
Effect of Antimicrobial Treatment on the Dynamics of Ceftiofur Resistance in Enterobacteriaceae from Adult California Dairy Cows

 , ,
, , 
Abstract
1. Introduction
2. Materials and Methods
2.1. Study Population
2.2. Enrollment
2.3. Sample Collection
2.4. Sample Processing
2.5. Ceftiofur-Impregnated MacConkey Agar
2.6. Bacterial Enumeration
2.7. Positive/Negative Controls
2.8. Statistical Analyses
2.9. Kernel-Weighted Local Polynomial Smoothed Regression
2.10. Multilevel Mixed Effects Negative Binomial Models (MENBM)
2.11. Multilevel Mixed Effects Interval Regression Models
3. Results
3.1. Study Population and AMD Treatments
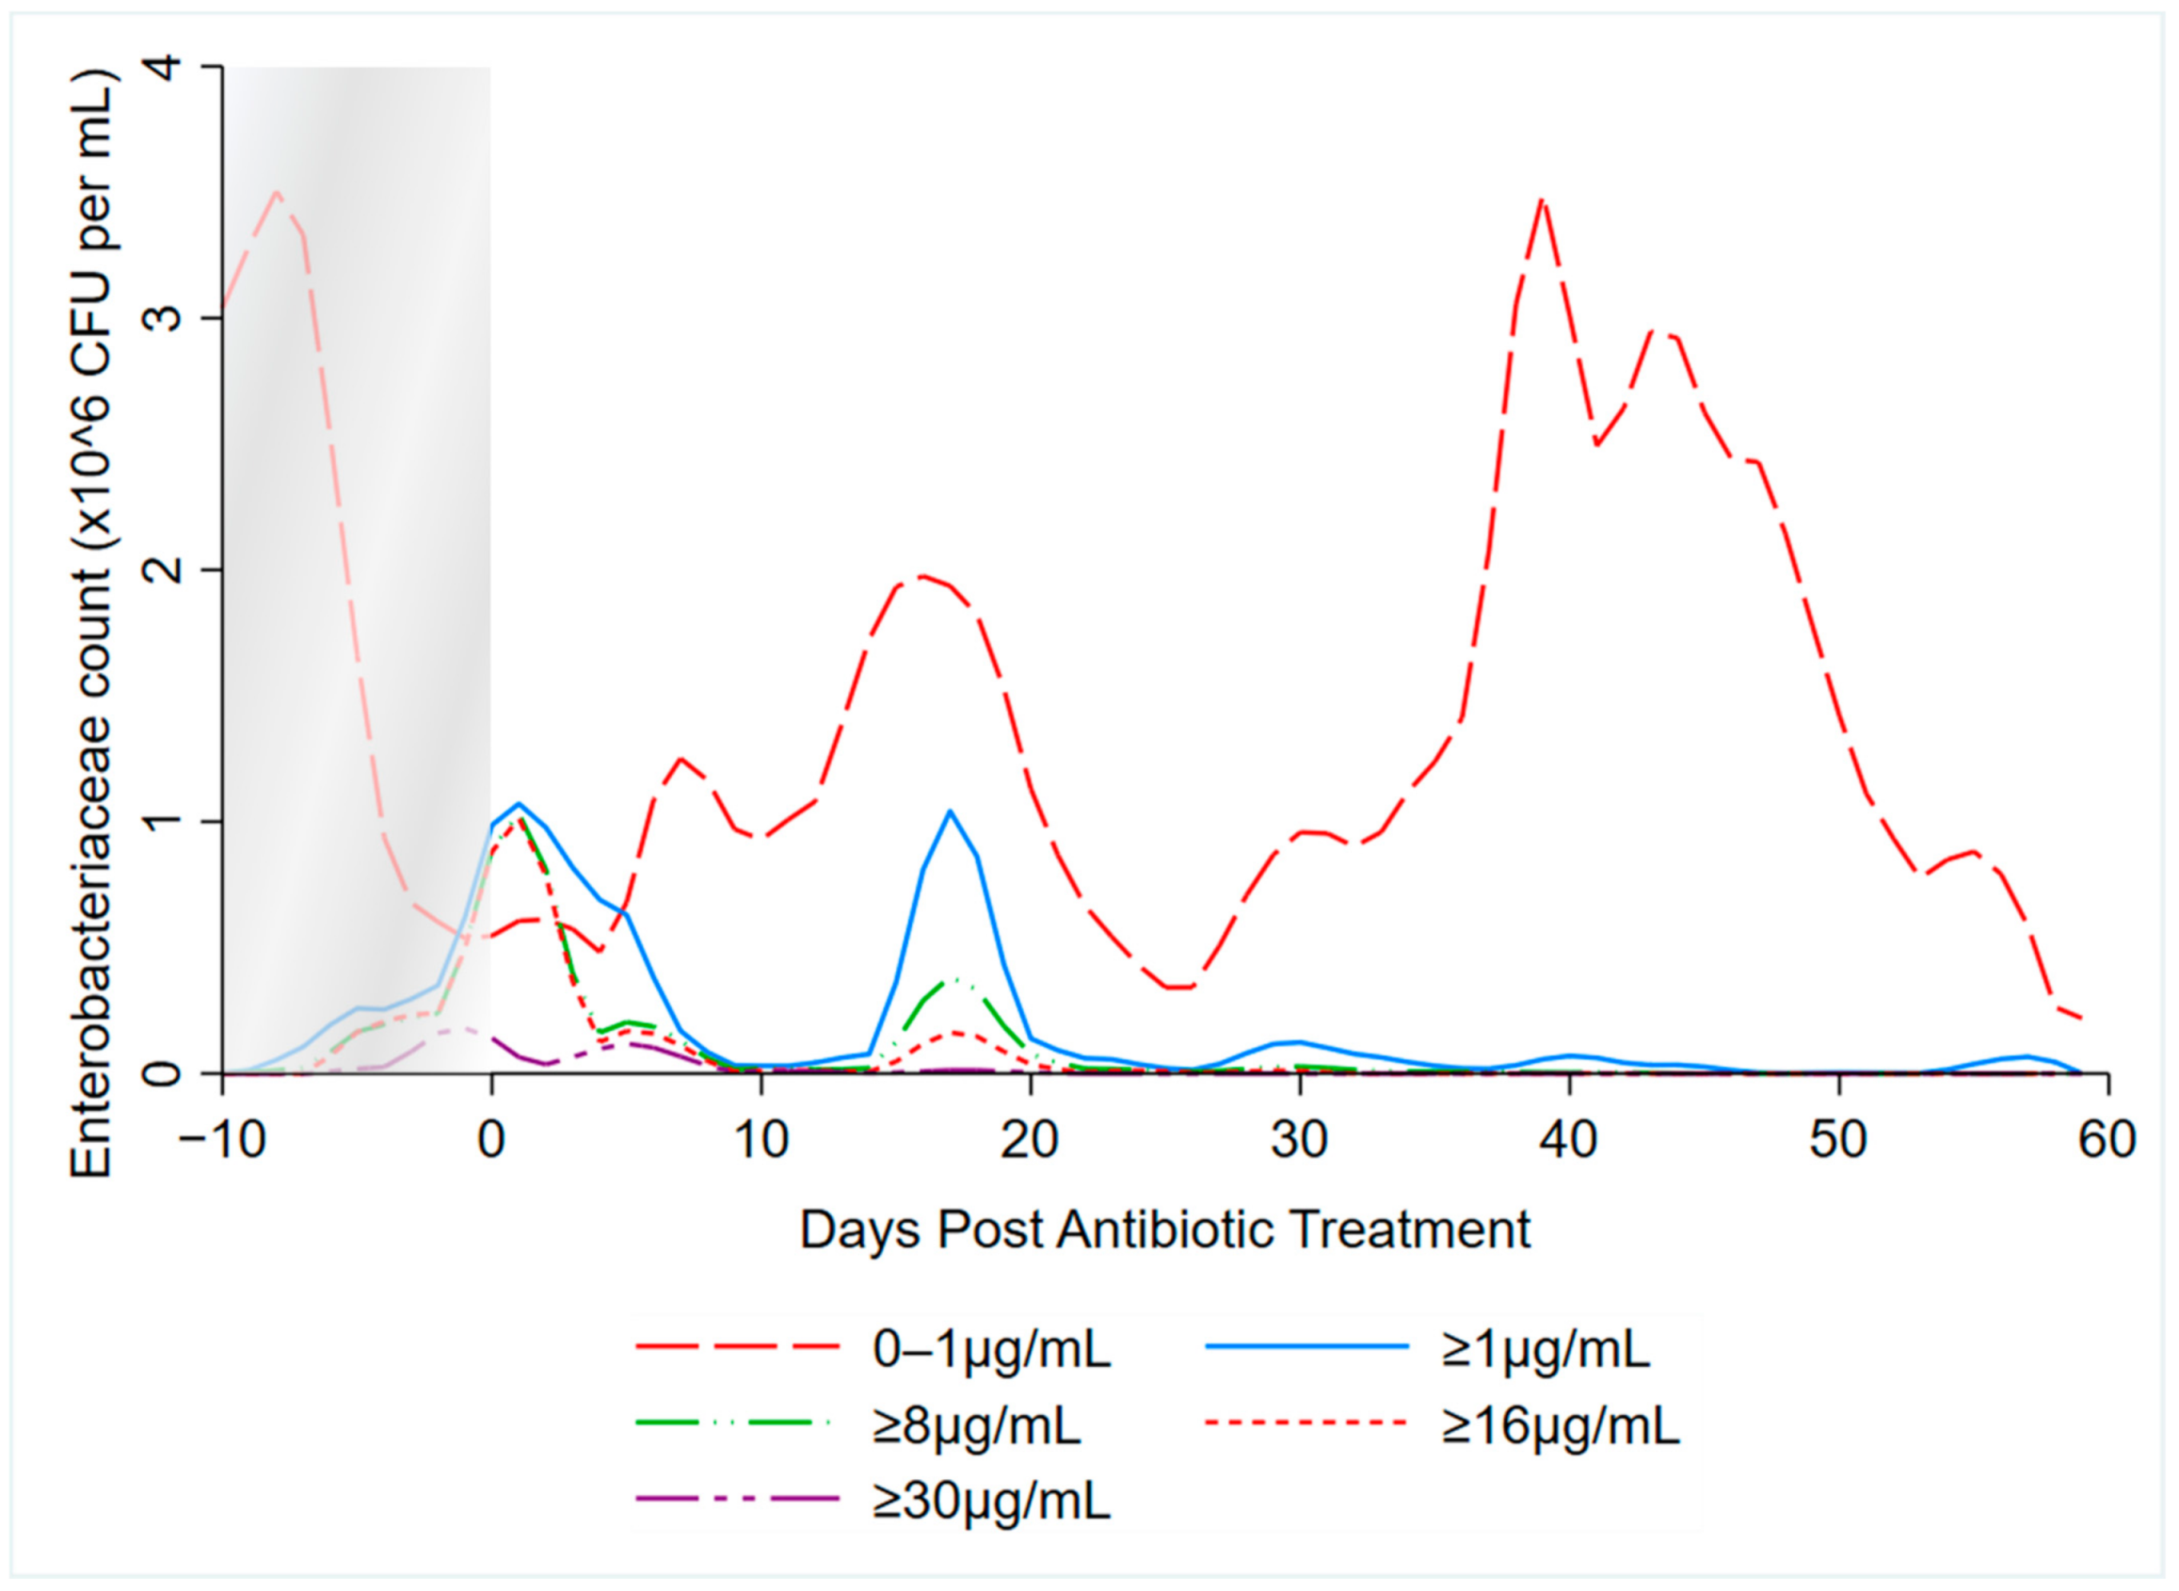
3.2. Kernel-Weighted Local Polynomial Smoothed Regression
3.3. Multilevel Mixed Effects Negative Binomial Models
3.4. Multilevel Mixed Effects Interval Regression Models
4. Discussion
5. Conclusions
Author Contributions
Funding
Institutional Animal Care and Use Committee statements
Informed Consent Statement
Data Availability Statement
Acknowledgments
Conflicts of Interest
References
- CDC (Centers for Disease Control). Antibiotic Resistance Threats in the United States; CDC (Centers for Disease Control): Atlanta, GA, USA, 2019.
- OECD (Organisation for Economic Co-operation and Development). Antimicrobial Resistance Tackling the Burden in the European Union Briefing Note for EU/EEA Countries Contents; OECD (Organisation for Economic Co-operation and Development): Paris, French, 2019. [Google Scholar]
- Lammie, S.L.; Hughes, J.M. Antimicrobial Resistance, Food Safety, and One Health: The Need for Convergence. Annu. Rev. Food Sci. Technol. 2016, 7, 287–312. [Google Scholar] [CrossRef]
- FAC (Food and Agricultural Code). Livestock: Use of Antimicrobial Drugs [14400–14408]; FAC (Food and Agricultural Code): Sacramento, CA, USA, 2015. [Google Scholar]
- Murphy, D.; Ricci, A.; Auce, Z.; Beechinor, J.G.; Bergendahl, H.; Breathnach, R.; Bureš, J.; Duarte Da Silva, J.P.; Hederová, J.; Hekman, P.; et al. EMA and EFSA Joint Scientific Opinion on measures to reduce the need to use antimicrobial agents in animal husbandry in the European Union, and the resulting impacts on food safety (RONAFA). EFSA J. 2017, 15. [Google Scholar] [CrossRef]
- FDA (U.S. Food and Drug Administration). Code of Federal Regulations Title 21: Sec. 558.6 Veterinary Feed Directive Drugs 2015; FDA (U.S. Food and Drug Administration): Silver Spring, MD, USA, 2015.
- Aidara-Kane, A.; Angulo, F.J.; Conly, J.; Minato, Y.; Silbergeld, E.K.; McEwen, S.A.; Collignon, P.J.; Balkhy, H.; Collignon, P.; Friedman, C.; et al. World Health Organization (WHO) guidelines on use of medically important antimicrobials in food-producing animals. Antimicrob. Resist. Infect. Control. 2018, 7. [Google Scholar] [CrossRef]
- World Health Organization Highest Priority Critically Important Antimicrobials. Available online: http://www.who.int/foodsafety/cia/en/ (accessed on 1 July 2020).
- FDA (U.S. Food and Drug Administration). 21 CFR Part 530: Final rule. Fed. Regist. 2012, 77, 735–745. [Google Scholar]
- USDA (United States Department of Agriculture). Dairy Cattle Management Practices in the United States, 2014; USDA (United States Department of Agriculture): Fort Collins, CO, USA, 2016.
- Arumugham, V.B.; Cascella, M. Third Generation Cephalosporins; StatPearls Publishing: Treasure Island, FL, USA, 2020. [Google Scholar]
- United States Department of Agriculture. Milk Quality, Milking Procedures, and Mastitis on U.S. Dairies, 2014; United States Department of Agriculture: Fort Collins, CO, USA, 2018.
- Pereira, R.; Williams, D.R.; Rossitto, P.; Adaska, J.; Okello, E.; Champagne, J.; Lehenbauer, T.W.; Li, X.; Chase, J.; Nguyen, T.; et al. Association between herd management practices and antimicrobial resistance in Salmonella spp. from cull dairy cattle in Central California. PeerJ 2019. [Google Scholar] [CrossRef]
- Abdelfattah, E.M.; Ekong, P.; Okello, E.; Chamchoy, T.; Karle, B.M.; Black, R.; Sheedy, D.B.; El-Ashmawy, W.; Williams, D.R.; Califano, D.; et al. Epidemiology of Antimicrobial Resistance (AMR) on California dairies: Descriptive and Cluster Analyses of Adult cow fecal Escherichia coli and Enterococcus spp. AMR phenotype. PeerJ. 2021. [Google Scholar] [CrossRef]
- EFSA (European Food Safety Authority); ECDPC (European Centre for Disease Prevention and Control) The European Union Summary Report on Antimicrobial Resistance in zoonotic and indicator bacteria from humans, animals and food in 2017/2018. EFSA J. 2020, 18. [CrossRef]
- Sharma, R.; Munns, K.; Alexander, T.; Entz, T.; Mirzaagha, P.; Yanke, L.J.; Mulvey, M.; Topp, E.; McAllister, T. Diversity and distribution of commensal fecal Escherichia coli bacteria in beef cattle administered selected subtherapeutic antimicrobials in a feedlot setting. Appl. Environ. Microbiol. 2008, 74, 6178–6186. [Google Scholar] [CrossRef] [PubMed]
- Von Wintersdorff, C.J.H.; Penders, J.; Van Niekerk, J.M.; Mills, N.D.; Majumder, S.; Van Alphen, L.B.; Savelkoul, P.H.M.; Wolffs, P.F.G. Dissemination of antimicrobial resistance in microbial ecosystems through horizontal gene transfer. Front. Microbiol. 2016, 7, 173. [Google Scholar] [CrossRef] [PubMed]
- McManus, M.C. Mechanisms of bacterial resistance to antimicrobial agents. Am. J. Health Pharm. 1997, 54, 1420–1433. [Google Scholar] [CrossRef]
- Vogwill, T.; Maclean, R.C. The genetic basis of the fitness costs of antimicrobial resistance: A meta-analysis approach. Evol. Appl. 2015. [Google Scholar] [CrossRef] [PubMed]
- Singer, R.S.; Patterson, S.K.; Wallace, R.L. Effects of therapeutic ceftiofur administration to dairy cattle on Escherichia coli dynamics in the intestinal tract. Appl. Environ. Microbiol. 2008. [Google Scholar] [CrossRef] [PubMed]
- Foster, D.M.; Jacob, M.E.; Farmer, K.A.; Callahan, B.J.; Theriot, C.M.; Kathariou, S.; Cernicchiaro, N.; Prange, T.; Papich, M.G. Ceftiofur formulation differentially affects the intestinal drug concentration, resistance of fecal Escherichia coli, and the microbiome of steers. PLoS ONE 2019, 14, e0223378. [Google Scholar] [CrossRef] [PubMed]
- Kanwar, N.; Scott, H.M.; Norby, B.; Loneragan, G.H.; Vinasco, J.; McGowan, M.; Cottell, J.L.; Chengappa, M.M.; Bai, J.; Boerlin, P. Effects of ceftiofur and chlortetracycline treatment strategies on antimicrobial susceptibility and on tet(A), tet(B), and blaCMY-2 resistance genes among E. coli isolated from the feces of feedlot cattle. PLoS ONE 2013, 8, e80575. [Google Scholar] [CrossRef] [PubMed]
- Daniels, J.B.; Call, D.R.; Hancock, D.; Sischo, W.M.; Baker, K.; Besser, T.E. Role of ceftiofur in selection and dissemination of blaCMY-2-mediated cephalosporin resistance in Salmonella enterica and commensal Escherichia coli Isolates from cattle. Appl. Environ. Microbiol. 2009, 75, 3648–3655. [Google Scholar] [CrossRef]
- Taylor, E.A.; Jordan, E.R.; Garcia, J.A.; Hagevoort, G.R.; Norman, K.N.; Lawhon, S.D.; Piñeiro, J.M.; Scott, H.M. Effects of two-dose ceftiofur treatment for metritis on the temporal dynamics of antimicrobial resistance among fecal Escherichia coli in Holstein-Friesian dairy cows. PLoS ONE 2019, 14, e0220068. [Google Scholar] [CrossRef]
- Mann, S.; Siler, J.D.; Jordan, D.; Warnick, L.D. Antimicrobial susceptibility of fecal escherichia coli isolates in dairy cows following systemic treatment with ceftiofur or penicillin. Foodborne Pathog. Dis. 2011, 8, 861–867. [Google Scholar] [CrossRef]
- Edmonson, A.J.; Lean, I.J.; Weaver, L.D.; Farver, T.; Webster, G. A Body Condition Scoring Chart for Holstein Dairy Cows. J. Dairy Sci. 1989, 72, 68–78. [Google Scholar] [CrossRef]
- CLSI (Clinical and Laboratory Standards Institute). M100: Performance Standards for Antimicrobial Susceptibility Testing, 27th ed.; CLSI (Clinical and Laboratory Standards Institute): Wayne, PA, USA, 2017. [Google Scholar]
- Cella, E.; Okello, E.; Rossitto, P.; Beniamino, C.-G.; Sheedy, D.; Pereira, R.; Karle, B.; Lehenbauer, T.; Aly, S. Estimating the Rate of Acquisition and Loss of Ceftiofur Resistance in Pre-Weaned Dairy Calves; manuscript in preparation; National Institute of Food and Agriculture: Davis, CA, USA, 2021.
- Aly, S.S.; Zhao, J.; Li, B.; Jiang, J. Reliability of environmental sampling culture results using the negative binomial intraclass correlation coefficient. Springerplus 2014, 3, 1–7. [Google Scholar] [CrossRef]
- Aly, S.S.; Anderson, R.J.; Adaska, J.M.; Jiang, J.; Gardner, I.A. Association between Mycobacterium avium subspecies paratuberculosis infection and milk production in two California dairies. J. Dairy Sci. 2010, 93, 1030–1040. [Google Scholar] [CrossRef]
- Stephen, C.P.; Johnson, W.H.; Leblanc, S.J.; Foster, R.A.; Chenier, T.S. The impact of ecbolic therapy in the early postpartum period on uterine involution and reproductive health in dairy cows. J. Vet. Med. Sci. 2019, 81, 491–498. [Google Scholar] [CrossRef]
- Hasegawa, H.; Suzuki, E.; Maeda, S. Horizontal Plasmid Transfer by Transformation in Escherichia coli: Environmental Factors and Possible Mechanisms. Front. Microbiol. 2018, 9, 2365. [Google Scholar] [CrossRef] [PubMed]
- Ding, C.; Yang, D.; Ma, J.; Jin, M.; Shen, Z.; Shi, D.; Tian, Z.; Kang, M.; Li, J.; Qiu, Z. Effects of free antibiotic resistance genes in the environment on intestinal microecology of mice. Ecotoxicol. Environ. Saf. 2020, 204, 111119. [Google Scholar] [CrossRef]
- Dong, J.J.; Russo, J.D.; Sampson, K. Population dynamics model and analysis for bacteria transformation and conjugation. J. Phys. Commun. 2020, 4, 1–11. [Google Scholar] [CrossRef]
- CLSI (Clinical and Laboratory Standards Institute). M07: Dilution AST for Aerobically Grown Bacteria, 11th ed.; Clinical and Laboratory Standards Institute: Wayne, PA, USA, 2018. [Google Scholar]
- Alcaine, S.D.; Sukhnanand, S.S.; Warnick, L.D.; Su, W.L.; McGann, P.; McDonough, P.; Wiedmann, M. Ceftiofur-resistant Salmonella strains isolated from dairy farms represent multiple widely distributed subtypes that evolved by independent horizontal gene transfer. Antimicrob. Agents Chemother. 2005, 49, 4061–4067. [Google Scholar] [CrossRef]
- EUCAST (European Committee on Antimicrobial Susceptibility Testing). EUCAST SOP 10.0 Standard Operating Procedure: MIC Distributions and the Setting of Epidemiological Cutoff (ECOFF) Values; EUCAST (European Committee on Antimicrobial Susceptibility Testing): Växjö, Sweden, 2017. [Google Scholar]
- EUCAST (European Committee on Antimicrobial Susceptibility Testing) Antimicrobial Wild Type Distributions of Microorganisms. Available online: https://mic.eucast.org/Eucast2/ (accessed on 21 November 2020).


| Example 1: | |||||
|---|---|---|---|---|---|
| Ceftiofur concentration | 0 µg/mL | 1 µg/mL | 8 µg/mL | 16 µg/mL | 30 µg/mL |
| Colony counts c |  1500 1500 |  1000 1000 |  100 100 |  25 25 |  2 2 |
| Interval specification | [0 to 1] | [1 to 8] | [8 to 16] | [16 to 30] | [30 to +∞) |
| Maximum MIC a | - | - | - | - | 1 |
| Population MIC b | 500 | 900 | 75 | 23 | 2 |
| Example 2: | |||||
| Ceftiofur concentration | 0 µg/mL | 1 µg/mL | 8 µg/mL | 16 µg/mL | 30 µg/mL |
| Colony counts c |  1500 1500 |  400 400 |  2 2 |  0 0 |  0 0 |
| Interval specification | [0 to 1] | [1 to 8] | [8 to 16] | [16 to 30] | [30 to +∞) |
| Maximum MIC a | - | - | 1 | - | - |
| Population MIC b | 1100 | 398 | 2 | 0 | 0 |
| Study Cows | Antimicrobial Treatments | ||||
|---|---|---|---|---|---|
| Lactation | Eligible | Enrolled | Injectable | Intramammary | |
| Farm A Cohorts | |||||
| Winter/Fall | |||||
| 1st | 30 | 6 | 0 | 0 | |
| 2nd | 12 | 6 | 0 | 0 | |
| 3+ | 20 | 12 | 0 | 1 | |
| Spring/Summer | |||||
| 1st | 12 | 12 | 0 | 0 | |
| 2nd | 10 | 7 | 0 | 1 | |
| 3+ | 8 | 5 | 0 | 1 | |
| Farm B Cohorts | |||||
| Winter/Fall | |||||
| 1st | 39 | 8 | 6 | 0 | |
| 2nd | 20 | 6 | 2 | 1 | |
| 3+ | 36 | 10 | 2 | 0 | |
| Spring/Summer | |||||
| 1st | 24 | 8 | 3 | 0 | |
| 2nd | 23 | 5 | 0 | 0 | |
| 3+ | 25 | 11 | 3 | 0 | |
| “Sensitive” Enterobacteriaceae Counts (0–1 µg/mL Ceftiofur) | ≥1 µg/mL Ceftiofur-Resistant Enterobacteriaceae Counts | |||||||||
|---|---|---|---|---|---|---|---|---|---|---|
| 95% Confidence Interval | 95% Confidence Interval | |||||||||
| Variable | Estimate a | S.E. | p Value | Lower Limit | Upper Limit | Estimate a | S.E. | p Value | Lower Limit | Upper Limit |
| Pre-treatment | referent | referent | ||||||||
| During treatment | −1.24 | 0.007 | <0.01 | −1.26 | −1.23 | 6.00 | 0.022 | <0.01 | 5.95 | 6.04 |
| Days post-treatment: | ||||||||||
| 1–2 | −1.53 | 0.011 | <0.01 | −1.55 | −1.51 | 4.64 | 1.023 | <0.01 | 2.63 | 6.64 |
| 3–4 | −2.25 | 0.021 | <0.01 | −2.29 | −2.21 | 4.23 | 0.944 | <0.01 | 2.38 | 6.08 |
| 5–6 | −2.30 | 0.013 | <0.01 | −2.33 | −2.28 | 2.98 | 0.851 | <0.01 | 1.31 | 4.64 |
| 7–8 | −1.45 | 0.000 | <0.01 | −1.45 | −1.45 | 0.64 | 0.749 | 0.40 | −0.83 | 2.10 |
| 9–10 | −1.71 | 0.002 | <0.01 | −1.71 | −1.70 | 0.99 | 0.093 | <0.01 | 0.81 | 1.17 |
| 11–12 | −0.48 | 0.069 | <0.01 | −0.62 | −0.34 | 0.49 | 0.271 | 0.07 | −0.04 | 1.02 |
| 13–14 | −1.02 | 0.004 | <0.01 | −1.03 | −1.02 | 1.06 | 0.977 | 0.28 | −0.86 | 2.98 |
| 15–21 | −0.62 | 0.021 | <0.01 | −0.66 | −0.57 | 2.93 | 1.253 | 0.02 | 0.47 | 5.39 |
| 22–28 | −1.28 | 0.042 | <0.01 | −1.36 | −1.20 | 0.27 | 0.419 | 0.52 | −0.55 | 1.09 |
| 29–35 | −0.61 | 0.047 | <0.01 | −0.70 | −0.52 | 1.24 | 0.704 | 0.08 | −0.14 | 2.62 |
| 36–42 | 0.32 | 0.040 | <0.01 | 0.24 | 0.40 | 1.23 | 0.263 | <0.01 | 0.71 | 1.74 |
| 43–49 | 0.51 | 0.063 | <0.01 | 0.39 | 0.64 | −0.68 | 0.597 | 0.26 | −1.85 | 0.49 |
| 50–56 | −0.34 | 0.041 | <0.01 | −0.42 | −0.26 | −1.05 | 1.387 | 0.45 | −3.77 | 1.66 |
| 57–58 | −1.99 | 0.010 | <0.01 | −2.01 | −1.97 | −0.56 | 0.151 | <0.01 | −0.85 | −0.26 |
| Farm | ||||||||||
| A | referent | referent | ||||||||
| B | 0.09 | 0.042 | 0.034 | 0.01 | 0.17 | 2.32 | 0.716 | <0.01 | 0.92 | 3.72 |
| Intercept | 14.15 | 0.023 | <0.01 | 14.10 | 14.19 | 6.77 | 0.804 | <0.01 | 5.19 | 8.34 |
| Ln(dispersion) | 0.65 | 0.260 | 0.14 | 1.16 | 3.47 | 0.511 | 2.47 | 4.47 | ||
| Random effects | ||||||||||
| DIM b (slope) | <0.01 | <0.01 | <0.01 | <0.01 | <0.01 | 0.004 | <0.01 | 0.45 | ||
| Cow (intercept) | 1.12 | 0.389 | 0.56 | 2.21 | 2.05 | 2.256 | 0.24 | 17.70 | ||
| ≥8 µg/mL Ceftiofur-Resistant Enterobacteriaceae Counts | ≥16 µg/mL Ceftiofur-Resistant Enterobacteriaceae Counts | |||||||||
|---|---|---|---|---|---|---|---|---|---|---|
| 95% Confidence Interval | 95% Confidence Interval | |||||||||
| Variable | Estimate a | S.E. | p Value | Lower Limit | Upper Limit | Estimate a | S.E. | p Value | Lower Limit | Upper Limit |
| Pre-treatment | referent | referent | ||||||||
| During treatment | 5.53 | 1.648 | <0.01 | 0.00 | 2.30 | 6.57 | 1.947 | <0.01 | 2.75 | 10.38 |
| Days post-treatment: | ||||||||||
| 1–2 | 4.47 | 2.052 | 0.03 | 0.03 | 0.44 | 4.98 | 2.761 | 0.07 | −0.43 | 10.39 |
| 3–4 | 3.02 | 1.907 | 0.11 | 0.11 | −0.72 | 2.83 | 2.691 | 0.29 | −2.45 | 8.10 |
| 5–6 | 2.60 | 1.812 | 0.15 | 0.15 | −0.95 | 2.32 | 2.576 | 0.37 | −2.73 | 7.37 |
| 7–8 | −1.06 | 1.739 | 0.54 | 0.54 | −4.46 | −1.54 | 2.442 | 0.53 | −6.33 | 3.24 |
| 9–10 | 0.75 | 1.915 | 0.70 | 0.70 | −3.01 | −2.07 | 2.873 | 0.47 | −7.70 | 3.57 |
| 11–12 | −0.18 | 2.003 | 0.93 | 0.93 | −4.10 | −2.95 | 3.834 | 0.44 | −10.47 | 4.56 |
| 13–14 | −0.26 | 2.084 | 0.90 | 0.90 | −4.35 | −4.06 | 4.106 | 0.32 | −12.11 | 3.99 |
| 15–21 | 0.85 | 1.457 | 0.56 | 0.56 | −2.00 | 2.14 | 1.957 | 0.28 | −1.70 | 5.97 |
| 22–28 | −1.43 | 1.520 | 0.35 | 0.35 | −4.41 | −0.32 | 2.275 | 0.89 | −4.77 | 4.14 |
| 29–35 | −1.57 | 1.543 | 0.31 | 0.31 | −4.60 | −3.00 | 2.001 | 0.13 | −6.92 | 0.93 |
| 36–42 | −1.47 | 1.530 | 0.34 | 0.34 | −4.47 | −6.75 | 2.353 | <0.01 | −11.36 | −2.14 |
| 43–49 | −3.47 | 1.718 | 0.04 | 0.04 | −6.83 | −4.81 | 2.941 | 0.10 | −10.57 | 0.95 |
| Intercept | 9.18 | 0.553 | <0.01 | 0.00 | 8.10 | 8.34 | 0.709 | <0.01 | 6.95 | 9.73 |
| Ln(dispersion) | 3.31 | 0.069 | 3.18 | 3.45 | 4.03 | 0.096 | 3.84 | 4.22 | ||
| Random effects | ||||||||||
| DIM b (slope) | 0.03 | 0.012 | 0.01 | 0.07 | 0.03 | 0.010 | 0.01 | 0.06 | ||
| Cow (intercept) | 4.25 | 1.398 | 2.23 | 8.10 | 4.70 | 1.941 | 2.10 | 10.56 | ||
| Enterobacteriaceae (x,1000) per Gram of Feces at Respective Levels of Ceftiofur | ||||||||
|---|---|---|---|---|---|---|---|---|
| Time | <1 µg/mL (Sensitive) a | ≥1 µg/mL a | ≥8 µg/mL | ≥16 µg/mL | ||||
| Pre-treatment/Untreated | 1526 | (1469–1584) | 9 | (7–10) | 10 | (0–20) | 4 | (0–10) |
| During Treatment | 440 | (417–463) | 3570 | (2802–4338) | 2437 | (0–9853) | 2979 | (0–14,000) |
| Days Post-Treatment: | ||||||||
| 1–2 | 331 | (311–351) | 917 | (0–2914) | 845 | (0–4166) | 611 | (0–3823) |
| 3–4 | 161 | (160–162) | 612 | (0–1850) | 198 | (0–934) | 71 | (0–438) |
| 5–6 | 153 | (151–155) | 174 | (0–494) | 131 | (0–585) | 43 | (0–248) |
| 7–8 | 359 | (346–372) | 17 | (0–44) | 3 | (0–14) | 1 | (0–5) |
| 9–10 | 277 | (265–288) | 24 | (15–32) | 21 | (0–95) | 1 | (0–3) |
| 11–12 | 945 | (852–1037) | 14 | (4–25) | 8 | (0–39) | 0 | (0–2) |
| 13–14 | 548 | (531–565) | 26 | (0–79) | 7 | (0–37) | 0 | (0–1) |
| 15–21 | 825 | (822–827) | 166 | (0–603) | 23 | (0–82) | 35 | (0–160) |
| 22–28 | 424 | (405–442) | 12 | (0–23) | 2 | (0–9) | 3 | (0–16) |
| 29–35 | 831 | (785–877) | 31 | (0–78) | 2 | (0–8) | 0 | (0–1) |
| 36–42 | 2110 | (2023–2196) | 30 | (9–51) | 2 | (0–8) | 0 | (0–0) |
| 43–49 | 2552 | (2335–2768) | 5 | (0–11) | 0 | (0–1) | 0 | (0–0) |
| 50–56 | 1090 | (1044–1136) | 3 | (0–12) | – b | – b | ||
| 57–58 | 209 | (205–212) | 5 | (3–7) | – b | – b | ||
| Maximum MIC | Population MIC | |||||||||
|---|---|---|---|---|---|---|---|---|---|---|
| 95% Confidence Interval | 95% Confidence Interval | |||||||||
| Variable | Estimate d | S.E. | p Value | Lower Limit | Upper Limit | Estimate d | S.E. | p Value | Lower Limit | Upper Limit |
| Pre-treatment | referent | referent | ||||||||
| During treatment | 9.13 | 2.541 | <0.01 | 4.15 | 14.11 | 8.33 | 0.0003 | <0.01 | 8.329 | 8.330 |
| Days post-treatment: | ||||||||||
| 1–2 | 9.00 | 3.232 | 0.01 | 2.67 | 15.34 | 6.53 | 0.0005 | <0.01 | 6.534 | 6.536 |
| 3–4 | 15.12 | 3.392 | <0.01 | 8.47 | 21.77 | 2.95 | 0.0009 | <0.01 | 2.949 | 2.953 |
| 5–6 | 5.24 | 2.925 | 0.07 | −0.49 | 10.97 | 6.07 | 0.0011 | <0.01 | 6.068 | 6.073 |
| 7–8 | 2.98 | 3.006 | 0.32 | −2.91 | 8.87 | 1.04 | 0.0004 | <0.01 | 1.044 | 1.046 |
| 9–10 | 5.05 | 3.206 | 0.12 | −1.24 | 11.33 | 1.04 | 0.0010 | <0.01 | 1.034 | 1.038 |
| 11–12 | −1.21 | 3.070 | 0.69 | −7.23 | 4.80 | 1.06 | 0.0010 | <0.01 | 1.059 | 1.063 |
| 13–14 | 1.83 | 3.209 | 0.57 | −4.46 | 8.12 | 0.00 | 0.0007 | 0.51 | −0.002 | 0.001 |
| 15–21 | 5.44 | 2.258 | 0.02 | 1.01 | 9.86 | 0.21 | 0.0003 | <0.01 | 0.210 | 0.211 |
| 22–28 | 1.62 | 2.371 | 0.49 | −3.03 | 6.27 | 0.25 | 0.0008 | <0.01 | 0.251 | 0.254 |
| 29–35 | 1.81 | 2.525 | 0.47 | −3.14 | 6.76 | 0.83 | 0.0005 | <0.01 | 0.825 | 0.827 |
| 36–42 | 2.19 | 2.677 | 0.41 | −3.05 | 7.44 | 0.10 | 0.0004 | <0.01 | 0.100 | 0.101 |
| 43–49 | 0.76 | 2.840 | 0.79 | −4.80 | 6.33 | −0.24 | 0.0004 | <0.01 | −0.241 | −0.240 |
| 50–56 | −3.24 | 3.229 | 0.32 | −9.57 | 3.09 | 1.39 | 0.0007 | <0.01 | 1.389 | 1.392 |
| Intercept | 9.56 | 2.510 | <0.01 | 4.64 | 14.48 | 0.44 | 0.0002 | <0.01 | 0.439 | 0.440 |
| Random effects | ||||||||||
| DIM e (slope) | 0.02 | 0.011 | <0.01 | 0.06 | 0.01 | <0.0001 | 0.009 | 0.009 | ||
| Cow (intercept) | 68.20 | 29.254 | 29.42 | 158.09 | 1.38 | 0.0004 | 2.287 | 2.288 | ||
| Residual variance | 82.34 | 7.328 | 69.16 | 98.03 | 10.97 | 0.0004 | 10.971 | 10.972 | ||
Publisher’s Note: MDPI stays neutral with regard to jurisdictional claims in published maps and institutional affiliations. |
© 2021 by the authors. Licensee MDPI, Basel, Switzerland. This article is an open access article distributed under the terms and conditions of the Creative Commons Attribution (CC BY) license (https://creativecommons.org/licenses/by/4.0/).
Share and Cite
Sheedy, D.B.; Okello, E.; Williams, D.R.; Precht, K.; Cella, E.; Lehenbauer, T.W.; Aly, S.S. Effect of Antimicrobial Treatment on the Dynamics of Ceftiofur Resistance in Enterobacteriaceae from Adult California Dairy Cows. Microorganisms 2021, 9, 828. https://doi.org/10.3390/microorganisms9040828
Sheedy DB, Okello E, Williams DR, Precht K, Cella E, Lehenbauer TW, Aly SS. Effect of Antimicrobial Treatment on the Dynamics of Ceftiofur Resistance in Enterobacteriaceae from Adult California Dairy Cows. Microorganisms. 2021; 9(4):828. https://doi.org/10.3390/microorganisms9040828
Chicago/Turabian StyleSheedy, David B., Emmanuel Okello, Deniece R. Williams, Katie Precht, Elisa Cella, Terry W. Lehenbauer, and Sharif S. Aly. 2021. "Effect of Antimicrobial Treatment on the Dynamics of Ceftiofur Resistance in Enterobacteriaceae from Adult California Dairy Cows" Microorganisms 9, no. 4: 828. https://doi.org/10.3390/microorganisms9040828
APA StyleSheedy, D. B., Okello, E., Williams, D. R., Precht, K., Cella, E., Lehenbauer, T. W., & Aly, S. S. (2021). Effect of Antimicrobial Treatment on the Dynamics of Ceftiofur Resistance in Enterobacteriaceae from Adult California Dairy Cows. Microorganisms, 9(4), 828. https://doi.org/10.3390/microorganisms9040828