Article

Biogeographical Distribution and Community Assembly of Active Protistan Assemblages along an Estuary to a Basin Transect of the Northern South China Sea

1
State Key Laboratory of Marine Environmental Science, College of Ocean and Earth Sciences, Xiamen University, Xiamen 361102, China
2
Fujian Key Laboratory of Marine Carbon Sequestration, Xiamen University, Xiamen 361102, China
3
College of Marine Science and Technology, China University of Geosciences (Wuhan), Wuhan 430000, China
*
Authors to whom correspondence should be addressed.
Microorganisms 2021, 9(2), 351; https://doi.org/10.3390/microorganisms9020351
Submission received: 18 November 2020 / Revised: 28 January 2021 / Accepted: 5 February 2021 / Published: 10 February 2021

Abstract

:
Marine protists are essential for globally critical biological processes, including the biogeochemical cycles of matter and energy. However, compared with their prokaryotic counterpart, it remains largely unclear how environmental factors determine the diversity and distribution of the active protistan communities on the regional scale. In the present study, the biodiversity, community composition, and potential drivers of the total, abundant, and rare protistan groups were studied using high throughput sequencing on the V9 hyper-variable regions of the small subunit ribosomal RNA (SSU rRNA) along an estuary to basin transect in the northern South China Sea. Overall, Bacillariophyta and Cercozoa were abundant in the surface water; heterotrophic protists including Spirotrichea and marine stramenopiles 3 (MAST-3) were more abundant in the subsurface waters near the heavily urbanized Pearl River estuary; Chlorophyta and Pelagophyceae were abundant at the deep chlorophyll maximum depth, while Hacrobia, Radiolaria, and Excavata were the abundant groups in the deep water. Salinity, followed by water depth, temperature, and other biological factors, were the primary factors controlling the distinct vertical and horizontal distribution of the total and abundant protists. Rare taxa were driven by water depth, followed by temperature, salinity, and the concentrations of PO43−. The active protistan communities were mainly driven by dispersal limitation, followed by drift and other ecological processes.

1. Introduction

Microorganisms, including bacteria, archaea, protists (microbial eukaryotes), fungi, and viruses, play fundamental ecological roles in marine ecosystems [1]. Protists that play various roles in the aquatic ecosystems (e.g., primary producers, grazers, decomposers, and parasites) are essential for globally critical biological processes, including the biogeochemical cycles, the remineralization of organic matter, and climate regulation [2,3,4]. They have incredibly high abundance and species diversity, which enable them to quickly adapt to the changing surrounding environment [5]. It has been proposed that changes in the taxonomic composition of communities can have substantial impacts on essential ecosystem functions, e.g., primary and secondary production and matter cycling [6]. Consequently, knowledge of the biodiversity, community composition, biogeographical distribution, and the driving factors of protists are critical to understanding the response of marine ecosystems to global changes [1,7].
The abundant (operational taxonomic units, OTUs, with relative abundances > 1%) and rare (OTUs with relative abundances <0.01%) microbial taxa may have distinct characteristics and ecological functions [8,9,10]. The abundant taxa play an essential role in biomass, carbon, and nutrient cycling and are more closely related to other taxa in the ecosystem [11,12,13]. The rare taxa have been proposed to include individuals that grow slowly or remain dormant, contribute predominantly to species richness, and actively maintain ecosystem stability [14,15,16,17,18]. Locally rare taxa can also act as seed bank for seasonal succession or sporadic blooms and respond only when the environment becomes favorable [8,10]. In recent decades, high-throughput sequencing (HTS) on marker genes, e.g., ribosomal genes, has enabled researchers to increasingly discover the enormous diversity of marine microbes, including the rare biosphere with more refined taxonomic resolution [9,19,20,21,22,23,24,25]. However, most studies to date addressing the abundant and rare marine microbial groups focused more on the prokaryotes [26,27,28,29,30,31]. Less attention has been paid to marine protists, leaving the understanding of these two groups largely lagged behind compared with its prokaryotic counterpart [9,14,32,33].
Microbial communities revealed by environmental DNA (eDNA) sequencing may include live, dormant, dead cells, and even extracellular nucleic acids [34,35]. Compared with DNA, extracellular RNA molecules are much less stable and can only survive for much shorter time periods. Thus sequencing based on environmental RNA (eRNA) extracts was proposed to reveal only the metabolically active microbial groups, which has only been recently applied to the study on protists [24,36,37]. To date, most studies focusing on the abundant and rare groups were based on eDNA sequencing [13,25,32]. Only very few studies have investigated these two groups using eRNA-based sequencing, which is even rarer for protists [9,29,38].
The South China Sea (SCS) is one of the largest marginal seas in the western Pacific Ocean [39]. Sharp environmental gradients over small spatial scales have been found along an estuary to basin transect in the northern South China Sea (nSCS) due to the input of freshwater and nutrients from the Pearl River and the intrusion of oceanic water from the SCS: from coastal waters to the open ocean; bottom depths ranging from several tens of meters to over 3000 m; from eutrophic estuary to oligotrophic sea area; low salinity from freshwater to typical oceanic water [40,41]. Furthermore, the viral and bacterial abundances and the chlorophyll concentration showed a nearshore to offshore, surface water to deep water decreasing trend [42,43]. Therefore, the nSCS can serve as an ideal environment for studying the protistan biodiversity, composition, community assembly process, and the underlying control mechanisms.
Previous studies have been done on prokaryotes and viruses, including their biodiversity distribution and community response to environmental factors in the Pearl River Estuary (PRE) and the SCS [44,45,46,47,48,49,50,51]. In terms of protists, several pioneering studies have shown that protists have high diversity in the PRE [52,53,54] and the northern/central SCS [24,55,56], and protistan communities are constrained by complex environmental factors [57,58,59]. However, the composition and assembly processes of the active protistan assemblages along the PRE to the SCS basin transect and the driving factors of the total and abundant/rare taxa need further exploration.
In the present study, using eRNA-based HTS, vertical and horizontal distributions of the diversity, community structure, and assembly processes of the active protistan assemblages along an estuary to basin transect of the nSCS were studied. By measuring multiple environmental parameters, distinct protistan community composition and potential drivers of the total, abundant and rare protistan groups were identified. The active protistan communities were mainly driven by dispersal limitation, followed by drift and other ecological processes.

2. Materials and Methods

2.1. Sampling

Twenty-seven samples from 11 sites with water depth ranging from 5 to 1000 m were collected from 20 August 2014 to 4 September 2014 onboard R/V Dongfanghong II (Figure 1; Table S1). At each sampling site, seawater was collected for the analysis of chlorophyll a (Chl a), nutrients (including NO2, NO3, PO43−, and SiO44−), picoplankton and virus enumeration, and HTS, using Niskin bottles which were set up in a circular rosette attached around CTD sensors (Sea-Bird SBE 911plus, Sea-Bird Electronics, Bellevue, WA, USA). Five replicate samples (2 mL each) of 20 µm mesh prefiltered seawater were fixed with 1% ice-cold glutaraldehyde, flash-frozen in liquid nitrogen, and then stored −80 °C. Two liters of seawater were prefiltered using a 200 μm pore size mesh onto a 0.4 μm pore size filter (Millipore, Burlington, MA, USA), soaked in RNA stabilization solution (Ambion, Austin, TX, USA), and stored at −80 °C for later RNA extraction. Seawater for the determination of Chl a were filtered onto a 25 mm diameter Whatman GF/F filter and then kept frozen at −20 °C until analysis. Chl a was measured using an acetone extraction method with a Turner-Designs TrilogyTM laboratory fluorometer (Turner Designs, San Jose, CA, USA) [60]. Samples of inorganic nutrient concentrations were frozen, stored at −20 °C and measured by a Technicon AA3 Auto-Analyzer (Bran-Lube, Norderstedt, Germany).

2.2. Enumeration of Virus and Picoplankton

The enumeration of viral-like particles (VLPs) and picoplankton was according to [61,62,63]. All samples were added with 1-μm diameter yellow-green fluorescent beads (Molecular Probes, Thermo Fisher, Waltham, MA, USA) as an internal standard with the final concentration of ca. 1% to get a better indication effect. For the enumeration of autotrophic picoplankton including pigmented pico-sized eukaryotes (PPEs), Synechococcus, and Prochlorococcus, no staining step was performed [63]. Samples for the enumeration of VLPs and heterotrophic prokaryotes were stained with SYBR Green I (Molecular Probes, Thermo Fisher, Waltham, MA, USA) [61,62]. Briefly, for the enumeration of VLPs, after thawed at 37 °C, diluted with 0.02-μm filtered Tris-EDTA buffer (Sigma-Aldrich, Darmstadt, Germany), and stained with SYBR Green I, VLPs were analyzed at a flow rate of 0.1–1 mL h−1 and identified on the basis of the green fluorescence and side scatter signal [61]. Autotrophic picoplankton, heterotrophic prokaryotes, and VLPs were analyzed on the same Epics Altra II flow cytometer (Beckman Coulter, Brea, CA, USA). FCS Express V3 software (De Novo Software) was used to obtain VLPs and picoplankton abundance.

2.3. High Throughput Sequencing

Environmental RNA was extracted using the RNeasy Mini Kit (Qiagen, Stockach, Germany). Nanodrop ND-2000 Spectrophotometer (Thermo, Waltham, MA, USA) and gel electrophoresis were used to determine the RNA concentration and quality, respectively. Extracted RNA was reverse transcribed using the QuantiTect® Reverse Transcription Kit (Qiagen, China), which removed residual DNA at the first step. The primers (1389F/1510R) were used to amplify the V9 hypervariable regions (ca. 130 bp) of the reverse transcribed SSU rRNA gene [64]. Five individual PCR reactions were performed for each sample and then combined to collect enough amplicons for sequencing. PCR amplicons were purified using Wizard® SV Gel and PCR Clean-Up System (Promega, Beijing, China). Samples were shipped to Majorbio Bio-pharm Biotechnology Co., Ltd. (Shanghai, China) for paired-end (2 × 250 bp) multiplexed sequencing using the Illumina MiSeq platform. All sequence data have been submitted to the NCBI Sequence Read Archive, accessible through the accession number PRJNA687549.

2.4. Sequence Processing and Statistical Analyses

Raw reads were screened and assembled using Trimmomatic and Flash software [65,66] and criteria employed as below: (i) reads were truncated at any site that obtained an average quality score of <20 over a 50-bp sliding window and the truncated reads shorter than 50 bp were discarded; (ii) reads with any mismatch in the barcode, more than two nucleotide mismatches in the primer or containing ambiguous characters were removed; and (iii) overlapping sequences shorter than 10 bp or with a mismatch ratio of more than 0.2, were eliminated [58]. Potential chimeric reads were detected and removed in QIIME using USEARCH 6 [67]. Reads were then clustered into Operational Taxonomic Units (OTUs) at ≥97% sequence similarity using UPARSE [68]. The taxonomic assignment was achieved using the BLASTn search against Protist Ribosomal Database 2 (PR2) [69]. OTUs assigned to Bacteria, Archaea, Metazoa, Fungi, and plastids were excluded in downstream analysis. Singletons were also removed before further analysis.
Rarefaction curves were generated using the “rarefaction.single” command in Mothur [70]. Alpha diversity indexes, including OTU richness and Shannon, were calculated based on multiple random resampling at the lowest sequences counts (9634) among samples. A dendrogram was constructed in PRIMER.V.6.0 using the Bray–Curtis similarity index of the normalized data [71,72]. Analysis of similarities (ANOSIM) was used to test sample clustering patterns in PRIMER V.6.0. Similarity percentage (SIMPER) analysis identified OTUs with the most significant differences in community composition among the four groups, which contributed to a total of ca. 50% difference among groups [73,74]. Simple and partial Mantel tests were used to test correlations between environmental variables and communities after 1000 permutations [75]. The paired geographic distances between samples were obtained through the NOAA website (http://www.nhc.noaa.gov/gccalc.shtml, 20 June 2020).
Quantification of major ecological processes followed [76]. Briefly, two major steps were conducted. We first calculated the β-mean nearest taxon distance (βMNTD) to determine whether communities are under heterogeneous or homogeneous selection [77]. Null models were then constructed using 999 randomizations [76]. Differences between the obtained βMNTD and the mean of the null distribution are denoted as β-Nearest Taxon Index (βNTI). βNTI >2 or < −2 indicates the deterministic processes (i.e., variable selection and homogeneous selection, respectively) while −2 < βNTI < 2 indicates the stochastic processes (i.e., homogenizing dispersal). Second, the Bray–Curtis-based Raup-Crick (RCbray) for pairwise community comparisons were calculated to determine the impacts of dispersal and drift [76]. RCbray > 0.95 indicate dispersal limitation and |βNTI| < 2 and |RCbray| < 0.95 suggest that the community assembly is not dominated by any single process [76].

3. Results

3.1. Environmental Factors

Temperature and salinity of the surface (5 m) water of the coastal nSCS sites (including A9, J1, J2, and J3; ranging from 28.16 to 29.65 °C, and 31.13 to 33.28, respectively) were significantly lower than the other sites (with mean ± standard deviation of 29.85 ± 0.13 °C and 33.48 ± 0.11, respectively) (Mann–Whitney test, p < 0.01). Vertically, water temperature decreased while salinity increased with the increasing water depth (Figure S1; Table S1). The concentrations of nutrients (NO2, NO3, PO43−, and SiO44−) showed a distinctly nearshore to offshore decreasing trend horizontally, while a surface to deep water increasing trend vertically (Figure S1, Table S1). The concentrations of Chl a of the coastal sites including A9, J1, and J2 were the highest at 5 m, while those of the offshore sites were found at the deep chlorophyll maximum (DCM) layer.
Similar to the physical and chemical parameters of the sampling sites, the spatial distribution of microbial abundances also showed an environmental gradient along the transect (Figure S2, Table S1). The abundances of Synechococcus and pigmented pico-sized eukaryotes (PPEs) decreased from 1.00 × 10⁵ to 1.94 × 10² cells mL−1 and from 1.51 × 10⁴ to 4.71 × 10² cells mL−1, respectively, from the coastal to open ocean sites, while that of Prochlorococcus increased from 4.33 × 10³ to 1.70 × 10⁵ cells mL−1 seaward. The abundances of heterotrophic prokaryotes and VLPs generally decreased both seaward and vertically.

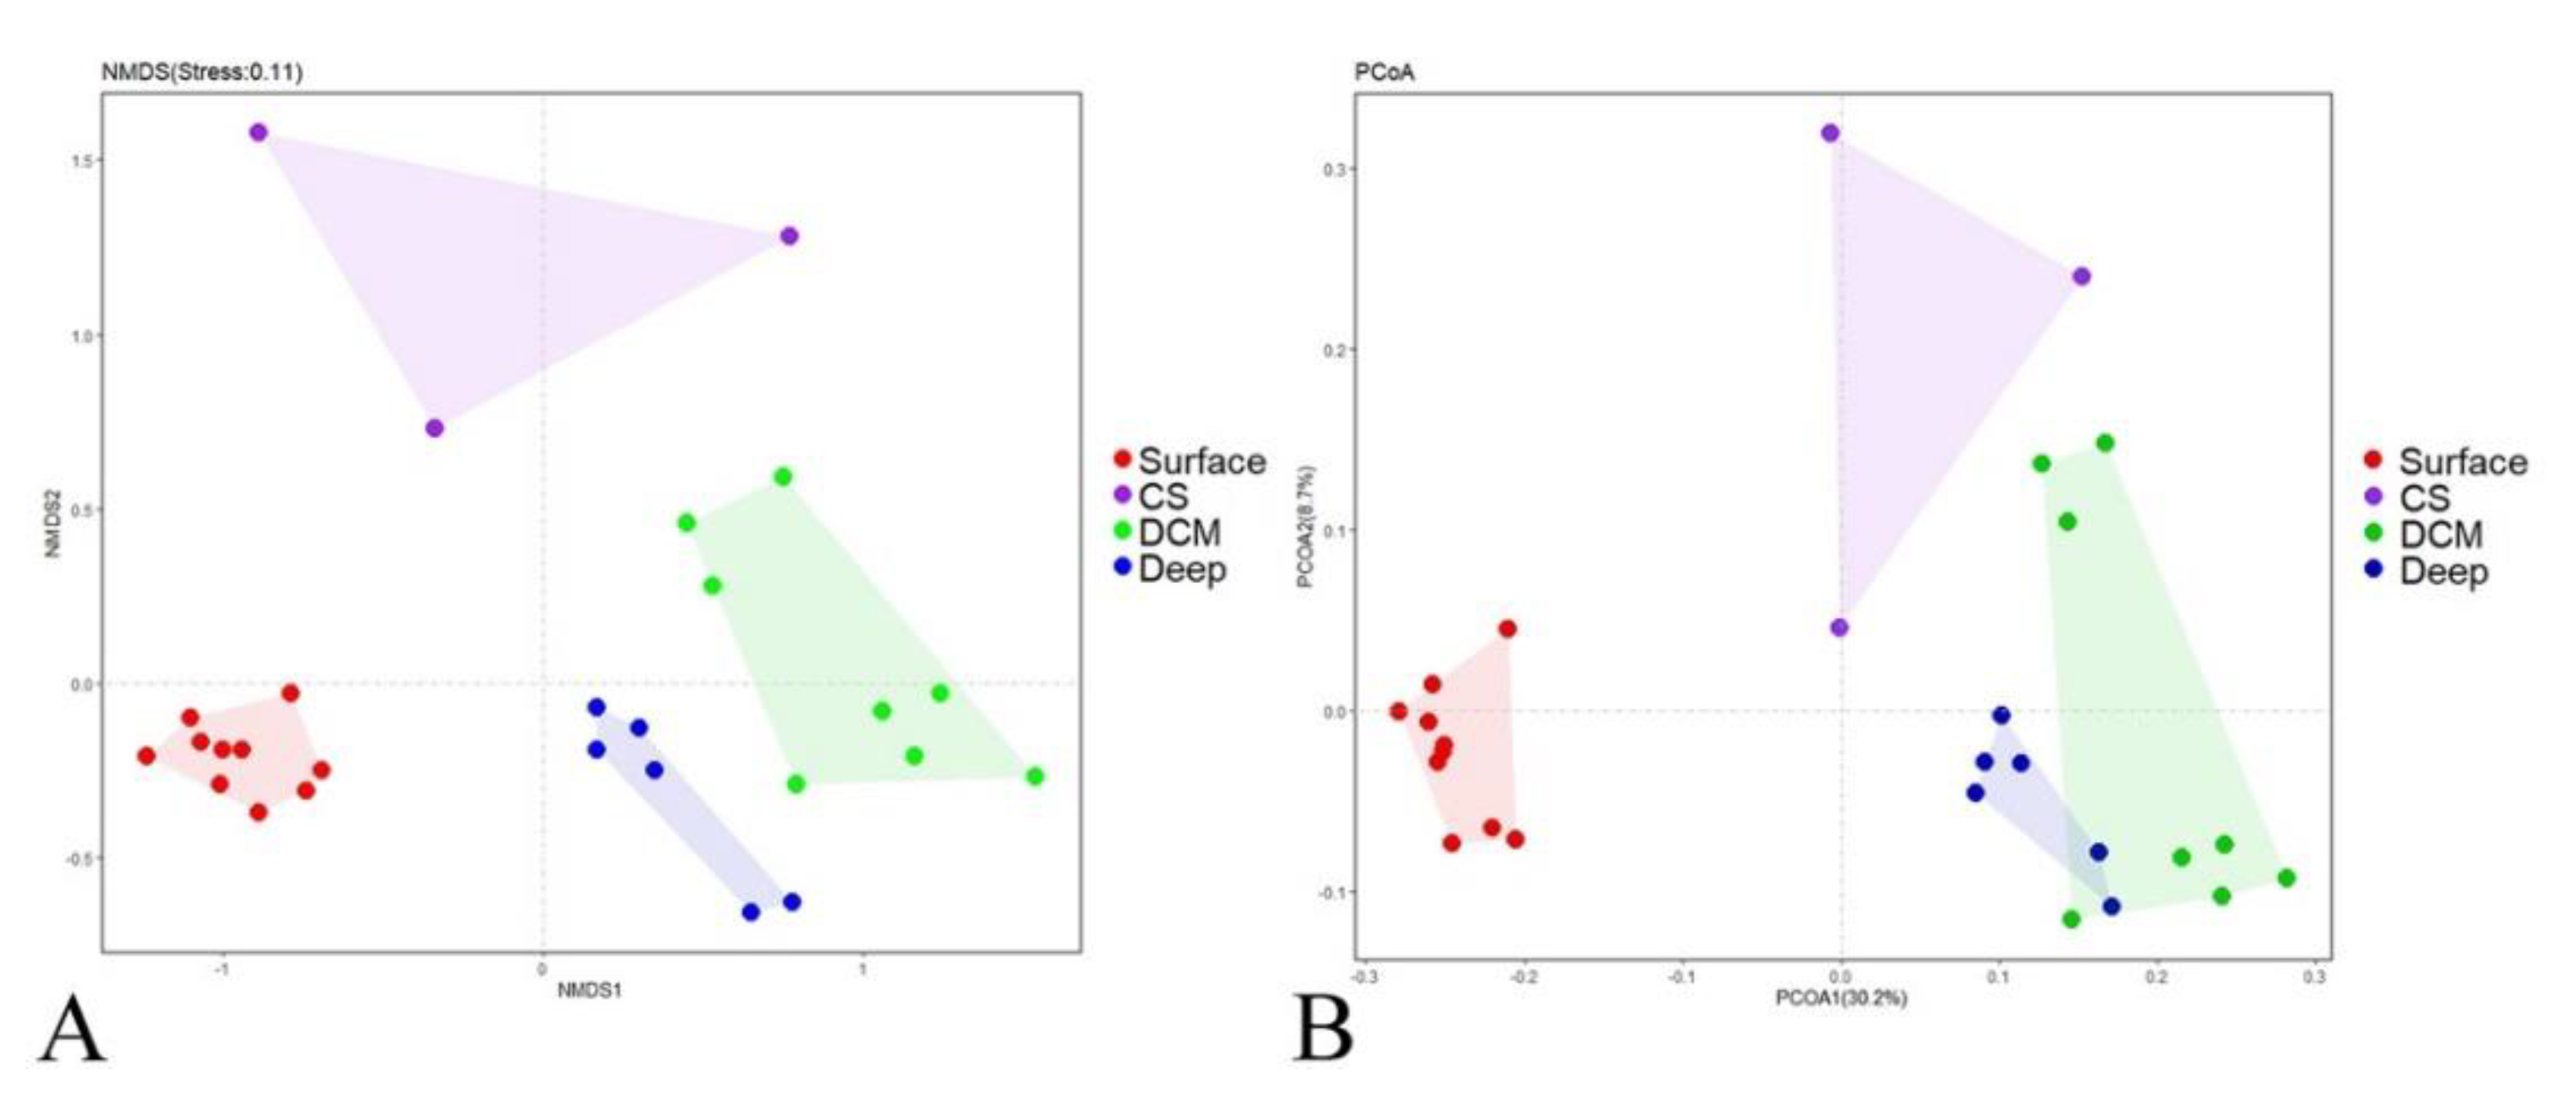
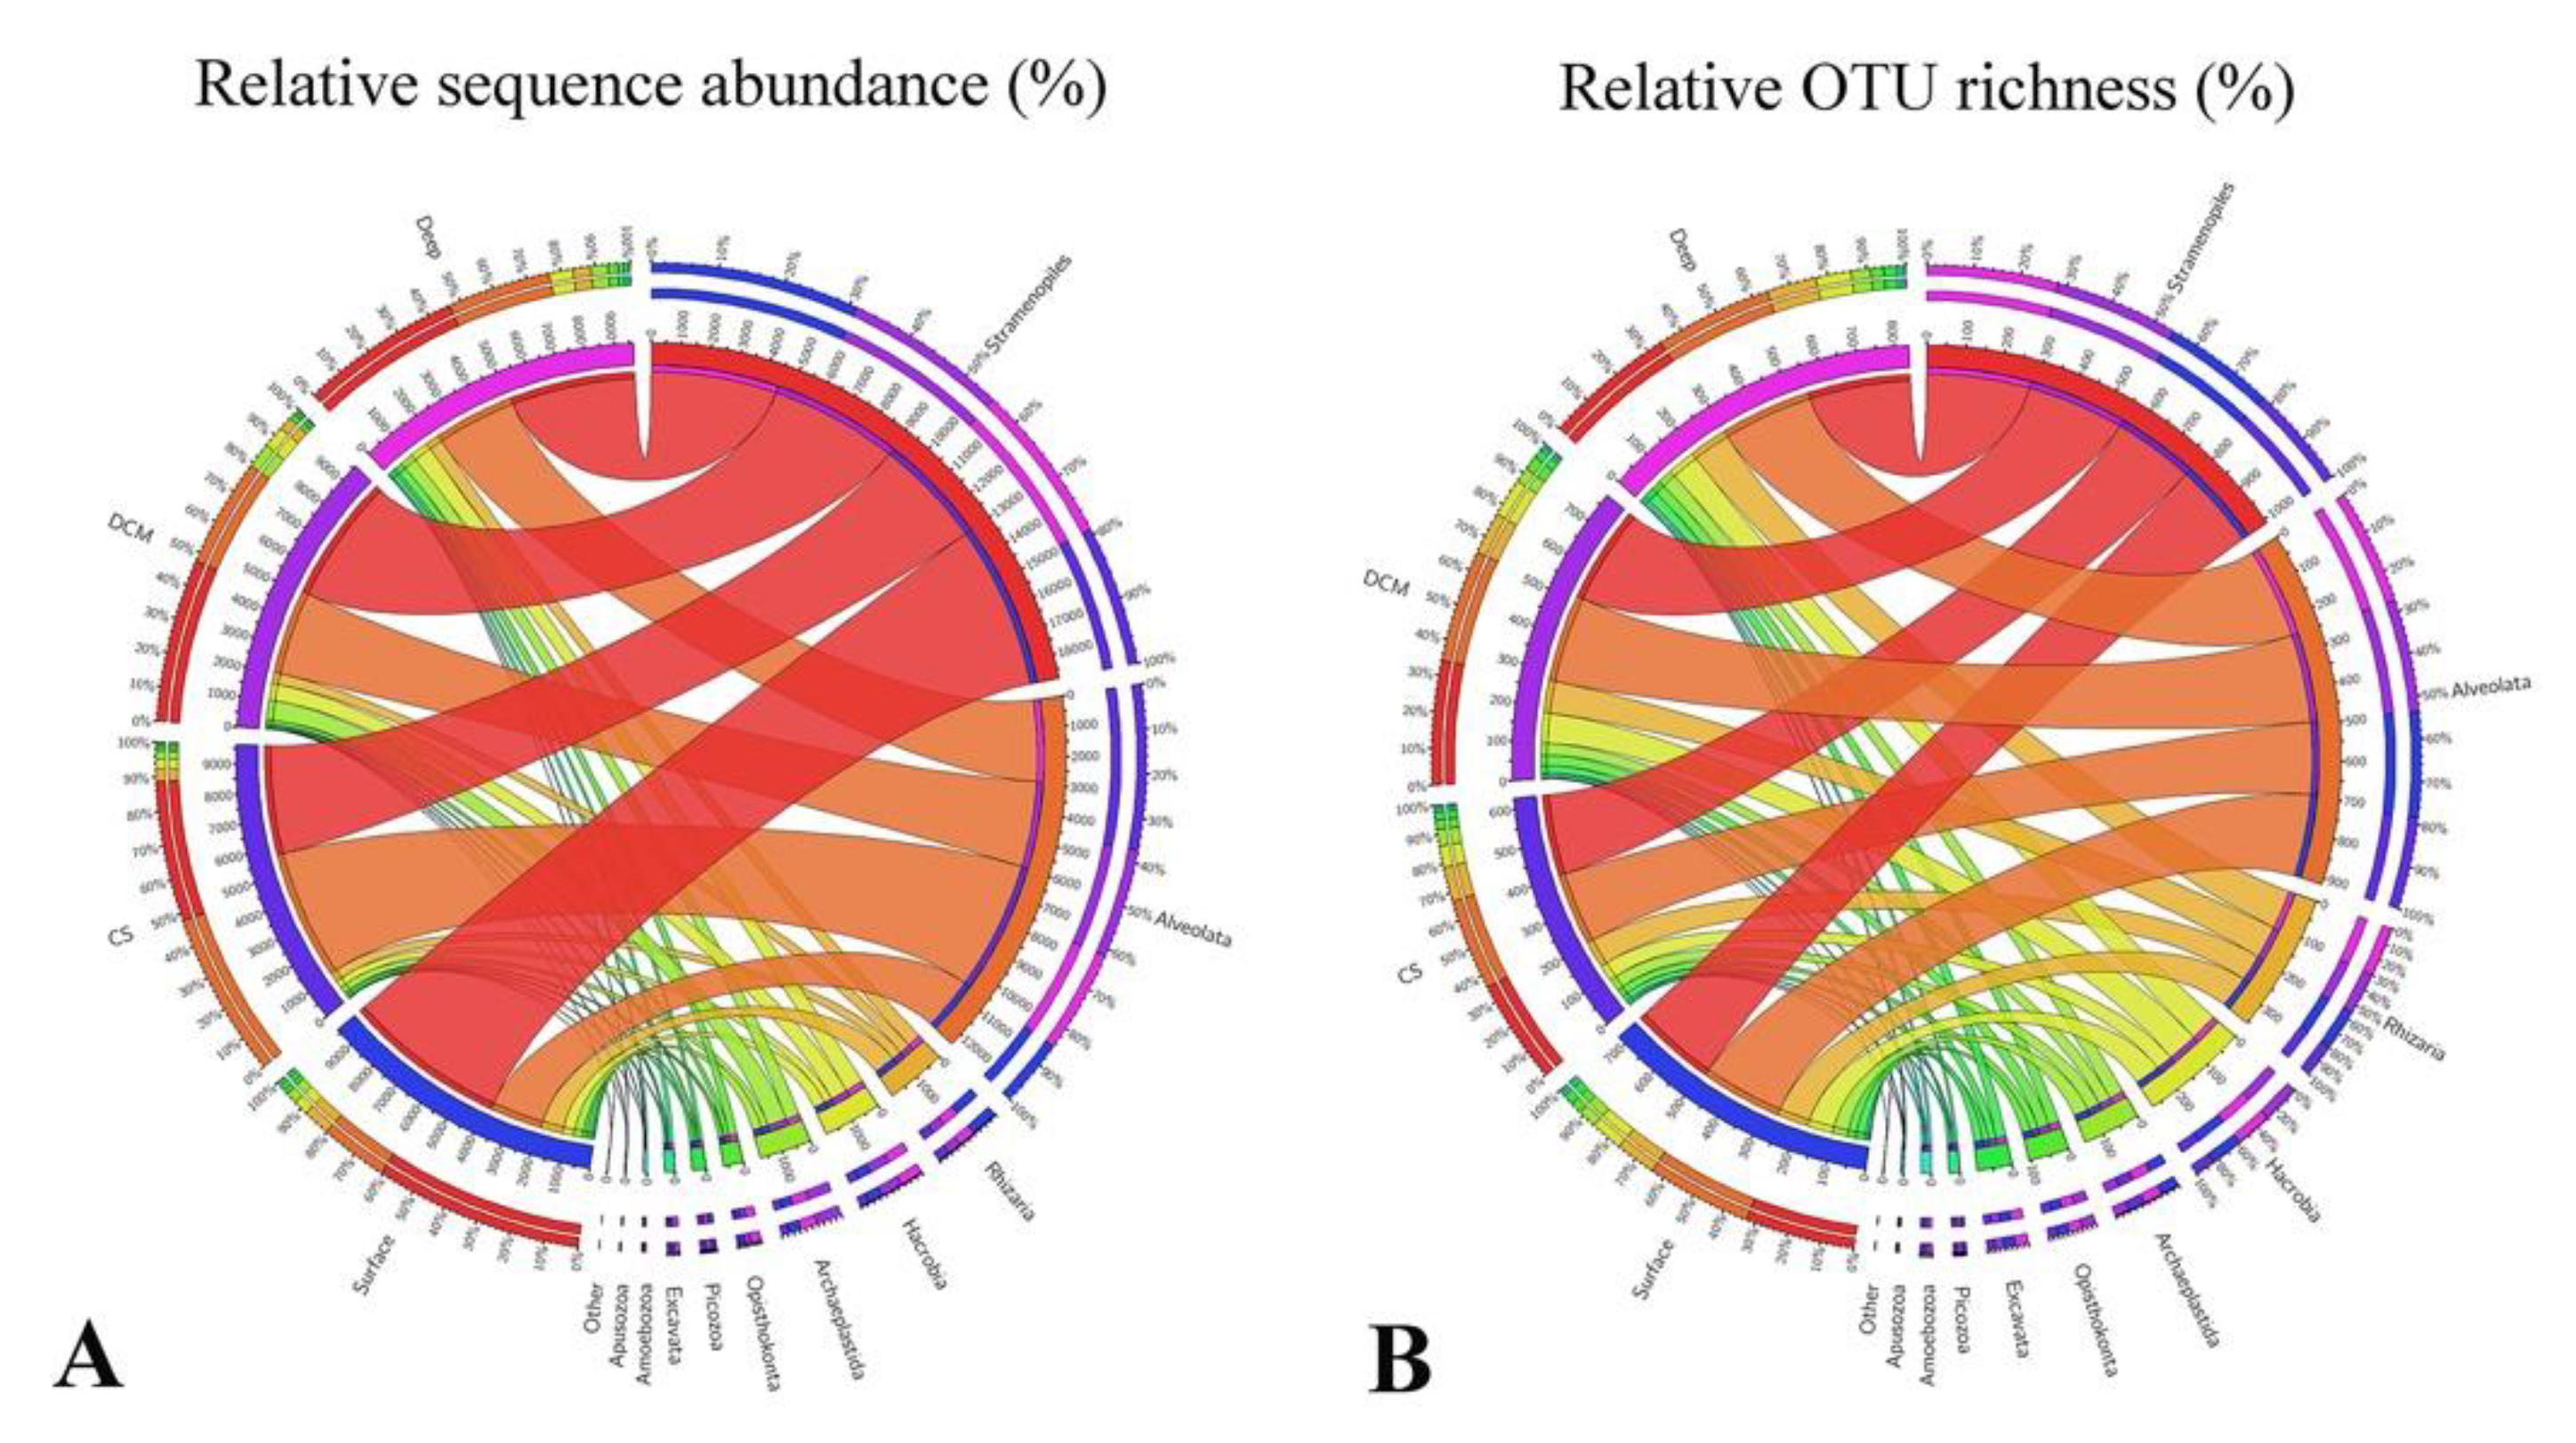
3.2. Beta Diversity and Community Composition

Although rarefaction analysis showed that protists were not fully sampled in the present study (Figure S3, Good’s coverage ranging from 97.6% to 99.2%), our study gave a snapshot of the active protistan assemblages along an estuary to a basin transect in the nSCS. In the nonmetric multidimensional scaling (nMDS) ordination plot based on the Bray–Curtis dissimilarity of protistan communities, four groups were identified (Figure 2A): (1) Group Surface including all surface samples; (2) Group CS (coastal subsurface water) including samples A9-25m, J1-25m, and J2-25m, which were collected from the subsurface waters near the heavily urbanized PRE; (3) Group DCM including samples collected at the deep chlorophyll maximum (DCM) depth of sites J3, J4, J5, I1, D, K2, K3, and K4; and (4) Group Deep including samples from the deep waters of sites J4, J5, I1, D, K2 and K3. This grouping pattern was statistically supported by the ANOSIM analysis (Table 1). The principal coordinate analysis (PCoA) plot of community taxonomic relatedness quantified by the Bray–Curtis dissimilarity metric also showed a similar clustering pattern (Figure 2B).
After randomly resampling at the lowest sequence count (9634) among all samples, a total of 3298 OTUs were obtained, ranging from 585 to 977 OTUs per sample. Ninety-seven percent of all retrieved OTUs could be classified at the supergroup taxonomic level (Figure 3). Overall, Group Surface was characterized by having the highest sequences proportions of Stramenopiles (ca. 61%), Rhizaria (ca. 8%), and Picozoa (ca. 2%), and the lowest sequences proportions of Alveolata (ca. 20%). In contrast, Group CS was characterized by having the lowest sequences proportions of Stramenopiles (ca. 41%) and the highest sequences proportions of Alveolata (ca. 48%). Group DCM was characterized by having the highest relative sequence abundance of Archaeplastida (ca. 7%), while group Deep was characterized by having the highest relative sequence abundance of Hacrobia (ca. 7%) and Opisthokonta (ca. 3%). Members affiliated with Excavata, Amoebozoa, and Apusozoa made only minor contributions to the total communities. In terms of OTU richness, OTUs affiliated with Stramenopiles and Alveolata almost contributed equally to the whole community (ca. 34 ± 1% and 31 ± 1%, respectively), followed by Rhizaria (ca. 12%), Hacrobia (ca. 9%), and the other supergroups (Figure 3B).
A protistan taxon with a high LDA score in a given group may serve as a potential biomarker for that group [78]. Protistan assemblages at Kingdom, Phylum, and Class taxonomic levels were used to identify the potential biomarkers in the four identified groups, i.e., Surface, CS, DCM, and Deep. Forty-nine protistan assemblages were identified using a logarithmic LDA size effect value of 3.5 (Figure 4A). Cladogram showed that Cercozoa, Bacillariophyta, and Picozoa were more abundant in group Surface. Notably, Bacillariophyta affiliated sequences exceeded 4000 in group Surface (Figure S4). Ciliophora (mainly Spirotrichea) was more abundant in group CS. Chlorophyta (mainly Prosino_Clade_7) and Telonemia were more abundant in group DCM. Radiolaria, Haptophyta (mainly Prymnesiophyceae), Streptophyta, Dinophyta, and Discoba were more abundant in group Deep. At the Kingdom level, seven discriminating lineages among the four groups were revealed by linear discriminant analysis effect size (LEfSe), i.e., Picozoa, Rhizaria, and Stramenopiles for group Surface, Alveolata for group CS, Archaeplastida for group DCM, and Hacrobia and Excavata for group Deep (Figure 4B).
SIMPER analysis identified 24 OTUs that totally contributed ca. 50% of the protistan community dissimilarities among the four groups (Figure 5). These OTUs were affiliated with Stramenopiles (12 OTUs), Alveolata (9 OTUs), Chlorophyta (2 OTUs), and Rhizaria (1 OTU), which contributed ca. 30.9%, 16.4%, 2.1%, and 0.6% of the community dissimilarities, respectively. OTUs identified as members in Stramenopiles were from Bacillariophyta (5 OTUs), MAST (3 OTUs), Bicoecea (1 OTU), Chrysophyceae (1 OTU), Labyrinthulea (1 OTU), and Pelagophyceae (1 OTU). OTUs affiliated with Alveolata were members of the ciliate family Strobilidiidae (8 OTUs) and dinoflagellate class Dinophyceae (1 OTU). The 2 OTUs identified as Chlorophyta were affiliated with Mamiellophyceae and Prasino-Clade-7, respectively. The OTU identified as Rhizaria belonged to Filosa-Thecofilosea (Cercozoa).

3.3. Alpha Diversity and Its Driving Factors

The alpha diversity indexes, including OTU richness and Shannon, were comparable in groups Surface and CS that were overall lower than those of the groups DCM and Deep, the latter of which had the highest diversity estimates (Figure S5). Spearman correlation coefficients between the alpha diversity estimates and environmental variables showed that OTU richness was significantly correlated with water depth, followed by the abundance of Synechococcus, salinity, latitude, longitude, and the abundance of heterotrophic prokaryotes (Table 2). The Shannon index was significantly correlated with latitude and longitude, followed by the abundance of heterotrophic prokaryotes, water depth, the abundance of VLPs, salinity, and temperature (Table 2).

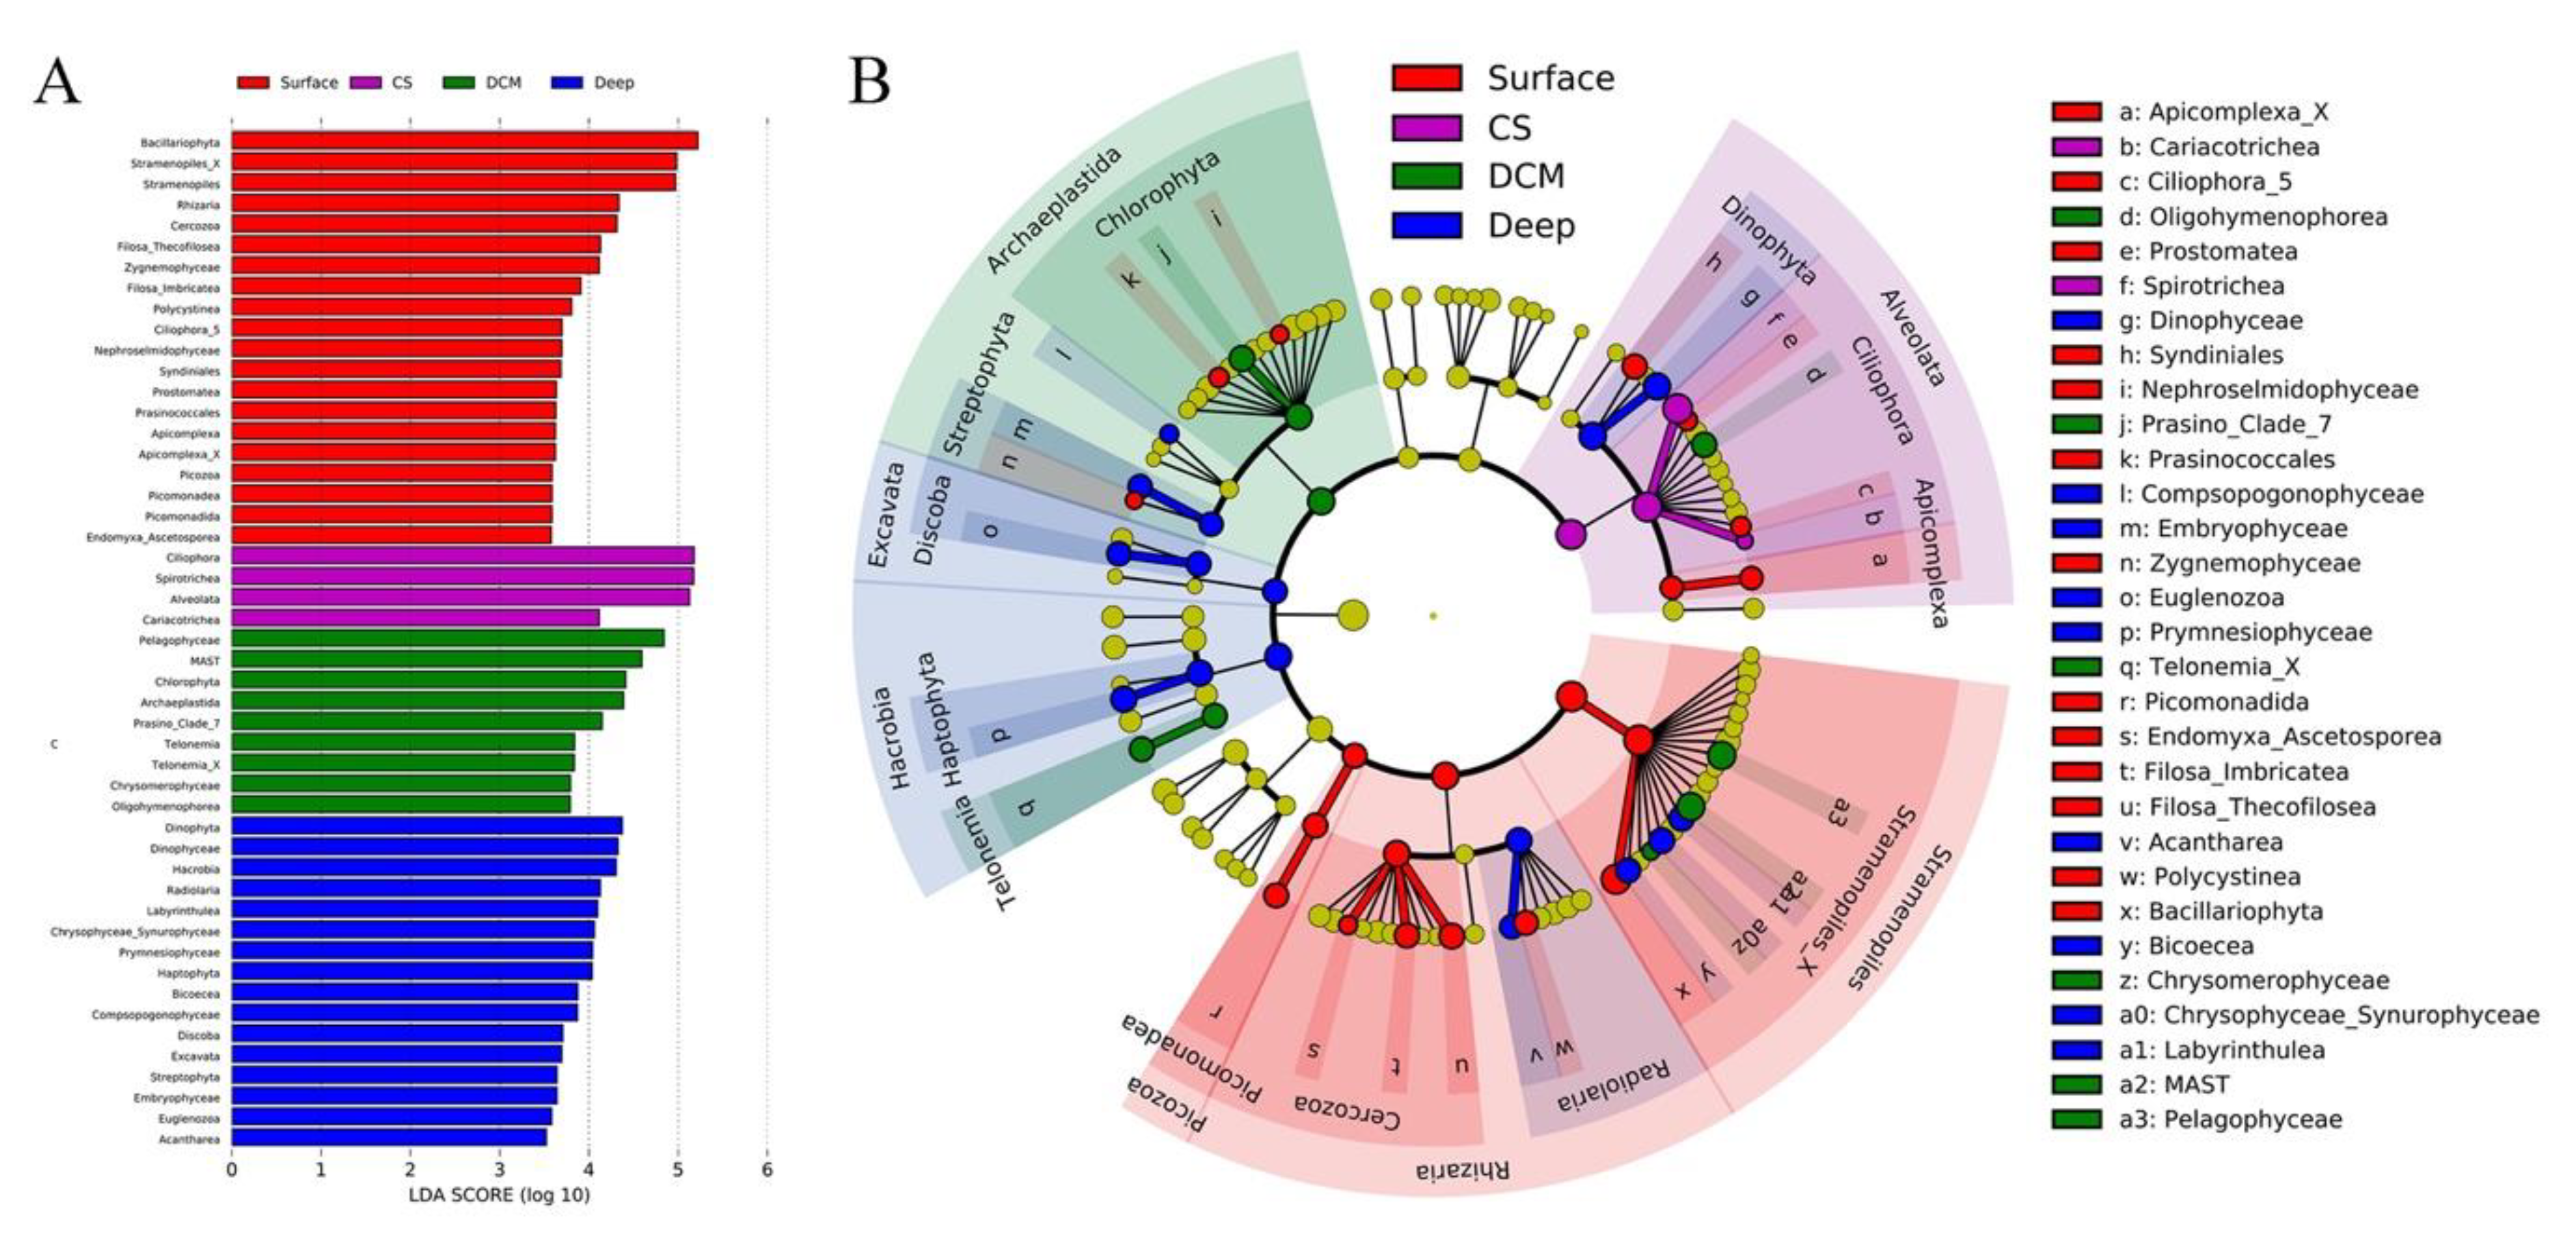
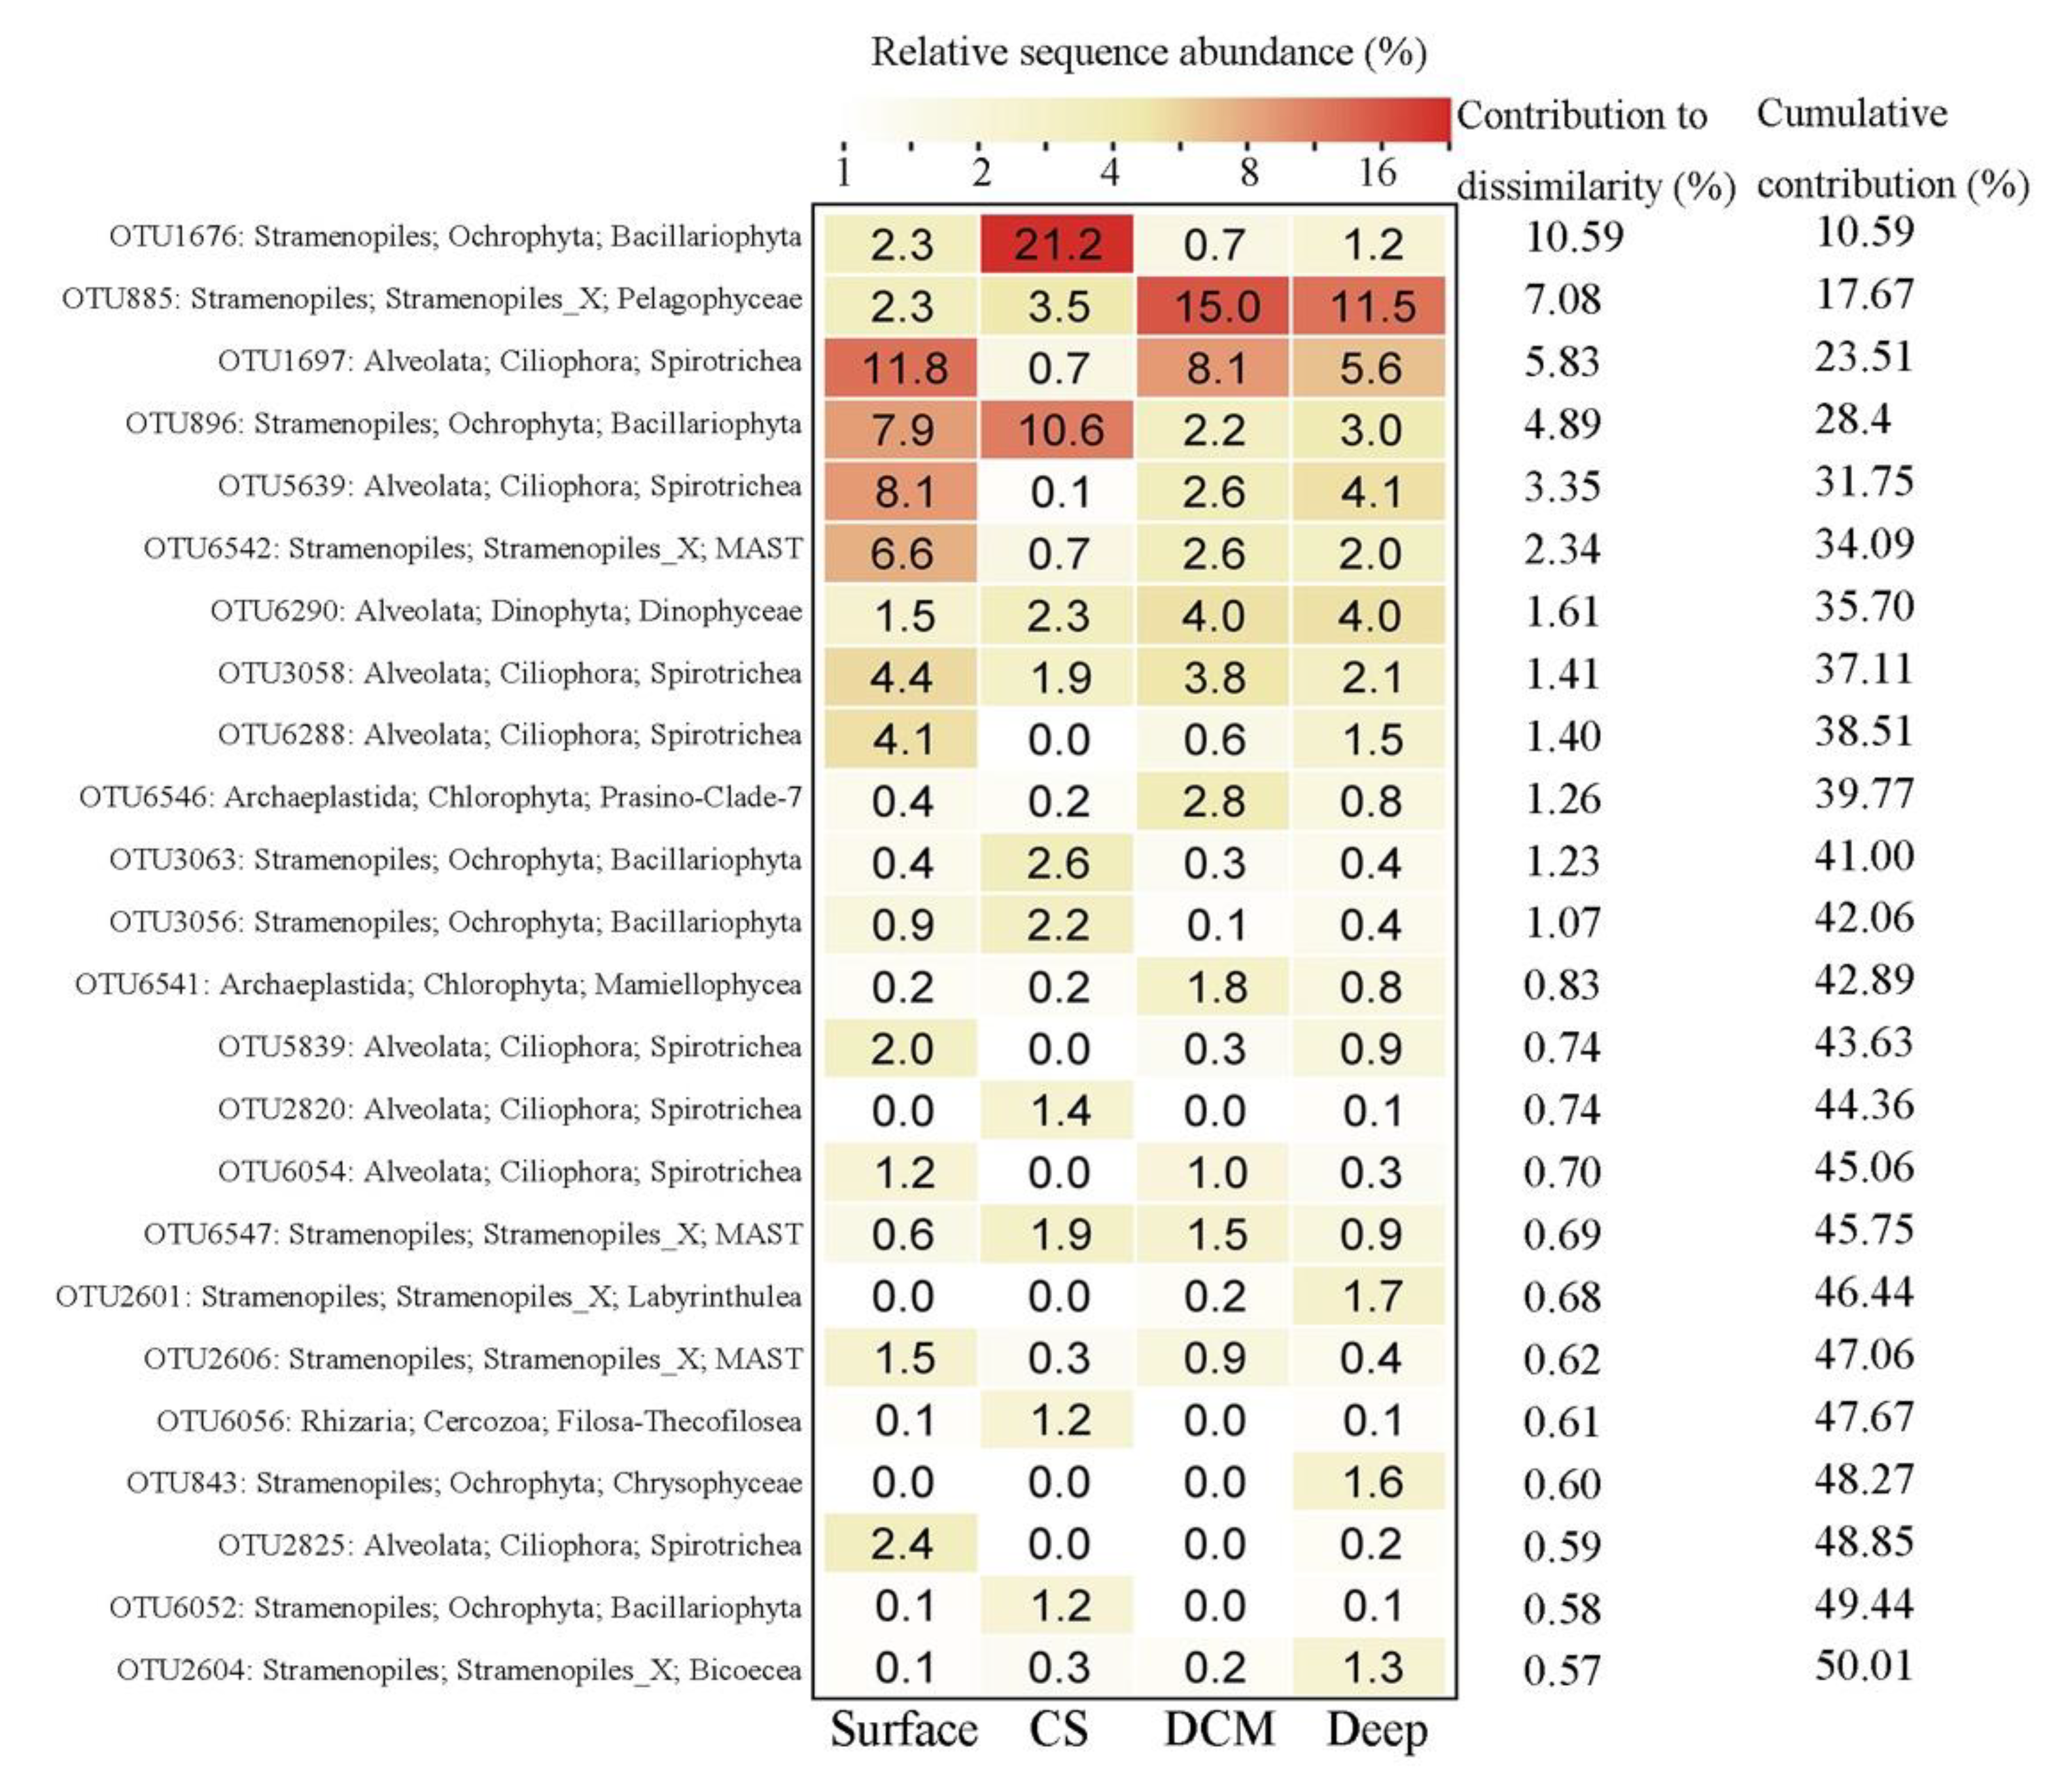
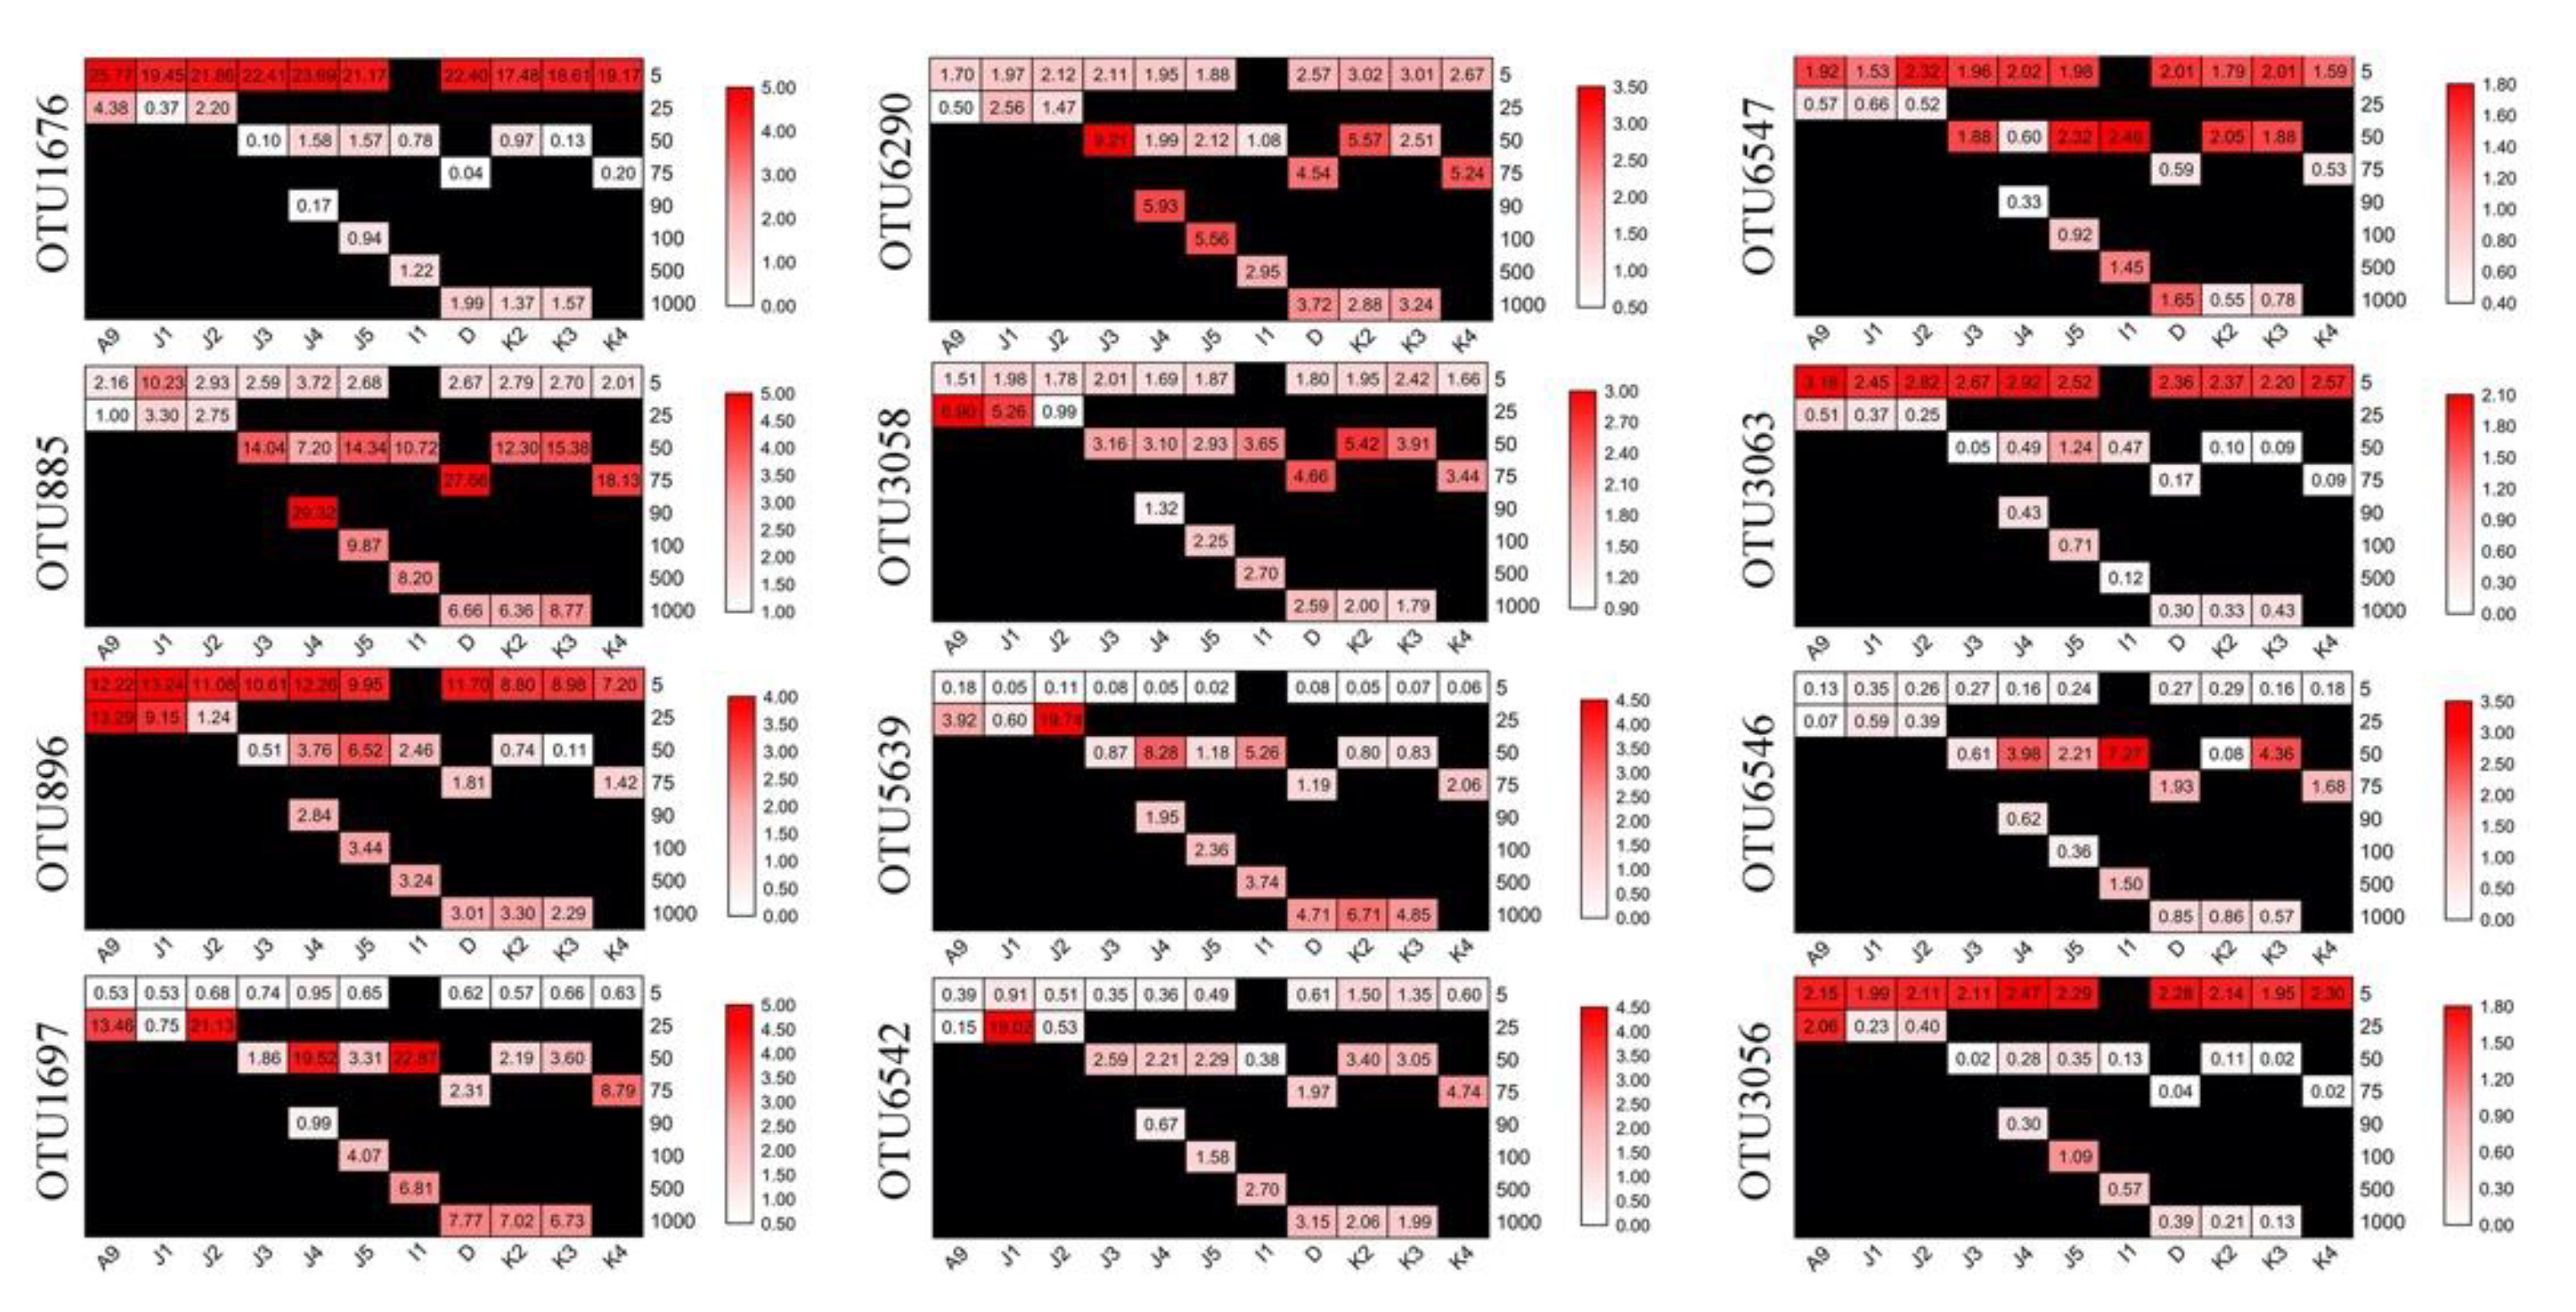
3.4. Abundant and Rare Groups

Twelve OTUs were found to be abundant (defined as OTUs accounting for >1% of the total sequences), which totally accounted for ca. 43.9% of sequences and ca. 0.4% of OTUs obtained (Figure S6A). These OTUs were affiliated with Bacillariophyta (OTU1676, OTU896, OTU3063, and OTU3056), Ciliophora (OTU1697, OTU3058, and OTU5639), Pelagophyceae (OTU885), Dinophyceae (OTU6290), Solenicola (OTU6542), Labyrinthulomycetes (OTU6547), and Chlorophyta (OTU6546), which contributed ca. 16.93%, 10.54%, 8.54%, 3.11%, 2.11%, 1.44%, and 1.12% of the total sequences, respectively (Table S2). These abundant OTUs showed distinct distribution patterns. OTU885, OTU896, OTU6290, and OTU1767, were abundant in all samples, with only a few exceptions in some samples (Figure 6). OTUs, including OTU1697, OTU5639, and OTU6542, were intermedium (relative sequence abundance 0.01–1% within a sample) in surface samples and abundant in the subsurface and deep samples, respectively. OTU6546 was found to be intermedium in both surface and deep samples and were only abundant in a few subsurface samples. OTU3063 and OTU3056 were abundant in all surface samples and the intermedium in the subsurface and deep samples (Figure 6).
To show the identity of these OTUs, similarities were obtained between the representative sequences of each OTU with its first BLAST hit (the nearest neighbors, NNs), as well as the first BLAST hit with a species name (the nearest named neighbors, NNNs) in GenBank. High similarities were found between the representative sequences of OTUs and their NN, which were all environmental sequences, 10 of which were identical, and the rest had >99% similarity (Table S2). The high similarities between the representative sequences of OTUs and their NNs indicate that these OTUs were most likely also recovered from other environments.
A total of 2573 OTUs were considered rare (defined as OTUs accounting for <0.01% of the total sequences), which totally accounted for ca. 78.1% of OTUs and ca. 5.5% of sequences recovered. The rare group was dominated by members in Alveolata (ca. 31.6% of the total OTUs), followed by members in Stramenopiles and Rhizaria (ca. 17.3% and ca. 12.3% of the total OTUs, respectively) (Figure S6B). Fifty OTUs were found to be rare in at least one sample (defined as <0.1% of sequences in a sample) but changed to abundant (defined as >1% of sequences in a sample) in at least one sample showing the shift between the locally rare and abundant OTUs. These OTUs were from a diverse of protistan groups including mainly Bacillariophyta in group Surface, Ciliophora in group CS, Archaeplastida in group DCM, and Bacillariophyta and Ciliophora in group Deep (Figure S7).

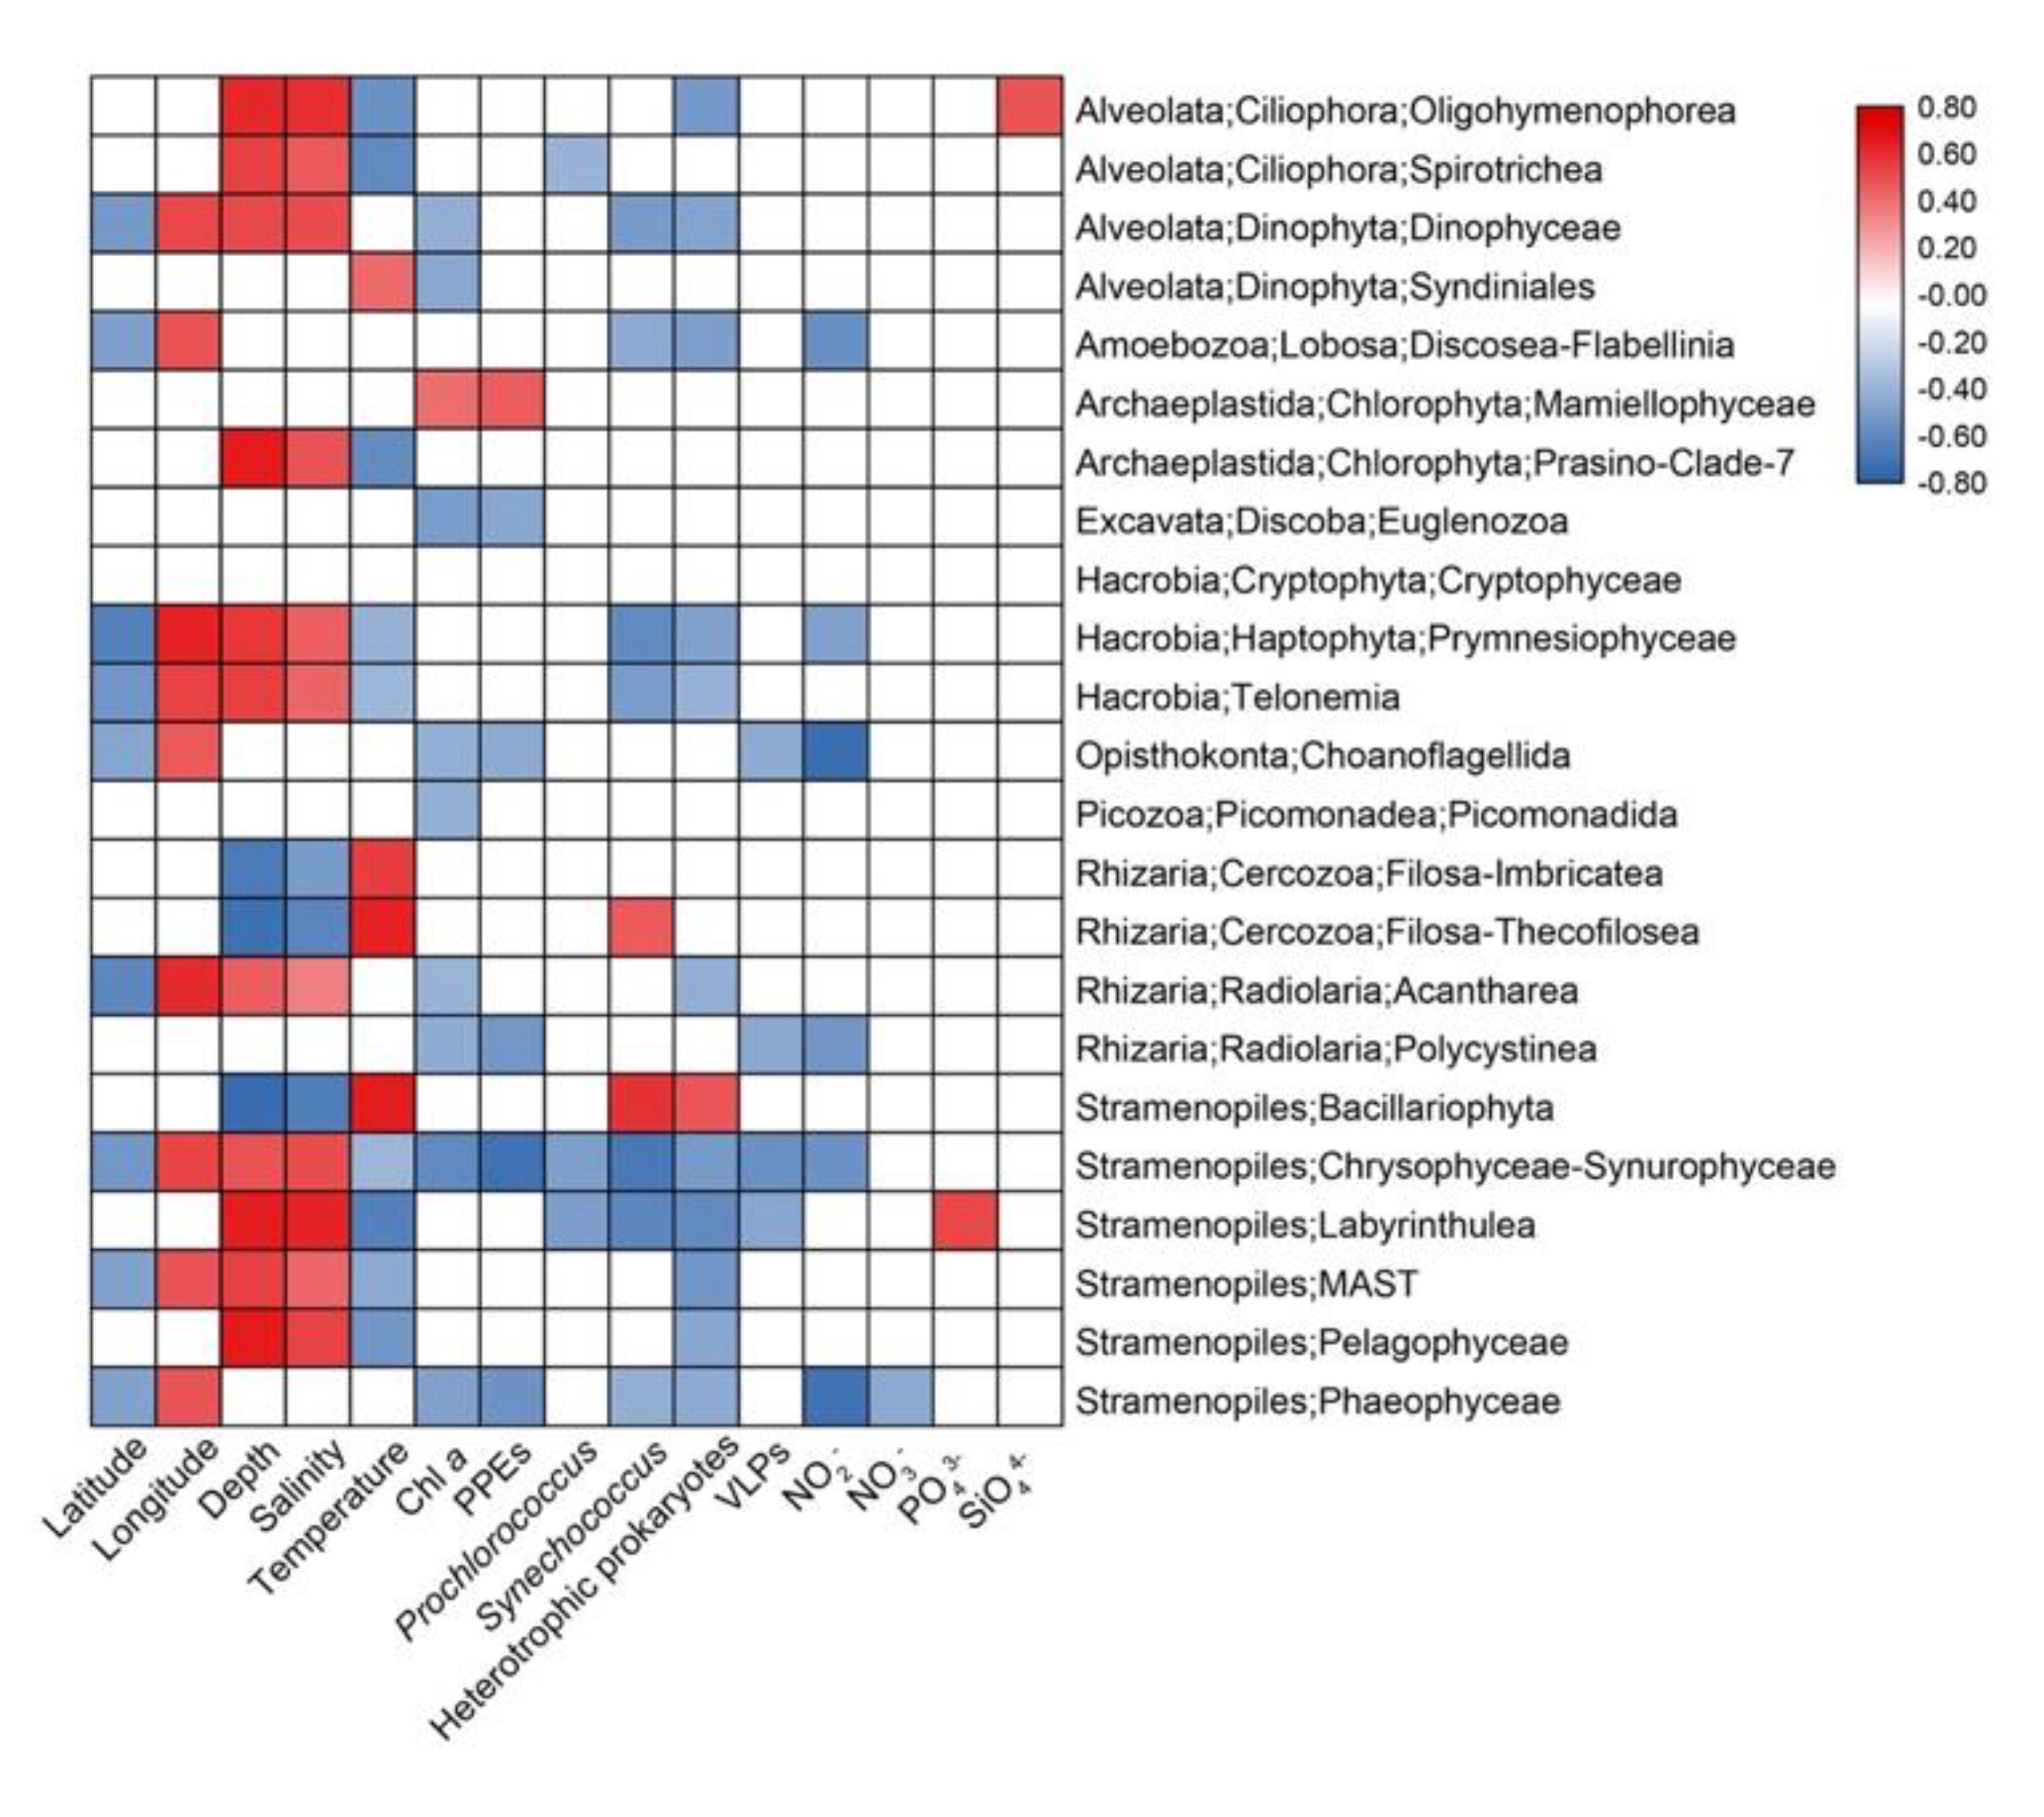
3.5. Effects of Environmental Parameters on the Total (TG), Abundant (AG) and Rare (RG) Groups

In the simple mantel tests, the TG, AG, and RG were significantly correlated with salinity, water depth, and temperature (Table 3). Partial Mantel tests showed that salinity was the dominant driving factor on the TG and AG, followed by a combination of water depth and temperature. On the contrary, water depth and temperature were the dominant driving factor on the RG. TG was significantly correlated with geographic distance, latitude, and longitude after controlling for depth. Also, TG and AG were significantly correlated with the concentrate of Chl a and the abundances of heterotrophic prokaryotes. TG was also significantly correlated with the abundances of PPEs, even after controlling for water depth. RG was significantly correlated with the concentrate of PO43− (Table 3). In surface water, geographic distance was the dominant driving factor on the TG and AG, while the temperature was the dominant driving factor on the RG (Table 4).
Spearman’s correlation analyses were conducted to explore the possible influence of environmental variables on the relative sequence abundance of major taxonomic groups (Figure 7). Depth and Salinity were usually positively correlated with several protistan groups (e.g., Ciliophora, Dinophyceae, Haptophyta, MAST, etc.) while temperature usually had the negative effects. The abundance of heterotrophic prokaryotes usually had negative effects on protistan groups including Dinophyceae, Oligohymenophorea, Amoebozoa, Haptophyta, etc. while nutrients only affected a few groups (Figure 7).

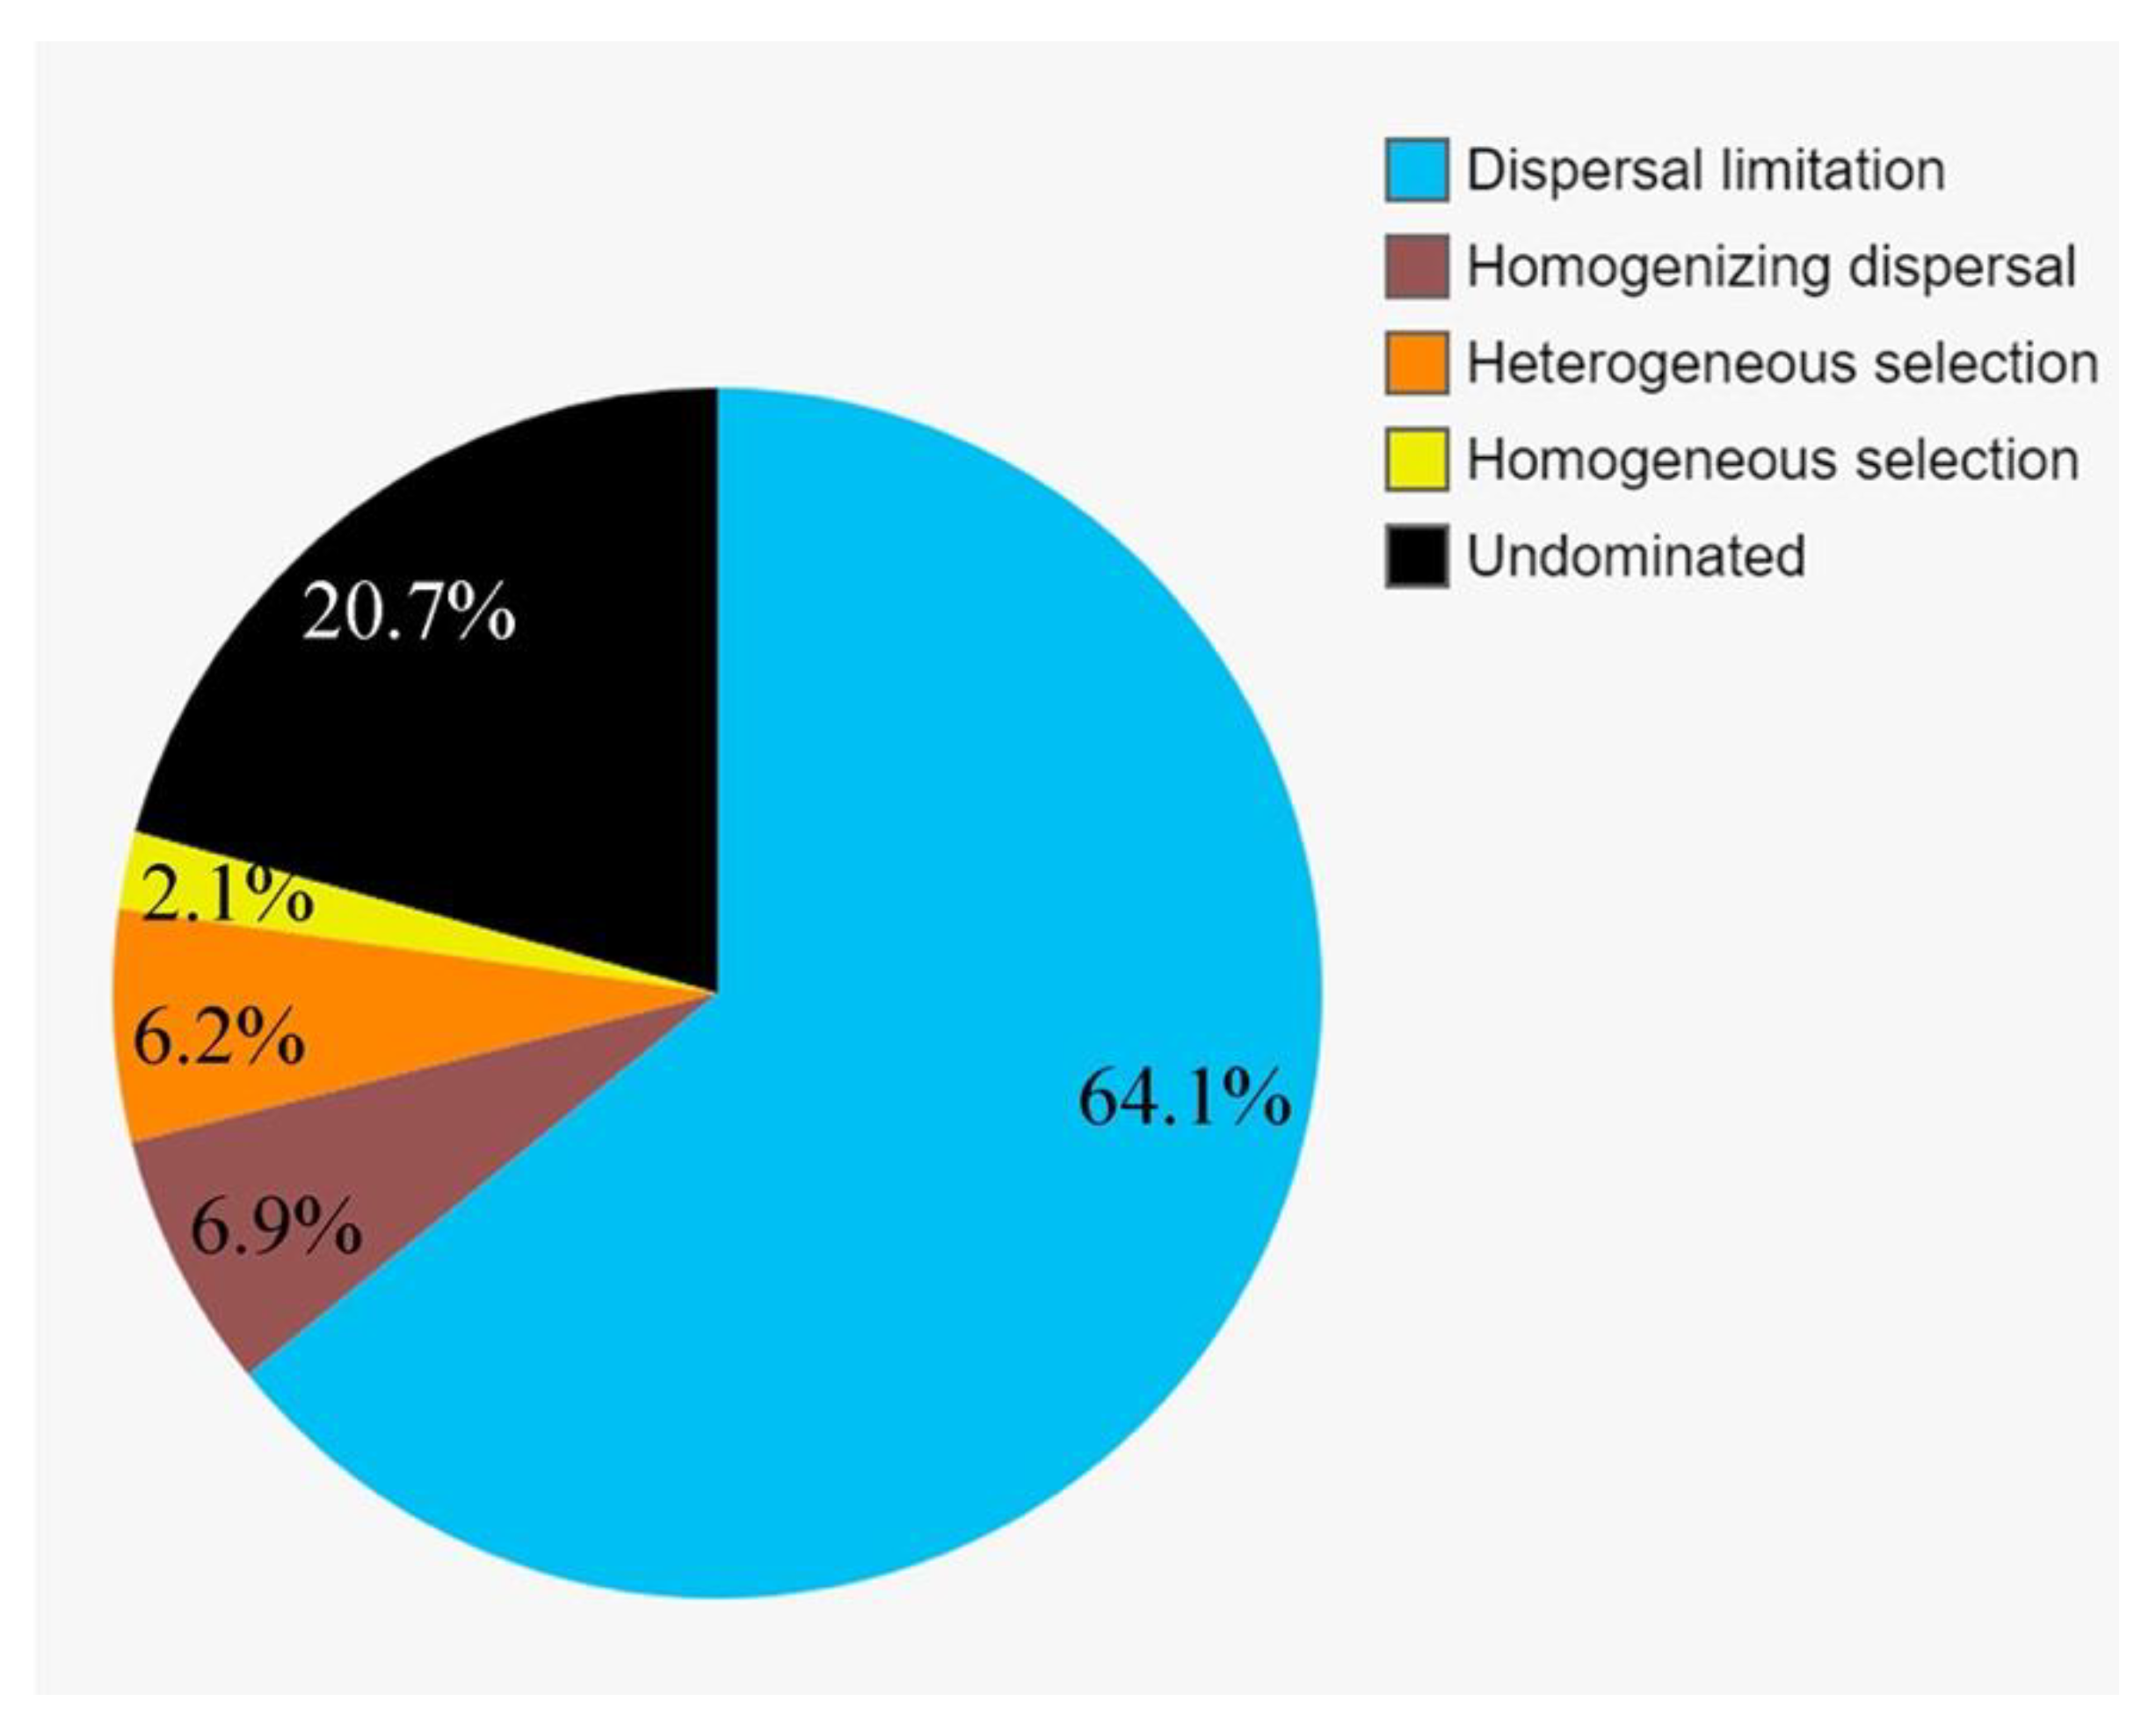
3.6. The Community Assembly of Protists

To further assess the contributions of spatial and environmental factors on the active protistan communities, quantification of ecological processes mediating community assembly was performed. Dispersal limitation was the primary driver for the community assembly and explained 64.1% of community turnover, followed by drift (ca. 20.7%) and homogeneous selection (ca. 6.9%). The rest processes, including homogenizing selection and heterogeneous selection, totally accounted for ca. 8.3% of community turnover (Figure 8).

4. Discussion

4.1. Environmental Parameters

The vertical and horizontal distribution patterns of environmental parameters were quite clear. Temperature, the concentration of nutrients and Chl a, and the abundances of Synechococcus, PPEs, heterotrophic prokaryotes, and VLPs were the highest near the river mouth and decreased as the riverine water mixed with seawater, which was within the range of previous reports [43,47,79,80]. The distribution pattern of the salinity was opposed to temperature. Previous studies showed that nutrients delivered by freshwater input to the estuary were pushed toward high salinity areas [79]. Because the salinity of the eutrophic freshwater of the nearshore PRE was lower than that of the seawater, the surface nutrients of nearshore stations were higher, promoting autotrophic picoplankton growth [79]. Along the vertical way, the temperature gradually decreased, while salinity was opposed within the range of previous reports [24]. The concentrations of NO2-, NO3-, PO43- and SiO44- were low in the coastal SCS [47,80] and increased in the open sea along the vertical way, as reported previously [81].

4.2. Variations of Major Protistan Assemblages along the Transect

Previous studies investigating protistan diversity were either limited to PRE or specific areas in the SCS, and rather few studies involved large-scale sampling [13,80]. Meanwhile, most of the studies carried out in the SCS focused on protistan diversity in the photic zone, and very few studies involved deep-sea protistan communities [24,55,82]. In the present study, RNA-based HTS that can reduce the interference of dead/dormant cells and extracellular DNA [24] was used to infer how environmental variables drive the vertical and horizontal distribution patterns of the active total, abundant, and rare protistan groups along an estuary to basin transect in the northern SCS. The protistan communities were divided into four distinct groups: Surface, CS, DCM, and Deep (Figure 2). The impact of water depth on the protistan communities was evident, forming groups Surface, CS, DCM, and Deep. Several studies of the protistan community identified water depth as the principal cause of community variability [24,83,84,85]. Group CS clustered sparsely, which showed community composition rapidly changed from the subsurface waters near the heavily urbanized PRE with complex and fast-changing environment conditions [58,79].
Bacillariophyta were abundant in group Surface (Figure 4 and Figure S4). The Bacillariophyceae affiliated sequences of the surface samples were high from the PR to the offshore. It has been previously observed that Bacillariophyta is a dominant group, for instance, in the SCS [58] and the northwestern Pacific Ocean [86]. Bacillariophyceae have been considered to be the major source of carbon flux in the surface ocean [87], and many species of Bacillariophyceae showed wide adaptability in the entire freshwater-seawater salinity gradients [88]. Thalassiosirales (Figure 6, OTU1676, and OTU896), which is often associated with eutrophic conditions, occurred mainly at the coastal surface waters [89,90,91]. Rhizosoleniales (Figure 6, OTU3063, and OTU3056) includes many meso- and polyhyaline waters species and may transport a large number of the new nitrogen requirements into the surface waters [92,93]. Cercozoa that included both predatory and parasitic species was reported to have a high diversity of ecological functions in a variety of environments including fresh and sea water, sediment, and soil [94,95,96,97,98]. In the present study, Cercozoa was the dominant group of Rhizaria at the surface water of all stations. Cercozoa sequences were mainly contributed by Filosa-Thecofilosea and Filosa-Imbricatea. Free-living Cercozoa were found to feed on fungi, algae, and other protozoa in a variety of pelagic as well as sediment environments [99]. A previous study has shown that marine cercozoan Crythecomonas was abundant in surface water due to the regulation of stratification process [100].
Spirotrichea (mainly Tintinnida) and MAST-3 were more abundant in group CS (Figure 4 and Figure 6). As members of the microzooplankton, tintinnids are a group of planktonic heterotrophic ciliates that are occasionally capable of preying on most algal production in coastal waters [101]. MAST-3, a group of heterotrophic flagellates and globally widespread bacterial grazers, can significantly affected the subtropical coastal waters ecosystem [102,103,104].
Chlorophyta (mainly Prosino_Clade_7 and Mamiellophyceae) and Pelagophyceae were abundant at the DCM depth (Figure 4, Figure 5, and Figure S4), which is consistent with previous studies in SCS applying restriction fragment length polymorphism (RFLP) and fluorescence in situ hybridization (FISH) approaches [57,80]. A previous study has also shown that Mamiellophyceae dominated the coastal waters of the East China Sea [86]. Pelagophyceae species are found to be key members of the PPEs assemblages at the DCM depth in the NW Pacific [86], the eastern Pacific Ocean [105], the southern Pacific Ocean [106], the northwestern Sargasso Sea [107], and offshore regions of the northern Iberian Peninsula during summer stratification [108].
Hacrobia (mainly Prymnesiophyceae), Radiolaria, and Excavata (mainly Discoba) were abundant in group Deep (Figure 4 and Figure S4). Within Hacrobia, Prymnesiophyeae was the dominant group, which was the only dominant PPEs in the warm pool of the NW Pacific [86] and the SCS [53,57,80]. Prymnesiales that have haptonema and are capable of being mixotrophy might contribute to their adaptability to diverse environments such as in the deep sea [109,110]. They can be incorporated into large aggregates or rapidly-sinking fecal pellets of organisms at the higher trophic level and brought to the deep waters [111,112,113,114]. Radiolaria and Excavata were more abundant in deep waters, consistent with previous reports [24,84,115].

4.3. Driving Factors of the Total, Abundant, and Rare Protistan Groups

In this study, we investigated how environmental factors, geographic distance, and depth drive the protistan communities, including the total (TG), abundant (AG), and rare (RG) groups, along an estuary to basin transect in the nSCS (Table 3 and Table 4). Simple- and partial Mantel tests showed that salinity was the most dominant driving factor on the TG and AG (Table 3). Our sampling stations spanned the estuary to the open sea, and the salinity ranged from 31.13 to 34.54 (Figure S1). Previous studies on microbial communities in the PRE showed that salinity was the most important driving factor [47,51,58,116]. After controlling for salinity, TG and AG still showed significant correlations with water depth and temperature, which suggested that water depth and temperature were also important driving factors on the TG and AG. After controlling for water depth, no significant correlation between TG/AG and temperature was found. After controlling for temperature, AG but not TG showed significant correlations with water depth. The above result indicated that the effect of temperature was likely resulted from its co-correlation with water depth [100]. Previous studies found water depth was the major driving factor of marine protistan communities, which is probably due to the fact that depth may serve as a good proxy for many physical and chemical variables in the ocean [14,24,83,84,85].
The TG was significantly correlated with geographic distance after controlling for depth (Table 4). Geographic distances may be the result of long-term slow effects compared to water depth and water mass that significantly affect community structure [81]. The importance of geographical distance in the construction of protistan communities does not eliminate the effect of local characteristics on compositional responses [117]. In the surface waters, both TG and AG were significantly correlated with geographic distance. RG were not correlated with either geographic distance or environmental factors (Table 4). It was proposed that the breadth of the taxon niche is the decisive factor influencing the distribution of taxa, and broad niche classification groups are mainly restricted by diffusion, while low niche classification groups are mainly subject to environmental restrictions [118]. Compared to RG, AG and TG have a broader niche [119]. Meanwhile, the TG and AG have many same species, and there may be under great competitive pressure. The high competition exerting on the active microbial community may lead to a certain degree of dispersion restrictions, leading to a significant distance-decay relationship [81].
On the contrary, water depth and temperature were identified to be the dominant driving factors on the RS, and salinity did not affect the distribution of RG after controlling for depth or temperature (Table 3). This reflected that RG and TG/AG might be shaped by different environmental variables [9,14]. Water depth was an integrated factor in constraining temperature, radiation, pressure, and salinity, and RG might play a strong role in those abiotic selection [14]. RG in different depth layers were influenced by contrasting driving factors [13]. Table 4 showed that the correlations between RG and environmental factors were not significant in the surface waters. AG and RG may have different ecological niches and surviving strategies. The few abundant taxa were proposed to be responsible for most of the biomass and carbon cycling, whereas the rare taxa may be important for the cycling of certain elements [11]. Rare microbial taxa were also regarded as a species bank [119], so the active rare taxa might not be influenced by a single environmental factor.
Overall, TG and AG had potential similar drivers, including salinity, followed by water depth, temperature, geographic distance, and biological factors, while RG was dominated by water depth, followed by temperature. It suggested that AG may serve as biomarkers in different geographic areas. AG responded most strongly to abiotic factors than TG, followed by RG, and the varying degrees of TG, AG, and RG responses to the environmental variables contributed to the stabilization of the total community. Rare taxa may become an abundant member of the community when the favorable environmental conditions emerged or when the abundant taxa decrease drastically or even becomes extinct [9,11].

Supplementary Materials

The following are available online at https://www.mdpi.com/2076-2607/9/2/351/s1, Figure S1: The physical and chemical parameters along the transect from Pearl River estuary to northern South China Sea, Figure S2: The biological parameters along the transect from Pearl River estuary to northern South China Sea, Figure S3: Rarefaction curves of the samples collected, Figure S4: Relative abundances of sequences and OTUs of the eight supergroups. (A) Taxonomic Stramenopiles; (B) Aveolata; (C) Archaeplastida; (E) Rhizaria; (F) Excavata, Opisthokonta and Picozoa, Figure S5: Alpha diversity estimates of OTU richness (A) and Shannon (B) the four groups (surface, CS, DCM, and Deep). ** p < 0.01, * p < 0.05, Figure S6: Sequences abundance of the abundant (A) and OTU richness of the rare (B) groups at the supergroup taxonomic level, Figure S7: Compositions of the rare taxa that can shift to abundant taxa in the four groups, Table S1: Name, coordinates, and environmental parameters of the samples. HP: Heterotrophic prokaryotes; PPEs, pigmented pico-sized eukaryotes; VLPs, viral like particles; ND: Not detected; BDL: Below detection limit, Table S2: List of the twelve abundant OTUs with the relative abundance of sequences, taxonomic identification, GenBank accession number and the identification of the nearest named neighbor (NNN), similarity (%-S) with the NNN, and GenBank accession number of the nearest neighbor (NN) and similarity (%-S) with NN.

Author Contributions

D.X. and N.J. conceived and designed the experiments; R.L., C.H., J.W., J.S., and Y.W. performed onboard sample processing and data analysis; all authors wrote the paper. All authors have read and agreed to the published version of the manuscript.

Funding

This work was supported by the National Key Research and Development Program of China (2016YFA0601400) and the National Natural Science Foundation of China (91751207, 41876142, 41861144018, and 41876134).

Institutional Review Board Statement

Not applicable.

Informed Consent Statement

Not applicable.

Data Availability Statement

All sequence data generated in this study have been submitted to the NCBI Sequence Read Archive, accessible through the accession number PRJNA687549.

Acknowledgments

We acknowledge the organization of the cruise by the captain and crews of the R/V Dongfanghong II for facilitating sample collection. Special thanks are given to the two anonymous reviewers for their valuable comments.

Conflicts of Interest

The authors declare that the research was conducted in the absence of any commercial or financial relationships that could be construed as a potential conflict of interest.

References

  1. Sunagawa, S.; Coelho, L.P.; Chaffron, S.; Kultima, J.R.; Labadie, K.; Salazar, G.; Djahanschiri, B.; Zeller, G.; Mende, D.R.; Alberti, A.; et al. Structure and function of the global ocean microbiome. Science 2015, 348, 1261359. [Google Scholar] [CrossRef] [PubMed] [Green Version]
  2. Fuhrman, J.A. Microbial community structure and its functional implications. Nat. Cell Biol. 2009, 459, 193–199. [Google Scholar] [CrossRef]
  3. Amaral-Zettler, L.; Artigas, L.F.; Baross, J.; Bharathi, L.; Boetius, A.; Chandramohan, D.; Herndl, G.; Kogure, K.; Neal, P.; Pedrós-Alió, C.; et al. A Global Census of Marine Microbes. In Life in the World’s Oceans: Diversity, Distribution, and Abundance; Wiley-Blackwell: Hoboken, NJ, USA, 2010; ISBN 9781405192972. [Google Scholar]
  4. Caron, D.A.; Alexander, H.; Allen, A.E.; Archibald, J.M.; Armbrust, E.V.; Bachy, C.; Bell, C.J.; Bharti, A.; Dyhrman, S.T.; Guida, S.M.; et al. Probing the evolution, ecology and physiology of marine protists using transcriptomics. Nat. Rev. Genet. 2016, 15, 6–20. [Google Scholar] [CrossRef]
  5. Pace, N.R. A molecular view of microbial diversity and the biosphere. Science 1997, 276, 734–740. [Google Scholar] [CrossRef] [PubMed]
  6. Levinsen, H.; Nielsen, T.G. The trophic role of marine pelagic ciliates and heterotrophic dinoflagellates in arctic and temperate coastal ecosystems: A cross-latitude comparison. Limnol. Oceanogr. 2002, 47, 427–439. [Google Scholar] [CrossRef]
  7. Follows, M.J.; Dutkiewicz, S.; Grant, S.; Chisholm, S.W. Emergent biogeography of microbial communities in a model ocean. Science 2007, 315, 1843–1846. [Google Scholar] [CrossRef] [Green Version]
  8. Caron, D.; Countway, P. Hypotheses on the role of the protistan rare biosphere in a changing world. Aquat. Microb. Ecol. 2009, 57, 227–238. [Google Scholar] [CrossRef] [Green Version]
  9. Logares, R.; Audic, S.; Bass, D.; Bittner, L.; Boutte, C.; Christen, R.; Claverie, J.-M.; Decelle, J.; Dolan, J.R.; Dunthorn, M.; et al. Patterns of rare and abundant marine microbial eukaryotes. Curr. Biol. 2014, 24, 813–821. [Google Scholar] [CrossRef] [Green Version]
  10. Lennon, J.T.; Jones, S.E. Microbial seed banks: The ecological and evolutionary implications of dormancy. Nat. Rev. Genet. 2011, 9, 119–130. [Google Scholar] [CrossRef] [PubMed]
  11. Pedrós-Alió, C. The Rare Bacterial Biosphere. Annu. Rev. Mar. Sci. 2012, 4, 449–466. [Google Scholar] [CrossRef] [PubMed] [Green Version]
  12. Jiao, S.; Chen, W.; Weimin, C. Biogeography and ecological diversity patterns of rare and abundant bacteria in oil-contaminated soils. Mol. Ecol. 2017, 26, 5305–5317. [Google Scholar] [CrossRef]
  13. Wu, W.; Logares, R.; Huang, B.; Hsieh, C.-H. Abundant and rare picoeukaryotic sub-communities present contrasting patterns in the epipelagic waters of marginal seas in the northwestern Pacific Ocean. Environ. Microbiol. 2017, 19, 287–300. [Google Scholar] [CrossRef]
  14. Jia, X.; Dini-Andreote, F.; Salles, J.F. Community assembly processes of the microbial rare biosphere. Trends Microbiol. 2018, 26, 738–747. [Google Scholar] [CrossRef]
  15. Jousset, A.; Bienhold, C.; Chatzinotas, A.; Gallien, L.; Gobet, A.; Kurm, V.; Küsel, K.; Rillig, M.C.; Rivett, D.W.; Salles, J.F.; et al. Where less may be more: How the rare biosphere pulls ecosystems strings. ISME J. 2017, 11, 853–862. [Google Scholar] [CrossRef]
  16. Mallon, C.A.; Poly, F.; Le Roux, X.; Marring, I.; Van Elsas, J.D.; Salles, J.F. Resource pulses can alleviate the biodiversity-invasion relationship in soil microbial communities. Ecology 2015, 96, 915–926. [Google Scholar] [CrossRef] [PubMed] [Green Version]
  17. Wang, Y.; Hatt, J.K.; Tsementzi, D.; Rodriguez-R, L.M.; Ruiz-Pérez, C.A.; Weigand, M.R.; Kizer, H.; Maresca, G.; Krishnan, R.; Poretsky, R.; et al. Quantifying the importance of the rare biosphere for microbial community response to organic pollutants in a freshwater ecosystem. Appl. Environ. Microbiol. 2017, 83, e03321-16. [Google Scholar] [CrossRef] [Green Version]
  18. Van Elsas, J.D.; Chiurazzi, M.; Mallon, C.A.; Elhottova, D.; Kristufek, V.; Salles, J.F. Microbial diversity determines the invasion of soil by a bacterial pathogen. Proc. Natl. Acad. Sci. USA 2012, 109, 1159–1164. [Google Scholar] [CrossRef] [PubMed] [Green Version]
  19. Delong, E.F.; Karl, D.M. Genomic perspectives in microbial oceanography. Nat. Cell Biol. 2005, 437, 336–342. [Google Scholar] [CrossRef] [PubMed]
  20. Caron, D.A.; Countway, P.D.; Jones, A.C.; Kim, D.Y.; Schnetzer, A. Marine protistan diversity. Annu. Rev. Mar. Sci. 2012, 4, 467–493. [Google Scholar] [CrossRef] [Green Version]
  21. De Vargas, C.; Audic, S.; Henry, N.; Decelle, J.; Mahé, F.; Logares, R.; Lara, E.; Berney, C.; Le Bescot, N.; Probert, I.; et al. Ocean plankton. Eukaryotic plankton diversity in the sunlit ocean. Science 2015, 348, 1261605. [Google Scholar] [CrossRef] [Green Version]
  22. Gran-Stadniczeñko, S.; Egge, E.D.; Hostyeva, V.; Logares, R.; Eikrem, W.; Edvardsen, B. Protist diversity and seasonal dynamics in Skagerrak plankton communities as revealed by metabarcoding and microscopy. J. Eukaryot. Microbiol. 2018, 66, 494–513. [Google Scholar] [CrossRef]
  23. Bork, P.; Bowler, C.; De Vargas, C.; Gorsky, G.; Karsenti, E.; Wincker, P. Tara Oceans studies plankton at planetary scale. Science 2015, 348, 873. [Google Scholar] [CrossRef] [Green Version]
  24. Xu, D.; Li, R.; Hu, C.; Sun, P.; Jiao, N.; Warren, A. Microbial eukaryote diversity and activity in the water column of the South China Sea based on DNA and RNA high throughput sequencing. Front. Microbiol. 2017, 8, 1121. [Google Scholar] [CrossRef]
  25. Nolte, V.; Pandey, R.V.; Jost, S.; Medinger, R.; Ottenwälder, B.; Boenigk, J.; Schlötterer, C. Contrasting seasonal niche separation between rare and abundant taxa conceals the extent of protist diversity. Mol. Ecol. 2010, 19, 2908–2915. [Google Scholar] [CrossRef] [PubMed] [Green Version]
  26. Hugoni, M.; Taib, N.; Debroas, D.; Domaizon, I.; Dufournel, I.J.; Bronner, G.; Salter, I.; Agogué, H.; Mary, I.; Galand, P.E. Structure of the rare archaeal biosphere and seasonal dynamics of active ecotypes in surface coastal waters. Proc. Natl. Acad. Sci. USA 2013, 110, 6004–6009. [Google Scholar] [CrossRef] [Green Version]
  27. Gobet, A.; Böer, S.; Huse, S.M.; Van Beusekom, J.; Quince, C.; Sogin, M.L.; Boetius, A.; Ramette, A. Diversity and dynamics of rare and of resident bacterial populations in coastal sands. ISME J. 2011, 6, 542–553. [Google Scholar] [CrossRef] [Green Version]
  28. Galand, P.E.; Casamayor, E.O.; Kirchman, D.L.; Lovejoy, C. Ecology of the rare microbial biosphere of the Arctic Ocean. Proc. Natl. Acad. Sci. USA 2009, 106, 22427–22432. [Google Scholar] [CrossRef] [Green Version]
  29. Jones, S.E.; Lennon, J.T. Dormancy contributes to the maintenance of microbial diversity. Proc. Natl. Acad. Sci. USA 2010, 107, 5881–5886. [Google Scholar] [CrossRef] [PubMed] [Green Version]
  30. Aanderud, Z.T.; Jones, S.E.; Efierer, N.; Lennon, J.T. Resuscitation of the rare biosphere contributes to pulses of ecosystem activity. Front. Microbiol. 2015, 6, 24. [Google Scholar] [CrossRef] [Green Version]
  31. Campbell, B.J.; Yu, L.; Heidelberg, J.F.; Kirchman, D.L. Activity of abundant and rare bacteria in a coastal ocean. Proc. Natl. Acad. Sci. USA 2011, 108, 12776–12781. [Google Scholar] [CrossRef] [PubMed] [Green Version]
  32. Genitsaris, S.; Monchy, S.; Viscogliosi, E.; Sime-Ngando, T.; Ferreira, S.; Christaki, U. Seasonal variations of marine protist community structure based on taxon-specific traits using the eastern English Channel as a model coastal system. FEMS Microbiol. Ecol. 2015, 91. [Google Scholar] [CrossRef] [PubMed]
  33. Mangot, J.-F.; Domaizon, I.; Taib, N.; Marouni, N.; Duffaud, E.; Bronner, G.; Debroas, D. Short-term dynamics of diversity patterns: Evidence of continual reassembly within lacustrine small eukaryotes. Environ. Microbiol. 2013, 15, 1745–1758. [Google Scholar] [CrossRef]
  34. Josephson, K.L.; Gerba, C.P.; Pepper, I.L. Polymerase chain reaction detection of nonviable bacterial pathogens. Appl. Environ. Microbiol. 1993, 59, 3513–3515. [Google Scholar] [CrossRef] [PubMed] [Green Version]
  35. Dell’Anno, A. Extracellular DNA plays a key role in deep-sea ecosystem functioning. Science 2005, 309, 2179. [Google Scholar] [CrossRef] [PubMed]
  36. Hu, S.K.; Campbell, V.; Connell, P.; Gellene, A.G.; Liu, Z.; Terrado, R.; Caron, D.A. Protistan diversity and activity inferred from RNA and DNA at a coastal ocean site in the eastern North Pacific. FEMS Microbiol. Ecol. 2016, 92, fiw050. [Google Scholar] [CrossRef] [Green Version]
  37. Charvet, S.; Vincent, W.F.; Lovejoy, C. Effects of light and prey availability on Arctic freshwater protist communities examined by high-throughput DNA and RNA sequencing. FEMS Microbiol. Ecol. 2014, 88, 550–564. [Google Scholar] [CrossRef] [Green Version]
  38. Sun, P.; Huang, L.; Xu, D.; Huang, B.; Chen, N.; Warren, A. Marked seasonality and high spatial variation in estuarine ciliates are driven by exchanges between the ‘abundant’ and ‘intermediate’ biospheres. Sci. Rep. 2017, 7, 1–12. [Google Scholar] [CrossRef] [Green Version]
  39. Dai, M.; Meng, F.; Tang, T.; Kao, S.-J.; Lin, J.; Chen, J.; Huang, J.-C.; Tian, J.; Gan, J.; Yang, S. Excess total organic carbon in the intermediate water of the South China Sea and its export to the North Pacific. Geochem. Geophys. Geosyst. 2009, 10. [Google Scholar] [CrossRef] [Green Version]
  40. Hu, J.; Kawamura, H.; Hong, H.; Qi, Y. A Review on the currents in the South China Sea: Seasonal circulation, South China Sea Warm Current and Kuroshio intrusion. J. Oceanogr. 2000, 56, 607–624. [Google Scholar] [CrossRef]
  41. Ning, X.; Chai, F.; Xue, H.; Cai, Y.; Liu, C.; Shi, J. Physical-biological oceanographic coupling influencing phytoplankton and primary production in the South China Sea. J. Geophys. Res. Space Phys. 2004, 109, 1–20. [Google Scholar] [CrossRef] [Green Version]
  42. He, L.; Yin, K.; Yuan, X.; Li, D.; Zhang, D.; Harrison, P.J. Spatial distribution of viruses, bacteria and chlorophyll in the northern South China Sea. Aquat. Microb. Ecol. 2009, 54, 153–162. [Google Scholar] [CrossRef] [Green Version]
  43. Hu, C.; Chen, X.; Yu, L.; Xu, D.; Jiao, N. Elevated contribution of low nucleic acid prokaryotes and viral lysis to the prokaryotic community along the nutrient gradient from an estuary to open ocean transect. Front. Microbiol. 2020, 11. [Google Scholar] [CrossRef]
  44. Jin, T.; Zhang, T.; Ye, L.; Lee, O.O.; Wong, Y.H.; Qian, P.Y. Diversity and quantity of ammonia-oxidizing Archaea and Bacteria in sediment of the Pearl River Estuary, China. Appl. Microbiol. Biotechnol. 2011, 90, 1137–1145. [Google Scholar] [CrossRef] [PubMed] [Green Version]
  45. Yuan, X.; He, L.; Yin, K.; Pan, G.; Harrison, P.J. Bacterial distribution and nutrient limitation in relation to different water masses in the coastal and northwestern South China Sea in late summer. Cont. Shelf Res. 2011, 31, 1214–1223. [Google Scholar] [CrossRef]
  46. Li, J.; Jiang, X.; Jing, Z.; Li, G.; Chen, Z.; Zhou, L.; Zhao, C.; Liu, J.; Tan, Y. Spatial and seasonal distributions of bacterioplankton in the Pearl River Estuary: The combined effects of riverine inputs, temperature, and phytoplankton. Mar. Pollut. Bull. 2017, 125, 199–207. [Google Scholar] [CrossRef] [PubMed]
  47. Xie, W.; Zhang, C.; Zhou, X.; Wang, P. Salinity-dominated change in community structure and ecological function of Archaea from the lower Pearl River to coastal South China Sea. Appl. Microbiol. Biotechnol. 2014, 98, 7971–7982. [Google Scholar] [CrossRef] [PubMed]
  48. Ni, Z.; Huang, X.; Zhang, X. Picoplankton and virioplankton abundance and community structure in Pearl River Estuary and Daya Bay, South China. J. Environ. Sci. 2015, 32, 146–154. [Google Scholar] [CrossRef]
  49. Hu, A.; Jiao, N.; Zhang, R.; Hu, A. Community structure and function of planktonic Crenarchaeota: Changes with depth in the South China Sea. Microb. Ecol. 2011, 62, 549–563. [Google Scholar] [CrossRef]
  50. Xia, X.; Guo, W.; Liu, H. Dynamics of the bacterial and archaeal communities in the Northern South China Sea revealed by 454 pyrosequencing of the 16S rRNA gene. Deep. Sea Res. Part II Top. Stud. Oceanogr. 2015, 117, 97–107. [Google Scholar] [CrossRef]
  51. Hou, L.; Xie, X.; Wan, X.; Kao, S.; Jiao, N.; Zhang, Y. Niche differentiation of ammonia and nitrite oxidizers along a salinity gradient from the Pearl River estuary to the South China Sea. Biogeosciences 2018, 15, 5169–5187. [Google Scholar] [CrossRef] [Green Version]
  52. Lin, D.; Zhou, H.; Chen, Y.-Q.; Li, L.-Y.; Chen, J.-H.; Wu, S.-H.; Huang, Q.-J.; Qu, L.-H. Diversity and distribution of planktonic protists in the northern South China Sea. J. Plankton Res. 2010, 33, 445–456. [Google Scholar] [CrossRef] [Green Version]
  53. Wu, W.; Huang, B.; Zhong, C. Photosynthetic picoeukaryote assemblages in the South China Sea from the Pearl River estuary to the SEATS station. Aquat. Microb. Ecol. 2014, 71, 271–284. [Google Scholar] [CrossRef]
  54. Wu, W.; Liu, H. Disentangling protist communities identified from DNA and RNA surveys in the Pearl River-South China Sea Continuum during the wet and dry seasons. Mol. Ecol. 2018, 27, 4627–4640. [Google Scholar] [CrossRef]
  55. Xu, D.; Jiao, N.; Ren, R.; Warren, A. Distribution and diversity of microbial eukaryotes in bathypelagic waters of the South China Sea. J. Eukaryot. Microbiol. 2017, 64, 370–382. [Google Scholar] [CrossRef] [PubMed]
  56. Yuan, J.; Chen, M.-Y.; Shao, P.; Zhou, H.; Chen, Y.-Q.; Qu, L. Genetic diversity of small eukaryotes from the coastal waters of Nansha Islands in China. FEMS Microbiol. Lett. 2004, 240, 163–170. [Google Scholar] [CrossRef]
  57. Wu, W.; Wang, L.; Liao, Y.; Huang, B. Microbial eukaryotic diversity and distribution in a river plume and cyclonic eddy-influenced ecosystem in the South China Sea. MicrobiologyOpen 2015, 4, 826–840. [Google Scholar] [CrossRef]
  58. Li, R.; Jiao, N.; Warren, A.; Xu, D. Changes in community structure of active protistan assemblages from the lower Pearl River to coastal Waters of the South China Sea. Eur. J. Protistol. 2018, 63, 72–82. [Google Scholar] [CrossRef]
  59. Jiang, Z.-Y.; Wang, Y.-S.; Sun, F.-L. Spatial structure of eukaryotic ultraplankton community in the northern South China Sea. Biologia 2014, 69, 557–565. [Google Scholar] [CrossRef]
  60. Welschmeyer, N.A. Fluorometric analysis of chlorophyll a in the presence of chlorophyll b and pheopigments. Limnol. Oceanogr. 1994, 39, 1985–1992. [Google Scholar] [CrossRef]
  61. Liang, Y.; Zhang, Y.; Zhang, Y.; Luo, T.; Rivkin, R.B.; Jiao, N. Distributions and relationships of virio- and picoplankton in the epi-, meso- and bathypelagic zones of the Western Pacific Ocean. FEMS Microbiol. Ecol. 2016, 93, fiw238. [Google Scholar] [CrossRef] [PubMed]
  62. Marie, D.; Partensky, F.; Vaulot, D.; Brussaard, C. Enumeration of phytoplankton, bacteria, and viruses in marine samples. Curr. Protoc. Cytom. 1999, 10, 11. [Google Scholar] [CrossRef]
  63. Jiao, N.; Yang, Y.Y.; Koshikawa, H.H.; Watanabe, M.M. Influence of hydrographic conditions on picoplankton distribution in the East China Sea. Aquat. Microb. Ecol. 2002, 30, 37–48. [Google Scholar] [CrossRef] [Green Version]
  64. Amaral-Zettler, L.A.; McCliment, E.A.; Ducklow, H.W.; Huse, S.M. A method for studying protistan diversity using mas-sively parallel sequencing of V9 hypervariable regions of small-subunit ribosomal RNA genes. PLoS ONE 2009, 4, e6372. [Google Scholar] [CrossRef]
  65. Bolger, A.M.; Lohse, M.; Usadel, B. Trimmomatic: A flexible trimmer for Illumina sequence data. Bioinformatics 2014, 30, 2114–2120. [Google Scholar] [CrossRef] [Green Version]
  66. Magoč, T.; Magoč, M.; Salzberg, S.L. FLASH: Fast length adjustment of short reads to improve genome sssemblies. Bioinform. 2011, 27, 2957–2963. [Google Scholar] [CrossRef]
  67. Caporaso, J.G.; Kuczynski, J.; Stombaugh, J.; Bittinger, K.; Bushman, F.D.; Costello, E.K.; Fierer, N.; Peña, A.G.; Goodrich, J.K.; Gordon, J.I.; et al. QIIME allows analysis of high-throughput community sequencing data. Nat. Methods 2010, 7, 335–336. [Google Scholar] [CrossRef] [PubMed] [Green Version]
  68. Edgar, R.C. Search and clustering orders of magnitude faster than BLAST. Bioinformatics 2010, 26, 2460–2461. [Google Scholar] [CrossRef] [PubMed] [Green Version]
  69. Guillou, L.; Bachar, D.; Audic, S.; Bass, D.; Berney, C.; Bittner, L.; Boutte, C.; Burgaud, G.; De Vargas, C.; Decelle, J.; et al. The Protist Ribosomal Reference database (PR2): A catalog of unicellular eukaryote small sub-unit rRNA sequences with curated taxonomy. Nucleic Acids Res. 2012, 41, D597–D604. [Google Scholar] [CrossRef] [Green Version]
  70. Schloss, P.D.; Westcott, S.L.; Ryabin, T.; Hall, J.R.; Hartmann, M.; Hollister, E.B.; Lesniewski, R.A.; Oakley, B.B.; Parks, D.H.; Robinson, C.J.; et al. Introducing mothur: Open-source, platform-independent, community-supported software for describing and comparing microbial communities. Appl. Environ. Microbiol. 2009, 75, 7537–7541. [Google Scholar] [CrossRef] [Green Version]
  71. Clarke, K.R.; Warwick, R.M. Change in Marine Communities: An Approach to Statistical Analysis and Interpretation, 2nd ed.; PRIMER-E: Plymouth, UK, 2001; p. 172. [Google Scholar]
  72. Clarke, K.R.; Gorley, R.N. PRIMER v6: User Manual/Tutorial; PRIMER-E: Plymouth, UK, 2006. [Google Scholar] [CrossRef]
  73. Clarke, K.R. Non-parametric multivariate analyses of changes in community structure. Aust. J. Ecol. 1993, 18, 117–143. [Google Scholar] [CrossRef]
  74. Hammer, Ø.; Harper, D.A.; Ryan, P.D. PAST: Paleontological statistics software package for education and data analysis. Palaeontol. Electron. 2001, 4, 9. [Google Scholar] [CrossRef]
  75. Legendre, P.; Legendre, L. Numerical Ecology; Elsevier: Amsterdam, The Netherlands, 1998. [Google Scholar]
  76. Stegen, J.C.; Lin, X.; Fredrickson, J.K.; Chen, X.; Kennedy, D.W.; Murray, C.J.; Rockhold, M.L.; Konopka, A. Quantifying community assembly processes and identifying features that impose them. ISME J. 2013, 7, 2069–2079. [Google Scholar] [CrossRef] [PubMed]
  77. Zhou, J.; Ning, D. Stochastic community assembly: Does it matter in microbial ecology? Microbiol. Mol. Biol. Rev. 2017, 81, e00002-17. [Google Scholar] [CrossRef] [PubMed] [Green Version]
  78. Segata, N.; Izard, J.; Waldron, L.; Gevers, D.; Miropolsky, L.; Garrett, W.S.; Huttenhower, C. Metagenomic biomarker discovery and explanation. Genome Biol. 2011, 12, R60. [Google Scholar] [CrossRef] [PubMed] [Green Version]
  79. Qiu, D.; Huang, L.; Zhang, J.; Lin, S. Phytoplankton dynamics in and near the highly eutrophic Pearl River Estuary, South China Sea. Cont. Shelf Res. 2010, 30, 177–186. [Google Scholar] [CrossRef]
  80. Wu, W.; Wang, L.; Liao, Y.; Xu, S.; Huang, B. Spatial and seasonal distributions of photosynthetic picoeukaryotes along an estuary to basin transect in the northern South China Sea. J. Plankton Res. 2017, 39, 423–435. [Google Scholar] [CrossRef]
  81. Zhang, Y.; Zhao, Z.; Dai, M.; Jiao, N.; Herndl, G.J. Drivers shaping the diversity and biogeography of total and active bacterial communities in the South China Sea. Mol. Ecol. 2014, 23, 2260–2274. [Google Scholar] [CrossRef]
  82. Li, X.; Warren, A.; Jiao, N.; Xu, D. Distribution of protists in the deep South China Sea revealed by high-throughput sequencing. J. Ocean Univ. China 2020, 19, 161–170. [Google Scholar] [CrossRef]
  83. Countway, P.D.; Gast, R.J.; Dennett, M.R.; Savai, P.; Rose, J.M.; Caron, D.A. Distinct protistan assemblages characterize the euphotic zone and deep sea (2500 m) of the western North Atlantic (Sargasso Sea and Gulf Stream). Environ. Microbiol. 2007, 9, 1219–1232. [Google Scholar] [CrossRef]
  84. Schnetzer, A.; Moorthi, S.D.; Countway, P.D.; Gast, R.J.; Gilg, I.C.; Caron, D.A. Depth matters: Microbial eukaryote diversity and community structure in the eastern North Pacific revealed through environmental gene libraries. Deep. Sea Res. Part I Oceanogr. Res. Pap. 2011, 58, 16–26. [Google Scholar] [CrossRef]
  85. Countway, P.D.; Vigil, P.; Schnetzer, A.; Moorthi, S.D.; Caron, D.A. Seasonal analysis of protistan community structure and diversity at the USC Microbial Observatory (San Pedro Channel, North Pacific Ocean). Limnol. Oceanogr. 2010, 55, 2381–2396. [Google Scholar] [CrossRef] [Green Version]
  86. Choi, D.H.; An, S.M.; Chun, S.; Yang, E.C.; Selph, K.E.; Lee, C.M.; Noh, J.H. Dynamic changes in the composition of photosynthetic picoeukaryotes in the northwestern Pacific Ocean revealed by high-throughput tag sequencing of plastid 16S rRNA genes. FEMS Microbiol. Ecol. 2016, 92, fiv170. [Google Scholar] [CrossRef]
  87. Michaels, A.F.; Silver, M.W. Primary production, sinking fluxes and the microbial food web. Deep. Sea Res. Part A Oceanogr. Res. Pap. 1988, 35, 473–490. [Google Scholar] [CrossRef]
  88. Balzano, S.; Sarno, D.; Kooistra, W.H.C.F. Effects of salinity on the growth rate and morphology of ten Skeletonema strains. J. Plankton Res. 2010, 33, 937–945. [Google Scholar] [CrossRef] [Green Version]
  89. Balzano, S.; Abs, E.; Leterme, S. Protist diversity along a salinity gradient in a coastal lagoon. Aquat. Microb. Ecol. 2015, 74, 263–277. [Google Scholar] [CrossRef] [Green Version]
  90. Lee, J.E.; Chung, I.K.; Lee, S.-R. Dynamic genetic features of eukaryotic plankton diversity in the Nakdong River estuary of Korea. Chin. J. Oceanol. Limnol. 2016, 35, 844–857. [Google Scholar] [CrossRef]
  91. Sarno, D.; Kooistra, W.H.C.F.; Balzano, S.; Hargraves, P.E.; Zingone, A. Diversity in the genus Skeletonema (bacillariophyceae): III. Phylogenetic position and morphological variability of Skeletonema costatum and Skeletonema grevillei, with the description of Skeletonema ardens sp. nov. J. Phycol. 2007, 43, 156–170. [Google Scholar] [CrossRef]
  92. Łotocka, M. The first observed bloom of the diatom Dactyliosolen fragilissimus (Bergon) Hasle 1996 in the Gulf of Gdańsk [commun.]. Oceanologia 2006, 48, 447–452. [Google Scholar]
  93. Villareal, T.A.; Altabet, M.A.; Culver-Rymsza, K. Nitrogen transport by vertically migrating diatom mats in the North Pacific Ocean. Nat. Cell Biol. 1993, 363, 709–712. [Google Scholar] [CrossRef]
  94. Bass, D.; Cavalier-Smith, T. Phylum-specific environmental DNA analysis reveals remarkably high global biodiversity of Cercozoa (Protozoa). Int. J. Syst. Evol. Microbiol. 2004, 54, 2393–2404. [Google Scholar] [CrossRef]
  95. Berney, C.; Romac, S.; Mahé, F.; Santini, S.; Siano, R.; Bass, D. Vampires in the oceans: Predatory cercozoan amoebae in marine habitats. ISME J. 2013, 7, 2387–2399. [Google Scholar] [CrossRef] [PubMed]
  96. Fiore-Donno, A.M.; Richter-Heitmann, T.; Degrune, F.; Dumack, K.; Regan, K.M.; Marhan, S.; Boeddinghaus, R.S.; Rillig, M.C.; Friedrich, M.W.; Kandeler, E.; et al. Functional traits and spatio-temporal structure of a major group of soil protists (Rhizaria: Cercozoa) in a temperate grassland. Front. Microbiol. 2019, 10, 1332. [Google Scholar] [CrossRef] [PubMed] [Green Version]
  97. Reece, K.S.; Siddall, M.E.; Stokes, N.A.; Burreson, E.M. Molecular phylogeny of the haplosporidia based on two independent gene sequences. J. Parasitol. 2004, 90, 1111–1122. [Google Scholar] [CrossRef]
  98. Skovgaard, A.; Daugbjerg, N. Identity and systematic position of Paradinium poucheti and other Paradinium-like parasites of marine copepods based on morphology and nuclear-encoded SSU rDNA. Protist 2008, 159, 401–413. [Google Scholar] [CrossRef]
  99. Dumack, K.; Müller, M.E.; Bonkowski, M. Description of Lecythium terrestris sp. nov. (Chlamydophryidae, Cercozoa), a soil dwelling protist feeding on fungi and algae. Protist 2016, 167, 93–105. [Google Scholar] [CrossRef] [PubMed]
  100. Thaler, M.; Lovejoy, C. Distribution and diversity of a protist predator Cryothecomonas (Cercozoa) in Arctic marine waters. J. Eukaryot. Microbiol. 2012, 59, 291–299. [Google Scholar] [CrossRef]
  101. Dolan, J.R.; Gallegos, C.L. Estuarine diversity of tintinnids (planktonic ciliates). J. Plankton Res. 2001, 23, 1009–1027. [Google Scholar] [CrossRef] [Green Version]
  102. Massana, R.; Del Campo, J.; Sieracki, M.E.; Audic, S.; Logares, R. Exploring the uncultured microeukaryote majority in the oceans: Reevaluation of ribogroups within stramenopiles. ISME J. 2014, 8, 854–866. [Google Scholar] [CrossRef] [Green Version]
  103. Cheung, M.K.; Nong, W.; Kwan, H.S.; Wong, C.K. Composition of heterotrophic flagellates in coastal waters of different trophic status. Curr. Microbiol. 2013, 67, 351–355. [Google Scholar] [CrossRef]
  104. Not, F.; Campo, J.; Balagué, V.; De Vargas, C.; Massana, R. New insights into the diversity of marine picoeukaryotes. PLoS ONE 2009, 4, e7143. [Google Scholar] [CrossRef] [Green Version]
  105. Dupont, C.L.; McCrow, J.P.; Valas, R.; Moustafa, A.; Walworth, N.; Goodenough, U.; Roth, R.; Hogle, S.L.; Bai, J.; Johnson, Z.; et al. Genomes and gene expression across light and productivity gradients in eastern subtropical Pacific microbial communities. ISME J. 2015, 9, 1076–1092. [Google Scholar] [CrossRef] [Green Version]
  106. Shi, X.L.; Lepère, C.; Scanlan, D.J.; Vaulot, D. Plastid 16S rRNA Gene Diversity among eukaryotic picophytoplankton sorted by flow cytometry from the South Pacific Ocean. PLoS ONE 2011, 6, e18979. [Google Scholar] [CrossRef]
  107. Treusch, A.H.; Demir-Hilton, E.; Vergin, K.L.; Worden, A.Z.; Carlson, C.; Donatz, M.G.; Burton, R.M.; Giovannoni, S.J. Phytoplankton distribution patterns in the northwestern Sargasso Sea revealed by small subunit rRNA genes from plastids. ISME J. 2011, 6, 481–492. [Google Scholar] [CrossRef] [Green Version]
  108. Cabello, A.M.; Latasa, M.; Forn, I.; Morán, X.A.G.; Massana, R. Vertical distribution of major photosynthetic picoeukaryotic groups in stratified marine waters. Environ. Microbiol. 2016, 18, 1578–1590. [Google Scholar] [CrossRef] [PubMed]
  109. Unrein, F.; Gasol, J.M.; Not, F.; Forn, I.; Massana, R. Mixotrophic haptophytes are key bacterial grazers in oligotrophic coastal waters. ISME J. 2014, 8, 164–176. [Google Scholar] [CrossRef] [Green Version]
  110. Xu, D.; Sun, P.; Zhang, Y.; Li, R.; Huang, B.; Jiao, N.; Warren, A.; Wang, L. Pigmented microbial eukaryotes fuel the deep sea carbon pool in the tropical Western Pacific Ocean. Environ. Microbiol. 2018, 20, 3811–3824. [Google Scholar] [CrossRef] [PubMed] [Green Version]
  111. Richardson, T.L.; Jackson, G.A. Small Phytoplankton and carbon export from the surface ocean. Science 2007, 315, 838–840. [Google Scholar] [CrossRef] [Green Version]
  112. Iversen, M.; Ploug, H. Ballast minerals and the sinking carbon flux in the ocean: Carbon-specific respiration rates and sinking velocity of marine snow aggregates. Biogeosciences 2010, 7, 2613–2624. [Google Scholar] [CrossRef] [Green Version]
  113. Ploug, H.; Iversen, M.H.; Koski, M.; Buitenhuis, E.T. Production, oxygen respiration rates, and sinking velocity of copepod fecal pellets: Direct measurements of ballasting by opal and calcite. Limnol. Oceanogr. 2008, 53, 469–476. [Google Scholar] [CrossRef] [Green Version]
  114. Simon, M.; Grossart, H.; Schweitzer, B.; Ploug, H. Microbial ecology of organic aggregates in aquatic ecosystems. Aquat. Microb. Ecol. 2002, 28, 175–211. [Google Scholar] [CrossRef] [Green Version]
  115. Not, F.; Gausling, R.; Azam, F.; Heidelberg, J.F.; Worden, A.Z. Vertical distribution of picoeukaryotic diversity in the Sargasso Sea. Environ. Microbiol. 2007, 9, 1233–1252. [Google Scholar] [CrossRef]
  116. Zhang, Y.; Jiao, N.; Cottrell, M.T.; Kirchman, D.L. Contribution of major bacterial groups to bacterial biomass production along a salinity gradient in the South China Sea. Aquat. Microb. Ecol. 2006, 43, 233–241. [Google Scholar] [CrossRef] [Green Version]
  117. Xiong, J.; Ye, X.; Wang, K.; Chen, H.; Hu, C.; Zhu, J.; Zhang, D. Biogeography of the sediment bacterial community responds to a nitrogen pollution gradient in the East China Sea. Appl. Environ. Microbiol. 2014, 80, 1919–1925. [Google Scholar] [CrossRef] [PubMed] [Green Version]
  118. Pandit, S.N.; Kolasa, J.; Cottenie, K. Contrasts between habitat generalists and specialists: An empirical extension to the basic metacommunity framework. Ecology 2009, 90, 2253–2262. [Google Scholar] [CrossRef] [PubMed] [Green Version]
  119. Grime, J.P. Benefits of plant diversity to ecosystems: Immediate, filter and founder effects. J. Ecol. 1998, 86, 902–910. [Google Scholar] [CrossRef]
Figure 1. Geographic location of the sampling sites.
Microorganisms 09 00351 g001
Figure 2. Plots of the nonmetric multidimensional scaling (nMDS) (A) ordination and principal coordinate analysis (PCoA); (B) based on Bray–Curtis dissimilarities of the protistan communities. Surface, surface waters; CS, coastal subsurface waters; DCM, deep chlorophyll maxima depth; Deep, deep waters.
Microorganisms 09 00351 g002
Figure 3. Overview of the relative sequence abundance (A) and OTU richness (B) of protistan assemblages in Group Surface (surface waters), Group CS (coastal subsurface waters), Group DCM (deep chlorophyll maximum), and Group Deep (deep waters), respectively.
Microorganisms 09 00351 g003
Figure 4. (A) Linear discriminant analysis Effect Size (LEfSe) analysis on selected OTUs among the four identified groups, Group Surface (surface waters), Group CS (coastal subsurface waters), Group DCM (deep chlorophyll maximum depth), and Group Deep (deep waters). Only lineages with Least Discriminant Analysis (LDA) values >3.5 are displayed. The multiclass analysis strategy is less strict (one-against-all). Group differences are represented by the color of the most abundant lineages (red: Surface; purple: CS; green: DCM; blue: Deep; and yellow: nonsignificant). (B) Cladogram indicating the phylogenetic distribution of the protistan lineages associated with the four groups. Circles indicate phylogenetic levels (from domain to class) in reverse order. The diameter of each circle is proportional to the abundance of the given protistan taxon.
Microorganisms 09 00351 g004
Figure 5. Taxonomic identities of the top 24 OTUs that contributed most to community dissimilarities among the four groups with their relative contributions to each group.
Microorganisms 09 00351 g005
Figure 6. Heatmap showing changes of the relative sequence abundance of the 12 abundant OTUs.
Microorganisms 09 00351 g006
Figure 7. Spearman’s correlations between relative sequence abundance of major protistan groups and environmental parameters. The correlation coefficients’ values are indicated according to the color bar and insignificant values (p > 0.05) are left blank.
Microorganisms 09 00351 g007
Figure 8. Partition of the community assembly process of the active protistan communities.
Microorganisms 09 00351 g008
Table 1. ANOSIM tests of the groupings of protistan assemblages. Community turnover was based on the Bray–Curtis distance. Surface, surface waters; CS, coastal subsurface waters; DCM, deep chlorophyll maximum depth; Deep, deep waters.
PairsANOSIM
rp
Surface vs. CS0.9000.003
Surface vs. DCM0.9960.001
Surface vs. Deep0.9970.001
CS vs. DCM0.7610.006
CS vs. Deep0.6790.012
DCM vs. Deep0.5340.001
Table 2. Spearman’s correlation coefficients between alpha diversity estimates and environmental variables. When the correlation is significant both r- and p-values are underlined (p < 0.05) or in bold (p < 0.01).
Environmental VariablesOTU RichnessShannon
rprp
Latitude−0.4540.017−0.5650.002
Longitude0.4540.0170.5650.002
Depth0.4830.0110.5540.003
Temperature−0.3280.094−0.4050.036
Salinity0.4790.0110.4820.011
NO3-0.1300.5860.0090.97
NO2-−0.1000.722−0.1750.534
PO43-0.4380.090.0370.892
SiO44-0.2260.3250.1030.656
Chl a−0.1530.507–0.2150.349
Prochlorococcus, abundance−0.1700.461–0.0230.922
Synechococcus, abundance−0.4820.027–0.2920.200
PPEs, abundance–0.0270.907–0.2070.368
Heterotrophic prokaryotes, abundance−0.4160.039−0.5610.004
Abundance of VLPs–0.1670.470−0.5000.021
Table 3. Simple and partial Mantel tests for the correlations between environmental factors and protistan community composition. When the correlation is significant both r- and p-values are underlined (p < 0.05) or in bold (p < 0.01). (CF: Control for; Geo_distance, geographic distance; HP: Heterotrophic prokaryotes; PPEs, pigmented pico-sized eukaryotes; VLPs, viral like particles)
Environmental VariablesSimple MantelPartial Mantel
TotalAbundantRareCFTotalAbundantRareCFTotalAbundantRare
rprprprprprprprprp
Salinity0.3870.0010.4260.0010.1440.005T0.3190.0010.3480.0010.059 0.130 D0.3350.0010.3680.0010.077 0.073
Depth0.2760.0010.3260.0010.2540.001S0.1870.0080.2360.0010.2240.001T0.081 0.077 0.110 0.026 0.108 0.017
Temperature0.2660.0010.3100.0010.2310.001S0.134 0.046 0.1710.0100.1910.002D0.244 0.244 0.029 0.287 −0.006 0.528
Geo_distance0.090 0.097 0.047 0.200 0.039 0.237 S0.065 0.153 0.015 0.334 0.028 0.282 D0.102 0.047 0.059 0.163 0.048 0.176
Latitude0.092 0.081 0.047 0.210 0.039 0.237 S0.067 0.137 0.015 0.399 0.028 0.323 D0.105 0.042 0.061 0.163 0.048 0.168
Longitude0.095 0.060 0.053 0.181 0.038 0.222 S0.072 0.117 0.023 0.308 0.028 0.287 D0.106 0.051 0.064 0.121 0.046 0.184
NO3-0.005 0.455 0.003 0.413 −0.002 0.472 S−0.221 0.993 −0.245 0.995 −0.113 0.929 D−0.197 0.989 −0.225 0.997 −0.122 0.968
NO2-0.159 0.124 0.085 0.248 −0.001 0.465 S0.044 0.356 −0.046 0.578 −0.059 0.718 D0.153 0.156 0.063 0.315 −0.019 0.552
PO43-0.184 0.084 0.211 0.065 0.153 0.049 S0.079 0.250 0.108 0.191 0.132 0.085 D−0.171 0.943 −0.144 0.906 0.040 0.302
SO44-0.050 0.304 0.043 0.304 0.008 0.426 S−0.131 0.909 −0.157 0.964 −0.061 0.798 D−0.217 0.992 −0.258 1.000 −0.130 0.981
Chl a0.185 0.030 0.180 0.034 0.044 0.246 S0.110 0.097 0.101 0.112 0.025 0.364 D0.091 0.144 0.081 0.169 −0.012 0.566
Prochlorococcus, abundance−0.0520.736−0.0590.7700.0210.368S−0.1110.940−0.1210.9830.0020.478D0.0080.4150.0010.4320.0520.242
Synechococcus, abundance0.0600.2270.0540.239−0.0390.736S−0.0700.804−0.0800.836−0.0900.917D0.0930.1370.0890.145−0.0410.726
PPEs, abundance0.1560.0470.1400.0570.0030.444S0.0630.1850.0430.259−0.0350.708D0.1460.0430.1260.067−0.0260.639
HP, abundance0.1600.0170.1400.0300.0040.464S0.0280.297−0.0090.525−0.0570.830D0.0970.0700.0660.136−0.0550.838
VLPs, abundance0.0590.2040.0700.166−0.0070.520S0.0360.2870.0470.229−0.0200.600D−0.0360.676−0.0320.648−0.0800.887
Table 4. Simple and partial Mantel tests for the correlations between environmental variables and community composition in the surface water. When the correlation is significant both r- and p-values are underlined (p < 0.05) or in bold (p < 0.01). (Geo_distance, geographic distance; HP: Heterotrophic prokaryotes; PPEs, pigmented pico-sized eukaryotes; VLPs, viral like particles).
Environmental VariablesSimple MantelPartial Mantel
TotalAbundantRareControl forTotalAbundantRare
rprprprprprp
Geo_distance0.4610.0050.5030.0040.2090.079
Latitude0.4580.0080.4990.0020.2010.093Geo_distance−0.0170.552−0.0350.610−0.0920.72
Longitude0.4230.0120.4610.0080.1820.108Geo_distance−0.2100.909−0.2410.959−0.1460.821
Salinity−0.0240.5180.0930.3600.1630.075Geo_distance−0.2240.814−0.1030.6340.0980.158
Temperature0.2820.1510.4040.0600.1840.052Geo_distance0.1540.2910.2910.1390.1240.116
NO3-0.2530.1820.3710.0810.0570.305Geo_distance0.1030.3190.2340.1750.0000.505
NO2-0.2120.3010.4060.1370.1270.236Geo_distance0.1660.3230.3600.1870.1040.300
PO43-0.4670.0660.5930.027−0.0330.651Geo_distance0.4290.1050.5750.032−0.0960.836
SiO44-0.4830.0360.4960.017−0.0210.592Geo_distance0.4410.0520.4580.035−0.0690.743
Chl a0.1950.2300.3210.1150.1370.183Geo_distance−0.0020.4730.1550.2550.0600.349
Prochlorococcus, abundance0.1220.2030.0690.3230.1400.190Geo_distance0.0950.2340.0310.3880.1260.191
Synechococcus, abundance−0.0520.5480.0970.3140.0400.338Geo_distance−0.1410.6880.0220.4290.0080.458
PPEs, abundance0.310.1290.4490.046−0.0740.782Geo_distance0.2090.2330.3680.089−0.1430.931
HP, abundance0.1070.2940.1920.2200.0160.439Geo_distance0.0780.3290.1760.225−0.0010.506
VLPs, abundance−0.1670.778−0.0970.621−0.0170.515Geo_distance−0.1660.735−0.0880.604−0.0040.517
Publisher’s Note: MDPI stays neutral with regard to jurisdictional claims in published maps and institutional affiliations.

