Article

Biochemical Characterization of Recombinant Isocitrate Dehydrogenase and Its Putative Role in the Physiology of an Acidophilic Micrarchaeon

1
Department of Applied Biology, Institute for Applied Biosciences, Karlsruhe Institute of Technology (KIT), Fritz-Haber-Weg 2, 76131 Karlsruhe, Germany
2
Institute for Biological Interfaces, Karlsruhe Institute of Technology (KIT), Hermann-von-Helmholtz-Platz 1, 76344 Eggenstein-Leopoldshafen, Germany
3
Institute of Technical Microbiology, Department of Process and Chemical Engineering, Technical University of Hamburg, Kasernenstr. 12, 21073 Hamburg, Germany
*
Author to whom correspondence should be addressed.
Microorganisms 2021, 9(11), 2318; https://doi.org/10.3390/microorganisms9112318
Submission received: 6 September 2021 / Revised: 20 October 2021 / Accepted: 4 November 2021 / Published: 9 November 2021

Abstract

:
Despite several discoveries in recent years, the physiology of acidophilic Micrarchaeota, such as “Candidatus Micrarchaeum harzensis A_DKE”, remains largely enigmatic, as they highly express numerous genes encoding hypothetical proteins. Due to a lacking genetic system, it is difficult to elucidate the biological function of the corresponding proteins and heterologous expression is required. In order to prove the viability of this approach, A_DKE’s isocitrate dehydrogenase (MhIDH) was recombinantly produced in Escherichia coli and purified to electrophoretic homogeneity for biochemical characterization. MhIDH showed optimal activity around pH 8 and appeared to be specific for NADP+ yet promiscuous regarding divalent cations as cofactors. Kinetic studies showed KM-values of 53.03 ± 5.63 µM and 1.94 ± 0.12 mM and kcat-values of 38.48 ± 1.62 and 43.99 ± 1.46 s−1 resulting in kcat/KM-values of 725 ± 107.62 and 22.69 ± 2.15 mM−1 s−1 for DL-isocitrate and NADP+, respectively. MhIDH’s exceptionally low affinity for NADP+, potentially limiting its reaction rate, can likely be attributed to the presence of a proline residue in the NADP+ binding pocket, which might cause a decrease in hydrogen bonding of the cofactor and a distortion of local secondary structure.

1. Introduction

Microorganisms can survive and thrive under extreme environmental conditions [1,2,3]. Bacteria and Archaea in particular are often adapted to niches of extreme temperature, pressure, radiation, salinity, or pH, which allows them to populate a vast variety of habitats inaccessible to non-extremophiles [1,4]. Still, to cope with these conditions, a significant amount of metabolic resources is required, in order to adjust the intracellular reaction conditions. Acidophiles, for example, are thriving in environments with pH values below pH 3 [5,6], yet maintain a near-neutral internal pH by applying numerous synergistic mechanisms of proton homoeostasis [5,7,8].
Although neutralophilic forms have been identified, recently [9], Micrarchaeota were originally discovered in habitats with pH values between 0.5 and 4.0 [10]. Interestingly, most known acidophilic members of this phylum, which comprise the Micrarchaeaceae family [9], possess small-sized, circular genomes with an overall limited metabolic potential [9,10,11,12,13]. Thus, Micrarchaeaceae are assumed to be dependent on a symbiotic relationship with host organisms of the order Thermoplasmatales [11,12,13,14,15].
To our best knowledge, the only acidophilic Micrarchaeon currently cultivated under laboratory conditions is “Candidatus Micrarchaeum harzensis A_DKE” in co-culture with its putative host “Ca. Scheffleriplasma hospitalis B_DKE” [13]. The culture was enriched from acid mine drainage biofilms originating from the abandoned pyrite mine “Drei Kronen und Ehrt” in the Harz Mountains (Germany) [14,16]. Although an extensive multiomic approach, comprising genomics, transcriptomics, proteomics, lipidomics, and metabolomics, has been conducted on A_DKE [13,17], details of its metabolism, other than a seemingly strong dependence on the tricarboxylic acid cycle [13], still remain enigmatic. Approximately a third of the genes in the A_DKE genome encode hypothetical proteins, most of which are also actively expressed, according to transcriptomic data [13]. Of note, these hypothetical protein-encoding genes comprise 35% and 60% of A_DKE’s 100 and 10 highest expressed genes, respectively [unpublished data]. Considering A_DKE’s reduced genome and so far largely enigmatic metabolism [13,14], these proteins of unknown function might be crucial for understanding A_DKE’s physiology. Yet, due to low sequence conservation, in silico characterization of these proteins is currently not possible and thus biochemical characterization remains the key to fully understand A_DKE’s physiology. However, investigating the function of these proteins by means of heterologous expression proves to be difficult, since there is no information on the intracellular conditions in Micrarchaeota. Thus, a suitable production platform must be chosen mimicking the intracellular conditions of A_DKE as best as possible to facilitate proper folding of the proteins of interest.
The goal of this study was to investigate the viability of biochemical characterization of A_DKE proteins via recombinant expression in E. coli. As a target protein, its isocitrate dehydrogenase (IDH) was chosen, which is a key enzyme of the tricarboxylic acid cycle catalyzing the oxidative decarboxylation of isocitrate to α-ketoglutarate and CO2 [18]. Here, we present the first description of a functional A_DKE enzyme. The characterization revealed an IDH with a slightly alkaline pH optimum and an exceptionally low cofactor affinity. Bioinformatic analysis suggested that the reason for the latter is an alteration in the architecture of the NADP+ binding pocket compared to IDH model enzymes.

2. Materials and Methods

2.1. Database Research and Bioinformatic Sequence and Structure Analyses

Genomic (accession number: CP060530) and transcriptomic data (accession numbers: SRX8933312-SRX8933315) of A_DKE were accessed via the National Center for Biotechnology Information NCBI [19] (bio project number: PRJNA639692). The pH optima and kinetic parameters of homologous enzymes for comparison with experimentally identified parameters for MhIDH were obtained from the BRENDA database ([20], www.brenda-enzymes.org) (accessed on 6 November 2021).
The theoretical molecular weight and isoelectric point of MhIDH were calculated using the CLC Main Workbench 20.0.1 (QIAGEN, Aarhus, Denmark). Conserved sequence motifs and protein domains were detected using the Pfam database ([21], http://pfam.xfam.org/) (accessed on 6 November 2021).
MhIDH homologues were identified via BLASTp [22] search of the UniprotKB/swiss-prot database [19] via NCBI. A multiple sequence alignment comparing MhIDH with experimentally verified homologues from Escherichia coli K-12 (EcIDH, NCBI: P08200.1), Aeropyrum pernix K1 (ApIDH, NCBI: GBF08417.1), Archaeoglobus fulgidus DSM 4304 (AfIDH, NCBI: O29610.1), Haloferax volcanii DS2 (HvIDH, NCBI: D4GU92.1), and Sulfolobus tokodaii strain 7 (StIDH, NCBI: BAB67271.1) was carried out using the Clustal Omega algorithm [23,24,25] as a plugin for the CLC Main Workbench 20.0.1. The alignment was visualized using the ESPript 3.0 server ([26], www.espript.ibcp.fr) (accessed on 6 November 2021).
Homology modeling of a putative MhIDH structure was achieved via the CLC Main Workbench 20.0.1 using the crystal structure of EcIDH in complex with Ca2+, isocitric acid and NADP+ ([27], PDB: 4AJ3, 49.5% homology, 1.9 Å resolution) as a template. Assessment of local model quality and B-factor, as well as docking of the cofactors Mn2+, NADP+, and the substrate isocitrate to the MhIDH model structure was performed using the ResQ server [28] and the COACH server [29,30], respectively. Protein ligand interactions were analyzed using the PLIP server ([31], www.plip-tool.biotec.tu-dresden.de) (accessed on 7 November 2021)). All protein structures were visualized using PyMOL 2.3.3 (Schrödinger, New York, NY, USA).

2.2. Cloning and Recombinant Expression of icd26x His

The icd2 gene was PCR-amplified from genomic DNA isolated from a co-culture containing “Ca. Micrarchaeum harzensis A_DKE” and “Ca. Scheffleriplasma hospitalis B_DKE” [13] via oligonucleotide primers 1 and 2 (see Table 1). The latter introduced a 6x His-tag encoding sequence to the 5′-end, as well as complementary overlaps to the target vector pBAD202 (Invitrogen, Carlsbad, CA, USA). pBAD202 was linearized via inverse PCR using primers 3 and 4 (see Table 1). Both PCR products were gel-purified using the Wizard® SV Gel and PCR Clean-Up System (Promega, Mannheim, Germany) and assembled via isothermal in vitro ligation [32]. The resulting plasmid pBAD202_icd26x His was transformed into E. coli Rosetta pRARE (Merck, Darmstadt, Germany).
In order to monitor production of MhIDH6x His over time, E. coli Rosetta pRARE pBAD202_ icd26x His was cultivated in shaking flasks containing 50 mL of Terrific Broth medium (1.2% (w/v) tryptone, 2.4% (w/v) yeast extract, 0.5% (w/v) glycerol, 17 mM of KH2PO4, 72 mM of K2HPO4) supplemented with 50 µg mL−1 of kanamycin and 30 µg mL−1 of chloramphenicol at 37 °C and 180 rpm. Upon reaching an OD600 of 0.6–0.8, expression of icd26x His was induced by addition of 1 mM of L-(+)-arabinose. From this point forth, the culture was incubated at 30 °C and 180 rpm and samples (1 mL) were taken at different time points after induction (0, 1, 2, 4, 6, and 24 h), and subjected to OD600-measurement using a GENESYSTM 20 spectrophotometer (Thermo Fisher Scientific, Schwerte, Germany) and preparation for SDS-PAGE analysis. Samples were centrifuged for 2 min at 16,000× g and cell pellets were resuspended in 75 µL of 2× SDS loading dye (240 mM of TRIS/HCl (pH 6.8), 20% (v/v) glycerol, 2% (w/v) SDS, 100 mM of DTT, 0.02% (w/v) Orange G) per OD600 of 0.2, boiled for 10 min at 95 °C and centrifuged for 5 min at 16,000× g. After determination of the optimal induction time, over-expression was carried out in a total volume of 1 L as described above. Cells were harvested for 15 min at 16,000× g and 4 °C, 4 h after induction, and stored at −20 °C until used.

2.3. Isolation and Affinity Purification of MhIDH6x His

The cell pellet of an expression culture was resuspended in IMAC buffer (50 mM of HEPES/NaOH (pH 7.4), 500 mM of NaCl) followed by the addition of a spatula tip of Deoxyribonuclease I (SERVA Electrophoresis, Heidelberg, Germany). Cell extracts were prepared using mechanical disruption in an FA-078 FRENCH® Pressure Cell Press (SLM Aminco, Urbana, IL, USA) at 137.8 MPa.
The raw lysate was fractioned by successive steps of centrifugation. Intact cells and cell debris were pelleted for 15 min at 6000× g and 4 °C. Membranes were separated from the plasma fraction via ultracentrifugation for 60 min at 138,000× g and 4 °C. The membrane pellet was resuspended in solubilization buffer (20 mM HEPES/NaOH (pH 8.0), 150 mM of NaCl, 2% (v/v) Triton X-100) and the plasma fraction was passed through a 0.2-µm syringe filter (Sarstedt, Nümbrecht, Germany) to remove remaining insoluble particles. Samples of the raw lysate, as well as the membrane and plasma fraction were used for SDS-PAGE.
Nickel immobilized metal ion affinity chromatography (Ni2+-IMAC) for protein purification was conducted using a HisTrap® HP 5-mL column (GE Healthcare, Munich, Germany) coupled with a BioLogic DuoFlow™ Chromatography System (Bio-Rad, Munich, Germany). The column was equilibrated with IMAC buffer, prior to loading with plasma fraction. Non-specifically bound proteins were removed by washing with IMAC buffer containing 80 mM of imidazole. Elution of the target protein was achieved with IMAC buffer containing 500 mM of imidazole. The eluted fraction was concentrated using a 3-kDa MWCO centrifugal filter (Merck, Darmstadt, Germany). Samples of the column flow-through, wash, and eluate were used for SDS-PAGE.
Size exclusion chromatography (SEC) of the concentrated protein solution was conducted using a HiLoadTM 26/600 SuperdexTM 200 pg column (GE Healthcare, Munich, Germany) coupled to the aforementioned chromatography system. The column was equilibrated and run isocratically with IDH buffer (50 mM of HEPES/NaOH (pH 7.4), 150 mM of NaCl, 1 mM of DTT, 0.5 mM of MgCl2). The eluted fractions were collected, concentrated, and analyzed via SDS-PAGE. For long-term storage at −20 °C, 50% (v/v) glycerol was added.

2.4. Protein Quantification, SDS-PAGE & Western Blot

Protein quantification of samples collected for analysis via SDS-PAGE was carried out colorimetrically according to [33]. Alternatively, purified protein was quantified spectrophotometrically using a NanoDrop 2000 (Thermo Fisher Scientific, Schwerte, Germany).
Samples containing 20 µg of total protein (5 µg in case of purified protein) were mixed with 2× SDS loading dye and separated via denaturing SDS-PAGE in hand cast 12% TRIS/Glycine gels according to [34]. As reference, either BlueStarTM Prestained Protein Marker (NIPPON Genetics, Düren, Germany) or PageRulerTM Prestained Protein Ladder (Thermo Fisher Scientific, Schwerte, Germany) was used. After separation, the gels were subjected to either colloidal staining using Quick Coomassie Stain (Protein Ark, Sheffield, UK) or transfer of the separated proteins to a nitrocellulose membrane (Roth, Karlsruhe, Germany) via a semi-dry blot. The latter was carried out with a Trans-Blot® Turbo™ device (Bio-Rad, Munich, Germany) at 1.3 A for 10 min using a continuous blotting buffer system (330 mM of TRIS, 267 mM of glycine, 15% (v/v) ethanol, 5% (v/v) methanol, pH 8.8).
Densitometric estimation of protein purity from Coomassie-stained acrylamide gels was carried out using the Image Studio Lite 5.2 software (LI-COR, Lincoln, NE, USA).
For immuno-staining the membrane was blocked for at least 1 h at room temperature with TBST (20 mM of TRIS/HCl (pH 7.5), 500 mM of NaCl, 0.05% (v/v) Tween® 20) containing 3% (w/v) skim milk powder. After a few brief rinses with TBST, the blot was incubated with a mouse anti-His-tag primary antibody (Sigma–Aldrich, Steinheim, Germany), diluted 1:1000 in TBS (10 mM TRIS/HCl (pH 7.5), 150 mM NaCl) containing 3% (w/v) BSA for 1 h, followed by washing with TBST (4 × 5 min) and incubation with a goat anti-mouse alkaline phosphatase secondary antibody (Sigma–Aldrich, Steinheim, Germany) diluted 1:30,000 in TBST containing 3% (w/v) skim milk powder for 45 min. After washing with TBST (4 × 5 min) and several brief rinses with dH2O, protein bands were visualized colori-metrically using the AP conjugate substrate kit (Bio-Rad, Munich, Germany) in accordance with the manufacturer’s instructions.

2.5. Spectrophotometric IDH-Activity Assays and Determination of Kinetic Properties

MhIDH6x His activity and kinetic properties were determined at least in triplicates at 28 °C by monitoring the formation of NADH or NADPH spectrophotometrically at 340 nm using an NADH or NADPH standard curve for quantification. The standard reaction mixture contained 100 mM of TRIS/HCl (pH 8.0), 1 mM of DL-Na3-isocitrate, 5 mM of MgCl2, 2 mM of Na2NADP and 0.6–2.5 µg of enzyme in a total volume of 200 µL. Each reaction was started individually by addition of either NADP+ or enzyme using a TeInjectTM Dispenser (Tecan, Männedorf, Switzerland) followed by measurement of A340 each 200 ms for 15–30 s using an Infinite® M 200 PRO plate reader (Tecan, Männedorf, Switzerland). Investigation of cofactor-specificity was conducted by measuring specific activity with 20 mM of NADP+ or NAD+ in the presence of Mg2+ and cation-dependency was determined by measuring specific activity in presence of 5 mM of MgCl2, MnCl2, CaCl2, ZnCl2, NiCl2, CuCl2, CoCl2, and Na2EDTA, respectively, with 2 mM of NADP+.
The pH optimum was determined by measuring specific activity in buffers with varying pH values. A corresponding polynomial fitting curve of fifth order was calculated using Origin Pro 2020. In order to span a range from pH 5 to 9.0, three different buffer systems were applied as described in [35]: 0.1 M of CH3CO2Na/CH3CO2H (pH 5.0–6.0), 0.1 M of Na2HPO4/NaH2PO4 (pH 5.5–7.5), and 0.1 M of TRIS/HCl (pH 7.0–9.0).
Enzyme kinetics were determined by measuring the initial reaction rate at increasing concentrations of NADP+ (0–10 mM) and DL-isocitrate (0–500 µM), respectively. KM and Vmax were calculated from a non-linear fit based on the Michaelis–Menten model [36,37] using Origin Pro 2020.

3. Results & Discussion

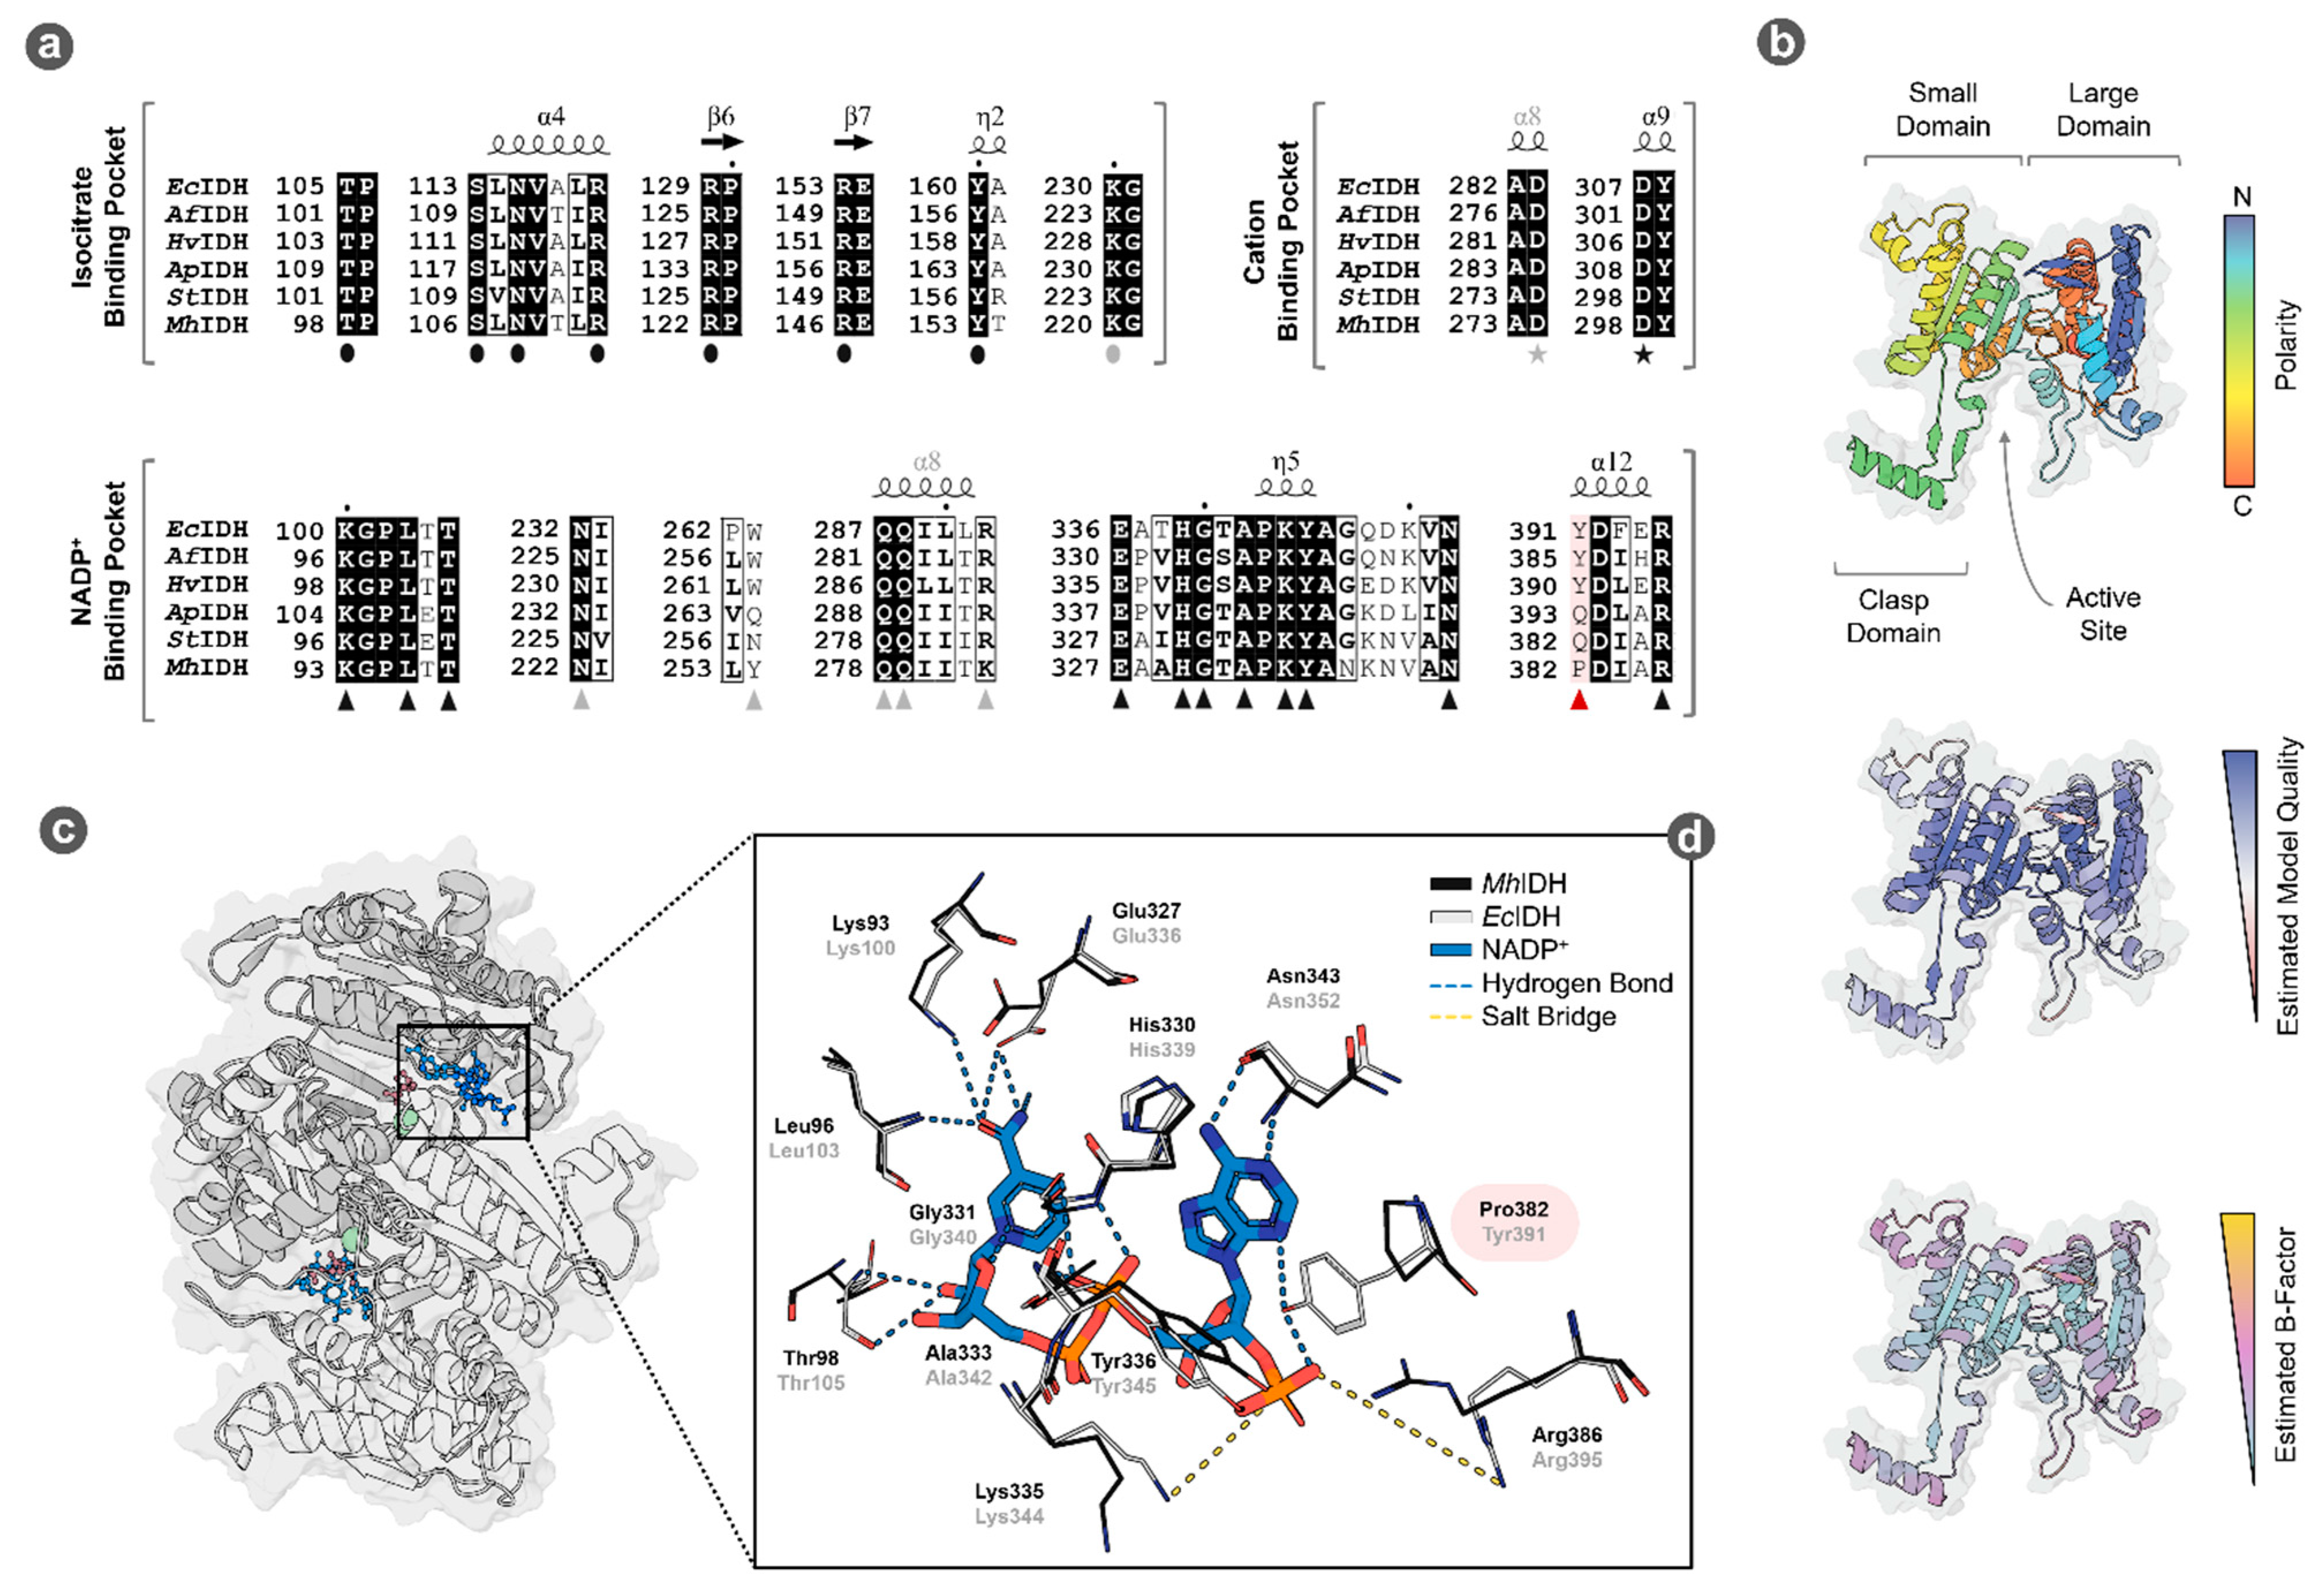
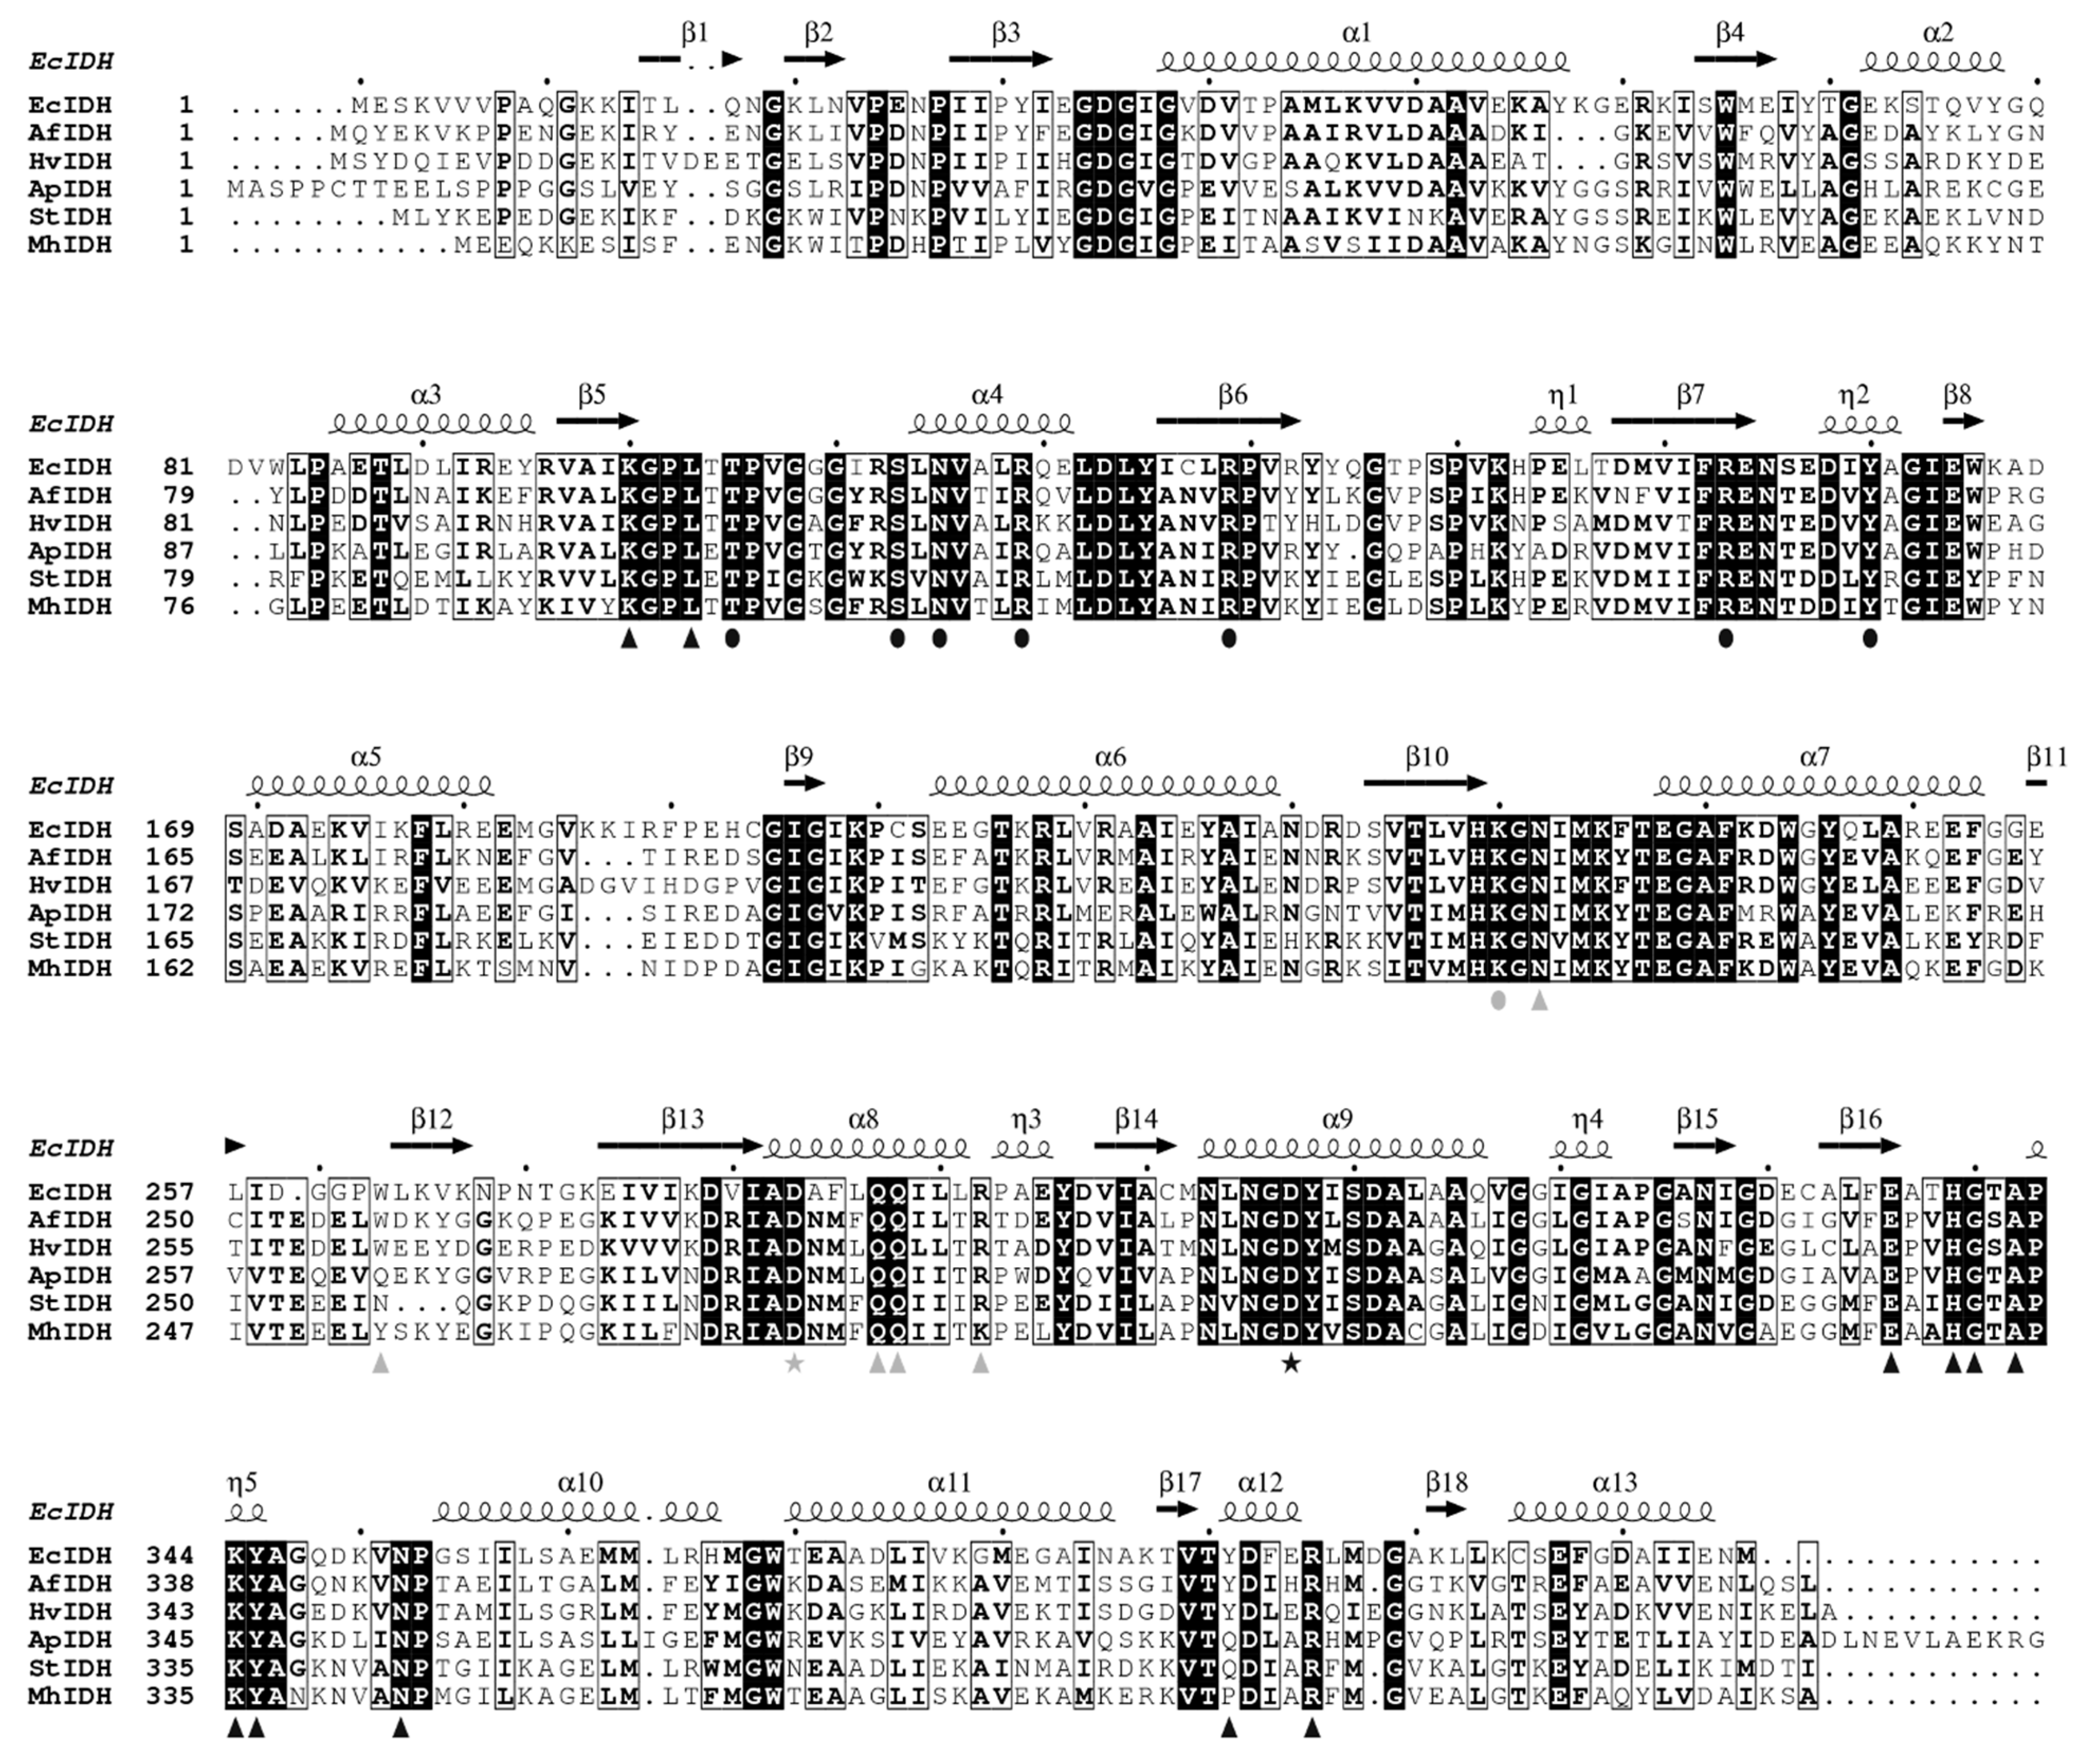
3.1. MhIDH Shows Conserved Characteristics of Prokaryotic, NADP-Dependent IDHs

A_DKE possesses only one gene (icd2, Micr_00902) annotated to be encoding a putative NADP-dependent IDH, which is actively expressed, according to available transcriptomic data [13]. In silico analyses of its amino acid sequence allowed the calculation of a theoretical molecular weight and isoelectric point (pI) of 45.05 kDa and 5.82, respectively, as well as the discovery of a highly conserved isocitrate/isopropylmalate dehydrogenase domain (Pfam: PF00180.20), almost spanning the entire length of the sequence (Thr23-Leu402). Furthermore, a BLASTp search of the UniprotKB/swiss-prot database revealed high sequence homology to several experimentally proven homodimeric, NADP-dependent IDHs with nearly all amino acids reported to be involved in substrate and cofactor binding being conserved (see Appendix A, Figure A1 and Table A1).

3.2. MhIDH6x His Can Be Produced in E. coli

Since direct purification of native MhIDH from “Ca. Micrarchaeum harzensis A_DKE” is not feasible due to slow growth and overall low cell density of A_DKE cultures, the corresponding gene was cloned and over-expressed in E. coli. Test-expression over time showed high expression levels with a maximum at 4 h after induction and a decrease in product concentration 24 h after induction (see Figure 1a). The protein has an apparent molecular weight of roughly 50 kDa, matching the theoretical molecular weight. It was found to be located in the cytoplasmic fraction and could not be detected in the membrane fraction (see Figure 1b). Affinity purification of MhIDH6x His from the plasma fraction was successful in a single step, providing roughly 90% of electrophoretic homogeneity (see Figure 1c). SEC was used for further purification to apparent electrophoretic homogeneity.

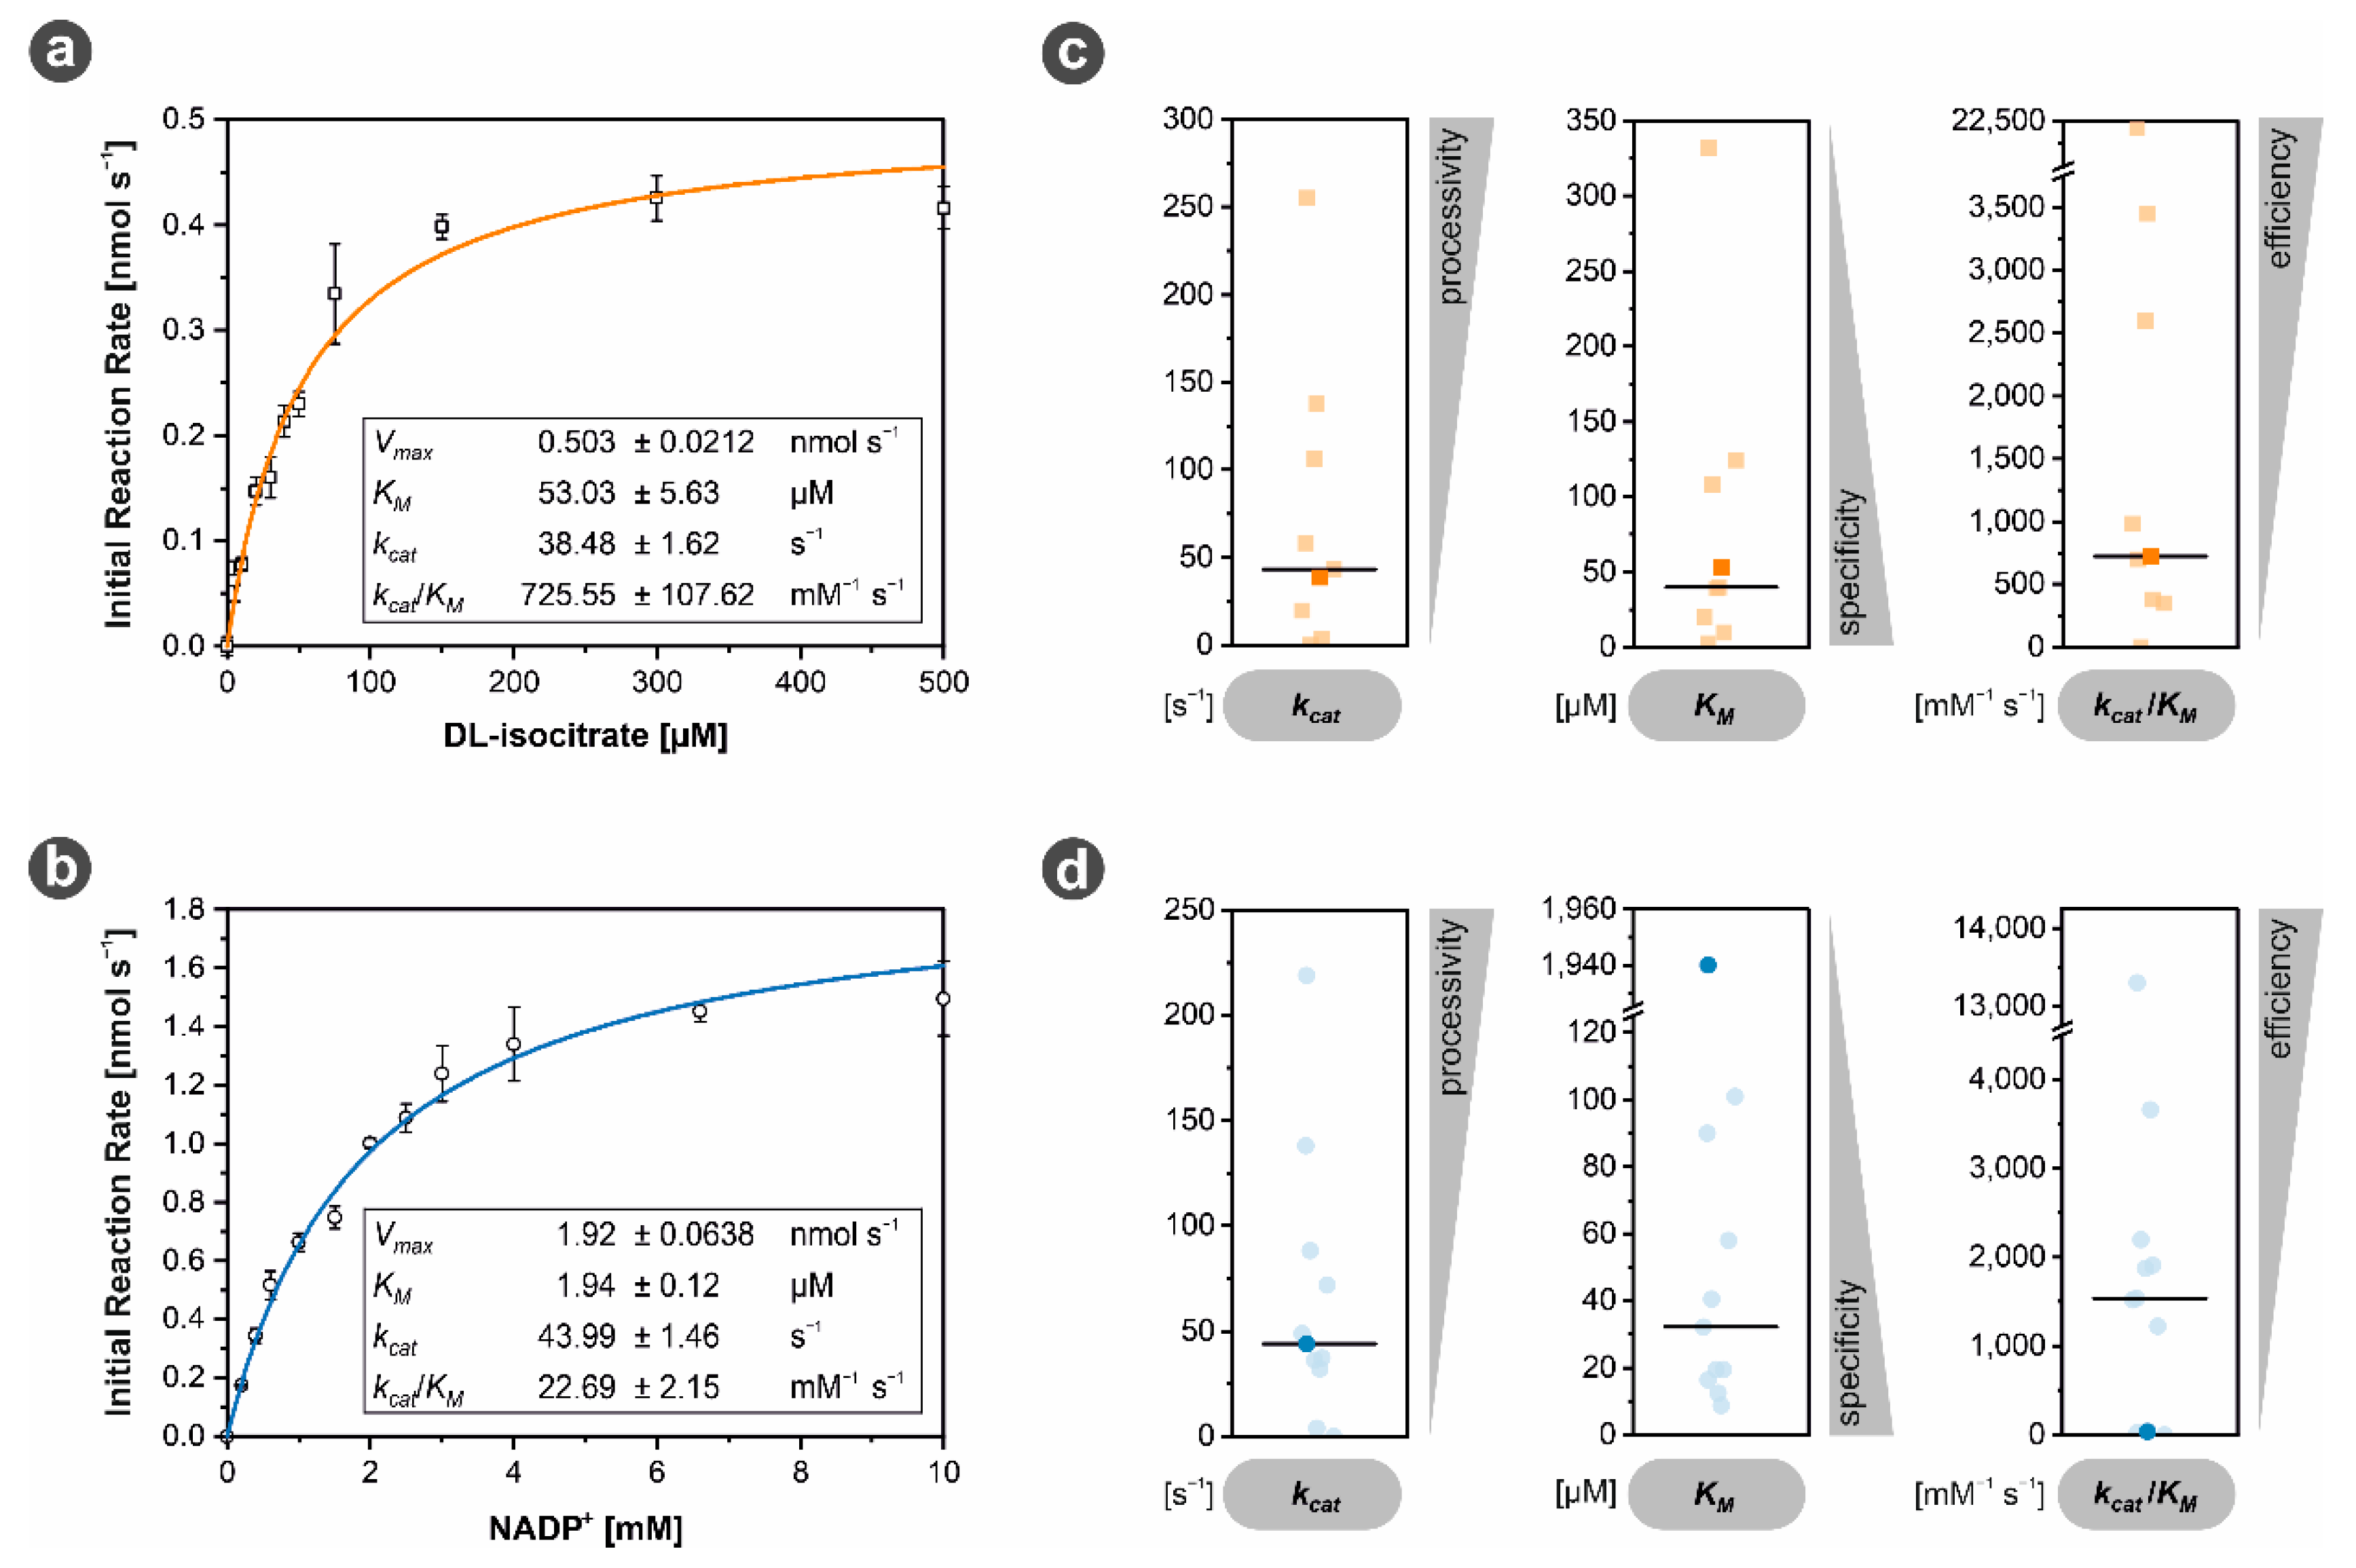
3.3. Biochemical Properties of MhIDH6x His

3.3.1. MhIDH6x His Activity Is Dependent on NADP+ and Divalent Cations

IDHs catalyze the oxidative decarboxylation of isocitrate to α-ketoglutarate and CO2. The electrons released in this process are transferred to either NAD+ (EC 1.1.1.41) or NADP+ (EC 1.1.1.42) [18,38]. Type I IDHs found in bacteria and archaea predominantly use NADP+ [38,39]. Still, promiscuous forms accepting both cofactors have been reported as well [40,41,42]. Furthermore, IDHs are known to be dependent on divalent metal cations, such as Mg2+ and Mn2+ [43]. In order to characterize enzyme activity of recombinant MhIDH, its dependency on different cofactors was tested.
With 41.09 ± 1.02 µmol min−1 mg−1 MhIDH6x His activity was about 55-fold higher using NADP+ as cofactor relative to NAD+ with only 0.74 ± 0.09 µmol min−1 mg−1 (see Figure 2a). The apparent NADP+ specificity of the enzyme was also supported by structural information. The primary structure of MhIDH contains conserved amino acid residues (Lys335, Tyr336, and Arg386) in the active site (see Appendix A, Figure A1), which have been shown in EcIDH [44,45], StIDH [46], and ApIDH [47] to specifically stabilize the 2‘-phosphate moiety of NADP+ ensuring that NADP+ is bound preferably. As expected, divalent cations appear to be vital for MhIDH6x His function, as the enzyme does not show any activity in presence of EDTA (see Figure 2b). Still, with several different metal ions having an activating effect, MhIDH is rather promiscuous in this regard. While Mn2+ and Mg2+ induced maximal activity increases, only 44.2 ± 4.01%, 43.2 ± 1.99%, and 6.6 ± 0.60% of relative maximal activity can be achieved with Cu2+, Co2+, and Ni2+, respectively. Zn2+ and Ca2+, on the other hand, do not seem to enhance enzyme activity, as in presence of these ions MhIDH6x His is only marginally more active than in presence of EDTA. The variance in activation levels in presence of different cations is seemingly independent of ionic radii, and is hypothesized to be due to individual modes of binding in the active site of the enzyme [48]. Moreover, Zn2+ [49] and Ca2+ [48,50] have been reported to inhibit IDH activity. In the case of Ca2+, this is most likely due to a spatial shift of ligands bound in the active site in order to accommodate the large ionic radius of the cation [50].

3.3.2. MhIDH6x His Shows Highest Activity at Slightly Alkaline pH

With the optimal cofactor combination known, specific activity was measured at different pH values in increments of 0.5. From this data a non-linear fitting curve was calculated with the global maximum of the curve indicating the pH optimum of the enzyme, which was identified to be around pH 8. At least 85% of the maximum specific activity could be retained in a range from pH 7.5 to 8.5 (see Figure 3a). A comparison to other IDHs from acidophilic and neutralophilic organisms, listed in the BRENDA database, reveals this feature to be quite common, as it corresponds to the median value of pH 8 (see Figure 3b).

3.3.3. MhIDH6x His Is Characterized by Low NADP+ Affinity

Kinetic data of MhIDH6x His was obtained for the substrate DL-isocitrate and the cofactor NADP+ (see Figure 4a,b). Overall, kinetic properties of MhIDH6x His regarding DL-isocitrate appear to be quite average compared to other IDHs (see Figure 4c and Appendix A, Table A2), as with KM = 53.03 ± 5.63 µM, kcat = 38.48 ± 1.62 s−1, and kcat/KM = 725 ± 107.62 mM−1 s−1 all parameters lie close to the respective median value.
Regarding NADP+, on the other hand, MhIDH6x His performs significantly worse in comparison to other IDHs (see Figure 4d and Appendix A, Table A2). A KM of 1.94 ± 0.12 mM is exceptionally high compared to other IDHs being the least specific enzyme in the comparison. Despite a decent turnover rate close to the median value (kcat = 43.99 ± 1.46 s−1), MhIDH6x His ranks among the three IDHs with the lowest catalytic efficiency (kcat/KM = 22.69 ± 2.15 mM−1 s−1).
All in all, low affinity to NADP+ could be the bottleneck limiting the overall reaction rate of MhIDH6x His and possibly the metabolic rate of the whole organism, given that IDH is a key enzyme of the tricarboxylic acid cycle, which is the central metabolic pathway in A_DKE [14]. This potential metabolic bottleneck could be bypassed by production of α-ketoglutarate from glutamate via glutamate dehydrogenase, which is expressed relatively highly in A_DKE [14].
While the low cofactor affinity of MhIDH6x His could be an artefact resulting from the His-tag located at its N-terminus, there is strong evidence suggesting that this might be a natural characteristic of the enzyme itself, when considering potential ligand binding mechanics.
To investigate potential ligand binding mechanisms in MhIDH, we conducted a multiple sequence alignment with other experimentally verified IDHs and modeled a putative structure (see Figure 5) using a crystal structure of EcIDH as a template.
The model features high estimated local model quality and shows the characteristic fold of prokaryotic NADP-dependent IDHs, comprising a large and a small domain responsible for cofactor and substrate binding, respectively, as well as a clasp domain allowing homodimerization ([46,47], see Figure 5b). The estimated local B-factor of the model indicates a rigid core, as well as flexible loops surrounding the active site in between the small and large domain (see Figure 5b), which allow conformational change necessary for catalytic activity in EcIDH [27]. Ligands isocitrate, NADP+ and Mn2+, could be docked in the active sites of the homodimeric model, with their relative positions closely resembling those in EcIDH (see Figure 5c).
A comparably average KM value for isocitrate is not surprising, considering that without exception all amino acids known to be involved in isocitrate binding in other IDHs [27,46,47,50] are conserved in the isocitrate binding pocket of MhIDH (see Figure 5a).
Furthermore, low affinity of MhIDH for NADP+ can be explained by structural analysis, as well. The NADP+ binding pocket in EcIDH is formed by the 310-helix η4 (residues 318–324), the NADP+ binding loop (residues 336–352), as well as helix α12 (residues 390–397) [27]. In particular, residues Lys100, Leu103, Thr105, Asn232*, residues 258*-261*, Trp263*, Gln287*, Gln288*, Arg292*, Glu336, His339, Gly340, Ala342, Lys344, Tyr345, Asn352, Tyr391, and Arg395 (* marks amino acids from the second homodimer subunit) are involved in binding NADP+ via hydrogen bonds or salt bridges ([27], see Figure 5a).
Corresponding residues in StIDH [46] and ApIDH [47] have been described to facilitate NADP+ binding, as well (see Figure 5a). Almost all of the corresponding amino acids in MhIDH are conserved or at least display similar physicochemical properties (Tyr254* instead of Trp263* and Lys282* instead of Arg292*), the only exception being Tyr391 (see Figure 5a,d), which is substituted for a proline in MhIDH (Pro382). While this appears to be a common feature among isopropylmalate dehydrogenases rather than IDHs (i.e., in Thermus thermophilus [51]), MhIDH showed significantly higher sequence homology to the latter (see Appendix A, Table A1). Since Tyr391 forms hydrogen bonds stabilizing the 2′-phosphate of NADP+ (see Figure 5a,d) this amino acid plays a critical role in cofactor stabilization and selectivity in EcIDH [44,45,51]. Moreover, it has been reported that a proline at this position disrupts the local α-helix in favor of a β-turn [51,52], which could distance Lys386, another crucial residue ensuring NADP+ specificity, from the 2′-phosphate of NADP+ and thereby decrease cofactor stabilization even more.

4. Conclusions

Although several approaches lead to new findings about Micrarchaeota in the last decade, the survival strategies of these ultra-small, acidophilic organisms are still not fully understood. In this study, we presented the first biochemical description of a recombinant micrarchaeal enzyme. The enzyme was successfully produced in E. coli and biochemically characterized. Compared to other known IDHs, the NADP+ and divalent cation-dependent protein from A_DKE shows optimal activity at near-neutral pH and seems to be highly inefficient because of the architecture of its NADP+ binding pocket. Since MhIDH plays a role in A_DKE’s main pathway for generation of reducing equivalents, its inefficiency is in line with the slow growth rates of the Micrarchaeon and is hypothesized to be partly overcome via glutamate dehydrogenase. Lastly, this study proves the viability of recombinant production of functional A_DKE proteins in E. coli, which opens numerous possibilities for the biochemical characterization of proteins of unknown function in A_DKE.

Author Contributions

Conceptualization, J.G.; methodology, D.W.; validation, D.W. and J.G.; formal analysis, D.W.; investigation, D.W.; resources, J.G.; data curation, D.W. and S.G.; writing—original draft preparation, D.W., S.G. and J.G.; writing—review and editing, D.W., S.G. and J.G.; visualization, D.W.; supervision, J.G.; project administration, J.G.; funding acquisition, J.G. All authors have read and agreed to the published version of the manuscript.

Funding

This research received no external funding.

Institutional Review Board Statement

Not applicable.

Informed Consent Statement

Not applicable.

Data Availability Statement

All data shown are contained within the article.

Conflicts of Interest

The authors declare no conflict of interest.

Appendix A

Figure A1. Multiple sequence alignment of MhIDH with homologous NADP-specific IDHs. MhIDH-homologues from E. coli K-12 (EcIDH, NCBI: P08200.1), Archaeoglobus fulgidus DSM 4304 (AfIDH, NCBI: O29610.1), Haloferax volcanii DS2 (HvIDH, NCBI: D4GU92.1), Aeropyrum pernix K1 (ApIDH, NCBI: GBF08417.1), and Sulfolobus tokodaii Strain 7 (StIDH, NCBI: BAB67271.1) were identified via BLASTp-search and aligned using Clustal Omega. Identical amino acids are highlighted in black, similar amino acids are boxed. Secondary structure elements of EcIDH (above) named according to their type and number of appearance are indicated by arrows (β-strands), as well as large and small squiggles (α- and 310 (η)-helices), respectively. Amino acids involved in isocitrate- (●), NADP+- (▲) and cation-binding (★) in EcIDH [27] are highlighted below by the indicated symbols. The symbols in gray represent amino acids which interact with the ligands in the active site of the other homodimer subunit. Every tenth position in the alignment is highlighted by a black dot.
Microorganisms 09 02318 g0a1
Table A1. Selected results of a BLASTp-search for homologues of MhIDH using the UniprotKB/swiss-prot database as a reference.
NCBI AccessionDescriptione-ValueIdentity [%]
O29610.1Isocitrate dehydrogenase [NADP]; [Archaeoglobus fulgidus DSM 4304]3.54 × 10−15055.47
P96318.2Isocitrate dehydrogenase [NADP]; [Caldococcus noboribetus]9.487 × 10−14754.61
D4GU92.1Isocitrate dehydrogenase [NADP]; [Haloferax volcanii DS2]1.2741 × 10−13448.05
P08200.1Isocitrate dehydrogenase [NADP]; [Escherichia coli K-12]9.9176 × 10−12849.75
P39126.1Isocitrate dehydrogenase [NADP]; [Bacillus subtilis subsp. subtilis str. 168]5.42 × 10−12749.40
Q9ZH99.1Isocitrate dehydrogenase [NADP]; [Coxiella burnetii RSA 493]2.2534 × 10−12649.26
P65099.1Isocitrate dehydrogenase [NADP]; [Staphylococcus aureus subsp. aureus Mu50]5.4508 × 10−12549.14
Q6G8N2.1Isocitrate dehydrogenase [NADP]; [Staphylococcus aureus subsp. aureus MSSA476]6.9239 × 10−12549.14
Q5HNL1.1Isocitrate dehydrogenase [NADP]; [Staphylococcus epidermidis RP62A] 9.4905 × 10−12549.14
Q6GG12.1Isocitrate dehydrogenase [NADP]; [Staphylococcus aureus subsp. aureus MRSA252]1.2055 × 10−12449.63
P56063.1Isocitrate dehydrogenase [NADP]; [Helicobacter pylori 26695]2.7939 × 10−12249.27
Q9ZN36.1Isocitrate dehydrogenase [NADP]; [Helicobacter pylori J99]6.5213 × 10−12248.66
Q02NB5.1Isocitrate dehydrogenase [NADP]; [Pseudomonas aeruginosa UCBPP-PA14]7.6852 × 10−12249.23
Q59940.2Isocitrate dehydrogenase [NADP]; [Streptococcus mutans UA159]3.6802 × 10−12046.02
P41560.2Isocitrate dehydrogenase [NADP] 1; [Colwellia maris]1.0682 × 10−11948.65
Q59985.1Isocitrate dehydrogenase [NADP]; [Streptococcus salivarius]9.7535 × 10−11646.27
P50214.1Isocitrate dehydrogenase [NADP]; [Nostoc sp. PCC 7120 = FACHB-418]1.995 × 10−11342.58
P80046.2Isocitrate dehydrogenase [NADP]; [Synechocystis sp. PCC 6803 substr. Kazusa]3.0758 × 10−10942.45
O67480.1Isocitrate dehydrogenase [NADP]; [Aquifex aeolicus VF5]4.518 × 10−10946.62
Q4UKR1.2Isocitrate dehydrogenase [NADP]; [Rickettsia felis URRWXCal2]3.03035 × 10−5935.88
Q1RJU4.1Isocitrate dehydrogenase [NADP]; [Rickettsia bellii RML369-C]6.19516 × 10−5834.82
Q92IR7.1Isocitrate dehydrogenase [NADP]; [Rickettsia conorii str. Malish 7]4.10157 × 10−5735.09
Q9ZDR0.1Isocitrate dehydrogenase [NADP]; [Rickettsia prowazekii str. Madrid E]5.79905 × 10−5735.45
O27441.13-isopropylmalate dehydrogenase; [Methanothermobacter thermautotrophicus str. Delta H]4.50989 × 10−5130.97
O29627.13-isopropylmalate dehydrogenase; [Archaeoglobus fulgidus DSM 4304]8.66687 × 10−4732.41
P50455.33-isopropylmalate dehydrogenase; [Sulfurisphaera tokodaii str. 7]1.07086 × 10−4630.81
Table A2. Overview on NADP-dependent IDHs with a mostly complete set of catalytic parameters listed in the BRENDA database.
OrganismpH
Optimum
DL-Isocitric AcidNADP+Refs
kcat
[s−1]
KM
[mM]
kcat/KM
[mM−1 s−1]
kcat
[s−1]
KM
[mM]
kcat/KM
[mM−1 s−1]
Archaeoglobus fulgidus8.62550.332700 2190.016513 300 [40,53]
Bifidobacterium longum subsp. infantis8.0NANANA36.40.019451 871 *[49]
Escherichia coli8.0106.40.04052 600 88.10.03922 200 [53]
Haloferax volcanii8.00.00230.1080.021 *0.0030.1010.030 *[18,54,55]
Microcystis aeruginosa7.543.210.1243347.63 *48.880.03221 518 *[56]
Mycobacterium tuberculosis 17.53.80.01380 *40.12532 *[57]
Mycobacterium tuberculosis 27.519.60.02980 *37.40.01961 908 *[57]
Plasmodium falciparum8.01380.043 450 *1380.091 533 *[58]
Saccharolobus solfataricus8.0NANANANANANA[18]
Sus scrofa7.458.30.002622 423 *32.20.00883 659 *[59,60]
Thermoplasma acidophilum7.5NANANANANANA[61]
Yarrowia lipolytica8.5NANANA720.0581 220 [62]
Ca. Micrarchaeum harzensis A_DKE”8.038.48 ± 1.620.0530 ± 0.0056725 ± 107.62 43.99 ± 1.461.94 ± 0.1222.69 ± 2.15 This study
1 IDH isoform 1; 2 IDH isoform 2; * missing value was calculated from the other two given values; NA: not available.

References

  1. Kristjánsson, J.K.; Hreggvidsson, G.O. Ecology and habitats of extremophiles. World J. Microbiol. Biotechnol. 1995, 11, 17–25. [Google Scholar] [CrossRef]
  2. Pikuta, E.V.; Hoover, R.B.; Tang, J. Microbial extremophiles at the limits of life. Crit. Rev. Microbiol. 2007, 33, 183–209. [Google Scholar] [CrossRef] [PubMed]
  3. Horikoshi, K.; Antranikian, G.; Bull, A.T.; Robb, F.T.; Stetter, K.O. Extremophiles Handbook Volume 1. J. Chem. Inf. Model. 1981, 53, 1689–1699. [Google Scholar] [CrossRef]
  4. Charlesworth, J.; Burns, B.P. Extremophilic adaptations and biotechnological applications in diverse environments. AIMS Microbiol. 2016, 2, 251–261. [Google Scholar] [CrossRef]
  5. Baker-Austin, C.; Dopson, M. Life in acid: PH homeostasis in acidophiles. Trends Microbiol. 2007, 15, 165–171. [Google Scholar] [CrossRef] [PubMed]
  6. Golyshina, O.V.; Golyshin, P.N.; Timmis, K.N.; Ferrer, M. The “pH optimum anomaly” of intracellular enzymes of Ferroplasma acidiphilum. Environ. Microbiol. 2006, 8, 416–425. [Google Scholar] [CrossRef] [PubMed]
  7. Slonczewski, J.L.; Fujisawa, M.; Dopson, M.; Krulwich, T.A. Cytoplasmic pH Measurement and Homeostasis in Bacteria and Archaea. Adv. Microb. Physiol. 2009, 55, 1–79, 317. [Google Scholar]
  8. Matin, A. pH Homeostasis in Acidophiles. In Novartis Foundation Symposium 221—Bacterial Responses to pH; John Wiley & Sons, Ltd.: Hoboken, NJ, USA, 2007; pp. 152–166. ISBN 9780470515631. [Google Scholar]
  9. Kadnikov, V.V.; Savvichev, A.S.; Mardanov, A.V.; Beletsky, A.V.; Chupakov, A.V.; Kokryatskaya, N.M.; Pimenov, N.V.; Ravin, N.V. Metabolic Diversity and Evolutionary History of the Archaeal Phylum “ Candidatus Micrarchaeota” Uncovered from a Freshwater Lake Metagenome. Appl. Environ. Microbiol. 2020, 86, 1–13. [Google Scholar] [CrossRef] [PubMed]
  10. Chen, L.X.; Méndez-García, C.; Dombrowski, N.; Servín-Garcidueñas, L.E.; Eloe-Fadrosh, E.A.; Fang, B.Z.; Luo, Z.H.; Tan, S.; Zhi, X.Y.; Hua, Z.S.; et al. Metabolic versatility of small archaea Micrarchaeota and Parvarchaeota. ISME J. 2018, 12, 756–775. [Google Scholar] [CrossRef]
  11. Baker, B.J.; Comolli, L.R.; Dick, G.J.; Hauser, L.J.; Hyatt, D.; Dill, B.D.; Land, M.L.; VerBerkmoes, N.C.; Hettich, R.L.; Banfield, J.F. Enigmatic, ultrasmall, uncultivated Archaea. Proc. Natl. Acad. Sci. USA 2010, 107, 8806–8811. [Google Scholar] [CrossRef] [PubMed] [Green Version]
  12. Golyshina, O.V.; Toshchakov, S.V.; Makarova, K.S.; Gavrilov, S.N.; Korzhenkov, A.A.; La Cono, V.; Arcadi, E.; Nechitaylo, T.Y.; Ferrer, M.; Kublanov, I.V.; et al. ‘ARMAN’ archaea depend on association with euryarchaeal host in culture and in situ. Nat. Commun. 2017, 8, 60. [Google Scholar] [CrossRef] [PubMed]
  13. Krause, S.; Gfrerer, S.; Reuse, C.; Dombrowski, N.; Villanueva, L.; Bunk, B.; Spröer, C.; Neu, T.R.; Kuhlicke, U.; Schmidt-Hohagen, K.; et al. Unraveling the critical growth factors for stable cultivation of (nano-sized) Micrarchaeota. bioRxiv 2021. [Google Scholar] [CrossRef]
  14. Krause, S.; Bremges, A.; Münch, P.C.; McHardy, A.C.; Gescher, J. Characterisation of a stable laboratory co-culture of acidophilic nanoorganisms. Sci. Rep. 2017, 7, 3289. [Google Scholar] [CrossRef] [Green Version]
  15. Golyshina, O.V.; Bargiela, R.; Toshchakov, S.V.; Chernyh, N.A.; Ramayah, S.; Korzhenkov, A.A.; Kublanov, I.V.; Golyshin, P.N. Diversity of “Ca. Micrarchaeota” in Two Distinct Types of Acidic Environments and Their Associations with Thermoplasmatales. Genes 2019, 10, 461. [Google Scholar] [CrossRef] [Green Version]
  16. Ziegler, S.; Dolch, K.; Geiger, K.; Krause, S.; Asskamp, M.; Eusterhues, K.; Kriews, M.; Wilhelms-Dick, D.; Goettlicher, J.; Majzlan, J.; et al. Oxygen-dependent niche formation of a pyrite-dependent acidophilic consortium built by archaea and bacteria. ISME J. 2013, 7, 1725–1737. [Google Scholar] [CrossRef] [PubMed]
  17. Gfrerer, S.; Winkler, D.; Novion Ducassou, J.; Couté, Y.; Rachel, R.; Gescher, J. Micrarchaeota are covered by a proteinaceous S-layer. bioRxiv 2021. [Google Scholar] [CrossRef]
  18. Camacho, M.L.; Brown, R.A.; Bonete, M.J.; Danson, J.M.; Hough, D.W. Isocitrate dehydrogenases from Haloferax volcanii and Sulfolobus solfataricus: Enzyme purification, characterisation and N-terminal sequence. FEMS Microbiol. Lett. 1995, 134, 85–90. [Google Scholar] [CrossRef]
  19. Agarwala, R.; Barrett, T.; Beck, J.; Benson, D.A.; Bollin, C.; Bolton, E.; Bourexis, D.; Brister, J.R.; Bryant, S.H.; Canese, K.; et al. Database resources of the National Center for Biotechnology Information. Nucleic Acids Res. 2018, 46, D8–D13. [Google Scholar] [CrossRef] [Green Version]
  20. Jeske, L.; Placzek, S.; Schomburg, I.; Chang, A.; Schomburg, D. BRENDA in 2019: A European ELIXIR core data resource. Nucleic Acids Res. 2019, 47, D542–D549. [Google Scholar] [CrossRef]
  21. Finn, R.D.; Coggill, P.; Eberhardt, R.Y.; Eddy, S.R.; Mistry, J.; Mitchell, A.L.; Potter, S.C.; Punta, M.; Qureshi, M.; Sangrador-Vegas, A.; et al. The Pfam protein families database: Towards a more sustainable future. Nucleic Acids Res. 2016, 44, 279–285. [Google Scholar] [CrossRef]
  22. Altschul, S.F.; Gish, W.; Miller, W.; Myers, E.W.; Lipman, D.J. Basic local alignment search tool. J. Mol. Biol. 1990, 215, 403–410. [Google Scholar] [CrossRef]
  23. Sievers, F.; Wilm, A.; Dineen, D.; Gibson, T.J.; Karplus, K.; Li, W.; Lopez, R.; McWilliam, H.; Remmert, M.; Söding, J.; et al. Fast, scalable generation of high-quality protein multiple sequence alignments using Clustal Omega. Mol. Syst. Biol. 2011, 7, 539. [Google Scholar] [CrossRef] [PubMed]
  24. Sievers, F.; Higgins, D.G. Clustal Omega for making accurate alignments of many protein sequences. Protein Sci. 2018, 27, 135–145. [Google Scholar] [CrossRef] [Green Version]
  25. Sievers, F.; Barton, G.J.; Higgins, D.G. Multiple Sequence Alignments. In Bioinformatics; Baxevanis, A.D., Bader, G.D., Wishart, D.S., Eds.; Wiley: Hoboken, NJ, USA, 2020; pp. 227–250. ISBN 9781119335580. [Google Scholar]
  26. Robert, X.; Gouet, P. Deciphering key features in protein structures with the new ENDscript server. Nucleic Acids Res. 2014, 42, 320–324. [Google Scholar] [CrossRef] [PubMed] [Green Version]
  27. Gonçalves, S.; Miller, S.P.; Carrondo, M.A.; Dean, A.M.; Matias, P.M. Induced fit and the catalytic mechanism of isocitrate dehydrogenase. Biochemistry 2012, 51, 7098–7115. [Google Scholar] [CrossRef] [Green Version]
  28. Yang, J.; Wang, Y.; Zhang, Y. ResQ: An Approach to Unified Estimation of B-Factor and Residue-Specific Error in Protein Structure Prediction. J. Mol. Biol. 2016, 428, 693–701. [Google Scholar] [CrossRef] [Green Version]
  29. Yang, J.; Roy, A.; Zhang, Y. BioLiP: A semi-manually curated database for biologically relevant ligand-protein interactions. Nucleic Acids Res. 2013, 41, 1096–1103. [Google Scholar] [CrossRef] [Green Version]
  30. Yang, J.; Roy, A.; Zhang, Y. Protein-ligand binding site recognition using complementary binding-specific substructure comparison and sequence profile alignment. Bioinformatics 2013, 29, 2588–2595. [Google Scholar] [CrossRef]
  31. Salentin, S.; Schreiber, S.; Haupt, V.J.; Adasme, M.F.; Schroeder, M. PLIP: Fully automated protein-ligand interaction profiler. Nucleic Acids Res. 2015, 43, W443–W447. [Google Scholar] [CrossRef]
  32. Gibson, D.G.; Young, L.; Chuang, R.Y.; Venter, J.C.; Hutchison, C.A.; Smith, H.O. Enzymatic assembly of DNA molecules up to several hundred kilobases. Nat. Methods 2009, 6, 343–345. [Google Scholar] [CrossRef]
  33. Bradford, M.M. A rapid and sensitive method for the quantitation of microgram quantities of protein utilizing the principle of protein-dye binding. Anal. Biochem. 1976, 72, 248–254. [Google Scholar] [CrossRef]
  34. Laemmli, U.K. Cleavage of structural proteins during the assembly of the head of bacteriophage T4. Nature 1970, 227, 680–685. [Google Scholar] [CrossRef] [PubMed]
  35. Reeves, H.C.; Daumy, G.O.; Lin, C.C.; Houston, M. NADP+-Specific Isocitrate Dehydrogenase of Escherichia coli. Biochim. Biophys. Acta 1972, 258, 27–39. [Google Scholar] [CrossRef]
  36. Michaelis, L.; Menten, M.L. Die Kinetik der Invertinwirkung. Biochem. Z. 1913, 49, 333–369. [Google Scholar]
  37. Johnson, K.; Goody, R. The Original Michaelis Constant: Translation of the 1913 Michaelis-Menten Paper. Biochemistry 2012, 50, 8264–8269. [Google Scholar] [CrossRef] [Green Version]
  38. Steen, I.H.; Madern, D.; Karlström, M.; Lien, T.; Ladenstein, R.; Birkeland, N.-K. Comparison of Isocitrate Dehydrogenase from Three Hyperthermophiles Reveals Differences in Thermostability, Cofactor Specificity, Oligomeric State, and Phylogenetic Affiliation. J. Biol. Chem. 2001, 276, 43924–43931. [Google Scholar] [CrossRef] [PubMed] [Green Version]
  39. Zhu, G.; Golding, G.B.; Dean, A.M. The selective cause of an ancient adaptation. Science 2005, 307, 1279–1282. [Google Scholar] [CrossRef]
  40. Steen, I.H.; Lien, T.; Birkeland, N.K. Biochemical and phylogenetic characterization of isocitrate dehydrogenase from a hyperthermophilic archaeon, Archaeoglobus fulgidus. Arch. Microbiol. 1997, 168, 412–420. [Google Scholar] [CrossRef] [PubMed]
  41. Potter, S. Evidence for a dual-specificity isocitrate dehydrogenase in the euryarchaeotan Thermoplasma acidophilum. Can. J. Microbiol. 1993, 39, 262–264. [Google Scholar] [CrossRef]
  42. Danson, M.J.; Wood, P.A. Isocitrate dehydrogenase of the thermoacidophilic archaebacterium Sulpholobus acidocaldarius. FEBS Lett. 1984, 172, 289–293. [Google Scholar] [CrossRef] [Green Version]
  43. Dean, A.M.; Koshland, D.E. Kinetic Mechanism of Escherichia coli Isocitrate Dehydrogenase. Biochemistry 1993, 32, 9302–9309. [Google Scholar] [CrossRef] [PubMed]
  44. Dean, A.M.; Golding, G.B. Protein engineering reveals ancient adaptive replacements in isocitrate dehydrogenase. Proc. Natl. Acad. Sci. USA 1997, 94, 3104–3109. [Google Scholar] [CrossRef] [Green Version]
  45. Hurley, J.H.; Dean, A.M.; Koshland, D.E.; Stroud, R.M. Catalytic Mechanism of NADP+-Dependent Isocitrate Dehydrogenase: Implications from the Structures of Magnesium-Isocitrate and NADP+ Complexes. Biochemistry 1991, 30, 8671–8678. [Google Scholar] [CrossRef]
  46. Kondo, H.; Murakami, M. Crystal Structures of the Putative Isocitrate Dehydrogenase from Sulfolobus tokodaii Strain 7 in the Apo and NADP + -Bound Forms. Archaea 2018, 2018, 7571984. [Google Scholar] [CrossRef] [PubMed] [Green Version]
  47. Karlström, M.; Stokke, R.; Helene Steen, I.; Birkeland, N.K.; Ladenstein, R. Isocitrate dehydrogenase from the hyperthermophile Aeropyrum pernix: X-ray structure analysis of a ternary enzyme-substrate complex and thermal stability. J. Mol. Biol. 2005, 345, 559–577. [Google Scholar] [CrossRef] [PubMed]
  48. Colman, R.F. Role of Metal Ions in Reactions Catalyzed by Pig Heart Triphosphopyridine Nucleotide-dependent Isocitrate Dehydrogenase. J. Biol. Chem. 1972, 247, 215–223. [Google Scholar] [CrossRef]
  49. Huang, S.-P.; Cheng, H.-M.; Wang, P.; Zhu, G.-P. Biochemical Characterization and Complete Conversion of Coenzyme Specificity of Isocitrate Dehydrogenase from Bifidobacterium longum. Int. J. Mol. Sci. 2016, 17, 296. [Google Scholar] [CrossRef] [PubMed] [Green Version]
  50. Stoddard, B.L.; Dean, A.; Koshland, D.E. Structure of Isocitrate Dehydrogenase with Isocitrate, Nicotinamide Adenine Dinucleotide Phosphate and Calcium at 2.5-Å Resolution: A Pseudo-Michaelis Ternary Complex. Biochemistry 1993, 32, 9310–9316. [Google Scholar] [CrossRef] [PubMed]
  51. Chen, R.; Greer, A.; Dean, A.M. A highly active decarboxylating dehydrogenase with rationally inverted coenzyme specificity. Proc. Natl. Acad. Sci. USA 1995, 92, 11666–11670. [Google Scholar] [CrossRef] [Green Version]
  52. Chen, R.; Greer, A.F.; Dean, A.M.; Hurley, J.H. Engineering secondary structure to invert coenzyme specificity in isopropylmalate dehydrogenase. Tech. Protein Chem. 1997, 8, 809–816. [Google Scholar] [CrossRef]
  53. Stokke, R.; Karlström, M.; Yang, N.; Leiros, I.; Ladenstein, R.; Birkeland, N.K.; Steen, I.H. Thermal stability of isocitrate dehydrogenase from Archaeoglobus fulgidus studied by crystal structure analysis and engineering of chimers. Extremophiles 2007, 11, 481–493. [Google Scholar] [CrossRef] [PubMed]
  54. Camacho, M.; Rodríguez-Arnedo, A.; Bonete, M.J. NADP-dependent isocitrate dehydrogenase from the halophilic archaeon Haloferax volcanii: Cloning, sequence determination and overexpression in Escherichia coli. FEMS Microbiol. Lett. 2002, 209, 155–160. [Google Scholar] [CrossRef] [PubMed]
  55. Rodríguez-Arnedo, A.; Camacho, M.; Llorca, F.; Bonete, M.J. Complete reversal of coenzyme specificity of isocitrate dehydrogenase from Haloferax volcanii. Protein J. 2005, 24, 259–266. [Google Scholar] [CrossRef]
  56. Jin, M.M.; Wang, P.; Li, X.; Zhao, X.Y.; Xu, L.; Song, P.; Zhu, G.P. Biochemical characterization of NADP+-dependent isocitrate dehydrogenase from Microcystis aeruginosa PCC7806. Mol. Biol. Rep. 2013, 40, 2995–3002. [Google Scholar] [CrossRef] [PubMed]
  57. Banerjee, S.; Nandyala, A.; Podili, R.; Katoch, V.M.; Hasnain, S.E. Comparison of Mycobacterium tuberculosis isocitrate dehydrogenases (ICD-1 and ICD-2) reveals differences in coenzyme affinity, oligomeric state, pH tolerance and phylogenetic affiliation. BMC Biochem. 2005, 6, 20. [Google Scholar] [CrossRef] [PubMed] [Green Version]
  58. Wrenger, C.; Müller, S. Isocitrate dehydrogenase of Plasmodium falciparum: Energy metabolism or redox control? Eur. J. Biochem. 2003, 270, 1775–1783. [Google Scholar] [CrossRef] [PubMed]
  59. Lee, P.; Colman, R.F. Thr373, Asp375, and Lys260 are in the coenzyme site of porcine NADP-dependent isocitrate dehydrogenase. Arch. Biochem. Biophys. 2006, 450, 183–190. [Google Scholar] [CrossRef]
  60. Plaut, G.W.E. Isocitrate Dehydrogenase. In The Enzymes; Boyer, P.D., Lardy, H., Myrbäck, K., Eds.; Academic Press: New York, NY, USA, 1963; pp. 105–126. [Google Scholar]
  61. Stokke, R.; Birkeland, N.K.; Steen, I.H. Thermal stability and biochemical properties of isocitrate dehydrogenase from the thermoacidophilic archaeon Thermoplasma acidophilum. Extremophiles 2007, 11, 397–402. [Google Scholar] [CrossRef]
  62. Li, X.; Wang, P.; Ge, Y.; Wang, W.; Abbas, A.; Zhu, G. NADP+-specific isocitrate dehydrogenase from oleaginous yeast Yarrowia lipolytica CLIB122: Biochemical characterization and coenzyme sites evaluation. Appl. Biochem. Biotechnol. 2013, 171, 403–416. [Google Scholar] [CrossRef]
Figure 1. Recombinant production and purification of MhIDH6x His. (a) 12% SDS-PAGE of samples from test-expression of icd26x His. Cell samples were taken 0, 1, 2, 4, 6, and 24 h after induction of gene expression, normalized to identical cell densities and disrupted by thermal and chemical lysis, prior to loading on the gel. Identical gels were prepared for colloidal Coomassie- (top) and colorimetric immuno-staining using an anti His-tag primary antibody (bottom). (b,c) 12% SDS-PAGE of samples from isolation and chromatographic purification of MhIDH6x His. Gels were Coomassie- and immuno-stained as described above. IMAC 1, 2, and 3 refer to the flow through during loading of the Ni2+-IMAC column, and the fractions which eluted with 80 and 500 mM imidazole, respectively. SEC 1 refers to the first fractions eluted during size exclusion chromatography.
Microorganisms 09 02318 g001
Figure 2. Cofactor-specificity of MhIDH6x His. (a) Specific IDH activity in presence of 20 mM of NADP+ (dark gray) or 20 mM of NAD+ (light gray). Assays were performed at pH 8 and 28 °C in presence of Mg2+. (b) Relative MhIDH6x His activity in presence of different divalent cations and EDTA. Assays were performed at pH 8 and 28 °C in presence of NADP+.
Microorganisms 09 02318 g002
Figure 3. Optimal pH of MhIDH6x His. (a) Specific IDH activity as a function of the pH value with a polynomial fitting curve of 5th order (R2 > 0.99). The global maximum of the curve corresponding to the pH optimum of 8 is indicated by a dashed line, the range of specific activity higher than 85% of the maximal activity is highlighted in gray. pH ranges with sodium acetate (■), sodium phosphate (●), and TRIS/HCl (▲) buffers are indicated by the respective symbols. Assays were conducted at 28 °C in presence of NADP+ and Mg2+. (b) Distribution of pH optima of homologous IDHs listed in the BRENDA database (see Appendix A, Table A2). The pH optimum of MhIDH6x His is highlighted in black. The median is indicated by a black bar.
Microorganisms 09 02318 g003
Figure 4. Enzyme kinetics of MhIDH6x His. (a,b) The initial reaction rate of the enzyme for DL-isocitrate (□, orange) and NADP+ (○, blue) was measured at the indicated substrate concentrations and fit according to the Michaelis-Menten model (R2 (DL-isocitrate) > 0.98, R2 (NADP+) > 0.99). The corresponding kinetic parameters derived from the fits are given in the respective inset tables. All assays were conducted at 28 °C in presence of Mg2+, as well as 1 mM of DL-isocitrate and 20 mM of NADP+, respectively. Reaction mixtures contained 2 and 0.6 µg of enzyme per reaction for NADP+ and DL-isocitrate kinetics, respectively. (c,d) Comparison of kinetic parameters of MhIDH6x His for DL-isocitrate (□, orange) and NADP+ (○, blue) with those of other IDHs listed in the BRENDA database (transparent, see Appendix A, Table A2). The parameters of MhIDH6x His are highlighted in opaque orange and blue, respectively. The corresponding median values are indicated by a black bar.
Microorganisms 09 02318 g004
Figure 5. Putative structure and ligand binding in MhIDH. (a) Partial multiple sequence alignment of the substrate and cofactor binding pockets of MhIDH with IDH sequences from E. coli K-12 (EcIDH, NCBI: P08200.1), Archaeoglobus fulgidus DSM 4304 (AfIDH, NCBI: O29610.1), Haloferax volcanii DS2 (HvIDH, NCBI: D4GU92.1), Aeropyrum pernix K1 (ApIDH, NCBI: GBF08417.1), and Sulfolobus tokodaii strain 7 (StIDH, NCBI: BAB67271.1). Identical amino acids are highlighted in black, homologous amino acids are boxed. Residues involved in isocitrate (●) cation (★) and NADP+ (▲) binding in EcIDH according to [27] are highlighted by the corresponding symbols. The position of Pro382 in MhIDH is highlighted in red. Residues of the second homodimer subunit involved in ligand binding are highlighted by gray symbols. For full alignment see Appendix A, Figure A1. (b) Putative structure of monomeric MhIDH homology modeled after the crystal structure of EcIDH ([27], PDB: 4AJ3, 49.5% sequence homology, 1.9 Å resolution) in ribbon representation and colored according to orientation of the backbone, as well as estimated local model quality and B-factor as determined by the ResQ server. The surface representation of the protein is indicated in the background. (c) Ribbon representation of a putative quaternary structure of MhIDH in top view, forming a homodimer with an active site located between the large and small domain of each subunit. Docked ligands isocitrate (red), NADP+ (blue) and Mn2+ (green) are shown in ball-and-stick representation. (d) Detail-view of a structural alignment of the NADP+ binding pockets in the MhIDH model (black) and the EcIDH crystal structure (gray). Side chains of amino acids presumably involved in cofactor binding, as well as NADP+ are displayed as stick-models and are highlighted according to their atomic composition: O–red; N–blue, P–orange; C–gray (EcIDH), black (MhIDH), or blue (NADP+). Interactions between EcIDH residues and NADP+ are indicated by dashed lines (salt bridges—yellow; hydrogen bonds—light blue).
Microorganisms 09 02318 g005
Table 1. Oligonucleotide primers used in this study.
No.OrientationSequence (5′ → 3′) 1
1forwardGTT TAA CTT TAA GAA GGA GAT ATA CAT ACC ATG CAC CAT CAT CAC CAC CAT GAA GAA CAG AAA AAA GAA TCA ATA AG
2reverseCCG CCA AAA CAG CCA AGC TGG AGA CCG TTT TCA TGC TGA TTT TAT CGC
3forwardAAA CGG TCT CCA GCT TG
4reverseGGT ATG TAT ATC TCC TTC TTA AAG TTA AAC
1 sequence-overlaps to pBAD202 are underlined, the 6x His-tag encoding sequence is printed bold.
Publisher’s Note: MDPI stays neutral with regard to jurisdictional claims in published maps and institutional affiliations.

