Article

Phylogenetic Analysis Reveals Source Attribution Patterns for Campylobacter spp. in Tennessee and Pennsylvania

1
Department of Food Science, University of Tennessee, Knoxville, TN 37996, USA
2
Department of Public Health, University of Tennessee, Knoxville, TN 37996, USA
3
Department of Food Science, The Pennsylvania State University, University Park, PA 16802, USA
4
Tennessee Department of Health, Nashville, TN 37243, USA
5
Pennsylvania Department of Health, Harrisburg, PA 17120, USA
6
Department of Pathology and Laboratory Medicine, Perelman School of Medicine, The University of Pennsylvania, Philadelphia, PA 19104, USA
7
Division of Laboratory Services, Tennessee Department of Health, Nashville, TN 37216, USA
*
Author to whom correspondence should be addressed.
Microorganisms 2021, 9(11), 2300; https://doi.org/10.3390/microorganisms9112300
Submission received: 10 September 2021 / Revised: 27 October 2021 / Accepted: 29 October 2021 / Published: 5 November 2021
(This article belongs to the Special Issue Campylobacter: Current Status and Future Challenges)

Abstract

:
Campylobacteriosis is the most common bacterial foodborne illness in the United States and is frequently associated with foods of animal origin. The goals of this study were to compare clinical and non-clinical Campylobacter populations from Tennessee (TN) and Pennsylvania (PA), use phylogenetic relatedness to assess source attribution patterns, and identify potential outbreak clusters. Campylobacter isolates studied (n = 3080) included TN clinical isolates collected and sequenced for routine surveillance, PA clinical isolates collected from patients at the University of Pennsylvania Health System facilities, and non-clinical isolates from both states for which sequencing reads were available on NCBI. Phylogenetic analyses were conducted to categorize isolates into species groups and determine the population structure of each species. Most isolates were C. jejuni (n = 2132, 69.2%) and C. coli (n = 921, 29.9%), while the remaining were C. lari (0.4%), C. upsaliensis (0.3%), and C. fetus (0.1%). The C. jejuni group consisted of three clades; most non-clinical isolates were of poultry (62.7%) or cattle (35.8%) origin, and 59.7 and 16.5% of clinical isolates were in subclades associated with poultry or cattle, respectively. The C. coli isolates grouped into two clades; most non-clinical isolates were from poultry (61.2%) or swine (29.0%) sources, and 74.5, 9.2, and 6.1% of clinical isolates were in subclades associated with poultry, cattle, or swine, respectively. Based on genomic similarity, we identified 42 C. jejuni and one C. coli potential outbreak clusters. The C. jejuni clusters contained 188 clinical isolates, 19.6% of the total C. jejuni clinical isolates, suggesting that a larger proportion of campylobacteriosis may be associated with outbreaks than previously determined.

1. Introduction

Campylobacteriosis, caused by Campylobacter spp., is the most common bacterial foodborne illness in the United States, with an annual incidence rate of 19.5 cases per 100,000 in 2019 [1]. The USDA Economic Research Service estimated that up to 1.6 million cases occurred in 2018 in the United States, resulting in a total cost of illness up to $5.2 billion [2]. Campylobacteriosis is common in low- and middle-income countries. Though most people affected fully recover, campylobacteriosis is linked to chronic sequalae including irritable bowel syndrome, reactive arthritis, and Guillain–Barré syndrome (GBS) [3,4].
The Campylobacter genus currently consists of 34 validly published species (as of 6 May 2021) [5,6]. C. jejuni and C. coli are the species that most commonly cause human campylobacteriosis, however, other species including C. lari, C. upsaliensis, C. concisus, C. ureolyticus, and C. fetus may also cause campylobacteriosis [7,8,9,10]. The Campylobacter species cluster into five greater phylogenetic groups, with C. jejuni, C. coli, and C. upsaliensis belonging to the same group [10].
Campylobacteriosis is commonly acquired through the consumption of contaminated food derived from animals, consumption of other food products cross-contaminated from animal products, contact with infected animals, consumption of food products contaminated through soil or water containing animal waste, or consumption of contaminated water [3,11]. Large outbreaks attributed to Campylobacter spp. have been associated with drinking water, milk (pasteurized and unpasteurized), lettuce, clams, root vegetables, peas, cheese, beef, chicken, and dogs [12]. However, most Campylobacter cases in the United States are considered sporadic (99.5%), rather than outbreak-associated [13]. Additionally, an estimated 18% of campylobacteriosis cases in the U.S. are linked to international travel [3,13,14].
Several studies have investigated source attribution and risk factors for Campylobacter infection, although they vary in scope of species, subtyping methodology, and geographical area, and some even incorporate epidemiological data. Overall, considering Campylobacter spp. as a whole, most studies suggest that poultry or poultry followed by ruminants are the most prevalent sources [15,16,17,18,19,20,21]. Additionally, Liao et al. found a positive correlation between rurality and ruminant-sourced campylobacteriosis [22]. For C. jejuni specifically, the consensus is that poultry or poultry and ruminants are the primary sources, with swine being negligible [15,16,17,20,21,23,24,25,26,27,28,29,30]. Thepault et al. identified 15 host-segregating genes in C. jejuni, which were related to metabolic activities, protein modification, signal transduction, stress response, and hypothetical proteins [23]. For C. coli, most studies point to poultry as the primary source, but there is considerable variability in the identified secondary source including swine [17,25,27,31,32], ruminants [15,20,33,34], and environmental sources [35]. Traditional subtyping methods (e.g., multilocus sequence typing [MLST], pulsed field gel electrophoresis [PFGE]) that were used in the older source attribution studies have relatively lower discriminatory power compared to whole-genome sequencing (WGS)-based subtyping methods, which also allow for the inference of evolutionary relationships. Applying higher resolution subtyping methods results in more accurate source attribution predictions [24,26,32].
Campylobacter is monitored as part of PulseNet [36]. Prior to the PulseNet transition to WGS for subtyping in the surveillance of Campylobacter, which was completed in 2019 [37], many states did not sequence this microorganism. As sequencing of Campylobacter clinical isolates for routine surveillance has increased [38,39] and PulseNet has transitioned to WGS, there are more opportunities to use these data for cluster identification and source attribution.
The objectives of this study were to compare clinical and non-clinical Campylobacter spp. populations from Tennessee (TN) and Pennsylvania (PA); use non-clinical isolate source data and phylogenetic clustering to see if source attribution trends emerge; and identify and describe potential outbreak clusters using hqSNP thresholds. Isolates from two states were examined to provide a greater diversity of both clinical and non-clinical sources. This study provides insight into the population structure of Campylobacter genus and the relative importance of different livestock sources in the transmission of clinically important species, C. jejuni and C. coli.

2. Materials and Methods

2.1. Isolates and Sequencing

Isolates used in this study (n = 3080) are listed in Table S1 and are summarized in Table 1. PA clinical isolates (n = 110) were from samples collected from patients at the University of Pennsylvania Health System facilities (2017–2018) and were sequenced for this study. Genomic DNA was extracted using a Qiagen DNA Easy Mini Kit (Qiagen GmbH, Hilden, Germany) as per the manufacturer’s instructions with the addition of a RNase treatment, as previously described [40]. Libraries were prepared using Nextera XT kits and sequenced with an Illumina MiSeq at the University of Tennessee Genomics Core. Biosample IDs and metadata for TN clinical isolates submitted to and sequenced with an Illumina MiSeq by the state public health lab (2013–2021) as part of routine sequencing were obtained from the TN Department of Health in order to retrieve them from NCBI (state information is not listed for clinical isolates on NCBI). The NCBI Pathogen Detection Isolates Browser was queried to obtain IDs for non-clinical isolates using the filters: isolation type “environmental/other” and location “PA” or “TN.” The non-clinical isolate collection date ranges were 2013–2021 for PA and 2003–2021 for TN. Most of the non-clinical isolate sources were food animals and meats including poultry, cattle, swine, sheep (n = 7), and goat (n = 4); the only non-food animal or meat-associated isolates were isolated from puppy stool (n = 2). These isolates will be collectively referred to as “non-clinical isolates.” Raw reads for TN clinical (n = 964), TN non-clinical (n = 689), and PA non-clinical (n = 1317) isolates were downloaded from the NCBI SRA database. All raw reads were trimmed with Trimmomatic (v0.35) [41] (with the following parameters: ILLUMINACLIP: NexteraPE- PE.fa:2:30:10 LEADING:3 TRAILING:3 SLIDINGWINDOW:4:15 MINLEN:36), quality checked with FastQC (v0.11.7) [42] and MultiQC (v1.5) [43]. Trimmed reads were assembled with SPAdes (v3.12.0) [44] (using the careful option and with automatic kmer size selection) and assemblies were filtered to remove contigs <200 bp in length or with SPAdes-computed k-mer coverages <5×. Assembly statistics were generated using QUAST (v4.6.3) [45], Bbmap (v38.88) [46], and SAMtools (v0.1.8) [47]. Only assemblies that met all the following criteria were included in further analyses: total length of 1.4–2.2 Mbp, number of contigs ≤200, G + C content of 29–47%, and estimated average sequencing read coverage of ≥10×.

2.2. Phylogenetic Analysis and Taxonomic Identification

KSNP3 (v 3.1) [48] was used to analyze the assemblies, along with reference genomes (n = 127 including type strains downloaded from the NCBI RefSeq database), to divide the isolates into presumptive species groups as we did not know the species of some of the isolates initially and wanted to confirm the identity of the rest. Clades or isolates that did not fall within the main clade and/or grouped with reference genomes of known species were removed from the isolate set and KSNP3 was run again with only the isolates from the “main clade.” This process was continued until isolates could be confidently separated into species groups. Optimum kmer value was determined for each run using the included Kchooser utility; optimum values determined and used for analyses were 19 and 21. All isolates were subtyped using the appropriate MLST schemes on PubMLST [49,50,51]. Isolates that needed further classification or taxonomic identification (e.g., non-jejuni/coli, outliers) were evaluated using rMLST [49,52], JSpeciesWS (v3.8.2) [53], SpeciesFinder 2.0 [54], KmerFinder (v3.0.2) [54], and TYGS (v281) [55].
After grouping isolates by species, analyses were conducted with each species individually using KSNP3. This enabled us to determine species-level population structure and identify how closely related clinical isolates were to each other and to non-clinical isolates. The output core SNP matrix fasta files were used to create phylogenetic trees with MegaX v10.1.8 [56] (with evolutionary distances calculated using the number of differences method [57], evolutionary history inferred using the neighbor-joining method [58], and 100 bootstrap replicates [59]), which were then visualized and edited with iTOL v6.1.1 [60].

2.3. Cluster Identification

From the species-level KSNP3 analyses outputs, potential outbreak clusters that contained ≥3 clinical isolates that had SNP distances of ≤5 SNPs were identified. Additionally, we identified non-clinical isolates that were related to clinical isolates in these clusters within ≤5 SNPs. Then, a hqSNP analysis was performed with each of the potential clusters individually using the CFSAN SNP pipeline (v1.0.1) [61] and one of the clinical isolates as an internal reference (one that was part of the “core” of the cluster, meaning it had smaller SNP distances to other clinical cluster isolates). The hqSNP distance threshold used to define a cluster was ≤10 hqSNPs. Based on the resulting hqSNP distances, a putative cluster was confirmed as a cluster if all clinical isolates were ≤10 hqSNPs from another clinical isolate. Conversely, a putative cluster was determined to not be a cluster if all the isolates exceeded the hqSNP distance threshold. A putative cluster was marked as needing to be further modified if either some isolates exceeded the hqSNP distance threshold of ≤10 hqSNPs and needed to be removed (singletons), or if the cluster needed to be subdivided into two or more separate clusters. The process was repeated for the modified clusters until they were confirmed as a cluster or determined to not be a cluster. Similarly, non-clinical isolates that were related to clinical within ≤10 SNPs remained in the clusters. Metrics are available in Table S2.

3. Results

3.1. Most Isolates Were Identified as C. jejuni and C. coli

Our analysis included clinical and non-clinical Campylobacter spp. isolates from both Tennessee and Pennsylvania. The clinical isolates from TN were collected as part of routine state-wide surveillance, whereas the isolates from PA were collected from patients from facilities within a single health system in the Philadelphia and surrounding areas (PA does not currently collect and sequence Campylobacter for surveillance). Hence, it should be noted that the PA clinical isolates may not be representative of the entire state. Most of the isolates were determined to be C. jejuni (69.2%) and C. coli (29.9%), with the remaining isolates belonging to C. lari (0.4%), C. upsaliensis (0.3%), and C. fetus (0.1%) (Table 1). Phylogenetic analyses were conducted separately for each species to identify the species-level population structure of Campylobacter from clinical and non-clinical sources in TN and PA. Additionally, this approach allowed us to determine how closely related clinical strains are to each other and to isolates from non-clinical sources.

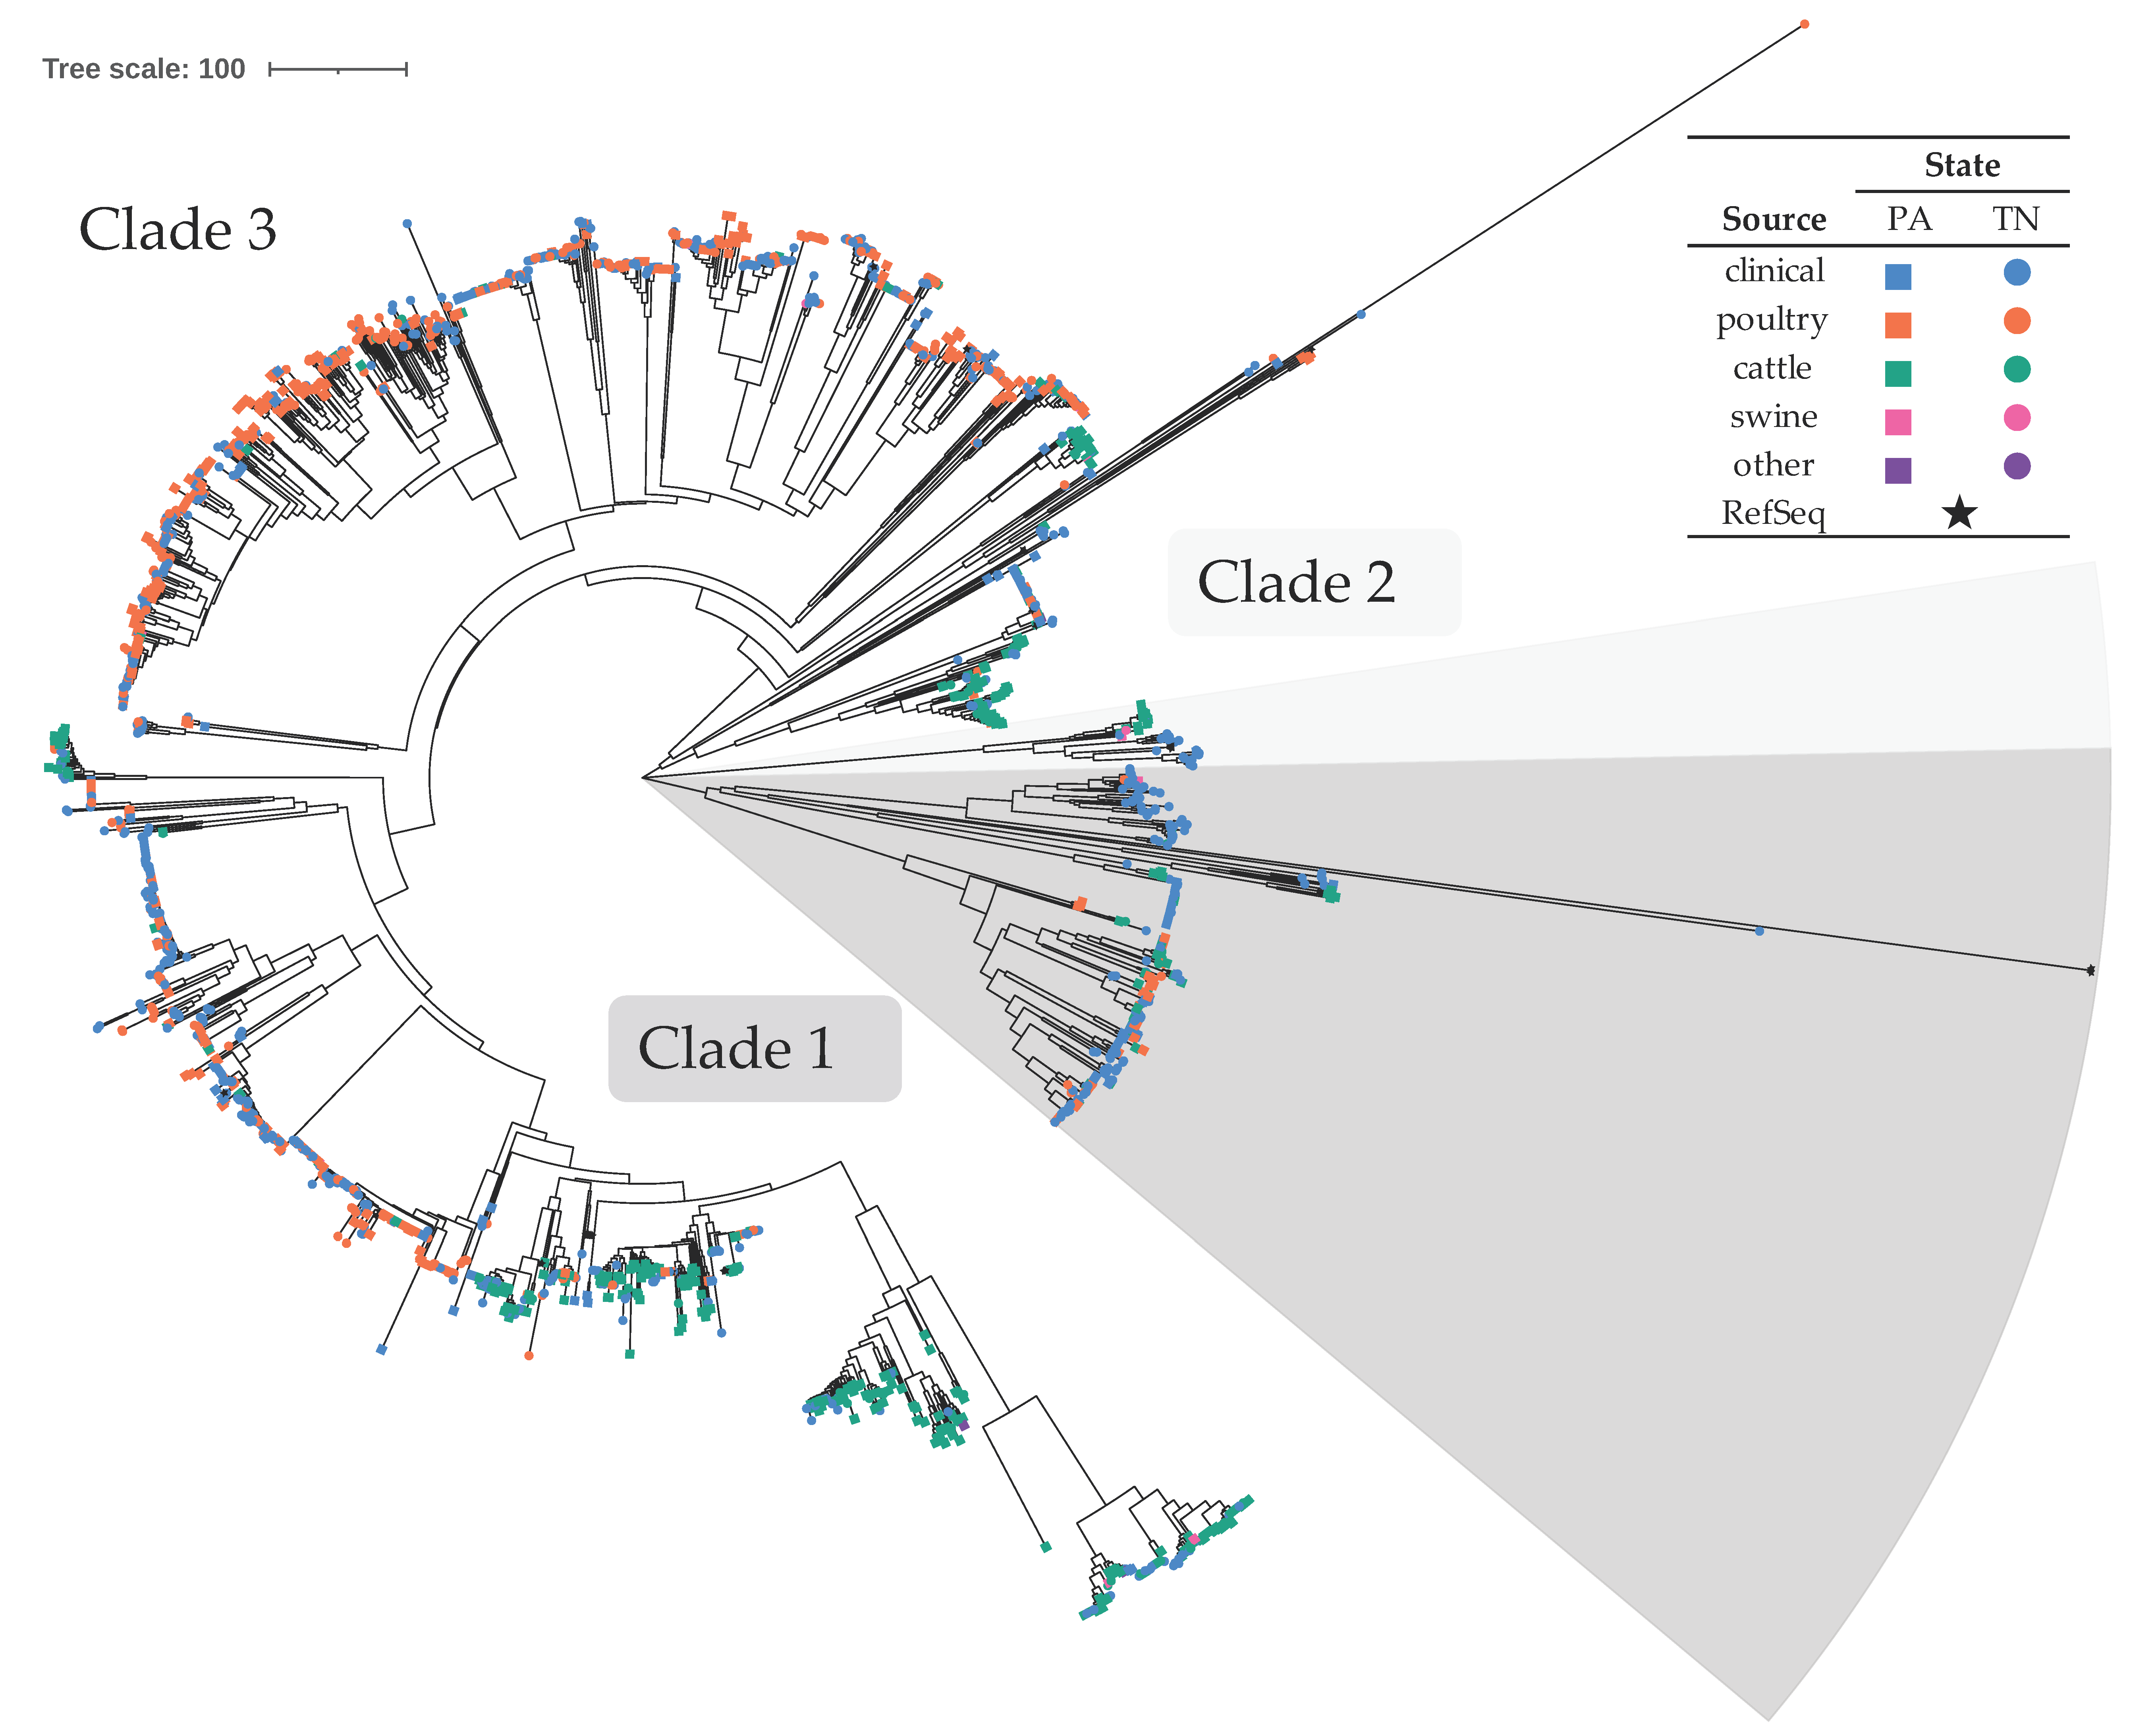
3.2. C. jejuni Formed Three Clades, Primarily Consisting of Poultry and Bovine Isolates

The majority of isolates, 69.2%, were presumptively identified as C. jejuni (n = 2132) (Table 1), with an overall average distance of 511.2 core SNPs. Considering all sources, 58.4% originated from TN and 41.6% from PA. Isolates from both states showed similar levels of diversity, with average within group distances of 506.3–507.1 core SNPs. These were further divided into three distinct clades (Figure 1). This species phylogenetic group consisted of 45.0% clinical isolates and 55.0% non-clinical isolates. Of the non-clinical isolates, most were poultry (62.7%) and cattle-associated (35.8%), with very few associated with swine (1.3%) or other sources (one isolated from puppy stool and two isolated from sheep/lamb) (Table 1 and Figure 1). Of isolates from the most substantial sources, clinical isolates were the most diverse with an average within group distance of 536.6 core SNPs compared to 488.0 for cattle and 407.9 for poultry. C. jejuni clade 1 contained 251 isolates, clade 2 contained 41, and clade 3 contained 1840 isolates, with an average within clade distances of 508.7, 27.2, and 422.6 core SNPs, respectively. The majority of non-clinical isolates from clade 1 originated from cattle (48.8%) or poultry (47.6%) sources, and very few from swine (3.7%). In clade 3, most non-clinical isolates were poultry-associated (65.0%), followed by cattle (33.8%), with a small number from swine (0.8%); clade 3 also contained isolates from puppy stool and sheep/lamb. Within clades 1 and 3, there were evident subclades consisting of non-clinical isolates predominantly from a single food animal source. Out of 11 source-specific subclades, five contained mostly poultry-sourced isolates and six contained mostly cattle-sourced isolates (Figure 1 and Figure S1); the non-clinical isolates within these subclades were 85.7–100.0% poultry- or 88.5–100.0% cattle-sourced, respectively. They also contained clinical isolates: 573 total in the poultry-associated subclades and 158 total in the cattle-associated.
C. jejuni species phylogenetic group isolates belonged to 28 different MLST clonal complexes (CC) (148 isolates belonged to STs that are categorized into a CC and 100 isolates are of an unknown ST) (Table 1). Among these, isolates from clade 1 one belonged to eight different CCs and isolates from clade 3 belonged to 21 different CCs. In clade 1, ST-41 and ST-682 CCs contained only clinical isolates and ST-177 CC contained only non-clinical isolates (Table S1). The non-clinical isolates belonging to ST-177, ST-179, and ST-508 CCs were exclusively from cattle sources, isolates from ST-403 CC were predominantly from cattle (88.9%), those from the ST-283 complex were predominantly of poultry origin (80.0%), and isolates from ST-45 CC were similarly distributed between poultry- and cattle-associated (51.7% and 44.8%, respectively). A small percentage (≤11.1%) of non-clinical isolates belonging to ST-45 and ST-403 CCs were of swine origin.
In C. jejuni clade 3, ST-692 and ST-1332 CCs contained only clinical isolates and ST-446 and ST-1287 CCs contained only non-clinical isolates. Non-clinical isolates that belonged to ST-443, ST-446, ST-460, ST-607, and ST-1287 CCs were exclusively poultry-associated. Only considering non-clinical isolates, those from ST-48, ST-49, ST-206, ST-353, ST-354, ST-464, and ST-52 CCs were predominantly poultry-associated (77.8–96.3%), those from ST-42 and ST-61 CCs were predominantly cattle-associated (96.6% and 91.7%, respectively), and isolates from ST-21, ST-22, ST-257, and ST-658 CCs were predominantly poultry- or cattle-associated. A small percentage (≤6.5%) of non-clinical isolates belonging to ST-21, ST-49, ST-61, ST-257, ST-353, and ST-464 CCs were swine-associated.

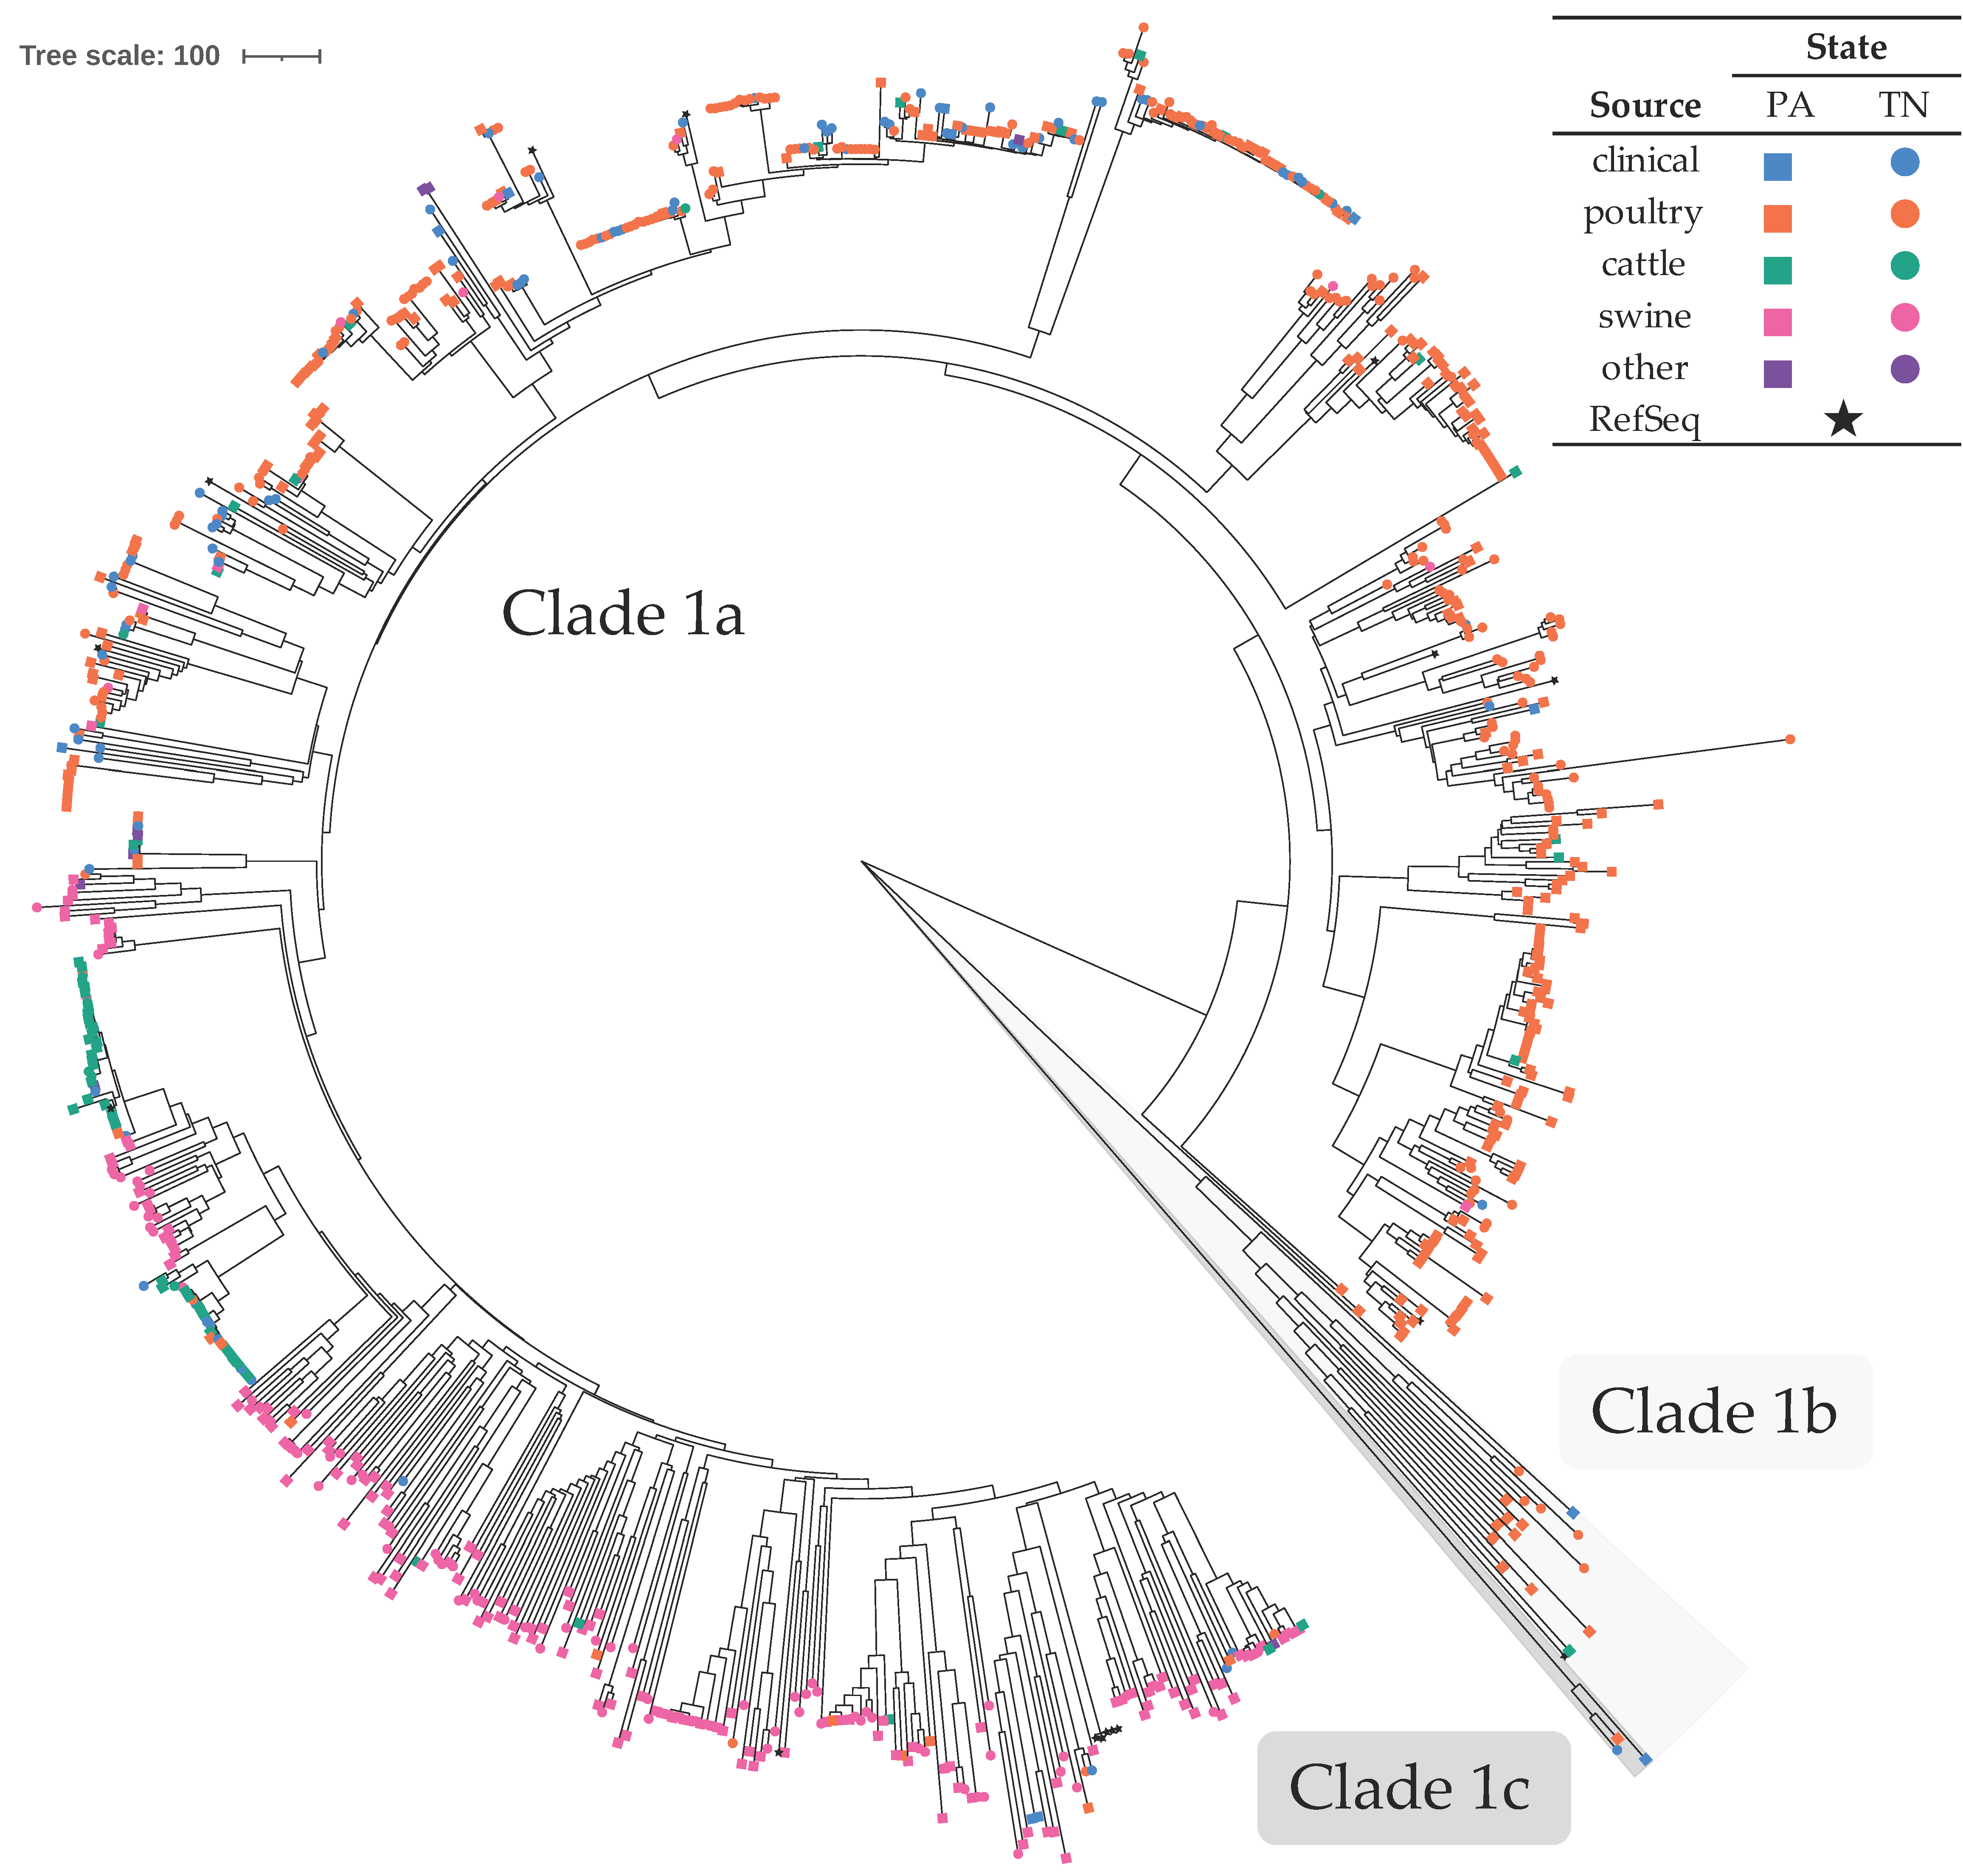
3.3. C. coli Formed Two Clades, Primarily Consisting of Poultry and Swine Isolates

Comprising the second largest group (29.9%), 921 isolates were presumptively identified as C. coli (Table 1). A large majority (89.4%) were non-clinical isolates. Isolates of this species were divided into two distinct clades (1 and 3; clade 3 isolates were removed from the final SNP analysis due to large SNP distances [3390–3669 SNPs] between isolates from clades 1 and 3), with clade 1 being further subdivided into three subclades (Figure 2). Clades 1a, 1b, and 3 corresponded to clades identified by other researchers [33,62,63,64], hence they were named consistently with the published literature. Specifically, clade 1a represented isolates belonging to ST-828 CC (80 belonged to a ST that was not associated with a CC or were of an unknown ST), clade 1b represented isolates from ST-1150 CC (seven were of an unknown ST), and clade 1c represented ST-1243 isolates that do not formally belong to any CC. Clade 1 had an overall average SNP distance of 719.6. Clade 1 contained 918 isolates (subclade 1a contained 899, 1b contained 16, and 1c contained three isolates, with within subclade average distances of 659.5, 933.6, and 183.3 core SNPs, respectively) and clade 3 contained five isolates. Similar to other studies, most of the C. coli isolates belonged to ST-828 CC [32]. Within clade 1, isolates from cattle sources showed the least diversity (average within group distance of 491.2 core SNPs) when compared to isolates from swine (627.1), clinical (664.2), and poultry (694.75) sources. Additionally, when considering all sources of clade 1 isolates, isolates from PA were more diverse than those from TN, with average within group distances of 743.8 and 660.4 core SNPs, respectively. The majority of non-clinical isolates in clade 1a originated from poultry sources (60.4%), followed by swine (29.7%) and cattle (8.7%). Within clade 1a, there were subclades that consisted of non-clinical isolates predominantly from a single food animal source (poultry, cattle, or swine) (Figure 2 and Figure S2). These source-associated clades also contained clinical isolates: 73 total in the poultry-associated subclades, six in the swine-associated, and nine in the cattle-associated. Clade 1b contained only one clinical isolate and most of the non-clinical isolates were from poultry (93.3%). Clade 1c contained two clinical isolates and one poultry isolate.
Clade 3 consisted of only isolates from TN, with two from clinical sources and three from poultry sources. These clade 3 isolates were confirmed to be C. coli by SpeciesFinder, KmerFinder, and rMLST results (all showed 100% support except one that showed 80%) (File S1). However, TYGS results indicated that they were a potential new species and ANI values when compared to C. coli type strain assemblies were <95%. Additionally, their genomes were 1.54–1.59 Mbp in length and had a G + C content of 31.7–31.8%, compared to 1.91–1.94 Mbp and 31.0% for the C. coli type strain assemblies.

3.4. Other Species

Thirteen isolates were presumptively identified as C. lari (Table 1). Most of these isolates originated from PA (76.9%), and those from non-clinical sources were poultry- (60%) or cattle-associated (40%). Nine belong to C. lari ST-21, one to ST-77, and three were of unknown ST (Table S1). Ten isolates were presumptively identified as C. upsaliensis (Table 1), all of unknown ST. All but one of these isolates originated from TN and clinical sources. Four isolates, all from TN clinical sources, were presumptively identified as C. fetus (Table 1). Two belonged to C. fetus ST-3, one to ST-6, and one to ST-11.

3.5. Potential Outbreak Clusters

For C. jejuni, we identified 42 potential outbreak clusters using a distance threshold of 10 hqSNPs, consisting of 188 total clinical isolates (Table 2, Table S3, Figure S1). Each cluster contained 3–13 clinical isolates with average within-cluster distances ranging from 0–11.07 hqSNPs. Thirty-three of the clusters contained only clinical isolates from TN, one only from PA, and eight contained clinical isolates from both states. The collection dates for clinical isolates within a single cluster spanned from a single day up to over four years. Additionally, clinical isolates from 16 of the potential clusters were also related (≤10 hqSNPs) to 1–8 non-clinical isolates per cluster. Among clusters in which clinical isolates were closely related to non-clinical isolates, 11 clusters contained non-clinical isolates of only poultry origin, three of only cattle origin, and two of both poultry and cattle origin.
For C. coli, we identified a single potential outbreak cluster using a distance threshold of 10 hqSNPs (Table 2, Table S3, Figure S2). The cluster contained four clinical isolates, all from TN, with an average within-cluster distance of 13 hqSNPs. The collection dates for the clinical isolates within the cluster spanned over 2.5 years. Clinical isolates from the cluster were also related (≤10 hqSNPs) to seven non-clinical isolates, which were only from poultry sources.

4. Discussion

In this study, we examined the population structure of Campylobacter spp. isolates from clinical and non-clinical sources from Tennessee and Pennsylvania. We identified livestock source attribution trends for individual C. jejuni and C. coli clades based on phylogenetic clustering. Additionally, we identified a large number of potential outbreak clusters for C. jejuni, which may indicate that more C. jejuni illnesses share a common source than previously thought. However, only genomic relatedness was used for cluster identification in this study; epidemiological data are needed to confirm these clusters.

4.1. Source Attribution Trends

Previous studies have investigated the relative importance of different sources of human campylobacteriosis [15,16,22,23,24,25]. Most studies included Campylobacter spp. together or only C. jejuni, and the majority linked campylobacteriosis with poultry, and to a lesser extent with ruminants. The present study examined both C. jejuni and C. coli individually. Our results indicate that while poultry appears to be the major source of infections with both species based on close phylogenetic clustering, cattle and swine may also be substantial sources of C. jejuni and C. coli infections.

4.1.1. C. jejuni Associated with Poultry and Bovine Sources

The non-clinical isolates from the three major C. jejuni clades were mostly from poultry (62.7%) and bovine (35.8%) sources, with clade 1 having approximately equal proportions of cattle (48.8%) and poultry (47.6%) isolates and clade 3 having a higher proportion of poultry isolates (65.0%). Furthermore, we identified several subclades within clades 1 and 3 that contained non-clinical isolates primarily associated with a single animal source, which suggests host adaptation. The poultry- and cattle-associated subclades also contained 573 (59.7% of clinical C. jejuni isolates) and 158 (16.5%) clinical isolates, respectively. This indicates that these clinical isolates likely originated from poultry or cattle sources, which further supports the inference that poultry has a relatively higher contribution to C. jejuni infection than cattle. When examining clinical and environmental C. jejuni isolates collected from east Tennessee during the same time period, Kelley et al. observed that the clinical isolates clustered with isolates from cattle, chickens, water, and other birds [65], which is consistent with our findings. Using three different types of data (MLST, comparative genomic fingerprints, and 15 host segregating genes) for source attribution, Thepault et al. concluded that 31–63% of the British and French clinical cases of C. jejuni could be attributed to chicken while 22–55% were attributed to ruminants [24]. The percentage of C. jejuni clinical isolates that were in poultry-associated subclades in the current study (59.6%) is at the higher end of the poultry-attributable range they reported. However, the percentage in cattle-associated subclades (16.5%) is lower than the ruminant-attributable range.
Other researchers have found that some C. jejuni clonal complexes (CC) are associated with different livestock or environmental sources, while some are prevalent among multiple sources [25,65,66,67]. Of the 12 most prevalent CCs in the current study (those containing ≥50 isolates), seven were poultry-associated (ST-353, ST-48, ST-206, ST-464, ST-607, ST-443, and ST-52 CCs), two were cattle-associated (ST-61 and ST-42 CCs), and three were associated with both poultry and cattle (ST-21, ST-45, and ST-22 CCs). This was consistent with results based on isolates from Scotland reported by Sheppard et al., with the exceptions of ST-48 (multiple), ST-206 (cattle/sheep), ST-464 (N/A), and ST-52 (multiple) CCs [66]. This was also similar to results based on isolates from east TN described by Kelley et al. with the exception of ST-48 (cattle), ST-206 (N/A), ST-22 (N/A), and ST-52 (N/A) CCs [65]. Some of these differences may be due to geospatial variability in host adaptation. Our results further support the idea that some subpopulations within the greater clades may be host specialist genotypes, while other may be host generalist genotypes. However, CCs that commonly cause campylobacteriosis (e.g., ST-21, ST-45, ST-828 CCs) [25,66] are generalist lineages, which is challenging for genomic source attribution if the CCs alone were to be used for source attribution.

4.1.2. C. coli Associated with Poultry, Swine, and Bovine Sources

Overall, the non-clinical C. coli strains evaluated in this study were mostly of poultry origin (61.2%), followed by swine (29.0%) and cattle (8.6%). Additionally, we identified subclades within clade 1a that contained non-clinical isolates primarily associated with a single animal source, which suggests host adaptation. The poultry, swine, and cattle-associated subclades also contained 73 (74.5% of C. coli clinical isolates), six (6.1%), and nine (9.2%) clinical isolates, respectively, which gives an estimate of the potential relative contribution of each source to C. coli infection. Other researchers that examined the epidemiology and source attribution of C. coli have concluded that the primary source of human C. coli infection is poultry, but their findings differ on whether the secondary source is swine [25] or ruminants [33,64].
The Sheppard study cited in the previous section also included C. coli isolates; they discovered that the most common CC (ST-828 CC), was prevalent in all studied livestock/environmental sources (chicken, cattle, sheep, pigs, and turkey), but that ST-1150 CC was only found in turkey [66]. Our results differ in that the non-clinical isolates from clade 1b (consistent with ST-1150 CC) originate from chicken (80.0%), turkey (13.3%), and cattle (6.7%). In a different study by Sheppard et al., clade 1 isolates were mostly associated with poultry and ruminants, and isolates from clades 2 and 3 were mostly isolated from riparian sources (water fowl and environmental waters) [64]; our study contained no isolates of riparian origin. Differences between regions such as types of livestock produced, livestock production practices, or wildlife populations may lead to similar strains being prevalent in different livestock reservoirs. While the two regions evaluated in the present study, TN and PA, have similar poultry production inventories, TN has a higher beef cattle inventory, and PA has higher dairy cattle and hog inventories [68,69]. Interestingly, when the C. jejuni isolates from non-clinical sources are evaluated separately for each state, poultry and cattle isolates accounted for similar proportions (50.2 and 48.2%, respectively) in PA, but poultry isolates accounted for a much higher proportion (88.5%) than cattle (10.2%) in TN. A similar trend was also seen with C. coli with poultry isolates accounting for a higher proportion in TN (70.8%) than PA (55.6%). While these variations may be caused by the aforementioned factors, they could also be a result of different sampling practices between the two states. Cultural and dietary differences may also impact the relative foodborne or direct contact exposures to different livestock sources [70,71,72].
Our source attribution trends were reinforced by case-control studies examining the risk factors of C. jejuni and C. coli infections. Doorduyn et al. investigated risk factors for Campylobacter infections in the Netherlands utilizing questionnaire response and clinical observations to conduct a case-control analysis [73]. The primary risk factor for C. jejuni infection was the consumption of chicken (OR = 2.2, 95% CI: 1.5–3.45) with a population attributable risk (PAR) of 28%. Additionally, the calculated adjusted odds ratio (AOR) for both C. jejuni and C. coli infection was 2.4 (95% CI: 1.2–4.8) for poultry consumption. Furthermore, Rosner et al. determined that consumption of any chicken meat resulted in an AOR of 1.6 (95% CI: 1.2–2.0) and contact with poultry resulted in an AOR of 2.1 (95% CI: 1.4–3.0) for Campylobacter infection [25]. They concluded that consumption of pork had an AOR of 3.3 (95% CI: 1.0–11.0) and a population attributable fraction (PAF) of 66% for C. coli infections. This is consistent with the higher swine prevalence for C. coli in our investigation. Doorduyn et al. also calculated that the OR for beef consumption was 0.5 (95%CI: 0.3–0.9) for C. coli infections. This finding is consistent with our source attribution trends, where the proportion of clinical C. coli isolates that were part of cattle-associated subclades was low (9.2%) [25]. The findings of these two studies demonstrate that contact and consumption of poultry increases the odds of Campylobacter infection with both C. jejuni and C. coli, and that consuming pork increases the odds of C. coli infection. This is consistent with our findings that most of the C. jejuni and C. coli clinical isolates part of were poultry-associated subclades. However, while a substantial proportion of the non-clinical C. coli isolates in the present study were from swine sources, only a small proportion of clinical isolates were part of the swine-associated subclade.

4.1.3. Other Campylobacter spp.

While most isolates in our study were C. jejuni and C. coli, a small percentage were identified as C. lari, C. upsaliensis, and C. fetus. This is consistent with previous reports that most human campylobacteriosis infections are caused by C. jejuni and C. coli [7,8,9,10].

4.2. Higher Proportion of Clinical Campylobacter Isolates May Be Outbreak-Associated

The current PulseNet guideline for local Campylobacter cluster detection is three or more cases differing within 10 alleles by cgMLST, of which two differ within five alleles, and isolation dates for all cases should be within the past 60 days of detection. In this study, potential outbreak clusters were identified using a genetic distance threshold of 10 hqSNPs; note that only genetic relatedness was considered, so epidemiological information would also need to be considered to further support cluster designation or food vehicle. We identified 42 potential outbreak clusters for C. jejuni and one for C. coli. The C. jejuni clusters contained a total of 188 clinical isolates, which was 19.6% of the total C. jejuni clinical isolates. This is a much larger proportion of potential outbreak-associated C. jejuni than has been previously reported (0.5% of Campylobacter infections are estimated to be outbreak-associated) [13]. Other researchers have also found that when using WGS methods, the number of isolates that form clusters is higher than previously thought [74,75,76] including a 25% clustering proportion of Danish clinical isolates reported by Joensen et al. [77]. This may be due to the increased discriminatory power provided by WGS and the resulting analyses compared to previously used methods (e.g., PFGE). As more states begin routinely sequencing Campylobacter, there may be an increase in the number of clusters detected, which will likely affect epidemiological investigations and workload. Additionally, these genetic linkages between clinical isolates that were previously thought to be sporadic, especially those that span longer time periods, may also be indicative of continuous common source outbreaks; this information would be useful for both prevention of illnesses (e.g., developing and improving campylobacteriosis prevention strategies) and response to outbreaks (e.g., faster identification of source and implementing corrective actions).

5. Conclusions

Notable livestock source attribution trends were observed for C. jejuni and C. coli clades. These trends were consistent with most of those previously reported, however, they differed from those identified in some studies in different regions. Source trends were even more evident for subclades within the main phylogenetic clades. This suggests potential host adaptation, offers valuable information on the relative contribution of different food animal sources to campylobacteriosis in humans, and may provide insight for epidemiological investigations. Additionally, our findings highlight the need to consider source differences between and within these two species to develop more targeted risk assessments and more effective intervention measures. However, there may be significant regional differences based on geography and dominant types of livestock production. One limitation of this study is the representativeness of the dataset: likely biased sample availability (for both clinical and non-clinical isolates) and lack of isolates from other putative sources. Future investigations comparing more diverse Campylobacter populations that include isolates from a larger variety of sources (e.g., wild animals, pets, the environment) may result in different and/or more accurate source attribution trends. Additionally, we found that a fifth of C. jejuni isolates were part of potential outbreak clusters, which was much higher than the proportion previously reported to be outbreak-related. This indicates that as WGS is more routinely used for cluster detection, there may be an increase in the number of clusters detected.

Supplementary Materials

The following are available online at https://www.mdpi.com/article/10.3390/microorganisms9112300/s1, Figure S1: Neighbor-joining phylogenetic tree of C. jejuni isolates, Figure S2: Neighbor-joining phylogenetic tree of C. coli isolates, Table S1: Isolates used in study, Table S2: hqSNP pipeline metrics, Table S3: Putative clusters.

Author Contributions

Conceptualization, L.K.H., T.G.D., J.R.D. and J.K.; Methodology, L.K.H. and T.G.D.; Formal analysis, L.K.H.; Investigation, L.K.H., L.S.T., C.M., X.Q., R.S., R.Y. and I.N.; Resources, T.G.D., N.M.M., I.N., J.K., X.Q., R.S., K.N.G. and J.R.D.; Data curation, L.K.H., M.G., R.Y. and I.N.; Writing—original draft preparation, L.K.H. and W.E.A.; Writing—review and editing, L.K.H., T.G.D., W.E.A., R.Y., M.G., N.M.M., I.N., L.S.T., C.M., X.Q., R.S., K.N.G., J.R.D. and J.K.; Visualization, L.K.H.; Supervision, T.G.D.; Project administration, L.K.H. and T.G.D.; Funding acquisition, T.G.D., K.N.G. and J.R.D. All authors have read and agreed to the published version of the manuscript.

Funding

This research was funded by the Centers for Disease Control and Prevention (CDC) Epidemiology and Laboratory Capacity for Infectious Diseases (ELC) grant number 6 NU50CK000528-01; multistate project S1077 “Enhancing Microbial Food Safety by Risk Analysis”; and U.S. Food and Drug Administration grant number 1U01FD006253-01 to PADOH for collaboration in the National Antimicrobial Resistance Monitoring System (NARMS). JK was supported by the USDA National Institute of Food and Agriculture Hatch Appropriations under Project #PEN04646 and Accession #1015787.

Institutional Review Board Statement

Ethical review and approval were waived for this study, as no personally identifiable patient information was reported or linked with clinical isolates.

Informed Consent Statement

Patient consent was waived, as no personally identifiable patient information was reported or linked with clinical isolates.

Data Availability Statement

The data presented in this study are openly available in the NCBI databases under BioProject PRJNA755601.

Acknowledgments

We thank Veronica Brown for their assistance with DNA sequencing at the University of Tennessee Genomics Core.

Conflicts of Interest

The authors declare no conflict of interest. The funders had no role in the design of the study; in the collection, analyses, or interpretation of data; in the writing of the manuscript, or in the decision to publish the results.

References

  1. Tack, D.M.; Ray, L.; Griffin, P.M.; Cieslak, P.R.; Dunn, J.; Rissman, T.; Jervis, R.; Lathrop, S.; Muse, A.; Duwell, M. Preliminary incidence and trends of infections with pathogens transmitted commonly through food—Foodborne Diseases Active Surveillance Network, 10 US Sites, 2016–2019. Morb. Mortal. Wkly. Rep. 2020, 69, 509. [Google Scholar] [CrossRef]
  2. U.S. Department of Agriculture (USDA), E.R.S.E. Cost Estimates of Foodborne Illnesses. Available online: https://www.ers.usda.gov/data-products/cost-estimates-of-foodborne-illnesses/ (accessed on 16 August 2021).
  3. Centers for Disease Control and Prevention (CDC). Campylobacter (Campylobacteriosis): Questions and Answers. Available online: https://www.cdc.gov/campylobacter/faq.html (accessed on 28 January 2021).
  4. Keithlin, J.; Sargeant, J.; Thomas, M.K.; Fazil, A. Systematic review and meta-analysis of the proportion of Campylobacter cases that develop chronic sequelae. BMC Public Health 2014, 14, 1203. [Google Scholar] [CrossRef] [Green Version]
  5. Parte, A.C. LPSN—List of Prokaryotic names with Standing in Nomenclature (bacterio.net), 20 years on. Int. J. Syst. Evol. Microbiol. 2018, 68, 1825–1829. [Google Scholar] [CrossRef] [PubMed]
  6. LPSN. Genus Campylobacter. Available online: https://lpsn.dsmz.de/genus/campylobacter (accessed on 13 April 2021).
  7. Centers for Disease Control and Prevention (CDC). Foodborne Diseases Active Surveillance Network (FoodNet): FoodNet 2015 Surveillance Report (Final Data). Available online: https://www.cdc.gov/foodnet/pdfs/FoodNet-Annual-Report-2015-508c.pdf (accessed on 28 January 2021).
  8. Igwaran, A.; Okoh, A.I. Human campylobacteriosis: A public health concern of global importance. Heliyon 2019, 5, e02814. [Google Scholar] [CrossRef] [PubMed]
  9. Liu, F.; Ma, R.N.; Wang, Y.M.; Zhang, L. The Clinical Importance of Campylobacter concisus and Other Human Hosted Campylobacter Species. Front. Cell. Infect. Microbiol. 2018, 8, 22. [Google Scholar] [CrossRef] [PubMed] [Green Version]
  10. Costa, D.; Iraola, G. Pathogenomics of Emerging Campylobacter Species. Clin. Microbiol. Rev. 2019, 32, e00072-18. [Google Scholar] [CrossRef] [PubMed]
  11. Friedman, C.R.; Hoekstra, R.M.; Samuel, M.; Marcus, R.; Bender, J.; Shiferaw, B.; Reddy, S.; Ahuja, S.D.; Helfrick, D.L.; Hardnett, F.; et al. Risk Factors for Sporadic Campylobacter Infection in the United States: A Case-Control Study in FoodNet Sites. Clin. Infect. Dis. 2004, 38, S285–S296. [Google Scholar] [CrossRef] [Green Version]
  12. Centers for Disease Control and Prevention (CDC). National Outbreak Reporting System (NORS): NORS Dashboard. Available online: https://wwwn.cdc.gov/norsdashboard/ (accessed on 3 February 2021).
  13. Ebel, E.D.; Williams, M.S.; Cole, D.; Travis, C.C.; Klontz, K.C.; Golden, N.J.; Hoekstra, R.M. Comparing Characteristics of Sporadic and Outbreak-Associated Foodborne Illnesses, United States, 2004–2011. Emerg. Infect. Dis. 2016, 22, 1193–1200. [Google Scholar] [CrossRef] [Green Version]
  14. Ricotta, E.E.; Palmer, A.; Wymore, K.; Clogher, P.; Oosmanally, N.; Robinson, T.; Lathrop, S.; Karr, J.; Hatch, J.; Dunn, J.; et al. Epidemiology and antimicrobial resistance of international travel-associated Campylobacter infections in the United States, 2005–2011. Am. J. Public Health 2014, 104, e108–e114. [Google Scholar] [CrossRef]
  15. Cody, A.J.; Maiden, M.C.; Strachan, N.J.; McCarthy, N.D. A systematic review of source attribution of human campylobacteriosis using multilocus sequence typing. Eurosurveillance 2019, 24, 1800696. [Google Scholar] [CrossRef]
  16. Ravel, A.; Hurst, M.; Petrica, N.; David, J.; Mutschall, S.K.; Pintar, K.; Taboada, E.N.; Pollari, F. Source attribution of human campylobacteriosis at the point of exposure by combining comparative exposure assessment and subtype comparison based on comparative genomic fingerprinting. PLoS ONE 2017, 12, e0183790. [Google Scholar] [CrossRef] [Green Version]
  17. Kittl, S.; Heckel, G.; Korczak, B.M.; Kuhnert, P. Source Attribution of Human Campylobacter Isolates by MLST and Fla-Typing and Association of Genotypes with Quinolone Resistance. PLoS ONE 2013, 8, e81796. [Google Scholar] [CrossRef] [Green Version]
  18. Mughini-Gras, L.; Pijnacker, R.; Coipan, C.; Mulder, A.C.; Fernandes Veludo, A.; de Rijk, S.; van Hoek, A.H.A.M.; Buij, R.; Muskens, G.; Koene, M.; et al. Sources and transmission routes of campylobacteriosis: A combined analysis of genome and exposure data. J. Infect. 2021, 82, 216–226. [Google Scholar] [CrossRef] [PubMed]
  19. Lake, R.J.; Campbell, D.M.; Hathaway, S.C.; Ashmore, E.; Cressey, P.J.; Horn, B.J.; Pirikahu, S.; Sherwood, J.M.; Baker, M.G.; Shoemack, P.; et al. Source attributed case-control study of campylobacteriosis in New Zealand. Int. J. Infect. Dis. 2021, 103, 268–277. [Google Scholar] [CrossRef] [PubMed]
  20. Mossong, J.; Mughini-Gras, L.; Penny, C.; Devaux, A.; Olinger, C.; Losch, S.; Cauchie, H.-M.; van Pelt, W.; Ragimbeau, C. Human Campylobacteriosis in Luxembourg, 2010–2013: A Case-Control Study Combined with Multilocus Sequence Typing for Source Attribution and Risk Factor Analysis. Sci. Rep. 2016, 6, 20939. [Google Scholar] [CrossRef] [Green Version]
  21. Tyson, G.H.; Tate, H.P.; Abbott, J.; Tran, T.T.; Kabera, C.; Crarey, E.; Young, S.; McDermott, P.F.; Sprague, G.; Campbell, M.; et al. Molecular Subtyping and Source Attribution of Campylobacter Isolated from Food Animals. J. Food Prot. 2016, 79, 1891–1897. [Google Scholar] [CrossRef]
  22. Liao, S.-J.; Marshall, J.; Hazelton, M.L.; French, N.P. Extending statistical models for source attribution of zoonotic diseases: A study of campylobacteriosis. J. R. Soc. Interface 2019, 16, 20180534. [Google Scholar] [CrossRef] [Green Version]
  23. Thépault, A.; Méric, G.; Rivoal, K.; Pascoe, B.; Mageiros, L.; Touzain, F.; Rose, V.; Béven, V.; Chemaly, M.; Sheppard, S.K. Genome-Wide Identification of Host-Segregating Epidemiological Markers for Source Attribution in Campylobacter jejuni. Appl. Environ. Microbiol. 2017, 83, e03085-16. [Google Scholar] [CrossRef] [Green Version]
  24. Thépault, A.; Rose, V.; Quesne, S.; Poezevara, T.; Béven, V.; Hirchaud, E.; Touzain, F.; Lucas, P.; Méric, G.; Mageiros, L.; et al. Ruminant and chicken: Important sources of campylobacteriosis in France despite a variation of source attribution in 2009 and 2015. Sci. Rep. 2018, 8, 9305. [Google Scholar] [CrossRef]
  25. Rosner, B.M.; Schielke, A.; Didelot, X.; Kops, F.; Breidenbach, J.; Willrich, N.; Gölz, G.; Alter, T.; Stingl, K.; Josenhans, C.; et al. A combined case-control and molecular source attribution study of human Campylobacter infections in Germany, 2011–2014. Sci. Rep. 2017, 7, 5139. [Google Scholar] [CrossRef]
  26. Hsu, C.-H.; Harrison, L.; Mukherjee, S.; Strain, E.; McDermott, P.; Zhang, Q.; Zhao, S. Core Genome Multilocus Sequence Typing for Food Animal Source Attribution of Human Campylobacter jejuni Infections. Pathogens 2020, 9, 532. [Google Scholar] [CrossRef] [PubMed]
  27. Sheppard, S.K.; Colles, F.; Richardson, J.; Cody, A.J.; Elson, R.; Lawson, A.; Brick, G.; Meldrum, R.; Little, C.L.; Owen, R.J.; et al. Host Association of Campylobacter Genotypes Transcends Geographic Variation. Appl. Environ. Microbiol. 2010, 76, 5269–5277. [Google Scholar] [CrossRef] [PubMed] [Green Version]
  28. Berthenet, E.; Thépault, A.; Chemaly, M.; Rivoal, K.; Ducournau, A.; Buissonnière, A.; Bénéjat, L.; Bessède, E.; Mégraud, F.; Sheppard, S.K.; et al. Source attribution of Campylobacter jejuni shows variable importance of chicken and ruminants reservoirs in non-invasive and invasive French clinical isolates. Sci. Rep. 2019, 9, 8098. [Google Scholar] [CrossRef] [PubMed]
  29. Kovac, J.; Stessl, B.; Čadež, N.; Gruntar, I.; Cimerman, M.; Stingl, K.; Lušicky, M.; Ocepek, M.; Wagner, M.; Smole Možina, S. Population structure and attribution of human clinical Campylobacter jejuni isolates from central Europe to livestock and environmental sources. Zoonoses Public Health 2018, 65, 51–58. [Google Scholar] [CrossRef] [PubMed]
  30. Di Giannatale, E.; Garofolo, G.; Alessiani, A.; Di Donato, G.; Candeloro, L.; Vencia, W.; Decastelli, L.; Marotta, F. Tracing Back Clinical Campylobacter jejuni in the Northwest of Italy and Assessing Their Potential Source. Front. Microbiol. 2016, 7, 887. [Google Scholar] [CrossRef]
  31. Miller, W.G.; Englen, M.D.; Kathariou, S.; Wesley, I.V.; Wang, G.; Pittenger-Alley, L.; Siletz, R.M.; Muraoka, W.; Fedorka-Cray, P.J.; Mandrell, R.E. Identification of host-associated alleles by multilocus sequence typing of Campylobacter coli strains from food animals. Microbiology 2006, 152, 245–255. [Google Scholar] [CrossRef] [PubMed] [Green Version]
  32. Jehanne, Q.; Pascoe, B.; Bénéjat, L.; Ducournau, A.; Buissonnière, A.; Mourkas, E.; Mégraud, F.; Bessède, E.; Sheppard, S.K.; Lehours, P. Genome-Wide Identification of Host-Segregating Single-Nucleotide Polymorphisms for Source Attribution of Clinical Campylobacter coli Isolates. Appl. Environ. Microbiol. 2020, 86, e01787-20. [Google Scholar] [CrossRef]
  33. Nohra, A.; Grinberg, A.; Midwinter, A.C.; Marshall, J.C.; Collins-Emerson, J.M.; French, N.P. Molecular Epidemiology of Campylobacter coli Strains Isolated from Different Sources in New Zealand between 2005 and 2014. Appl. Environ. Microbiol. 2016, 82, 4363–4370. [Google Scholar] [CrossRef] [Green Version]
  34. Roux, F.; Sproston, E.; Rotariu, O.; MacRae, M.; Sheppard, S.K.; Bessell, P.; Smith-Palmer, A.; Cowden, J.; Maiden, M.C.J.; Forbes, K.J.; et al. Elucidating the Aetiology of Human Campylobacter coli Infections. PLoS ONE 2013, 8, e64504. [Google Scholar] [CrossRef] [Green Version]
  35. Harrison, L.; Mukherjee, S.; Hsu, C.-H.; Young, S.; Strain, E.; Zhang, Q.; Tillman, G.E.; Morales, C.; Haro, J.; Zhao, S. Core Genome MLST for Source Attribution of Campylobacter coli. Front. Microbiol. 2021, 12, 1936. [Google Scholar] [CrossRef]
  36. Centers for Disease Control and Prevention (CDC). Fast Facts about PulseNet. Available online: https://www.cdc.gov/pulsenet/about/fast-facts.html (accessed on 10 March 2021).
  37. Tolar, B.; Joseph, L.A.; Schroeder, M.N.; Stroika, S.; Ribot, E.M.; Hise, K.B.; Gerner-Smidt, P. An Overview of PulseNet USA Databases. Foodborne Pathog. Dis. 2019, 16, 457–462. [Google Scholar] [CrossRef] [PubMed] [Green Version]
  38. Ribot, E.M.; Freeman, M.; Hise, K.B.; Gerner-Smidt, P. PulseNet: Entering the Age of Next-Generation Sequencing. Foodborne Pathog. Dis. 2019, 16, 451–456. [Google Scholar] [CrossRef] [Green Version]
  39. Tong, S.; Ma, L.; Ronholm, J.; Hsiao, W.; Lu, X. Whole genome sequencing of Campylobacter in agri-food surveillance. Curr. Opin. Food Sci. 2021, 39, 130–139. [Google Scholar] [CrossRef]
  40. Denes, T.; den Bakker, H.C.; Tokman, J.I.; Guldimann, C.; Wiedmann, M. Selection and Characterization of Phage-Resistant Mutant Strains of Listeria monocytogenes Reveal Host Genes Linked to Phage Adsorption. Appl. Environ. Microbiol. 2015, 81, 4295–4305. [Google Scholar] [CrossRef] [PubMed] [Green Version]
  41. Bolger, A.M.; Lohse, M.; Usadel, B. Trimmomatic: A flexible trimmer for Illumina sequence data. Bioinformatics 2014, 30, 2114–2120. [Google Scholar] [CrossRef] [Green Version]
  42. Andrews, S.; Fast, Q.C. Available online: https://www.bioinformatics.babraham.ac.uk/projects/fastqc/ (accessed on 11 March 2021).
  43. Ewels, P.; Magnusson, M.; Lundin, S.; Käller, M. MultiQC: Summarize analysis results for multiple tools and samples in a single report. Bioinformatics 2016, 32, 3047–3048. [Google Scholar] [CrossRef] [Green Version]
  44. Bankevich, A.; Nurk, S.; Antipov, D.; Gurevich, A.A.; Dvorkin, M.; Kulikov, A.S.; Lesin, V.M.; Nikolenko, S.I.; Pham, S.; Prjibelski, A.D.; et al. SPAdes: A New Genome Assembly Algorithm and Its Applications to Single-Cell Sequencing. J. Comput. Biol. 2012, 19, 455–477. [Google Scholar] [CrossRef] [Green Version]
  45. Gurevich, A.; Saveliev, V.; Vyahhi, N.; Tesler, G. QUAST: Quality assessment tool for genome assemblies. Bioinformatics 2013, 29, 1072–1075. [Google Scholar] [CrossRef] [PubMed]
  46. Bushnell, B. Bbtools: A Suite of Fast, Multithreaded Bioinformatics Tools Designed for Analysis of DNA and RNA Sequence Data. Available online: https://jgi.doe.gov/data-and-tools/bbtools/ (accessed on 25 June 2021).
  47. Li, H.; Handsaker, B.; Wysoker, A.; Fennell, T.; Ruan, J.; Homer, N.; Marth, G.; Abecasis, G.; Durbin, R.; Genome Project Data Processing, S. The Sequence Alignment/Map format and SAMtools. Bioinformatics 2009, 25, 2078–2079. [Google Scholar] [CrossRef] [Green Version]
  48. Gardner, S.N.; Slezak, T.; Hall, B.G. kSNP3.0: SNP detection and phylogenetic analysis of genomes without genome alignment or reference genome. Bioinformatics 2015, 31, 2877–2878. [Google Scholar] [CrossRef] [Green Version]
  49. Jolley, K.A.; Bray, J.E.; Maiden, M.C.J. Open-access bacterial population genomics: BIGSdb software, the PubMLST.org website and their applications. Wellcome Open Res. 2018, 3, 124. [Google Scholar] [CrossRef]
  50. Dingle, K.E.; Colles, F.M.; Wareing, D.R.A.; Ure, R.; Fox, A.J.; Bolton, F.E.; Bootsma, H.J.; Willems, R.J.L.; Urwin, R.; Maiden, M.C.J. Multilocus Sequence Typing System for Campylobacter jejuni. J. Clin. Microbiol. 2001, 39, 14–23. [Google Scholar] [CrossRef] [PubMed] [Green Version]
  51. Miller, W.G.; On, S.L.W.; Wang, G.; Fontanoz, S.; Lastovica, A.J.; Mandrell, R.E. Extended Multilocus Sequence Typing System for Campylobacter coli, C. lari, C. upsaliensis, and C. helveticus. J. Clin. Microbiol. 2005, 43, 2315–2329. [Google Scholar] [CrossRef] [PubMed] [Green Version]
  52. Jolley, K.A.; Bliss, C.M.; Bennett, J.S.; Bratcher, H.B.; Brehony, C.; Colles, F.M.; Wimalarathna, H.; Harrison, O.B.; Sheppard, S.K.; Cody, A.J.; et al. Ribosomal multilocus sequence typing: Universal characterization of bacteria from domain to strain. Microbiology 2012, 158, 1005–1015. [Google Scholar] [CrossRef]
  53. Richter, M.; Rosselló-Móra, R.; Oliver Glöckner, F.; Peplies, J. JSpeciesWS: A web server for prokaryotic species circumscription based on pairwise genome comparison. Bioinformatics 2015, 32, 929–931. [Google Scholar] [CrossRef]
  54. Larsen, M.V.; Cosentino, S.; Lukjancenko, O.; Saputra, D.; Rasmussen, S.; Hasman, H.; Sicheritz-Pontén, T.; Aarestrup, F.M.; Ussery, D.W.; Lund, O.; et al. Benchmarking of Methods for Genomic Taxonomy. J. Clin. Microbiol. 2014, 52, 1529–1539. [Google Scholar] [CrossRef] [PubMed] [Green Version]
  55. Meier-Kolthoff, J.P.; Göker, M. TYGS is an automated high-throughput platform for state-of-the-art genome-based taxonomy. Nat. Commun. 2019, 10, 2182. [Google Scholar] [CrossRef]
  56. Kumar, S.; Stecher, G.; Li, M.; Knyaz, C.; Tamura, K. MEGA X: Molecular Evolutionary Genetics Analysis across Computing Platforms. Mol. Biol. Evol. 2018, 35, 1547–1549. [Google Scholar] [CrossRef] [PubMed]
  57. Nei, M.; Kumar, S. Molecular Evolution and Phylogenetics; Oxford University Press: Oxford, UK, 2000. [Google Scholar]
  58. Saitou, N.; Nei, M. The neighbor-joining method: A new method for reconstructing phylogenetic trees. Mol. Biol. Evol. 1987, 4, 406–425. [Google Scholar] [CrossRef]
  59. Felsenstein, J. Confidence Limits on Phylogenies: An Approach using the bootstrap. Evolution 1985, 39, 783–791. [Google Scholar] [CrossRef]
  60. Letunic, I.; Bork, P. Interactive Tree Of Life (iTOL) v5: An online tool for phylogenetic tree display and annotation. Nucleic Acids Res. 2021, 49, W293–W296. [Google Scholar] [CrossRef]
  61. Davis, S.; Pettengill, J.B.; Luo, Y.; Payne, J.; Shpuntoff, A.; Rand, H.; Strain, E. CFSAN SNP Pipeline: An automated method for constructing SNP matrices from next-generation sequence data. PeerJ Comput. Sci. 2015, 1, e20. [Google Scholar] [CrossRef] [Green Version]
  62. Sheppard, S.K.; Didelot, X.; Jolley, K.A.; Darling, A.E.; Pascoe, B.; Meric, G.; Kelly, D.J.; Cody, A.; Colles, F.M.; Strachan, N.J.C.; et al. Progressive genome-wide introgression in agricultural Campylobacter coli. Mol. Ecol. 2013, 22, 1051–1064. [Google Scholar] [CrossRef] [Green Version]
  63. Skarp-de Haan, C.P.A.; Culebro, A.; Schott, T.; Revez, J.; Schweda, E.K.H.; Hänninen, M.-L.; Rossi, M. Comparative genomics of unintrogressed Campylobacter coli clades 2 and 3. BMC Genom. 2014, 15, 129. [Google Scholar] [CrossRef] [PubMed] [Green Version]
  64. Sheppard, S.K.; Dallas, J.F.; Wilson, D.J.; Strachan, N.J.C.; McCarthy, N.D.; Jolley, K.A.; Colles, F.M.; Rotariu, O.; Ogden, I.D.; Forbes, K.J.; et al. Evolution of an Agriculture-Associated Disease Causing Campylobacter coli Clade: Evidence from National Surveillance Data in Scotland. PLoS ONE 2010, 5, e15708. [Google Scholar] [CrossRef] [Green Version]
  65. Kelley, B.R.; Ellis, J.C.; Large, A.; Schneider, L.G.; Jacobson, D.; Johnson, J.G. Whole-Genome Sequencing and Bioinformatic Analysis of Environmental, Agricultural, and Human Campylobacter jejuni Isolates From East Tennessee. Front. Microbiol. 2020, 11, 571064. [Google Scholar] [CrossRef]
  66. Sheppard, S.K.; Dallas, J.F.; MacRae, M.; McCarthy, N.D.; Sproston, E.L.; Gormley, F.J.; Strachan, N.J.C.; Ogden, I.D.; Maiden, M.C.J.; Forbes, K.J. Campylobacter genotypes from food animals, environmental sources and clinical disease in Scotland 2005/6. Int. J. Food Microbiol. 2009, 134, 96–103. [Google Scholar] [CrossRef] [Green Version]
  67. Sheppard, S.K.; Cheng, L.; Méric, G.; de Haan, C.P.A.; Llarena, A.-K.; Marttinen, P.; Vidal, A.; Ridley, A.; Clifton-Hadley, F.; Connor, T.R.; et al. Cryptic ecology among host generalist Campylobacter jejuni in domestic animals. Mol. Ecol. 2014, 23, 2442–2451. [Google Scholar] [CrossRef] [Green Version]
  68. USDA National Agricultural Statistics Service. 2020 State Agriculture Overview: Tennessee. Available online: https://www.nass.usda.gov/Quick_Stats/Ag_Overview/stateOverview.php?state=TENNESSEE (accessed on 25 May 2021).
  69. USDA National Agricultural Statistics Service. 2020 State Agriculture Overview: Pennsylvania. Available online: https://www.nass.usda.gov/Quick_Stats/Ag_Overview/stateOverview.php?state=PENNSYLVANIA (accessed on 25 May 2021).
  70. Käferstein, F.K. Actions to reverse the upward curve of foodborne illness. Food Control. 2003, 14, 101–109. [Google Scholar] [CrossRef]
  71. Majowicz, S.E.; Meyer, S.B.; Kirkpatrick, S.I.; Graham, J.L.; Shaikh, A.; Elliott, S.J.; Minaker, L.M.; Scott, S.; Laird, B. Food, health, and complexity: Towards a conceptual understanding to guide collaborative public health action. BMC Public Health 2016, 16, 487. [Google Scholar] [CrossRef]
  72. Pires, S.M.; Thomsen, S.T.; Nauta, M.; Poulsen, M.; Jakobsen, L.S. Food Safety Implications of Transitions Toward Sustainable Healthy Diets. Food Nutr. Bull. 2020, 41, 104S–124S. [Google Scholar] [CrossRef] [PubMed]
  73. Doorduyn, Y.; Van Den Brandhof, W.E.; Van Duynhoven, Y.T.H.P.; Breukink, B.J.; Wagenaar, J.A.; Van Pelt, W. Risk factors for indigenous Campylobacter jejuni and Campylobacter coli infections in The Netherlands: A case-control study. Epidemiol. Infect. 2010, 138, 1391–1404. [Google Scholar] [CrossRef] [PubMed] [Green Version]
  74. Brehony, C.; Lanigan, D.; Carroll, A.; McNamara, E. Establishment of sentinel surveillance of human clinical campylobacteriosis in Ireland. Zoonoses Public Health 2021, 68, 121–130. [Google Scholar] [CrossRef] [PubMed]
  75. Kovanen, S.M.; Kivistö, R.I.; Rossi, M.; Schott, T.; Kärkkäinen, U.-M.; Tuuminen, T.; Uksila, J.; Rautelin, H.; Hänninen, M.-L. Multilocus Sequence Typing (MLST) and Whole-Genome MLST of Campylobacter jejuni Isolates from Human Infections in Three Districts during a Seasonal Peak in Finland. J. Clin. Microbiol. 2014, 52, 4147–4154. [Google Scholar] [CrossRef] [Green Version]
  76. Llarena, A.-K.; Taboada, E.; Rossi, M. Whole-Genome Sequencing in Epidemiology of Campylobacter jejuni Infections. J. Clin. Microbiol. 2017, 55, 1269–1275. [Google Scholar] [CrossRef] [Green Version]
  77. Joensen, K.G.; Kuhn, K.G.; Müller, L.; Björkman, J.T.; Torpdahl, M.; Engberg, J.; Holt, H.M.; Nielsen, H.L.; Petersen, A.M.; Ethelberg, S.; et al. Whole-genome sequencing of Campylobacter jejuni isolated from Danish routine human stool samples reveals surprising degree of clustering. Clin. Microbiol. Infect. 2018, 24, 201.e205–201.e208. [Google Scholar] [CrossRef]
Figure 1. Neighbor-joining phylogenetic tree of C. jejuni isolates. The optimal tree with the sum of branch length equal to 37,842.9 is shown. The tree is drawn to scale, with branch lengths representing core SNP distances. There were a total of 6132 core SNP positions in the final dataset. Symbols at the end of tree leaves indicate isolation location and source (see legend). Figure S1 is an alternate rendering of the tree with bootstrap values and additional information.
Microorganisms 09 02300 g001
Figure 2. Neighbor-joining phylogenetic tree of C. coli isolates. The optimal tree with the sum of branch length equal to 73,485.2 is shown. The tree is drawn to scale, with branch lengths representing core SNP distances. There were a total of 11,628 core SNP positions in the final dataset. Symbols at the end of tree leaves indicate isolation location and source (see legend). Figure S2 is an alternate rendering of the tree with bootstrap values and additional information.
Microorganisms 09 02300 g002
Table 1. Summary of isolates used in the present study and statistics by species and clade.
Species, Clade, SubcladeClonal ComplexesNo. of Isolates (%)
StateSource
PATNClinicalNon-Clinical
PoultryCattleSwineOther
C. jejuni 2132 (69.2%)887 (41.6%)1245 (58.4%)960 (45.0%)1172 (55.0%)735 (62.7%)419 (35.8%)15 (1.3%)3 (0.3%)
1ST-45, ST-403, ST-508, ST-179, ST-283, ST-177, ST-682, ST-4125184 (33.5%)167 (66.5%)169 (67.3%)82 (32.%)39 (47.6%)40 (48.8%)3 (3.7%)0
2-4119 (46.3%)22 (53.7%)21 (51.2%)20 (48.8%)017 (85.0%)3
(15.0%)
0
3ST-21, ST-353, ST-48, ST-206, ST-61, ST-42, ST-464, ST-607, ST-22, ST-443, ST-52, ST-257, ST-354, ST-460, ST-49,
ST-658, ST-1034,
ST-1287, ST-1332,
ST-446, ST-692
1840784 (42.6%)1056 (57.4%)770 (41.8%)1070 (58.2%)696 (65.0%)362 (33.8%)9 (0.8%)3 (0.3%)
C. coli 921 (29.9%)529 (57.4%)392 (42.6%)98 (10.6%)823 (89.4%)504 (61.2%)71 (8.6%)239 (29.0%)9 (1.1%)
1 916529 (57.8%)387 (42.2%)96 (10.5%)820 (89.5%)501 (61.1%)71 (8.7%)239 (29.1%)9 (1.1%)
1aST-828897516 (57.5%)381 (42.5%)93 (10.4%)804 (89.6%)486 (60.4%)70 (8.7%)239 (29.7%)9 (1.1%)
1bST-11501611 (68.8%)5 (31.3%)1 (6.3%)15 (93.8%)14 (93.3%)1 (6.7%)00
1c-32 (66.7%)1 (33.3%)2 (66.7%)1 (33.3%)1 (100.0%)000
3-505 (100.0%)2 (40.0%)3 (60.0%)3 (100.0%)000
C. lariST-2113 (0.4%)10 (76.9%)3 (23.1%)3 (23.1%)10 (76.9%)6 (60.0%)4 (40.0%)00
C. upsaliensis-10 (0.3%)1 (10.0%)9 (90.0%)9 (90.0%)1 (10.0%)0001 (100.0%)
C. fetusST-3, ST-6, ST-114 (0.1%)04 (100.0%)4 (100.0%)00000
Total 30801427 (46.3%)1653 (53.7%)1074 (34.9%)2006 (65.1%)1244 (62.0%)494 (24.6%)254 (12.7%)10 (0.5%)
Table 2. Summary of potential outbreak clusters detected using a hqSNP distance threshold of 10 hqSNPs. Complete data are available in Table S3.
No. Potential Clusters
SpeciesTotalPA-OnlyTN-OnlyRelated to Non-Clinical Isolates
C. jejuni421338
C. coli1011
Publisher’s Note: MDPI stays neutral with regard to jurisdictional claims in published maps and institutional affiliations.

