Article

Ambient Air Pollution Shapes Bacterial and Fungal Ivy Leaf Communities

1
Center for Environmental Sciences, Environmental Biology, Hasselt University, 3590 Diepenbeek, Belgium
2
Institute for Materials Research, Analytical and Circular Chemistry, Hasselt University, 3590 Diepenbeek, Belgium
3
TRUGen Applied Genomics Laboratory, Department of Biological Sciences, Thompson Rivers University, Kamloops, BC V2C 0C8, Canada
4
Department of Plant Physiology and Biophysics, Faculty of Biology and Biotechnology, Maria Curie–Skłodowska University, 20-400 Lublin, Poland
*
Author to whom correspondence should be addressed.
Microorganisms 2021, 9(10), 2088; https://doi.org/10.3390/microorganisms9102088
Submission received: 17 September 2021 / Revised: 27 September 2021 / Accepted: 1 October 2021 / Published: 3 October 2021
(This article belongs to the Section Environmental Microbiology)

Abstract

:
Ambient air pollution exerts deleterious effects on our environment. Continuously exposed to the atmosphere, diverse communities of microorganisms thrive on leaf surfaces, the phylloplane. The composition of these communities is dynamic, responding to many environmental factors including ambient air pollution. In this field study, over a 2 year period, we sampled Hedera helix (ivy) leaves at six locations exposed to different ambient air pollution conditions. Daily, we monitored ambient black carbon (BC), PM2.5, PM10, nitrogen dioxide, and ozone concentrations and found that ambient air pollution led to a 2–7-fold BC increase on leaves, the phylloplane BC load. Our results further indicated that the phylloplane BC load correlates with the diversity of bacterial and fungal leaf communities, impacting diversity more than seasonal effects. The bacterial genera Novosphingobium, Hymenobacter, and Methylorubrum, and the fungal genus Ampelomyces were indicators for communities exposed to the highest phylloplane BC load. Parallel to this, we present one fungal and two bacterial phylloplane strains isolated from an air-polluted environment able to degrade benzene, toluene, and/or xylene, including a genomics-based description of the degradation pathways involved. The findings of this study suggest that ambient air pollution shapes microbial leaf communities, by affecting diversity and supporting members able to degrade airborne pollutants.

1. Introduction

Ninety-one percent of the world’s human population is currently living in places where air pollution parameters exceed World Health Organization (WHO) guideline limits [1]. It is most pronounced in high-traffic environments such as urban areas where substantial quantities of airborne pollutants, including particulate matter (PM) and volatile organic compounds (VOCs), are generated [2]. Black carbon (BC) is a ubiquitous component of ambient PM that is produced during incomplete combustion associated with biomass burning, transportation, residential activities, and industry [3], and it has a number of adverse public health and environmental impacts [4]. For example, considerable damage is caused to plants as a result of PM/BC deposition, leading to inhibition of photosynthetic activities and protein synthesis, as well as increased susceptibility to injuries caused by microorganisms and insects [5]. VOCs can be defined as organic compounds having a vapor pressure of more than or equal to 0.01 kPa at 20 °C, or having a corresponding volatility; this includes most polycyclic aromatic hydrocarbons containing up to four aromatic rings. Important fossil fuel-related VOCs include benzene, toluene, and xylene (BTX), 1,3-butadiene, ethylbenzene, styrene, naphthalene, and phenanthrene [6,7]. In addition to their role in ozone formation, these VOCs are reported to induce both short- and long-term adverse health effects including asthma, allergies, and cancer [8,9].
Always in contact with the surrounding air, abundant and diverse communities of microorganisms naturally exist on the surface of above-ground parts of plants, known as the phyllosphere [10]. The phyllosphere can be subdivided into the caulosphere (stems), phylloplane (leaves), anthosphere (flowers), and carposphere (fruits). With an estimated global leaf surface area of 1,017,260,200 km2 [11], the phylloplane is one of the most prevalent microbial habitats on earth, with bacteria being by far the most abundant and persistent organisms, at typical densities of 106–107 cells·cm−2 [12]. Most studies on the identity of organisms in the phyllosphere have focused on bacteria and, to a lesser extent, fungi, which are typically less numerous [10]. The composition of these microbial communities is dynamic, responding to environmental factors, both biotic and abiotic, such as leaf age, the copresence of other (micro)organisms, ultraviolet (UV) light exposure, fertilization, and water limitation [13].
It is evident that ambient air pollution not only poses hazards to humans, animals, and plants, but also influences phylloplane microbial communities, as leaf surfaces are continuously exposed to the atmosphere. However, to date, there has been little research done on the extent and nature of this influence. Here, we deployed metabarcoding to study the effects of ambient air pollution in the field on bacterial and fungal communities in the phylloplane of Hedera helix (ivy), an evergreen plant known for its hardiness and climbing ability [14]. H. helix has a widespread distribution in the northern hemisphere in diverse environments such as private gardens, city centers, municipal parks, nature reserves, and forests, and it shows a high capacity to take up and filter pollutants out of the air [15]. Over eight sampling events during a 2 year period, we sampled 4320 H. helix leaves at six locations exposed to different ambient air pollution conditions. We characterized these locations daily by monitoring ambient BC, PM2.5, PM10, nitrogen dioxide, and ozone concentrations. Furthermore, we measured phylloplane BC load and carried out extensive biennial metabarcoding surveys. In addition, we here present three phylloplane microorganisms isolated from an air-polluted environment that are able to degrade benzene, toluene, and xylene, including a genomics-based description of the degradation pathways involved.

2. Materials and Methods

2.1. Sampling Site Characteristics

We selected six sampling sites around Hasselt, Belgium harboring stable and healthy populations of H. helix plants. WGS84 coordinates were as follows: 50.936546, 5.317226 (HGa); 50.917344, 5.326918 (HGb); 50.934242, 5.337944 (HKa); 50.928680, 5.332674 (HKb); 50.940104, 5.438675 (DM); 50.921694, 5.433951 (DW). HGa and HGb are located on the outer city ring road of Hasselt, HKa and HKb are located on the inner city ring road, and DM and DW are located in two close-by nature reserves (Figure S1). The soil type at the six sites was characterized to be sandy loam with an average pH of 6.46 ± 0.1 (HGa: 6.41 ± 0.02, HGb: 6.38 ± 0.03, HKa: 6.61 ± 0.04, HKb: 6.56 ± 0.02, DM: 6.42 ± 0.01, DW: 6.37 ± 0.02) and average soil organic matter content of 962 ± 131 mg·kg−1 (HGa: 766 ± 61 mg·kg−1, HGb: 1022 ± 45 mg·kg−1, HKa: 914 ± 64 mg·kg−1, HKb: 932 ± 28 mg·kg−1, DM: 1169 ± 35 mg·kg−1, DW: 965 ± 26 mg·kg−1). Permission for sampling was obtained, and it was performed in accordance with institutional and international guidelines. Black carbon (BC), PM2.5, PM10, nitrogen dioxide, and ozone concentrations were monitored daily by the Belgian Interregional Environment Agency from 1 August 2017 until 31 August 2019 (n = 761) and calculated for every sampling site using the RIO–IFDM model [16]. Briefly, air pollution data of the official Belgian fixed monitoring network are interpolated using land-cover data from satellite images from the CORINE dataset [17], in combination with a dispersion model [18]. This model provides interpolated air pollution values from the Belgian telemetric air quality networks, “point” sources such as industries, and “line” sources such as highways, on a dense, irregular receptor point grid with a max cell size of 25 × 25 m. The performance of the overall model was assessed by a leave-one-out cross-validation; the validation statistics explained more than 74% of the spatiotemporal variability for BC, 80% for PM2.5 and PM10, 78% for nitrogen dioxide, and 65% for ozone [19]. Differences in mean air pollution parameter values between sampling sites were analyzed by performing analysis of variance (ANOVA) and multiple t-tests with Bonferroni correction. Temperature and precipitation were also monitored daily for this period by an automated weather station owned by the Royal Meteorological Institute of Belgium (WGS84 coordinates: 50.911774, 5.406425).

2.2. Collection and Preparation of Phylloplane Samples

Leaves (n = 3840; 80 per site, per sampling round) from H. helix plants ranging in age from 3–6 months were collected during eight sampling events, one per season, over the course of two seasonal cycles (years): 14 November 2017 (I); 5 February 2018 (II); 14 May 2018 (III); 1 August 2018 (IV); 5 November 2018 (V); 19 February 2019 (VI); 21 May 2019 (VII); 23 August 2019 (VIII). Plant leaves were identified as specimens belonging to H. helix by the first author; voucher specimens are available from Hasselt University. Leaves were cut from the plants at shoulder height using sterile forceps, put into sterile tubes (five leaves per tube) filled with phosphate buffer (50 mM Na2HPO4∙7H2O, 50 mM NaH2PO4∙H2O, 0.8 mM Tween-80, pH 7.0), and immediately transferred to the laboratory. Leaf weight was determined gravimetrically, and microbial cells were detached from the leaf surface by sonication (100 W, 42 kHz, 3 min), followed by shaking on an orbital shaker (240 rpm, 30 min). Next, resulting leaf wash suspensions (16 per site, per sampling round) were centrifuged (3000× g, 15 min), and the resuspended pellets were pooled into four samples per site, per sampling round, resulting in a total of 192 samples. Samples were immediately stored at −80 °C until DNA isolation.
An additional set of H. helix leaves (n = 480; 10 per site, per sampling round) was collected as previously described, except the resuspended pellets were not pooled, resulting in a total of 96 samples (two per site, per sampling round). Leaf wash suspensions were immediately stored at −20 °C until BC detection.

2.3. Black Carbon Detection in Leaf Wash Suspensions

BC particles present in leaf wash suspensions (n = 96) were detected using a specific and sensitive detection technique based on the non-incandescence-related white light (WL) generation of the particles under femtosecond-pulsed illumination, as previously described [20]. The day before measuring, leaf wash suspensions were transferred from −20 °C to room temperature. Z-stacks of the samples were collected using a Zeiss LSM 880 (Carl Zeiss, Oberkochen, Germany) equipped with a femtosecond-pulsed laser (810 nm, 150 fs, 80 MHz, Mai Tai DeepSee, Spectra–Physics, Andover, MA, USA) tuned to a central wavelength of 810 nm using a plan-apochromat 20× (0.8 NA) objective (Carl Zeiss, Oberkochen, Germany). Two-photon-induced WL emission of BC particles was acquired in the non-descanned mode after spectral separation and emission filtering using 400–410 nm and 450–650 nm bandpass filters. Each sample was aliquoted at 20 µL on a glass coverslip, and z-stacks were collected from the bottom up to 35 µm in the droplet. The resulting z-stacks had an imaging volume of 425.1 × 425.1 × 35.1 μm3 and a pixel dwell time of 1.54 µs. In total, 175 images per perfusate sample were obtained by recording z-stacks with a 1 µm slice thickness at five different locations in the aliquot (n = 480). The images were acquired using ZEN Black 2.0 software (Carl Zeiss, Oberkochen, Germany).
The number of BC particles in the obtained z-stacks was determined using a custom Matlab program (Matlab 2010, MathWorks, Eindhoven, The Netherlands). First, a peak-searching algorithm counted pixels above a threshold value. Here, threshold values of 0.1% lower than the highest pixel intensity value of the narrow second-harmonic generation channel (405/10) and two-photon-excited autofluorescence channel (550/200) were chosen. Next, the thresholded pixels of both images were compared, and only the overlapping ones were counted as BC particles. The average number of particles detected in the washing sample z-stacks was normalized to the imaging volume, and the results were expressed as the number of detected BC particles per g leaf material. Differences in mean values between sampling sites were analyzed by performing ANOVA and multiple t-tests with Benjamini–Hochberg correction.

2.4. Metabarcoding of the Bacterial and Fungal Phylloplane

Leaf wash suspensions (n = 192) were centrifuged (10,000× g, 10 min, 4 °C), and genomic DNA was isolated using a NucleoSpin Soil kit (Macherey–Nagel, Düren, Germany). Initially, two different sequencing libraries were prepared, one for bacterial and one for fungal phylloplane metabarcoding. The bacterial sequencing library was constructed by PCR amplification of the V3–V4 hypervariable region of the 16S rRNA gene using 341F (5′–TCGTCGGCAGCGTCAGATGTGTATAAGAGACAGCCTACGGGNGGCWGCAG–3′) and 785R (5′–GTCTCGTGGGCTCGGAGATGTGTATAAGAGACAGGACTACHVGGGTATCTAATCC–3′) primers [21] containing Nextera (Illumina, San Diego, CA, USA) transposase adapters (underlined). For fungal sequencing library construction, the hypervariable internal transcribed spacer 2 (ITS2) region between the 5.8S and 28S rRNA genes was PCR-amplified using gITS86F (5′–TCGTCGGCAGCGTCAGATGTGTATAAGAGACAGGTGARTCATCGARTCTTTGAA–3′) and ITS4R (5′–GTCTCGTGGGCTCGGAGATGTGTATAAGAGACAGTCCTCCGCTTATTGATATGC–3′) primers [22] including the same adapters. The 25 µL PCR reaction consisted of 1× reaction buffer with 1.8 mM MgCl2, 0.2 µM dNTP mix, 0.05 U·µL−1 enzyme blend (FastStart High Fidelity PCR System, Roche, Basel, Switzerland), 0.2 µM of each primer, 5% DMSO, and 1 µL of DNA template. Amplification conditions were as follows: 95 °C for 2 min; 25 cycles of 95 °C for 30 s, 54/58 °C (bacterial/fungal sequencing library) for 30 s, 72 °C for 1 min; held at 72 °C for 6 min. PCR products were purified using AMPure XP beads (Beckman Coulter, Brea, CA, USA) and subsequently indexed (n = 384) using the Nextera XT index kit (Illumina, San Diego, CA, USA). The 25 µL index PCR reaction consisted of 1× reaction buffer with 1.8 mM MgCl2, 0.2 µM dNTP mix, 0.05 U·µL−1 enzyme blend (FastStart High Fidelity PCR System, Roche, Basel, Switzerland), 0.2 µM of each index primer, and 1 µL of purified PCR product. Amplification conditions were as follows: 95 °C for 2 min; 14 cycles of 95 °C for 30 s, 55 °C for 30 s, 72 °C for 1 min; held at 72 °C for 6 min. After another round of purification, the DNA concentration of every indexed sample was quantified with a Qubit dsDNA HS assay kit and the Qubit 2.0 fluorometer (Thermo Fisher Scientific, Waltham, MA, USA) prior to equimolar pooling of the samples. Correct amplicon size and integrity were checked on an Agilent 2100 Bioanalyzer system (Agilent Technologies, Santa Clara, CA, USA), followed by sequencing using a MiSeq Reagent Kit v3 on a MiSeq system (Illumina, San Diego, CA, USA) at Hasselt University, Belgium. When preparing the sequencing libraries, a mock community containing eight bacterial and two fungal strains was included to assess sequencing biases, errors, and other artefacts (ZymoBIOMICS Microbial Community DNA Standard, Zymo Research, Irvine, CA, USA).

2.5. Analysis of Sequencing Data

Demultiplexed metabarcoding data were received in FASTQ format with all additional nucleotides removed except the 341F/785R (bacteria) or gITS86F/ITS4R (fungi) primers, and they were further processed with DADA2 1.18.0 [23]. Primer sequences were removed using cutadapt 2.1 [24], ShortRead 1.50.0 [25], and Biostrings 2.60.1 (R package). Forward reads were quality-filtered by truncation to 260/230 bp (bacteria/fungi) and reverse reads were quality-filtered by truncation to 190/160 bp, with maxN = 0 (max number of Ns) and maxEE = 1 (max number of expected errors). Default DADA2 parameter settings were used for error model learning, dereplication, amplicon sequence variant (ASV) inference, merging of forward and reverse reads, and chimera removal. Taxonomy was assigned to each resulting ASV with IDTAXA [26] using the RDP v18 16S rRNA [27] or Warcup v2 ITS [28] training set. ASV tables with assigned taxonomic entities were imported into phyloseq 1.36.0 [29], chloroplast sequences were discarded, and samples with a read count of less than 500 were removed, resulting in a dataset of 190/192 (bacteria/fungi) samples. Intra-sample (alpha) diversity was assessed using ASV observations and by calculating Shannon diversity indices, and rarefaction analyses were performed with ranacapa 0.1.0 [30]. Differences in alpha diversity mean values were analyzed by performing ANOVA and multiple t-tests with Benjamini–Hochberg correction. Before inter-sample (beta) diversity was measured, counts in every sample were scaled by S ( x ) = log 10 ( x + 1 ) and normalized to even sampling depth by N ( x ) = x i = 1 n x   10 6 , where n = 190/192 (bacteria/fungi). Principal coordinate analysis (PCoA) and nonmetric multidimensional scaling (NMDS) and was performed on Bray–Curtis dissimilarity matrices, and different outcomes were tested by geometric partitioning of variation with analysis of similarities (ANOSIM) and permutational multivariate analysis of variance (PERMANOVA), using vegan 2.5–7 (R package). Differentially abundant taxa between designated categories were identified by linear discriminative analysis (LDA) with effect size [31], where the Kruskal–Wallis test was used to detect taxa with significant (p < 0.05) differential abundance between the indicated categories. Next, LDA was used to estimate the effect size of each differentially abundant taxon; only LDA log10 scores ≥2 were considered. All mentioned data handling, statistics, and creation of plots (ggplot2 3.3.5, R package) were done within R 4.1.0 [32].

2.6. Benzene, Toluene, and Xylene Degradation by Phylloplane Isolates

First, we screened a collection (n = 300) of H. helix phylloplane isolates for their potential to metabolize diesel fuel (DF). Individual cultures were grown for 24 h in LB medium [33] at 30 °C on a shaker (150 rpm) until a culture density (OD600 nm) was reached between 0.8 and 1.2, pelleted by centrifugation, washed three times, and resuspended in 0.01 M phosphate-buffered saline (PBS). Culture suspensions were left overnight at 30 °C on a shaker (150 rpm). The next day, 80 µL of the suspensions were transferred to 750 µL of Bushnell–Haas (BH) medium [34] with the addition of 50 µL of filter-sterilized 100 µg·mL−1 2,6-dichlorophenolindophenol (DCPIP) and 5 µL of polytetrafluoroethylene (PTFE) filter-sterilized 0.45 µM DF as the sole carbon source [35]. After incubation in the dark for 5 days at 30 °C on a shaker (150 rpm), suspensions showing a visible change from blue to colorless (due to reduction of DCPIP, indicating respiration) were evaluated as positive for DF metabolization. The first part (n = 200) of this collection containing isolates sampled from HGa, HKb, DM, and DW was previously described [36] and resulted in two DF metabolizers [37,38], both isolated from HKb. The second part (n = 100), comprising isolates sampled only from HKb (isolated in the same way as described before [36], but using only LB medium), was screened and resulted in another four DF metabolizers. For long-term storage, isolates were flash-frozen in a solution of 30% (v/v) glycerol and 0.15 M NaCl, and stored at −45 °C.
Our screening effort resulted in six DF metabolizers which were further analyzed for their potential to degrade benzene, toluene, and xylene (BTX) using headspace gas chromatography–mass spectrometry (GC–MS). Individual cultures were grown for 24 h in LB medium at 30 °C on a shaker (150 rpm) until a culture density (OD600 nm) was reached between 0.8 and 1.2, pelleted by centrifugation, washed three times, and resuspended with BH medium. Using 20 mL headspace GC–MS vials, benzene, toluene, or ortho-, meta-, para-xylene was added to one series of BH medium and one series of BH medium with additional macronutrients (0.5 g·L−1 yeast extract, 0.5 g·L−1 tryptone, and 0.5 g·L−1 d-glucose) resulting in a final concentration of 20 mg·L−1 benzene, toluene, or xylene in 8 mL of medium including 800 µL of bacterial suspension. Vials were incubated in the dark for 10 days at 30 °C on a shaker (100 rpm). With regard to GC–MS analysis, samples were incubated at 80 °C for 20 min, and 1 mL of the headspace was injected into a TRACE 1310 gas chromatograph coupled to an ISQ single quadrupole GC–MS system (Thermo Fisher Scientific, Waltham, MA, USA).

2.7. Genome Sequencing and Analysis

We sequenced the genomes of two bacteria and one yeast that were able to degrade benzene, toluene, and/or xylene. Individual cultures were grown for 24 h in LB medium at 30 °C on a shaker (150 rpm) and centrifuged (10,000× g, 3 min); then, genomic DNA was isolated from the pellets using the DNeasy Blood & Tissue kit (QIAGEN, Hilden, Germany). The DNA concentration was quantified with a Qubit dsDNA HS assay kit and the Qubit 2.0 fluorometer (Thermo Fisher Scientific, Waltham, MA, USA). The Nextera DNA Flex library preparation kit along with the Nextera DNA CD indices (Illumina, San Diego, CA, USA) were used to tagment the DNA libraries for sequencing following the manufacturer’s instructions. Tagmentation was performed with 100 ng of genomic DNA, and amplification conditions were as follows: 68 °C for 3 min; 98 °C for 3 min; five cycles of 98 °C for 45 s, 62 °C for 30 s, 68 °C for 2 min; 68 °C for 1 min. The DNA concentration of every indexed sample was quantified as previously described prior to equimolar pooling of the samples. Library size distribution was checked on an Agilent 2100 Bioanalyzer system (Agilent Technologies, Santa Clara, CA, USA), followed by sequencing on a HiSeq X Ten system (Illumina, San Diego, CA, USA) by Macrogen (Seoul, South Korea).
Paired-end reads were assembled de novo using SPAdes 3.15.2 [39]. Contigs with a length of less than 1000 bp were discarded and genome assemblies were evaluated with QUAST 5.0.2 [40]. Bacterial genome annotation was completed with Prokka 1.14.6 [41] using the TIGRFAMs [42], Pfam [43], and HAMAP [44] hidden Markov model (HMM)-based databases. AUGUSTUS 3.4.0 [45] was used for fungal genome annotation. KEGG [46] orthology (KO) identifiers were assigned to individual genes with BlastKOALA 2.2 [47], followed by reconstruction of KEGG pathways using KEGG Mapper [48].

3. Results

3.1. Ambient Air Pollution Increases Black Carbon Load in the Phylloplane

We monitored ambient BC, PM2.5, PM10, nitrogen dioxide, and ozone concentrations on a daily basis over 2 years (from 1 August 2017 until 31 August 2019) at six sampling sites (Figure 1a–e). We also monitored temperature and precipitation during this period (Figure S2). A cyclical (seasonal) pattern was observed during these 2 years, with BC peaking in winter, PM2.5 and PM10 peaking during late winter/early spring, and NO2 and O3 peaking in winter and summer, respectively (Figure S3). Overall, significant (p < 0.05) differences were observed for the six sampling sites for a number of parameters (Table 1). For example, BC, PM2.5, PM10, and NO2 concentrations were highest (and O3 concentration lowest) at HGa, followed by HGb and HKa,b. Conversely, the lowest concentrations for these parameters were detected at DM and DW, sites where O3 concentrations were highest. We also measured phylloplane BC load during each of the eight sampling events (Figure 1f, Table 1). Here, we observed the highest BC load for HKa,b (bcH). DM and DW had the lowest BC load (bcL), and leaves at HGa,b experienced an intermediate BC load (bcM). While our data show that higher concentrations of ambient BC and NO2 (and lower O3 concentrations) and, to a lesser extent, PM2.5 and PM10 correlate with a 2–7-fold increase in phylloplane BC load, other characteristics of the sampling sites appeared to have an influence. Notably, ambient air pollution was highest at HGa,b, while HKa,b had the highest phylloplane BC load.

3.2. Phylloplane Black Carbon Load Correlates with Bacterial and Fungal Diversity

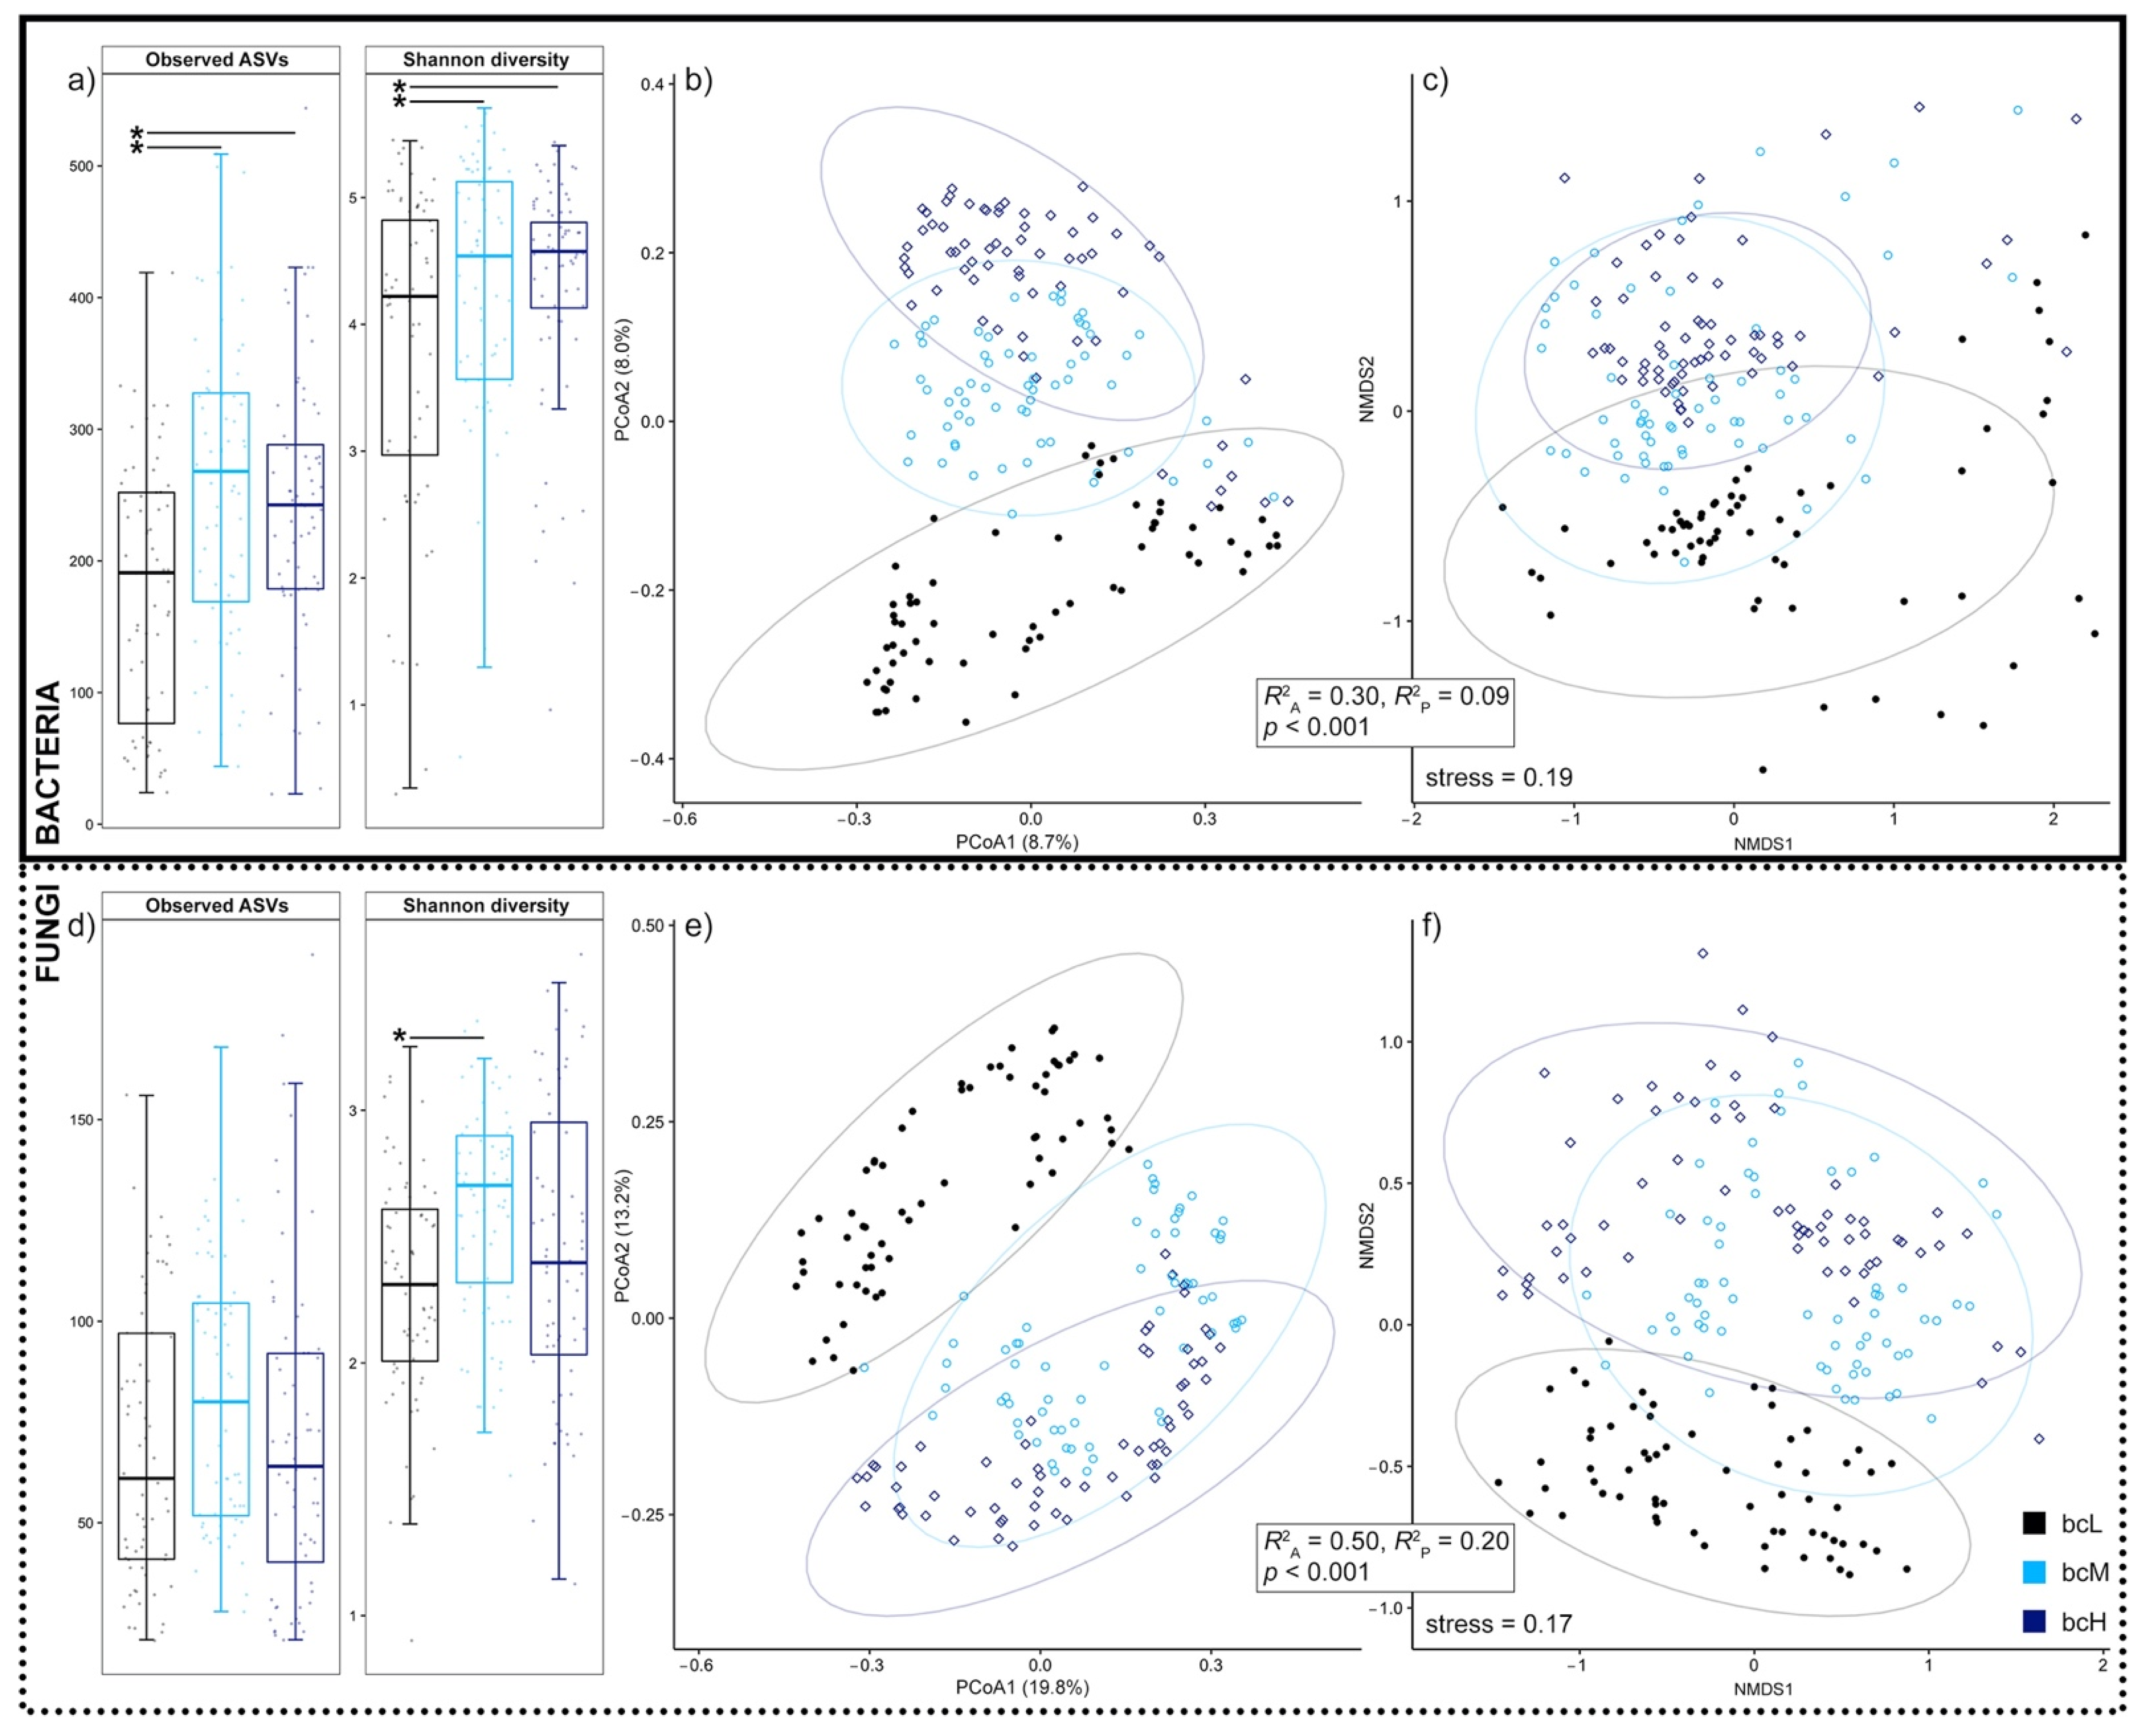
Our metabarcoding effort of the bacterial and fungal phylloplane of H. helix plants, growing at six locations with different phylloplane BC loads due to differences in ambient air pollution, resulted in a dataset of 190/192 (bacteria/fungi) samples including 1,888,912 16S rRNA V3–V4/5,167,679 ITS2 sequences covering 15,610/1685 amplicon sequence variants (ASVs). Rarefaction analysis indicated all samples were sufficiently sequenced to represent their true biological identity (Figure S4). To test if phylloplane BC load influences the bacterial and fungal leaf microbiome of H. helix, we first estimated the intra-sample (alpha) diversity of bacteria and fungi by calculating two metrics: the observed number of ASVs and the Shannon diversity index. Bacterial alpha diversity was lower in samples with low phylloplane BC load (bcL), compared to samples with medium and high BC load (bcM and bcH, respectively) (Figure 2a). On the other hand, fungal alpha diversity was similar under all three phylloplane BC load conditions; only the Shannon diversity of bcL samples was lower compared to bcM samples (Figure 2d). Next, we inferred inter-sample (beta) diversity by employing PCoA and NMDS on Bray–Curtis dissimilarity matrices. These two-dimensional representations show significantly (p < 0.001) distinctive groupings depending on phylloplane BC load for both bacterial (Figure 2b,c) and fungal (Figure 2e,f) H. helix leaf communities (R2ANOSIM = 0.30, R2PERMANOVA = 0.09, bacteria; R2ANOSIM = 0.50, R2PERMANOVA = 0.20, fungi). Moreover, the calculated effect sizes show that the BC load-correlating shift on fungal diversity was greater than on bacterial diversity. Such distinctive groupings were absent for seasonal categorizations (Figure S5). However, the seasonal effects on bacterial and fungal beta diversity were significant (p < 0.001), albeit with much lower effect sizes than those of phylloplane BC load (R2ANOSIM = 0.14, R2PERMANOVA = 0.05, bacteria; R2ANOSIM = 0.19, R2PERMANOVA = 0.10, fungi). Our results show that phylloplane BC load, which was increased by ambient air pollution by 2–7-fold, strongly correlated with the diversity of bacterial and fungal H. helix leaf communities, and had more impact than seasonal effects, over a 2 year investigation period.
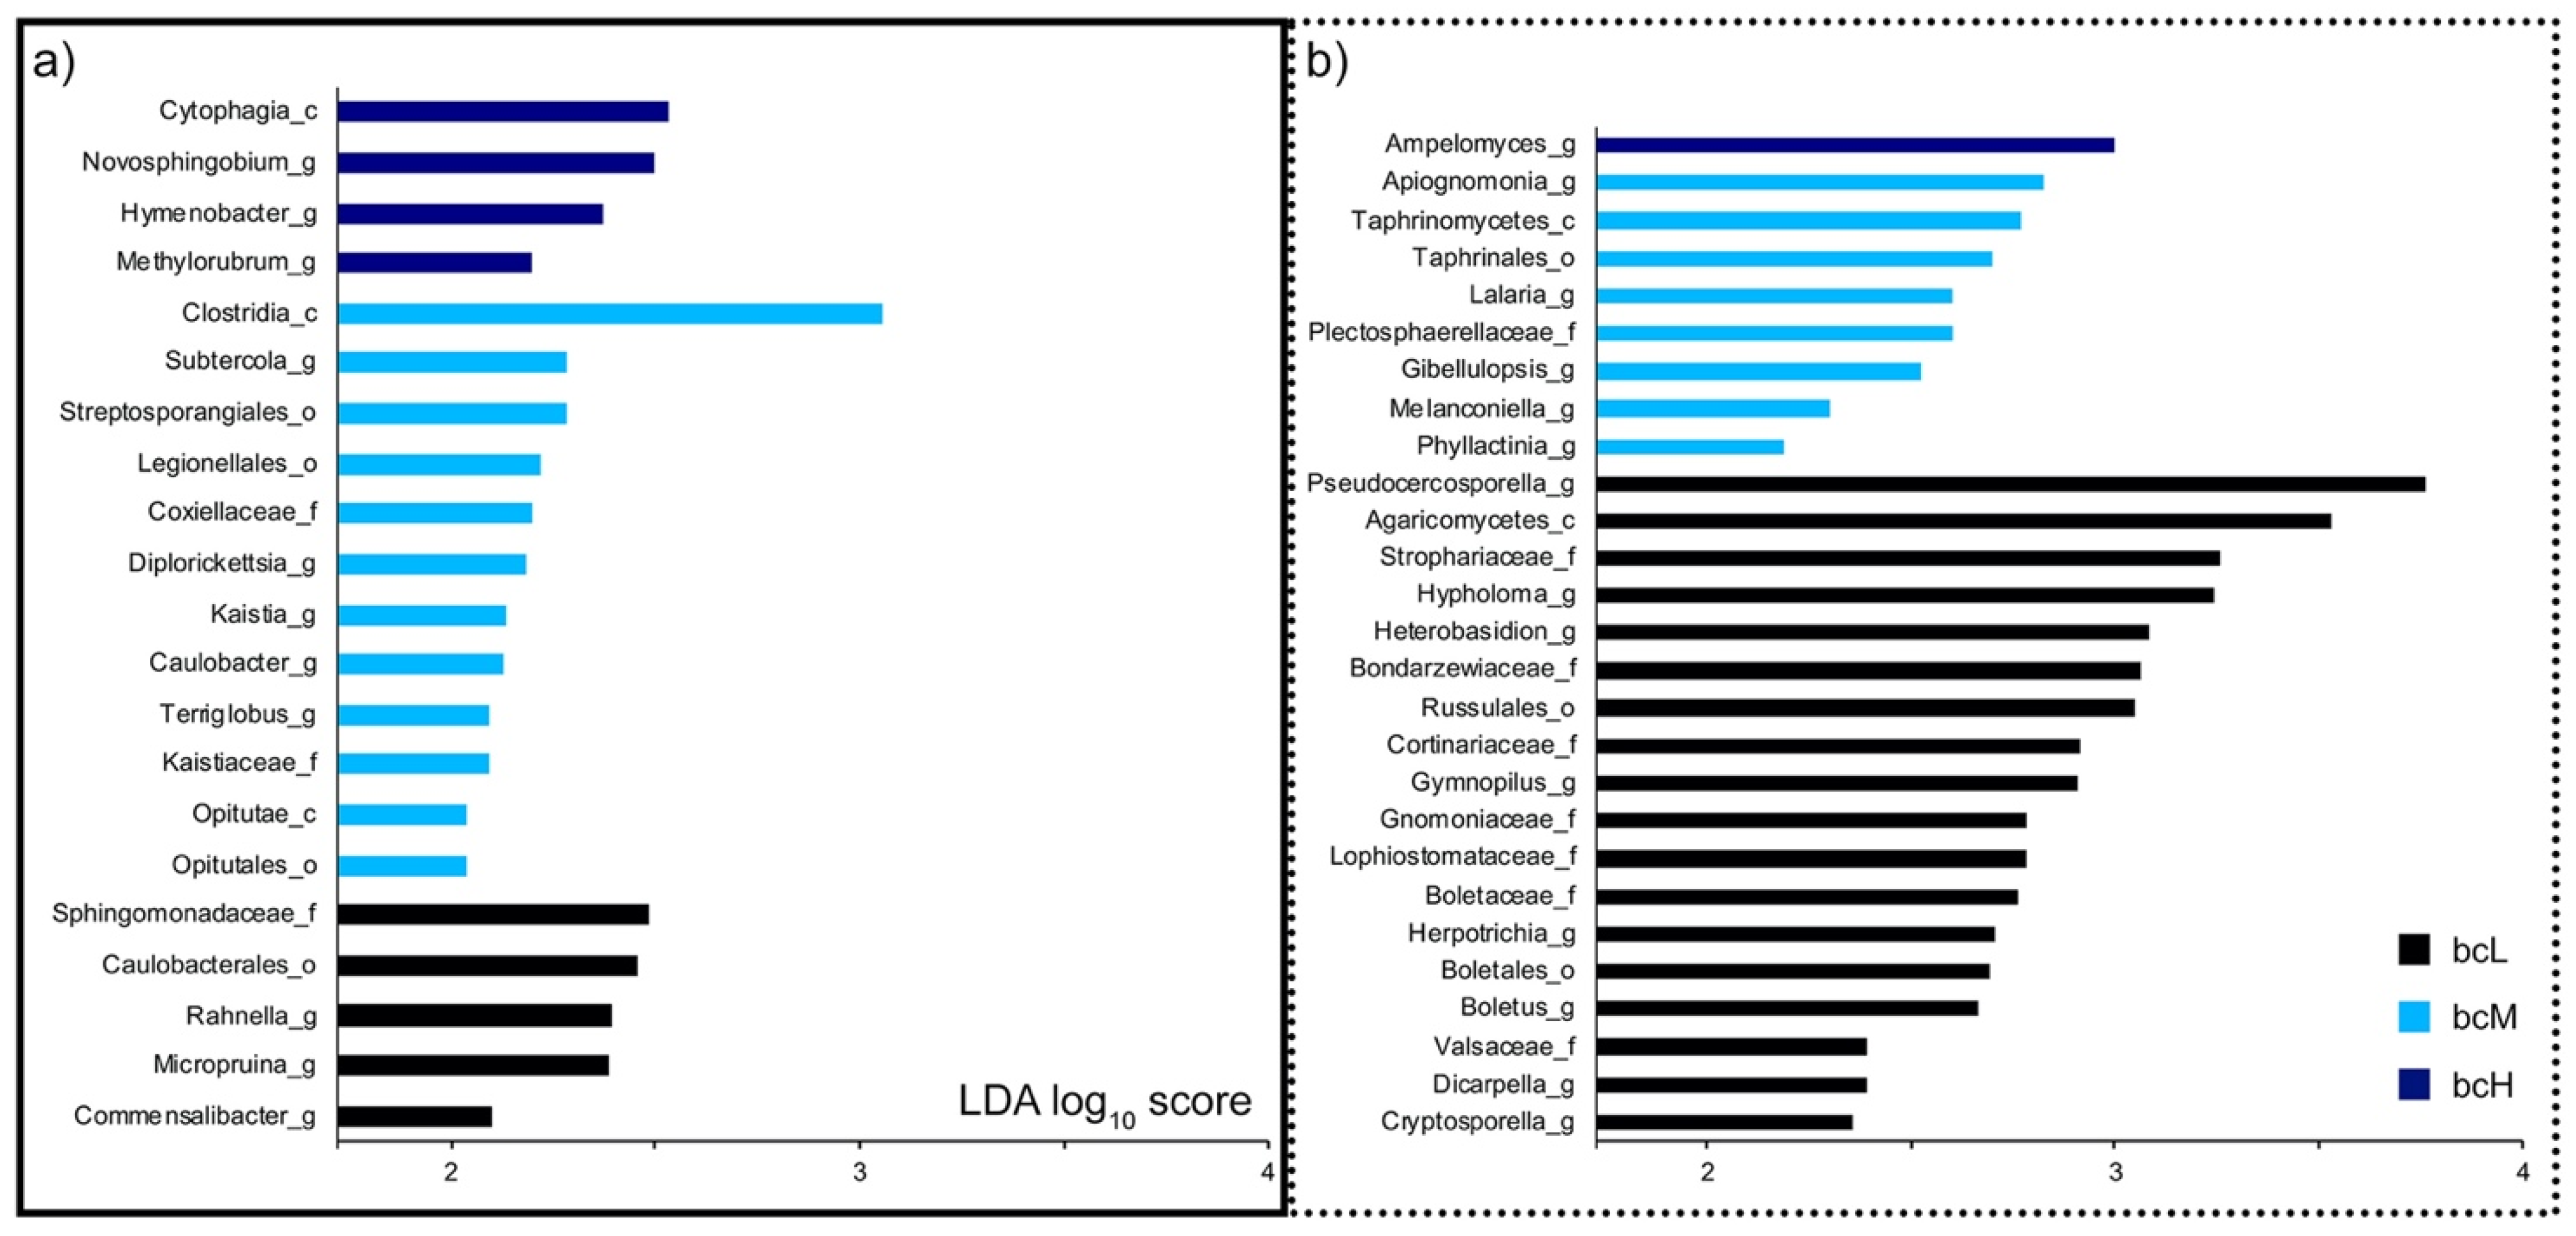
To better understand the nature of these observed diversity shifts, we identified indicators by analyzing for significantly (p < 0.05) differentially abundant taxa (Figure 3). At the genus level, Novosphingobium, Hymenobacter, Methylorubrum, and Ampelomyces were indicators for communities with high phylloplane BC load (bcH). Subtercola, Diplorickettsia, Kaistia, Caulobacter, Terriglobus, Apiognomonia, Lalaria, Gibellulopsis, Melanconiella, and Phyllactinia were associated with communities with medium phylloplane BC load (bcM). Rahnella, Micropruina, Commensalibacter, Pseudocercosporella, Hypholoma, Heterobasidion, Gymnopilus, Herpotrichia, Boletus, Dicarpella, and Cryptosporella were indicators for communities with low phylloplane BC load (bcL). Indicators at higher taxonomic levels (family, order, class) were also identified. Class Cytophagia was an indicator for bcH phylloplane communities. Families Coxiellaceae, Kaistiaceae, and Plectosphaerellaceae, orders Streptosporangiales, Legionellales, Opitutales, and Taphrinales, and classes Clostridia, Opitutae, and Taphrinomycetes were associated with bcM phylloplane communities. Lastly, families Sphingomonadaceae, Strophariaceae, Bondarzewiaceae, Cortinariaceae, Gnomoniaceae, Lophiostomataceae, Boletaceae, and Valsaceae, orders Caulobacterales, Russulales, and Boletales, and class Agaricomycetes were indicators for bcL phylloplane communities.

3.3. Phylloplane Isolates from an Air-Polluted Environment Degrade BTX

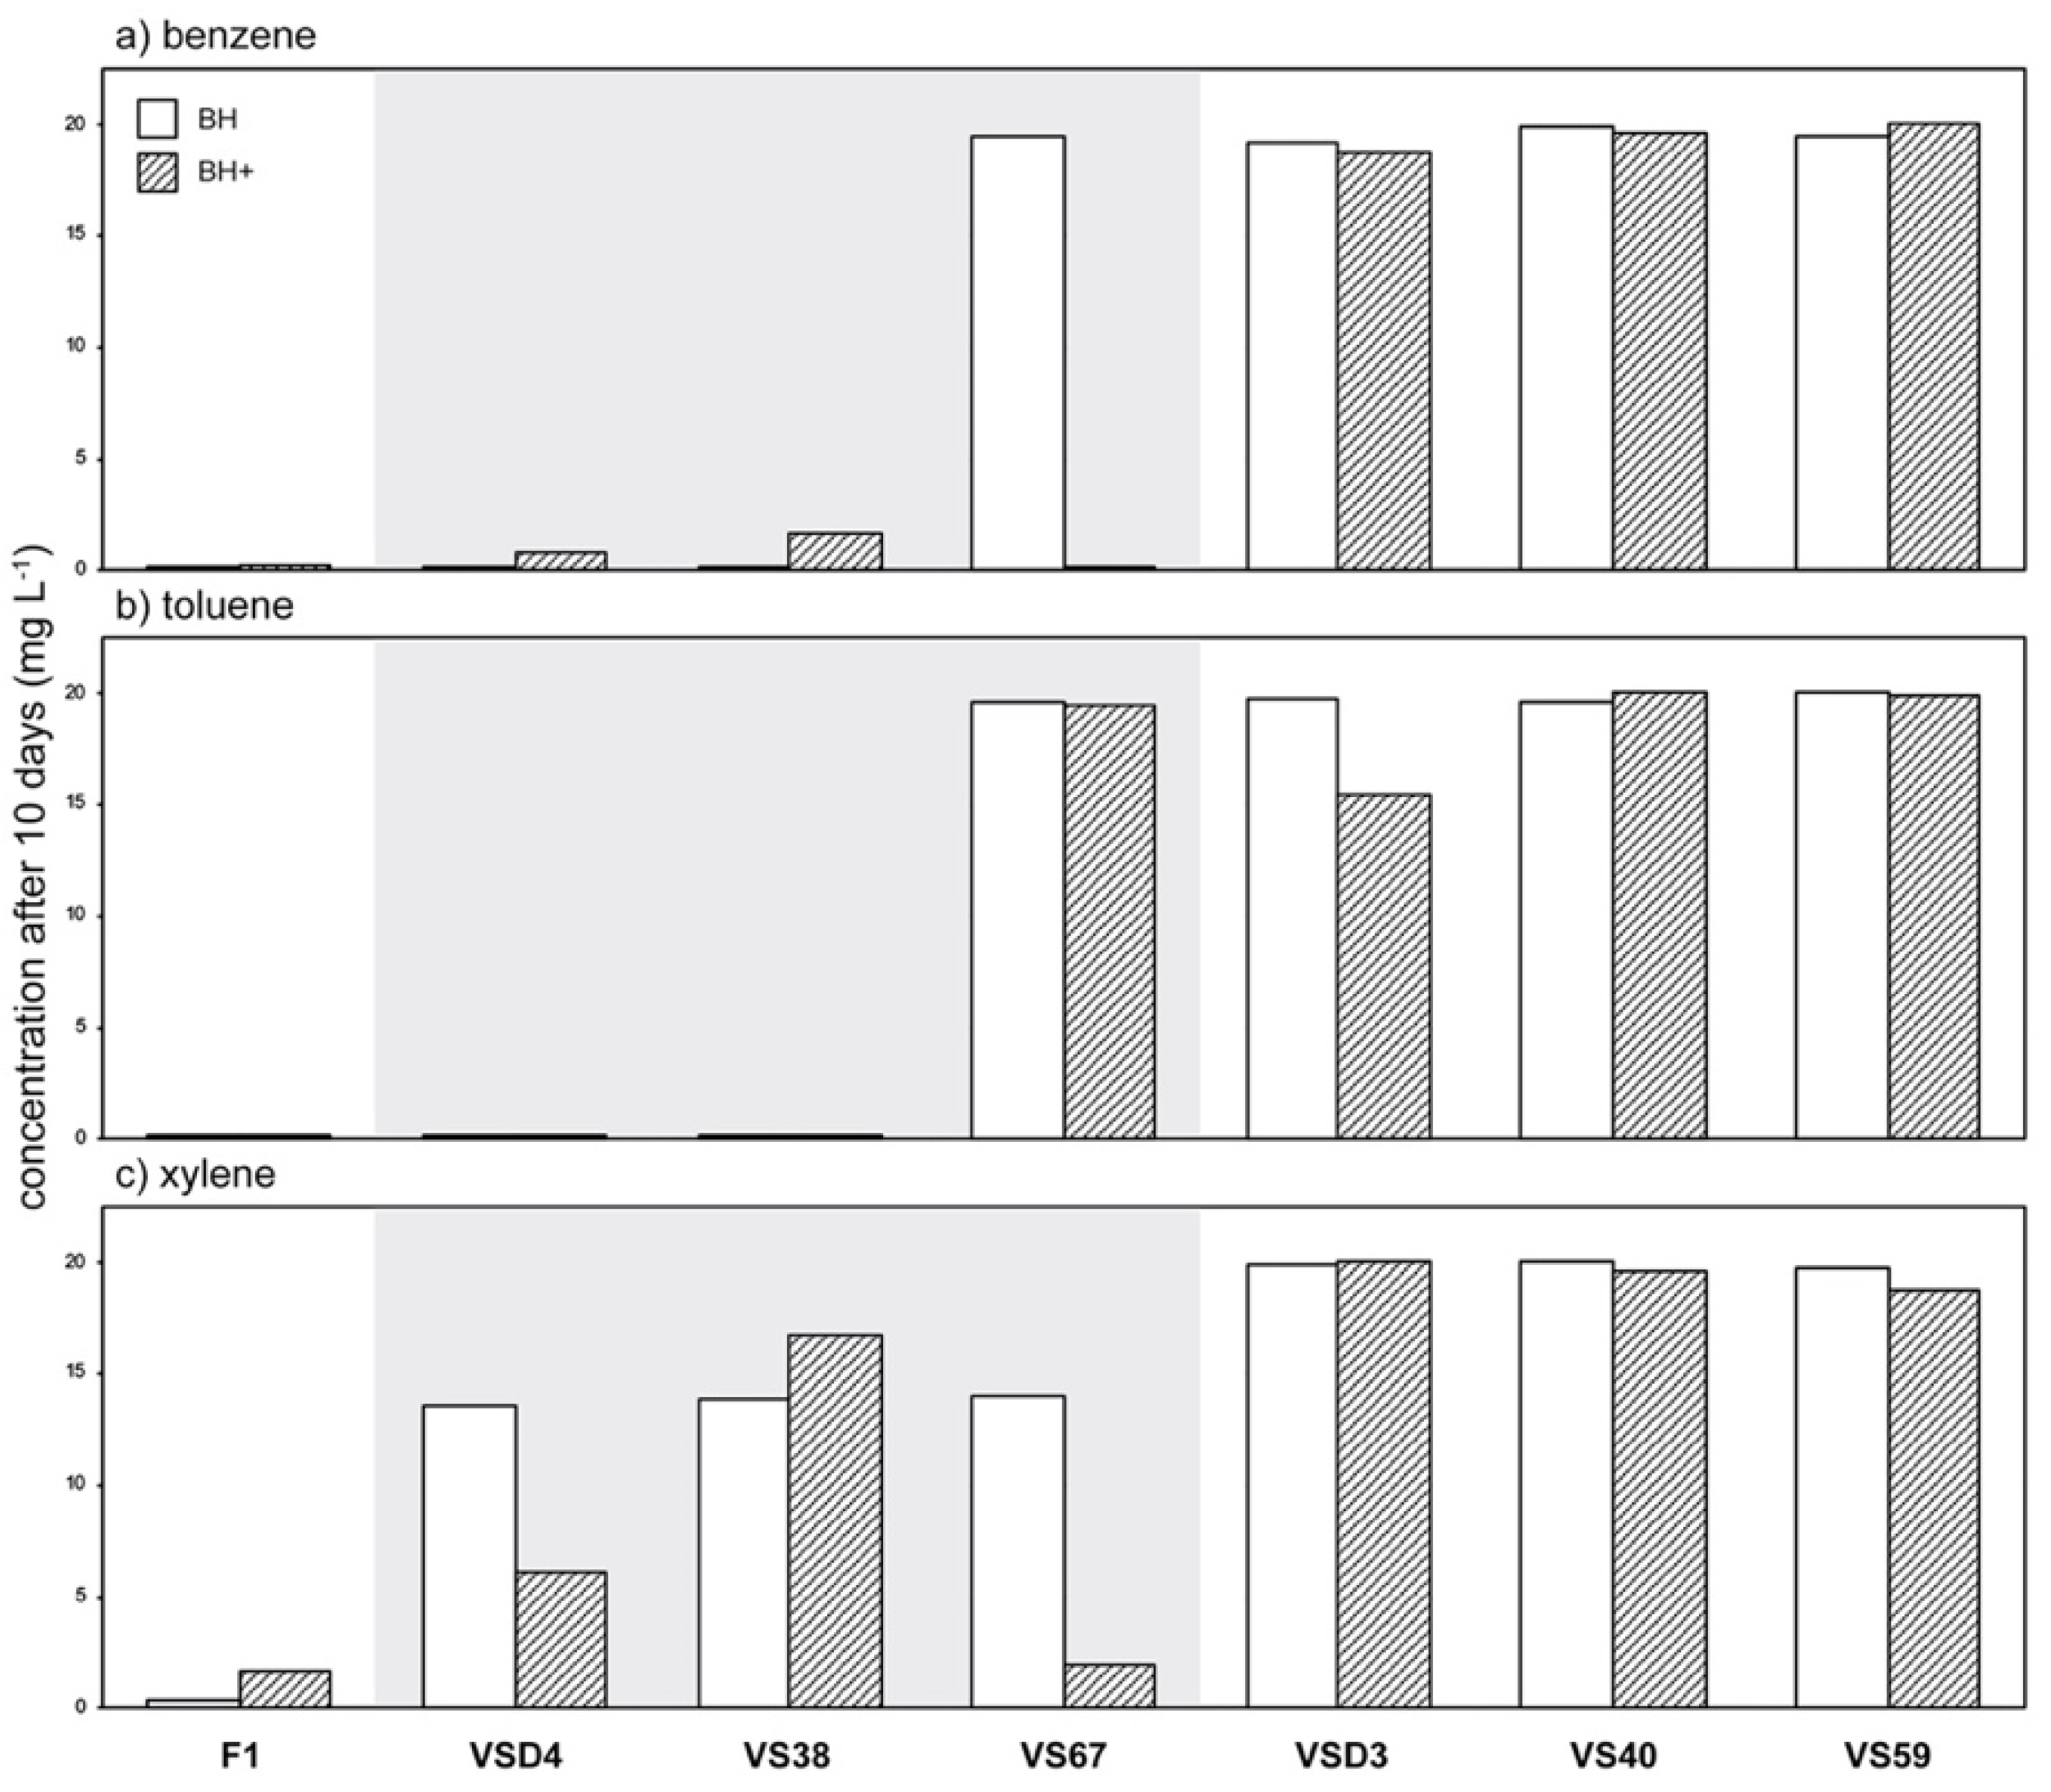
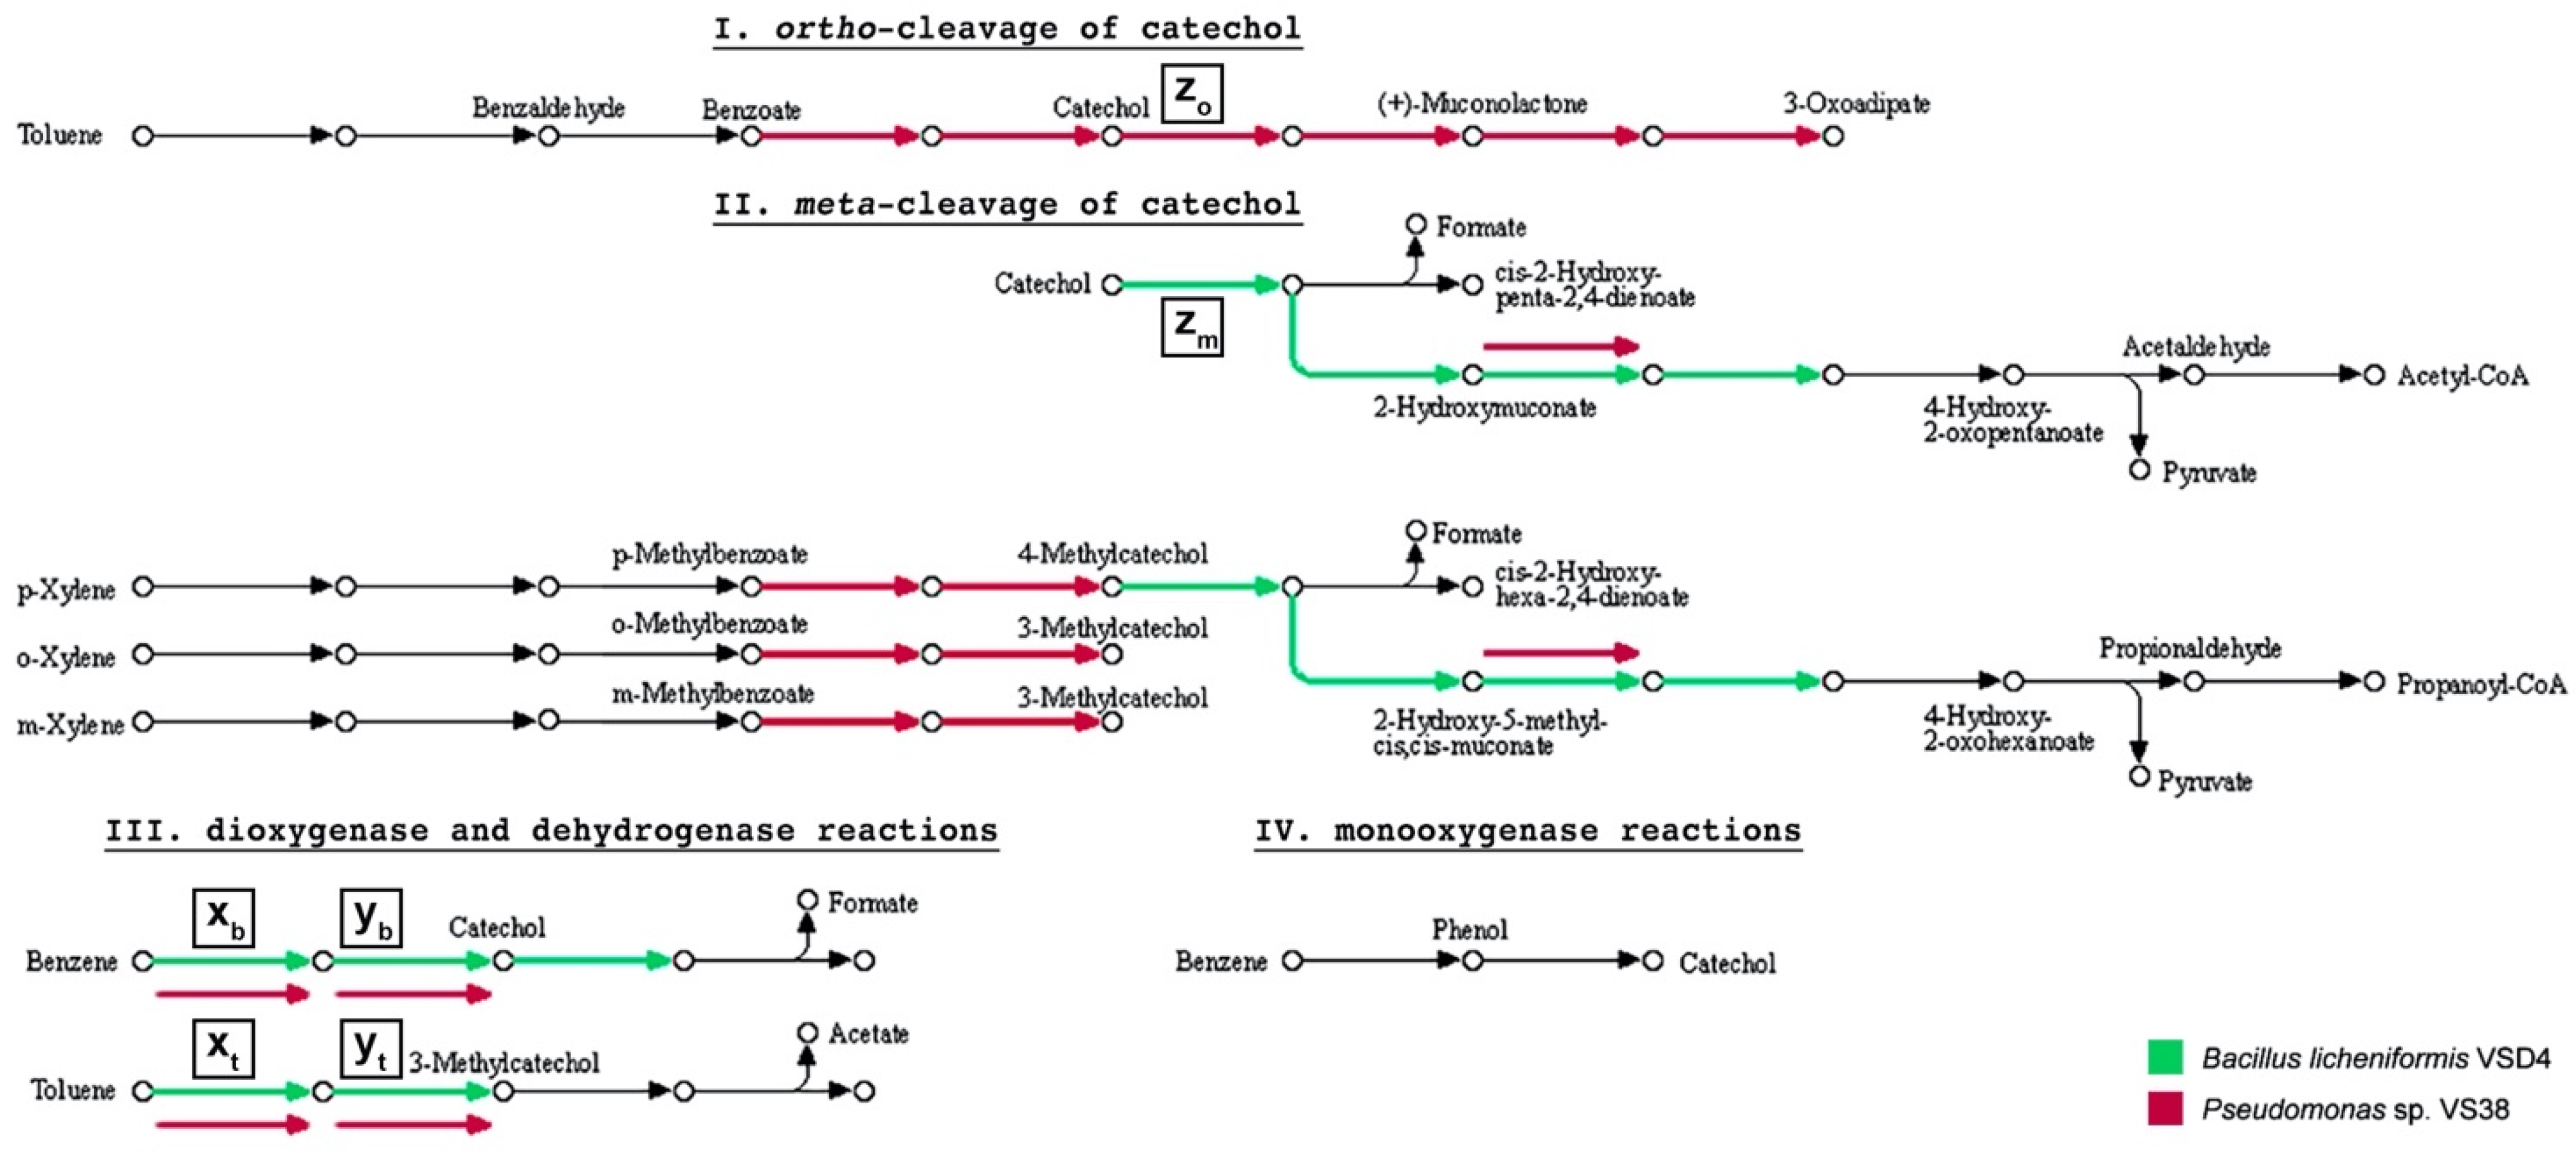
Given the impact of ambient air pollution on bacterial and fungal ivy leaf communities, it is reasonable to suggest that phylloplane microorganisms may be able to degrade common airborne pollutants. Therefore, we screened a collection of 300 H. helix phylloplane isolates for their potential to metabolize diesel fuel (DF). Our screening effort resulted in six DF metabolizers that were all isolated from bcH samples (HKb). We further analyzed these isolates for their potential to degrade benzene, toluene, and xylene (BTX). Two bacteria, Bacillus licheniformis VSD4 and Pseudomonas sp. VS38, were each able to completely degrade 20 mg·L−1 benzene and toluene in 10 days (Figure 4a,b). However, when additional carbon sources were provided, benzene removal was incomplete. Partial degradation of xylene was also observed for both isolates (Figure 4c). Rhodotorula sp. VS67, a red yeast, partially degraded xylene when it was provided as the sole carbon source. When other carbon sources where present, it was able to completely degrade benzene and (almost completely) xylene. Three of the diesel fuel metabolizers, Rhodococcus erythropolis VSD3, Pseudomonas sp. VS40, and Pseudomonas sp. VS59, were not able to notably degrade BTX. To better understand which degradation pathways are involved in the observed BTX degradation, we sequenced the genomes of B. licheniformis VSD4, Pseudomonas sp. VS38, and Rhodotorula sp. VS67 (Table S1). We assigned KEGG orthology (KO) identifiers to individual genes and reconstructed KEGG pathways related to BTX metabolism, categorized in the ortho- and meta-cleavage of catechol, dioxygenase, dehydrogenase, and monooxygenase reactions (Figure 5). The presence of homologs encoding the alpha subunit of benzene/toluene dioxygenase and cis-benzene/toluene dihydrodiol dehydrogenase was confirmed in silico in the genomes of B. licheniformis VSD4 and Pseudomonas sp. VS38. These two enzymes catalyze the oxygenation and dehydrogenation of benzene and toluene to catechol and 3-methylcatechol, respectively. From here on, degradation pathways in the two organisms diverge as B. licheniformis VSD4 has homologs involved in the meta-cleavage pathway of catechol, initiated by catechol 2,3-dioxygenase, while Pseudomonas sp. VS38 has homologs for the catechol ortho-cleavage pathway, initiated by catechol 1,2-dioxygenase. No enzyme-coding genes (homologs) related to these BTX degradation pathways were found in the genome of Rhodotorula sp. VS67.

4. Discussion

Due to the chemical coupling of O3 and NOx, the levels of O3 and NO2 are inextricably linked, and any resultant reduction in the level of NO2 is invariably accompanied by an increase in the level of O3, and vice versa [49]. HKa,b are both located on the inner ring road of the city of Hasselt, Belgium, with continuous traffic encircled by many tall buildings, HGa,b are located on the outer city ring road with more traffic but away from dense clusters of buildings, and DM and DW are in two nature reserves close-by. So-called street canyon effects could explain site-specific increases in phylloplane BC load, as was observed at HKa,b. In streets with aligned multiple-floor buildings, ventilation and dispersion of local emissions with surrounding and above-rooftop air is hindered [50]. Previously it was shown that the magnitude of street canyon effects depends on street architecture (aspect ratio, heterogeneity, green infrastructure, and openings) [50,51,52], wind conditions, and traffic-induced turbulence [53].
To test if phylloplane BC load influences the bacterial and fungal leaf microbiome of H. helix, we assessed the intra- (alpha) and inter-sample (beta) diversity. While fungal alpha diversity was similar under all three phylloplane BC load conditions, alpha diversity was highest for bacterial communities present on leaves with medium and high phylloplane BC loads exposed to greater ambient air pollution. This corroborates with a study on bacterial phylloplane communities of Platanus × acerifolia trees in Antwerp, Belgium, which showed that alpha diversity was twice as low in the phylloplane sampled in urban green and waterfront locations than adjacent to busy roads, urban residential areas, and industrial sites [54]. Another study conducted on bacterial phylloplane communities associated with seven tree species in Montreal, Canada also concluded that alpha diversity increased with urban intensity [55]. In a study that characterized the phyllospheric bacterial communities of Carpinus betulus trees across three locations, (i) the city center of Warsaw, Poland, (ii) a forest in a UNESCO World Heritage Site (Białowieża), (iii) and a forest in one of the world’s oldest operational oil fields (Bóbrka), alpha diversity was again highest in the most urban sampling location, the city center of Warsaw [56]. While these studies were not always able to directly relate increases in urban bacterial diversity to local air pollution parameters, our results indicate that ambient air pollution has the potential to impact bacterial diversity and associated plant/microbe–microbe interactions, plausibly by modifying the phylloplane microhabitat growth conditions and toxicity. This is further demonstrated by our beta diversity analyses, which show that air pollution-induced phylloplane BC load correlates with the diversity of bacterial and fungal H. helix leaf communities. Other studies have shown that plants often have microbial leaf communities exhibiting high seasonal variability [57,58,59,60,61], and we show that this is also true in our study over two annual cycles. It is, therefore, remarkable that our results indicate that seasonal effects were not the major driving factor of bacterial and fungal phylloplane diversity. A study on the phylloplane bacterial community of H. helix in Antwerp, Belgium also found that leaf communities differed greatly between urban and nonurban locations, where traffic-generated PM was lower [62], and another study that characterized the epiphytic bacterial communities on leaves of Platanus × hispanica trees suggested that a discriminating environmental effect is related to ultrafine particulate matter (UFP) and BC deposited on leaves [63]. With regard to fungi, one study showed that fungal communities of ornamental plants on roadsides in Sri Lanka adapt to ambient air pollution by shaping a community that is able to degrade aromatic hydrocarbons [64]. Here, we present a strong correlation between phylloplane BC load, increased by ambient air pollution, and bacterial and fungal diversity in a 2 year sampling approach using metabarcoding. We found that the bacterial genera Novosphingobium, Hymenobacter, and Methylorubrum, and the fungal genus Ampelomyces were indicators for communities with the highest phylloplane BC load. Hymenobacter was shown to dominate the urban phylloplane in two other studies [54,62], and Ampelomyces quisqualis was noted, with various intensity, in north-eastern Poland on different species of Erysiphales selected as potential indicators of urban pollution [65].
From a three-stage experiment comprising (i) isolation and (ii) screening of phylloplane microorganisms for diesel fuel metabolization, and (iii) measurements of BTX degradation, we here present two bacteria, B. licheniformis VSD4 and Pseudomonas sp. VS38, and one yeast, Rhodotorula sp. VS67, isolated from an air-polluted environment that are effectively able to degrade benzene, toluene, and/or xylene. Genome analyses revealed genes for the meta-cleavage of catechol for B. licheniformis VSD4 and for the ortho-cleavage of catechol for Pseudomonas sp. VS38. Degradation pathways involving catechol meta-cleavage are well-documented for several Bacillus strains [66,67,68], including B. licheniformis [69]. However, only a few Bacillus strains are reported as BTX degraders, e.g., B. subtilis DM-04 [70] and B. amyloliquefaciens W1 [71]. On the other hand, Pseudomonas strains are famous for their BTX degradation potential, including P. putida F1 [72], P. putida YNS1 [73], P. stutzeri OX1 [74], and Pseudomonas spp. VI4.1 and VI4T1 [75]. Our analyses showed that Rhodotorula sp. VS67, a red yeast, does not have the genetic basis to facilitate degradation mechanisms related to the meta- and ortho-cleavage pathways of catechol. It remains unclear via what mechanism it was able to degrade xylene as the sole carbon source. Since it was able to completely degrade benzene (and almost completely degrade xylene) only when other carbon sources where present, co-metabolization by monooxygenases is most likely involved [76]. The biodegradation of aromatic hydrocarbons by fungi has traditionally been considered to be of a co-metabolic nature [77]. For example, with regard to BTX degradation, the soil fungus Cladophialophora sp. T1 was able to degrade toluene and xylene via co-metabolization [78]. Transcriptome analysis of Cladophialophora immunda CBS 110551 associated the initial oxidation of the methyl-group of toluene with catalyzation by a membrane-bound cytochrome P450 [79,80].

5. Conclusions

Ambient air pollution has wide-ranging and deleterious effects on our environment and is a major issue for the global society. It is evident that air pollution also influences phylloplane microbial communities, as leaf surfaces are continuously exposed to the atmosphere, but the extent and nature of this influence remains unclear. In this field study, over a 2 year period, we sampled H. helix leaves at six locations exposed to different ambient air pollution conditions. We showed that ambient air pollution increases the phylloplane black carbon (BC) load 2–7-fold, and that this BC load strongly correlates with the diversity of bacterial and fungal H. helix leaf communities, impacting this diversity even more than seasonal effects. We further identified indicators for communities with high, medium, and low phylloplane BC load. Parallel to this, we present one fungal and two bacterial phylloplane strains isolated from an air-polluted environment able to degrade BTX, common airborne pollutants, including a genomics-based description of the degradation pathways involved. The findings of this study indicate that ambient air pollution contributes to shaping bacterial and fungal ivy leaf communities by impacting the diversity and supporting a community which includes members able to degrade airborne pollutants.

Supplementary Materials

The following are available online at https://www.mdpi.com/article/10.3390/microorganisms9102088/s1: Figure S1. Study area and sampling locations; Figure S2. Biennial temperature and precipitation profile; Figure S3. Biennial profile of ambient air pollution parameters; Figure S4. Rarefaction analysis; Figure S5. Seasonal effects on bacterial and fungal phylloplane diversity; Table S1. Genome assemblies of phylloplane BTX degraders.

Author Contributions

Conceptualization, V.S., S.T. and J.V.; methodology, V.S., E.B., T.N., W.M. and J.V.H.; formal analysis, V.S.; investigation, V.S.; resources, J.V.H. and J.V.; data curation, V.S.; writing—original draft preparation, V.S.; writing—review and editing, S.T., J.V.H. and J.V.; visualization, V.S.; supervision, S.T. and J.V.; project administration, V.S., S.T. and J.V.; funding acquisition, V.S. and J.V. All authors have read and agreed to the published version of the manuscript.

Funding

This research was funded by the Hasselt University Methusalem project 08M03VGRJ, by the project G0D0916N (“Plant–microbe associations to reduce particulate matter concentration and toxicity in urban areas: a multidisciplinary approach”) financed by the Research Foundation—Flanders (FWO), and by a personal grant to V.S. provided by the Research Foundation—Flanders (FWO).

Data Availability Statement

The bacterial and fungal phylloplane metabarcoding samples are available from the Short Read Archive (SRA) of the National Center for Biotechnology Information (NCBI) under project accession number PRJNA706561. Genome assemblies of the phylloplane BTX degraders are available under project accession number PRJNA727619 (B. licheniformis VSD4, LMG 32319; Pseudomonas sp. VS38, LMG 32320) and PRJNA727621 (Rhodotorula sp. VS67, MUCL 58125). Cultures of these isolates are publicly available from the internationally recognized culture collections BCCM/LMG and BCCM/MUCL (accession numbers are underlined).

Acknowledgments

We want to express our sincere gratitude to Julie Claes, Ann Wijgaerts, and Jan Czech for their technical assistance. We also thank the VSC (Flemish Supercomputer Center), funded by the Research Foundation—Flanders (FWO) and the Flemish Government—department EWI for providing the computational resources and services used in this work.

Conflicts of Interest

The authors declare no conflict of interest. The funders had no role in the design of the study; in the collection, analyses, or interpretation of data; in the writing of the manuscript, or in the decision to publish the results.

References

  1. World Health Organization. Air Pollution. Available online: https://www.who.int/health-topics/air-pollution (accessed on 2 October 2021).
  2. Zhang, K.; Batterman, S.A. Air pollution and health risks due to vehicle traffic. Sci. Total Environ. 2013, 450–451, 307–316. [Google Scholar] [CrossRef] [Green Version]
  3. Anenberg, S.C.; Schwartz, J.; Shindell, D.; Amann, M.; Faluvegi, G.; Klimont, Z.; Janssens-Maenhout, G.; Pozzoli, L.; Van Dingenen, R.; Vignati, E.; et al. Global air quality and health co-benefits of mitigating near-term climate change through methane and black carbon emission controls. Environ. Health Perspect. 2012, 120, 831–839. [Google Scholar] [CrossRef] [Green Version]
  4. Grahame, T.J.; Klemm, R.; Schlesinger, R.B. Public health and components of particulate matter: The changing assessment of black carbon. J. Air Waste Manag. Assoc. 2014, 64, 620–660. [Google Scholar] [CrossRef]
  5. Rai, P.K. Impacts of particulate matter pollution on plants: Implications for environmental biomonitoring. Ecotoxicol. Environ. Saf. 2016, 129, 120–136. [Google Scholar] [CrossRef]
  6. Chin, J.Y.; Batterman, S.A. VOC composition of current motor vehicle fuels and vapors, and collinearity analyses for receptor modeling. Chemosphere 2012, 86, 951–958. [Google Scholar] [CrossRef] [Green Version]
  7. Zielinska, B.; Sagebiel, J.; McDonald, J.D.; Whitney, K.; Lawson, D.R. Emission rates and comparative chemical composition from selected in-use diesel and gasoline-fueled vehicles. J. Air Waste Manag. Assoc. 2004, 54, 1138–1150. [Google Scholar] [CrossRef]
  8. Nurmatov, U.B.; Tagiyeva, N.; Semple, S.; Devereux, G.; Sheikh, A. Volatile organic compounds and risk of asthma and allergy: A systematic review. Eur. Respir. Rev. 2015, 24, 92–101. [Google Scholar] [CrossRef]
  9. Kuykendall, J.R.; Shaw, S.L.; Paustenbach, D.; Fehling, K.; Kacew, S.; Kabay, V. Chemicals present in automobile traffic tunnels and the possible community health hazards: A review of the literature. Inhal. Toxicol. 2009, 21, 747–792. [Google Scholar] [CrossRef] [PubMed]
  10. Vorholt, J.A. Microbial life in the phyllosphere. Nat. Rev. Microbiol. 2012, 10, 828–840. [Google Scholar] [CrossRef] [PubMed]
  11. Woodward, F.I.; Lomas, M.R. Vegetation dynamics—Simulating responses to climatic change. Biol. Rev. 2004, 79, 643–670. [Google Scholar] [CrossRef] [PubMed]
  12. Lindow, S.E.; Brandl, M.T. Microbiology of the phyllosphere. Appl. Environ. Microbiol. 2003, 69, 1875–1883. [Google Scholar] [CrossRef] [Green Version]
  13. Müller, T.; Ruppel, S. Progress in cultivation-independent phyllosphere microbiology. FEMS Microbiol. Ecol. 2014, 87, 2–17. [Google Scholar] [CrossRef]
  14. Metcalfe, D.J. Hedera helix L. J. Ecol. 2005, 93, 632–648. [Google Scholar] [CrossRef]
  15. Dzierżanowski, K.; Popek, R.; Gawrońska, H.; Sæbø, A.; Gawroński, S.W. Deposition of particulate matter of different size fractions on leaf surfaces and in waxes of urban forest species. Int. J. Phytoremediat. 2011, 13, 1037–1046. [Google Scholar] [CrossRef] [PubMed]
  16. Lefebvre, W.; Van Poppel, M.; Maiheu, B.; Janssen, S.; Dons, E. Evaluation of the RIO-IFDM-street canyon model chain. Atmos. Environ. 2013, 77, 325–337. [Google Scholar] [CrossRef]
  17. Janssen, S.; Dumont, G.; Fierens, F.; Mensink, C. Spatial interpolation of air pollution measurements using CORINE land cover data. Atmos. Environ. 2008, 42, 4884–4903. [Google Scholar] [CrossRef]
  18. Lefebvre, W.; Degrawe, B.; Beckx, C.; Vanhulsel, M.; Kochan, B.; Bellemans, T.; Janssens, D.; Wets, G.; Janssen, S.; De Vlieger, I.; et al. Presentation and evaluation of an integrated model chain to respond to traffic-and health-related policy questions. Environ. Model. Softw. 2013, 40, 160–170. [Google Scholar] [CrossRef]
  19. Lefebvre, W.; Vercauteren, J.; Schrooten, L.; Janssen, S.; Degraeuwe, B.; Maenhaut, W.; de Vlieger, I.; Vankerkom, J.; Cosemans, G.; Mensink, C.; et al. Validation of the MIMOSA-AURORA-IFDM model chain for policy support: Modeling concentrations of elemental carbon in Flanders. Atmos. Environ. 2011, 45, 6705–6713. [Google Scholar] [CrossRef]
  20. Bové, H.; Steuwe, C.; Fron, E.; Slenders, E.; D’Haen, J.; Fujita, Y.; Uji, I.H.; vandeVen, M.; Roeffaers, M.; Ameloot, M. Biocompatible label-free detection of carbon black particles by femtosecond pulsed laser microscopy. Nano Lett. 2016, 16, 3173–3178. [Google Scholar] [CrossRef] [Green Version]
  21. Klindworth, A.; Pruesse, E.; Schweer, T.; Peplies, J.; Quast, C.; Horn, M.; Glöckner, F.O. Evaluation of general 16S ribosomal RNA gene PCR primers for classical and next-generation sequencing-based diversity studies. Nucleic Acids Res. 2013, 41, e1. [Google Scholar] [CrossRef]
  22. Vancov, T.; Keen, B. Amplification of soil fungal community DNA using the ITS86F and ITS4 primers. FEMS Microbiol. Lett. 2009, 296, 91–96. [Google Scholar] [CrossRef] [Green Version]
  23. Callahan, B.J.; McMurdie, P.J.; Rosen, M.J.; Han, A.W.; Johnson, A.J.A.; Holmes, S.P. DADA2: High-resolution sample inference from Illumina amplicon data. Nat. Methods 2016, 13, 581–583. [Google Scholar] [CrossRef] [Green Version]
  24. Martin, M. Cutadapt removes adapter sequences from high-throughput sequencing reads. EMBnet J. 2011, 17, 10–12. [Google Scholar] [CrossRef]
  25. Morgan, M.; Anders, S.; Lawrence, M.; Aboyoun, P.; Pages, H.; Gentleman, R. ShortRead: A bioconductor package for input, quality assessment and exploration of high-throughput sequence data. Bioinformatics 2009, 25, 2607–2608. [Google Scholar] [CrossRef] [PubMed] [Green Version]
  26. Murali, A.; Bhargava, A.; Wright, E.S. IDTAXA: A novel approach for accurate taxonomic classification of microbiome sequences. Microbiome 2018, 6, 140. [Google Scholar] [CrossRef] [PubMed]
  27. Cole, J.R.; Wang, Q.; Fish, J.A.; Chai, B.; McGarrell, D.M.; Sun, Y.; Brown, C.T.; Porras-Alfaro, A.; Kuske, C.R.; Tiedje, J.M. Ribosomal Database Project: Data and tools for high throughput rRNA analysis. Nucleic Acids Res. 2014, 42, D633–D642. [Google Scholar] [CrossRef] [PubMed] [Green Version]
  28. Deshpande, V.; Wang, Q.; Greenfield, P.; Charleston, M.; Porras-Alfaro, A.; Kuske, C.R.; Cole, J.R.; Midgley, D.J.; Tran-Dinh, N. Fungal identification using a Bayesian classifier and the Warcup training set of internal transcribed spacer sequences. Mycologia 2016, 108, 1–5. [Google Scholar] [CrossRef]
  29. McMurdie, P.J.; Holmes, S. phyloseq: An R package for reproducible interactive analysis and graphics of microbiome census data. PLoS ONE 2013, 8, e61217. [Google Scholar] [CrossRef] [Green Version]
  30. Kandlikar, G.S.; Gold, Z.J.; Cowen, M.C.; Meyer, R.S.; Freise, A.C.; Kraft, N.J.B.; Moberg-Parker, J.; Sprague, J.; Kushner, D.J.; Curd, E.E. ranacapa: An R package and Shiny web app to explore environmental DNA data with exploratory statistics and interactive visualizations. F1000Research 2018, 7, 1734. [Google Scholar] [CrossRef]
  31. Segata, N.; Izard, J.; Waldron, L.; Gevers, D.; Miropolsky, L.; Garrett, W.S.; Huttenhower, C. Metagenomic biomarker discovery and explanation. Genome Biol. 2011, 12, R60. [Google Scholar] [CrossRef] [Green Version]
  32. R Core Team. R: A Language and Environment for Statistical Computing. Available online: https://www.r-project.org/ (accessed on 2 October 2021).
  33. Bertani, G. Studies on lysogenesis. I. The mode of phage liberation by lysogenic Escherichia coli. J. Bacteriol. 1951, 62, 293–300. [Google Scholar] [CrossRef] [Green Version]
  34. Bushnell, L.D.; Haas, H.F. The utilization of certain hydrocarbons by microorganisms. J. Bacteriol. 1941, 41, 653–673. [Google Scholar] [CrossRef] [Green Version]
  35. Bučková, M.; Puškarová, A.; Chovanová, K.; Kraková, L.; Ferianc, P.; Pangallo, D. A simple strategy for investigating the diversity and hydrocarbon degradation abilities of cultivable bacteria from contaminated soil. World J. Microbiol. Biotechnol. 2013, 29, 1085–1098. [Google Scholar] [CrossRef]
  36. Stevens, V.; Thijs, S.; Vangronsveld, J. Diversity and plant growth-promoting potential of (un)culturable bacteria in the Hedera helix phylloplane. BMC Microbiol. 2021, 21, 66. [Google Scholar] [CrossRef]
  37. Stevens, V.; Thijs, S.; McAmmond, B.; Langill, T.; Van Hamme, J.; Weyens, N.; Vangronsveld, J. Draft genome sequence of Bacillus licheniformis VSD4, a diesel fuel-degrading and plant growth-promoting phyllospheric bacterium. Genome Announc. 2017, 5, e00027-17. [Google Scholar] [CrossRef] [Green Version]
  38. Stevens, V.; Thijs, S.; McAmmond, B.; Langill, T.; Van Hamme, J.; Weyens, N.; Vangronsveld, J. Draft genome sequence of Rhodococcus erythropolis VSD3, a diesel fuel-degrading and plant growth-promoting bacterium isolated from Hedera helix leaves. Genome Announc. 2017, 5, e01680-16. [Google Scholar] [CrossRef] [PubMed] [Green Version]
  39. Bankevich, A.; Nurk, S.; Antipov, D.; Gurevich, A.A.; Dvorkin, M.; Kulikov, A.S.; Lesin, V.M.; Nikolenko, S.I.; Pham, S.; Prjibelski, A.D.; et al. SPAdes: A new genome assembly algorithm and its applications to single-cell sequencing. J. Comput. Biol. 2012, 19, 455–477. [Google Scholar] [CrossRef] [PubMed] [Green Version]
  40. Gurevich, A.; Saveliev, V.; Vyahhi, N.; Tesler, G. QUAST: Quality assessment tool for genome assemblies. Bioinformatics 2013, 29, 1072–1075. [Google Scholar] [CrossRef] [PubMed]
  41. Seemann, T. Prokka: Rapid prokaryotic genome annotation. Bioinformatics 2014, 30, 2068–2069. [Google Scholar] [CrossRef] [PubMed]
  42. Haft, D.H.; Selengut, J.D.; White, O. The TIGRFAMs database of protein families. Nucleic Acids Res. 2003, 31, 371–373. [Google Scholar] [CrossRef] [PubMed] [Green Version]
  43. Mistry, J.; Chuguransky, S.; Williams, L.; Qureshi, M.; Salazar, G.A.; Sonnhammer, E.L.L.; Tosatto, S.C.E.; Paladin, L.; Raj, S.; Richardson, L.J.; et al. Pfam: The protein families database in 2021. Nucleic Acids Res. 2021, 49, D412–D419. [Google Scholar] [CrossRef]
  44. Pedruzzi, I.; Rivoire, C.; Auchincloss, A.H.; Coudert, E.; Keller, G.; de Castro, E.; Baratin, D.; Cuche, B.A.; Bougueleret, L.; Poux, S.; et al. HAMAP in 2015: Updates to the protein family classification and annotation system. Nucleic Acids Res. 2015, 43, D1064–D1070. [Google Scholar] [CrossRef] [Green Version]
  45. Stanke, M.; Morgenstern, B. AUGUSTUS: A web server for gene prediction in eukaryotes that allows user-defined constraints. Nucleic Acids Res. 2005, 33, W465–W467. [Google Scholar] [CrossRef] [PubMed] [Green Version]
  46. Kanehisa, M.; Goto, S. KEGG: Kyoto Encyclopedia of Genes and Genomes. Nucleic Acids Res. 2000, 28, 27–30. [Google Scholar] [CrossRef]
  47. Kanehisa, M.; Sato, Y.; Morishima, K. BlastKOALA and GhostKOALA: KEGG tools for functional characterization of genome and metagenome sequences. J. Mol. Biol. 2016, 428, 726–731. [Google Scholar] [CrossRef] [Green Version]
  48. Kanehisa, M.; Sato, Y. KEGG Mapper for inferring cellular functions from protein sequences. Protein Sci. 2020, 29, 28–35. [Google Scholar] [CrossRef] [PubMed] [Green Version]
  49. Hagenbjörk, A.; Malmqvist, E.; Mattisson, K.; Sommar, N.J.; Modig, L. The spatial variation of O3, NO, NO2 and NOx and the relation between them in two Swedish cities. Environ. Monit. Assess. 2017, 189, 161. [Google Scholar] [CrossRef] [PubMed] [Green Version]
  50. Vardoulakis, S.; Fisher, B.E.A.; Pericleous, K.; Gonzalez–Flesca, N. Modelling air quality in street canyons: A review. Atmos. Environ. 2003, 37, 155–182. [Google Scholar] [CrossRef] [Green Version]
  51. Janhäll, S. Review on urban vegetation and particle air pollution—Deposition and dispersion. Atmos. Environ. 2015, 105, 130–137. [Google Scholar] [CrossRef]
  52. Kumar, P.; Ketzel, M.; Vardoulakis, S.; Pirjola, L.; Britter, R. Dynamics and dispersion modelling of nanoparticles from road traffic in the urban atmospheric environment—A review. J. Aerosol Sci. 2011, 42, 580–603. [Google Scholar] [CrossRef] [Green Version]
  53. Karra, S.; Malki-Epshtein, L.; Neophytou, M. The dispersion of traffic related pollutants across a non-homogeneous street canyon. Procedia Environ. Sci. 2011, 4, 25–34. [Google Scholar] [CrossRef] [Green Version]
  54. Wuyts, K.; Smets, W.; Lebeer, S.; Samson, R. Green infrastructure and atmospheric pollution shape diversity and composition of phyllosphere bacterial communities in an urban landscape. FEMS Microbiol. Ecol. 2020, 96, fiz173. [Google Scholar] [CrossRef] [PubMed]
  55. Laforest-Lapointe, I.; Messier, C.; Kembel, S.W. Tree leaf bacterial community structure and diversity differ along a gradient of urban intensity. mSystems 2017, 2, e00087-17. [Google Scholar] [CrossRef] [PubMed] [Green Version]
  56. Imperato, V.; Kowalkowski, Ł.; Portillo-Estrada, M.; Gawroński, S.W.; Vangronsveld, J.; Thijs, S. Characterisation of the Carpinus betulus L. phyllomicrobiome in urban and forest areas. Front. Microbiol. 2019, 10, 1110. [Google Scholar] [CrossRef] [Green Version]
  57. Redford, A.J.; Fierer, N. Bacterial succession on the leaf surface: A novel system for studying successional dynamics. Microb. Ecol. 2009, 58, 189–198. [Google Scholar] [CrossRef]
  58. Grady, K.L.; Sorensen, J.W.; Stopnisek, N.; Guittar, J.; Shade, A. Assembly and seasonality of core phyllosphere microbiota on perennial biofuel crops. Nat. Commun. 2019, 10, 4135. [Google Scholar] [CrossRef] [Green Version]
  59. Copeland, J.K.; Yuan, L.; Layeghifard, M.; Wang, P.W.; Guttman, D.S. Seasonal community succession of the phyllosphere microbiome. Mol. Plant Microbe Interact. 2015, 28, 274–285. [Google Scholar] [CrossRef] [PubMed] [Green Version]
  60. Stone, B.W.G.; Jackson, C.R. Seasonal patterns contribute more towards phyllosphere bacterial community structure than short-term perturbations. Microb. Ecol. 2021, 81, 146–156. [Google Scholar] [CrossRef]
  61. Jackson, C.R.; Denney, W.C. Annual and seasonal variation in the phyllosphere bacterial community associated with leaves of the southern Magnolia (Magnolia grandiflora). Microb. Ecol. 2011, 61, 113–122. [Google Scholar] [CrossRef]
  62. Smets, W.; Wuyts, K.; Oerlemans, E.; Wuyts, S.; Denys, S.; Samson, R.; Lebeer, S. Impact of urban land use on the bacterial phyllosphere of ivy (Hedera sp.). Atmos. Environ. 2016, 147, 376–383. [Google Scholar] [CrossRef]
  63. Espenshade, J.; Thijs, S.; Gawroński, S.; Bové, H.; Weyens, N.; Vangronsveld, J. Influence of urbanization on epiphytic bacterial communities of the Platanus x hispanica tree leaves in a biennial study. Front. Microbiol. 2019, 10, 675. [Google Scholar] [CrossRef] [PubMed] [Green Version]
  64. Undugoda, L.J.S.; Kannangara, S.; Sirisena, D.M. Aromatic hydrocarbon degrading fungi inhabiting the phyllosphere of ornamental plants on roadsides of urban areas in Sri Lanka. J. Bioremediat. Biodegrad. 2016, 7, 328. [Google Scholar] [CrossRef]
  65. Sucharzewska, E.; Dynowska, M. Preliminary evaluation of the effect of Ampelomyces quisqualis on the degree of plant infestations with selected Erysiphales species proposed as potential bioindicators. Plant Protect. Sci. 2002, 38, 436–438. [Google Scholar] [CrossRef]
  66. Buswell, J.A. The meta-cleavage of catechol by a thermophilic Bacillus species. Biochem. Biophys. Res. Commun. 1974, 60, 934–941. [Google Scholar] [CrossRef]
  67. Banerjee, A.; Ghoshal, A.K. Phenol degradation by Bacillus cereus: Pathway and kinetic modeling. Bioresour. Technol. 2010, 101, 5501–5507. [Google Scholar] [CrossRef] [PubMed]
  68. Duffner, F.M.; Müller, R. A novel phenol hydroxylase and catechol 2,3-dioxygenase from the thermophilic Bacillus thermoleovorans strain A2: Nucleotide sequence and analysis of the genes. FEMS Microbiol. Lett. 1998, 161, 37–45. [Google Scholar] [CrossRef] [Green Version]
  69. ChrisFelshia, S.; AshwinKarthick, N.; Thilagam, R.; Gnanamani, A. Elucidation of 2,4-dichlorophenol degradation by Bacillus licheniformis strain SL10. Environ. Technol. 2020, 41, 366–377. [Google Scholar] [CrossRef] [PubMed]
  70. Mukherjee, A.K.; Bordoloi, N.K. Biodegradation of benzene, toluene, and xylene (BTX) in liquid culture and in soil by Bacillus subtilis and Pseudomonas aeruginosa strains and a formulated bacterial consortium. Environ. Sci. Pollut. Res. Int. 2012, 19, 3380–3388. [Google Scholar] [CrossRef]
  71. Wongbunmak, A.; Khiawjan, S.; Suphantharika, M.; Pongtharangkul, T. BTEX biodegradation by Bacillus amyloliquefaciens subsp. plantarum W1 and its proposed BTEX biodegradation pathways. Sci. Rep. 2020, 10, 17408. [Google Scholar] [CrossRef]
  72. Díaz, L.F.; Muñoz, R.; Bordel, S.; Villaverde, S. Toluene biodegradation by Pseudomonas putida F1: Targeting culture stability in long-term operation. Biodegradation 2008, 19, 197–208. [Google Scholar] [CrossRef]
  73. You, Y.; Shim, J.; Cho, C.H.; Ryu, M.H.; Shea, P.J.; Kamala-Kannan, S.; Chae, J.C.; Oh, B.T. Biodegradation of BTEX mixture by Pseudomonas putida YNS1 isolated from oil-contaminated soil. J. Basic Microbiol. 2013, 53, 469–475. [Google Scholar] [CrossRef] [PubMed]
  74. Nagarajan, K.; Loh, K.C. Formulation of microbial cocktails for BTEX biodegradation. Biodegradation 2015, 26, 51–63. [Google Scholar] [CrossRef]
  75. Imperato, V.; Portillo-Estrada, M.; McAmmond, B.M.; Douwen, Y.; Van Hamme, J.D.; Gawroński, S.W.; Vangronsveld, J.; Thijs, S. Genomic diversity of two hydrocarbon-degrading and plant growth-promoting Pseudomonas species isolated from the oil field of Bóbrka (Poland). Genes 2019, 10, 443. [Google Scholar] [CrossRef] [Green Version]
  76. Yoshikawa, M.; Zhang, M.; Toyota, K. Biodegradation of volatile organic compounds and their effects on biodegradability under co-existing conditions. Microbes Environ. 2017, 32, 188–200. [Google Scholar] [CrossRef] [Green Version]
  77. Prenafeta-Boldú, F.X.; Summerbell, R.; Sybren de Hoog, G. Fungi growing on aromatic hydrocarbons: Biotechnology’s unexpected encounter with biohazard? FEMS Microbiol. Rev. 2006, 30, 109–130. [Google Scholar] [CrossRef] [Green Version]
  78. Prenafeta-Boldú, F.X.; Vervoort, J.; Grotenhuis, J.T.; Van Groenestijn, J.W. Substrate interactions during the biodegradation of benzene, toluene, ethylbenzene, and xylene (BTEX) hydrocarbons by the fungus Cladophialophora sp. strain T1. Appl. Environ. Microbiol. 2002, 68, 2660–2665. [Google Scholar] [CrossRef] [Green Version]
  79. Blasi, B.; Tafer, H.; Kustor, C.; Poyntner, C.; Lopandic, K.; Sterflinger, K. Genomic and transcriptomic analysis of the toluene degrading black yeast Cladophialophora immunda. Sci. Rep. 2017, 7, 11436. [Google Scholar] [CrossRef] [PubMed] [Green Version]
  80. Luykx, D.M.; Prenafeta-Boldú, F.X.; de Bont, J.A. Toluene monooxygenase from the fungus Cladosporium sphaerospermum. Biochem. Biophys. Res. Commun. 2003, 312, 373–379. [Google Scholar] [CrossRef] [PubMed]
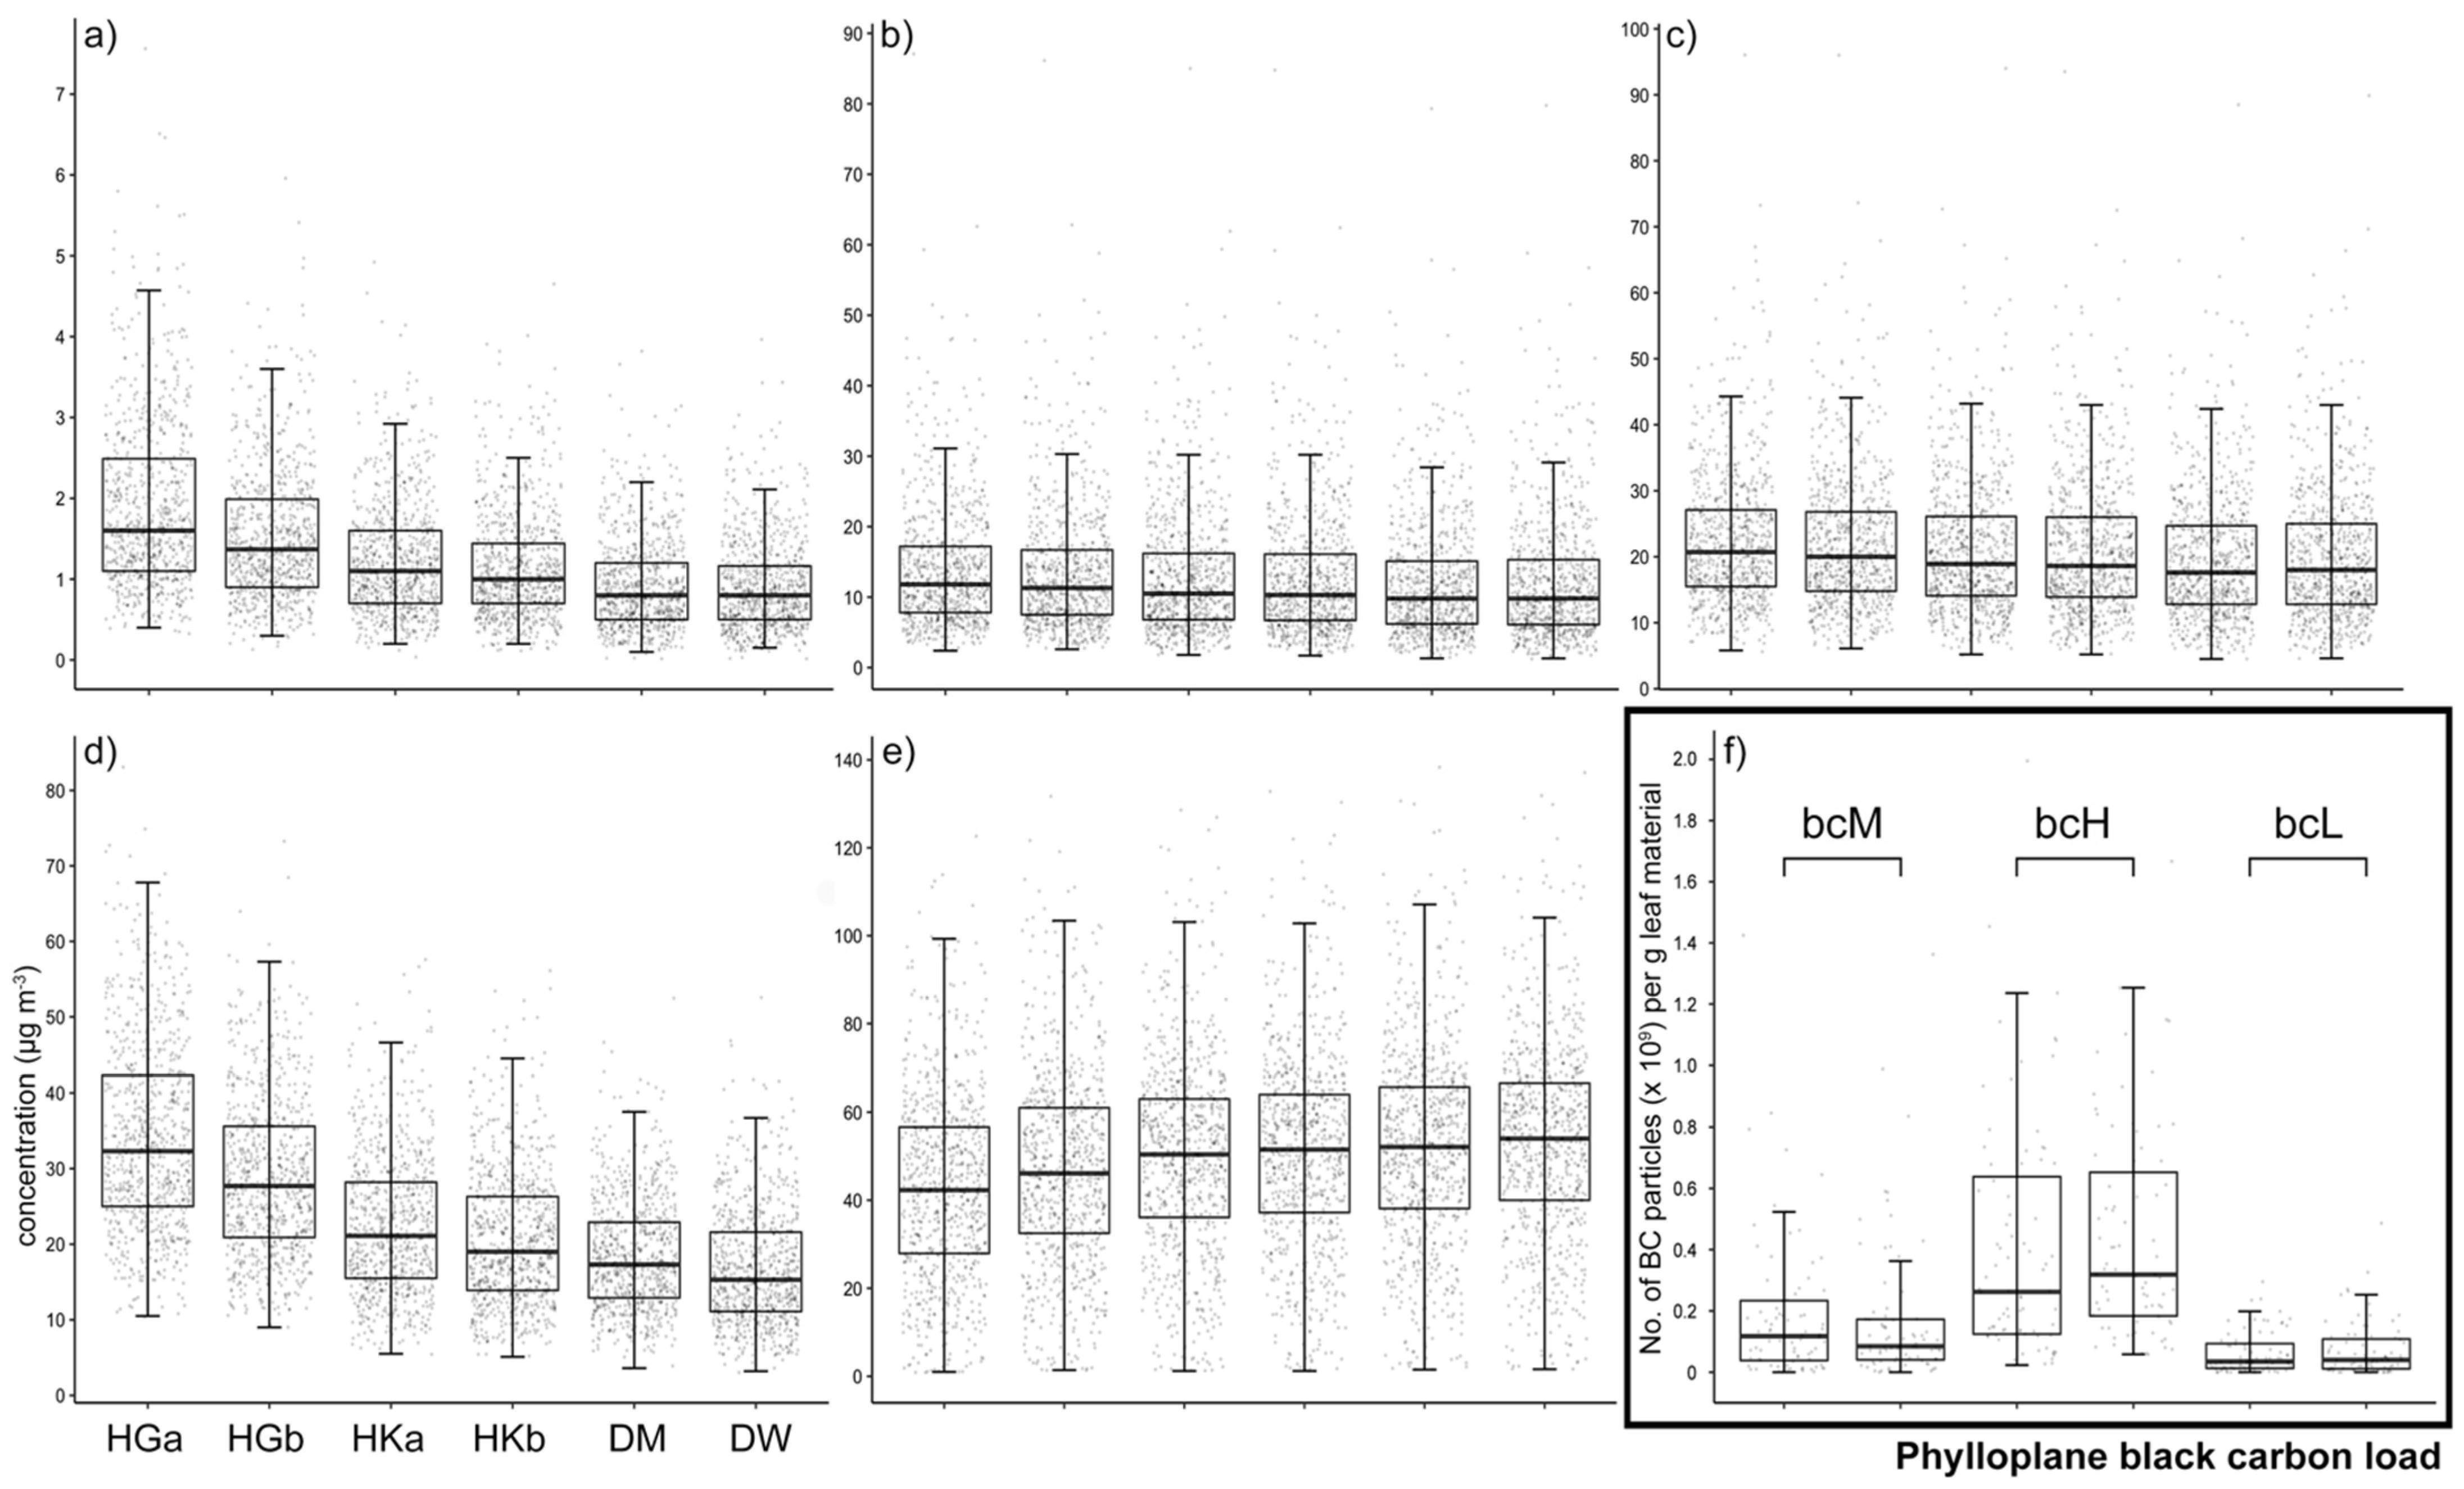
Figure 1. Ambient air pollution parameters and phylloplane black carbon load. Ambient BC (a), PM2.5 (b), PM10 (c), nitrogen dioxide (d), and ozone (e) concentrations were monitored daily from 1 August 2017 until 31 August 2019 (n = 761) at six sampling sites (HGa, HGb, HKa, HKb, DM, and DW) harboring populations of H. helix plants. Phylloplane BC load (f) was assessed during each sampling round (n = 480). Box plots span the interquartile range (25th to 75th percentile), lines within boxes denote the median, and whiskers extend to 1.5 times the interquartile range. Low (bcL), medium (bcM), and high (bcH) phylloplane BC load.
Microorganisms 09 02088 g001
Figure 2. Phylloplane black carbon load correlates with bacterial and fungal diversity. Bacterial (n = 190) and fungal (n = 192) intra-sample (alpha) diversity was assessed with amplicon sequence variant (ASV) observations and by calculating Shannon diversity indices (a,d). Box plots span the interquartile range (25th to 75th percentile), lines within boxes denote the median, and whiskers extend to 1.5 times the interquartile range. Multiple t-test significance (p < 0.05) is indicated with an asterisk (*). Inter-sample (beta) diversity was measured with principal coordinate analysis (PCoA; b,e) and nonmetric multidimensional scaling (NMDS; c,f) on Bray–Curtis dissimilarity matrices. Ellipses indicate 95% data intervals. ANOSIM (R2A) and PERMANOVA (R2P) effect size and significance are shown. Low (bcL), medium (bcM), and high (bcH) phylloplane BC load.
Microorganisms 09 02088 g002
Figure 3. Indicators of bacterial and fungal leaf communities with different phylloplane black carbon load. Significant (p < 0.05, LDA with effect size) differentially abundant bacterial (a) and fungal (b) taxa between communities with low (bcL), medium (bcM), and high (bcH) phylloplane BC load. Only LDA log10 scores ≥2 were considered; a higher score denotes a more differentially abundant taxon. After every taxon name, the rank is indicated (c: class, o: order, f: family, g: genus).
Microorganisms 09 02088 g003
Figure 4. BTX degradation potential of phylloplane diesel fuel metabolizers. Six diesel fuel metabolizers isolated from the phylloplane of H. helix growing at an air-polluted environment were further analyzed by headspace GC–MS for their potential to degrade benzene (a), toluene (b), and xylene (c) (BTX): Pseudomonas putida F1 (positive control), Bacillus licheniformis VSD4, Pseudomonas sp. VS38, Rhodotorula sp. VS67, Rhodococcus erythropolis VSD3, Pseudomonas sp. VS40, and Pseudomonas sp. VS59. BH(+): Bushnell–Haas medium (+: with additional macronutrients; 0.5 g·L−1 yeast extract, 0.5 g·L−1 tryptone, and 0.5 g·L−1 d-glucose).
Microorganisms 09 02088 g004
Figure 5. BTX degradation pathways. KEGG orthology (KO) identifiers were assigned to individual genes in the genomes of benzene, toluene, and/or ortho(o)-, meta(m)-, para(p)-xylene (BTX) degraders Bacillus licheniformis VSD4, Pseudomonas sp. VS38, and Rhodotorula sp. VS67, followed by reconstruction of KEGG pathways related to BTX degradation, categorized in the ortho- and meta-cleavage of catechol (I/II), dioxygenase, dehydrogenase (III), and monooxygenase (IV) reactions. Arrows highlighted in color indicate the presence of the respective enzyme-coding gene (homolog) in the specified genome. No enzyme-coding homologs related to these KEGG BTX degradation pathways were found for Rhodotorula sp. VS67. xb/t benzene/toluene dioxygenase, yb/t cis-benzene/toluene dihydrodiol dehydrogenase, zo catechol 1,2-dioxygenase, zm catechol 2,3-dioxygenase.
Microorganisms 09 02088 g005
Table 1. Ambient air pollution parameters. Phylloplane black carbon (BC) load (n = 480) and ambient air BC, PM2.5, PM10, nitrogen dioxide (NO2), and ozone (O3) concentrations (n = 761) are given as mean values ± standard deviation (SD) for the six sampling sites. Low (bcL), medium (bcM), and high (bcH) phylloplane BC load. u Significantly different (p < 0.05) from HGa, v from HGb, w from HKa, x from HKb, y from DM, and z from DW. * No. of BC particles (×108) per g of leaf material.
Sampling Site BC
(µg·m−3)
PM2.5
(µg·m−3)
PM10
(µg·m−3)
NO2
(µg·m−3)
O3
(µg·m−3)
Phylloplane BC Load *
HGabcM1.9 ± 1.0 vwxyz14.1 ± 9.2 yz22.7 ± 10.4 xyz34.2 ± 12.5 vwxyz42.9 ± 21.5 vwxyz1.9 ± 2.4 wxyz
HGb 1.5 ± 0.8 uwxyz13.7 ± 9.2 yz22.2 ± 10.5 yz28.9 ± 10.6 uwxyz46.9 ± 22.1 uxyz1.7 ± 2.3 wxyz
HKabcH1.3 ± 0.7 uvyz13.0 ± 9.221.3 ± 10.422.4 ± 9.2 uvxyz49.9 ± 22.1 uz4.1 ± 3.8 uvyz
HKb 1.1 ± 0.7 uvyz12.9 ± 9.221.1 ± 10.5 u20.7 ± 8.9 uvwyz51.0 ± 22.2 uv4.4 ± 3.4 uvyz
DMbcL0.9 ± 0.6 uvwx12.1 ± 8.7 uv19.8 ± 10.0 uv18.5 ± 7.4 uvwxz52.1 ± 22.5 uv0.6 ± 0.7 uvwx
DW 0.9 ± 0.5 uvwx12.2 ± 8.9 uv20.1 ± 10.3 uv16.8 ± 7.7 uvwxy53.6 ± 22.5 uvw0.7 ± 0.9 uvwx
Publisher’s Note: MDPI stays neutral with regard to jurisdictional claims in published maps and institutional affiliations.