Host–Pathogen Interactions between Xanthomonas fragariae and Its Host Fragaria × ananassa Investigated with a Dual RNA-Seq Analysis


Abstract
1. Introduction
2. Materials and Methods
2.1. Bacterial Strain and Bacterial Preparation
2.2. Plant Inoculation and Leaf Collection
2.3. RNA Extraction from Plant Material
2.4. RNA Quantification, Qualification, and DNase Treatment
2.5. RNA Processing and Sequencing
2.6. Bioinformatics
3. Results and Discussion
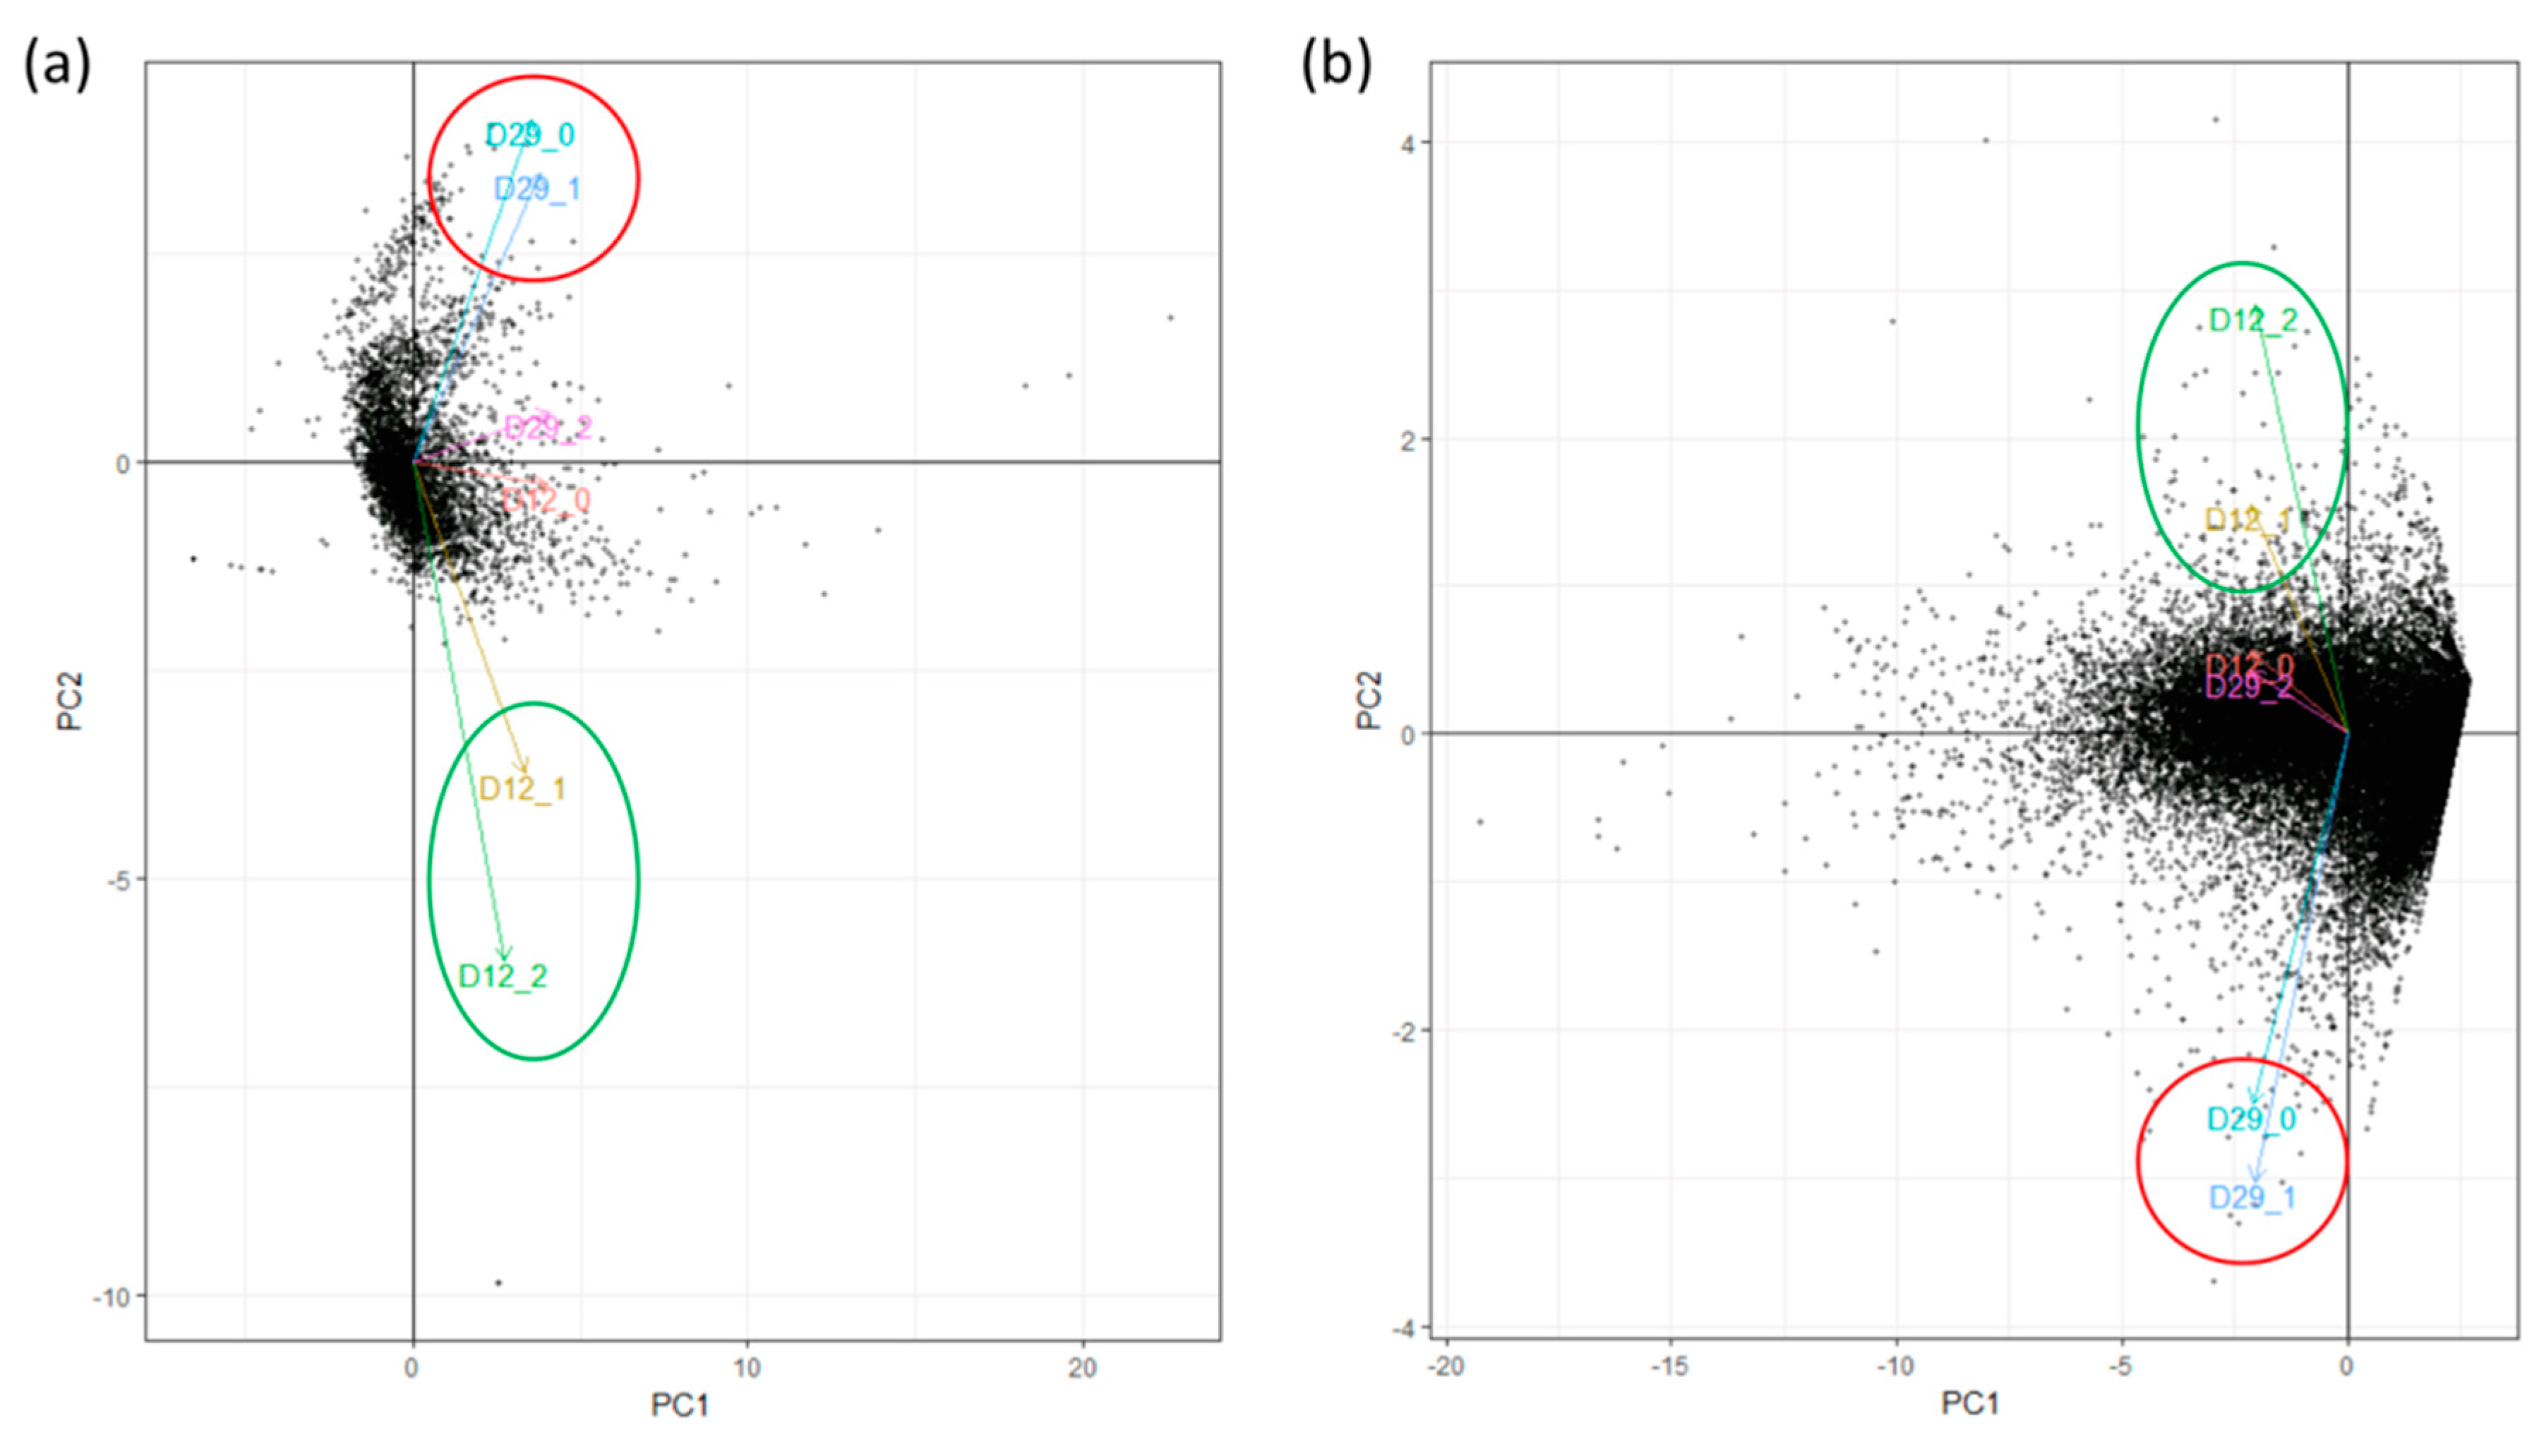
3.1. Sequenced RNA Reads Selection
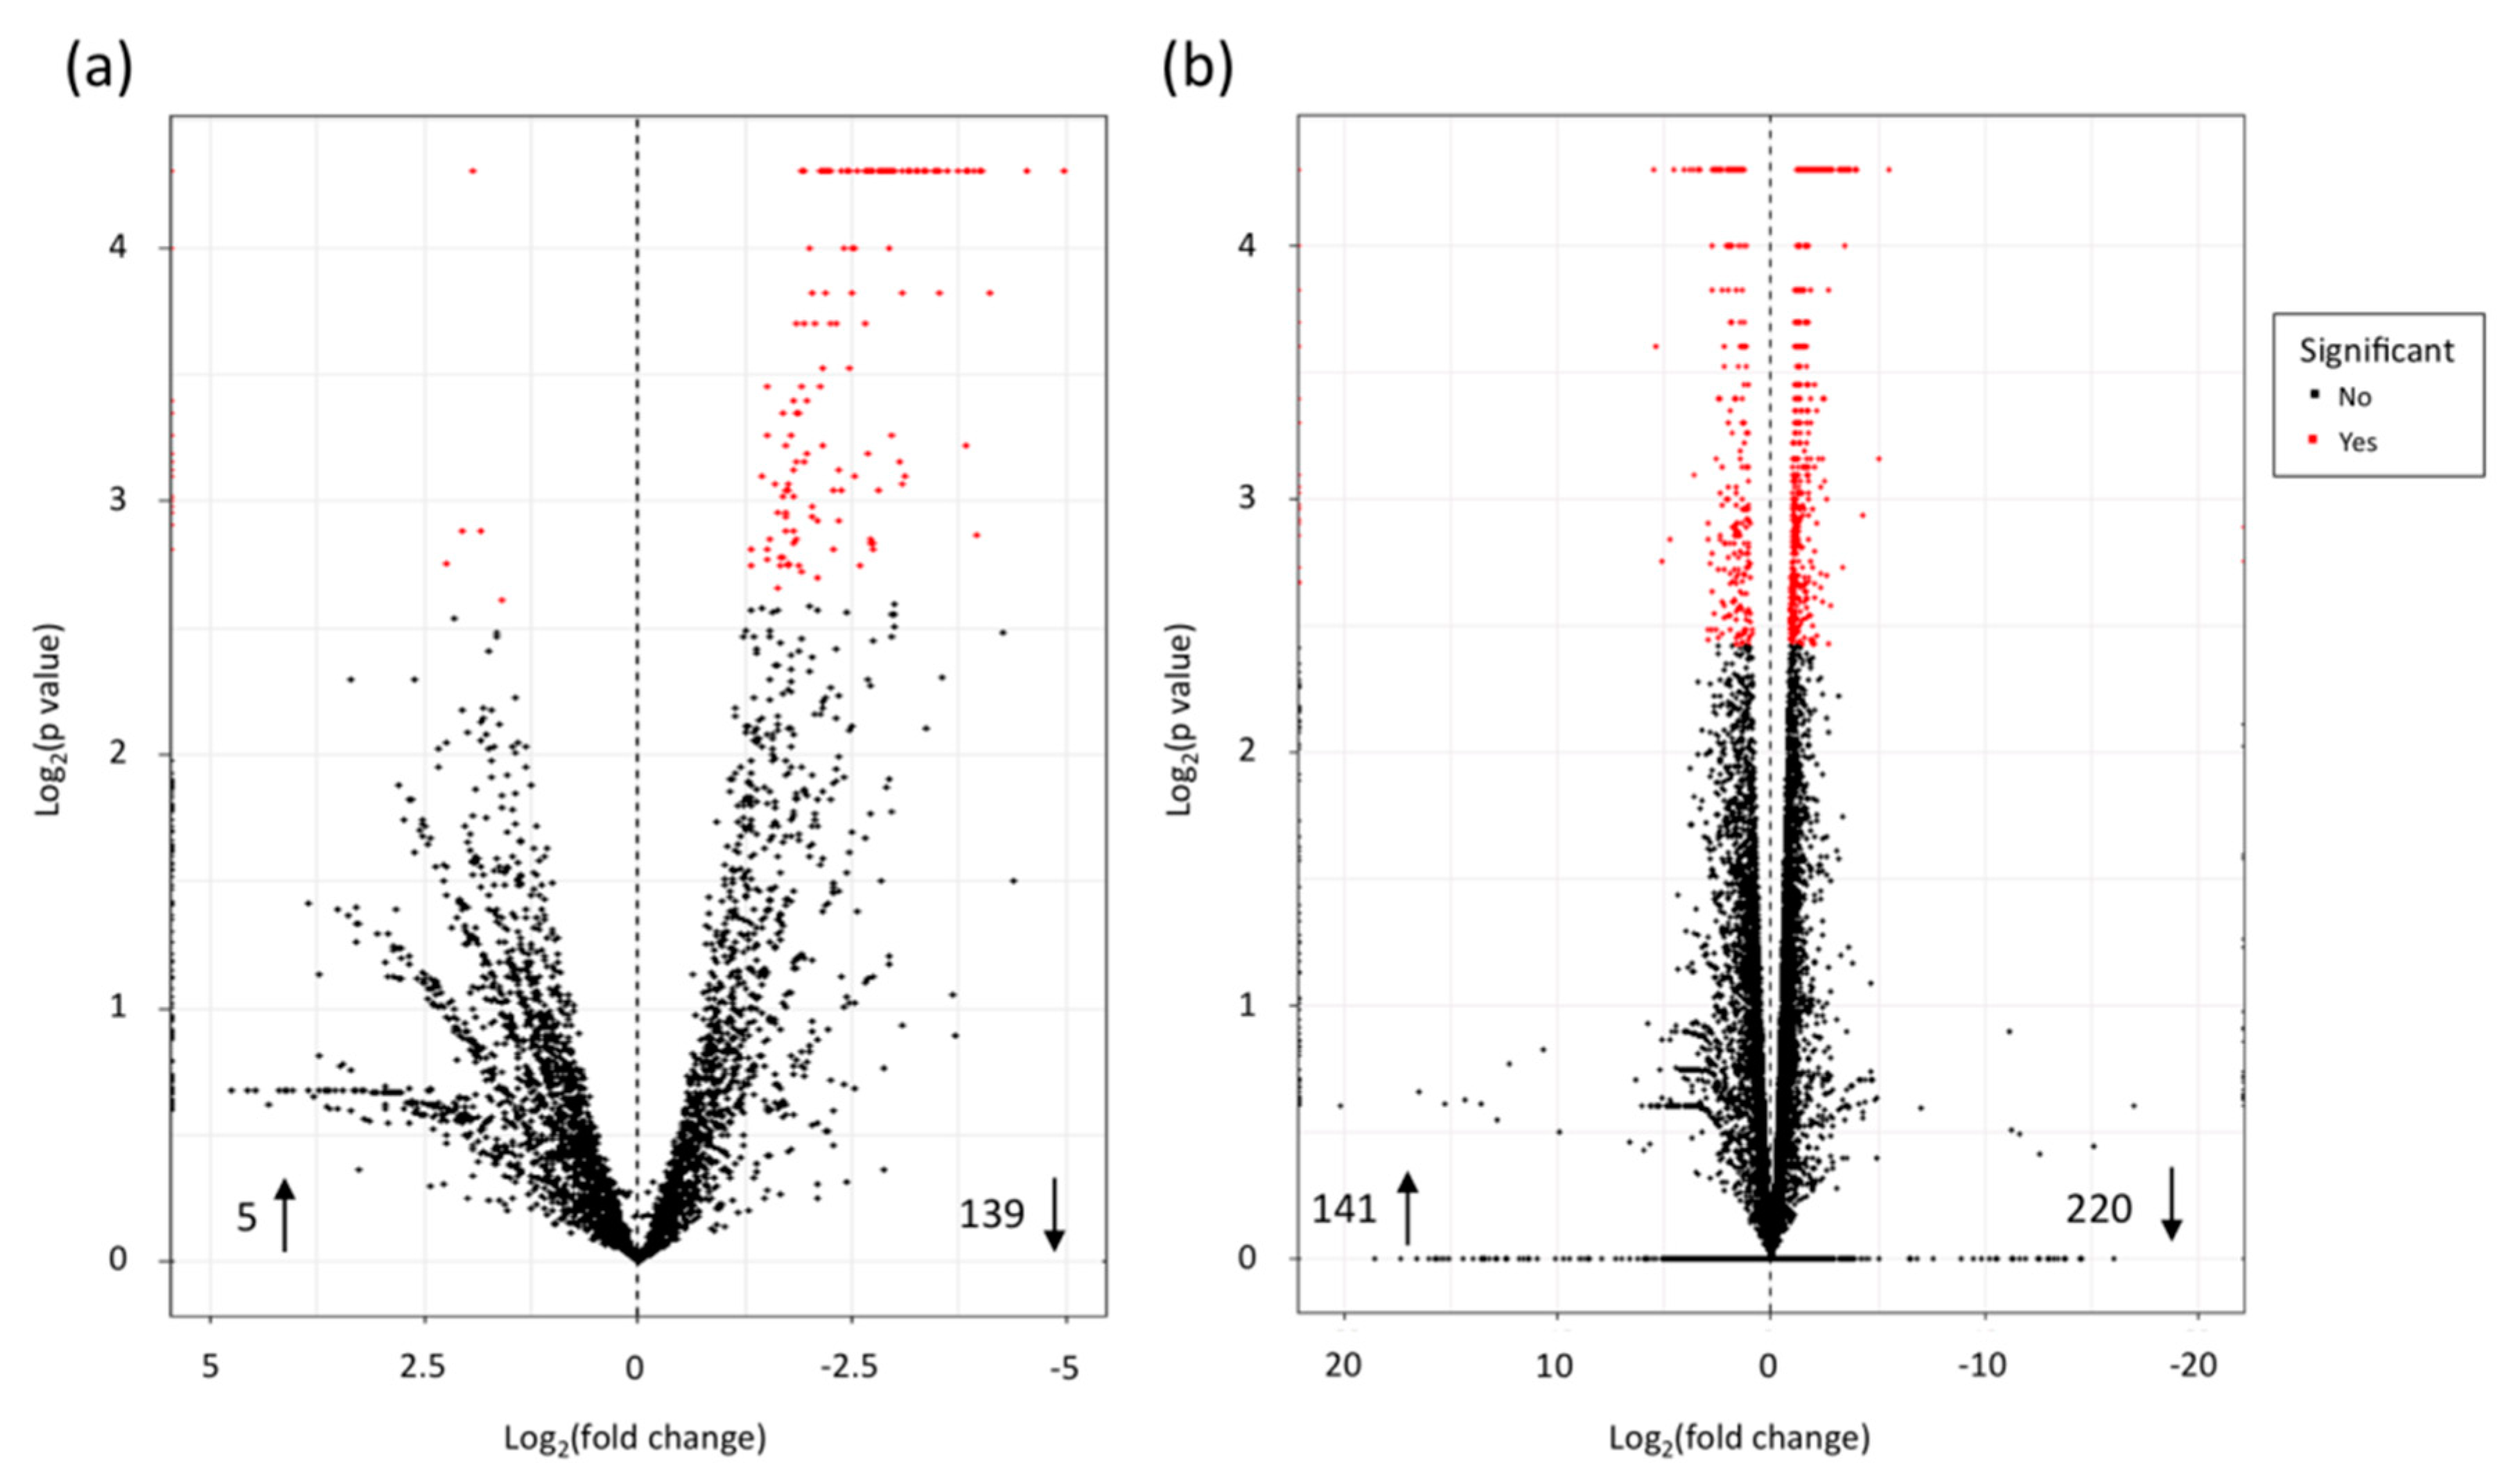
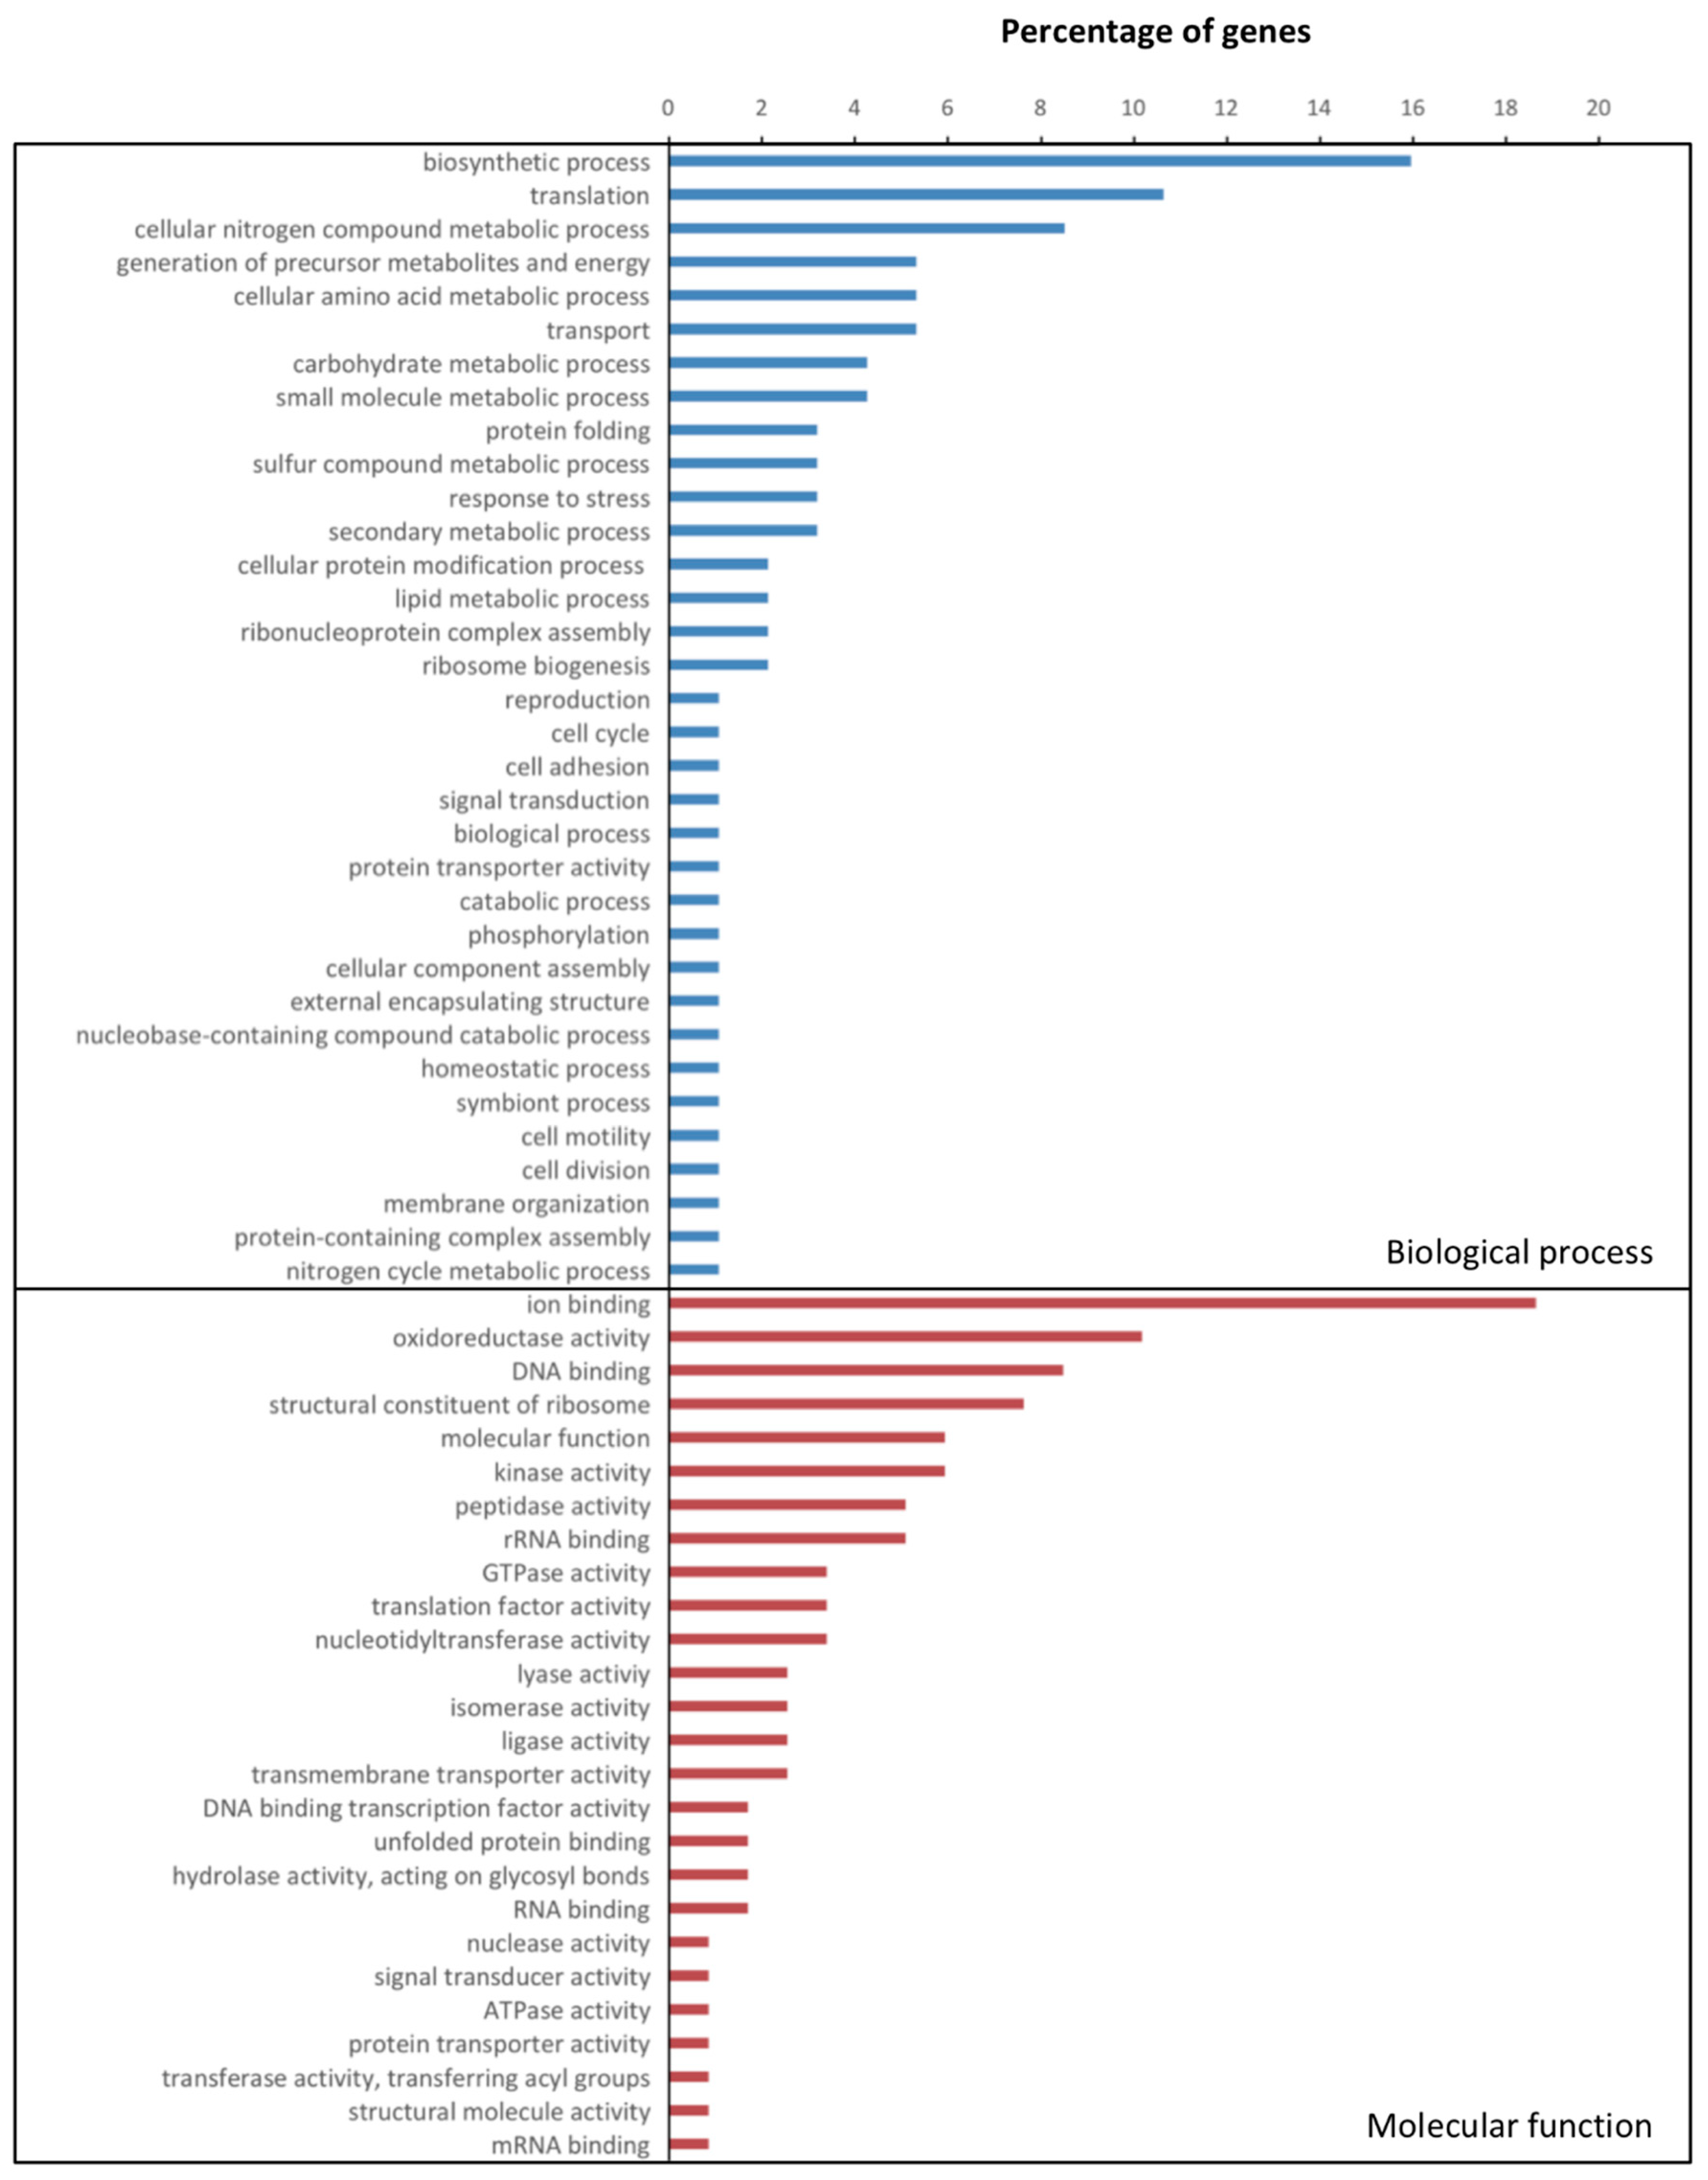
3.2. Gene Expression in X. Fragariae
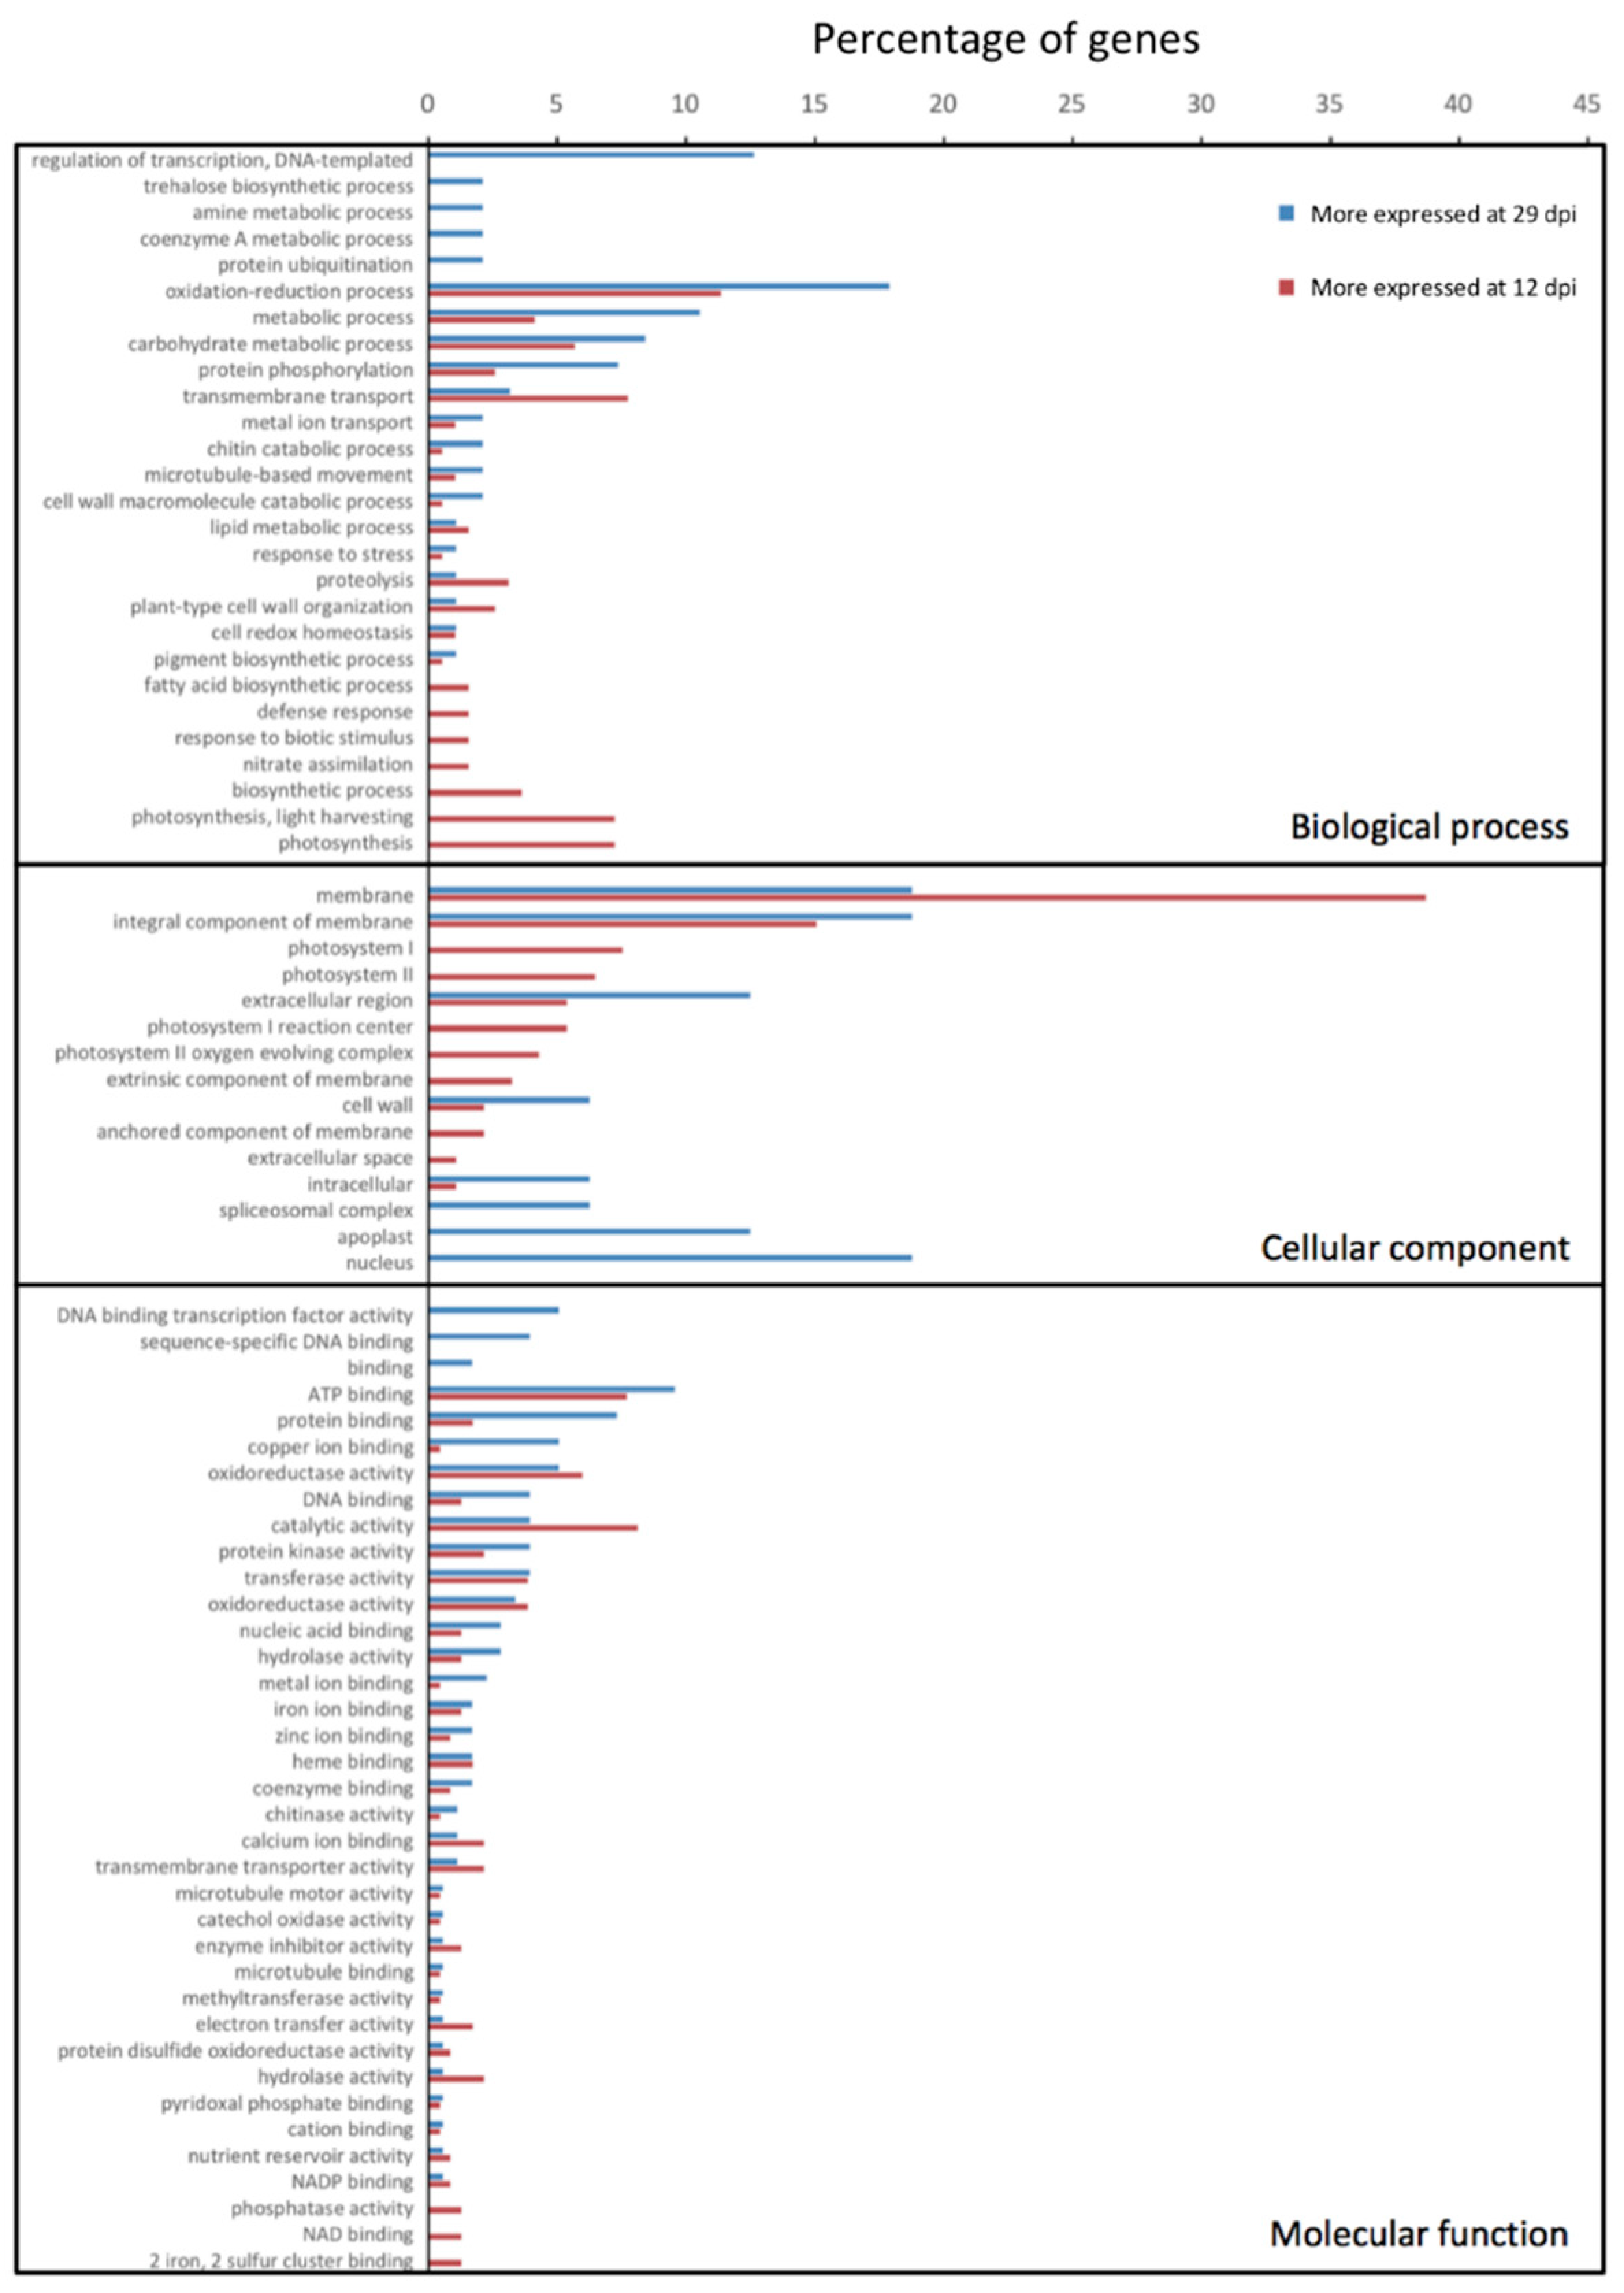
3.3. Gene Expression in Strawberry
4. Conclusions
Supplementary Materials
Author Contributions
Funding
Acknowledgments
Conflicts of Interest
References
- Dangl, J.L.; Jones, J.D.G. Plant pathogens and integrated defence responses to infection. Nature 2001, 411, 826–833. [Google Scholar] [CrossRef] [PubMed]
- Hancock, J.F.; Sjulin, T.M.; Lobos, G.A. Strawberries. In Temperate Fruit Crop Breeding: Germplasm to Genomics; Hancock, J.F., Ed.; Springer: Dordrecht, The Netherlands, 2008; pp. 393–437. [Google Scholar]
- Zhang, J.; Wang, X.; Yu, O.; Tang, J.; Gu, X.; Wan, X.; Fang, C. Metabolic profiling of strawberry (Fragaria × ananassa Duch.) during fruit development and maturation. J. Exp. Bot. 2011, 62, 1103–1118. [Google Scholar] [CrossRef] [PubMed]
- Amil-Ruiz, F.; Blanco-Portales, R.; Muñoz-Blanco, J.; Caballero, J.L. The strawberry plant defense mechanism: A molecular review. Plant Cell Physiol. 2011, 52, 1873–1903. [Google Scholar] [CrossRef] [PubMed]
- Njuguna, W.; Liston, A.; Cronn, R.; Ashman, T.-L.; Bassil, N. Insights into phylogeny, sex function and age of Fragaria based on whole chloroplast genome sequencing. Mol. Phylogen. Evol. 2013, 66, 17–29. [Google Scholar] [CrossRef] [PubMed]
- Akiyama, Y.; Yamamoto, Y.; Ohmido, N.; Ohshima, M.; Fukui, K. Estimation of the nuclear DNA content of strawberries (Fragaria spp.) compared with Arabidopsis thaliana by using dual-step flow cytometry. Cytologia 2001, 66, 431–436. [Google Scholar] [CrossRef]
- Davis, T.M.; Denoyes-Rothan, B.; Lerceteau-Köhler, E. Strawberry. In Genome Mapping and Molecular Breeding in Plants: Fruits and Nuts; Kole, C., Ed.; Springer: Berlin, Germany, 2007; Volume 4, pp. 189–205. [Google Scholar]
- Sánchez-Sevilla, J.F.; Vallarino, J.G.; Osorio, S.; Bombarely, A.; Posé, D.; Merchante, C.; Botella, M.A.; Amaya, I.; Valpuesta, V. Gene expression atlas of fruit ripening and transcriptome assembly from RNA-seq data in octoploid strawberry (Fragaria × ananassa). Sci. Rep. 2017, 7, 13737. [Google Scholar] [CrossRef]
- Hirakawa, H.; Shirasawa, K.; Kosugi, S.; Tashiro, K.; Nakayama, S.; Yamada, M.; Kohara, M.; Watanabe, A.; Kishida, Y.; Fujishiro, T.; et al. Dissection of the octoploid strawberry genome by deep sequencing of the genomes of Fragaria species. DNA Res. 2014, 21, 169–181. [Google Scholar] [CrossRef]
- Slovin, J.; Michael, T. Structural and functional genomics. In Genetics, Genomics and Breeding of Berries; Science Publisher: Enfield, NH, USA, 2011; pp. 240–308. [Google Scholar]
- Shulaev, V.; Sargent, D.J.; Crowhurst, R.N.; Mockler, T.C.; Folkerts, O.; Delcher, A.L.; Jaiswal, P.; Mockaitis, K.; Liston, A.; Mane, S.P.; et al. The genome of woodland strawberry (Fragaria vesca). Nat. Genet. 2010, 43, 109. [Google Scholar] [CrossRef]
- Edger, P.P.; VanBuren, R.; Colle, M.; Poorten, T.J.; Wai, C.M.; Niederhuth, C.E.; Alger, E.I.; Ou, S.; Acharya, C.B.; Wang, J.; et al. Single-molecule sequencing and optical mapping yields an improved genome of woodland strawberry (Fragaria vesca) with chromosome-scale contiguity. GigaScience 2017, 7, 1–7. [Google Scholar] [CrossRef]
- Martin, R.R.; Tzanetakis, I.E. Characterization and recent advances in detection of strawberry viruses. Plant Dis. 2006, 90, 384–396. [Google Scholar] [CrossRef]
- Martin, R.R.; Tzanetakis, I.E. High risk strawberry viruses by region in the United States and Canada: Implications for certification, nurseries, and fruit production. Plant Dis. 2013, 97, 1358–1362. [Google Scholar] [CrossRef] [PubMed]
- EPPO. PM 3/83 (1) Fragaria plants for planting—inspection of places of production. EPPO Bull. 2017, 47, 349–365. [Google Scholar] [CrossRef]
- Kennedy, B.; King, T. Angular leafspot, a new disease of strawberry. Phytopathology 1960, 50, 641–642. [Google Scholar]
- Maas, J. Part II: Infectious diseases - Angular leaf spot. In Compendium of Strawberry Diseases, 2nd ed.; Maas, J., Ed.; Amer. Phytopathological Society: St. Paul, MN, USA, 1998; pp. 16–17. [Google Scholar] [CrossRef]
- EPPO. Xanthomonas fragariae Kennedy & King. EPPO Bull. 1986, 16, 17–20. [Google Scholar] [CrossRef]
- EPPO. Xanthomonas fragariae. EPPO Bull. 2006, 36, 135–144. [CrossRef]
- Rat, B. Xanthomonas fragariae: Cause of angular leaf spot of strawberry. In Xanthomonas; Swings, J.G., Civerolo, E.L., Eds.; Chapman & Hall: London, UK, 1993; pp. 69–70. [Google Scholar]
- Bestfleisch, M.; Richter, K.; Wensing, A.; Wünsche, J.; Hanke, M.-V.; Höfer, M.; Schulte, E.; Flachowsky, H. Resistance and systemic dispersal of Xanthomonas fragariae in strawberry germplasm (Fragaria L.). Plant Pathol. 2015, 64, 71–80. [Google Scholar] [CrossRef]
- Hildebrand, D.; Schroth, M.; Wilhelm, S. Systemic invasion of strawberry by Xanthomonas fragariae causing vascular collapse. Phytopathology 1967, 57, 1260. [Google Scholar]
- Gétaz, M.; Krijger, M.; Rezzonico, F.; Smits, T.H.M.; van der Wolf, J.M.; Pothier, J.F. Genome-based population structure analysis of the plant pathogen Xanthomonas fragariae indicates two potential sources and pathways of bacterial spread through plant material trade. Microb. Genom. 2018, 4. [Google Scholar] [CrossRef]
- Gétaz, M.; Van der Wolf, J.M.; Blom, J.; Pothier, J.F. Complete genome sequences of three isolates of Xanthomonas fragariae, the bacterium responsible for angular leaf spots on strawberry plants. Genome Announc. 2017, 5, e00632-17. [Google Scholar] [CrossRef]
- Henry, P.M.; Leveau, J.H.J. Finished genome sequences of Xanthomonas fragariae, the cause of bacterial angular leaf spot of strawberry. Genome Announc. 2016, 4, e01271-16. [Google Scholar] [CrossRef]
- Gétaz, M.; Blom, J.; Smits, T.H.M.; Pothier, J.F. Comparative genomics of Xanthomonas fragariae and Xanthomonas arboricola pv. fragariae reveals intra- and interspecies variations. Phytopathol. Res. 2020, 2, 17. [Google Scholar] [CrossRef]
- Peyraud, R.; Dubiella, U.; Barbacci, A.; Genin, S.; Raffaele, S.; Roby, D. Advances on plant–pathogen interactions from molecular toward systems biology perspectives. Plant J. 2017, 90, 720–737. [Google Scholar] [CrossRef] [PubMed]
- De Vos, R.C.H.; Moco, S.; Lommen, A.; Keurentjes, J.J.B.; Bino, R.J.; Hall, R.D. Untargeted large-scale plant metabolomics using liquid chromatography coupled to mass spectrometry. Nat. Protoc. 2007, 2, 778. [Google Scholar] [CrossRef] [PubMed]
- Dettmer, K.; Aronov Pavel, A.; Hammock Bruce, D. Mass spectrometry-based metabolomics. Mass Spectrom. Rev. 2006, 26, 51–78. [Google Scholar] [CrossRef]
- Shulaev, V.; Cortes, D.; Miller, G.; Mittler, R. Metabolomics for plant stress response. Physiol. Plant. 2008, 132, 199–208. [Google Scholar] [CrossRef]
- Kim, M.S.; Jin, J.S.; Kwak, Y.-S.; Hwang, G.-S. Metabolic response of strawberry (Fragaria × ananassa) leaves exposed to the angular leaf spot bacterium (Xanthomonas fragariae). J. Agric. Food Chem. 2016, 64, 1889–1898. [Google Scholar] [CrossRef]
- Ponce-Valadez, M.; Fellman, S.M.; Giovannoni, J.; Gan, S.-S.; Watkins, C.B. Differential fruit gene expression in two strawberry cultivars in response to elevated CO2 during storage revealed by a heterologous fruit microarray approach. Postharvest Biol. Technol. 2009, 51, 131–140. [Google Scholar] [CrossRef]
- Aharoni, A.; Keizer, L.C.; Bouwmeester, H.J.; Sun, Z.; Alvarez-Huerta, M.; Verhoeven, H.A.; Blaas, J.; van Houwelingen, A.M.M.L.; De Vos, R.C.H.; van der Voet, H.; et al. Identification of the SAAT gene involved in strawberry flavor biogenesis by use of DNA microarrays. Plant Cell 2000, 12, 647–661. [Google Scholar] [CrossRef]
- Aharoni, A.; Keizer, L.C.P.; Van Den Broeck, H.C.; Blanco-Portales, R.; Muñoz-Blanco, J.; Bois, G.; Smit, P.; De Vos, R.C.H.; Connell, A.P. Novel insight into vascular, stress, and auxin-dependent and—Independent gene expression programs in strawberry, a non-climacteric fruit. Plant Physiol. 2002, 129, 1019. [Google Scholar] [CrossRef]
- Tao, Y.; Xie, Z.; Chen, W.; Glazebrook, J.; Chang, H.-S.; Han, B.; Zhu, T.; Zou, G.; Katagiri, F. Quantitative nature of Arabidopsis responses during compatible and incompatible interactions with the bacterial pathogen Pseudomonas syringae. Plant Cell 2003, 15, 317–330. [Google Scholar] [CrossRef]
- Bumgarner, R. DNA microarrays: Types, Applications and their future. Curr. Protoc. Mol. Biol. 2013. [Google Scholar] [CrossRef]
- Ozsolak, F.; Milos, P.M. RNA sequencing: Advances, challenges and opportunities. Nat. Rev. Genet. 2010, 12, 87. [Google Scholar] [CrossRef] [PubMed]
- Socquet-Juglard, D.; Kamber, T.; Pothier, J.F.; Christen, D.; Gessler, C.; Duffy, B.; Patocchi, A. Comparative RNA-seq analysis of early-infected peach leaves by the invasive phytopathogen Xanthomonas arboricola pv. pruni. PLoS ONE 2013, 8, e54196. [Google Scholar] [CrossRef] [PubMed]
- Chatnaparat, T.; Prathuangwong, S.; Lindow, S.E. Global pattern of gene expression of Xanthomonas axonopodis pv. glycines within soybean leaves. Mol. Plant Microbe Interact. 2016, 29, 508–522. [Google Scholar] [CrossRef] [PubMed]
- Noh, T.-H.; Song, E.-S.; Kim, H.-I.; Kang, M.-H.; Park, Y.-J. Transcriptome-based identification of differently expressed genes from Xanthomonas oryzae pv. oryzae strains exhibiting different virulence in rice varieties. Int. J. Mol. Sci. 2016, 17, 259. [Google Scholar] [CrossRef]
- Kamber, T.; Buchmann, J.P.; Pothier, J.F.; Smits, T.H.M.; Wicker, T.; Duffy, B. Fire blight disease reactome: RNA-seq transcriptional profile of apple host plant defense responses to Erwinia amylovora pathogen infection. Sci. Rep. 2016, 6, 21600. [Google Scholar] [CrossRef]
- Puławska, J.; Kałużna, M.; Warabieda, W.; Mikiciński, A. Comparative transcriptome analysis of a lowly virulent strain of Erwinia amylovora in shoots of two apple cultivars—susceptible and resistant to fire blight. BMC Genom. 2017, 18, 868. [Google Scholar] [CrossRef]
- Koike, H. The aluminium-cap method for testing sugarcane varieties against leaf scald disease. Phytopathology 1965, 55, 317–319. [Google Scholar]
- Kastelein, P.; Krijger, M.; Czajkowski, R.; van der Zouwen, P.S.; van der Schoor, R.; Jalink, H.; van der Wolf, J.M. Development of Xanthomonas fragariae populations and disease progression in strawberry plants after spray-inoculation of leaves. Plant Pathol. 2014, 63, 255–263. [Google Scholar] [CrossRef]
- Christou, A.; Georgiadou, E.C.; Filippou, P.; Manganaris, G.A.; Fotopoulos, V. Establishment of a rapid, inexpensive protocol for extraction of high quality RNA from small amounts of strawberry plant tissues and other recalcitrant fruit crops. Gene 2014, 537, 169–173. [Google Scholar] [CrossRef]
- Weller, S.A.; Beresford-Jones, N.J.; Hall, J.; Thwaites, R.; Parkinson, N.; Elphinstone, J.G. Detection of Xanthomonas fragariae and presumptive detection of Xanthomonas arboricola pv. fragariae, from strawberry leaves, by real-time PCR. J. Microbiol. Meth. 2007, 70, 379–383. [Google Scholar] [CrossRef] [PubMed]
- Chen, X.-R.; Brurberg, M.B.; Elameen, A.; Klemsdal, S.S.; Martinussen, I. Expression of resistance gene analogs in woodland strawberry (Fragaria vesca) during infection with Phytophthora cactorum. Mol. Genet. Genom. 2016, 291, 1967–1978. [Google Scholar] [CrossRef] [PubMed]
- Bolger, A.M.; Lohse, M.; Usadel, B. Trimmomatic: A flexible trimmer for Illumina sequence data. Bioinformatics 2014, 30, 2114–2120. [Google Scholar] [CrossRef] [PubMed]
- Langmead, B.; Salzberg, S.L. Fast gapped-read alignment with Bowtie 2. Nat. Methods 2012, 9, 357. [Google Scholar] [CrossRef] [PubMed]
- Li, H.; Handsaker, B.; Wysoker, A.; Fennell, T.; Ruan, J.; Homer, N.; Marth, G.; Abecasis, G.; Durbin, R. The sequence alignment/map format and SAMtools. Bioinformatics 2009, 25, 2078–2079. [Google Scholar] [CrossRef]
- Trapnell, C.; Roberts, A.; Goff, L.; Pertea, G.; Kim, D.; Kelley, D.R.; Pimentel, H.; Salzberg, S.L.; Rinn, J.L.; Pachter, L. Differential gene and transcript expression analysis of RNA-seq experiments with TopHat and Cufflinks. Nat. Protoc. 2012, 7, 562–578. [Google Scholar] [CrossRef]
- Goff, L.; Trapnell, C.; Kelley, C. cummeRbund: Analysis, Exploration, Manipulation, and Visualization of Cufflinks High-Throughput Sequencing Data; R Package: Madison, WI, USA, 2013. [Google Scholar]
- R Development Core Team. R: A Language and Environment for Statistical Computing; R Foundation for Statistical Computing: Vienna, Austria, 2008. [Google Scholar]
- Conesa, A.; Götz, S. Blast2GO: A comprehensive suite for functional analysis in plant genomics. Int. J. Plant Genom. 2008, 2008, 619832. [Google Scholar] [CrossRef]
- Benz, R. Channel formation by RTX-toxins of pathogenic bacteria: Basis of their biological activity. Biochim. Biophys. Acta 2016, 1858, 526–537. [Google Scholar] [CrossRef]
- Li, L.; Li, R.-F.; Ming, Z.-H.; Lu, G.-T.; Tang, J.-L. Identification of a novel type III secretion-associated outer membrane-bound protein from Xanthomonas campestris pv. campestris. Sci. Rep. 2017, 7, 42724. [Google Scholar] [CrossRef]
- Hausner, J.; Büttner, D. The YscU/FlhB homologue HrcU from Xanthomonas controls type III secretion and translocation of early and late substrates. Microbiology 2014, 160, 576–588. [Google Scholar] [CrossRef]
- Lonjon, F.; Turner, M.; Henry, C.; Rengel, D.; Lohou, D.; van de Kerkhove, Q.; Cazalé, A.-C.; Peeters, N.; Genin, S.; Vailleau, F. Comparative secretome analysis of Ralstonia solanacearum type 3 secretion-associated mutants reveals a fine control of effector delivery, essential for bacterial pathogenicity. Mol. Cell. Proteom. 2016, 15, 598–613. [Google Scholar] [CrossRef] [PubMed]
- Cunnac, S.; Boucher, C.; Genin, S. Characterization of the cis-acting regulatory element controlling HrpB-mediated activation of the type III secretion system and effector genes in Ralstonia solanacearum. J. Bacteriol. 2004, 186, 2309–2318. [Google Scholar] [CrossRef] [PubMed]
- Lonjon, F.; Lohou, D.; Cazalé, A.-C.; Büttner, D.; Ribeiro, B.G.; Péanne, C.; Genin, S.; Vailleau, F. HpaB-dependent secretion of type III effectors in the plant pathogens Ralstonia solanacearum and Xanthomonas campestris pv. vesicatoria. Sci. Rep. 2017, 7, 4879. [Google Scholar] [CrossRef]
- Puławska, J.; Kałużna, M.; Warabieda, W.; Pothier, J.F.; Gétaz, M.; Van der Wolf, J.M. Transcriptome analysis of Xanthomonas fragariae in strawberry leaves. Sci. Rep. under review.
- Sinha, D.; Gupta, M.K.; Patel, H.K.; Ranjan, A.; Sonti, R.V. Cell wall degrading enzyme induced rice innate immune responses are suppressed by the type 3 secretion system effectors XopN, XopQ, XopX and XopZ of Xanthomonas oryzae pv. oryzae. PLoS ONE 2013, 8, e75867. [Google Scholar] [CrossRef] [PubMed]
- Lim, S.-H.; So, B.-H.; Wang, J.-C.; Song, E.-S.; Park, Y.-J.; Lee, B.-M.; Kang, H.-W. Functional analysis of pilQ gene in Xanthomanas oryzae pv. oryzae, bacterial blight pathogen of rice. J. Microbiol. 2008, 46, 214–220. [Google Scholar] [CrossRef]
- Bahar, O.; Goffer, T.; Burdman, S. Type IV pili are required for virulence, twitching motility, and biofilm formation of Acidovorax avenae subsp. citrulli. Mol. Plant Microbe Interact. 2009, 22, 909–920. [Google Scholar] [CrossRef]
- Dunger, G.; Guzzo, C.R.; Andrade, M.O.; Jones, J.B.; Farah, C.S. Xanthomonas citri subsp. citri type IV pilus is required for twitching motility, biofilm development, and adherence. Mol. Plant Microbe Interact. 2014, 27, 1132–1147. [Google Scholar] [CrossRef]
- Kim, J.; Lee, J.-Y.; Lee, H.; Choi, J.Y.; Kim, D.H.; Wi, Y.M.; Peck, K.R.; Ko, K.S. Microbiological features and clinical impact of the type VI secretion system (T6SS) in Acinetobacter baumannii isolates causing bacteremia. Virulence 2017, 8, 1378–1389. [Google Scholar] [CrossRef]
- Hachani, A.; Allsopp, L.P.; Oduko, Y.; Filloux, A. The VgrG proteins are “à la carte” delivery systems for bacterial type VI effectors. J. Biol. Chem. 2014, 289, 17872–17884. [Google Scholar] [CrossRef]
- Cascales, E.; Cambillau, C. Structural biology of type VI secretion systems. Philos. Trans. R. Soc. Lond. Ser. B Biol. Sci. 2012, 367, 1102–1111. [Google Scholar] [CrossRef] [PubMed]
- Zheng, J.; Leung, K.Y. Dissection of a type VI secretion system in Edwardsiella tarda. Mol. Microbiol. 2007, 66, 1192–1206. [Google Scholar] [CrossRef] [PubMed]
- Silverman, J.M.; Brunet, Y.R.; Cascales, E.; Mougous, J.D. Structure and regulation of the type VI secretion system. Annu. Rev. Microbiol. 2012, 66, 453–472. [Google Scholar] [CrossRef] [PubMed]
- Basler, M.; Pilhofer, M.; Henderson, G.P.; Jensen, G.J.; Mekalanos, J.J. Type VI secretion requires a dynamic contractile phage tail-like structure. Nature 2012, 483, 182. [Google Scholar] [CrossRef] [PubMed]
- Basler, M. Type VI secretion system: Secretion by a contractile nanomachine. Philos. Trans. R. Soc. Lond. Ser. B Biol. Sci. 2015, 370, 20150021. [Google Scholar] [CrossRef]
- Ranford, J.C.; Henderson, B. Chaperonins in disease: Mechanisms, models, and treatments. Mol. Pathol. 2002, 55, 209–213. [Google Scholar] [CrossRef]
- Si, Y.; Yuan, F.; Chang, H.; Liu, X.; Li, H.; Cai, K.; Xu, Z.; Huang, Q.; Bei, W.; Chen, H. Contribution of glutamine synthetase to the virulence of Streptococcus suis serotype 2. Vet. Microbiol. 2009, 139, 80–88. [Google Scholar] [CrossRef]
- Loimaranta, V.; Hytönen, J.; Pulliainen, A.T.; Sharma, A.; Tenovuo, J.; Strömberg, N.; Finne, J. Leucine-rich repeats of bacterial surface proteins serve as common pattern recognition motifs of human scavenger receptor gp340. J. Biol. Chem. 2009, 284, 18614–18623. [Google Scholar] [CrossRef]
- Xu, R.-Q.; Blanvillain, S.; Feng, J.-X.; Jiang, B.-L.; Li, X.-Z.; Wei, H.-Y.; Kroj, T.; Lauber, E.; Roby, D.; Chen, B.; et al. AvrACXcc8004, a type III effector with a leucine-rich repeat domain from Xanthomonas campestris pathovar campestris confers avirulence in vascular tissues of Arabidopsis thaliana ecotype Col-0. J. Bacteriol. 2008, 190, 343–355. [Google Scholar] [CrossRef]
- Michaels, G.A. Variation in the proportion of 50S and 30S ribosomal subunits at different growth rates. J. Bacteriol. 1971, 107, 385–387. [Google Scholar] [CrossRef]
- Park, J.S.; Lee, W.C.; Yeo, K.J.; Ryu, K.-S.; Kumarasiri, M.; Hesek, D.; Lee, M.; Mobashery, S.; Song, J.H.; Kim, S.I.; et al. Mechanism of anchoring of OmpA protein to the cell wall peptidoglycan of the gram-negative bacterial outer membrane. FASEB J. 2012, 26, 219–228. [Google Scholar] [CrossRef] [PubMed]
- McClean, S.; Healy, M.E.; Collins, C.; Carberry, S.; O’Shaughnessy, L.; Dennehy, R.; Adams, Á.; Kennelly, H.; Corbett, J.M.; Carty, F.; et al. Linocin and OmpW are involved in attachment of the cystic fibrosis-associated pathogen Burkholderia cepacia complex to lung epithelial cells and protect mice against infection. Infect. Immun. 2016, 84, 1424–1437. [Google Scholar] [CrossRef]
- Ritter, A.; Com, E.; Bazire, A.; Goncalves, M.D.S.; Delage, L.; Pennec, G.L.; Pineau, C.; Dreanno, C.; Compère, C.; Dufour, A. Proteomic studies highlight outer-membrane proteins related to biofilm development in the marine bacterium Pseudoalteromonas sp. D41. Proteomics 2012, 12, 3180–3192. [Google Scholar] [CrossRef] [PubMed]
- Chng, S.-S.; Ruiz, N.; Chimalakonda, G.; Silhavy, T.J.; Kahne, D. Characterization of the two-protein complex in Escherichia coli responsible for lipopolysaccharide assembly at the outer membrane. Proc. Natl. Acad. Sci. USA 2010, 107, 5363. [Google Scholar] [CrossRef] [PubMed]
- Polissi, A.; Sperandeo, P. The lipopolysaccharide export pathway in Escherichia coli: Structure, organization and regulated assembly of the Lpt machinery. Mar. Drugs 2014, 12, 1023–1042. [Google Scholar] [CrossRef] [PubMed]
- Limoli, D.H.; Jones, C.J.; Wozniak, D.J. Bacterial extracellular polysaccharides in biofilm formation and function. In Microbial Biofilms, Second Edition; American Society of Microbiology: Washington, DC, USA, 2015. [Google Scholar] [CrossRef]
- Saier, J.M.H.; Reddy, V.S.; Tsu, B.V.; Ahmed, M.S.; Li, C.; Moreno-Hagelsieb, G. The transporter classification database (TCDB): Recent advances. Nucleic Acids Res. 2016, 44, D372–D379. [Google Scholar] [CrossRef]
- Expert, D.; Franza, T.; Dellagi, A. Iron in plant–pathogen interactions. In Molecular Aspects of Iron Metabolism in Pathogenic and Symbiotic Plant–Microbe Associations; Expert, D., O’Brian, M.R., Mark, R., Eds.; Springer Briefs in Biometals: Dordrecht, Germany, 2012. [Google Scholar] [CrossRef]
- Henry, P.M.; Gebben, S.J.; Tech, J.J.; Yip, J.L.; Leveau, J.H.J. Inhibition of Xanthomonas fragariae, causative agent of angular leaf spot of strawberry, through iron deprivation. Front. Microbiol. 2016, 7, 1589. [Google Scholar] [CrossRef]
- Mendgen, K.; Hahn, M. Plant infection and the establishment of fungal biotrophy. Trends Plant Sci. 2002, 7, 352–356. [Google Scholar] [CrossRef]
- Vandroemme, J.; Cottyn, B.; Baeyen, S.; De Vos, P.; Maes, M. Draft genome sequence of Xanthomonas fragariae reveals reductive evolution and distinct virulence-related gene content. BMC Genom. 2013, 14, 829. [Google Scholar] [CrossRef]
- Kraepiel, Y.; Barny, M.A. Gram-negative phytopathogenic bacteria, all hemibiotrophs after all? Mol. Plant Pathol. 2016, 17, 313–316. [Google Scholar] [CrossRef]
- Ghanta, S.; Chattopadhyay, S. Glutathione as a signaling molecule: Another challenge to pathogens. Plant Signal. Behav. 2011, 6, 783–788. [Google Scholar] [CrossRef]
- Xu, J.; Wang, X.-y.; Guo, W.-Z. The cytochrome P450 superfamily: Key players in plant development and defense. J. Integr. Agric. 2015, 14, 1673–1686. [Google Scholar] [CrossRef]
- Dubreuil-Maurizi, C.; Vitecek, J.; Marty, L.; Branciard, L.; Frettinger, P.; Wendehenne, D.; Meyer, A.J.; Mauch, F.; Poinssot, B. Glutathione deficiency of the Arabidopsis mutant pad2–1 affects oxidative stress-related events, defense gene expression, and the hypersensitive response. Plant Physiol. 2011, 157, 2000–2012. [Google Scholar] [CrossRef] [PubMed]
- Hiruma, K.; Fukunaga, S.; Bednarek, P.; Piślewska-Bednarek, M.; Watanabe, S.; Narusaka, Y.; Shirasu, K.; Takano, Y. Glutathione and tryptophan metabolism are required for Arabidopsis immunity during the hypersensitive response to hemibiotrophs. Proc. Natl. Acad. Sci. USA 2013, 110, 9589–9594. [Google Scholar] [CrossRef] [PubMed]
- Liu, X.; Zhang, S.; Whitworth, R.J.; Stuart, J.J.; Chen, M.-S. Unbalanced activation of glutathione metabolic pathways suggests potential involvement in plant defense against the gall midge Mayetiola destructor in wheat. Sci. Rep. 2015, 5, 8092. [Google Scholar] [CrossRef] [PubMed]
- Mizutani, M. Impacts of diversification of cytochrome P450 on plant metabolism. Biol. Pharm. Bull. 2012, 35, 824–832. [Google Scholar] [CrossRef]
- Belkhadir, Y.; Subramaniam, R.; Dangl, J.L. Plant disease resistance protein signaling: NBS–LRR proteins and their partners. Curr. Opin. Plant Biol. 2004, 7, 391–399. [Google Scholar] [CrossRef]
- Ellis, J.; Dodds, P.; Pryor, T. Structure, function and evolution of plant disease resistance genes. Curr. Opin. Plant Biol. 2000, 3, 278–284. [Google Scholar] [CrossRef]
- Ng, A.; Xavier, R.J. Leucine-rich repeat (LRR) proteins: Integrators of pattern recognition and signaling in immunity. Autophagy 2011, 7, 1082–1084. [Google Scholar] [CrossRef]
- Wani, S.H.; Kumar, V.; Shriram, V.; Sah, S.K. Phytohormones and their metabolic engineering for abiotic stress tolerance in crop plants. Crop. J. 2016, 4, 162–176. [Google Scholar] [CrossRef]
- Wang, K.L.-C.; Li, H.; Ecker, J.R. Ethylene biosynthesis and signaling networks. Plant Cell 2002, 14, S131–S151. [Google Scholar] [CrossRef] [PubMed]
- Spaepen, S.; Vanderleyden, J. Auxin and plant-microbe interactions. Cold Spring Harb. Perspect. Biol. 2011, 3, a001438. [Google Scholar] [CrossRef] [PubMed]
- Bouchez, O.; Huard, C.; Lorrain, S.; Roby, D.; Balagué, C. Ethylene is one of the key elements for cell death and defense response control in the Arabidopsis lesion mimic mutant vad1. Plant Physiol. 2007, 145, 465–477. [Google Scholar] [CrossRef]
- Iqbal, N.; Khan, N.A.; Ferrante, A.; Trivellini, A.; Francini, A.; Khan, M.I.R. Ethylene role in plant growth, development and senescence: Interaction with other phytohormones. Front. Plant Sci. 2017, 8, 475. [Google Scholar] [CrossRef] [PubMed]
- Serrano, I.; Audran, C.; Rivas, S. Chloroplasts at work during plant innate immunity. J. Exp. Bot. 2016, 67, 3845–3854. [Google Scholar] [CrossRef]
- De Torres Zabala, M.; Littlejohn, G.; Jayaraman, S.; Studholme, D.; Bailey, T.; Lawson, T.; Tillich, M.; Licht, D.; Bölter, B.; Delfino, L.; et al. Chloroplasts play a central role in plant defence and are targeted by pathogen effectors. Nat. Plants 2015, 1, 15074. [Google Scholar] [CrossRef]
- Göhre, V.; Jones, A.M.E.; Sklenář, J.; Robatzek, S.; Weber, A.P.M. Molecular crosstalk between PAMP-triggered immunity and photosynthesis. Mol. Plant-Microbe Interact. 2012, 25, 1083–1092. [Google Scholar] [CrossRef]
- Khalaf, A.A.; Gmitter, F.G.; Conesa, A.; Dopazo, J.; Moore, G.A. Fortunella margarita transcriptional reprogramming triggered by Xanthomonas citri subsp. citri. BMC Plant Biol. 2011, 11, 159. [Google Scholar] [CrossRef]
- Bonfig, K.B.; Schreiber, U.; Gabler, A.; Roitsch, T.; Berger, S. Infection with virulent and avirulent P. syringae strains differentially affects photosynthesis and sink metabolism in Arabidopsis leaves. Planta 2006, 225, 1–12. [Google Scholar] [CrossRef]
- Bolton, M.D. Primary metabolism and plant defense—Fuel for the fire. Mol. Plant-Microbe Interact. 2009, 22, 487–497. [Google Scholar] [CrossRef]
- Niyogi, K.K. Safety valves for photosynthesis. Curr. Opin. Plant Biol. 2000, 3, 455–460. [Google Scholar] [CrossRef]
- Eulgem, T. Dissecting the WRKY web of plant defense regulators. PLoS Pathog. 2006, 2, e126. [Google Scholar] [CrossRef] [PubMed]
- Casado-Díaz, A.; Encinas-Villarejo, S.; Santos Berta de, l.; Schilirò, E.; Yubero-Serrano, E.M.; Amil-Ruíz, F.; Pocovi Mariana, I.; Pliego-Alfaro, F.; Dorado, G.; Rey, M.; et al. Analysis of strawberry genes differentially expressed in response to Colletotrichum infection. Physiol. Plant. 2006, 128, 633–650. [Google Scholar] [CrossRef]
- Olsen, A.N.; Ernst, H.A.; Leggio, L.L.; Skriver, K. NAC transcription factors: Structurally distinct, functionally diverse. Trends Plant Sci. 2005, 10, 79–87. [Google Scholar] [CrossRef]
- Cavalcanti, F.R.; Resende, M.L.V.D.; Pereira, R.B.; Costa, J.d.C.d.B.; Carvalho, C.P.d.S. Atividades de quitinase e beta-1,3-glucanase após eliciação das defesas do tomateiro contra a mancha-bacteriana. Pesqui. Agropecuária Bras. 2006, 41, 1721–1730. [Google Scholar] [CrossRef][Green Version]
- Yan, X.; Qiao, H.; Zhang, X.; Guo, C.; Wang, M.; Wang, Y.; Wang, X. Analysis of the grape (Vitis vinifera L.) thaumatin-like protein (TLP) gene family and demonstration that TLP29 contributes to disease resistance. Sci. Rep. 2017, 7, 4269. [Google Scholar] [CrossRef]
- Beffa, R.S.; Neuhaus, J.M.; Meins, F. Physiological compensation in antisense transformants: Specific induction of an “ersatz” glucan endo-1,3-beta-glucosidase in plants infected with necrotizing viruses. Proc. Natl. Acad. Sci. USA 1993, 90, 8792–8796. [Google Scholar] [CrossRef]


| Replicate | Raw Reads | Trimming and Filtering | Bacterial Mapping | Plant Mapping | |||
|---|---|---|---|---|---|---|---|
| Remaining Reads | Removed Reads (%) | Overall Aligned | Overall Aligned (%) | Overall Aligned | Overall Aligned (%) | ||
| 12 dpi leaf 1 1 | 65,512,500 | 56,513,044 | 13.74 | 4,806,523 | 8.51 | 39,162,615 | 69.30 |
| 12 dpi leaf 2 | 64,973,090 | 61,741,330 | 4.97 | 1,708,033 | 2.77 | 54,919,192 | 88.95 |
| 12 dpi leaf 3 | 44,154,658 | 41,413,993 | 6.21 | 1,235,070 | 2.98 | 37,562,210 | 90.70 |
| 29 dpi leaf 1 | 39,031,270 | 38,021,945 | 2.59 | 2,776,597 | 7.30 | 32,632,204 | 85.82 |
| 29 dpi leaf 2 | 79,106,667 | 70,440,561 | 10.95 | 3,101,000 | 4.40 | 58,772,409 | 83.44 |
| 29 dpi leaf 3 1 | 149,738,897 | 143,962,456 | 3.86 | 3,711,553 | 2.58 | 109,970,724 | 76.39 |
| Locus Tag | Locus: Position | Expression | Fold Change (Log2) | Protein Description |
|---|---|---|---|---|
| Ribosome | ||||
| PD885_RS14555 | NZ_LT853882.1: 3129676–3130403 | down | −1.82 | 30S ribosomal protein S5 |
| PD885_RS09535 | NZ_LT853882.1: 2044105–2045791 | down | −2.01 | 30S ribosomal protein S1 |
| PD885_RS14575 | NZ_LT853882.1: 3132158–3132464 | down | −3.53 | 30S ribosomal protein S14 |
| PD885_RS14625 | NZ_LT853882.1: 3136013–3136841 | down | −2.05 | 50S ribosomal protein L2 |
| PD885_RS01580 | NZ_LT853882.1: 348309–348738 | down | −2.15 | 50S ribosomal protein L13 |
| PD885_RS14700 | NZ_LT853882.1: 3154771–3155200 | down | −2.28 | 50S ribosomal protein L11 |
| PD885_RS14580 | NZ_LT853882.1: 3132482–3133025 | down | −2.52 | 50S ribosomal protein L5 |
| PD885_RS04680 | NZ_LT853882.1: 1026045–1026366 | down | −2.70 | 50S ribosomal protein L21 |
| PD885_RS14680 | NZ_LT853882.1: 3152571–3152937 | down | −3.07 | 50S ribosomal protein L7/L12 |
| T3SS | ||||
| PD885_RS06675 | NZ_LT853882.1: 1447891–1449712 | down | −2.73 | EscC/YscC/HrcC type III secretion system outer membrane ring |
| PD885_RS06645 | NZ_LT853882.1: 1442977–1443742 | down | −2.65 | EscJ/YscJ/HrcJ type III secretion inner membrane ring |
| PD885_RS06630 | NZ_LT853882.1: 1440799–1441873 | down | −2.24 | EscU/YscU/HrcU type III secretion system export apparatus switch |
| PD885_RS06635 | NZ_LT853882.1: 1442090–1442546 | down | −2.81 | HrpB1 family type III secretion system apparatus |
| PD885_RS06580 | NZ_LT853882.1: 1433397–1433868 | down | −3.99 | type III secretion protein HpaB |
| PD885_RS06680 | NZ_LT853882.1: 1449789–1450173 | down | −4.98 | type III secretion protein Hpa1 |
| PD885_RS06640 | NZ_LT853882.1: 1442583–1442976 | down | −2.54 | type III secretion protein HrpB2 |
| T3E | ||||
| PD885_RS01740 | NZ_LT853882.1: 376677–378864 | down | −2.39 | type III effector XopN |
| PD885_RS02910 | NZ_LT853882.1: 653223–653931 | down | −2.97 | type III effector XopR |
| PD885_RS17340 | NZ_LT853882.1: 3731049–3732024 | down | −1.89 | type III effector XopV |
| T4SS | ||||
| PD885_RS16190 | NZ_LT853882.1: 3471918–3473817 | down | −1.90 | type IV pilus secretin PilQ family protein–fimbrial assembly |
| T6SS | ||||
| PD885_RS10450 | NZ_LT853882.1: 2231241–2232738 | down | −1.65 | type VI secretion system contractile sheath large subunit EvpB |
| PD885_RS10445 | NZ_LT853882.1: 2230609–2231107 | down | −3.63 | type VI secretion system tube protein Hcp |
| PD885_RS04345 | NZ_LT853882.1: 944106–946857 | down | −1.72 | type VI secretion system tip protein VgrG |
| Chaperonin | ||||
| PD885_RS02005 | NZ_LT853882.1: 442628–444269 | down | −1.50 | molecule chaperonin GroEL |
| Regulation | ||||
| PD885_RS00915 | NZ_LT853882.1: 215236–216646 | down | −1.60 | type I glutamate–ammonia ligase–glutamine synthetase GlnA |
| LPS | ||||
| PD885_RS15075 | NZ_LT853882.1: 3219172–3222999 | down | −1.81 | LPS–assembly protein LptD–organic solvent tolerance protein |
| Biofilm, membrane | ||||
| PD885_RS13005 | NZ_LT853882.1: 2801740–2802466 | down | −1.75 | OmpA family protein–cell envelope biogenesis protein |
| PD885_RS03590 | NZ_LT853882.1: 788222–788894 | down | −1.98 | OmpW family protein–membrane protein |
| TonB | ||||
| PD885_RS16700 | NZ_LT853882.1: 3587957–3590420 | down | −1.83 | TonB-dependent receptor (TCDB: 1.B.14.1.28) |
| PD885_RS16470 | NZ_LT853882.1: 3524801–3527693 | down | −2.02 | TonB-dependent receptor (TCDB: 1.B.14.6.11) |
| General stress | ||||
| PD885_RS10575 | NZ_LT853882.1: 2269375–2269633 | down | −1.92 | stress-induced protein |
| PD885_RS12550 | NZ_LT853882.1: 2705902–2706391 | down | −1.95 | general stress protein |
| Recognition | ||||
| PD885_RS17775 | NZ_LT853882.1: 3832365–3832962 | down | −3.25 | Ax21 family protein |
| Motility | ||||
| PD885_RS10885 | NZ_LT853882.1: 2338459–2339659 | down | −3.34 | flagellin |
| Toxin | ||||
| PD885_RS16725 | NZ_LT853882.1: 3595055–3603270 | up | 1.93 | calcium-binding protein, Ca2+ binding protein, RTX toxin-related |
| Locus Tag | Locus: Position | Expression | Fold Change (Log2) | Gene Description |
|---|---|---|---|---|
| Glutathione metabolism | ||||
| FvH4_4g13000 | Fvb4: 16653443–16654859 | up | 2.45 | crocetin glucosyltransferase, chloroplastic-like |
| FvH4_5g05100 | Fvb5: 2978458–2983365 | up | 2.04 | probable alpha,alpha-trehalose-phosphate synthase |
| FvH4_4g09780 | Fvb4: 11758877–11762248 | up | 1.81 | probable alpha,alpha-trehalose-phosphate synthase [UDP-forming] |
| FvH4_2g40150 | Fvb2: 28671382–28672822 | up | 1.60 | anthocyanidin 3-O-glucosyltransferase 5-like |
| FvH4_7g22820 | Fvb7: 17936656–17943623 | up | 1.60 | crocetin glucosyltransferase, chloroplastic-like |
| FvH4_3g29980 | Fvb3: 23159280–23164945 | down | −1.78 | glucomannan 4-beta-mannosyltransferase 2 |
| FvH4_6g53560 | Fvb6: 39232986–39237091 | down | −2.23 | ribonucleoside-diphosphate reductase small chain |
| FvH4_7g31450 | Fvb7: 22725705–22729890 | down | −2.42 | starch synthase 1, chloroplastic/amyloplastic |
| FvH4_1g12090 | Fvb1: 6609415–6610712 | down | −4.00 | glyoxalase/fosfomycin resistance/dioxygenase domain |
| Cytochrome | ||||
| FvH4_4g29810 | Fvb4: 29777129–29779171 | up | 2.55 | cytochrome p450 78A5 |
| FvH4_2g40560 | Fvb2: 28894033–28900936 | up | 1.55 | cytochrome p450, family 82, subfamily C, polypeptide 4 |
| FvH4_2g07410 | Fvb2: 6119730–6121188 | up | 1.55 | allene oxide synthase-like |
| FvH4_5g27150 | Fvb5: 18417464–18422984 | down | −1.87 | ferric reduction oxidase 7, chloroplastic |
| FvH4_5g02700 | Fvb5: 1623401–1625033 | down | −1.98 | cytochrome p450 86A7 |
| FvH4_5g14010 | Fvb5: 7931662–7935314 | down | −2.05 | flavonoid 3’-monooxygenase |
| Auxin (AAI) | ||||
| FvH4_2g04750 | Fvb2: 3685624–3688124 | up | 2.09 | probable indole-3-acetic acid-amido synthetase GH3.1 |
| FvH4_7g17340 | Fvb7: 14759798–14760392 | down | −1.81 | auxin-induced protein X15-like |
| FvH4_6g44990 | Fvb6: 34565510–34570206 | down | −2.01 | probable indole-3-acetic acid-amido synthetase GH3.5 |
| FvH4_6g00660 | Fvb6: 378744–381847 | down | −2.32 | putative auxin efflux carrier component 8 |
| FvH4_6g34740 | Fvb6: 27411186–27411858 | down | −2.65 | auxin-binding protein ABP19a |
| Ethylene (ET) | ||||
| FvH4_5g19800 | Fvb5: 11637731–11638778 | up | 1.51 | ethylene-responsive transcription factor 5 |
| FvH4_5g38040 | Fvb5: 28094328–28096045 | up | 2.76 | aminocyclopropane-1-carboxylate oxidase homolog |
| FvH4_6g08370 | Fvb6: 4946527–4949032 | down | −1.71 | S-adenosylmethionine synthase 1-like |
| FvH4_4g21340 | Fvb4: 24380885–24383481 | down | −2.15 | S-adenosylmethionine synthase 2 |
| Leucin-rich repeat (LRR) | ||||
| FvH4_5g24920 | Fvb5: 16382894–16383420 | up | 2.20 | putative F-box/lrr-repeat protein 23 |
| FvH4_3g45520 | Fvb3: 37735078–37737977 | up | 2.16 | leucine-rich repeat receptor protein kinase EXS-like |
| FvH4_7g14060 | Fvb7: 12491034–12492810 | up | 1.87 | probable leucine-rich repeat receptor-like protein kinase At1g35710 |
| FvH4_5g23420 | Fvb5: 14763405–14766264 | up | 2.39 | disease resistance protein RPM1-like (LRR superfamily) |
| FvH4_7g24240 | Fvb7: 18726677–18731259 | down | −1.69 | probable lrr receptor-like serine/threonine-protein kinase At3g47570 |
| FvH4_2g05530 | Fvb2: 4568048–4570195 | down | −1.97 | leucine-rich repeat (lrr) family protein |
| WRKY domain containing protein | ||||
| FvH4_5g04360 | Fvb5: 2573220–2577327 | up | 2.75 | probable wrky transcription factor 53 |
| FvH4_4g06830 | Fvb4: 6132454–6133929 | up | 1.98 | probable wrky transcription factor 11 |
| FvH4_6g10510 | Fvb6: 6310957–6313581 | up | 1.87 | probable wrky transcription factor 33 |
| FvH4_2g41060 | Fvb2: 29128088–29130611 | up | 1.62 | probable wrky transcription factor 40 isoform X2 |
| NAC domain containing protein | ||||
| FvH4_4g31070 | Fvb4: 30387328–30388714 | up | 3.29 | NAC transcription factor 29-like |
| FvH4_2g16180 | Fvb2: 14147225–14149397 | up | 1.83 | NAC transcription factor 29 |
| FvH4_3g20690 | Fvb3: 13746269–13748147 | up | 1.80 | NAC domain-containing protein 72-like |
| Pathogenesis-related | ||||
| FvH4_4g30150 | Fvb4: 29928212–29930748 | up | 5.07 | beta-1,3-glucanase |
| FvH4_6g45580 | Fvb6: 34959190–34962068 | up | 1.94 | probable endo-1,3(4)-beta-glucanase |
| FvH4_4g10610 | Fvb4: 14349186–14350693 | up | 4.74 | chitinase 4-like |
| FvH4_1g10600 | Fvb1: 5814344–5815342 | up | 2.47 | endochitinase-like protein |
| FvH4_4g11930 | Fvb4: 15646302–15649061 | down | −1.80 | chitinase-like protein 1 |
| FvH4_6g16950 | Fvb6: 10815316–10816828 | up | 5.51 | thaumatin-like |
| FvH4_5g01820 | Fvb5: 1151603–1152293 | up | 4.12 | thaumatin, protein P21-like |
| FvH4_6g24670 | Fvb6: 18708864–18710041 | up | 2.76 | thaumatin-like protein 1b |
| FvH4_3g28370 | Fvb3: 21335348–21337404 | up | 4.57 | glucan endo-1,3-beta-glucosidase-like |
| FvH4_5g06210 | Fvb5: 3658609–3660218 | up | 3.76 | glucan endo-1,3-beta-glucosidase, basic isoform-like |
| FvH4_6g24680 | Fvb6: 18714133–18715667 | up | 2.28 | glucan endo-1,3-beta-glucosidase, basic isoform-like |
| FvH4_2g02860 | Fvb2: 2250275–2250770 | up | 2.81 | pathogenesis-related protein 1A-like (cysteine-rich) |
| FvH4_3g02840 | Fvb3: 1482707–1497385 | up | 2.15 | cysteine-rich receptor-like protein kinase 10 |
| FvH4_6g09980 | Fvb6: 5928404–5929569 | down | −1.55 | non-specific lipid-transfer protein 1-like isoform X1 |
| FvH4_6g09970 | Fvb6: 5915102–5916203 | down | −2.24 | lipid transfer protein 4 |
| FvH4_2g28920 | Fvb2: 22545044–22545446 | down | −2.84 | 14 kDa proline-rich protein DC2.15-like, lipip transfer |
| Photosynthesis/Chloroplastic/Carbon fixation/Glyconeogenesis/Citric acid cycle shung | ||||
| FvH4_3g21020 | Fvb3: 14037513–14039386 | down | −3.13 | chlorophyll a-b binding protein 13, chloroplastic |
| FvH4_6g40970 | Fvb6: 32372483–32373647 | down | −2.59 | chlorophyll a-b binding protein 151, chloroplastic |
| FvH4_6g41050 | Fvb6: 32391614–32398766 | down | −2.00 | chlorophyll a-b binding protein 151, chloroplastic-like, partial |
| FvH4_7g19750 | Fvb7: 16227980–16230030 | down | −1.91 | chlorophyll a-b binding protein 6, chloroplastic |
| FvH4_6g40150 | Fvb6: 31710858–31712682 | down | −2.02 | chlorophyll a-b binding protein 8, chloroplastic |
| FvH4_5g30940 | Fvb5: 21867161–21868613 | down | −2.40 | chlorophyll a-b binding protein CP24 10A, chloroplastic |
| FvH4_7g24350 | Fvb7: 18809164–18811045 | down | −2.52 | chlorophyll a-b binding protein CP29.3, chloroplastic isoform X1 |
| FvH4_6g38390 | Fvb6: 30344332–30345143 | down | −2.75 | chlorophyll a-b binding protein of LHCII type 1 |
| FvH4_6g32440 | Fvb6: 25477938–25478742 | down | −1.91 | chlorophyll a-b binding protein of LHCII type 1-like |
| FvH4_3g06120 | Fvb3: 3521880–3529614 | down | −2.34 | chlorophyll a-b binding protein of LHCII type 1-like |
| FvH4_6g38450 | Fvb6: 30386770–30387574 | down | −2.46 | chlorophyll a-b binding protein of LHCII type 1-like |
| FvH4_3g37660 | Fvb3: 32272449–32273253 | down | −2.51 | chlorophyll a-b binding protein of LHCII type 1-like |
| FvH4_1g09040 | Fvb1: 4778659–4780612 | down | −1.55 | chlorophyll a-b binding protein, chloroplastic |
| FvH4_4g23750 | Fvb4: 26130750–26132548 | down | −1.68 | chlorophyll a-b binding protein, chloroplastic |
| FvH4_6g44370 | Fvb6: 34191144–34193039 | down | −1.56 | cytochrome b6-f complex iron-sulfur subunit, chloroplastic |
| FvH4_2g13890 | Fvb2: 12167935–12172009 | down | −1.68 | fructose-1,6-bisphosphatase, cytosolic |
| FvH4_2g10390 | Fvb2: 9250051–9252469 | down | −1.74 | fructose-bisphosphate aldolase 1, chloroplastic |
| FvH4_4g25450 | Fvb4: 27213930–27219353 | down | −1.71 | glutamate-glyoxylate aminotransferase 2 |
| FvH4_6g54460 | Fvb6: 39756571–39759126 | down | −1.52 | glyceraldehyde-3-phosphate dehydrogenase A, chloroplastic |
| FvH4_5g25760 | Fvb5: 17250900–17253991 | down | −1.65 | glyceraldehyde-3-phosphate dehydrogenase B, chloroplastic |
| FvH4_2g02490 | Fvb2: 1986822–1989446 | down | −1.97 | malate dehydrogenase, glyoxysomal isoform X2 |
| FvH4_6g38900 | Fvb6: 30775176–30776861 | down | −1.85 | oxygen-evolving enhancer protein 2, chloroplastic |
| FvH4_3g02920 | Fvb3: 1561440–1563015 | down | −1.73 | oxygen-evolving enhancer protein 3–2, chloroplastic |
| FvH4_5g33740 | Fvb5: 24430492–24436620 | down | −1.92 | phosphoenolpyruvate carboxykinase [ATP] |
| FvH4_1g21630 | Fvb1: 13591226–13595458 | down | −1.69 | photosynthetic NDH subunit of lumenal location 4, chloroplastic |
| FvH4_4g15260 | Fvb4: 18876811–18877429 | down | −1.71 | photosystem I reaction center subunit II, chloroplastic-like |
| FvH4_3g11800 | Fvb3: 6971526–6972286 | down | −1.73 | photosystem I reaction center subunit III, chloroplastic |
| FvH4_3g09680 | Fvb3: 5629058–5631096 | down | −2.00 | photosystem I reaction center subunit psaK, chloroplastic |
| FvH4_3g41620 | Fvb3: 34939645–34940283 | down | −2.06 | photosystem I reaction center subunit V, chloroplastic |
| FvH4_6g31740 | Fvb6: 24848099–24849503 | down | −1.54 | photosystem I reaction center subunit VI, chloroplastic-like |
| FvH4_6g00530 | Fvb6: 323097–325385 | down | −1.68 | photosystem I reaction center subunit XI, chloroplastic |
| FvH4_2g26970 | Fvb2: 21549577–21552377 | down | −2.05 | photosystem II 22 kDa protein, chloroplastic |
| FvH4_2g31210 | Fvb2: 23984136–23987486 | down | −2.17 | photosystem II PsbX |
| FvH4_2g20470 | Fvb2: 17180656–17182221 | down | −1.57 | photosystem II reaction center Psb28 protein |
| FvH4_1g08270 | Fvb1: 4379754–4380126 | down | −2.13 | photosystem II protein |
| FvH4_2g14790 | Fvb2: 13006655–13015170 | down | −1.55 | probable glucuronosyltransferase |
| FvH4_1g24360 | Fvb1: 16228411–16233750 | down | −1.77 | probable polygalacturonase |
| FvH4_4g16670 | Fvb4: 20537377–20543743 | down | −1.58 | pyruvate, phosphate dikinase 2 |
| FvH4_3g15380 | Fvb3: 9556723–9560275 | down | −1.76 | sedoheptulose-1,7-bisphosphatase, chloroplastic-like |
© 2020 by the authors. Licensee MDPI, Basel, Switzerland. This article is an open access article distributed under the terms and conditions of the Creative Commons Attribution (CC BY) license (http://creativecommons.org/licenses/by/4.0/).
Share and Cite
Gétaz, M.; Puławska, J.; Smits, T.H.M.; Pothier, J.F. Host–Pathogen Interactions between Xanthomonas fragariae and Its Host Fragaria × ananassa Investigated with a Dual RNA-Seq Analysis. Microorganisms 2020, 8, 1253. https://doi.org/10.3390/microorganisms8081253
Gétaz M, Puławska J, Smits THM, Pothier JF. Host–Pathogen Interactions between Xanthomonas fragariae and Its Host Fragaria × ananassa Investigated with a Dual RNA-Seq Analysis. Microorganisms. 2020; 8(8):1253. https://doi.org/10.3390/microorganisms8081253
Chicago/Turabian StyleGétaz, Michael, Joanna Puławska, Theo H.M. Smits, and Joël F. Pothier. 2020. "Host–Pathogen Interactions between Xanthomonas fragariae and Its Host Fragaria × ananassa Investigated with a Dual RNA-Seq Analysis" Microorganisms 8, no. 8: 1253. https://doi.org/10.3390/microorganisms8081253
APA StyleGétaz, M., Puławska, J., Smits, T. H. M., & Pothier, J. F. (2020). Host–Pathogen Interactions between Xanthomonas fragariae and Its Host Fragaria × ananassa Investigated with a Dual RNA-Seq Analysis. Microorganisms, 8(8), 1253. https://doi.org/10.3390/microorganisms8081253