Abstract
Antarctica has one of the most extreme environments on Earth, with low temperatures and low nutrient levels. Antarctica’s organisms live primarily in the coastal, ice-free areas which cover approximately 0.18% of the continent’s surface. Members of Cyanobacteria and eukaryotic algae are important primary producers in Antarctica since they can synthesize organic compounds from carbon dioxide and water using solar energy. However, community structures of photosynthetic algae in Antarctica have not yet been fully explored at molecular level. In this study, we collected diverse algal samples in lacustrine and hydro-terrestrial environments of Langhovde and Skarvsnes, which are two ice-free regions in East Antarctica. We performed deep amplicon sequencing of both 16S ribosomal ribonucleic acid (rRNA) and 18S rRNA genes, and we explored the distribution of sequence variants (SVs) of these genes at single nucleotide difference resolution. SVs of filamentous Cyanobacteria genera, including Leptolyngbya, Pseudanabaena, Phormidium, Nodosilinea, Geitlerinama, and Tychonema, were identified in most of the samples, whereas Phormidesmis SVs were distributed in fewer samples. We also detected unicellular, multicellular or heterocyst forming Cyanobacteria strains, but in relatively small abundance. For SVs of eukaryotic algae, Chlorophyta, Cryptophyta, and Ochrophyta were widely distributed among the collected samples. In addition, there was a red colored bloom of eukaryotic alga, Geminigera cryophile (Cryptophyta), in the Langhovde coastal area. Eukaryotic SVs of Acutuncus antarcticus and/or Diphascon pingue of Tardigrada were dominant among most of the samples. Our data revealed the detailed structures of the algal communities in Langhovde and Skarvsnes. This will contribute to our understanding of Antarctic ecosystems and support further research into this subject.
1. Introduction
Photosynthesis is the most important biological process that converts solar energy into chemical energy. Members of Cyanobacteria, eukaryotic algae, and plants harbor two types of protein complex, namely photosystem I and II, and synthesize carbohydrate from carbon dioxide and water using light energy with production of oxygen [1]. These photoautotrophic organisms can inhabit environments that are free of organic carbons and serve as primary producers in most environments. Antarctica has one of the most extreme environments on earth, with low temperatures and low nutrient levels, and is perennially and almost entirely covered with thick ice. Living organisms in Antarctica are found primarily in the coastal, ice-free areas, which cover only 0.18% of the continent’s surface [2]. Cyanobacteria usually form microbial mats in the benthos of lakes, ponds, and streams [3]. Diverse eukaryotic algae, such as Chlorophyta (green algae), Bacillariophyta (diatoms), and Xanthophyta (yellow-green algae), have also been reported [4]. They are often exposed to severe physical stresses, such as high irradiation, desiccation, and freeze–thaw cycles [5]. Investigation of their community structures is important to reveal how they have adapted to the stressful environments.
Langhovde and Skarvsnes in Soya Coast, East Antarctica, are the research sites that have long been explored by the Japanese Antarctic Research Expedition. There are more than 50 lakes in these areas [6]. Most of these lakes are oligotrophic, where nutrient concentrations, such as nitrate, nitrite, ammonium, and phosphate, are lower than 0.1 mg l−1 [7]. In the bottom of these lakes, where the water does not freeze throughout the year [8], unique tower-like structures of microbial mats, called moss pillars, have been observed [9,10]. Studies using DNA cloning and sequencing of ribonucleic acid (rRNA) genes revealed the detailed community structure of the moss pillars in Lake Hotoke Ike in Skarvsnes [11,12]. The moss pillars consist of Leptobryum wilsonii and, in some cases, Bryum pseudotriquetrum [9,13]. The most dominant eukaryotic taxon in the moss pillars is Chytridiomycota (Fungi), which may be parasites and/or decomposers [11]. Ciliophora, Labyrinthulomycetes (Sagenista), and Tardigrades were also identified. For prokaryotes, the moss pillars are dominated by Proteobacteria, Cyanobacteria, Chloroflexi, and Planctomycetes [11]. Cyanobacteria genera such as Leptolyngbya, Nostoc, Phormidium, and Synechococcus are identified in the exterior part of the moss pillars [11]. Some Cyanobacteria may contribute to nitrogen cycling with their capacity of nitrogen fixation [14]. On the other hand, the community structures in littoral zones of the lakes and hydro-terrestrial environments, which are exposed to severer physical stresses compared with benthic environments, have not been fully explored at a molecular level in Langhovde and Skarvsnes. Recently, community structure of the surface sediment of littoral zone of Lake Yukidori Ike in Skarvsnes was analyzed using the DNA-cloning approach, identifying Proteobacteria, Cyanobacteria, Tardigrada, and Cryptomycoda (Fungi) as dominant taxa [15].
Deep amplicon sequencing of 16S and 18S rRNA genes, using next-generation sequencers, can detect living organisms with a high degree of sensitivity. This approach is replacing traditional analysis methods, such as DNA cloning or denaturing gradient gel electrophoresis (DGGE). The sequences produced by the next generation sequencers, such as the Illumina sequencers, contain ~0.1% sequence errors [16]. Traditionally, these sequences were clustered into operational taxonomic units (OTUs) based on a distance matrix at a specified threshold (e.g., 97% sequence identity), and representative sequences of the OTU were selected [17,18]. However, this approach ignores sequence variations below the identity threshold and causes inflation of minor OTUs containing sequencing errors. Recently, software packages that remove sequence errors have been developed [19,20,21]. These packages produce sequence variants (SVs) that are differentiated at single base-pair resolution, which overcomes the difficulties of the OTU-based approach.
In this study, we analyzed the structures of diverse algal communities in the lacustrine and hydro-terrestrial environments of Langhovde and Skarvsnes using deep amplicon sequencing of both 16S and 18S rRNA genes. We revealed that members of filamentous Cyanobacteria and Tardigrades were widespread in these environments. We also identified other SVs that were less widespread but dominant in specific environments. These results deepen our understanding of the diversity of the lacustrine and hydro-terrestrial ecosystems in East Antarctica.
2. Materials and Methods
2.1. Sampling Points
Langhovde and Skarvsnes are approximately 25 km and 50 km from Syowa Station on East Ongul Island, respectively (Figure 1A). In these areas, late May to mid-July is the winter season, with polar nights, whereas December to February is the summer season, with white nights. The number of days above 0 °C, recorded by automatic weather stations between 2010 and 2011, were 102 for Langhovde and 74 for Skarvsnes [22]. In the summer period, the average daily temperature was approximately 2 °C in both locations, with average solar radiation of ~200 W/m2 [22].
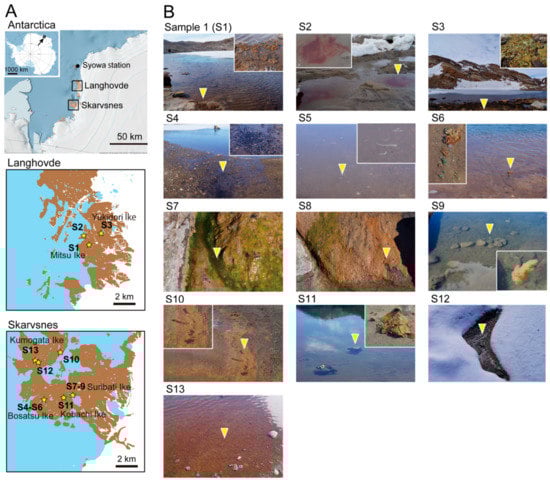
Figure 1.
Collection of algal samples. (A) Location of sampling sites in Langhovde and Skarvsnes. Sampling sites of S1-S13 were shown as yellow stars. Names of the lakes of the sampling points were shown accordingly. Map data were obtained from Quantarctica package (http://quantarctica.npolar.no/) or Geospatial Information Authority of Japan (https://www.gsi.go.jp/antarctic/) with modifications. (B) Photographs of sampling positions of S1-S13 samples. The inlet photographs show the enlargement of the sampling positions indicated by yellow triangles.
Samples were collected from lacustrine and hydro-terrestrial environments during the summer season, from December 24, 2018 to January 13, 2019, by the Japanese Antarctic Research Expedition. Latitude and longitude of the sampling points were measured using GPSMAP 64s (GARMIN Ltd., Schaffhausen, Switzerland) (Table S1). Samples S1–3 were collected in Langhovde: S1 was a brown mat isolated from Lake Mitsu Ike; S2 was a red colored bloom observed in a puddle of thawing snow in the coastal area; and S3 was a green and brown mat that was collected in Lake Yukidori Ike (Figure 1B). The S4–13 samples were collected in Skarvsnes: samples S4–6 were collected in Lake Bosatsu Ike (S4 and S6 were black and brown bacterial mats, respectively, and S5 was a small white filamentous aggregate floating on the surface of Lake Bosatsu Ike (Figure 1B)); samples S7–9 were collected near Lake Suribati Ike (S7 was a green colored aggregate found in a small stream near Lake Suribati Ike, S8 was a brown mat found near the stream, and S9 was a white aggregate floating on the surface of Lake Suribati Ike (Figure 1B)); S10 was a black and brown mat collected from Lake Neko Ike; S11 was a floating brown mat that originated from the benthic algal mat in Lake Kobachi Ike; S12 was a dark yellow mat collected from thawed soil near Lake Tokkuri Ike; and S13 was a orange mat, found at the bottom of the shallows in Lake Kumogata Ike. S2, S5, S7, and S9 were collected with liquid water, whereas the others were wet mat or soil samples. The pH and salinity of water samples were recorded using a portable analyzer PC5 (CEM Corporation, Bunkyo-ku, Tokyo, Japan). The water pH at these sampling points ranged from pH 7.03 to 8.87, and the salinity ranged from 0.02 to 7.5 parts per thousand (ppt) (Table S1).
2.2. Sample DNA Preparation
Approximately 10–30 g of samples were collected from 1–2 cm of the surface of each microbial mat, aggregate or soil, using a scoop. S2 water sample was collected using a disposable plastic syringe. Samples were transferred to the icebreaker SHIRASE and then frozen until DNA extraction was performed. Genomic DNA was extracted from approximately 10 mL volumes of each sample. The samples were mixed with 10 mL of 10 mM Tris-HCl pH 8.0, 5 mL of phenol pH 8.0, and 2 g of zirconia/glass beads (ϕ 0.1 mm), and vortexed vigorously for three minutes at room temperature. After heat treatment at 65 °C for 10 min, the debris and beads were removed by centrifugation for five minutes at 16,000× g. The upper water phase was transferred to a new tube and an equal volume of chloroform/isoamylalchol (24:1) was added, vortexed vigorously, and centrifuged for five minutes at 16,000× g. The upper water phase was precipitated with 2.5 volumes of 99.5% ethanol and 0.1 volumes of sodium acetate pH 5.2, and precipitated with centrifugation for 10 min at 21,600× g. The white pellets containing genomic DNA were washed with 70% ethanol, dried for five minutes at room temperature, and dissolved with 300 μl of 10 mM Tris-HCl pH 8.5. DNA was further purified using a DNeasy Blood and Tissue kit (Qiagen, Hilden, Germany), in accordance with the manufacturer’s instructions, and eluted with water.
2.3. Library Preparation and Sequencing
For deep amplicon sequencing, the V3–V4 region of the 16S rRNA and the V7–V8 region of the 18 rRNA genes were amplified using KOD FX Neo (Toyobo, Osaka, Japan). Primer sets 341F and 805R were used for 16S rRNA analysis [23], whereas primer sets F1183 and R1631 were used for 18S rRNA analysis [24]. The nucleotide sequences of these primers including the Illumina adapter for indexing were as follows (annealing sequences are underlined):
341F: 5′- TCGTCGGCAGCGTCAGATGTGTATAAGAGACAGCCTACGGGNGGCWGCAG-3′;
805R: 5′-GTCTCGTGGGCTCGGAGATGTGTATAAGAGACAGGACTACHVGGGTATCTAATCC -3′;
F1183: 5′- TCGTCGGCAGCGTCAGATGTGTATAAGAGACAGAATTTGACTCAACACGGG-3′;
R1631: 5′- GTCTCGTGGGCTCGGAGATGTGTATAAGAGACAGTACAAAGGGCAGGGACG-3′.
The polymerase chain reaction (PCR) thermal cycle was an initial denaturing step at 94 °C for two minutes, 35 cycles of denaturation at 98 °C for 10 s, annealing at 55 °C for 30 s, and extension at 68 °C for 30 s, with the final extension step at 68 °C for five minutes. The PCR product was purified with 0.8 volumes of AMPure XP beads, in accordance with the manufacturer’s instructions, and eluted with 10 mM Tris-HCl pH 8.5. Index PCR was performed in eight cycles using a Nextera XT Index Kit v2 (Illumina, San Diego, California, USA), in accordance with the manufacturer’s instructions. The same index was used for the 16S and 18S rRNA amplicons that were obtained from the same sample. The amplified libraries were purified by the addition of 1.12 volumes of AMPure XP beads, in accordance with the manufacturer’s instructions, and eluted with 10 mM Tris-HCl pH 8.5. The concentration of each library was quantified using a spectrophotometer, and equal amounts of each library were pooled and quantified using a Qubit dsDNA HS Assay Kit (Thermo Fisher Scientific, Waltham, Massachusetts, USA). Each 300 bp end of the pooled library was sequenced using an MiSeq Reagent Kit v3 (600 cycles; Illumina) on the MiSeq instrument (Illumina). The sequences were deposited at the DDBJ Sequence Read Archive (DRA) database under the accession numbers DRR205705 to DRR205717 with BioProject ID PRJDB9246 and BioSample IDs SAMD00202801 to SAMD00202813.
2.4. Data Analysis
Several noise removal software packages, such as DADA2 [19], Deblur [20], and UNOISE3 [21], have recently become available. These packages produce denoised sequences called amplicon sequence variants [19], sub-OTUs [20], or zero-radius OTUs [21]. These terms are synonymous, and are referred to as “sequence variants” (SVs) in this study. The three denoising packages produce a similar composition of SVs, but a different number of SVs [25]. DADA2 demonstrated the highest sensitivity to finding lower-abundance SVs, with false-positives, whereas Deblur had fewer abundant SVs, but a lower number of false positives [25]. We utilized the conservative Deblur package in this study. The sequence reads of the 16S and 18S rRNA genes were split using Cutadapt v1.8.3 [26]. We used the -g ^CCTACGGGNGGCWGCAG and -G ^GACTACHVGGGTATCTAATCC options for 16S rRNA analysis and the -g ^AATTTGACTCAACACGGG -G ^TACAAAGGGCAGGGACG options for 18S rRNA analysis. Additionally, we used the --discard-untrimmed option to eliminate sequence reads that did not contain the 5′ anchored adaptors. The sequence reads were imported QIIME2 ver. 2019.10 (https://qiime2.org) [27]. Forward and reverse reads were joined, denoised and chimera checked using the Deblur plugin with --p-trim-length options of 400 for both 16S rRNA and 18S rRNA genes. The taxonomy of the SVs was assigned using a feature-classifier plugin that was trained with the taxonomy information in majority_taxonomy_7_levels.txt of 99% clustering in SILVA ver. 132 (https://www.arb-silva.de/download/archive/) [28], for 16S rRNA analysis, or pr2_version_4.12.0_18S_mothur.tax of the Protist Ribosomal Reference database (PR2) [29], for 18S rRNA analysis. For 16S rRNA analysis, the SVs derived from eukaryotic chloroplasts and mitochondria were not removed. Some chimeric sequences were retained, even after the de novo chimera check pipeline of Deblur, which was probably caused by DNA fragmentation after our glass/zirconia beads treatment. Therefore, we performed a reference-based chimera check using vsearch with the --minh 0.5 option, using SILVA_132_SSURef_tax_silva.fasta as a reference [30], which removed 308 chimeric SVs (9.6%) for the 16S rRNA and 43 chimeric SVs (5.8%) for the 18S rRNA. Finally, 2,824 SVs and 692 SVs were obtained for the 16S and 18S rRNA genes respectively (S1 and S2 Data). To distinguish between the SV IDs of the 16S and 18S rRNA genes, they were designated as 16SV_XX and 18SV_XX, respectively (S1 and S2 Data). The number of ID was assigned in descending order of the sums of the counts of each SV. For phylogenetic tree construction, 92 SVs assigned to Cyanobacteria phylum, not belonging to chloroplast, were obtained using the filter_taxa function of the R phyloseq package [31]. Multiple sequence alignment of these SVs was prepared using the SILVA Incremental Aligner (SINA v1.2.11) with reference alignment of SILVA_132_SSURef_NR99_13_12_17_opt.arb [32]. The phylogenetic tree was estimated using FastTree v2.1.7 [33] and visualized using iTol v4 [34]. The relative abundance of major SVs were illustrated on bar and balloon plots (phyloseq v1.28.0, ggplot2 v3.2.1) by selecting SVs representing at least 0.2% of the overall dataset [31,35]. For α and β diversity analyses, SVs were rarefied to an even depth of 11,986 and 8,772 sequences, for 16S and 18S rRNA genes, respectively, using the R phyloseq package’s rarefy_even_depth function [31]. Non–metric multidimensional scaling (NMDS) plot of the Bray–Curtis distance matrix was obtained using ordinate and plot_ordination functions in the R phyloseq package [31]. Local alignment of SVs against the GenBank database and sequence identity analysis were performed using the blastn program [36].
3. Results and Discussion
3.1. Overall Community Structures
We analyzed community structures of diverse algal samples (S1–S13) that were collected from lacustrine and hydro-terrestrial environments of Langhovde and Skarvsnes (Figure 1, Table S1). Bar plots of the phylum level classification of the 16S rRNA showed that the dominant taxa were Bacteroidetes, Cyanobacteria, Planctomycetes, Proteobacteria, and Verrucomicrobia (Figure 2A). Previous study showed that Proteobacteria, Cyanobacteria, Chloroflexi, and Planctomycetes were dominant in the external parts of moss pillars [11]. Chloroflexi was detected in all our samples, but its relative abundance was low compared with the other dominant phyla (Figure 2A). Verrucomicrobia, which is nearly ubiquitous in soil environments including Antarctica [37], was detected in most samples, but in low abundances in S2 and S9 (Figure 2A).
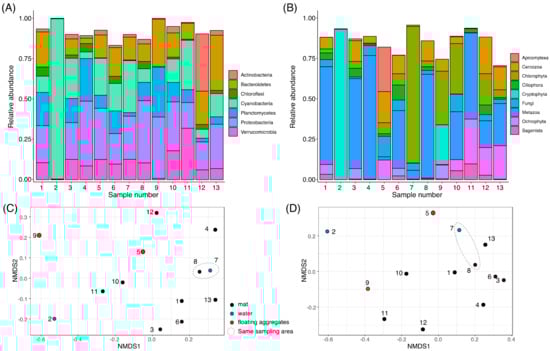
Figure 2.
Overall community structures of collected samples. Bar plots show the composition of sequence variants (SVs) that were agglomerated to the phylum level classification of the SILVA ver. 132 database for 16S rRNA (A) or the Rank 3 classification of the Protist Ribosomal Reference (PR2) database for 18S rRNA (B). Taxa below an average frequency of 2% are not shown. The NMDS plots of the Bray–Curtis distance matrix of each sample are shown for 16S rRNA (C) and 18S rRNA (D).
The relative abundance of Cyanobacteria was high in S2 (99.2%), S7 (32.2%), S11 (30.7%), S3 (24.9%), and S5 (23.0%), when compared with S6 (17.1%), S10 (14.6%), S13 (14.4%), S1 (10.1%), S8 (8.4%), S12 (5.6%), S4 (4.1%), and S9 (0.5%) (Figure 2A). The domination of Cyanobacteria in S2 is caused by chloroplast sequence of Cryptophyta forming red bloom (discussed in 3.4.). The orange colored Cyanobacteria mats like S1, S3, S6, S11, and S13 (Figure 1) were often observed in benthic environments of Antarctica, which is caused by accumulation of photo-protective pigments, such as carotenoids, scytonemin, and mycosporine-like amino acids [38]. These Cyanobacterial pigments may also protect other living organisms from UV irradiation. The abundance of Actinobacteria was high in S12 (35.5%), but not in other samples (Figure 2A). The abundances of Actinobacteria and Cyanobacteria showed negative and positive correlation, respectively, with moisture availability in the hyporheic zone of McMurdo Dry Valleys, Antarctica [39]. The high Actinobacteria and low Cyanobacteria abundances in S12 may suggest that the soil environment around S12 could be exposed to the low moisture condition.
The NMDS plot of the Bray–Curtis dissimilarity suggested a similar community structure in S7 and S8 (Figure 2C), which were collected from the same sampling point (Table S1). The NMDS plot suggested that the community structures of S2 and S9 tend to be distantly related to other samples (Figure 2C). The S2 showed the lowest alpha diversity (identified SVs, Shannon index, and Simpson index) at the rarefied read depth (Figure S1).
For 18S rRNA analysis, bar plots of the rank 3 (division) classification showed that the dominant taxa are Chlorophyta, Ochrophyta, Cryptophyta, Cercozoa and/or Metazoa, whose compositions are substantially different between samples (Figure 2B). The relative abundance of Chlorophyta was high in S7 (88.0%), S9 (34.5%), S10 (32.4%), and S12 (20.2%), whereas that of Ochrophyta was high in S11 (28.9%), S13 (21.6%), and S12 (17.9%). The relative abundance of Cryptophyta was high in S2 (96.9%) and S9 (25.7%), very low in S10 (0.23%), and not detected in the other samples. In addition to algae, Metazoa was widespread in S4 (79.8%), S8 (66.9%), S1 (63.0%), S3 (58.1%), S11 (55.6%), S6 (37.2%), S10 (30.9%), S13 (27.2%), and S7 (5.8%), and represented less than 3% in the other four samples. In the community structure of moss pillars, over half of eukaryotic phylotypes were assigned to Fungi [12], but Fungal SVs were not dominant in all our samples.
3.2. Distribution of SVs with High Prevalence
In 16S rRNA analysis, we identified 69 major SVs (Figure 3): 21 SVs of Proteobacteria; 14 SVs of Bacteroidetes; 14 SVs of Cyanobacteria; eight SVs of Verrucomicrobia; six SVs of Planctomycetes; and six other SVs. Twelve SVs were detected in only one sample, and the other 57 SVs were detected multiple times in different samples. In particular, 14 SVs showed a high prevalence in over half of the samples (>6/13) (red colored SVs in Figure 3). Eight of these SVs belonged to the Cyanobacteria phylum, which contained Phormidium (16SV_9 and 16SV_7), Leptolyngbya (16SV_4), Tychonema (16SV_36), Geitlerinema (16SV_33), Pseudanabaena (16SV_43), Nodosiliea (16SV_27), and the Leptolyngbyaceae family (16SV_2). These SVs showed 100% sequence identity to rRNA sequences in GenBank database that were detected in other Antarctic environments. For example, Phormidium (16SV_9) corresponds to Phormidium pseudopriestleyi FRX01 (KT347094) isolated in McMurdo Dry Valley, Southern Victorialand [40]. Phormidium (16SV_7) corresponds to the uncultured Cyanobacteria clone derived from Larsemann Hills (JX172507) [41]. Leptolyngbya (16SV_4) corresponds to Leptolyngbya antarctica ANT.BFI.1 isolated from Firelight Lake, Larsemann Hills (AY493590) [42]. Nodosiliea (16SV_27) corresponds to Leptolyngbya antarctica ANT.LAC.1 isolated from Ace Lake Peninsula, Vestfold Hills [42]. Leptolyngbyaceae (16SV_2) showed a 99.47% sequence identity to Phormidesmis arctica HOR 11-6 (KU219729.1) isolated from Svalbard in the Arctic. It also showed a 99.75% identity to Oscillatoriales OTU7 that were found in cryoconites on the glaciers of Antarctica, Arctic, Green land, and Northern Asia [43]. In addition to Cyanobacteria, six SVs showed a high prevalence (red colored SVs in Figure 3): Fimbriiglobus ruber (Planctomycetes: 16SV_20), Chthoniobacterales (Verrucomicrobia: 16SV_6, 16SV_40, and 16SV_31), Brevundimonas (Proteobacteria: 16SV_50), and Roseovarius (Proteobacteria: 16SV_58).
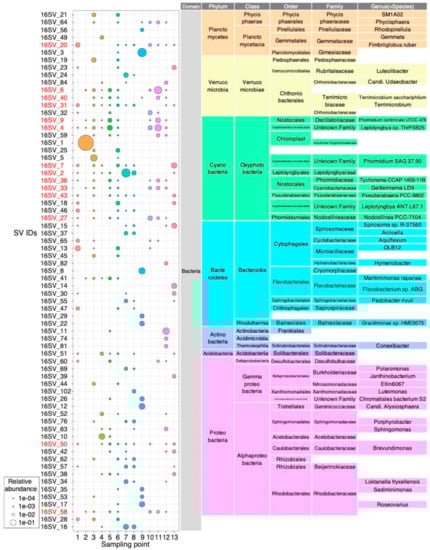
Figure 3.
Relative abundance and assigned taxonomy of the major SVs (16S rRNA gene) retrieved from 13 lacustrine and hydro-terrestrial samples collected in Langhovde and Skarvsnes, East Antarctica. SVs had been represented if they reached a relative abundance over 0.2% of the overall dataset. IDs of SVs with high prevalence (>6/13 samples) are shown in red.
In 18S rRNA analysis, we identified 73 major SVs (Figure 4). Thirteen SVs were detected in only one sample, and the other 60 SVs were detected multiple times in different samples. The prevalence of the major SVs in the 18S rRNA communities tended to be lower than that of the 16S rRNA communities. For example, only three SVs were detected in over half the samples (>6/13) (red colored SVs in Figure 4), which contained Chrysophyceae (Ochrophyta: 18SV_16), Tardigrada (Metazoa: 18SV_2), and Chrytridiomycetes (Fungi: 18SV_52). Chrysophyceae (18SV_16) showed a 100% sequence identity to Ochromonas sp. CCMP1899 isolated from McMurdo Sound, Antarctica (EF165133). Chrytridiomycetes (18SV_52) showed a 100% identity to uncultured Rhizophydiales in seawater of Japan (AB971109). Distribution of Tardigrada were discussed in 3.7.
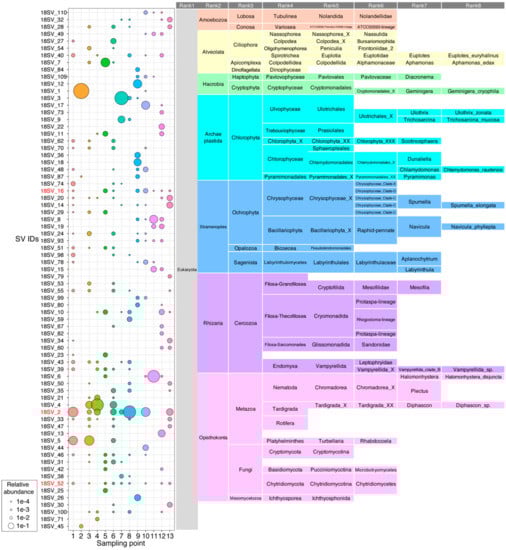
Figure 4.
Relative abundance and assigned taxonomy of the major SVs (18S rRNA gene) retrieved from 13 lacustrine and hydro-terrestrial samples collected in Langhovde and Skarvsnes, East Antarctica. SVs had been represented if they reached a relative abundance over 0.2% of the overall dataset. IDs of SVs with high prevalence (>6/13 samples) are shown in red. Unidentified ranks were shown as ‘_X’ in as described in the PR2 database [29].
3.3. Distribution of Cyanobacteria SVs
We focused on all detected SVs of Cyanobacteria phylum other than chloroplast (total 92 SVs), and we plotted their distribution and their phylogenetic relationship (Figure 5). Thirty-six SVs were detected in only one sample, and the other 56 SVs were detected multiple times in different samples (Figure 5). Cyanobacteria phylum are classified into Oxyphotobacteria, Melainabacteria, and Sericytochromatia [44,45], where the ability of oxygen-evolving photosynthesis has emerged only among Oxyphotobacteria. Oxyphotobacteria have traditionally been classified into five sections, based on their morphology [46]: (I) unicellular; (II) multicellular; (III) non-branched filamentous; (IV) non-branched filamentous and capable of forming differentiated cells for nitrogen fixation (heterocystous) [47]; and (V) blanched filamentous and heterocystous. Phylogenetic study showed that most extant Cyanobacteria descend from multicellular ancestors [48]. Notably, section III SVs were dominant in all samples (Figure 5, green). In contrast, section I SVs (yellow), such as Gloeobacter, Synechococcus, and Acaryochloris, and Section II SVs (orange), such as Gloeocapsa and Xenococcus, were detected, but in low abundance (Figure 5, yellow). Section IV SVs (purple), such as Nostoc, Nodularia, Petalonema, and Scytonema, were detected, but there were only five SVs, and their relative abundances were low. No section V SVs were detected in any samples, even at a sequencing depth over 11,986 sequences/sample (Figure 5 and Figure S2). The low abundance of the heterocystous strains of section IV and V is probably not caused by inefficient DNA extraction, since we utilized physical cell lysis with zirconia/glass beads.
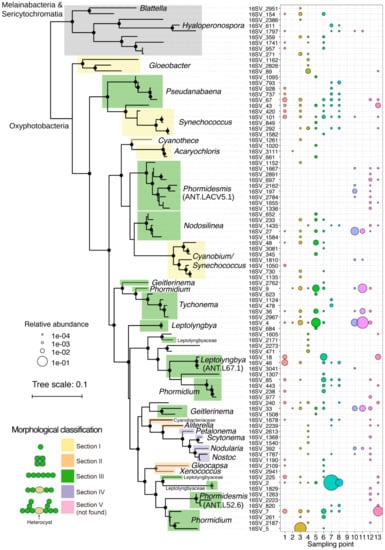
Figure 5.
Phylogenetic tree, relative abundance, and genus level taxonomy of all 92 SVs of cyanobacteria other than chloroplast detected. Branches with a confidence value >80% in the Shimodaira-Hasegawa (SH) test using the FastTree program are shown as black circles [33]. Morphological classifications of sections I-V in Cyanobacteria were shown accordingly.
The domination of section III strains was also reported in other studies of benthic microbial mats across Antarctica [14,49,50]. The low abundance of heterocystous strains suggests that nitrogen fixation of our samples was mainly performed by non-heterocystous strains and/or other heterotrophic bacteria. On the other hand, Cyanobacterial mats dominated with heterocystous strains such as Nostoc commune were observed in soils and ponds of Antarctica [37,51,52]. Nostoc was absent in salt pond with high conductivity on the McMurdo Ice Shelf, Antarctica, where Nodularia was still present [53]. The salinity of water in our sampling area ranged from 0.02 to 7.5 ppt (Table S1). Thus, high salt concentration may not inhibit the distribution of section V strains in our samples. Further analyses of community structures and environmental parameters (e.g., moisture, light, nutrient, metals, and oxygen concentration) are required to reveal the different adaptive strategies between heterocystous and non-heterocystous strains in Antarctica. For section III strains, Leptolyngbya, Pseudanabaena, Phormidium, Nodosilinea, Geitlerinama, and Tychonema were widespread in most samples, whereas Phormidesmis was distributed in limited number of samples (Figure 5). Eight SVs belonging to Phormidesmis ANT. LACV5.1 clade were detected in S12, where the soils were mostly covered with snow (Figure 1B). This distribution suggests that Phormidesmis strains of the eight SVs share common molecular mechanism(s) to acclimate to the soils exposed to freeze-thaw cycles. Phormidesmis genus is generally cold tolerant and widely distributed in Antarctic, Arctic, and Alpine environments [54,55]. Recent genome analysis of Phormidesmis priestleyi BC1401, which was isolated from cryoconite of Greenland, suggested that extracellular polymeric substances (EPS) could contribute to the tolerance of this strain in cold stress [56]. Analyses of the EPS-producing mechanism of Phormidesmis and its regulation responding to various physical stresses are important topics to be studied.
3.4. Red algal Bloom in S2
There was a brilliant red colored algal bloom in S2 in a puddle of thawing snow (Figure 1B). Such blooms are called red snow and are commonly observed in polar and alpine regions [57]. Cosmopolitan phylotypes of snow algae have been reported across the Arctic and Antarctic [49], suggesting their ability to spread widely. The red colored pigments are carotenoids, such as astaxanthin, that protect cells from excessive ultraviolet and visible light irradiation [58]. 16SV_1 was found in high abundance only in S2 (99.1%) and this SV was assigned to the Cryptomonadaceae chloroplast sequence. 16SV_1 had the highest identity (99.75%), with the chloroplast sequences of Teleaulax amphioxeia strain HACCP-CR01 (KP899713.1), Dinophysis caudata strain DC-LOHABE01 (EU123324.1), Myrionecta rubra strain MR-MAL01 (EU123322.1), and Dinophysis acuminata (AB073114.1), and a 99.5% identity to the chloroplast sequence of Geminigera cryophile (AB073111.1). The 18SV_1 gene was most abundant in S2 only (96.7%) and was assigned to Geminigera cryophila. 18SV_1 showed a 100% identity with Geminigera cryophila strain Ace Lake (HQ111513.1), which was detected in Antarctica’s Ace Lake, Vestfold Hills, East Antarctica [59]. The composition of red colored algal blooms in the Yatude Valley, Langhovde, has been reported previously [60]. DGGE analysis showed that these blooms contained Chlamydomonas and Chlorella (Chlorophyta), which accumulate large amounts of astaxanthin and its derivatives in the cells [60]. Our study showed that tThe red blooms in S2 consisted of only a single strain of Geminigera cryophile and contained hardly any other algae (Figure 3 and Figure 4), suggesting that the red blooms’ composition could differ greatly between sampling points in Langhovde. Previous nitrogen isotope analyses suggested that the red snow’s primary nitrogen source was fecal pellets from seabirds [60]. Although we did not identify dominant SVs that are specific to animal gut microbiome in S2 (Figure 3), the microbiome of the fecal pellets of seabirds and its comparison to that of the algal blooms will be an interesting topic to explore in the future.
3.5. Dominant Algae Strains in S7 and S8
S7 was green colored aggregates collected from a small stream, whereas S8 was a bacterial mat collected near S7 (Figure 1B). Three major algal SVs were detected in S7: 16SV_2 of Leptolyngbyaceae (26.5%), 18SV_3 (71.3%), and 18SV_9 (16.0%). The 18SV_3 was assigned as an order of Ulotrichales, but it had a 100% identity to the taxa of Ulvophyceae (KY233156.1), Klebsormidium (JQ315653.1), Ulothrix (DQ821516.1), Chlorothrix sp. (AY476827.1), and Urospora (AY476821.1). The 18SV_9 was assigned as Trichosarcina mucosa (Figure 4), but it had a 100% identity to the genera of Tupiella (MH374178.1), Sarcinofilum (MF000566.1), Hazenia (MF000563.1), Neoclonium (MF034643.1), Chamaetrichon (MF034633.1), Pseudendoclonium (DQ011230.1), and Trichosarcina (AM109906.1). Therefore, the genus level classifications of 18SV_3 and 18SV_9 remain ambiguous. Other DNA markers, such as the internal transcribed spacer (ITS), are required for accurate taxonomic assignment of 18SV_3 and 18SV_9 SVs. We did not identify chloroplast sequences for the two Ulotrichales, suggesting that the primer sets in the V3–V4 region did not work for the chloroplast DNA of these eukaryotic algae. Thus, the major populations of green colored aggregates observed in S7 were one strain of Leptolyngbyaceae and two strains of Ulotrichales. S8 also contained these three algal SVs, but with smaller relative abundance.
3.6. White Aggregates in S5 and S9
We collected two samples of white aggregates: small, filamentous aggregates in S5 and a large aggregate in S9 (Figure 1B). S5 contained filamentous Cyanobacteria, such as 16SV_4 (8.1%) of Leptolyngbya and 16SV_9 (4.1%) of Phormidium, and some SVs of unicellular Cyanobacteria, such as Acaryochloris, Cyanobium, and Synechococcus (Figure 3 and Figure 5). S5 also contained eukaryotic algal SVs of 18SV_11 (7.1%) of Prasiolales, and 18SV_16 (3.9%) and 18SV_51 (3.4%) of Chrysophyceae. However, these algae were not the majority in S5 (Figure 2A ,B), suggesting that the white aggregate in S5 consists of diverse non-algal species. S5 contained 18SV_7 with high abundance (28.7%), which was assigned as Alphamonas edax of Apicomplexa (Figure 4). The 18SV_7 gene had a 98.75% sequence identity to Colpodella (formerly Alphamonas) edax (AY234843.1). This organism, and other minor organisms, may contribute to white aggregate formation in S5. In contrast, S9 consisted of mainly eukaryotic algal SVs of 18SV_12 (25.7%) of Cryptomonadales, and 18SV_18 (17.6%) and 18SV_36 (9.3%) of Dunaliella (Figure 4). S9 did not contain any Cyanobacterial SVs other than chloroplasts (Figure 5). These results suggest that the large white aggregate in S9 was a eukaryotic algal mat. Notably, number of SVs, Shannon index, and Simpson index were low in the 16S rRNA community of S9 (Figure S1). It might be possible that the eukaryotic algae in S9 have been exposed to excessive light or high temperature stress on the lake surface and bleached their pigmentation.
3.7. Other Dominant SVs of Small Animals
The most dominant eukaryotic SVs were 18SV_2 and 18SV_4, which belonged to the phylum Tardigrada (Figure 4). Tardigrades can survive the severe climate of Antarctica, such as freeze-thaw cycles and dry conditions, by stopping all metabolic processes, which is known as cryptobiosis [61]. The 18SV_2 was identified in S1 (35.4%), S3 (4.6%), S4 (12.0%), S6 (10.8%), S7 (5.5%), S8 (61.8%), S10 (29.2%), and S13 (14.5%), whereas 18SV_4 was identified in S3 (17.5%), S4 (59.3%), and S6 (14.9%). These SVs of Tardigrada were not detected in surface water samples, such as S2, S5, and S9, suggesting that they inhabit benthic and hydro-terrestrial environments rather than open water environments. 18SV_2 had a 100% sequence identity to Acutuncus antarcticus (AB753790.1), whereas 18SV_4 had a 100% identity to Diphascon pingue (MH079473.1). These two SVs only differed in 3 nucleotides. These results suggest that Acutuncus antarcticus was the most widespread at our sampling points in Langhovde and Skarvsnes, whereas Diphascon pingue was less widespread, but more dominant, than Acutuncus antarcticus. This assumption is consistent with the observation that Acutuncus antarcticus is the most common species in terrestrial and lake environments in Antarctica [62]. Recently, the community structure of Lake Yukidori Ike, where the S3 sample was isolated, was analyzed using DNA-cloning methods for 16S and 18S rRNA genes [15]. This study showed that the majority of eukaryotic OTUs were Tardigrada, where OTUs of Diphascon (44%) and Acutuncus (9%) were detected. The high abundance of Diphascon compared with Acutuncus in Lake Yukidori Ike was consistent with the result of S3 in our study.
18SV_5 was identified in S3 (27.0%), S4 (33.3%), and S6 (4.5%). 18SV_5 was assigned to the order Rhabdocoela of flatworms (Figure 4). Rhabdocoela (18SV_5) had a 100% sequence identity to the minor phylotype (AB695468.1) in the moss pillars [12] and only a 94.5% sequence identity to Mesostoma lingua (AY775759.1). 18SV_6 dominated, especially in S11 (55.6%), and was assigned as Halomonhystera disjuncta of Nematode (Figure 4). Consistently, 18SV_6 showed a 100% sequence identity to Halomonhystera disjuncta (AJ966485.1) [63]. Halomonhystera is a cosmopolitan genus that has been recovered from various marine environments [64]. Stable isotope experiment suggested that Halomonhystera utilizes phytoplankton-derived hydrocarbons as energy source in the ice-shelf of the Eastern Antarctic Peninsula [65]. Therefore, we speculate that the Halomonhystera (18SV_6) may utilize Cyanobacteria and Ochrophyta as energy sources, as they were abundant in the microbial mat of S11. This information will contribute to our understanding of the diversity and adaptability of the lacustrine and hydro-terrestrial ecosystems in Antarctica.
Supplementary Materials
Supplementary materials can be found at https://www.mdpi.com/2076-2607/8/4/497/s1.
Author Contributions
Conceptualization, Y.H., T.S.; investigation, T.S., M.O., Y.H.; data analysis, Y.H.; writing—original draft preparation, Y.H.; writing—review and editing, Y.H., T.S., S.K., S.I.; supervision, T.E., N.H.; project administration, Y.H.; funding acquisition, N.H. All authors have read and agreed to the published version of the manuscript.
Funding
This research was supported by Grant-in-Aid for Scientific Research (S) (Grant number 15H05712) to N.H. from Japan Society for the Promotion of Science (JSPS).
Acknowledgments
We thank Josef Elster (University of South Bohemia), Sho Shimada (Toho University), Tomotake Wada (SOKENDAI), Fumino Maruo (Chuo University) and all staff in the 60th Japanese Antarctic Research Expedition for the assistance of sampling. We also thank Chihiro Azai (Ritsumeikan Univ.) for helpful discussions.
Conflicts of Interest
The authors declare no conflict of interest. The funders had no role in the design of the study; in the collection, analyses, or interpretation of data; in the writing of the manuscript, or in the decision to publish the results.
References
- Hohmann-Marriott, M.F.; Blankenship, R.E. Evolution of photosynthesis. Ann. Rev. Plant Biol. 2011, 62, 515–548. [Google Scholar] [CrossRef] [PubMed]
- Burton-Johnson, A.; Black, M.; Fretwell, P.T.; Kaluza-Gilbert, J. An automated methodology for differentiating rock from snow, clouds and sea in Antarctica from Landsat 8 imagery: A new rock outcrop map and area estimation for the entire Antarctic continent. Cryosphere 2016, 10, 1665–1677. [Google Scholar] [CrossRef]
- Vincent, W.F.; Quesada, A. Cyanobacteria in high latitude lakes, rivers and seas. In Ecology of Cyanobacteria II; Whitton, B.A., Ed.; Springer: Dordrecht, The Netherlands, 2012; pp. 371–385. [Google Scholar]
- Broady, P.A. Diversity, distribution and dispersal of Antarctic terrestrial algae. Biodivers. Conserv. 1996, 5, 1307–1335. [Google Scholar] [CrossRef]
- Seckbach, J. Algae and Cyanobacteria in Extreme Environments; Springer: Dordrecht, The Netherlands, 2007; p. 813. [Google Scholar]
- Imura, S.; Bando, T.; Seto, K.; Ohtani, S.; Kudoh, S.; Kanda, H. Distribution of aquatic mosses in the Soya Coast region, East Antarctica. Polar Biosci. 2003, 16, 1–10. [Google Scholar]
- Ohtsuka, T.; Kudoh, S.; Imura, S.; Ohtani, S. Diatoms composing benthic microbial mats in freshwater lakes of Skarvsnes ice-free area, East Antarctica. Polar Biosci. 2006, 20, 113–130. [Google Scholar]
- Tanabe, Y.; Kudoh, S.; Imura, S.; Fukuchi, M. Phytoplankton blooms under dim and cold conditions in freshwater lakes of East Antarctica. Polar Biol. 2008, 31, 199–208. [Google Scholar] [CrossRef]
- Imura, S.; Bando, T.; Saito, S.; Seto, K.; Kanda, H. Benthic moss pillars in Antarctic lakes. Polar Biol. 1999, 22, 137–140. [Google Scholar] [CrossRef]
- Nakai, R.; Imura, S.; Naganuma, T. Patterns of Microorganisms Inhabiting Antarctic Freshwater Lakes with Special Reference to Aquatic Moss Pillars; Springer International Publishing: Cham, Switzerland, 2019; pp. 25–43. [Google Scholar]
- Nakai, R.; Abe, T.; Baba, T.; Imura, S.; Kagoshima, H.; Kanda, H.; Kanekiyo, A.; Kohara, Y.; Koi, A.; Nakamura, K.; et al. Microflorae of aquatic moss pillars in a freshwater lake, East Antarctica, based on fatty acid and 16S rRNA gene analyses. Polar Biol. 2012, 35, 425–433. [Google Scholar] [CrossRef]
- Nakai, R.; Abe, T.; Baba, T.; Imura, S.; Kagoshima, H.; Kanda, H.; Kohara, Y.; Koi, A.; Niki, H.; Yanagihara, K.; et al. Eukaryotic phylotypes in aquatic moss pillars inhabiting a freshwater lake in East Antarctica, based on 18S rRNA gene analysis. Polar Biol. 2012, 35, 1495–1504. [Google Scholar] [CrossRef]
- Kato, K.; Arikawa, T.; Imura, S.; Kanda, H. Molecular identification and phylogeny of an aquatic moss species in Antarctic lakes. Polar Biol. 2013, 36, 1557–1568. [Google Scholar] [CrossRef]
- Fernandez-Valiente, E.; Quesada, A.; Howard-Williams, C.; Hawes, I. N2-fixation in cyanobacterial mats from ponds on the McMurdo Ice Shelf, Antarctica. Microb. Ecol. 2001, 42, 338–349. [Google Scholar] [CrossRef] [PubMed]
- Chaya, A.; Kurosawa, N.; Kawamata, A.; Kosugi, M.; Imura, S. Community structures of bacteria, archaea, and eukaryotic microbes in the freshwater glacier lake Yukidori-Ike in Langhovde, East Antarctica. Diversity 2019, 11, 105. [Google Scholar] [CrossRef]
- Bentley, D.R.; Balasubramanian, S.; Swerdlow, H.P.; Smith, G.P.; Milton, J.; Brown, C.G.; Hall, K.P.; Evers, D.J.; Barnes, C.L.; Bignell, H.R.; et al. Accurate whole human genome sequencing using reversible terminator chemistry. Nature 2008, 456, 53–59. [Google Scholar] [CrossRef] [PubMed]
- Edgar, R.C. Search and clustering orders of magnitude faster than BLAST. Bioinformatics 2010, 26, 2460–2461. [Google Scholar] [CrossRef] [PubMed]
- Schloss, P.D.; Handelsman, J. Introducing DOTUR, a computer program for defining operational taxonomic units and estimating species richness. Appl. Environ. Microbiol. 2005, 71, 1501–1506. [Google Scholar] [CrossRef] [PubMed]
- Callahan, B.J.; McMurdie, P.J.; Rosen, M.J.; Han, A.W.; Johnson, A.J.; Holmes, S.P. DADA2: High-resolution sample inference from Illumina amplicon data. Nat. Methods 2016, 13, 581–583. [Google Scholar] [CrossRef]
- Amir, A.; McDonald, D.; Navas-Molina, J.A.; Kopylova, E.; Morton, J.T.; Zech Xu, Z.; Kightley, E.P.; Thompson, L.R.; Hyde, E.R.; Gonzalez, A.; et al. Deblur rapidly resolves single-nucleotide community sequence patterns. mSystems 2017, 2, e00191-16. [Google Scholar] [CrossRef]
- Edgar, R.C. UNOISE2: Improved error-correction for Illumina 16S and ITS amplicon sequencing. bioRXiv 2016. [Google Scholar] [CrossRef]
- Kudoh, S.; Tanabe, Y.; Uchida, M.; Osono, T.; Imura, S. Meteorological features observed in Yukidori Zawa, Langhobde and Kizahashihama, Skarvsnes on the Sôya Coast, East Antarctica, with comparison of those observed at Syowa Station. Antarct. Rec. 2015, 59, 163–178. [Google Scholar]
- Klindworth, A.; Pruesse, E.; Schweer, T.; Peplies, J.; Quast, C.; Horn, M.; Glockner, F.O. Evaluation of general 16S ribosomal RNA gene PCR primers for classical and next-generation sequencing-based diversity studies. Nucleic Acids Res. 2013, 41, e1. [Google Scholar] [CrossRef]
- Hadziavdic, K.; Lekang, K.; Lanzen, A.; Jonassen, I.; Thompson, E.M.; Troedsson, C. Characterization of the 18S rRNA gene for designing universal eukaryote specific primers. PLoS ONE 2014, 9, e87624. [Google Scholar] [CrossRef] [PubMed]
- Nearing, J.T.; Douglas, G.M.; Comeau, A.M.; Langille, M.G.I. Denoising the Denoisers: An independent evaluation of microbiome sequence error-correction approaches. PeerJ 2018, 6, e5364. [Google Scholar] [CrossRef] [PubMed]
- Martin, M. Cutadapt removes adapter sequences from high-throughput sequencing reads. EMBnet.journal 2011, 17, 10–12. [Google Scholar] [CrossRef]
- Caporaso, J.G.; Kuczynski, J.; Stombaugh, J.; Bittinger, K.; Bushman, F.D.; Costello, E.K.; Fierer, N.; Pena, A.G.; Goodrich, J.K.; Gordon, J.I.; et al. QIIME allows analysis of high-throughput community sequencing data. Nat. Methods 2010, 7, 335–336. [Google Scholar] [CrossRef] [PubMed]
- Quast, C.; Pruesse, E.; Yilmaz, P.; Gerken, J.; Schweer, T.; Yarza, P.; Peplies, J.; Glockner, F.O. The SILVA ribosomal RNA gene database project: Improved data processing and web-based tools. Nucleic Acids Res. 2013, 41, D590–D596. [Google Scholar] [CrossRef] [PubMed]
- Guillou, L.; Bachar, D.; Audic, S.; Bass, D.; Berney, C.; Bittner, L.; Boutte, C.; Burgaud, G.; de Vargas, C.; Decelle, J.; et al. The Protist Ribosomal Reference database (PR2): A catalog of unicellular eukaryote small sub-unit rRNA sequences with curated taxonomy. Nucleic Acids Res. 2013, 41, D597–D604. [Google Scholar] [CrossRef]
- Rognes, T.; Flouri, T.; Nichols, B.; Quince, C.; Mahe, F. VSEARCH: A versatile open source tool for metagenomics. PeerJ 2016, 4, e2584. [Google Scholar] [CrossRef]
- McMurdie, P.J.; Holmes, S. phyloseq: An R package for reproducible interactive analysis and graphics of microbiome census data. PLoS ONE 2013, 8, e61217. [Google Scholar] [CrossRef]
- Pruesse, E.; Peplies, J.; Glockner, F.O. SINA: Accurate high-throughput multiple sequence alignment of ribosomal RNA genes. Bioinformatics 2012, 28, 1823–1829. [Google Scholar] [CrossRef]
- Price, M.N.; Dehal, P.S.; Arkin, A.P. FastTree 2—Approximately maximum-likelihood trees for large alignments. PLoS ONE 2010, 5, e9490. [Google Scholar] [CrossRef]
- Letunic, I.; Bork, P. Interactive Tree Of Life (iTOL) v4: Recent updates and new developments. Nucleic Acids Res. 2019, 47, W256–W259. [Google Scholar] [CrossRef] [PubMed]
- Wickham, H. ggplot2—Elegant Graphics for Data Analysis; Springer: New York, NY, USA, 2016. [Google Scholar]
- Camacho, C.; Coulouris, G.; Avagyan, V.; Ma, N.; Papadopoulos, J.; Bealer, K.; Madden, T.L. BLAST+: Architecture and applications. BMC Bioinform. 2009, 10, 421. [Google Scholar] [CrossRef] [PubMed]
- Bergmann, G.T.; Bates, S.T.; Eilers, K.G.; Lauber, C.L.; Caporaso, J.G.; Walters, W.A.; Knight, R.; Fierer, N. The under-recognized dominance of Verrucomicrobia in soil bacterial communities. Soil Biol. Biochem. 2011, 43. [Google Scholar] [CrossRef]
- Tanabe, Y.; Ohtani, S.; Kasamatsu, N.; Fukuchi, M.; Kudoh, S. Photophysiological responses of phytobenthic communities to the strong light and UV in Antarctic shallow lakes. Polar Biol. 2010, 33, 85–100. [Google Scholar] [CrossRef]
- Lee, K.C.; Caruso, T.; Archer, S.D.J.; Gillman, L.N.; Lau, M.C.Y.; Cary, S.C.; Lee, C.K.; Pointing, S.B. Stochastic and deterministic effects of a moisture gradient on soil microbial communities in the McMurdo Dry Valleys of Antarctica. Front. Microbiol. 2018, 9, 2619. [Google Scholar] [CrossRef] [PubMed]
- Jungblut, A.D.; Hawes, I.; Mackey, T.J.; Krusor, M.; Doran, P.T.; Sumner, D.Y.; Eisen, J.A.; Hillman, C.; Goroncy, A.K. Microbial mat communities along an oxygen gradient in a perennially ice-covered Antarctic lake. Appl. Environ. Microbiol. 2016, 82, 620–630. [Google Scholar] [CrossRef] [PubMed]
- Bajerski, F.; Wagner, D. Bacterial succession in Antarctic soils of two glacier forefields on Larsemann Hills, East Antarctica. FEMS Microbiol. Ecol. 2013, 85, 128–142. [Google Scholar] [CrossRef]
- Taton, A.; Grubisic, S.; Balthasart, P.; Hodgson, D.A.; Laybourn-Parry, J.; Wilmotte, A. Biogeographical distribution and ecological ranges of benthic cyanobacteria in East Antarctic lakes. FEMS Microbiol. Ecol. 2006, 57, 272–289. [Google Scholar] [CrossRef]
- Segawa, T.; Yonezawa, T.; Edwards, A.; Akiyoshi, A.; Tanaka, S.; Uetake, J.; Irvine-Fynn, T.; Fukui, K.; Li, Z.; Takeuchi, N. Biogeography of cryoconite forming cyanobacteria on polar and Asian glaciers. J. Biogeogr. 2017, 44, 2849–2861. [Google Scholar] [CrossRef]
- Soo, R.M.; Hemp, J.; Parks, D.H.; Fischer, W.W.; Hugenholtz, P. On the origins of oxygenic photosynthesis and aerobic respiration in Cyanobacteria. Science (N. Y.) 2017, 355, 1436–1440. [Google Scholar] [CrossRef]
- Di Rienzi, S.C.; Sharon, I.; Wrighton, K.C.; Koren, O.; Hug, L.A.; Thomas, B.C.; Goodrich, J.K.; Bell, J.T.; Spector, T.D.; Banfield, J.F.; et al. The human gut and groundwater harbor non-photosynthetic bacteria belonging to a new candidate phylum sibling to Cyanobacteria. eLife 2013, 2, e01102. [Google Scholar] [CrossRef] [PubMed]
- Rippka, R.; Deruelles, J.; Waterbury, J.B.; Herdman, M.; Stanier, R.Y. Generic assignments, strain histories and properties of pure cultures of cyanobacteria. Microbiology 1979, 111, 1–61. [Google Scholar] [CrossRef]
- Flores, E.; Herrero, A. Compartmentalized function through cell differentiation in filamentous cyanobacteria. Nat. Rev. Microbiol. 2010, 8, 39–50. [Google Scholar] [CrossRef] [PubMed]
- Schirrmeister, B.E.; Antonelli, A.; Bagheri, H.C. The origin of multicellularity in cyanobacteria. BMC Evolut. Biol. 2011, 11, 45. [Google Scholar] [CrossRef]
- Pessi, I.S.; Lara, Y.; Durieu, B.; Maalouf, P.d.C.; Verleyen, E.; Wilmotte, A. Community structure and distribution of benthic cyanobacteria in Antarctic lacustrine microbial mats. FEMS Microbiol. Ecol. 2018, 94. [Google Scholar] [CrossRef]
- Fernandez-Carazo, R.; Hodgson, D.A.; Convey, P.; Wilmotte, A. Low cyanobacterial diversity in biotopes of the Transantarctic Mountains and Shackleton Range (80-82 degrees S), Antarctica. FEMS Microbiol. Ecol. 2011, 77, 503–517. [Google Scholar] [CrossRef]
- Dajana, R.; Michal, G.; Marek, M.; Martin, B. Adaptations of cyanobacterium Nostoc commune to environmental stress: Comparison of morphological and physiological markers between European and Antarctic populations after rehydration. Czech Polar Rep. 2018, 8, 84–93. [Google Scholar]
- Broady, P.A. The distribution of terrestrial and hydro-terrestrial algal associations at three contrasting locations in southern Victoria Land, Antarctica. Algol. Stud. 2005, 118, 95–112. [Google Scholar] [CrossRef]
- Jungblut, A.-D.; Hawes, I.; Mountfort, D.; Hitzfeld, B.; Dietrich, D.R.; Burns, B.P.; Neilan, B.A. Diversity within cyanobacterial mat communities in variable salinity meltwater ponds of McMurdo Ice Shelf, Antarctica. Environ. Microbiol. 2005, 7, 519–529. [Google Scholar] [CrossRef]
- Chrismas, N.A.; Anesio, A.M.; Sanchez-Baracaldo, P. Multiple adaptations to polar and alpine environments within cyanobacteria: A phylogenomic and Bayesian approach. Front. Microbiol. 2015, 6, 1070. [Google Scholar] [CrossRef]
- Raabova, L.; Kovacik, L.; Elster, J.; STRUNECKÝ, O. Review of the genus Phormidesmis (Cyanobacteria) based on environmental, morphological, and molecular data with description of a new genus Leptodesmis. Phytotaxa 2019, 395, 1–16. [Google Scholar] [CrossRef]
- Chrismas, N.A.; Barker, G.; Anesio, A.M.; Sanchez-Baracaldo, P. Genomic mechanisms for cold tolerance and production of exopolysaccharides in the Arctic cyanobacterium Phormidesmis priestleyi BC1401. BMC Genom. 2016, 17, 533. [Google Scholar] [CrossRef] [PubMed]
- Segawa, T.; Matsuzaki, R.; Takeuchi, N.; Akiyoshi, A.; Navarro, F.; Sugiyama, S.; Yonezawa, T.; Mori, H. Bipolar dispersal of red-snow algae. Nat. Commun. 2018, 9, 3094. [Google Scholar] [CrossRef] [PubMed]
- Remias, D.; Pichrtova, M.; Pangratz, M.; Lutz, C.; Holzinger, A. Ecophysiology, secondary pigments and ultrastructure of Chlainomonas sp. (Chlorophyta) from the European Alps compared with Chlamydomonas nivalis forming red snow. FEMS Microbiol. Ecol. 2016, 92, fiw030. [Google Scholar] [CrossRef]
- Laybourn-Parry, J.; Bell, E.M. Ace Lake: Three decades of research on a meromictic, Antarctic lake. Polar Biol. 2014, 37, 1685–1699. [Google Scholar] [CrossRef]
- Fujii, M.; Takano, Y.; Kojima, H.; Hoshino, T.; Tanaka, R.; Fukui, M. Microbial community structure, pigment composition, and nitrogen source of red snow in Antarctica. Microb. Ecol. 2010, 59, 466–475. [Google Scholar] [CrossRef]
- Guidetti, R.; Altiero, T.; Rebecchi, L. On dormancy strategies in tardigrades. J. Insect Physiol. 2011, 57, 567–576. [Google Scholar] [CrossRef]
- Cesari, M.; McInnes, S.J.; Bertolani, R.; Rebecchi, L.; Guidetti, R. Genetic diversity and biogeography of the south polar water bear Acutuncus antarcticus (Eutardigrada : Hypsibiidae)—Evidence that it is a truly pan-Antarctic species. Invertebr. Syst. 2016, 30, 635–649. [Google Scholar] [CrossRef]
- Meldal, B.H.M.; Debenham, N.J.; De Ley, P.; De Ley, I.T.; Vanfleteren, J.R.; Vierstraete, A.R.; Bert, W.; Borgonie, G.; Moens, T.; Tyler, P.A.; et al. An improved molecular phylogeny of the Nematoda with special emphasis on marine taxa. Mol. Phylogenet. Evol. 2007, 42, 622–636. [Google Scholar] [CrossRef]
- Heip, C.H.R.; Vincx, M.; Vranken, G. The ecology of marine nematodes. Oceanogr. Mar. Biol. 1985, 23, 399–489. [Google Scholar]
- Hauquier, F.; Ingels, J.; Gutt, J.; Raes, M.; Vanreusel, A. Characterisation of the nematode community of a low-activity cold seep in the recently ice-shelf free larsen b area, eastern antarctic peninsula. PLoS ONE 2011, 6, e22240. [Google Scholar] [CrossRef] [PubMed]
© 2020 by the authors. Licensee MDPI, Basel, Switzerland. This article is an open access article distributed under the terms and conditions of the Creative Commons Attribution (CC BY) license (http://creativecommons.org/licenses/by/4.0/).