Article

Interactions between Magnaporthiopsis maydis and Macrophomina phaseolina, the Causes of Wilt Diseases in Maize and Cotton

1
Department of Plant Sciences, Migal—Galilee Research Institute, Tarshish 2, Kiryat Shmona 11016, Israel
2
Faculty Sciences, Tel-Hai College, Upper Galilee, Tel-Hai 12210, Israel
3
Department of Plant Pathology and Weed Research, Institute of Crop Protection, A.R.O., The Volcani Center, Newe Ya’ar, Ramat Yishai 30095, Israel
*
Author to whom correspondence should be addressed.
Microorganisms 2020, 8(2), 249; https://doi.org/10.3390/microorganisms8020249
Submission received: 1 December 2019 / Revised: 22 January 2020 / Accepted: 10 February 2020 / Published: 13 February 2020
(This article belongs to the Section Food Microbiology)

Abstract

:
Fungal pathogens are a significant threat to crops worldwide. The soil fungus, Magnaporthiopsis maydis, severely affects sensitive maize hybrids by causing the rapid wilting of plants at the maturity stage. Similarly, the soil fungus, Macrophomina phaseolina, develops in a variety of host plants, which leads to rot and plant mortality. The presence of both pathogens together in diseased cotton plants in Israel suggests possible interactions between them. Here, these relationships were tested in a series of experiments accompanied by real-time PCR tracking in maize and cotton. Despite the fact that neither of the pathogens was superior in a growth plate confrontation assay, their co-inoculum had a significant influence under field conditions. In maize sprouts and fully matured plants, infection by both pathogens (compared to inoculation with each of them alone) led to lesser amounts of M. maydis DNA but to increased amounts of M. phaseolina DNA levels. These results were obtained under a restricted water regime, while optimal water irrigation led to less pronounced differences. In water-stressed cotton sprouts, infection with both pathogens led to an increase in DNA amounts of each of the pathogens. Whereas the M. maydis DNA levels in the double infection remain high at the end of the season, a reduction in the amount of M. phaseolina DNA was observed. The double infection caused an increase in growth parameters in maize and cotton and decreased levels of dehydration in maize plants accompanied by an increase in yield production. Dehydration symptoms were minor in cotton under an optimal water supply. However, under a restricted water regime, the double infection abolished the harmful effect of M. phaseolina on the plants’ development and yield. These findings are the first report of interactions between these two pathogens in maize and cotton, and they encourage expanding the study to additional plant hosts and examining the potential involvement of other pathogens.

1. Introduction

The fungus Magnaporthiopsis maydis is known to severely affect sensitive maize (Zea mays) plants at the maturity stage. It has two additional synonyms, Cephalosporium maydis [1] and Harpophora maydis [2]. The disease, commonly known as “late wilt”, is reported so far in about eight countries but is considered the most harmful maize disease in Egypt [3] and Israel [4,5]. Although some prevention methods can restrict disease outbreak (for example, see [6]), the use of resistance maize cultivars is still the most common method for minimizing yield losses [7], and it was shown that plant hormones might be involved in restricting the pathogen [8]. Until lately, the only familiar and confirmed alternative host for M. maydis was Lupinus termis (lupine), which is widely cultivated in Egypt [9]. M. maydis was recently identified in Gossypium hirsutum (Pima cotton, Goliath cv.), Citrullus lanatus (watermelon, Malali cv.), and Setaria viridis (green foxtail) [10].
Late wilt is often associated with contamination by secondary plant pathogenic fungi, enhancing the stem symptoms. Indeed, fungi such as Fusarium verticillioides causing stalk rot, Macrophomina phaseolina causing charcoal rot, and M. maydis are grouped in a post-flowering stalk rot complex, which was identified as being one of the most widespread and destructive groups of diseases in maize [11]. The interactions between M. maydis and Fusarium oxysporum in the roots of cotton and maize were previously investigated [12]. These interactions are associated with an appreciable decrease in the severity of the cotton wilt disease but do not affect the pathogenicity of M. maydis to maize. The reduction in infection in cotton was more pronounced when the M. maydis precedes F. oxysporum in the soil than when they were inoculated simultaneously. M. maydis exerts little or no such effect when it follows F. oxysporum in the soil. These interactions are particularly interesting since both pathogens can be found abundantly in Egyptian soils and share these two summer crop hosts (cotton and maize), which are cultivated alternately in two-year rotations [12]. Interestingly, both F. oxysporum f. sp. lupini and M. maydis are also common fungal pathogens in lupine plants in Egypt, causing wilt diseases that result in substantial economic losses. The presence of both pathogens, M. maydis and F. oxysporum, in diseased maize, cotton, and lupine plants [12] evoke the question of how their interactions or cross-influence affect these and other potential host plants.
Despite the pivotal role of M. maydis, accumulating lines of evidence suggest that it does not act alone; instead, it is part of a more massive complex of maize pathogenic fungi [11]. Some of these fungi, such as F. verticillioides, are a secondary invader or opportunist that developed in late wilt-diseased attenuated maize plants [5]. Hence, the co-influence between M. maydis and other phytopathogenic fungi has only now begun to be revealed. The current study is an additional step towards uncovering the intriguing relationship between the late wilt pathogen and other phytoparasitic fungi. In particular, the interactions between M. maydis and M. phaseolina in maize and cotton plants were investigated.
M. phaseolina (Tassi) Goidanich, the charcoal rot causal agent, is a common pathogen affecting a wide range of cultivated and wild species in temperate, warm and tropical regions around the world [13]. The fungus has a vast host range and is responsible for causing damage to more than 500 cultivated and wild plants [14], including maize and cotton. Similar to M. maydis, M. phaseolina is a primarily soil-borne and seed-borne pathogen, but unlike M. maydis, it has a highly competitive saprophytic ability [15].
Both fungi have a similar pathogenic mode of action and produce similar visible symptoms. These pathogens are a challenge to control because they often survive in the soil for long periods. When a susceptible host plant is seeded, the fungi can penetrate the plants’ roots, causing root necrosis and affecting sprout development [14,16]. Usually, the symptoms develop later in the season as plants begin to flower and are enhanced under drought conditions [17,18]. When the growth season advances, M. maydis and M. phaseolina may spread upwards inside the plant’s vascular system, disrupt the water supply, and lead to dehydration and yield reduction [19,20]. While M. phaseolina is capable of producing phytotoxins [14], so far, no secreted phytotoxins have been identified in M. maydis. However, similar to M. phaseolina, M. maydis culture filtrate negatively affects maize seed development [21].
In a survey conducted in 2016 (Roni Cohen, unpublished results), M. phaseolina was identified at a high frequency in cotton fields scattered throughout the Hula Valley in the Upper Galilee (northern Israel). These fields are also known to be heavily infested with M. maydis, which causes a severe disease to sensitive maize hybrids. In the summer of 2017, both M. maydis and M. phaseolina were identified using quantitative real-time polymerase chain reaction (qPCR) in diseased cotton plants in a commercial field in Yavne (southern coastal plain of Israel) [10]. These accumulating lines of evidence suggested possible co-interactions between the two pathogens in cotton and maize in commercial fields where they coexist.
To the best of our knowledge, this is the first study of the co-influence of M. maydis and M. phaseolina under field conditions with molecular DNA tracking of each pathogen in maize and cotton tissues. This study aims at deepening our understanding of these curious relationships by measuring changes in the plants’ phenological development, health condition, and yield production. Previous reports of antagonisms among plant pathogens are relatively sparse [22]. The scarcity of reports may belie their frequent occurrence. A recent meta-analysis suggests that these interactions are probably much more prevalent than previously estimated [23]. Reports on pathogen–pathogen antagonisms encompass diverse plant disease systems, including tree pathogens and wood-rotting fungi [24], storage-rotting fungi [25], foliar pathogens [26], and root rots [27]. Studies of foliar pathogens are most common, with antagonisms being reported among foliar pathogens of wheat, barley, and peas (see, for example, [26,28,29]). This may be due to their relative ease of observation and not necessarily due to some innate association.

2. Materials and Methods

2.1. Fungal Isolates and Growth Conditions

The M. maydis isolate called Hm-2 (CBS 133165, CBS-KNAW Fungal Biodiversity Center, Utrecht, the Netherlands) was recovered from wilting maize plants sampled in Sde Nehemia (the Hula Valley, Upper Galilee, northern Israel) in 2001, and identified using pathogenicity, physiology, colony morphology, and microscopic and molecular traits [5,30]. The M. phaseolina isolate called Mp-1 was recovered from wilted cotton plants in 2017 (Roni Cohen’s lab, Newe Ya’ar Research Center, northern Israel) and was identified using pathogenicity, physiology, colony morphology, and microscopic characteristics. Final molecular identification of this isolate was accomplished in this study by qPCR with a primer set targeting M. phaseolina species-specific fragments [31], and a primer set targeting the Internal transcribed spacers (ITS), ITS1 and ITS4, as we will elaborate below. The qPCR resultant oligonucleotide was identified by sequencing. The fungi were grown on rich potato dextrose agar (PDA) (Difco, Detroit, MI, USA) at 28 ± 1 °C in the dark for 4-7 days.

2.2. Maize and Cotton Cultivars Selected for This Study

The Prelude cv. sweet maize from SRS Snowy River seeds, Australia (supplied by Green 2000 Ltd., Israel) was chosen for this study. The Prelude cv. had been previously tested for susceptibility to late wilt in the field [6,20] and proved to be highly sensitive. The Pima cotton, Goliath cv. (extra-long-staple [ELS] cotton) is commonly grown in different parts of Israel (supplied by Isreal Seeds, Kibbutz Shefaim). This cotton cultivar is also traditionally grown on late wilt contaminated fields during crop rotation and was recently reported to be M. maydis vulnerable [10]. In an extensive survey conducted by Roni Cohen across Israel (Newe Ya’ar Research Center, northern Israel), the Pima cotton, Goliath cv. was reported to be sensitive to M. phaseolina charcoal rot disease [32].

2.3. Plate Confrontation Assay

The interactions between M. maydis and M. phaseolina when both fungi are grown together on the surface of potato dextrose agar can be referred to as antagonism or a mycoparasitism. The plate confrontation assays were performed by positioning a mycelia disk (6 mm in diameter, taken from the margins of a 4-6-day-old colony) of M. maydis at one pole of the culture plate and mycelia disk (at the same size and age) of M. phaseolina on the opposite pole. The M. phaseolina was added to the plate two days after M. maydis since it grows significantly faster. The two fungi were then allowed to grow under optimal conditions (28 ± 1 °C in the dark) for six days until the colonies’ margins met in the area of interaction.

2.4. Full-Growth Season Pot Experiments under Field Conditions

This study examined the combined effect of M. maydis and M. phaseolina on the growth and yield of maize and cotton plants grown in pots in an open-air enclosure under field conditions. The experiments aimed at simulating field conditions and the reason for using pots (positioned in the open-air field) with naturally infested soil instead of sowing the plants directly to the field soil was to allow enhancing the soil inocula in order to achieve, as much as possible, high and equable infection, and for better control of the water regime. To elaborate on this, pathogenicity trials cannot rely on natural soil infestation alone, which can lead to highly variable results. Even in heavily infested fields, the spreading of the pathogen is not uniform. The pathogen is scattered in small quantities in the soil, and the disease spreading is not uniform in the field.
The experiments were conducted in an experimental farm located near Kibbutz Amir (in the Hula Valley Upper Galilee, northern Israel) during a whole growing season and were subsequently repeated twice in the spring and summer of 2018 and 2019. The two subsequent experiments were performed in a completely randomized design. Each treatment included 10 independent replications (pots). Each pot was 10 L in volume. The negative control in the experiments was soil taken from a nearby field that had no history of M. maydis or M. phaseolina infestation, and if such an infestation did exist, it was assumed to be very low. All the plants received fertilization and insecticides according to the recommended growth protocol of the Israel Ministry of Agriculture Consultation Service (SAHAM). Each of the pots was seeded with five seeds. The sprouts were diluted to one plant per pot during the seedling growth stage (34 and 23 days after sowing, DAS, in the maize pots, and 28 and 41 DAS in the cotton pots in 2018 and 2019, respectively). Watering was done by drip line irrigation (two droppers per pot) and controlled by a computerized irrigation system. The specific irrigation amount varied for each of the two experiments, as detailed in Table 1. The 2019 repetition included additional treatments to evaluate the effect of the deficient water regime, as will be detailed below. The average meteorological parameters measured during the 2018 and 2019 experimental periods were similar, with higher soil temperature (in both the maize and cotton growth periods) and radiation (only during the maize growth period) in 2019, as detailed in Table 2.
The methodology used for plant inoculation and growth was similar to that of Degani et al., 2019 [20]. The inoculum method involved mixing naturally infested peat soil taken from the Neot Mordechai maize field (Hula Valley, Upper Galilee, northern Israel), which was known to be M. maydis infested for many years [33] and was probably also subjected to M. phaseolina charcoal rot disease [32], with 30% Perlite No. 4 (to aerate the soil).
Additionally, a complementary inoculation with the Hm-2 isolate was carried out in two steps. First, 40 g of sterilized infected wheat seeds were added to the top 20 cm of the soil of each pot with the sowing. These seeds were previously incubated for three weeks at 28 °C in the dark with M. maydis or M. phaseolina culture agar disks (10 disks per 100 g seeds) and were used here to disperse the pathogen in the soil, as previously described [5,34]. Second, with the above-ground appearance, two agar disks (6-mm-diameter) taken from five-day-old M. maydis or M. phaseolina colonies (grown for six days at 28 °C in the dark) were added to the upper parts of the roots (4 cm beneath the ground surface). In the maize pots, this procedure was performed 13 or 9 days after the sowing (in the 2018 and 2019 experiments, respectively). In the cotton pots, this procedure was performed 22 or 9 days after the sowing (in the 2018 and 2019 experiments, respectively). In the 2019 repetition, an M. phaseolina complementary inoculum with Mp-1 isolate spore suspension was added to enhance the disease severity outcome. The M. phaseolina spore suspension was prepared by washing and collecting the spores from 10 five-day-old M. phaseolina colonies grown, as described above, on PDA plates. The spores were then suspended in 1 L sterile double distilled water (DDW). Ten ml of this suspension was sprinkled onto each seed with the sowing.
Maize developmental stages are stated according to [35]. Emergence percentages evaluation conducted 9 DAS for all the plants. The growth parameters were evaluated at the maize sprouting phase (29, 34-37, 54 DAS). Later, at the end of the experiment, the maize harvest day (79-82 DAS), phenological stage evaluation, wilt determination, and yield assessment were performed. A dehydration assessment was done on harvest day by calculating the percentage of plants showing typical maize late wilt dehydration symptoms—the upper leaves’ color alternation to light-silver and then to light-brown and rolling inward from the edges of the leaf. This assessment was done using four categories: 0—the plant is completely dried, 1—the plant has severe dehydration symptoms (over 50% of its part are dehydrated), 2—the plant shows light symptoms and most of its parts are green, 4—the plant is healthy, green, and without visible signs of disease. Thus, each repeat (individual plant) was evaluated according to this scale, and the dehydration proportions are the mean result received from each treatment. A similar symptom evaluation procedure was conducted for the cotton plants 37-41 and 54 DAS, as well as on the harvest day (154 or 167 DAS in 2018 and 2019, respectively), including growth parameter assessment and yield determination. Additionally, all of the plants in each treatment were uprooted, and each plant’s above-ground parts were measured to determine their height and wet weight. The roots’ and shoots’ dry biomass was determined after drying the plants at 65 °C for 62 h. Samples of tissue were taken in order to identify the fungal DNA inside the host tissues using qPCR, as will be described below.
The 2018 experiment. In the first experiment (2018), the sowing of the cotton plants was performed on May 5, 2018, and the sowing of maize was performed on May 24, 2018. Both cotton and maize plants emerged above the ground surface eight days after sowing. The maize fertilization took place 57 DAS (about one week after the male flowering). At that age, most of the plants were at the R1 development stage (silking: plants are at a maximum or near-maximum height and have one or more silks extending outside the husk leaves). The maize plants were harvested on August 14, 2018 (82 DAS, 25 days after fertilization, DAF). The cotton plants flowered on May 30, 2018 (58 DAS) and were harvested on October 3, 2018 (154 DAS).
The 2019 experiment. The field experiment, described above, was repeated in the summer of the following year (2019) at the same location and according to the same design. This repetition included additional treatments to evaluate the effect of water regime on pathogenesis outcome and disease symptoms development. Thus, half of the treatments received reduced irrigation (see Table 1) in order to produce a restricted, near-drought water regime that may encourage the development of M. maydis and M. phaseolina, and to facilitate the disease symptoms outbreak.
The sowing of the maize and cotton plants was performed on May 21, 2019. The maize plants’ fertilization took place 58 DAS (about one week after the male flowering). At that age, in the maize plot that received a regular water supply, most of the plants were at the R1 development stage. At the same age (58 DAS), the maize plots that had received reduced irrigation were at the VT development stage (tasseling: plants with fully visible tassel branches). The low water supply did not allow the plant to continue developing beyond this age (58 DAS), and they suffered from severe drought. Consequently, the reduced water supply plots were harvested one week later, 65 DAS, before the development of cobs. The maize plants that received a regular water regime were harvested on August 08, 2019 (79 DAS, 21 DAF). In the cotton plots, on 58 DAS, the plants had blossom buttons but had not yet flowered. The cotton plants flowered about one week later and were harvested on October 29, 2019 (161 DAS(.

2.5. Molecular Diagnosis

A molecular diagnosis was performed on plants collected from the pots experiment. Roots were washed to remove soil under tap water. The root tissue samples were taken from the uppermost part of the root—from the crown, seminal, and lateral roots (the fibrous root system)—and not from the primary root (the radicle root). The stem tissue samples were taken from the joint section between the aboveground first and second internode. Sampling was done by removing a cross-section of approximately 2 cm in length from each plant stem. The total weight of the samples (roots or stem) was adjusted to 0.7 g and considered to be one repeat. Tissue samples were placed in universal extraction bags (Bioreba, Reinach, Switzerland) with 4 mL of cetyl hexadecyltrimethylammonium bromide (CTAB) buffer and were ground with a manual tissue homogenizer (Bioreba, Reinach, Switzerland) for 5 min until the tissues were completely homogenized. The homogenized samples were treated for DNA purification as previously described [36]. The DNA was suspended in 100 µL of HPLC-grade water and kept at −20 °C until use in the qPCR analysis.
All of the qPCR reactions were performed as previously described [36] using the ABI PRISM® 7900 HT Sequence Detection System (Applied Biosystems, Foster City, CA, USA) for 384-well plates. The 5 µL of total reaction was used per sample well, including 2 µL of sample DNA extract, 2.5 µL of iTaq™ Universal SYBR® Green Supermix (Bio-Rad Laboratories Ltd., Rishon Le Zion, Israel), 0.25 µL of forward primer and 0.25 µL of reverse primer (10 µM from each primer to a well). The qPCR program was as follows: precycle activation stage, 1 min at 95 °C; 40 cycles of denaturation (15 s at 95 °C) and annealing and extension (30 s at 60 °C), followed by a melting curve analysis. Plant samples (root and stem tissues) from each experiment were analyzed separately by qPCR. Each sample was tested three times by qPCR to ensure consistency of the results. The A200a primers were utilized for qPCR (sequences in Table 3). The gene encoding for the last enzyme in the respiratory electron transport chain of the eukaryotic mitochondria-cytochrome c oxidase (COXI gene) was used as a “housekeeping” reference gene to normalize the amount of DNA [37]. The COX gene was amplified using the COX F/R primer set (Table 3). The amplified gene is from both the plants and the fungi that inoculate it. Relative quantification of the target M. maydis fungal DNA was calculated according to the ΔCt model [38]. The efficiency was presumed to be the same for all samples.

2.6. Statistical Analyses

A fully randomized statistical design was used in all experiments. Statistics and data analysis were carried out using the JMP program, 7th Edition, SAS Institute Inc., Cary, NC, USA. For the evaluation of M. maydis and M. phaseolina infection outcome in the experiments, the one-way ANOVA followed by post-hoc multiple comparisons of Student’s t-test for each pair was used. The t-test compared (with a significance threshold of p = 0.05) each treatment to the control.

3. Results

3.1. Plate Confrontation assay

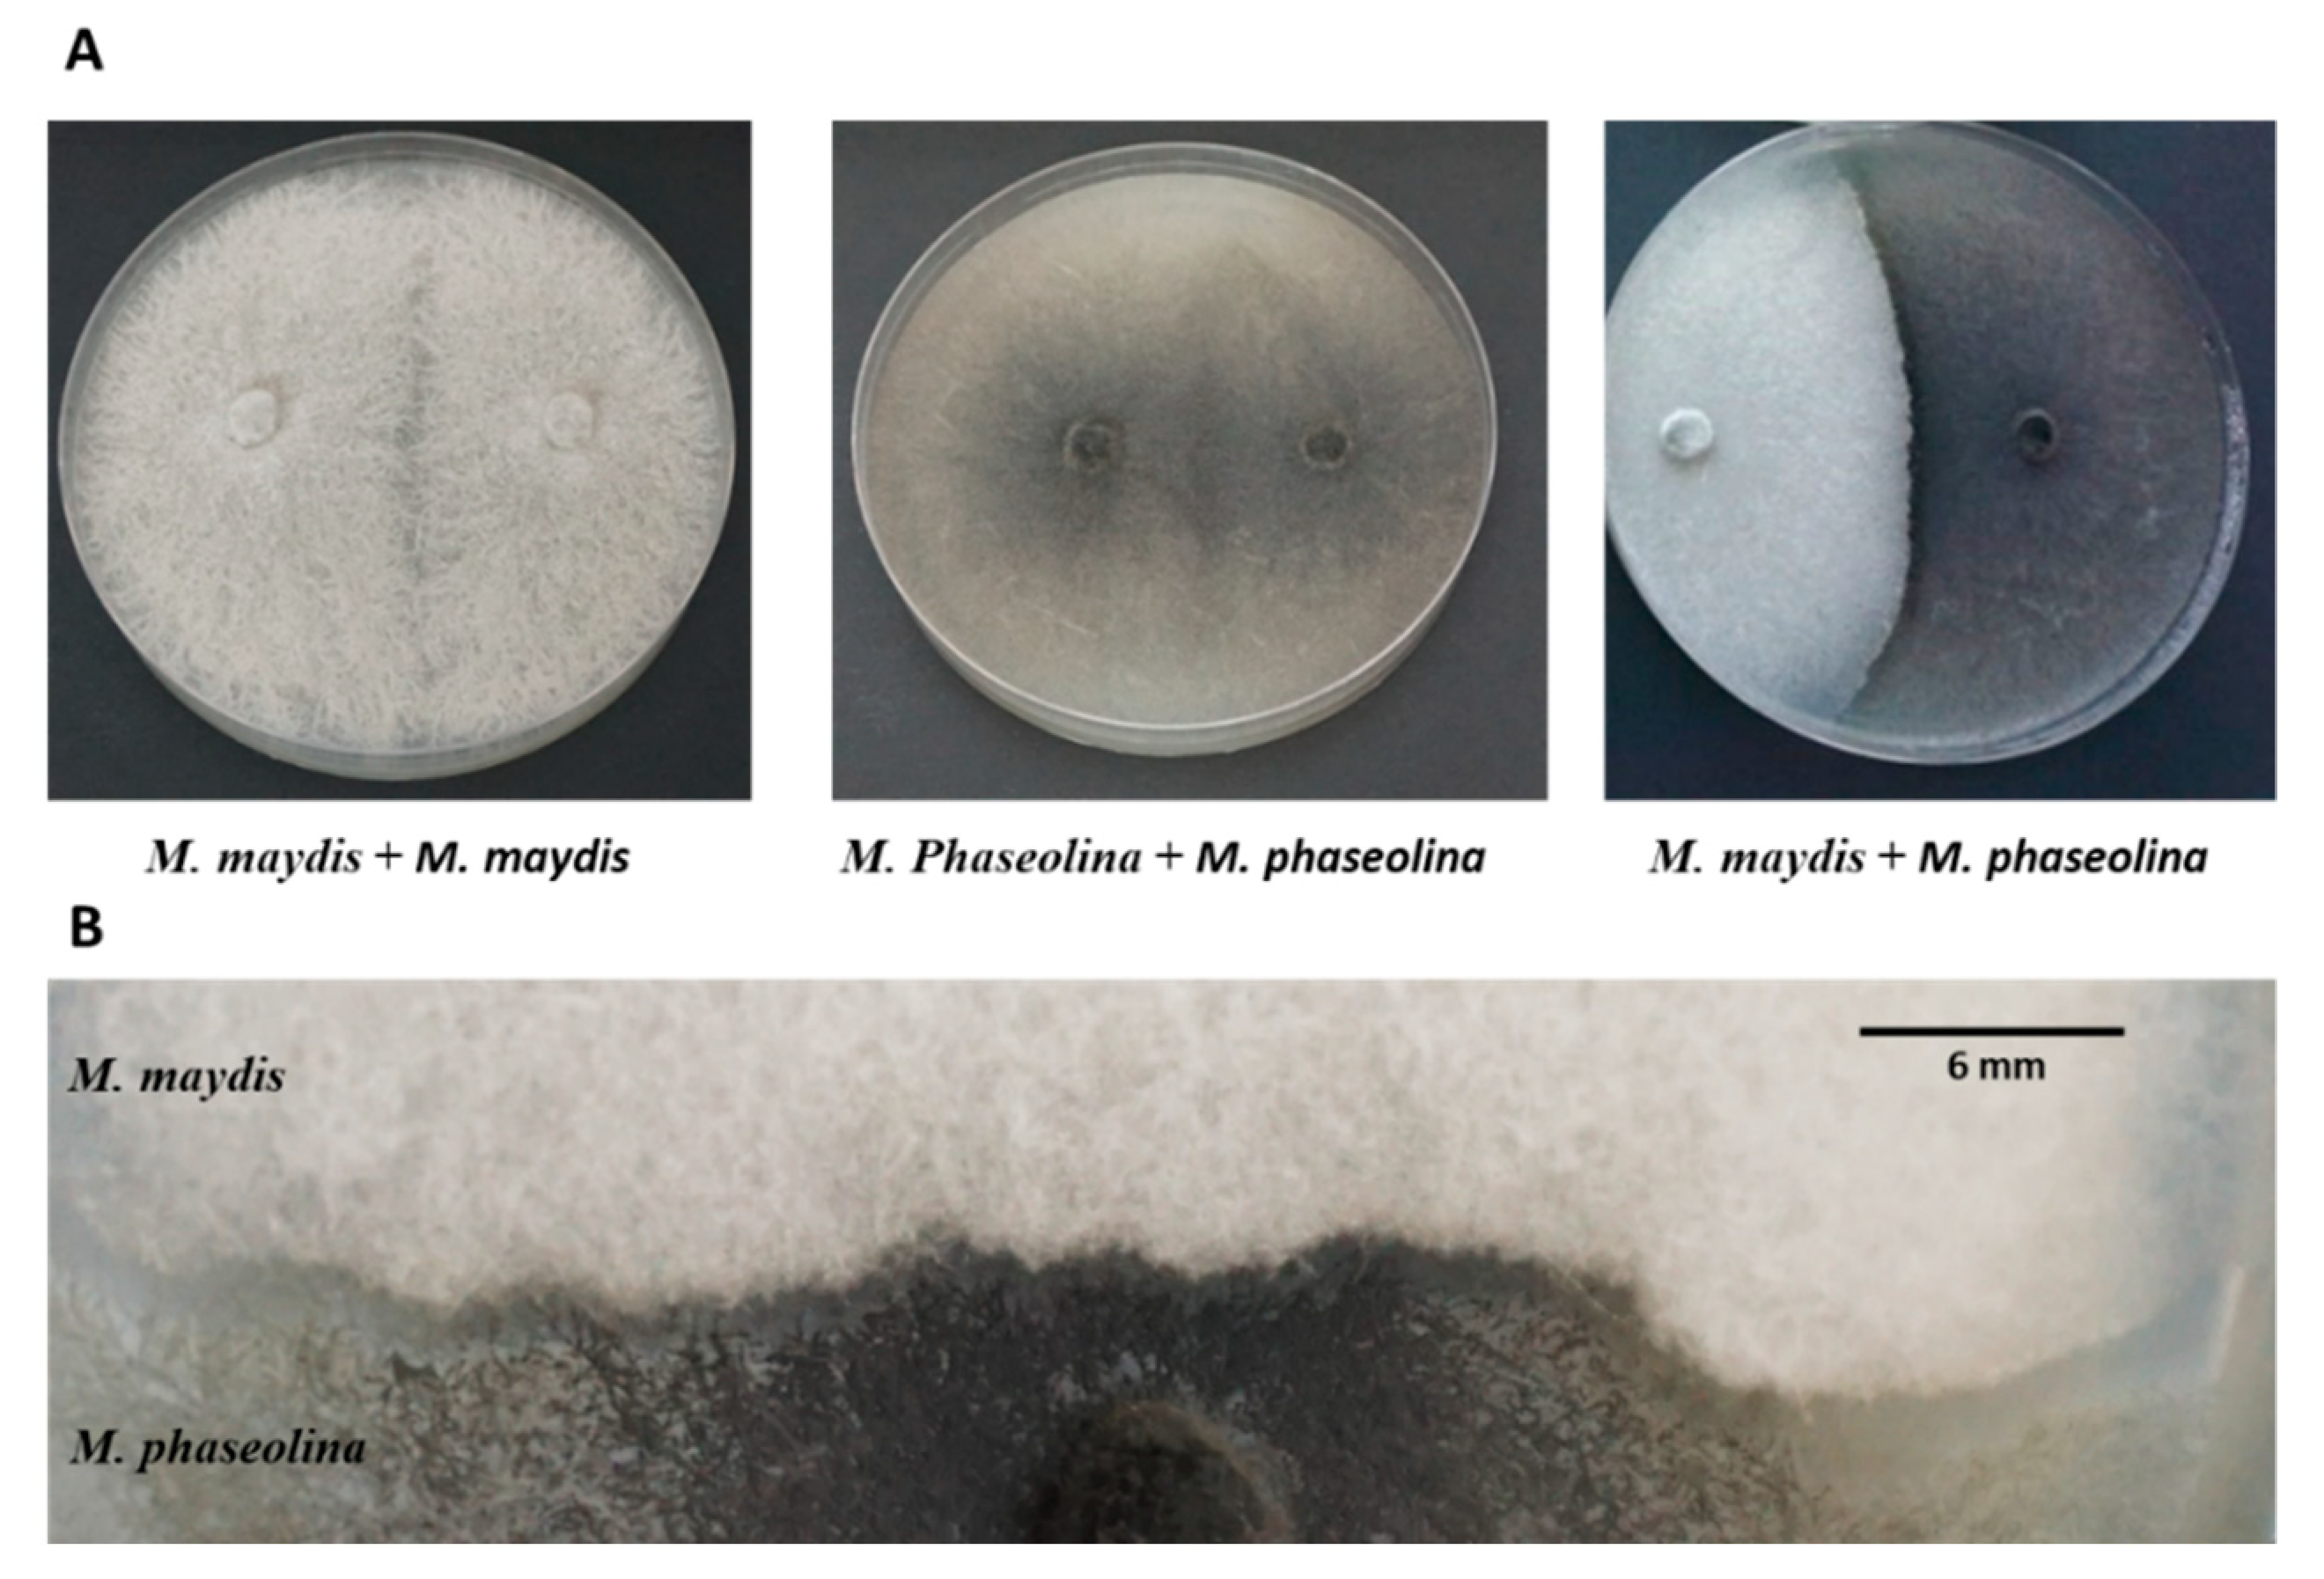
The relationship between the two soil pathogens that cause maize and cotton wilt diseases was tested in a confront antagonism assay in PDA culture plates. In this assay, a dominant fungus will usually continue to grow behind the confronted line while covering the other fungi. The results of this assay were compared to the growth rate of each fungus alone under the same conditions in order to estimate the growth inhibition rate caused by the other fungus. The growth of M. phaseolina was found to be faster than M. maydis, so the former was sown onto the plate two days after M. maydis. During the six days of incubation in the dark, the fungi grew toward each other until the meeting point, where they formed a clear line between the colonies and no further progress was possible. No mycoparasitism (growth of one fungus on top of the other) was observed (Figure 1A). Moreover, no inhibitory effect by secretion products of one of the pathogens that arrested the other was detected. If such an inhibitory effect does exist, it was effective only at a very short distance (approximately 2 mm) since the two fungi colonies formed a clear line between them (Figure 1B). Additionally, no interlocking of the webs between the two fungi was found.

3.2. Full-Growth Season Pot Experiments under Field Conditions

The combined effect of the two soil pathogens, M. maydis and M. phaseolina, at the late plant’s phenological stages (in which the signs of the disease are most noticeable), was tested in two years of subsequent experiments in maize and cotton. The experiments were conducted in the spring and summer of 2018 and 2019 in pots under field conditions throughout a full growing season. Similar results and tendencies were obtained in both repetitions, but, as expected, some variations occurred in the field conditions, expressed mainly in the intensity of the differences between treatments. Thus, in order to achieve a full and accurate understanding of the interactions between the two fungi, it is important to present the major findings from both years. Table 4, Table 5, Table 6 and Table 7 present the 2018 experiment, while most figures present the 2019 experiment (as will be detailed in each figure legend). In the molecular DNA tracking, the high level of variations within the results due to changes in field environment conditions, together with an objective difficulty to achieve a uniform infection, resulted in relatively high standard error values. Consequently, no statistically significant difference can be measured in most of those tests in comparison to the control. The negative control in the full-growth experiments was soil taken from a nearby field that has no record of M. maydis or M. phaseolina infestation, and if such an infestation did exist, it was assumed to be minor. Indeed, as will be illustrated in the results, the control field soil contained small quantities of the pathogens.

3.3. The Co-Influence of M. maydis and M. phaseolina on Maize Plants

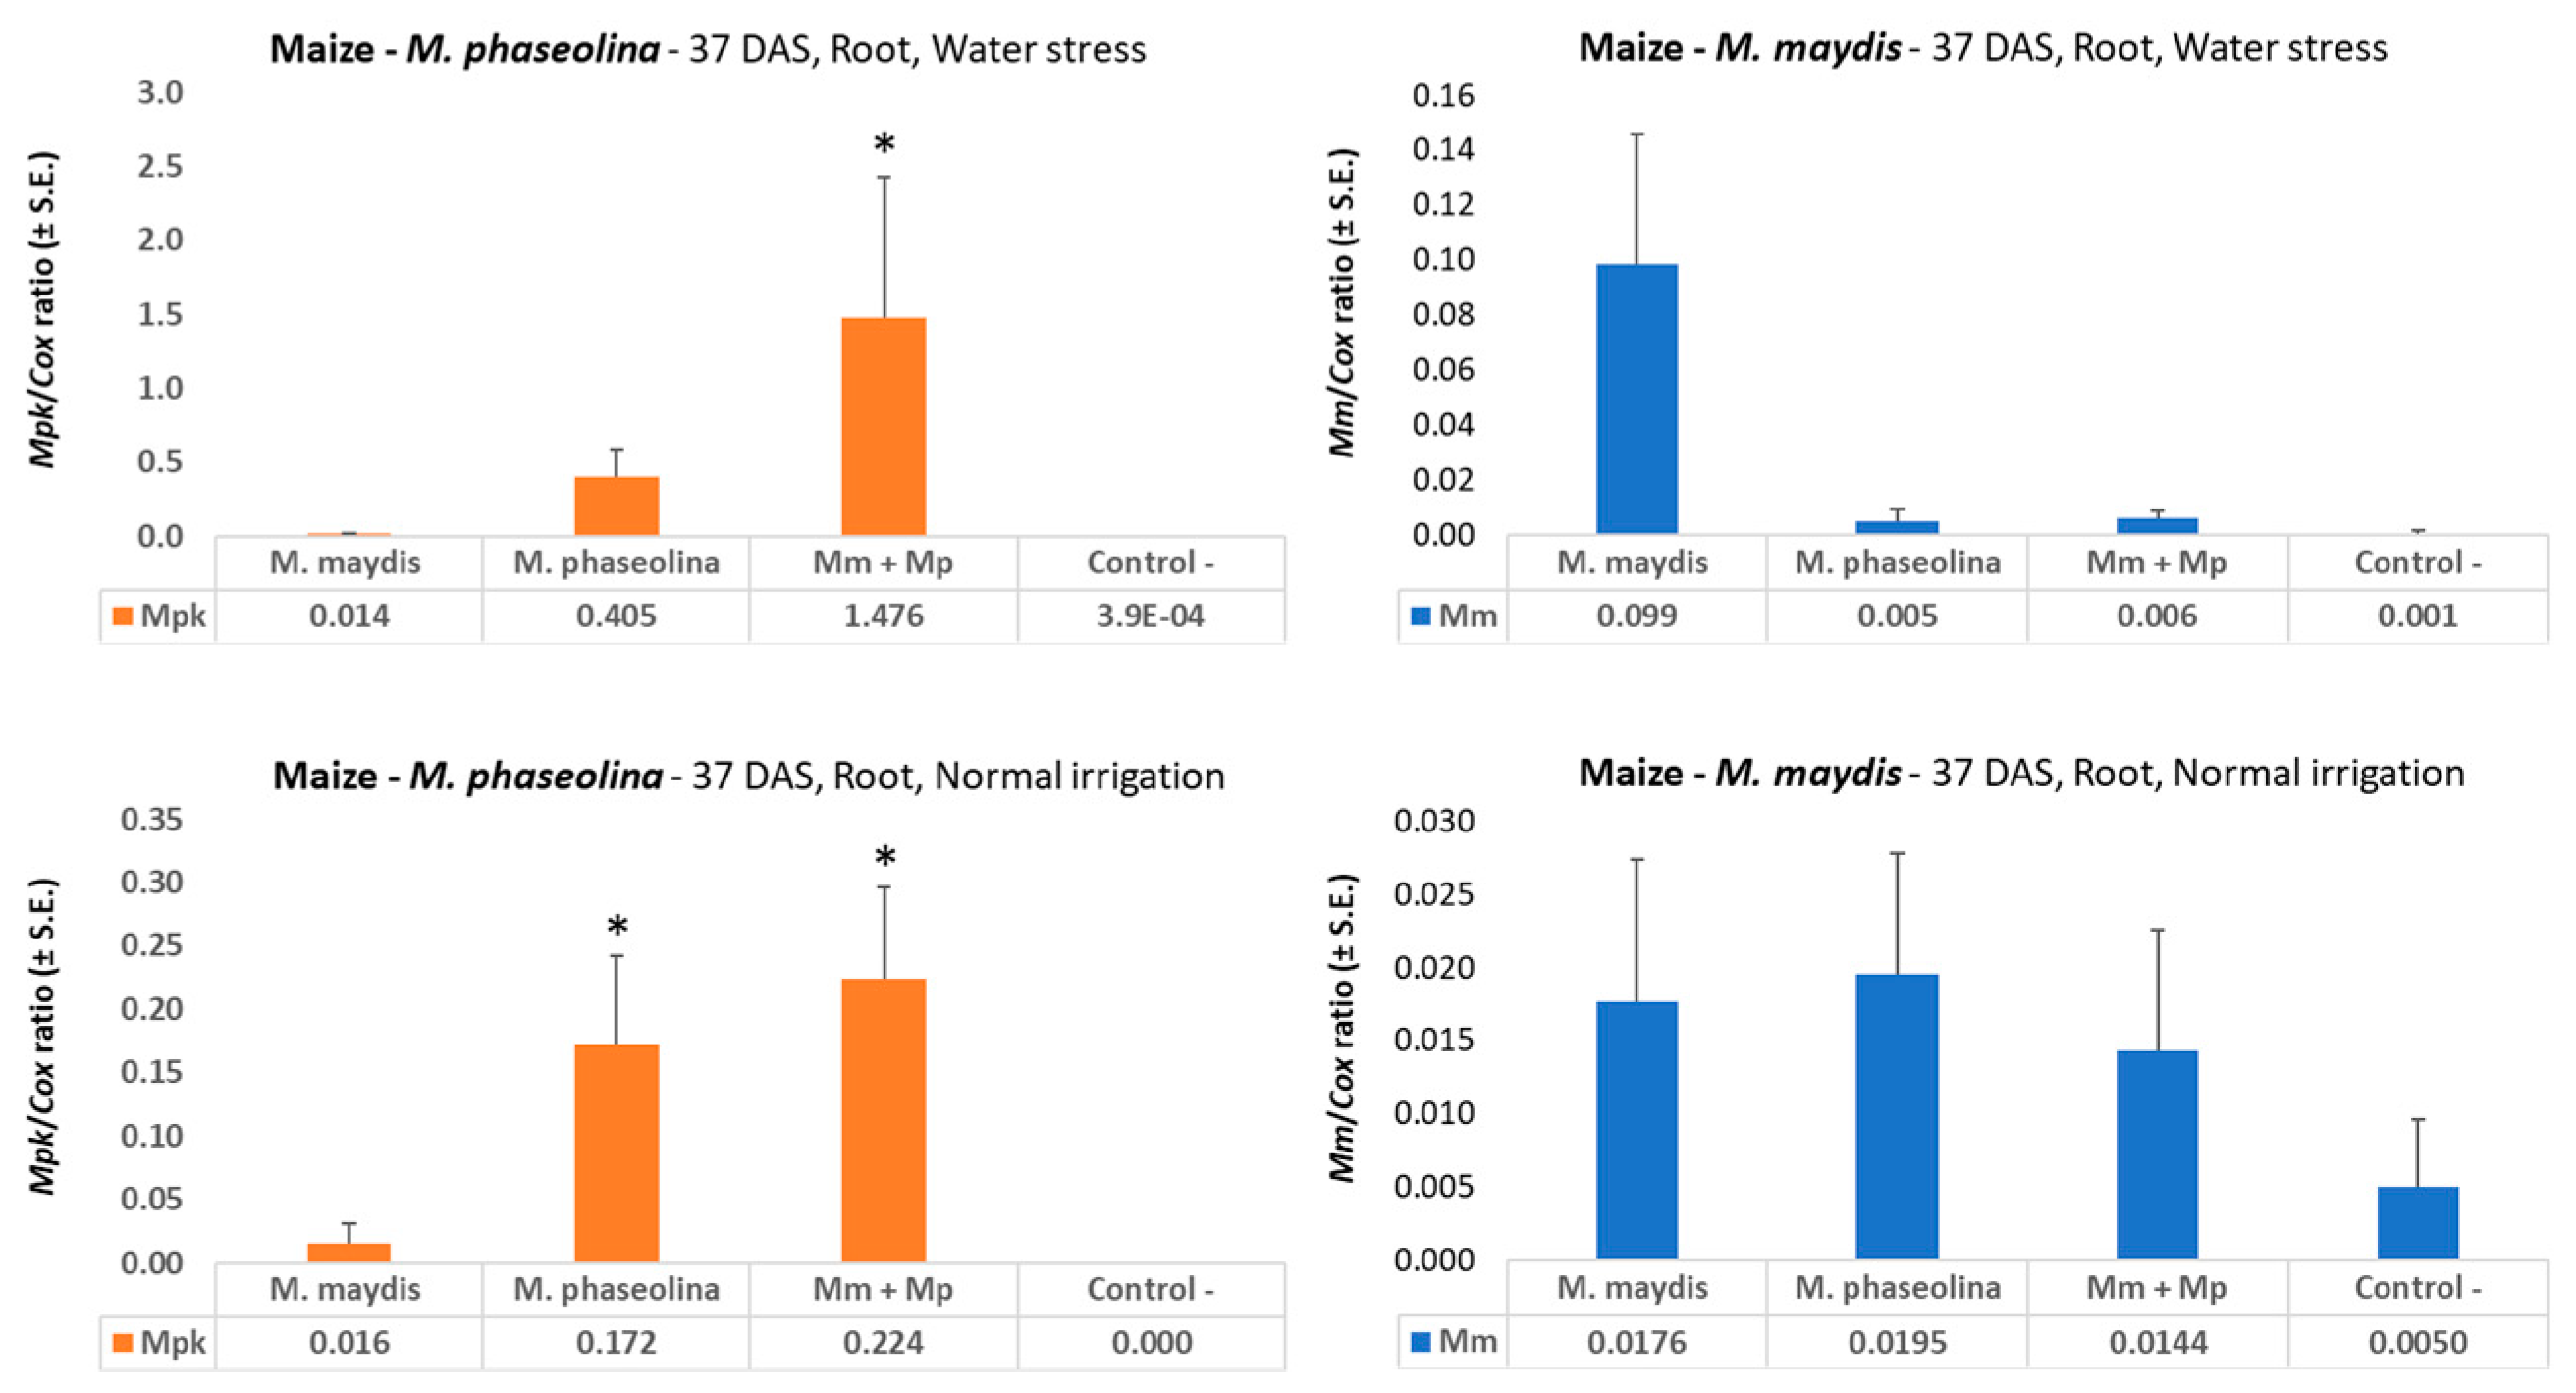
Molecular tracking of both pathogens’ DNA in the maize roots’ tissues during the growing season revealed the effect of the double infection on the spreading of both pathogens at the sprout stage (37 DAS, Figure 2). Infecting the plants with both pathogens, in comparison to infection with each of the pathogens alone, led to a decrease in the presence of M. maydis pathogen DNA and an increase in the amount of M. phaseolina in the plant roots. The difference in M. maydis DNA levels was maximized under water deficiency stress (to 16 times lower levels in the double infection treatment compared to the M. maydis inocula treatment, Figure 2 upper panel). In comparison, the highest M. phaseolina DNA was reached in the double infection treatment in the drought condition treatment, 3.6-fold higher than the infection solely with M. phaseolina. Despite these considerable changes in both pathogens, no measurable influence was reflected in the plants’ growth parameters (34 DAS), which were very similar in all treatments and the control (Table 4).
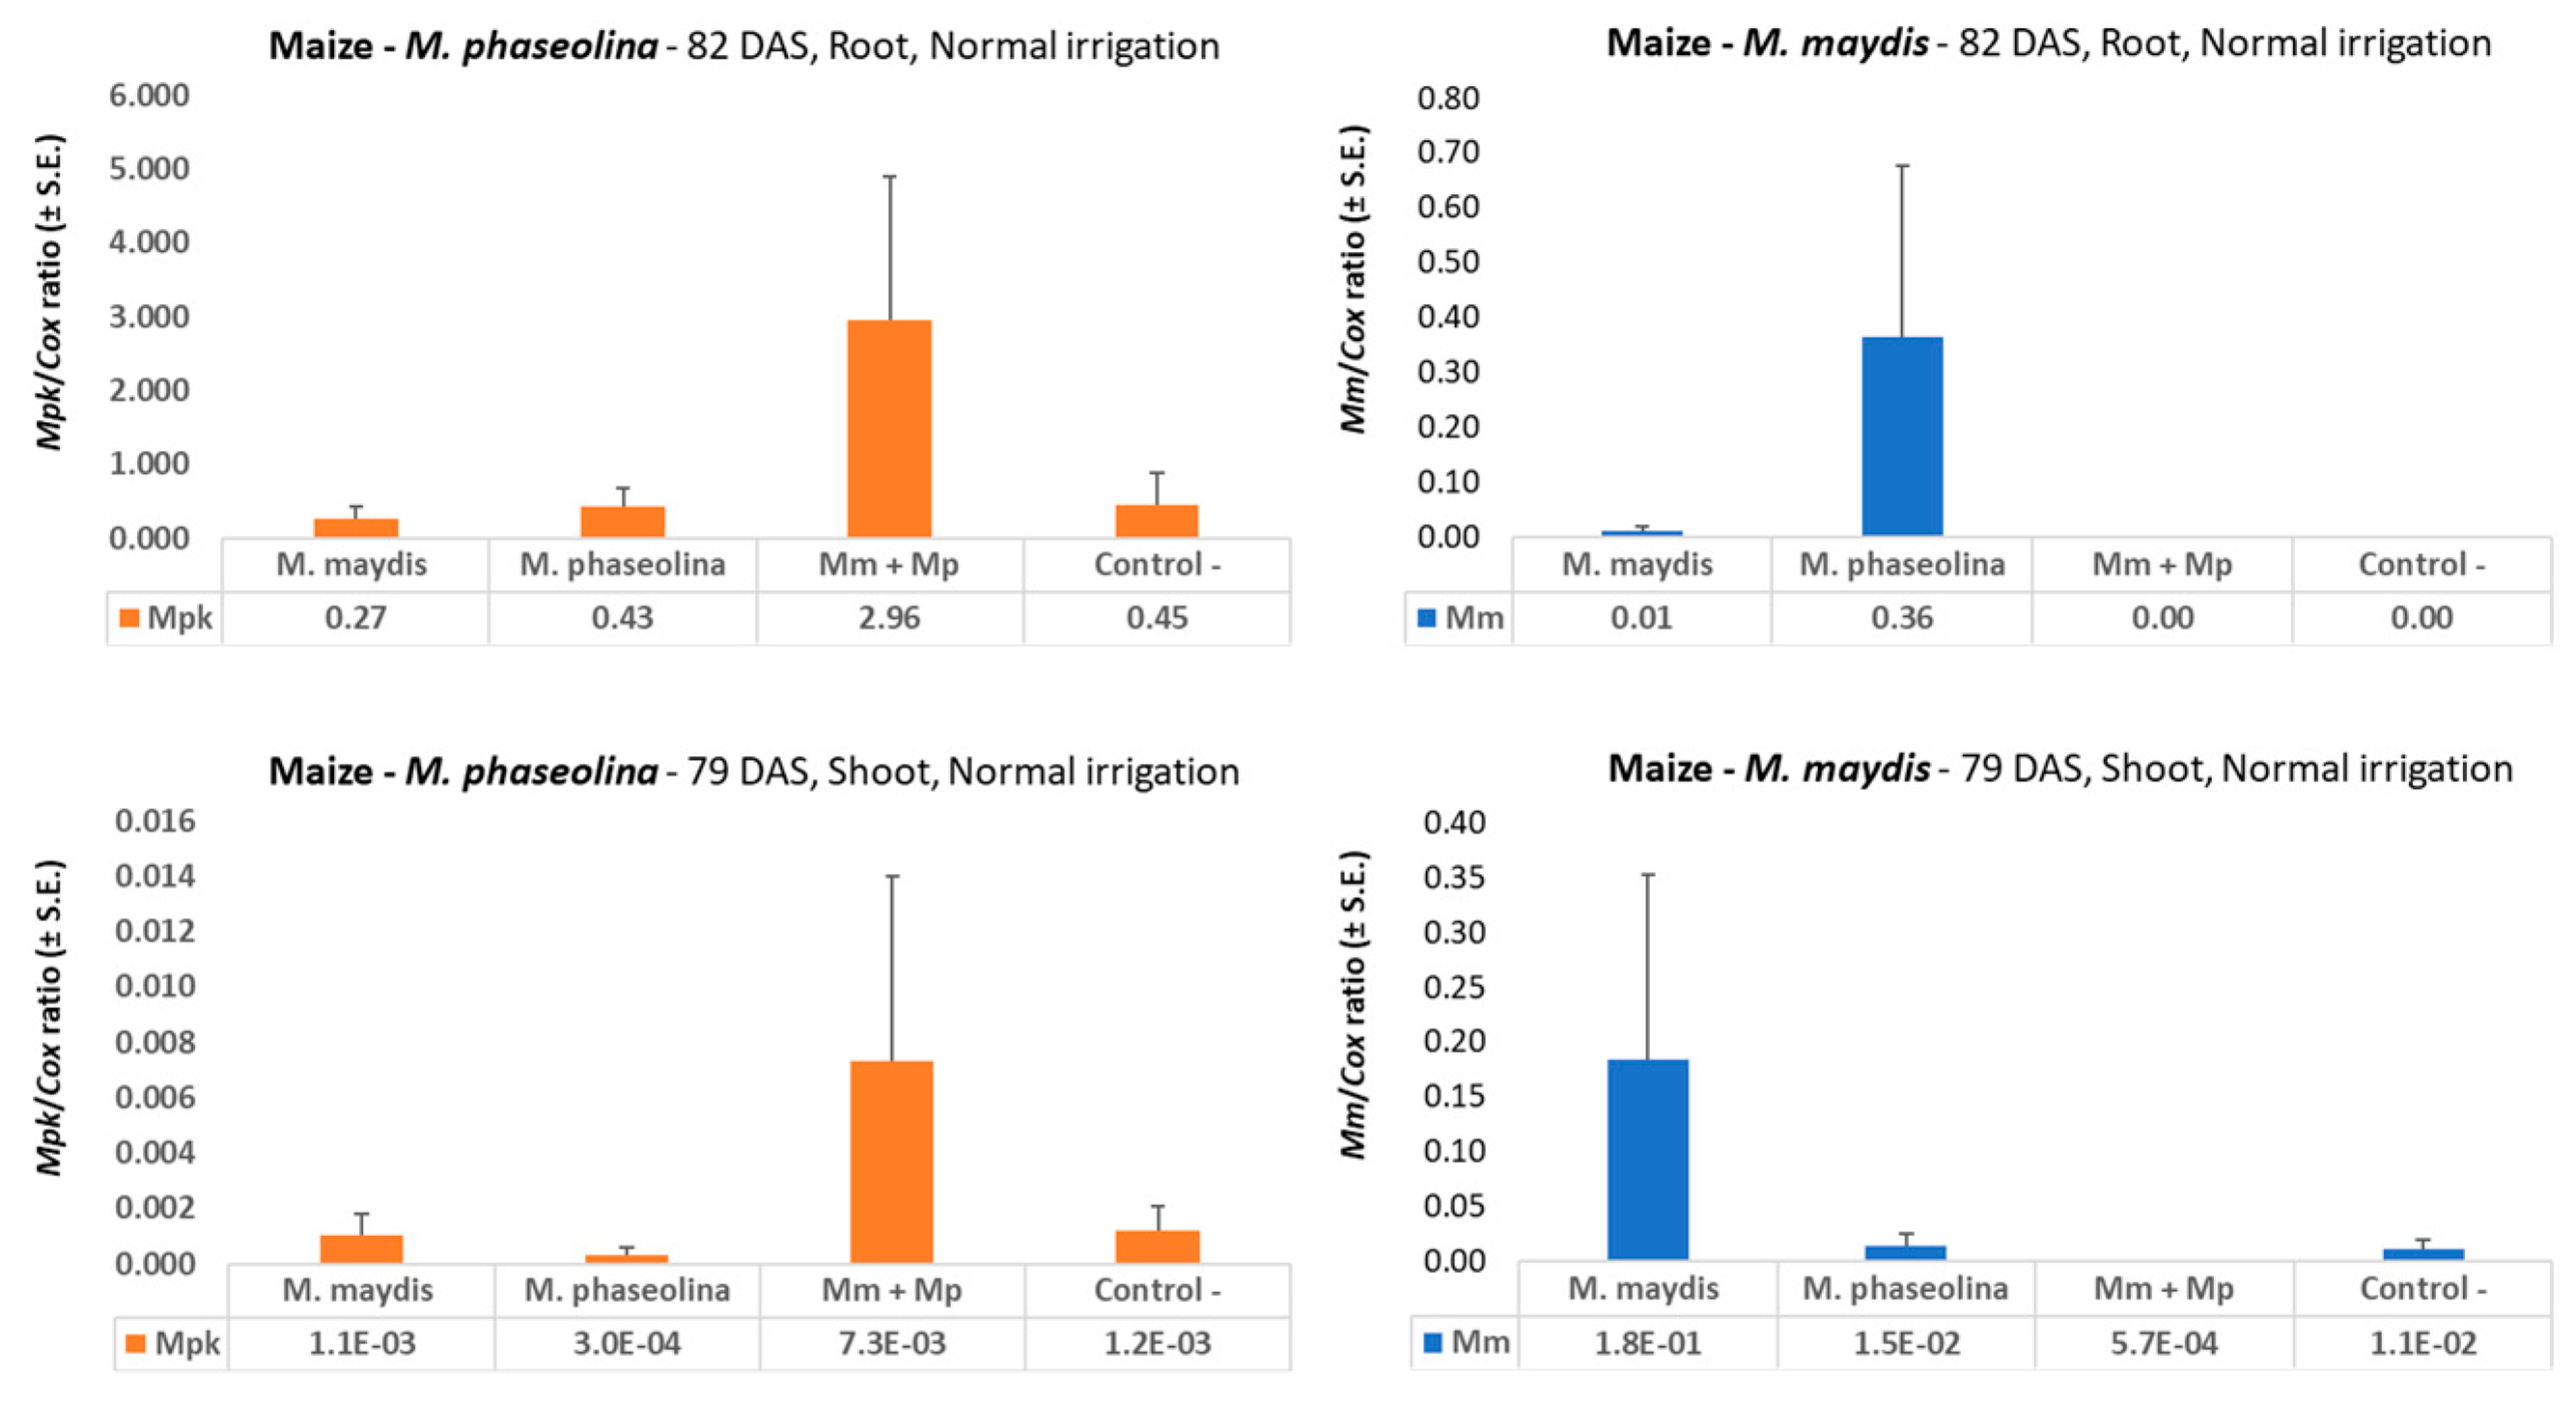
Tracing the fungal DNA in maize plant tissues at the end of the growing season (79-82 DAS) revealed a similar picture to that found in sprouts. At the end of the growing season, the combined infection with both pathogens compared to infection with M. maydis or M. phaseolina alone resulted in a sharp decrease in the fungal DNA levels of M. maydis and signaled an elevation in M. phaseolina DNA within the roots and the above-ground plants’ tissues (Figure 3). The double infection led to undetectable levels of M. maydis DNA in the roots and to 321 times lower levels in the stalks. The shoot’s M. maydis DNA level was 10 times higher than in the M. phaseolina inoculation, which was similar to the control (a natural field soil with very low levels of infestation, Figure 3). Remarkably, the double infection with both pathogens decreased M. maydis DNA levels nearly 20-fold below the control levels.
Interestingly, the appearance of M. maydis DNA in plants that grew on naturally infested field soil enriched with M. phaseolina inocula was high in the roots, compared to the M. maydis inocula treatment. This is probably the consequence of differences in the presence of M. maydis in this soil and natural variability in the sensitivity of the host plants. Indeed, half of the repeats in this treatment resulted in zero levels of M. maydis DNA.
M. phaseolina DNA levels in the double infection treatment (compared to sole M. phaseolina infection) increased 4.7- and 24-fold in the maize roots and stalks, respectively. It was observed that the overall DNA levels of M. phaseolina increased considerably in the roots towards the end of the season and that they were remarkably higher in the roots compared to the stalks (Figure 3).
In the 2018 experiment at this plant age (82 DAS), the fungal DNA variations had a noticeable effect on the plants’ growth parameters and yield (Table 5). All maize growth parameters (average plant height, root and shoot weight) and average cob weight were significantly (p < 0.05) higher in the M. maydis and M. phaseolina double infection compared to the single fungus inoculation. This influence was also reflected in the severity of disease symptoms (Table 6). The double infection treatment reduced disease damage and increased the number of healthy plants from two to three.
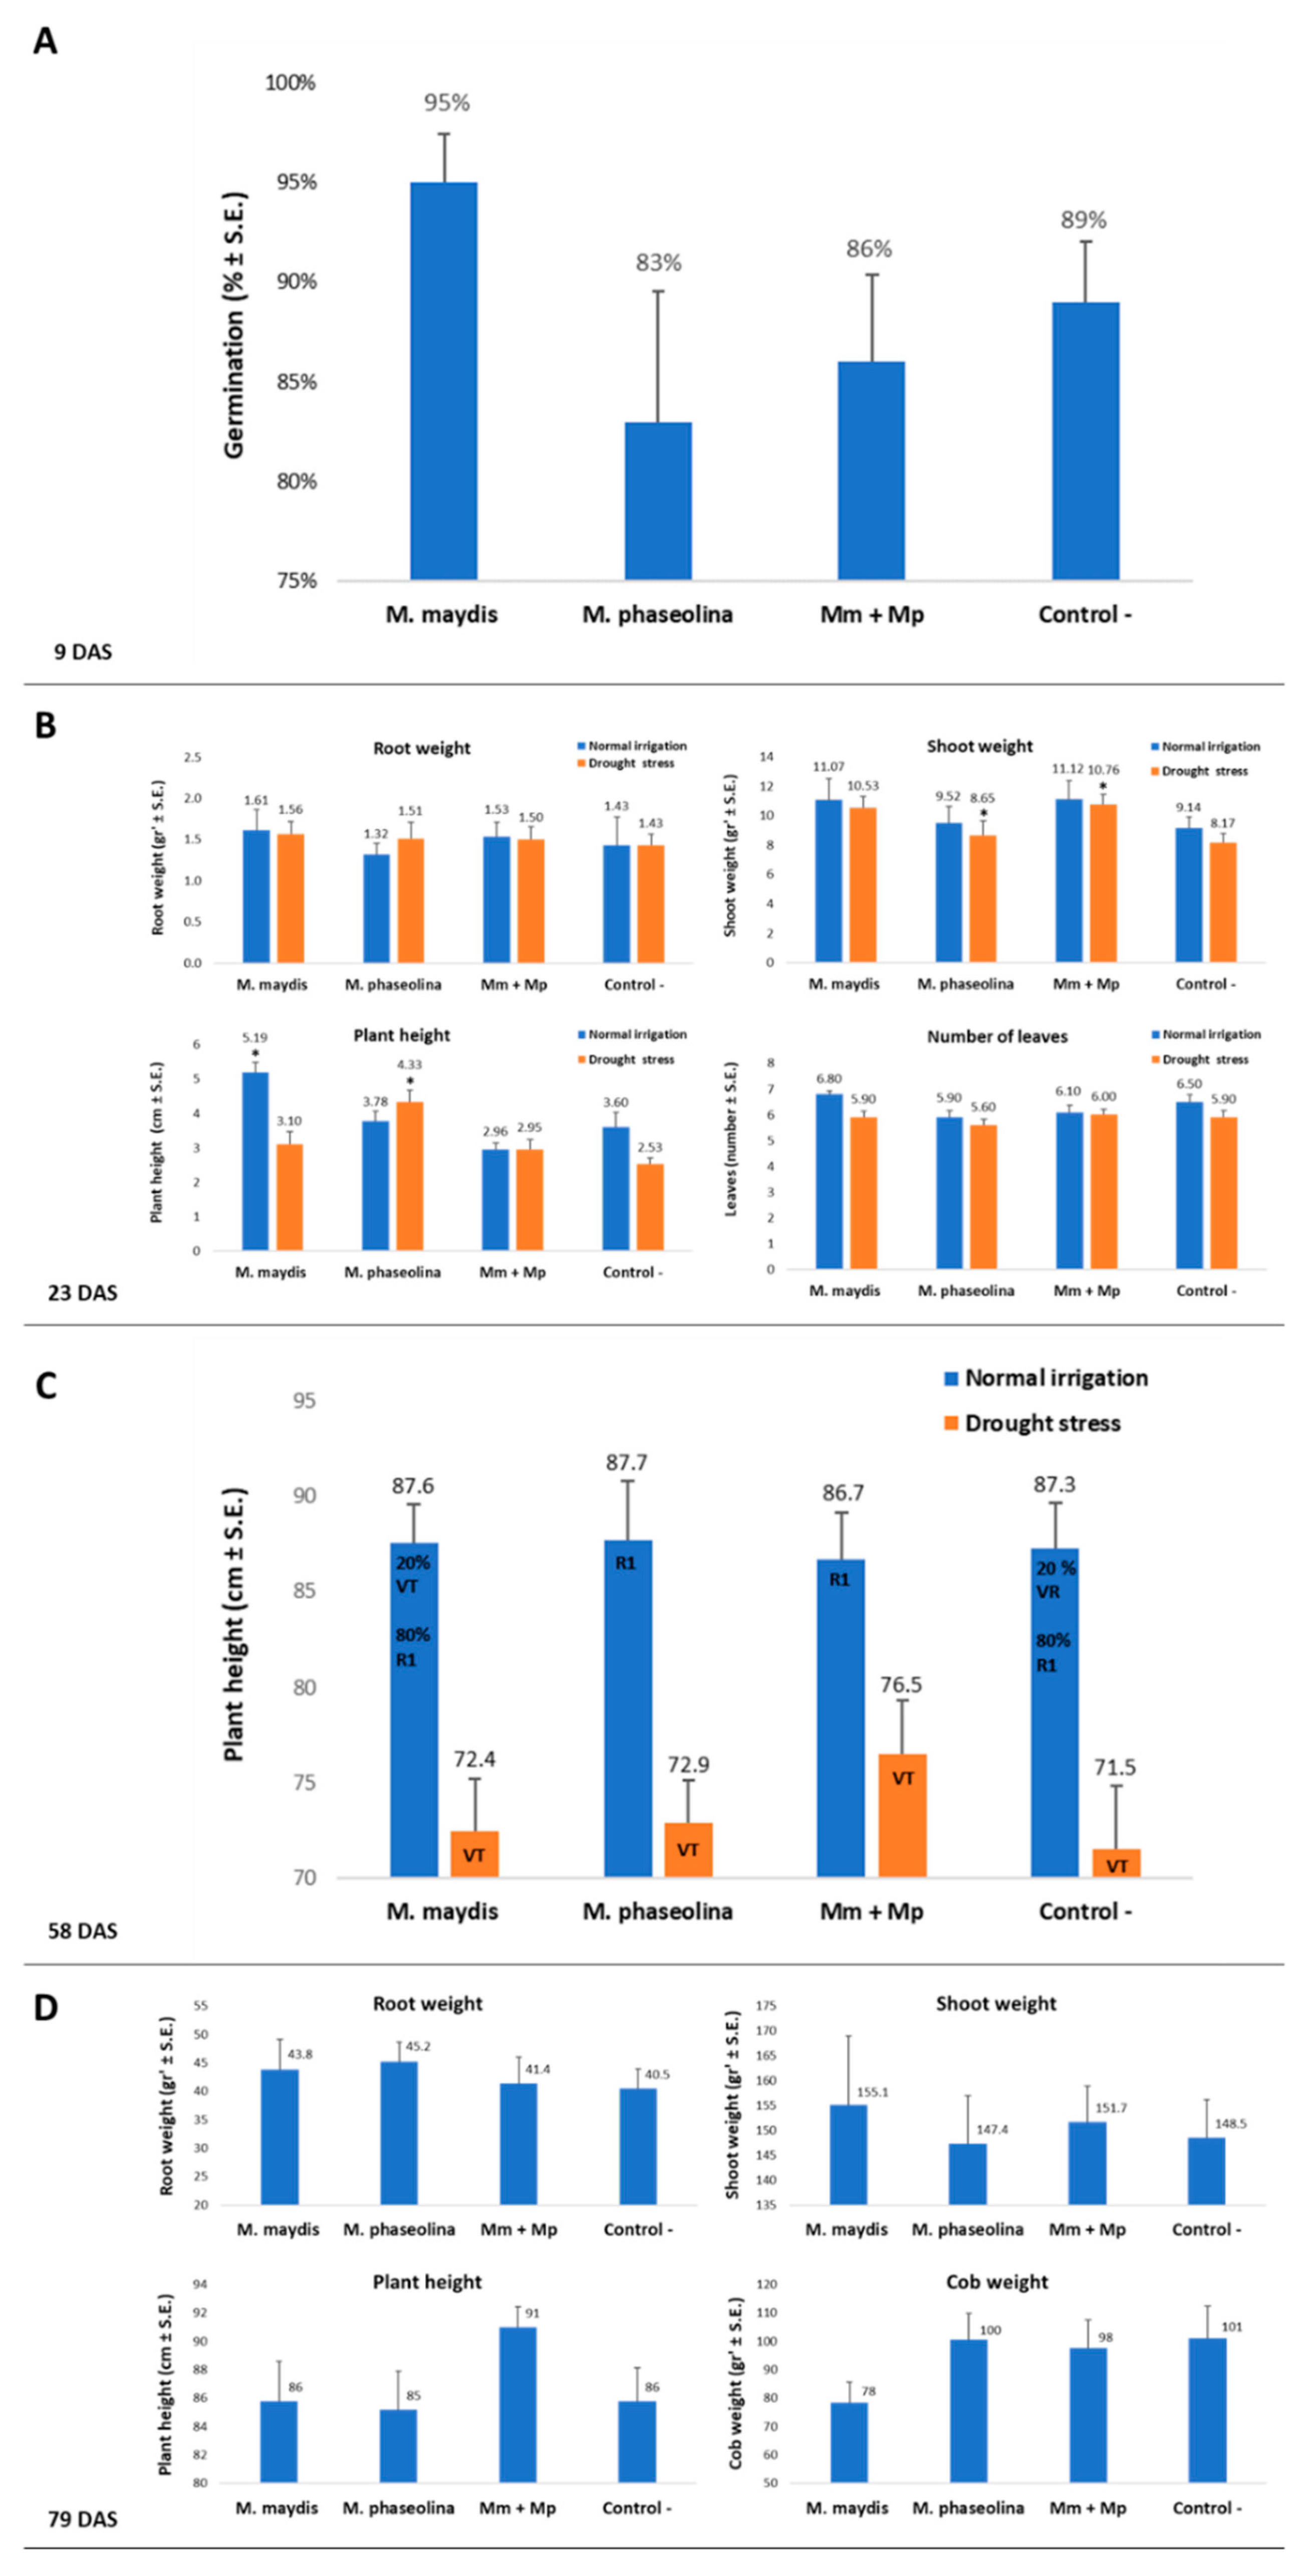
The 2019 repetition supported the 2018 findings of the combined effect of M. maydis and M. phaseolina on the maize plants’ development and health (Figure 4 and Figure 5, respectively). Similar to the 2018 experiment, in the 2019 experiment, no statistically significant difference between the treatments or the control could be identified during the emergence stage (9 DAS, Figure 4A). At this stage, the sole M. maydis inoculation caused higher (statistical difference, p < 0.05) values of emergence than the sole M. phaseolina inoculation, which resulted in opposite lower values. However, the treatments had similar growth parameters to the control (without any statistical difference) and these differences were later blurred at the sprouting stage (23 DAS, Figure 4B).
The lack of sufficient irrigation had a minor effect during the early growth period (23 DAS), reflected mainly in the above-ground parts (lower shoot biomass, plant height, and the number of leaves). In the water stress group, the M. phaseolina treated plants showed significant elevation in their height and shoot weight, compared to the control. Also, at this watering regime, the double inoculation with M. maydis and M. phaseolina led to significantly high shoot weight (p < 0.05, Figure 4B). Latter, at 58 DAS, the double infection or sole infection of the plants with M. phaseolina enhanced their progression from the VT (tasseling) to the R1 (silking) phenological stage (Figure 4C). Drought stress was a crucial factor in this regard, causing all maize plants to be delayed in the VT phase. At the season-ending, 79 DAS, the differences between the treatments were enhanced (Figure 4D). The most prominent positive influence of the double infection (compared to the single M. maydis inoculation) was expressed in an increase of 6% in average plant height and 26% in average cob weight. In the 2019 experiment, the benefit of the dual inoculation was most noticeable in the plants’ health evaluation (Figure 5 and Figure 6). Here, the combined infection abolished the severe late wilt symptoms and led to a sharp increase (from 10% to 43%) in the proportion of healthy plants.

3.4. The Co-Influence of M. maydis and M. phaseolina on Cotton Plants

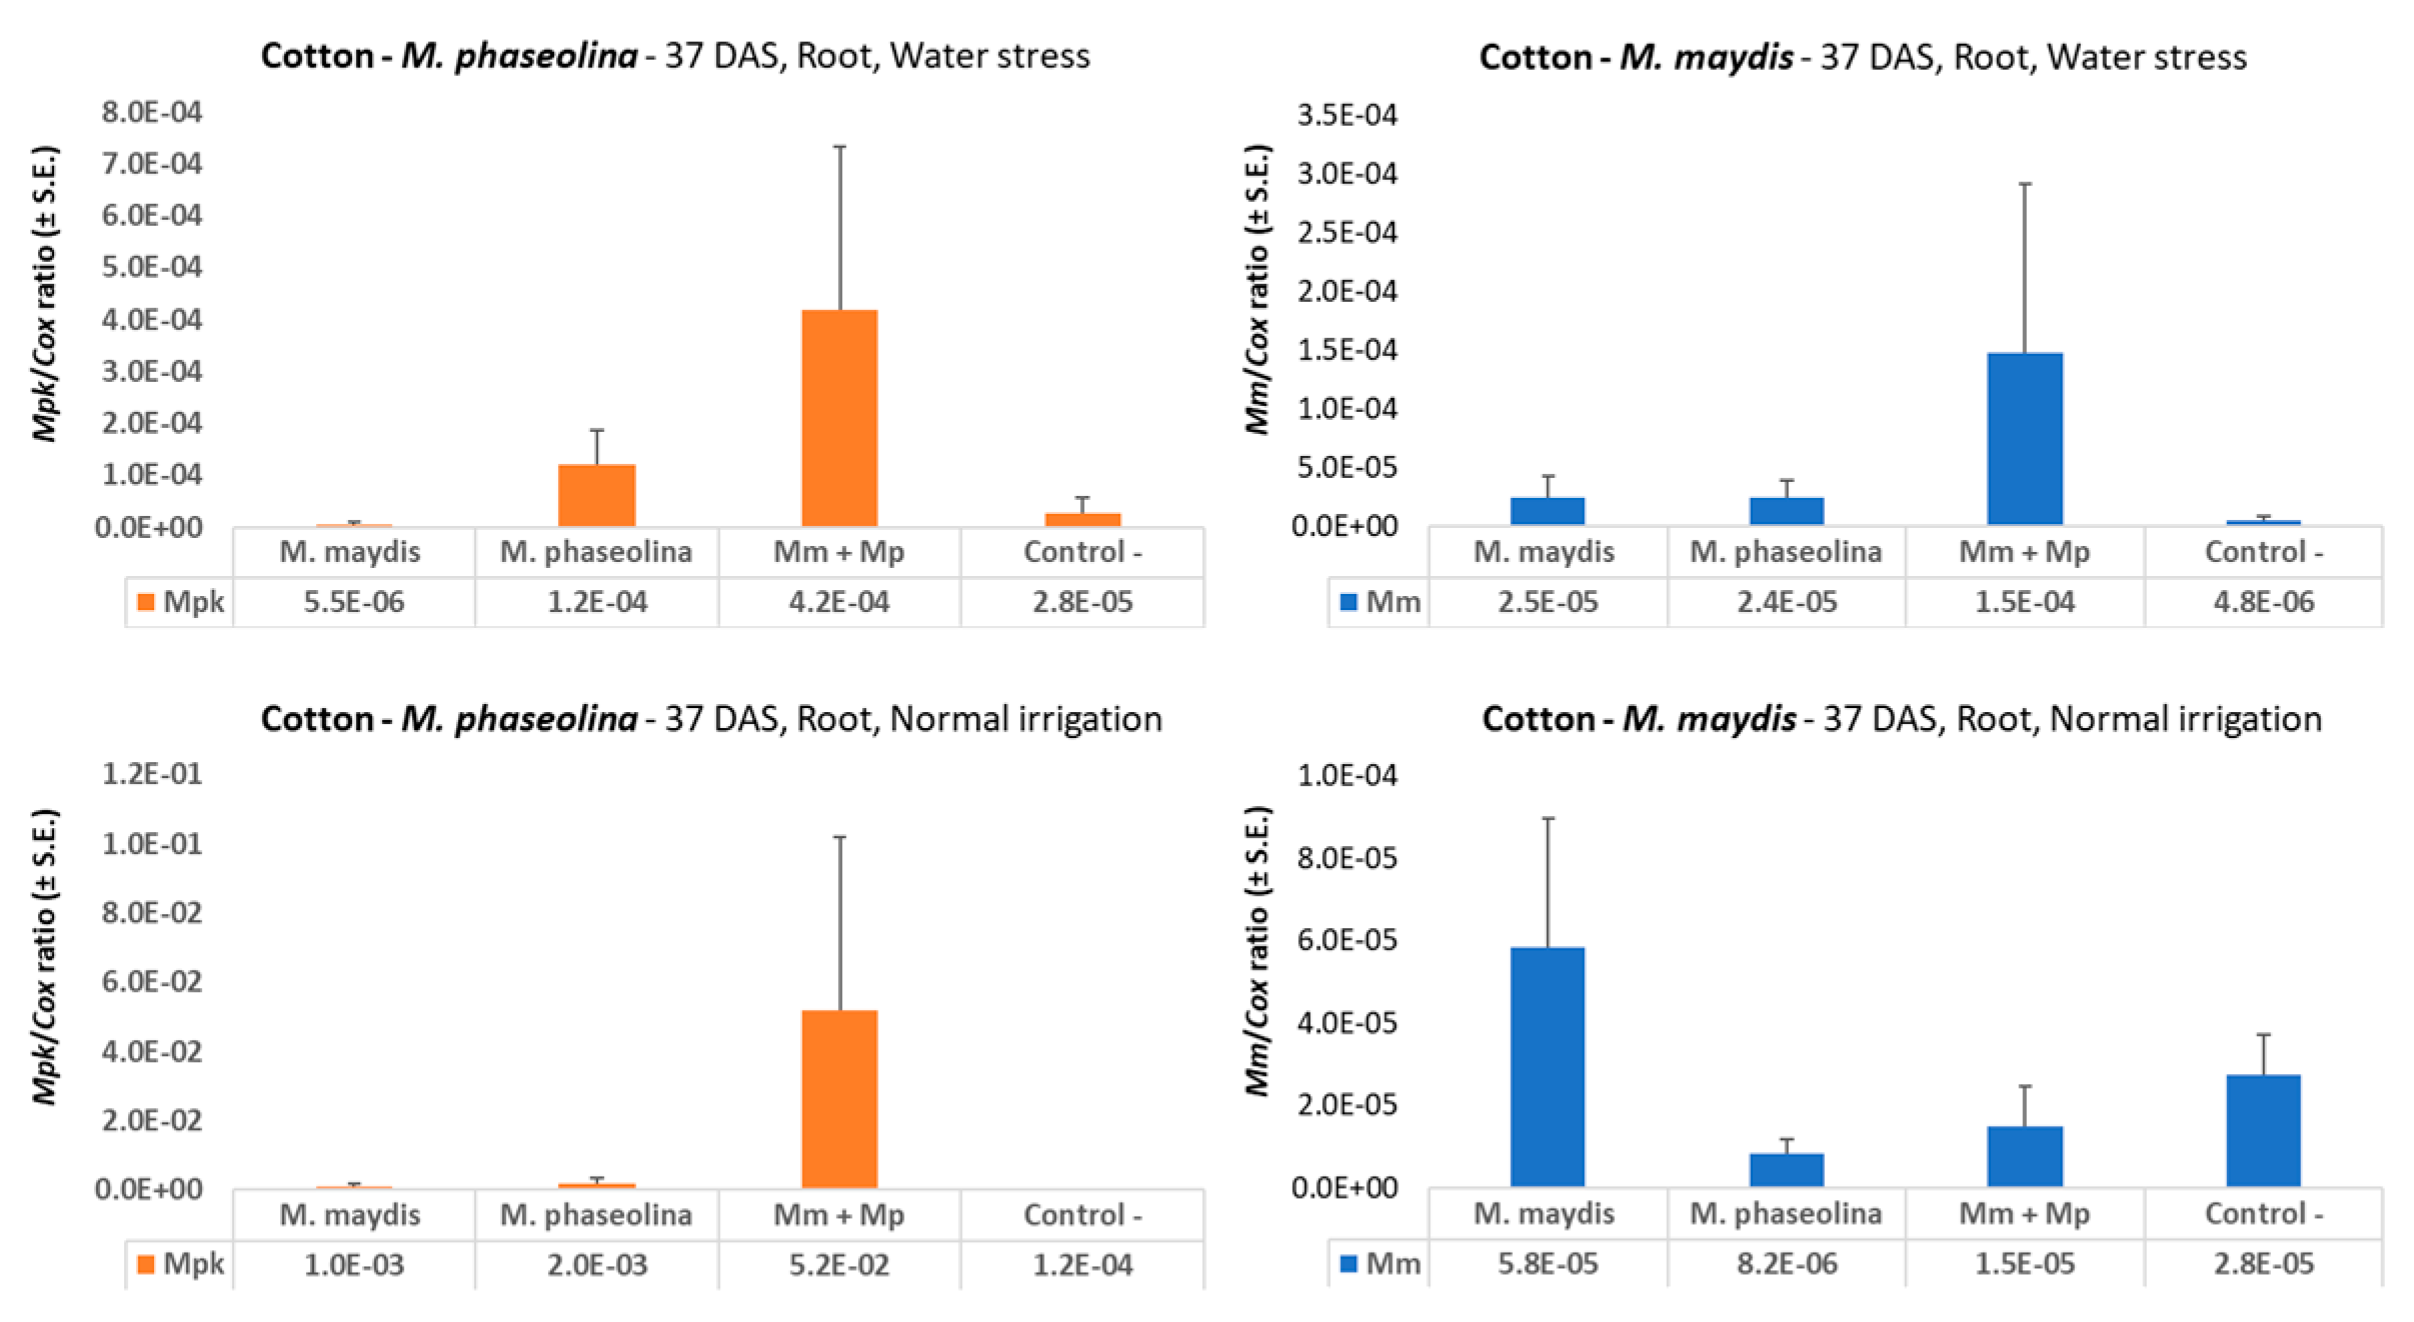
In cotton, the molecular tracking of the M. maydis and M. phaseolina pathogens’ DNA in the plant tissues during the growing season revealed a different picture than in the maize plants at the end of the season. At the sprout stage (37 DAS, Figure 7) and with a balanced water regime, similar to maize, infecting the cotton plants with both pathogens in comparison to infection with each of the pathogens alone led to a 3.9-fold decrease in the levels of M. maydis DNA and a 26-fold increase in the levels of M. phaseolina DNA in the plant roots. However, at water stress deficiency, the M. maydis DNA levels were higher in the double infection treatment than in the single M. maydis infection, and the amplification effect of the double infection on M. phaseolina DNA levels was less pronounced (Figure 7 upper panels)
At the end of the season (154 DAS), the dual inoculation influence on M. maydis DNA was similar to that obtained at 37 DAS under the insufficient water regime, with undetectable DNA levels in the M. maydis single inoculation, and low, but still measurable, M. maydis DNA levels (5.9*10-5) in the double infection treatment (Figure 8). Still, the only observable detection (Mm + Mp) is a result of one repeat out of the 10 repeats (nine repeats resulted in zero detection). However, when the same DNA samples were tested with the M. phaseolina primer set (Mpk), there were measurable and interesting results that reflect the outcome of the treatments. The highest M. phaseolina DNA level was achieved in the single infection treatment, with a 3.7-fold difference from the infection with both pathogens.
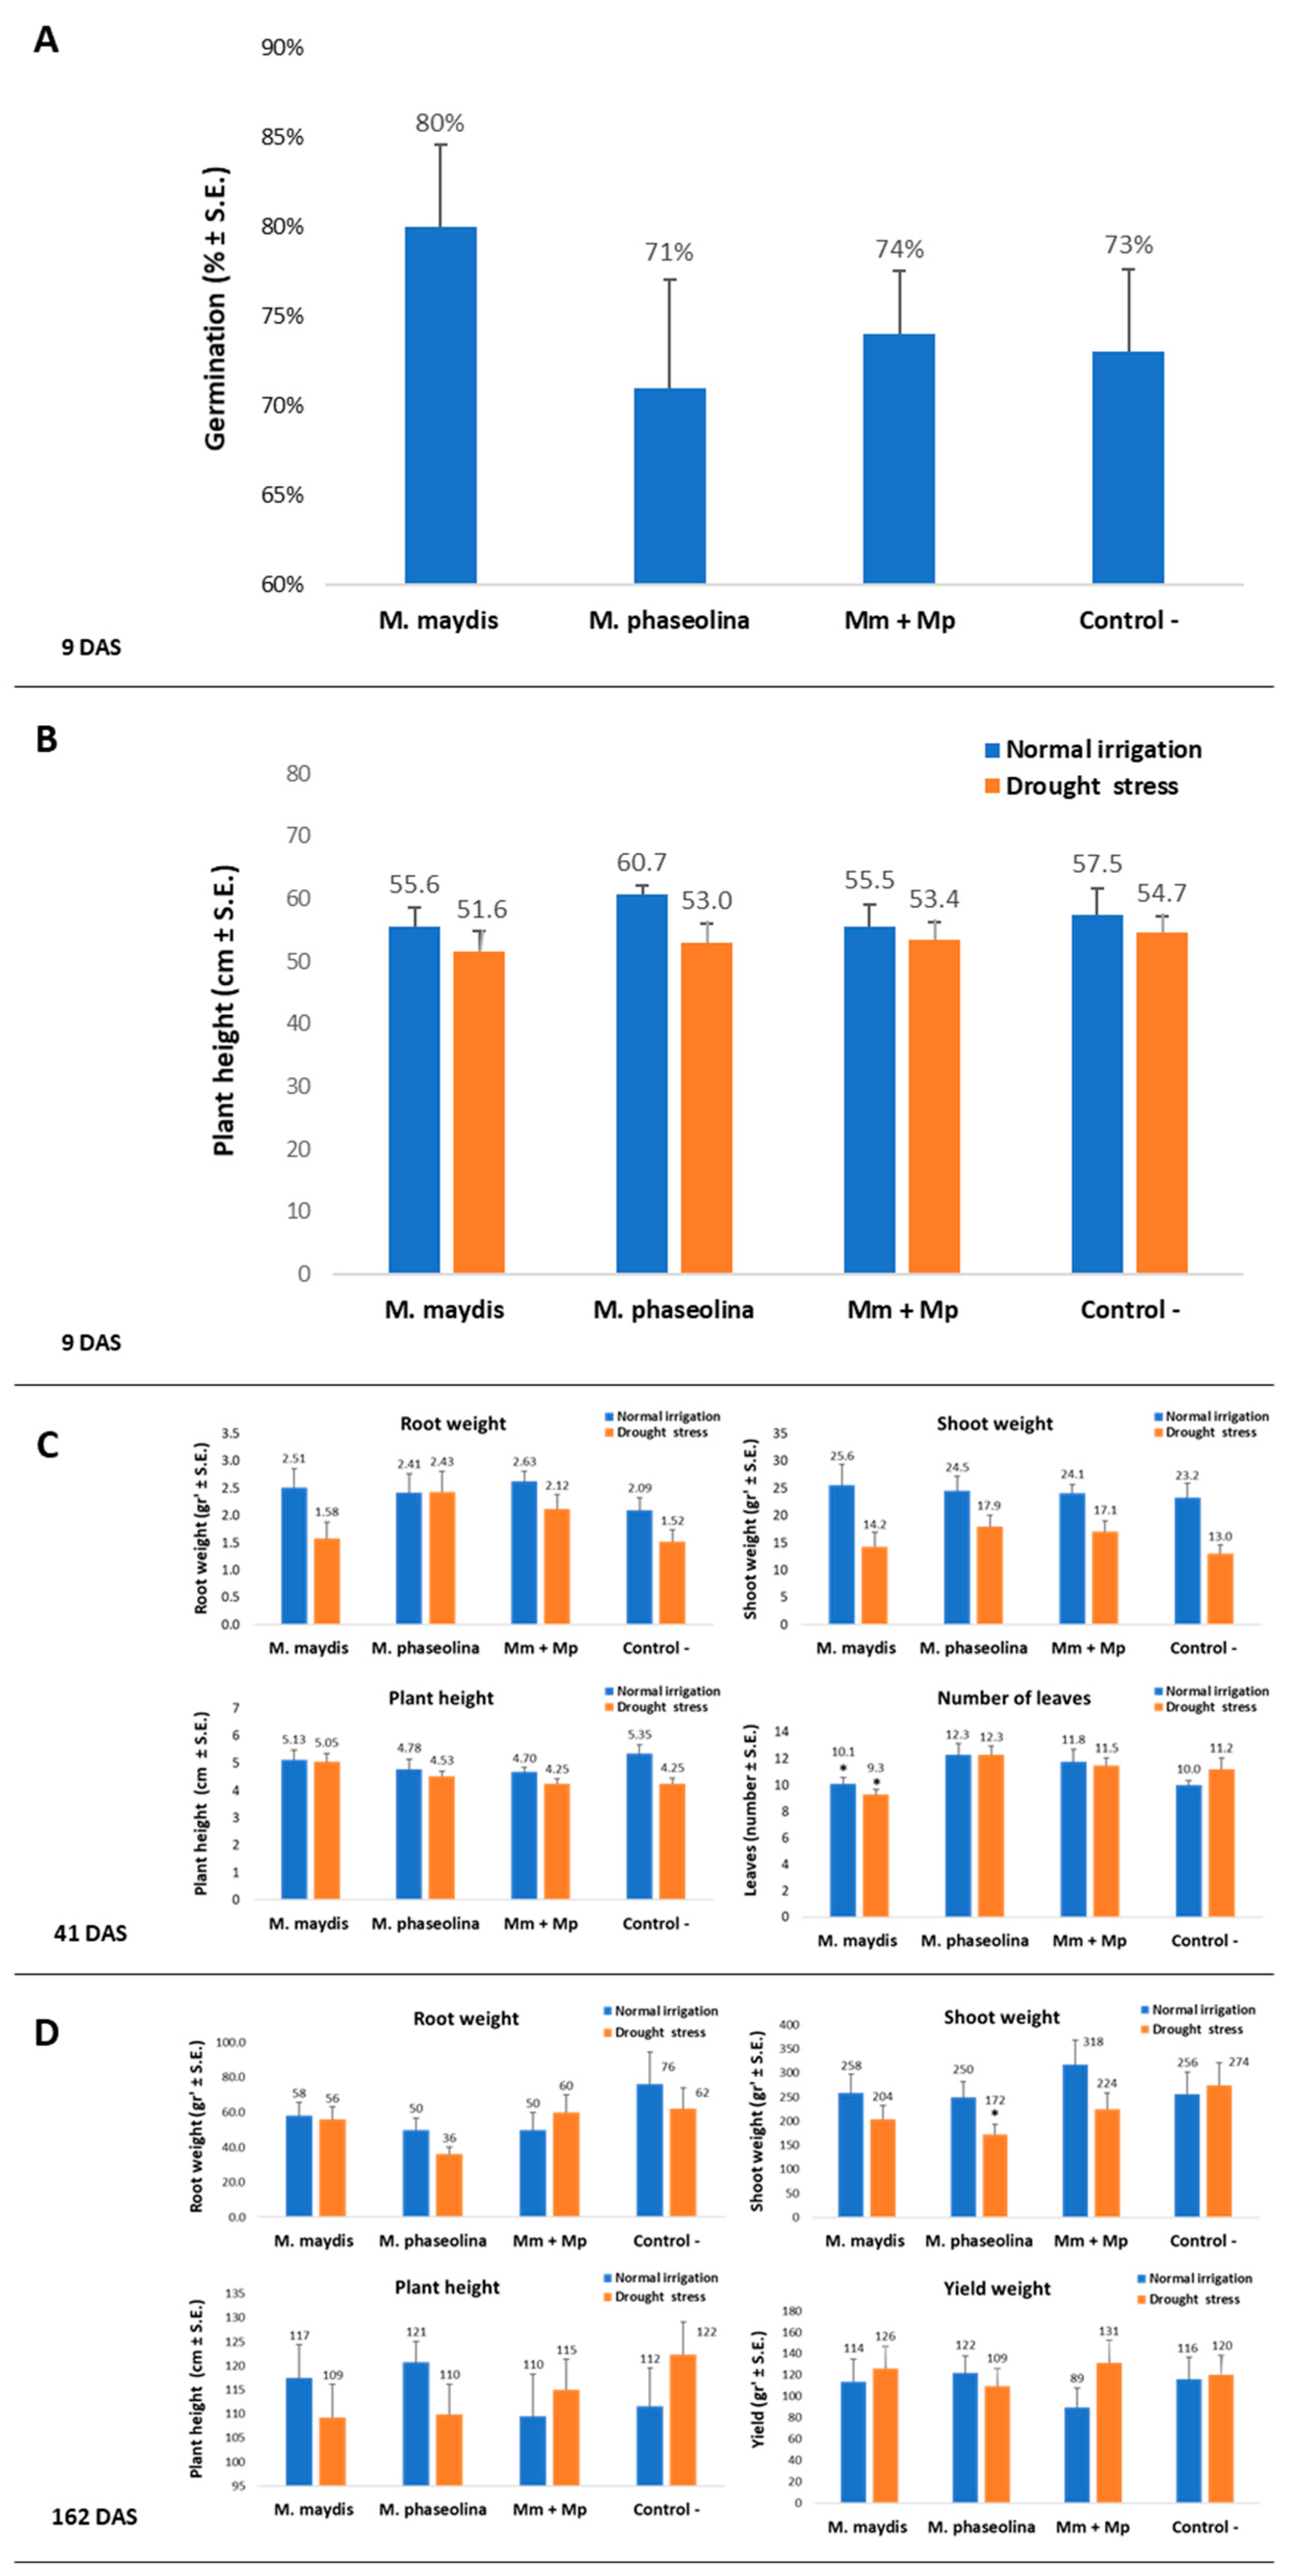
Inspecting the treatments’ influence on the cotton plants’ development reveals that the pathogens’ DNA spreading is not always expressed in the plants’ health conditions. At the sprout developmental stage (41 and 57 DAS), only a minor influence of the various infection modes was reflected in changes in growth parameters (Figure 9A–C, Table 7). As expected, the limitation of water supply caused a growth delay.
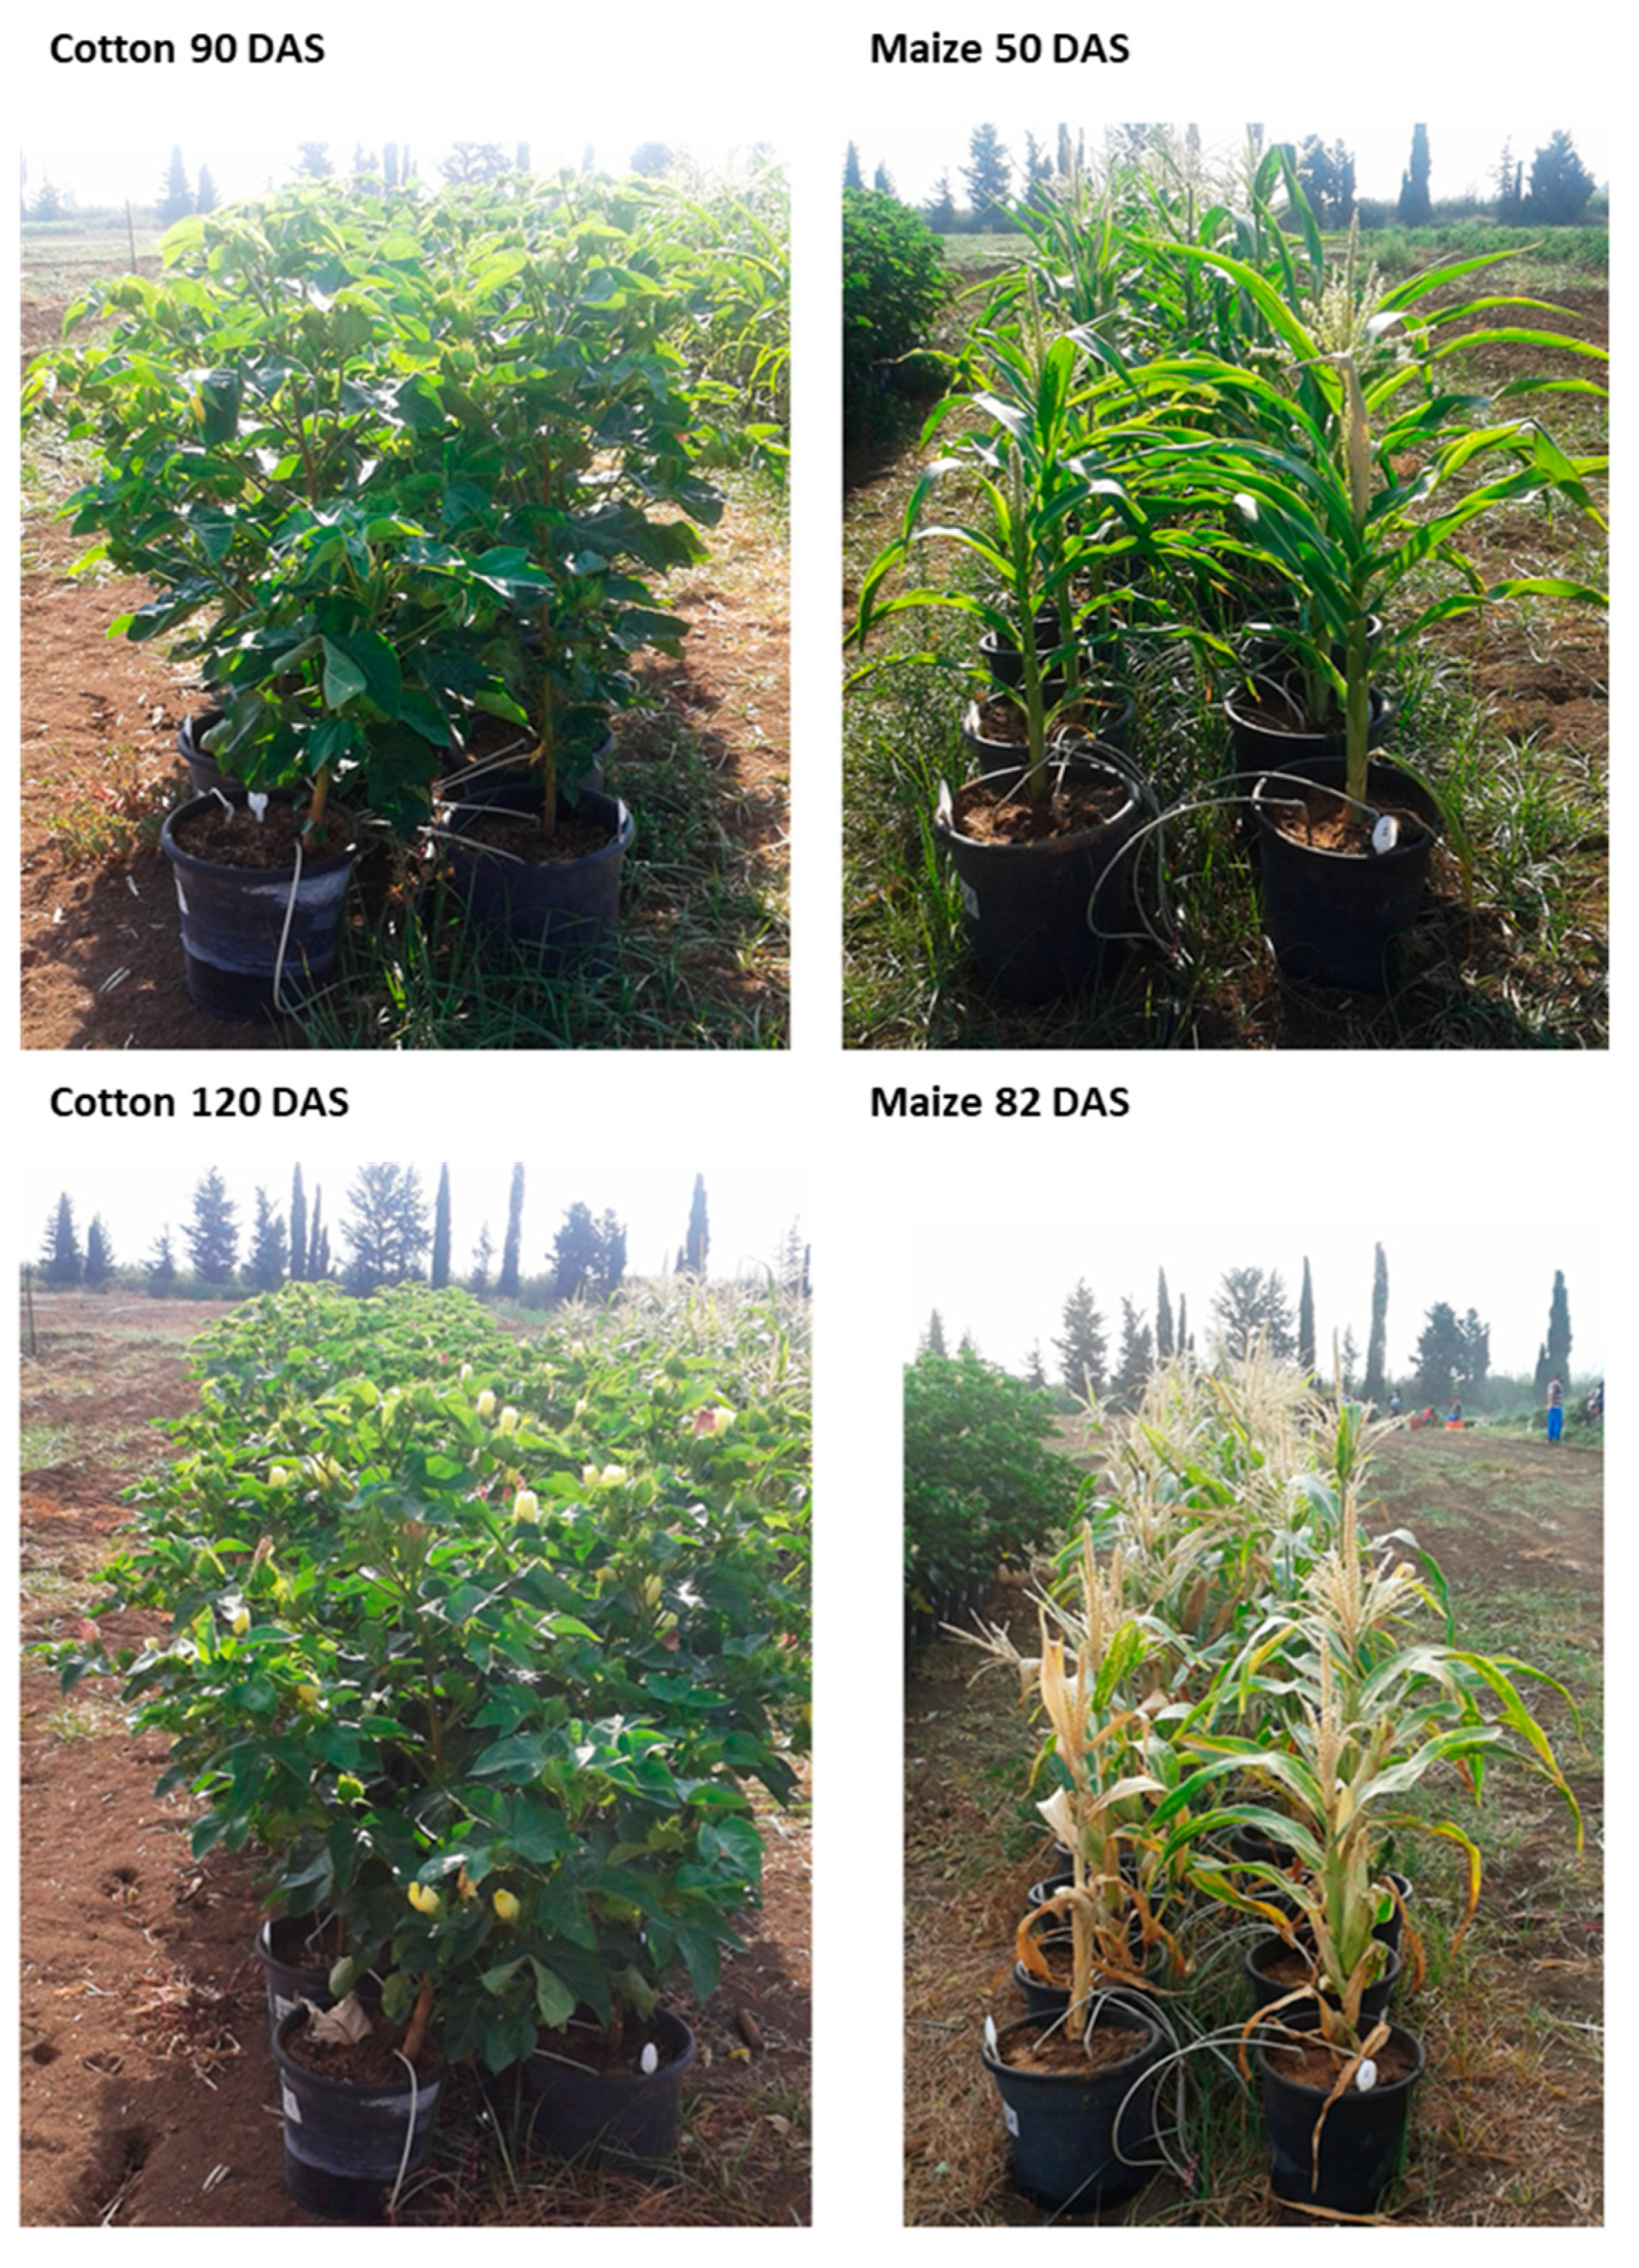
On the cotton harvest day (154 DAS), the double infection suppressing the influence on M. phaseolina DNA spreading (Figure 8) may be the reason for the recovery of plant height and root weight (Table 7). While the maize plants in this two-year study were developing severe late wilt symptoms at an advanced age (70 DAS onwards), the cotton plants showed no evident sign of wilting (Figure 6 and Figure 10), and only a delayed development was noticed in some of the treatments (Table 7).
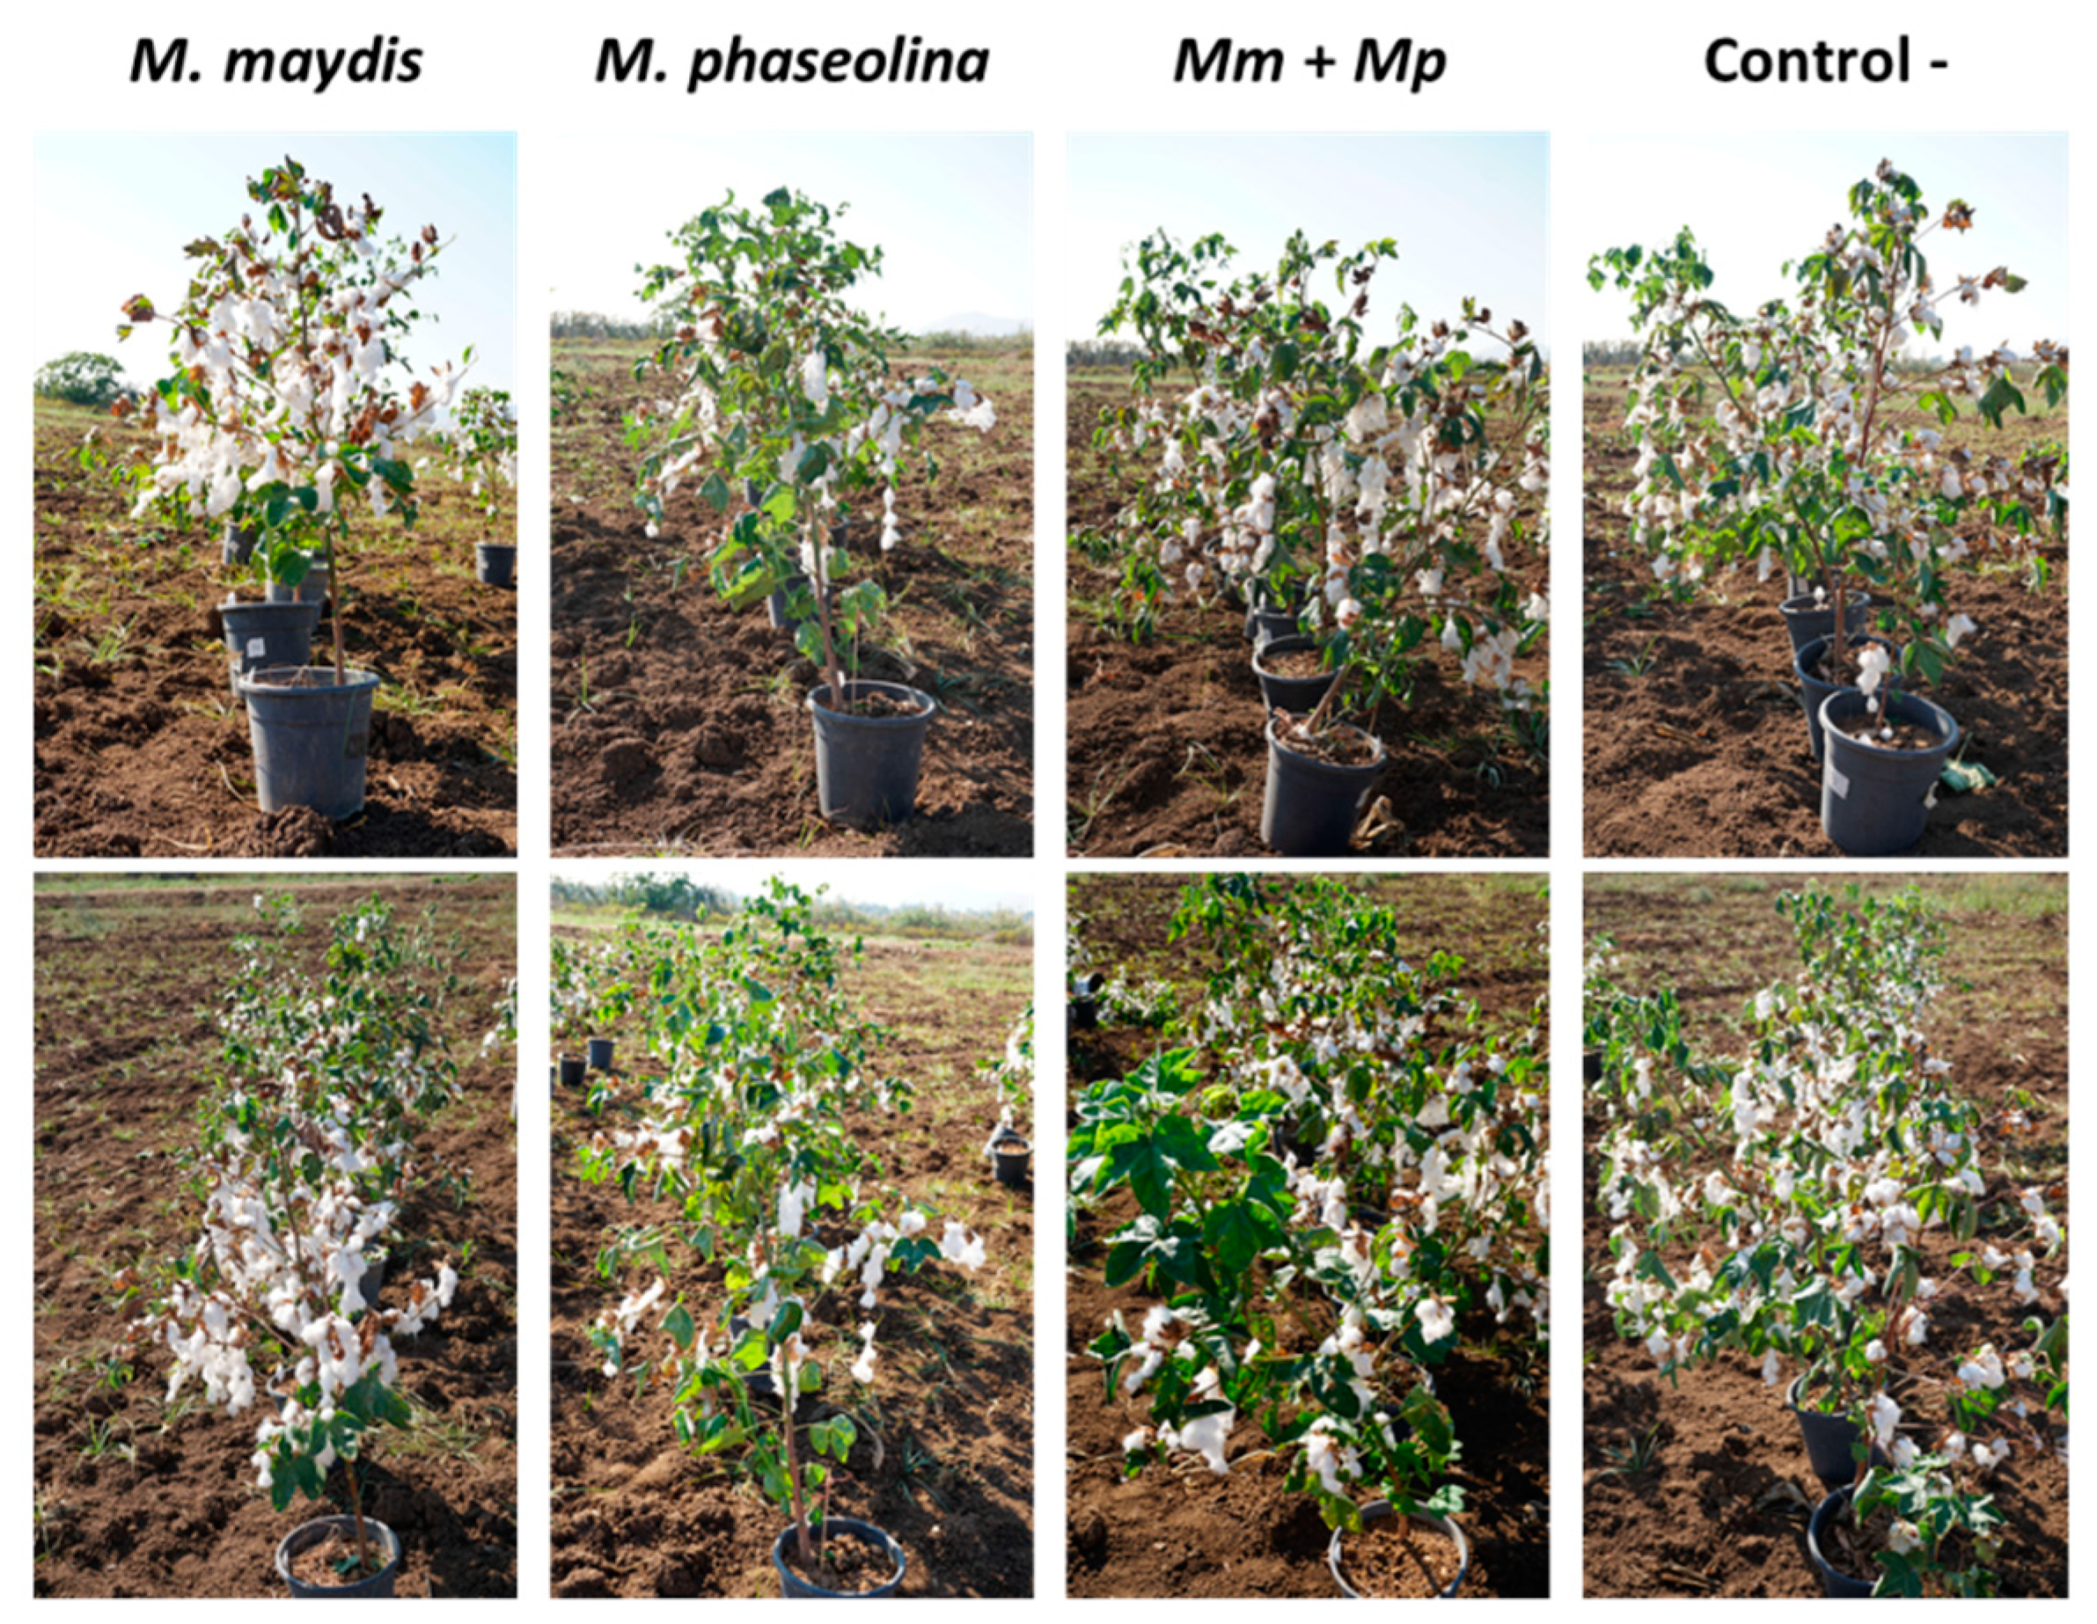
The 2019 repetition supported the 2018 findings, with enhancement in all growth parameters and yield productions that were measured (Figure 9D). These results were obtained at 162 DAS under a restricted water regime, while optimal water irrigation led to a lesser difference between the treatments. Supporting the accurate measurements, the 2019 experiment photo (Figure 10) on harvest day (162 DAS) reflects well the recovery in the plants’ development in the double infection treatment in comparison to the M. phaseolina single infection treatment.

4. Discussion

In Israel, M. maydis is considered a major threat to commercial maize fields, while M. phaseolina is a primary pathogen causing economic damage in cotton fields. Nevertheless, both pathogens can be found in both crops and may contribute to disease outbreak and spread [10,41]. The current study reveals a complex and competitive interaction between M. maydis and M. phaseolina species that had been previously unknown. The results of this study strongly suggest an antagonistic co-influence of these two vascular wilt pathogens, which results in restricting M. maydis spreading in maize plants and M. phaseolina spreading in cotton. This antagonism also has a positive influence on plant growth and yield.
Antagonistic interactions between phytoparasitic fungi have previously been reported in other host-pathogen species pairs [23], as detailed in the Introduction. In many of those studies, the molecular DNA tracing proved to be an essential research tool [25,27,42]. An example that is very similar to the current research is one of the most documented antagonisms among root pathogens, the suppression of Cochliobolus sativus by Fusarium (roseum) species [42]. In this recent study, a field trial was conducted that included the monitoring of spring wheat plant health and pathogen populations using qPCR. Across field locations, C. sativus and F. pseudograminearum isolates consistently and significantly reduced one another. However, our data suggest more complex interactions than a simple two-direction antagonism.
It is interesting to note that infecting maize plants solely with M. phaseolina caused a 20% reduction in the number of healthy plants compared to the negative control (from seven plants to five plants, Table 6). Thus, if both pathogens were acting without interfering with each other, their combined effect (50% in the M. maydis treatment and 20% in the M. phaseolina treatment) should have caused the total wilting of the plants. Instead, the dual inoculation led to some recovery of the plants. Indeed, M. maydis reduced M. phaseolina DNA in the roots of cotton plants by 4-fold, and M. phaseolina reduced M. maydis DNA in maize plants stems by 321-fold. Nevertheless, the mixed inoculation also resulted in higher levels of M. phaseolina DNA in maize and higher levels of M. maydis DNA in cotton. This suggests that the suppression effect of the fungal coexistence is of each pathogen in its primary host, while in its secondary host, the interactions with other phytopathogens can occasionally allow it to flourish. The nature of these interesting relationships and their causes will require further work to resolve. Another question triggered by the results presented here is what is the nature of M. maydis interactions with cotton plants?
It was previously reported that, in cotton, infecting the soil with M. maydis caused an increased growth of lateral roots and the appearance of local dark red lesions and shallow cracks on young cotton roots (up to 45 DAS) [12]. Later, as the plants matured, these lesions disappeared, as well as the fungus. Furthermore, M. maydis was not recovered from these symptomatic cotton plants [12]. It was recently reported that M. maydis infection also affected the root biomass and phenological development of young cotton plants (37 DAS) in a growth chamber [10]. The absence of symptoms in mature cotton plants reported in the above-cited work evokes a new inquisitive question: does this pathogen have a hidden lifestyle as an endophyte in cotton?
According to the data presented here, this may well be the case. Tracking the effect of M. maydis inoculation on cotton plants throughout the whole season in this two-year study supplies a large and consistent dataset. The data presented show that M. maydis inoculation at a regular irrigation regime did not affect the cotton growth parameters measured or the yield. On the contrary, in the 2018 experiment, in most measures, this inoculation resulted in higher growth and yield values at the end of the season. In the 2019 experiment, under drought stress, M. maydis infection led to a decreased weight and height of the above-ground parts of the cotton plants (without any measurable effect on yield production). This result may suggest that some opportunistic behaviors of this pathogen could exist. This assumption should be tested and established in future studies.
Formerly, results from random amplified polymorphic DNA (RAPD) analysis showed that M. phaseolina isolates from maize, cotton, and other crop hosts were differentiated from each other based on the host from which they initially isolated [41,43]. Moreover, isolates within each host that have different sensitivities to chlorate (a powerful oxidizer) also distinctly separated [41,43]. The researchers’ studies of a field with a long history of constant crop rotation led them to suggest that host specialization developed in this fungus. However, host specialization in M. phaseolina appears to occur with maize, but not with sorghum, cotton, or soybean, as indicated by the results of cross-inoculation experiments [41]. The colonization of maize roots was significantly higher with maize isolates than with isolates from other hosts. Since M. maydis distribution is limited to about only eight countries and is considered to be an exotic pathogen in most of the world, the above-mentioned knowledge about its host specialization and chlorate sensitivity is absent. It was only recently reported that the M. maydis host range is wider than we had thought [10].
It would be very interesting and economically significant to study the differentiation between M. maydis populations originating from different host species. Such studies, which were already carried out in maize in Egypt, had shown that isolates of M. maydis differ in pathogenicity, morphology, and route of infection [44]. Most importantly, it was reported in Egypt and Spain that this pathogen could undergo pathogenic changes that can result in highly virulent strains [34,45]. The Egyptian isolates of M. maydis were classified into four clonal lineages, which revealed not only diversity in virulence and colonization ability on maize but also fascinating competitiveness relationships [34]. The most virulent lineage, when tested alone, was the least competitive on susceptible maize accessions when incorporated into the soil as a component of the mixed inocula of all four lineages. In contrast, one of the less virulent lineages dominated (70% of infections) and appeared to be the most competitive.
Thus, it was suggested [34] that the most virulent strain may have an advantage in this interspecies competition when the field is seeded with resistance maize cultivar. However, in fields in which susceptible maize hybrids are cultivated, the other less virulent M. maydis strains may become more prevalent, and the most virulent lineage may be relatively rare. It should be taken into consideration that environmental aspects (biological and physical) are involved. M. maydis strains may differentiate due to their ability to grow either in the soil or in the host plant and due to their sensitivity to other soil microbes or their metabolic products.
The reciprocal suppression that was documented between M. maydis and M. phaseolina species in this study raises the importance of inspecting the effectiveness of preventing treatments while considering the pathogen specialization and the circumstances under which several pathogens are involved. To emphasize this, in spring 2018, a commercial field (Neot Mordechai field, Hula Valley, Upper Galilee, northern Israel) was planted with the sensitive maize cultivar Prelude cv. This field had a long history of late wilt incidences [5] and was therefore protected by a recently developed and highly effective chemical method [6]. Despite the use of the potent commercial mixture of Azoxystrobin and Difenoconazole (Syngenta, Basel, Switzerland), at the end of the season, only meager yields were achieved. The yield reduction was most probably the consequence of another fungal disease caused by F. verticillioides and F. oxysporum, which led to dehydration and yield loss (Ofir Degani et al., unpublished results). These Fusarium species are indeed universal and important vascular wilt disease-causing fungal pathogens [46]. To support this conclusion, in other plants in that field that were not affected by the Fusarium spp. disease, the chemical treatment almost wholly abolished any sign of late wilt disease.
It has now become evident that optimal water supply can reduce late wilt disease in maize. Indeed, our past experience [6,30,33] and a review of the literature support the conclusion that high water potential is one of the most important agrotechnical aims for restricting late wilt disease progression [17,47,48,49]. The results presented in the current study are in line with this conclusion, with nearly 10 times higher M. maydis DNA in drought-stressed maize sprouts (37 DAS, Figure 2). Interestingly, drought pressure also caused about three times higher M. phaseolina DNA in young maize plants, but both pathogens did not flourish under a restricted water regime in cotton (Figure 6) compared to regular irrigation conditions. A possible explanation is that the applied restricted water regime did not produce drought pressure as expected. Indeed the cotton plants in the decrease water irrigation pots were healthy and had an apparent healthy development.
Author Contributions

Conceptualization, O.D., S.D., and R.C.; data curation, O.D., S.D., D.A., and R.C.; formal analysis, O.D. and S.D.; funding acquisition, O.D. and R.C.; investigation, O.D., S.D., and D.A.; methodology, O.D., S.D., D.A., and R.C.; project administration, O.D. and S.D.; resources, O.D.; supervision, O.D.; validation, O.D., S.D., D.A., and R.C.; visualization, O.D. and S.D.; writing—original draft preparation, O.D.; writing—review and editing, O.D., S.D., and R.C., please turn to the CRediT taxonomy for the term explanation. All authors have read and agreed to the published version of the manuscript.

Funding

This research was funded by a two-year research grant (2018-2019) from the Israel Cotton Board Ltd. The APC was funded by Migal – Galilee Research Institute, Israel.

Acknowledgments

We would like to thank Onn Rabinovitz (Migal – Galilee Research Institute, Israel) for his helpful advice and support. We also would like to thank Danielle Regev, Ben Kalman (Migal –Galilee Research Institute, Israel), and Yael Kanter (Tel-Hai College, Israel) for their technical assistance.

Conflicts of Interest

The authors declare no conflict of interest. The funders had no role in the design of the study, in the collection, analyses, or interpretation of data, in the writing of the manuscript, or in the decision to publish the results.

References

  1. Samra, A.S.; Sabet, K.A.; Hingorani, M.K. Late wilt disease of maize caused by Cephalosporium maydis. Phytopathology 1963, 53, 402–406. [Google Scholar]
  2. Gams, W. Phialophora and some similar morphologically little-differentiated anamorphs of divergent Ascomycetes. Studies Mycol. 2000, 45, 187–200. [Google Scholar]
  3. Fayzalla, E.; Sadik, E.; Elwakil, M.; Gomah, A. Soil solarization for controlling Cephalosporium maydis, the cause of late wilt disease of maize in Egypt. Egypt J. Phytopathology 1994, 22, 171–178. [Google Scholar]
  4. Degani, O.; Cernica, G. Diagnosis and control of Harpophora maydis, the cause of late wilt in maize. Adv. Microbiol. 2014, 4, 94–105. [Google Scholar] [CrossRef] [Green Version]
  5. Drori, R.; Sharon, A.; Goldberg, D.; Rabinovitz, O.; Levy, M.; Degani, O. Molecular diagnosis for Harpophora maydis, the cause of maize late wilt in israel. Phytopathol. Mediterr. 2013, 52, 16–29. [Google Scholar]
  6. Degani, O.; Dor, S.; Movshowitz, D.; Fraidman, E.; Rabinowitz, O.; Graph, S. Effective chemical protection against the maize late wilt causal agent, Harpophora maydis, in the field. PLoS ONE 2018, 13, e0208353. [Google Scholar] [CrossRef]
  7. Galal, O.A.; Aboulila, A.A.; Motawei, A.; Galal, A. Biochemical and molecular diversity and their relationship to late wilt disease resistance in yellow maize inbred lines. Cytology 2019, 2, 47. [Google Scholar]
  8. Degani, O.; Drori, R.; Goldblat, Y. Plant growth hormones suppress the development of Harpophora maydis, the cause of late wilt in maize. Physiol. Mol. Biol. Plants 2015, 21, 137–149. [Google Scholar] [CrossRef] [Green Version]
  9. Sahab, A.F.; Osman, A.R.; Soleman, N.K.; Mikhail, M.S. Studies on root-rot of lupin in Egypt and its control. Egypt. J. Phytopathol. 1985, 17, 23–35. [Google Scholar]
  10. Dor, S.; Degani, O. Uncovering the host range for maize pathogen Magnaporthiopsis maydis. Plants 2019, 8, 259. [Google Scholar] [CrossRef] [Green Version]
  11. Khokhar, M.K.; Hooda, K.S.; Sharma, S.S.; Singh, V. Post flowering stalk rot complex of maize-present status and future prospects. Maydica 2014, 59, 226–242. [Google Scholar]
  12. Sabet, K.; Samra, A.; Mansour, I. Interaction between Fusarium oxysporum f. Vasinfectum and Cephalosporium maydis on cotton and maize. Ann. Appl. Biol. 1966, 58, 93–101. [Google Scholar] [CrossRef]
  13. Manici, L.; Caputo, F.; Cerato, C. Temperature responses of isolates of Macrophomina phaseolina from different climatic regions of sunflower production in Italy. Plant Dis. 1995, 79, 834–838. [Google Scholar] [CrossRef]
  14. Kaur, S.; Dhillon, G.S.; Brar, S.K.; Vallad, G.E.; Chand, R.; Chauhan, V.B. Emerging phytopathogen Macrophomina phaseolina: Biology, economic importance and current diagnostic trends. Crit. Rev. Microbiol. 2012, 38, 136–151. [Google Scholar] [CrossRef]
  15. Babu, B.K.; Saikia, R.; Arora, D.K. Molecular characterization and diagnosis of Macrophomina phaseolina: A charcoal rot fungus. In Molecular Identification of Fungi; Springer: Berlin/Heidelberg, Germany, 2010; pp. 179–193. [Google Scholar]
  16. Tej, R.; Rodríguez-Mallol, C.; Rodríguez-Arcos, R.; Karray-Bouraoui, N.; Molinero-Ruiz, L. Inhibitory effect of Lycium europaeum extracts on phytopathogenic soil-borne fungi and the reduction of late wilt in maize. Eur. J. Plant Pathol. 2018, 152, 249–265. [Google Scholar] [CrossRef] [Green Version]
  17. Abd El-Rahim, M.F.; Fahmy, G.M.; Fahmy, Z.M. Alterations in transpiration and stem vascular tissues of two maize cultivars under conditions of water stress and late wilt disease. Plant Pathol. 1998, 47, 216–223. [Google Scholar] [CrossRef]
  18. Goudarzi, S.; Banihashemi, Z.; Maftoun, M. Effect of salt and water stress on root infection by Macrophomina phaseolina and ion composition in shoot in sorghum. Iran Journal Plant Path 2011, 47, 69–83. [Google Scholar]
  19. Cohen, R.; Elkabetz, M.; Edelstein, M. Variation in the responses of melon and watermelon to Macrophomina phaseolina. Crop Prot. 2016, 85, 46–51. [Google Scholar] [CrossRef]
  20. Degani, O.; Movshowitz, D.; Dor, S.; Meerson, A.; Goldblat, Y.; Rabinovitz, O. Evaluating azoxystrobin seed coating against maize late wilt disease using a sensitive qPCR-based method. Plant Dis. 2019, 103, 238–248. [Google Scholar] [CrossRef] [Green Version]
  21. El-Gremi, S.M.A.; Belal, E.B.A.; Ghazy, N.A. Cephalosporium maydis as affected by maize root exudates and role of the fungal metabolites in pathogenesis. J. Agric. Sci. Mansoura Univ. 2007, 32, 7605–7615. [Google Scholar]
  22. Bruehl, G.W. Soilborne Plant Pathogens; Macmillan Publishing Company: New York, NY, USA, 1987. [Google Scholar]
  23. Stephens, A.E.; Srivastava, D.S.; Myers, J. Strength in numbers? Effects of multiple natural enemy species on plant performance. Proc. Biol. Sci. 2013, 280, 20122756. [Google Scholar] [CrossRef] [Green Version]
  24. Boddy, L. Interspecific combative interactions between wood-decaying basidiomycetes. FEMS Microbiol Ecol. 2000, 31, 185–194. [Google Scholar] [CrossRef]
  25. El Hadrami, A.; Wally, O.; Adam, L.; Daayf, F. PCR-based determination of colonization patterns during potato tuber infection by single and multiple pathogens. Eur. J. Plant Pathol. 2007, 117, 201–218. [Google Scholar] [CrossRef]
  26. Le May, C.; Potage, G.; Andrivon, D.; Tivoli, B.; Outreman, Y. Plant disease complex: Antagonism and synergism between pathogens of the Ascochyta blight complex on pea. J. Phytopathol. 2009, 157, 715–721. [Google Scholar] [CrossRef]
  27. Moya-Elizondo, E.A.; Jacobsen, B.J.; Hogg, A.C.; Dyer, A.T. Population dynamics between Fusarium pseudograminearum and Bipolaris sorokiniana in wheat stems using real-time qPCR. Plant Dis. 2011, 95, 1089–1098. [Google Scholar] [CrossRef] [Green Version]
  28. Nolan, S.; Cooke, B.; Monahan, F. Studies on the interaction between Septoria tritici and Stagonospora nodorum in wheat. Eur. J. Plant Pathol. 1999, 105, 917–925. [Google Scholar] [CrossRef]
  29. Round, P.; Wheeler, B.J. Interactions of Puccinia hordei and Erysiphe graminis on seedling barley. Applied Biol. 1978, 89, 21–35. [Google Scholar] [CrossRef]
  30. Degani, O.; Goldblat, Y. Ambient stresses regulate the development of the maize late wilt causing agent, Harpophora maydis. Agric. Sci. 2014, 5, 571–582. [Google Scholar]
  31. Babu, B.K.; Saxena, A.K.; Srivastava, A.K.; Arora, D.K. Identification and detection of Macrophomina phaseolina by using species-specific oligonucleotide primers and probe. J. Mycol. 2007, 99, 797–803. [Google Scholar] [CrossRef]
  32. Cohen, R. Macrophomina phaseolina, a multi-host soil fungus: On similarities and differences in the interactions with cucurbitaceae and gossypium hirsutum (cotton) plants. In Proceedings of the 5th conference of the Israel Society of Crop and Vegetable Sciences, Beit-Dagan, Israel, 5 –6 March 2018; Robert, H. Smith Faculty of Agriculture, Food and Environment, Rehovot, the Hebrew University of Jerusalem, Ministry of Agriculture and Rural Development: Beit-Dagan, Israel. [Google Scholar]
  33. Degani, O.; Weinberg, T.; Graph, S. Chemical control of maize late wilt in the field. Phytoparasitica 2014, 42, 559–570. [Google Scholar] [CrossRef]
  34. Zeller, K.A.; Abou-Serie, M.I.; El-Assuity, E.M.; Fahmy, Z.M.; Bekheet, F.M.; Leslie, J.F. Relative competitiveness and virulence of four clonal lineages of Cephalosporium maydis from Egypt toward greenhouse-grown maize. Plant Dis. 2002, 86, 373–378. [Google Scholar] [CrossRef] [Green Version]
  35. Abendroth, L.J.; Elmore, R.W.; Boyer, M.J.; Marlay, S.K. Corn Growth and Development; Iowa State University Extension: Ames, IA, USA, 2011. [Google Scholar]
  36. Degani, O.; Dor, S.; Movshovitz, D.; Rabinovitz, O. Methods for studying Magnaporthiopsis maydis, the maize late wilt causal agent. Agronomy 2019, 9, 181. [Google Scholar] [CrossRef] [Green Version]
  37. Weller, S.; Elphinstone, J.; Smith, N.; Boonham, N.; Stead, D. Detection of ralstonia solanacearumstrains with a quantitative, multiplex, real-time, fluorogenic PCR (TaqMan) assay. Appl. Environ. Microbiol. 2000, 66, 2853–2858. [Google Scholar] [CrossRef] [Green Version]
  38. Yuan, J.S.; Reed, A.; Chen, F.; Stewart, N.C. Statistical analysis of real-time PCR data. BMC Bioinform. 2006, 7, 1–12. [Google Scholar] [CrossRef] [Green Version]
  39. Larena, I.; Salazar, O.; González, V.; Julián, M.a.C.; Rubio, V. Design of a primer for ribosomal DNA internal transcribed spacer with enhanced specificity for Ascomycetes. J. Biotechnol. 1999, 75, 187–194. [Google Scholar] [CrossRef]
  40. Li, W.; Hartung, J.S.; Levy, L. Quantitative real-time PCR for detection and identification of Candidatus liberibacter species associated with Citrus huanglongbing. J. Microbiol. Methods 2006, 66, 104–115. [Google Scholar] [CrossRef]
  41. Su, G.; Suh, S.-O.; Schneider, R.; Russin, J.J. Host specialization in the charcoal rot fungus, Macrophomina phaseolina. Phytopathology 2001, 91, 120–126. [Google Scholar] [CrossRef] [Green Version]
  42. Troth, E.E.G.; Johnston, J.A.; Dyer, A.T. Competition between Fusarium pseudograminearum and Cochliobolus sativus observed in field and greenhouse studies. Phytopathology 2017, 108, 215–222. [Google Scholar] [CrossRef] [Green Version]
  43. Pearson, C.; Leslie, J.; Schwenk, F.J. Variable chlorate resistance in Macrophomina phaseolina from corn, soybean, and soil. Biology 1986, 76, 646–649. [Google Scholar]
  44. Warren, H.L. Potential disease problems: Late wilt of maize. Phytopathology 1983, 73, 782. [Google Scholar]
  45. Ortiz-Bustos, C.M.; Testi, L.; García-Carneros, A.B.; Molinero-Ruiz, L. Geographic distribution and aggressiveness of Harpophora maydis in the Iberian peninsula, and thermal detection of maize late wilt. Eur. J. Plant Pathol. 2016, 144, 383–397. [Google Scholar] [CrossRef]
  46. Loganathan, M.; Rai, A.; Ramesh, R.; Sharma, B.; Rai, R.; Rai, M. Vascular wilt diseases-a menace in vegetable crops. Veg. Sci. 2009, 36, 1–13. [Google Scholar]
  47. Ortiz-Bustos, C.; López-Bernal, A.; Testi, L.; MolineroRuiz, L. Environmental and irrigation conditions can mask the effect of Magnaporthiopsis maydis on growth and productivity of maize. Plant Pathol. 2019, 68, 1555–1564. [Google Scholar] [CrossRef]
  48. Samra, A.S.; Sabet, K.A.; Abdel-Rahim, M.F. Effect of Soil Conditions and Cultural Practices on Infection with Stalk Rots; U.A.R. Ministry of Agric. Government Printing Offices: Cairo, Egypt, 1966; pp. 117–164.
  49. Singh, S.D.; Siradhana, B.S. Date of sowing in relation to late wilt disease of maize. Indian Phytopathol. 1988, 41, 489–491. [Google Scholar]
Figure 1. Plate confrontation assays. The plate assay to identify interactions between Magnaporthiopsis maydis and Macrophomina phaseolina in a rich potato dextrose agar (PDA) culture media. (A) Left panel—M. maydis was seeded on both sides of the Petri dish. Center panel—M. Phaseolina was seeded at both poles of the dish. Right panel—the two fungi were seeded opposite each other, M. maydis on the left, and M. phaseolina on the right. (B) Magnification of the confrontation line between maydis (upper white hyphae) and M. phaseolina (lower dark hyphae). The two colonies formed a clear line between them. Images were taken after six days of growth at 28 °C ± 1 in the dark. Scale bar represents 6 mm.
Microorganisms 08 00249 g001
Figure 2. qPCR diagnosis of M. maydis and M. phaseolina in maize sprouts. A full-growth season pot experiment under field conditions was conducted in the spring and summer of 2019 with a late-wilt-susceptible maize genotype prelude. The quantitative real-time polymerase chain reaction (qPCR) was used to identify the ability of the pathogens, alone or in mixed inoculation, to infect and colonize maize root tissues 37 days after sowing (DAS). Half of the treatments received reduced irrigation (water stress, upper panel, see Table 1). The control is soil taken from a nearby field with minor levels of M. maydis or M. phaseolina infestation. The y-axis values are M. maydis relative DNA (Mm) or M. phaseolina relative DNA (Mpk) abundance normalized to the cytochrome c oxidase (Cox) DNA. Vertical upper bars represent the standard error of the mean of 10 replications (pots, each containing one plant). When existing, significance from the control is indicated as * = p < 0.05.
Microorganisms 08 00249 g002
Figure 3. qPCR diagnosis of M. maydis and M. phaseolina in maize at the end of the season. The experiment is described in Figure 2. M. maydis relative DNA (Mm) or M. phaseolina relative DNA (Mpk) abundance normalized to the cytochrome c oxidase (Cox) DNA was evaluated at 82 DAS (25 days after fertilization, DAF) in roots in the 2018 experiment (upper panels) and 79 DAS (25 DAF) in shoots in the 2019 experiment (lower panels). Vertical upper bars represent the standard error of the mean of 10 replications (pots, each containing one plant).
Microorganisms 08 00249 g003
Figure 4. Symptoms evaluation and yield assessment in maize. Plant developmental values and yield assessment was made for the plants in the 2019 experiment described in Figure 2. Sprout emergence, 9 DAS (A), phenological stage, 23 DAS (B), plant height, 58 DAS (C), and growth and yield assessment 79 DAS and 22 DAF (D) were determined after the inoculation of the plants with M. maydis and M. phaseolina, alone or in mixed inoculation. Vertical upper bars represent the standard error of the mean of 10 replications (pots, each containing one plant from 23 DAS onwards). When existing, significance from the control (untreated) is indicated as * = p < 0.05.
Microorganisms 08 00249 g004
Figure 5. Maize wilt assessment carried out 79 days after sowing. Wilting percentages of the 2019 experiment described in Figure 2 were determined 21 DAF. Plants were classified as “healthy” when no apparent signs of dehydration could be identified and as “symptoms” when the upper leaves’ color started to alter to light-silver and then to light-brown, rolling inward from the edges of the leaf. When the whole plant was presenting severe dehydration with light-brown color spreading to all of its parts and its cobs tilted down, it was classified as “diseased.” Percentages are the mean of 10 replications.
Microorganisms 08 00249 g005
Figure 6. Photograph of the maize and cotton plants in the 2018 experiment. The experiment at the vegetative growth stage, 50 and 90 DAS in maize and cotton, respectively (upper panels), and at the end of the season, 82 and 120 DAF in maize and cotton, respectively (lower panels).
Microorganisms 08 00249 g006
Figure 7. qPCR diagnosis of M. maydis and M. phaseolina in cotton sprouts. The full-growth season pot experiment under field conditions was conducted in the spring and summer of 2019. The charcoal-rot-susceptible cotton genotype Pima cotton, Goliath cv. was chosen for this experiment. The qPCR was used to identify the ability of the pathogens, alone or in mixed inoculation, to infect and colonize the cotton root tissues 37 days after sowing (DAS). The control is a soil taken from a nearby field with minor levels of M. maydis or M. phaseolina infestation. The y-axis values are M. maydis relative DNA (Mm) or M. phaseolina relative DNA (Mpk) abundance, normalized to the cytochrome c oxidase (Cox) DNA. Vertical upper bars represent the standard error of the mean of 10 replications (pots, each containing one plant).
Microorganisms 08 00249 g007
Figure 8. qPCR diagnosis of M. maydis and M. phaseolina in cotton at the end of the season (154 DAS). The experiment was conducted in 2018. The control is a soil taken from a nearby field with minor levels of M. maydis or M. phaseolina infestation. M. maydis relative DNA (Mm) or M. phaseolina relative DNA (Mpk) abundance was normalized to the cytochrome c oxidase (Cox) DNA. Vertical upper bars represent the standard error of the mean of 10 replications (pots, each containing one plant).
Microorganisms 08 00249 g008
Figure 9. Symptoms evaluation and yield assessment in cotton. Plant developmental values and yield assessment was made for plants in the 2019 experiment described in Figure 7. Sprout emergence (A) and height, (B) 9 DAS, phenological development, 41 DAS (C), and growth and yield assessment, 162 DAS (D), were determined after the inoculation of the plants with M. maydis and M. phaseolina, alone or in mixed inoculation. Vertical upper bars represent the standard error of the mean of 10 replications (pots, each containing one plant 41 DAS onwards). When existing, significance from the control (untreated) is indicated as * = p < 0.05.
Microorganisms 08 00249 g009
Figure 10. Photograph of the cotton plants under a restricted water regime, in the 2019 experiment (described in Figure 7). The field was photographed 162 DAS. A decreased development of the plants in the M. phaseolina inoculation pots can be seen.
Microorganisms 08 00249 g010
Table 1. Water irrigation regime during the full-growth season pot experiments (2018 and 2019).
YearIrrigation RegimeMaizeCotton
Age
(DAS) 2
Irrigation
(L per pot/2 day)
Age
(DAS)
Irrigation
(L per pot/2 day)
2018Normal 10–6 35.40–28 35
7–822.729–1542.5
2019Normal 10–4840–1624.8
49–796
Drought pressure0–4820–1624
49–794
1 A healthy irrigation regime was conducted according to the Israel Ministry of Agriculture Consultation Service (SAHAM) growth protocol. The total amount of water for each season was estimated to be 600 mm using the Penman method. 2 DAS—days after sowing. 3 Until the plants’ first emergence above the ground surface, the pots were irrigated to a near saturation capacity in order to allow for proper germination and initial development.
Table 2. Meteorological data for the 2018 and 2019 experiments.1.
20182019
Environmental Condition Maize
24/05-14/08
Cotton
02/05-03/10
Maize
21/05-08/08
Cotton
21/05-30/10
Temperature (°C)27.1 ± 5.226.8 ± 5.427.3 ± 5.726.5 ± 5.7
Humidity (%)60.4 ± 18.059.9 ± 19.157.2 ± 19.660.5 ± 19.7
Soil temp. top 5 cm (°C)28.9 ± 7.431.7 ± 8.933.8 ± 12.132.1 ± 19.7
Radiation (W/m2)328.9302.4355.6289.5
Precipitation (mm)9.931.40.553.8
Evaporation (mm)724.21257.04669.61201.6
1 Data (average ± standard deviation) according to the Israel Northern Research and Development meteorological station data.
Table 3. Primers for Magnaporthiopsis maydis and Macrophomina phaseolina detection.
PairsPrimerSequenceUsesAmplificationReferences
Pair 1A200a-for
A200a-rev
5′-CCGACGCCTAAAATACAGGA-3′
5′-GGGCTTTTTAGGGCCTTTTT-3′
Target gene200 bp M. maydis species-specific fragment[5]
Pair 2MpKFI MpKRI5′-CCGCCAGAGGACTATCAAAC-3′
5′- CGTCCGAAGCGAGGTGTATT-3′
Target gene300–400 bp M. phaseolina species-specific fragment[31]
Pair 3ITS1
ITS4
5′- TCCGTAGGTGAACCTGCGG -3′
5′- TCCTCCGCTTATTGATATGC -3′
Target geneTarget region for the identification of fungi species[39]
Pair 4COX-F
COX-R
5′-GTATGCCACGTCGCATTCCAGA-3′
5′-CAACTACGGATATATAAGRRCCRR AACTG-3′
ControlCytochrome c oxidase (COX) gene product [37,40]
Table 4. Maize average growth indices at 34 DAS 1 as a result of infection with M. maydis and M. phaseolina (the 2018 experiment).
Growth ParameterM. maydisM. phaseolinaM. maydis +M. phaseolinaControl 2
Emergence (%)64 ± 9.372 ± 5.370 ± 6.876 ± 5.8
Height (cm)22.0 ± 1.6521.4 ± 1.3421.5 ± 1.4119.9 ± 1.20
Root weight (g)3.7 ± 0.803.5 ± 0.534.0 ± 0.363.0 ± 0.52
Shoot weight (g)26.4 ± 4.624.3 ± 4.224.5 ± 3.718.4 ± 2.6
1 DAS—days after sowing. Values represent an average of 10 replications ± Standard error. No statistically significant (p < 0.05) difference was identified between the treatments and the control. 2 Control—soil from a nearby field with minor levels of M. maydis or M. phaseolina infestation.
Table 5. Maize average growth indices at 82 DAS (25 DAF 1) as a result of infection with M. maydis and M. phaseolina (the 2018 experiment).
Growth ParameterM. maydisM. phaseolinaM. maydis +M. phaseolinaControl 3
Height (cm)85.4 ± 4.994.9 ± 5.0111.7 ± 5.4 2109.2 ± 3.8
Root weight (g)40.5 ± 8.382.9 ± 32.159.0 ± 9.1 254.9 ± 10.6
Shoot weight (g)174.5 ± 22.6214.2 ± 34.9245.1 ± 13.0 2201.5 ± 24.6
Cob weight (g)91.4 ± 16.0112.7 ± 16.0170.7 ± 22.9 2125.1 ± 16.6
1 DAF—days after fertilization. 2 Significant difference (P < 0.05) from the sole M. maydis infection treatment and the control. 3 Control—soil from a nearby field with minor levels of M. maydis or M. phaseolina infestation.
Table 6. Maize dehydration assessment at 82 DAS following infection with M. maydis and M. phaseolina (the 2018 experiment).
TreatmentHealthyMild SymptomsSymptomsWilted
M. maydis20%30%10%40%
M. phaseolina50%30%10%10%
M. maydis + M. phaseolina30%10%20%40%
Control 170%30%0%0%
1 Control—soil from a nearby field with minor levels of M. maydis or M. phaseolina infestation.
Table 7. Cotton average growth indices at 57 DAS (at flowering) and at 154 DAS (at harvest) as a result of infection with M. maydis and M. phaseolina (the 2018 experiment).
Days after SowingGrowth ParameterM. maydisM. phaseolinaM. maydis + M. phaseolinaControl
57Height (cm)46.7 ± 3.053.6 ± 1.248.3 ± 2.150.0 ± 1.6
Root weight (kg)12.0 ± 1.311.5 ± 1.28.5 ± 0.910.8 ± 1.1
Shoot weight (kg)74.1 ± 11.272.1 ± 7.554.0 ± 7.462.8 ± 4.6
Number of leaves20.6 ± 2.721.6 ± 1.317.6 ± 1.118.7 ± 1.1
154Height (cm)116.4 ± 3.7105.3 ± 4.1117.2 ± 4.61108.9 ± 6.8
Root weight (kg)0.14 ± 0.020.10 ± 0.010.15 ± 0.0210.14 ± 0.02
Shoot weight (kg)0.50 ± 0.060.39 ± 0.070.62 ± 0.120.39 ± 0.09
Average crop weight (kg)0.25 ± 0.030.19 ± 0.030.23 ± 0.040.19 ± 0.03
Number of seeds15.1 ± 0.5915.4 ± 0.4214.7 ± 0.9913.7 ± 0.53
1 Significant difference (p < 0.05) from the sole M. phaseolina infection treatment.