Article

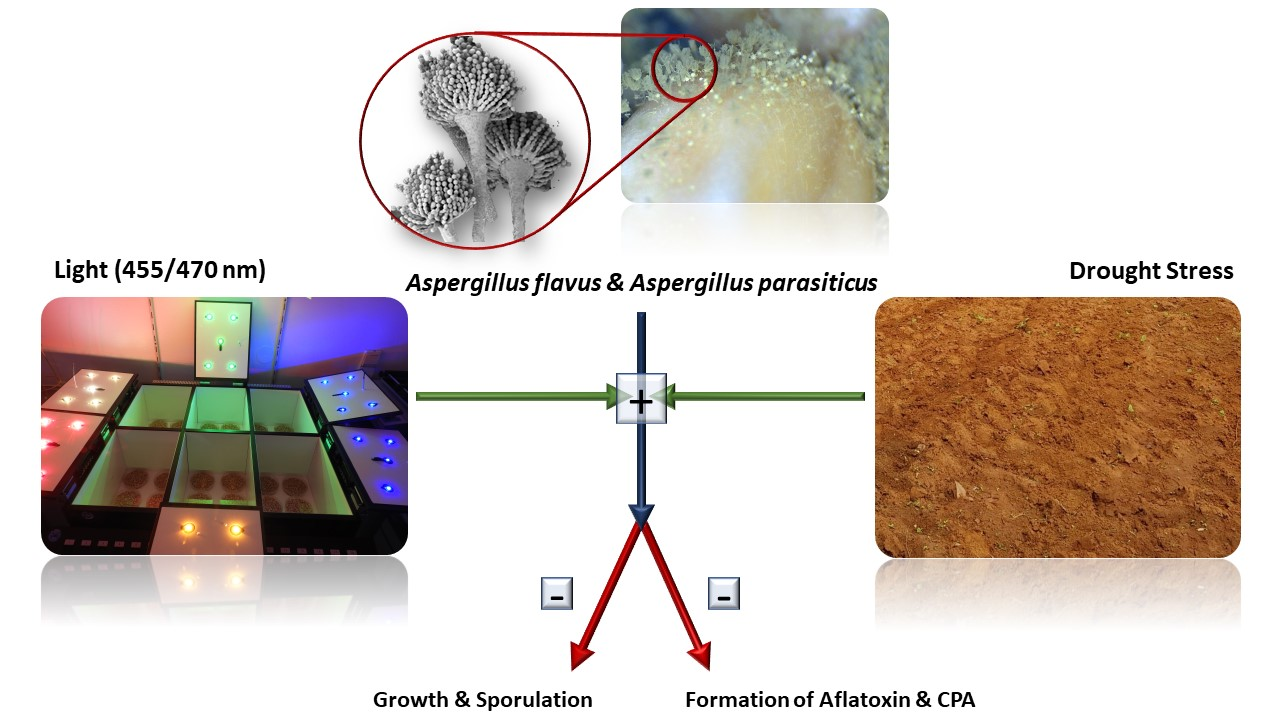
Influence of Light and Water Activity on Growth and Mycotoxin Formation of Selected Isolates of Aspergillus flavus and Aspergillus parasiticus

Max Rubner-Institut Karlsruhe Federal Research Institute for Nutrition and Food, Haid-und-Neu-Str. 09, 76131 Karlsruhe, Germany
*
Author to whom correspondence should be addressed.
Microorganisms 2020, 8(12), 2000; https://doi.org/10.3390/microorganisms8122000
Submission received: 6 November 2020 / Revised: 30 November 2020 / Accepted: 12 December 2020 / Published: 15 December 2020

Abstract

:
Aspergillus flavus and A. parasiticus are the main causes of aflatoxin contamination in various foods, particularly grains, as they can thrive in environments with lower water activity and higher temperatures. The growth of Aspergillus and the formation of the mycotoxins aflatoxin and cyclopiazonic acid are strongly influenced by environmental stimuli and can be reduced by modulating parameters such as water activity, pH, temperature and light during the storage. This study has two objectives—on the one hand, to assess how global warming and an increase in exposure to sunlight affect growth and mycotoxin formation, and on the other hand, how the findings from these experiments can be used to reduce fungal growth and mycotoxin formation in stored foods. Using growth substrates with two different water activities (aw 0.95, aw 0.98), together with a light incubation device consisting of different chambers equipped with diodes emitting visible light of five different wavelengths (455 nm, 470 nm, 530 nm, 590 nm, 627 nm) plus white light, we analyzed the growth and mycotoxin formation of selected Aspergillus flavus and A. parasiticus isolates. It was shown that light with a wavelength of 455/470 nm alone, but especially in combination with a lower water activity of aw 0.95, leads to a significant reduction in growth and mycotoxin formation, which was accompanied by reduced transcriptional activity of the responsible mycotoxin biosynthetic genes. Therefore, these results can be used to significantly reduce the growth and the mycotoxin formation of the analyzed fungi during storage and to estimate the trend of fungal infestation by Aspergillus flavus and A. parasiticus in water activity- and light exposure-equivalent climate change scenarios. Mycotoxin-producing aspergilli can be effective and sustainably inhibited using a combination of short-wave light and lowered water activity in the substrate. A higher annual mean temperature accompanying climate change may lead to an increased spread of aflatoxin-producing fungi in areas that were previously too cold for them. On the other hand, there will be regions in the world where contamination with aflatoxin-producing fungi will be reduced due to increased drought and sun exposure.

Graphical Abstract

1. Introduction

Mycotoxins, which are produced by different species of filamentous fungi, are common worldwide. Contaminated foods should be rejected for reasons of food safety, at the expense of the food supply of a steadily growing world population. The global food loss due to contamination with mycotoxins is estimated by the Food and Agriculture Organization (FAO) to be more than 25%, a value that apparently greatly underestimates the real situation [1]. In particular, the aflatoxins produced by some Aspergillus species should be emphasized here as health-relevant mycotoxins. Particular aflatoxin producers that cause problems in food are the species Aspergillus flavus, which mainly produces the B-aflatoxins B1 and B2, as well as A. parasiticus, which can also produce the G-aflatoxins G1 and G2 [2,3,4]. The former occurs mainly in cereals such as corn and wheat [5], the latter in cotton, Brazil nuts, peanuts and soil [6]. Both species are found particularly in regions with a warm climate such as Sub-Saharan Africa, Iran, Iraq, India and Southeast-Asia [7], but in more recent times they have also been found in Southern Europe due to global warming [8]. Aflatoxin B1 has been classified as carcinogenic by the FAO (IARC, 2012) [9,10,11]. After ingestion, aflatoxin is metabolized to the highly reactive aflatoxin B1 8,9-epoxide, which forms DNA adducts. In addition, in mammals aflatoxin B1 is hydrolyzed to another toxic compound called aflatoxin M1, which is excreted with milk, in a process called carry-over [12]. Both the uptake of the parent mycotoxin and exposure to the excretion product M1 via milk can trigger reduced growth rates in children, liver carcinoma [13] and the disturbance of the immune system [14,15]. In regions affected by aflatoxin-producing fungi, the aflatoxin levels can often be high and in several cases greatly exceed the legal limits [16]. Another toxic secondary metabolite produced by various genera of fungi including Aspergillus is the indole-tetramic-acid, cyclopiazonic acid (CPA) [17,18,19,20]. CPA is a potent inhibitor of the Ca2+ ATPase in the sarcoplasmic reticulum, has neurotoxic effects and leads to liver damage and degenerative changes in the kidneys [21,22]. It should be noted that not only aflatoxigenic Aspergillus species produce CPA—it is also produced by atoxigenic isolates such as those used as biocontrol organisms to compete with aflatoxigenic strains [20].
Mycotoxin contamination is not limited to post-harvest problems but can occur at several steps in the food processing chain, such as in the field due to infestation of the plants by aflatoxigenic fungi and during the subsequent storage under causal conditions or due to carry-over. Various environmental parameters influence whether a host plant is infected by a fungus and how much mycotoxin is produced by the fungus on the plant. These parameters include, for example, the susceptibility of the host plant, the composition and quality of the soil, the temperature and water availability (water activity/vapor pressure of water), harmful insects, competitors for fungi and the duration and intensity of solar radiation [23]. Aflatoxins consist of a substituted coumarin ring, which, depending on the aflatoxin, condenses on either a pentanone ring or a lactone ring. Aflatoxin biosynthesis is a multi-step process in which the polyketides are synthesized from acetate and malonate subunits [24]. The genes coding for mycotoxins such as aflatoxins are usually organized in the form of gene clusters. The transcription activity of such clusters is regulated by central regulatory genes, which are activated by specific transcription factors and influenced by physiological conditions [25,26,27,28]. Well-known physiological conditions that control aflatoxin biosynthesis are temperature, pH value, nitrogen and carbon sources and light [29,30,31,32], which are perceived via specific signaling pathways [33].
The influence of light is perceived, for example, by the blue light receptor signal system the “White-Collar-Complex”, first described by Crosthwaite and coworkers in Neurospora crassa [34]. Other research groups later described the influence of light on growth and mycotoxin formation in various species of Penicillium, Aspergillus, Alternaria and Fusarium [35,36,37,38,39,40]. It is known that in A. nidulans blue- and red-light receptor signaling is connected to the HOG (high osmolarity glycerol) MAP kinase pathway [41]. This pathway, which is regularly induced at lower water activities in response to drought stress, was also analyzed in species of Penicillium [42,43] and Alternaria [44]. In addition, in other works the connection between the signaling pathway for osmotic stress and light perception has also been examined for the plant pathogens A. alternata and Botrytis cinerea [37,45].
The increasing spread of aflatoxin-producing fungi due to climate change and the connection between these two important signaling pathways in fungi, HOG and light regulation, were the reason for the experimental setup in this study. In this setup, the combined effects of selected water activities and light wavelengths on the formation of the mycotoxins aflatoxin and cyclopiazonic acid were analyzed using three common isolates of A. flavus and A. parasiticus. The results obtained from the experiments are intended to provide an assessment of how global warming and an increase in light radiation affect growth and mycotoxin formation. We also aim to assess how the findings of the experiments can be used to reduce fungal growth and mycotoxin formation, especially during food storage.

2. Materials and Methods

2.1. Fungal Strains and Growth Conditions

For the growth experiments one non-aflatoxin producing A. flavus isolate and one aflatoxin B1/B2 producing A. flavus isolate was used, both producing cyclopiazonic acid, and one A. parasiticus isolate producing the aflatoxins B1/B2 and G1/G2. These representative isolates were chosen for their constant growth and mycotoxin formation over a period of time under standard laboratory conditions. Our analyses were focused on pksA (a key gene for aflatoxin production) and cpaA (a key gene for cyclopiazonic acid production). We carried out gene expression analyses by means of real-time PCR, determination of the growth rate by diameter measurement and mycotoxin quantification by HPLC. The two aflatoxin-producing strains A. flavus MRI19 and A. parasiticus BFE84 belonged to the culture collection of the Max Rubner-Institut, whereas A. flavus ATCC96045 was purchased from ATCC (ATCC: The Global Bioresource Center, atcc.org) as a non-aflatoxin producing strain. This strain, however, is able to produce CPA. The strains were grown in triplicate on potato dextrose agar (PDA) plates (25 g/L potato—dextrose agar, 10 g/L agar) modified with two different amounts of glycerol in order to adjust the water activity to 0.95 and 0.98 aw, as described in [46]. PDA was used because in our preliminary experiments the selected fungal isolates reliably showed high mycotoxin formation and growth on this substrate compared to other good growth substrates such as yeast extract sucrose (YES) or malt extract glucose agar (MGA). Regardless of the extent of growth and toxin formation, the experimental outcome was comparable on all growth media (not shown). Spore suspensions containing 1 × 10⁵ spores/mL were used for single-point inoculation in the center of the agar plates. Inoculations were carried out in biological triplicates. The cultures were incubated up to 10 days at different light wavelengths at room temperature (+/− 25 °C). The light box, which has been described before [47], was equipped with six incubation chambers containing diodes which emit wavelengths from red (627 nm, 7700 lx); white (17,750 lx); yellow (590 nm, 6400 lx) and green (530 nm, 7250 lx) to blue (470 nm, 2357 lx) and royal blue light (455 nm, 3350 lx). Daily growth and morphology of the colonies were analyzed by measuring the diameters twice, perpendicular to each other. Standard deviation between biological triplicates was calculated.

2.2. Isolation of RNA, cDNA Synthesis and Real-Time PCR

Mycelium samples were prepared for RNA isolation using the RNAeasy Plant Mini kit (Qiagen, Hilden, Germany). A volume of 6.5 µL β-mercaptoethanol and 650 µL RLC buffer solution was added to 80 mg of the mycelium and were homogenized for 2 × 30 s at 5 m/s using a MP FastPrep-24 Tissue and Cell Homogenizer (MP Biomedicals Germany GmbH, Eschwege, Germany). The samples were mixed thoroughly and incubated for 3 min at 56 °C. All further procedures were carried out according to the manufacturer’s instructions for the kit (RNAeasy Plant Mini kit (Qiagen, Hilden, Germany). cDNA synthesis was performed using 12 µL of RNA sample along with the Omniscript Reverse Transcription kit (Qiagen, Hilden, Germany) according to the manufacturer’s instructions. Gene expression analysis was performed with iQ™ SYBR® Green Supermix using a Bio-Rad iQ™5 Multicolor Real-Time PCR Detection System (Bio-Rad Laboratories GmbH, Hercules, CA, USA). Primer pairs resulting in amplificate sizes of about 1000 bp (external) and about 100 bp (internal) were designed and then purchased at biomers.net GmbH (Ulm, Germany). The primer set had the following nucleotide sequences: pksA_extern_for (5′-cacaatggcgccctcttcacgc-3′), pksA_extern_rev (3′-gttagttcctgccaccgccg-5′); pksA_intern_for (5′-gaccaccgaaagcttttgggac-3′), pksA_intern_rev (3′-cacatgcgtgttgatgtcccac-5′), cpaA_extern_for (5′-cctgcgagcactactttatcgg-3′), cpaA_extern_rev (3′-ccatactcctccaaagttatggg-5′), cpaA_intern_for (5′-ggtgaaatcacctaggagtggc-3′), cpaA_intern_rev (3′-ggtccagcctccagaaggc-5′). After an activation step of 10 min at 95 °C, real-time PCR was performed using the following temperature regime: 95 °C for 20 s, 55 °C for 40 s and 72 °C for 60 s for 40 cycles. Standard curves for all analyzed fragments were generated using the external primer pairs for the respective genes of interest. The concentration of the PCR products for the standard curve was determined using a Qubit 3 Fluorometer using the dsDNA HS Assay Kit (Thermo Fisher Scientific Inc., Waltham, MA, USA). The copy numbers were calculated and stock solutions were diluted between 102 to 1010 copy numbers/µL. Aliquots of the dilution series were used during all real-time PCR setups. The concentrations of the samples were calculated using Bio-Rad iQ5 Optical system software, calculating and including the generated standard curve automatically. All samples had three technical and six biological replicates, which were then pooled.

2.3. Quantification of Aflatoxins and Cyclopiazonic Acid Using High-Performance Liquid Chromatography (HPLC)

For determination of aflatoxin B1, B2, G1 and G2 and CPA biosynthesis, three agar plugs (diameter 1 cm) of three colonies were taken in triplicates from the region between center and the edge of the colony with the aid of a sterile corer. Agar plugs were transferred into 2-mL micro-reaction tubes and 750 µL of chloroform were added. Mycotoxins were extracted for 30 min at room temperature on a rotary shaker; the agar plugs were discarded and the chloroform extract was evaporated to dryness in a vacuum concentrator (Speed Vac, Savant Instruments, Farmingdale, NY, USA). Residues were subjected to HPLC determination. Quantitative determination of aflatoxins and CPA of each of the three biological replicates using HPLC was performed on a Hitachi Chromaster HPLC system (VWR International GmbH, Darmstadt, Germany) equipped with an auto-injector 5260, column oven 5310, pump 5160, DAD 5430 and fluorescence detector 5440. For aflatoxin detection the column oven was set to 40 °C; the fluorescence detector was set to an excitation of 365 nm and an emission of 450 nm. The flow rate was 0.7 mL/min and the injection volume was 10 μL. Solvent A consisted of 250 mM acetonitrile, solvent B of water and solvent C of methanol. Separation was carried out on a Hitachi LaChrom C18 (150/4.6–3 µm) reversed-phase column (VWR International GmbH, Darmstadt, Germany) using the following gradient (v/v): 0 min—20 min shift from solvent A 10% and solvent B 60% to solvent C 30%. For CPA detection, the column oven was set to 25 °C; the fluorescence detector was set to an excitation of 333 nm and an emission of 460 nm. The flow rate was at 0.8 mL/min and the injection volume was 10 μL. Solvent A consisted of 250 mM acetonitrile, solvent B of 0.1% formic acid. Separation was carried out on a Kinetex 2.6 µm Evo C18 100A (100 × 4.6 mm) column (Phenomenex, Torrance, CA, USA) using the following gradient (v/v): 0 min—solvent A 5%, solvent B 95%, 5 min—solvent A 50%, solvent B 50%, 15 min—solvent A 95%, solvent B 5%, 17 min—solvent A 5%, solvent B 95%, 22 min—solvent A 5%, solvent B 95%. All standards used were obtained from Sigma (Taufkirchen, Munich, Germany) with a purity of ≥98%. Data collection and handling was done with EZChrome Elite 3.2.

2.4. Statistical Calculation

The statistical analysis of growth values in relation to the control (growth without treatment) was carried out using the hypothesis test. The p-value for the growth rates was calculated with a significance level of α = 0.05. Additionally, to measure the dispersion of biological replicate samples relatively to its mean, standard deviations of means were calculated. For mycotoxin production and gene expression analysis, the paired t-test was used to calculate the average between treated samples and the control. In cases where measured mycotoxin concentrations in the samples were too low, no statistical significance tests were performed.

3. Results and Discussion

3.1. Growth of Aspergillus in Relation to Water Activity and Light

The influence of combinations of two different water activities (aw) and light with five different wavelengths plus white light on the growth of A. flavus MRI19, A. flavus ATCC96045 and A. parasiticus BFE84 was analyzed. These two environmental influencing factors are of particular importance with regard to global warming and the natural habitat of aflatoxigenic fungi, which is even now often exposed to light and drought stress. The strains were inoculated on PDA adjusted to aw 0.98 and aw 0.95 with glycerol and incubated at 25 °C under the influence of different wavelengths of light. Figure 1a,b shows the phenotypic and quantitative growth differences of the three Aspergillus isolates under different combinations of light and water activity. The growth of the three aspergilli analyzed was generally reduced, with lower water activity in the growth media. This is in accordance with the findings of Gibson et al. [48], who showed that Aspergillus grows particularly well at moderate temperatures and high water activity conditions. Experiments with other fungal species, mainly from the genus Penicillium, showed that both growth and mycotoxin production on substrates without adaption of the water activity were strongly influenced by the influence of different light wavelengths alone [36,38,47]. Sporulation and the formation of mycelia were also significantly affected in this context. The combination of slight drought stress, which is mimicked by the lower water activity of the substrate, together with light radiation, however, shows a clear promotion of the inhibition of growth for the analyzed Aspergillus species. In particular, a water activity of aw 0.95 in the growth substrate, together with short-wave light radiation (455/470 nm), led to a significant reduction or even a complete cessation of fungal growth. However, some of the spores showed an increased tolerance to drought stress and short-wave light radiation because they survived the procedure, and this led to tiny colonies after prolonged incubation (data not shown). These adapted spores which showed a higher resilience were positively selected by the harmful growth conditions particularly in case of the species A. parasiticus. A. parasiticus BFE84 and the non-aflatoxin producing strain A. flavus ATCC96045 showed higher growth rates under the given conditions than the aflatoxin-producing A. flavus strain MRI19. In general, longer wavelengths (530/627 nm) appear to support the growth of the fungi, whereas incubation under short wavelengths (455/470 nm) reduced growth persistently over an observation period of at least two weeks.

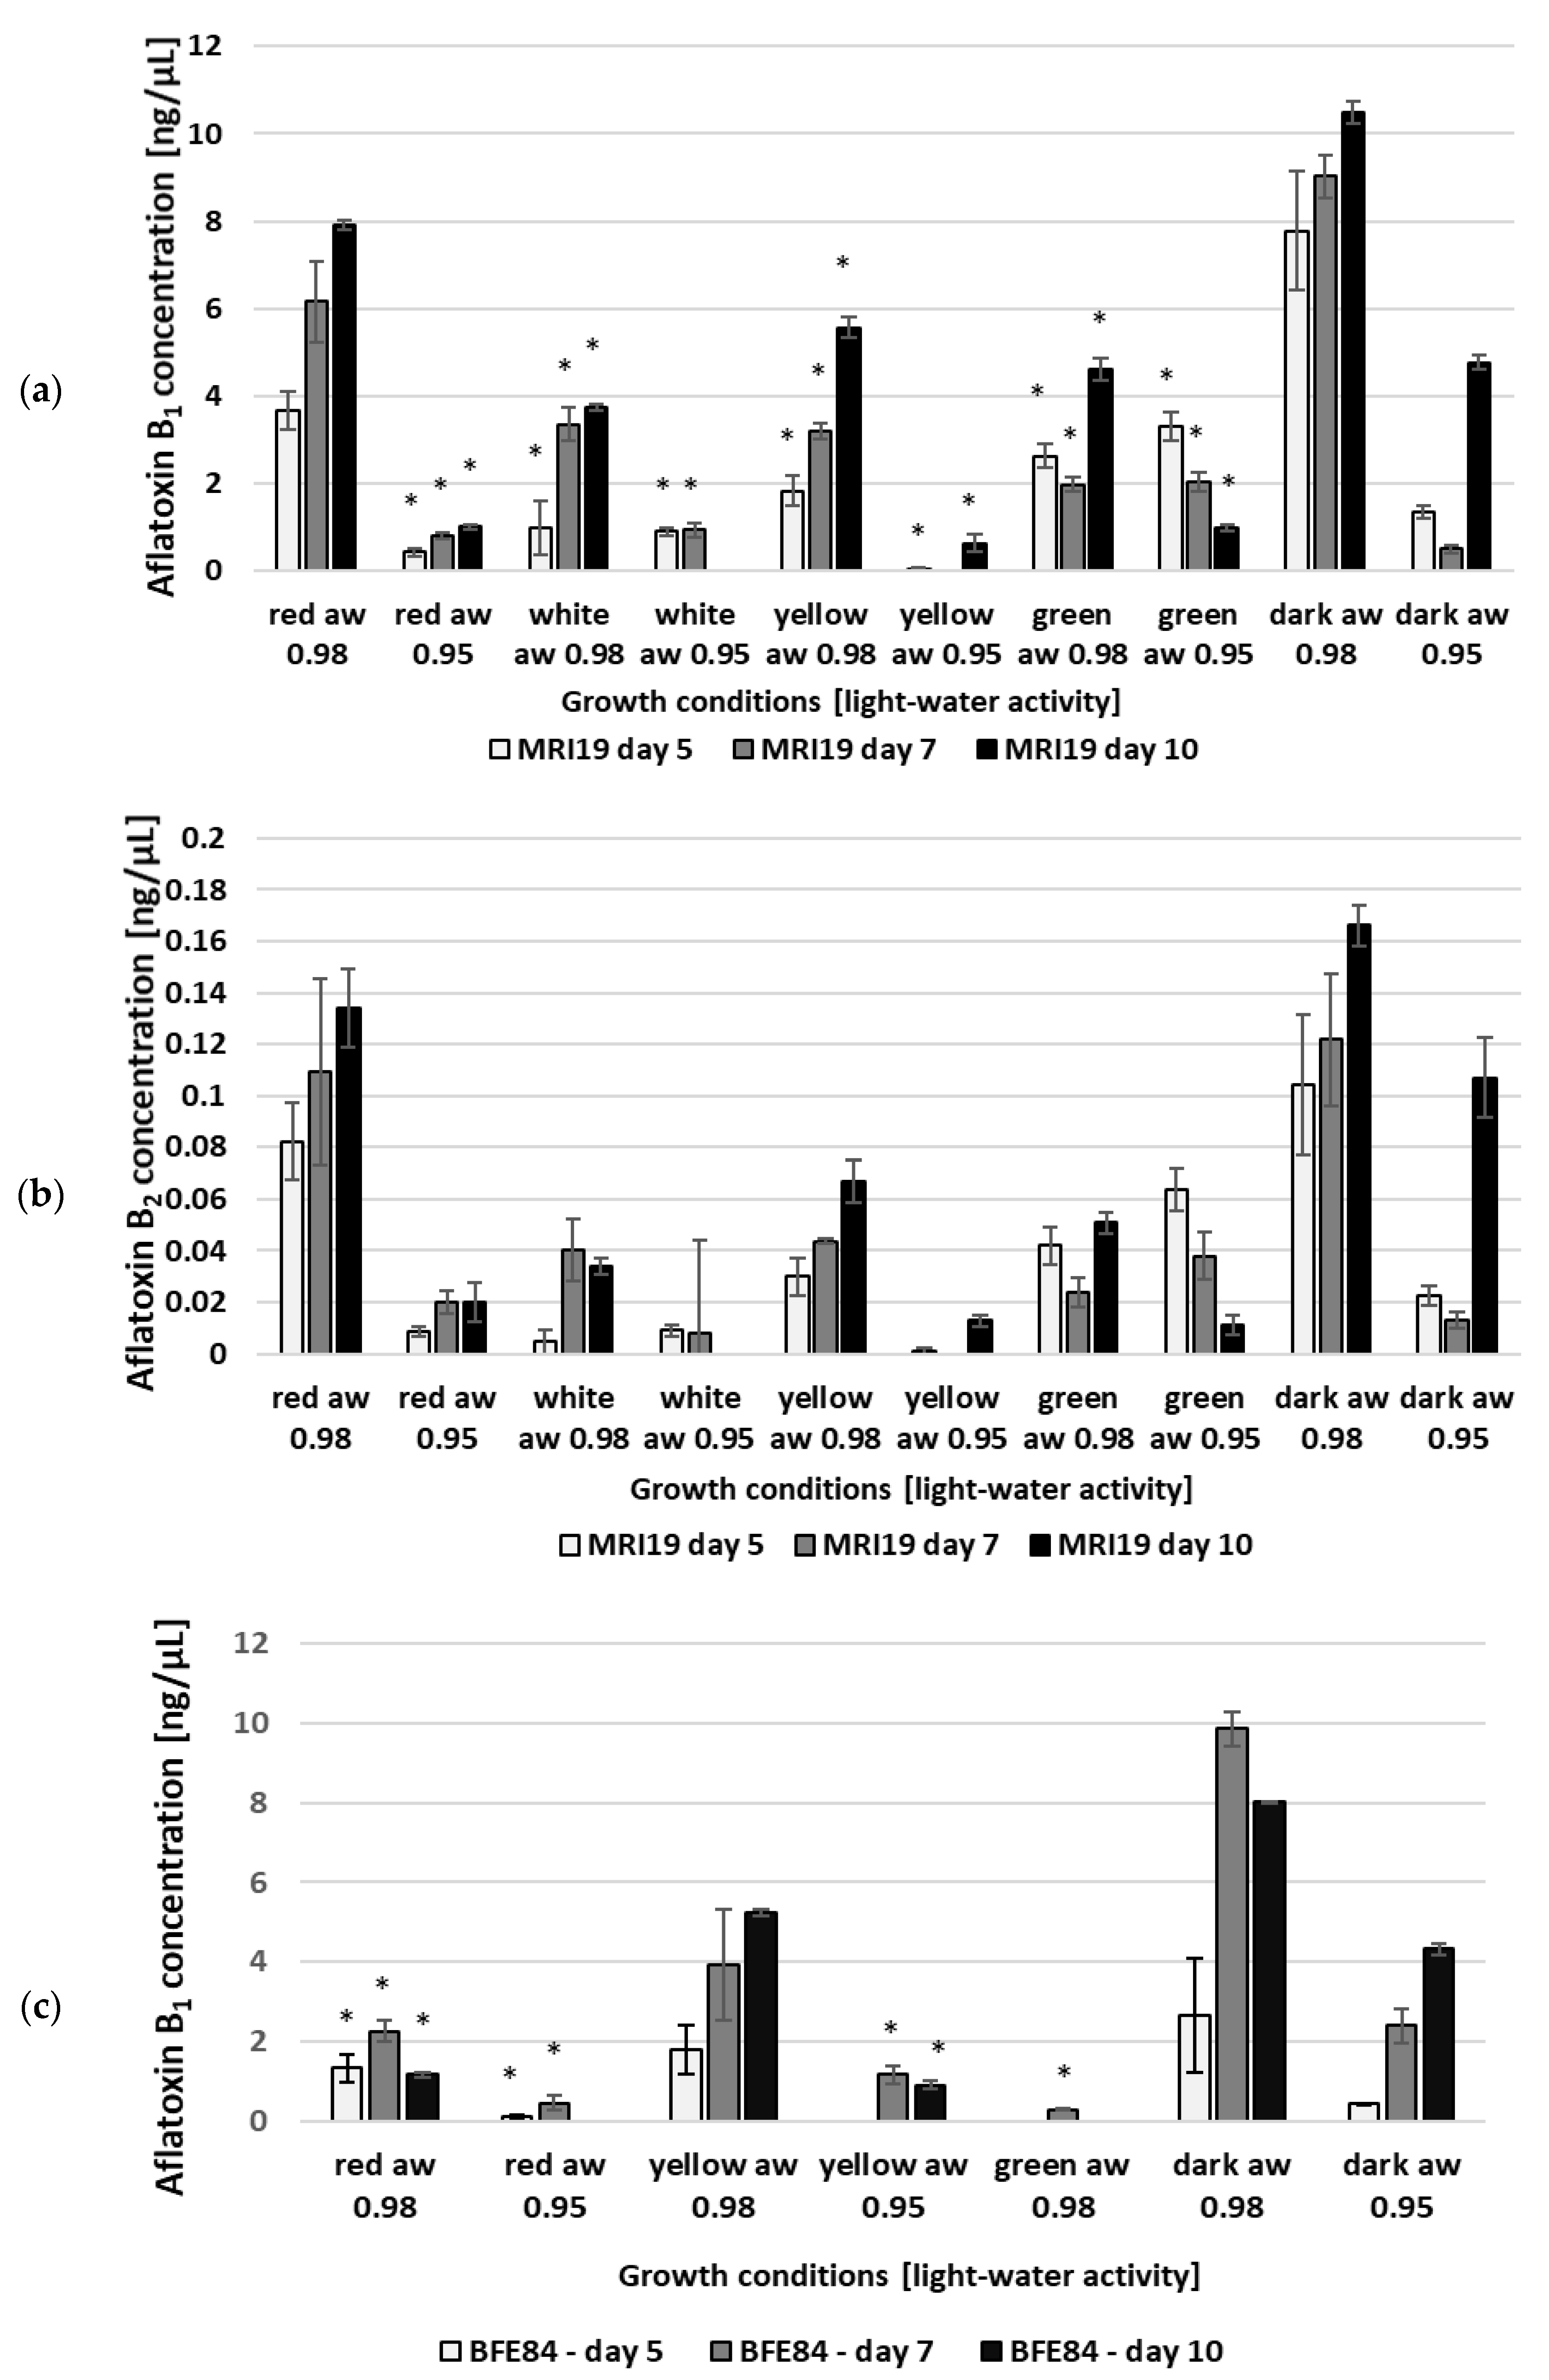
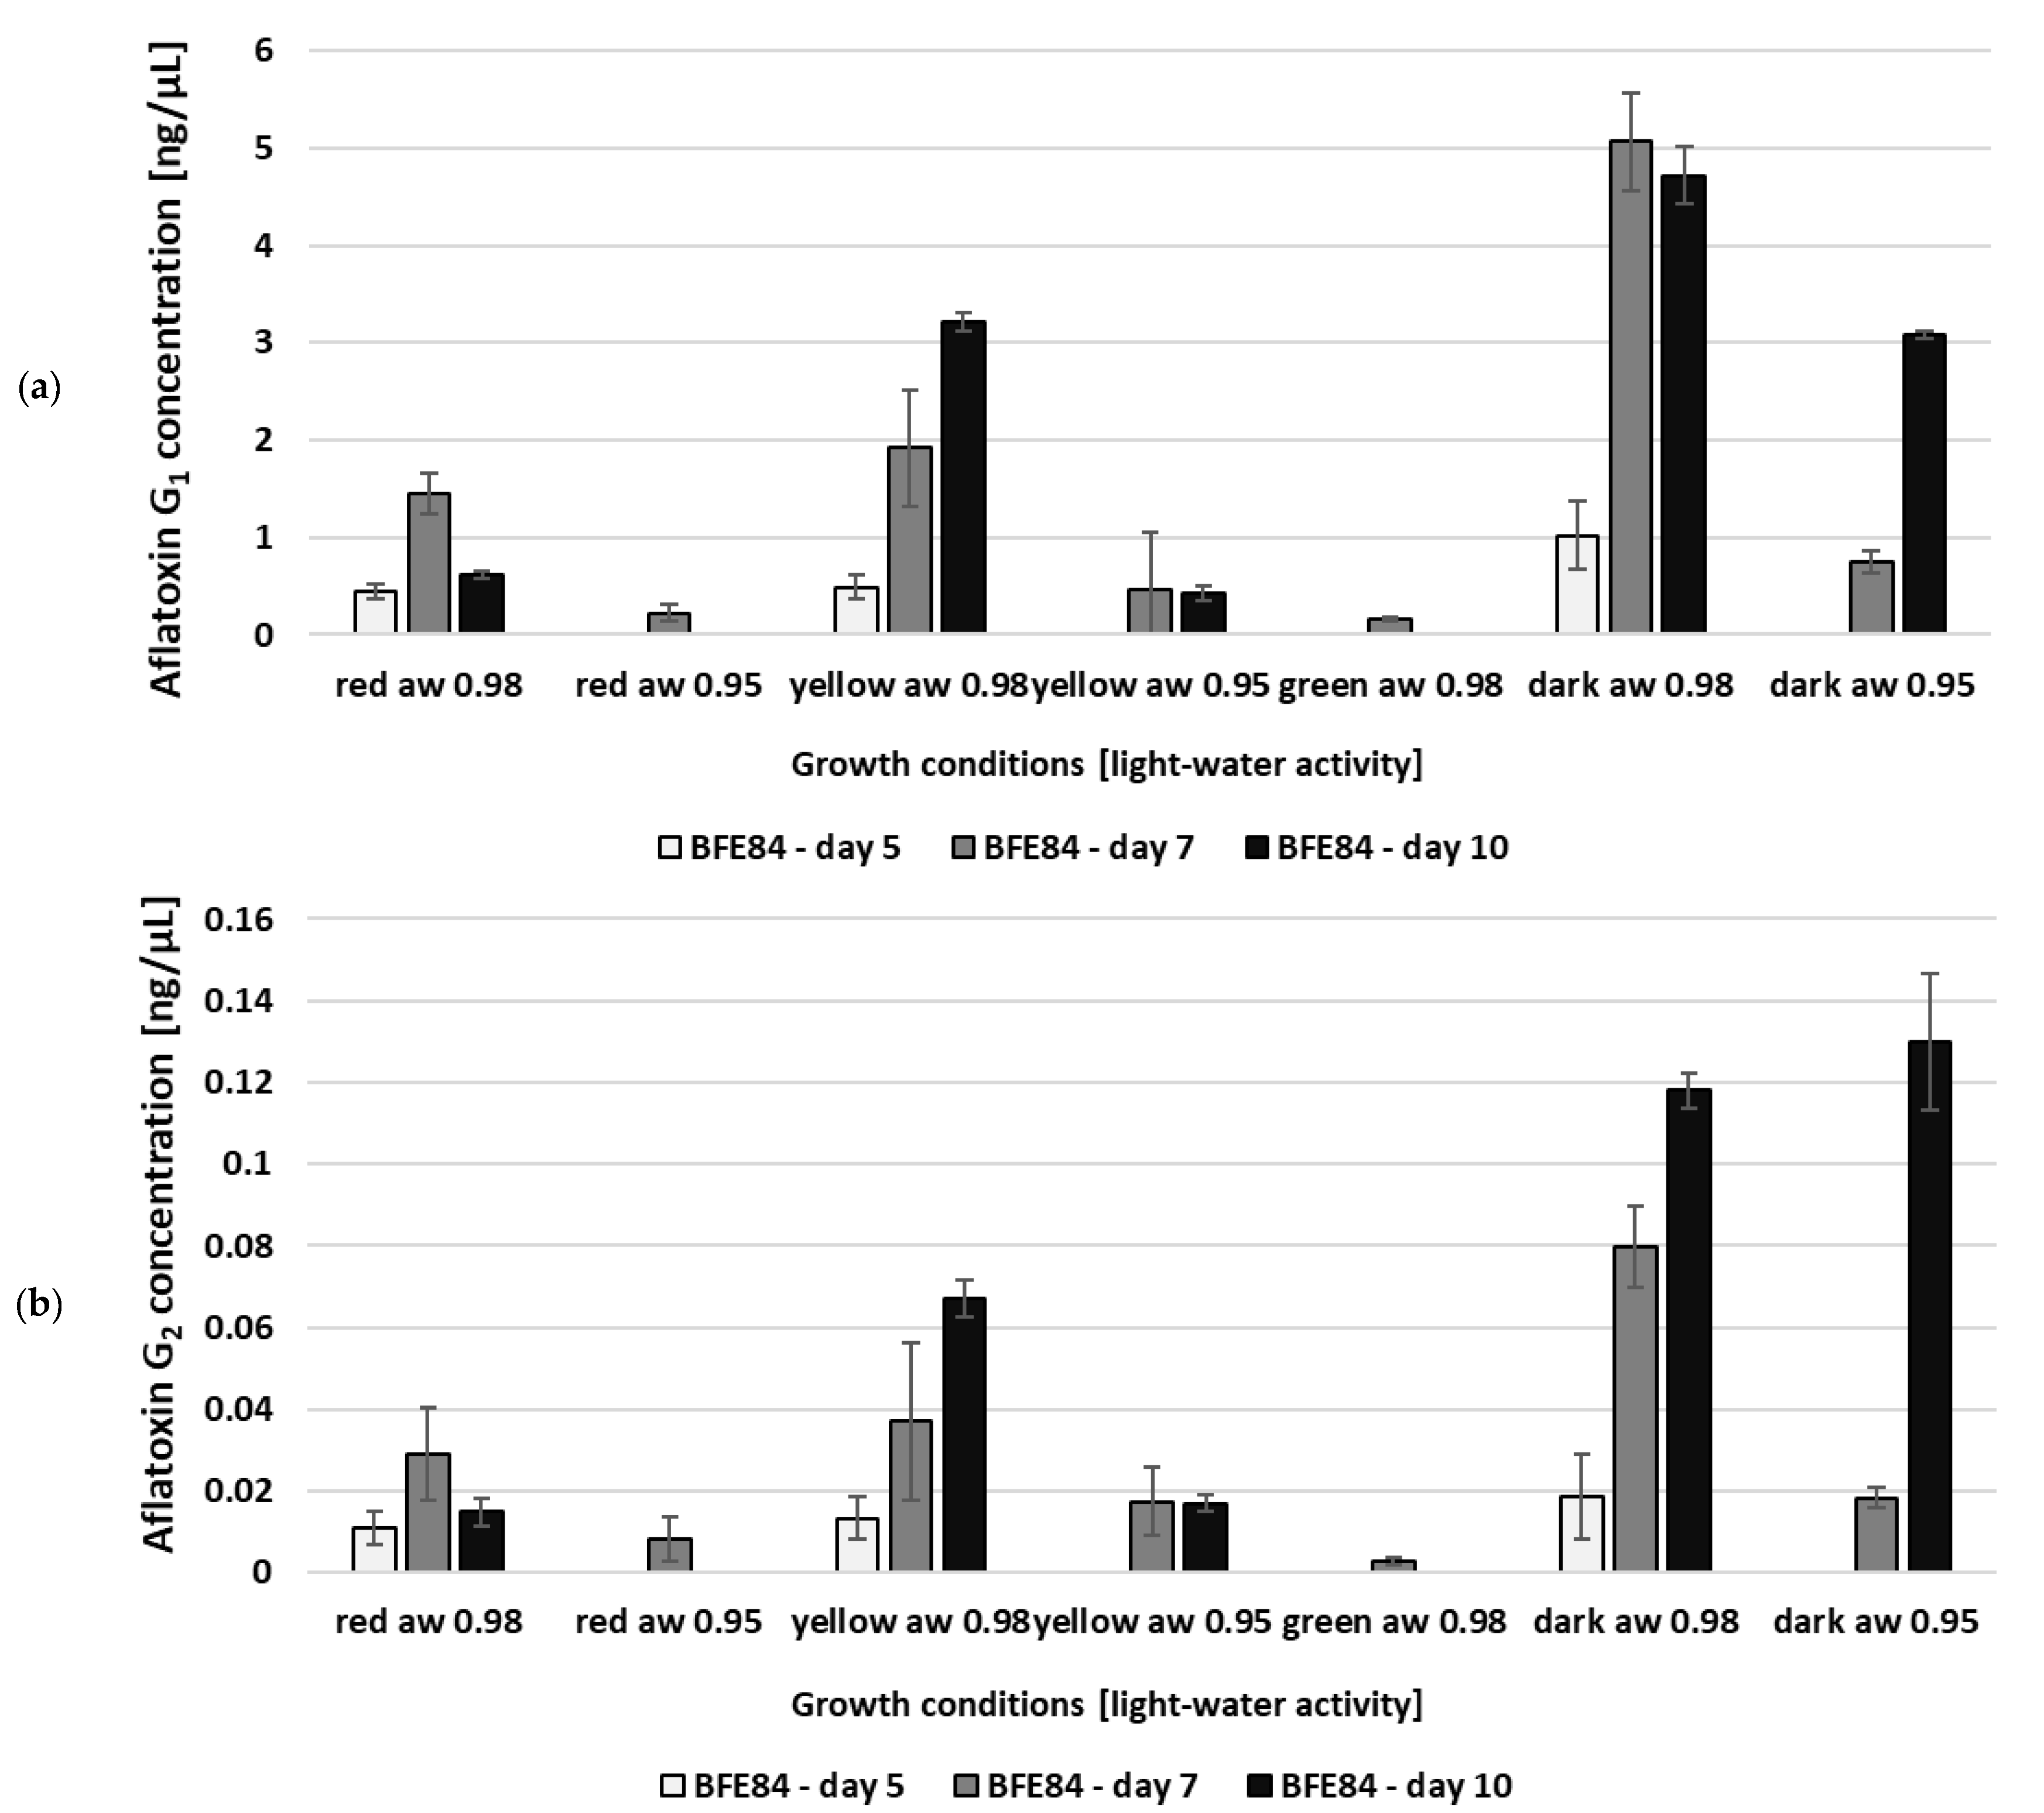
3.2. Aflatoxin Biosynthesis of Aspergillus in Relation to Water Activity and Light

The combination of moderate drought stress and different light wavelengths also showed a substantial effect on mycotoxin production, as shown in Figure 2 and Figure 3. Under the influence of only one parameter—light or water activity—mycotoxin formation was less affected. The combined effect of both influencing factors—short-wave light (455/470 nm) together with lower water activity (aw 0.95)—however, leads to a significant reduction in growth and a complete inhibition of mycotoxin formation. The aflatoxin B1/B2 formation of the A. flavus MRI19 and A. parasiticus BFE84 isolates over a period of ten days is shown in Figure 2a–d and the formation of aflatoxin G1/G2 by A. parasiticus is shown in Figure 3a,b. The highest aflatoxin concentrations could be measured in the growth of Aspergillus without light radiation. This leads to the assumption that aflatoxin formation in the dark is preferred and that aflatoxin obviously does not help to compensate for the harmful effects of light radiation, as described in the case of the mycotoxin citrinin produced by P. verrucosum [49,50]. Incubation under long-wave light (627 nm, red light) leads to a good reduction in aflatoxin formation of about 20% compared to dark conditions. However, the sporulation, mycelial phenotypical habitus and mycotoxin formation were still most similar to the samples incubated in the dark, followed by samples incubated at medium wavelengths. Under white, yellow and green light (depending on the fungal strain) the mycotoxin concentration was reduced even further. This observation differs from the results of Moussa et al. [40], who described an induction of aflatoxin B1 formation in A. flavus irradiated with white light. The reason for this discrepancy could be that they did not use LED light, which is more monochromatic “cold-white” light compared to Edison lightbulbs, which emit more yellow “warm white” light. Other groups found that white light harms the formation of sclerotia in A. flavus growing in liquid medium and to some extent the production of secondary metabolites [51,52]. It is already known that the reaction of the fungus to light depends on physical parameters associated with light such as the wavelength, the intensity, the duration of the radiation and thus the energy to which the fungus is exposed [38,47]. In addition, fungi that are well adapted to highly UV-exposed habitats such as melanin- or carotenoid-pigmented fungi that occur in crop fields in parallel with Aspergillus may be less sensitive to light radiation.

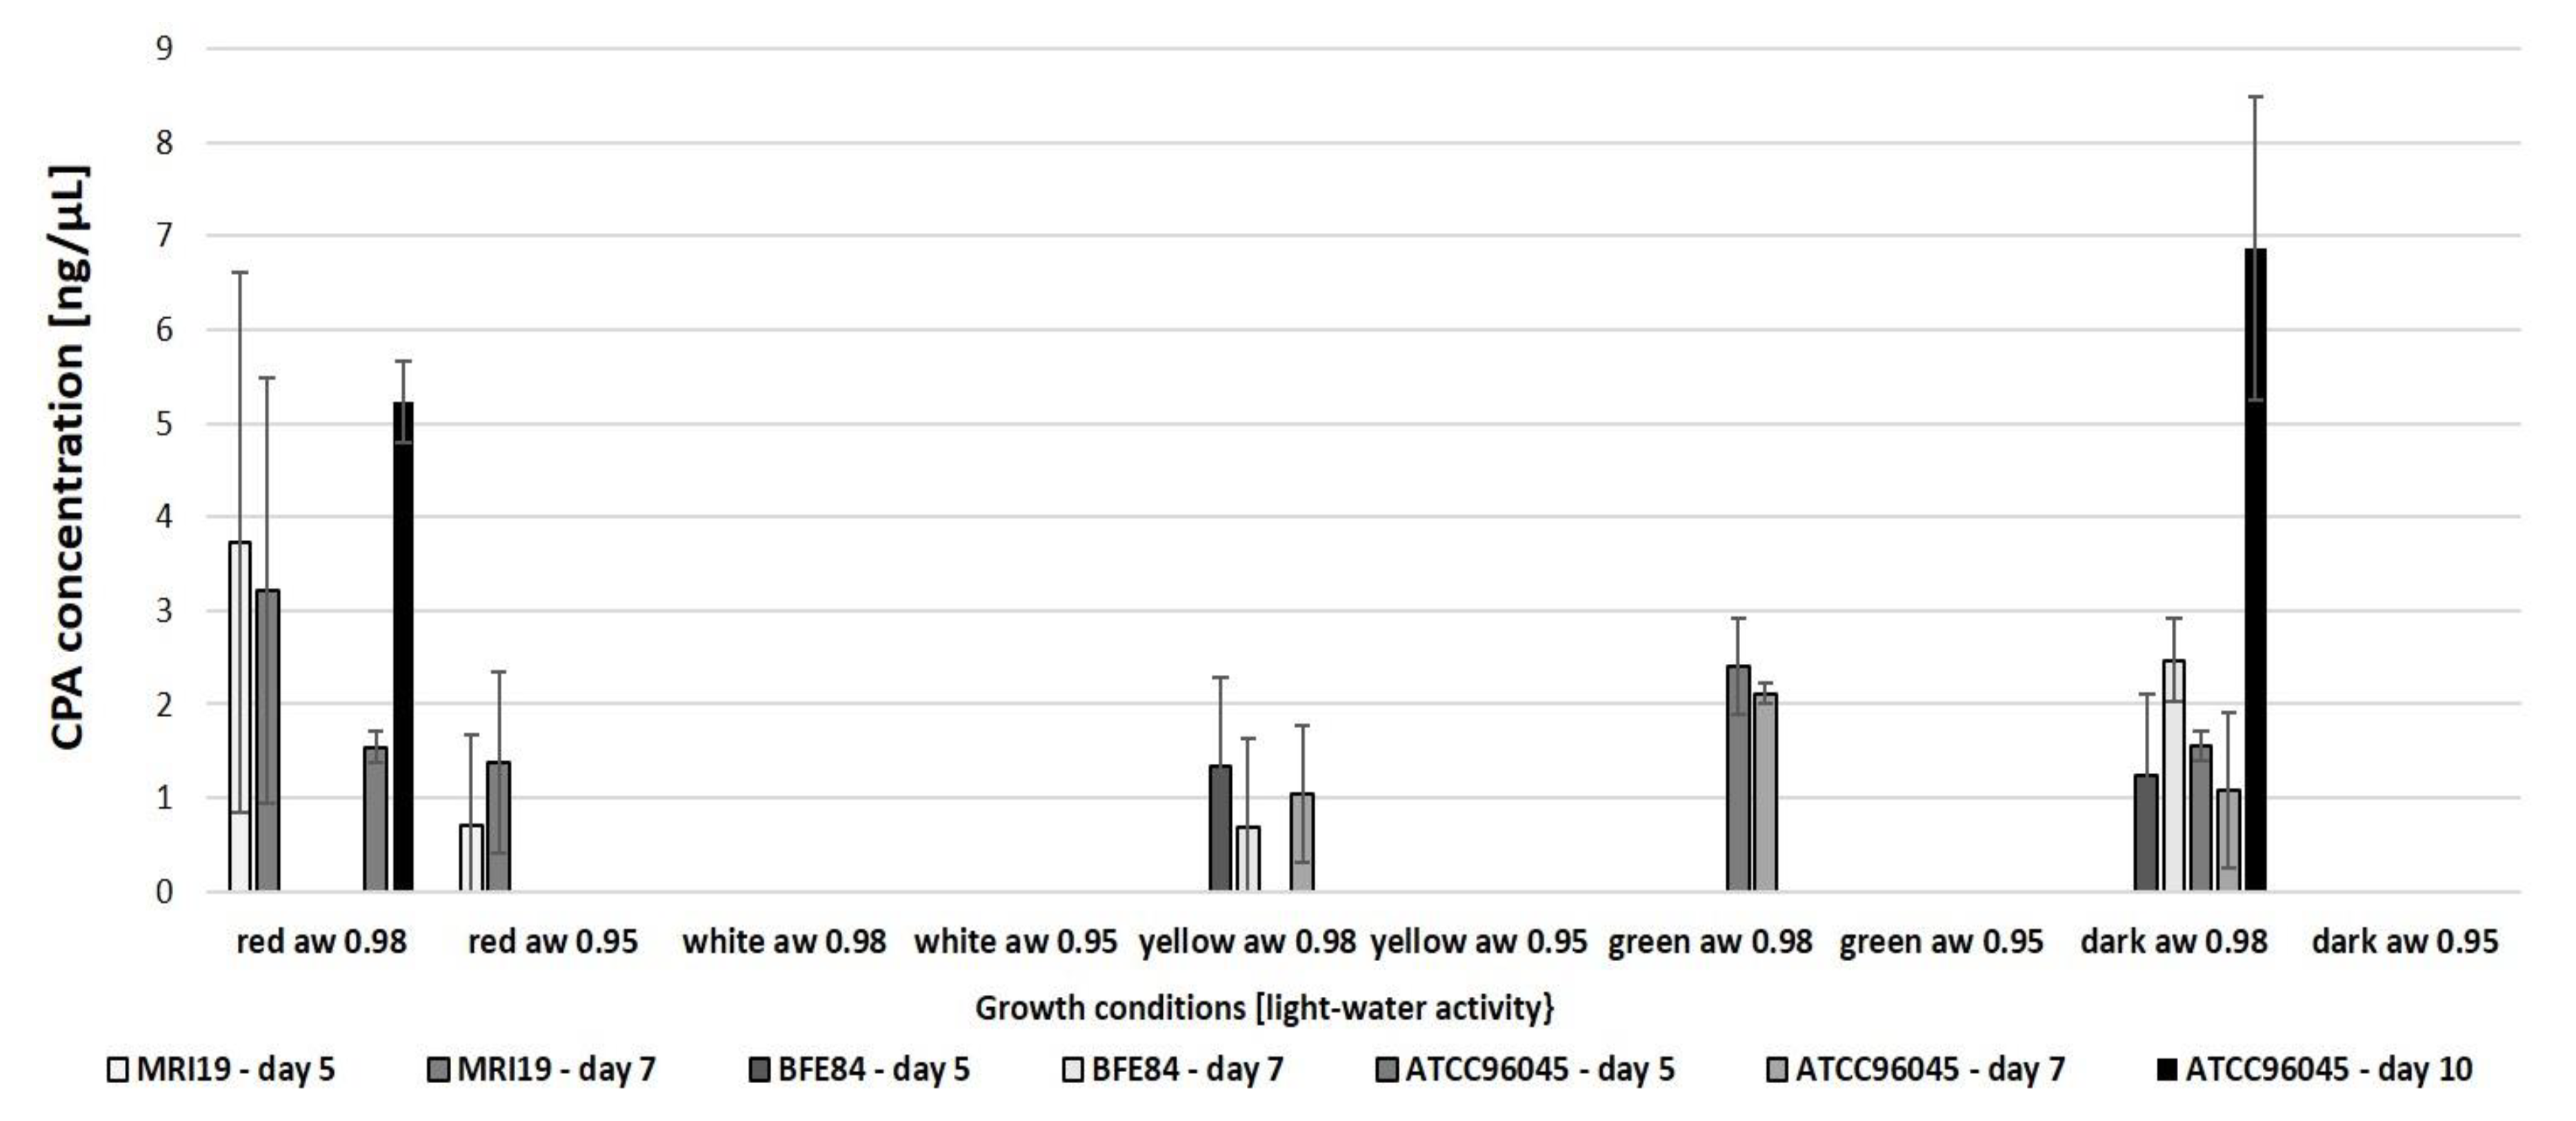
3.3. Cyclopiazonic Acid (CPA) Biosynthesis of Aspergillus in Relation to Water Activity and Light

In addition to the formation of aflatoxins, we were interested in the formation of cyclopiazonic acid (CPA) by the analyzed aspergilli. A. flavus strain ATCC96045 does not produce aflatoxins, although it does produce CPA (Figure 4). Similarly to the formation of aflatoxins, CPA production by the fungal strains was possible after irradiation with red and yellow light and in the dark. However, there were major differences between the strains analyzed. Although the CPA formation in the two aflatoxin-producing strains generally remained low, the concentration in the ATCC96045 strain increased, particularly at the end of the experiment.

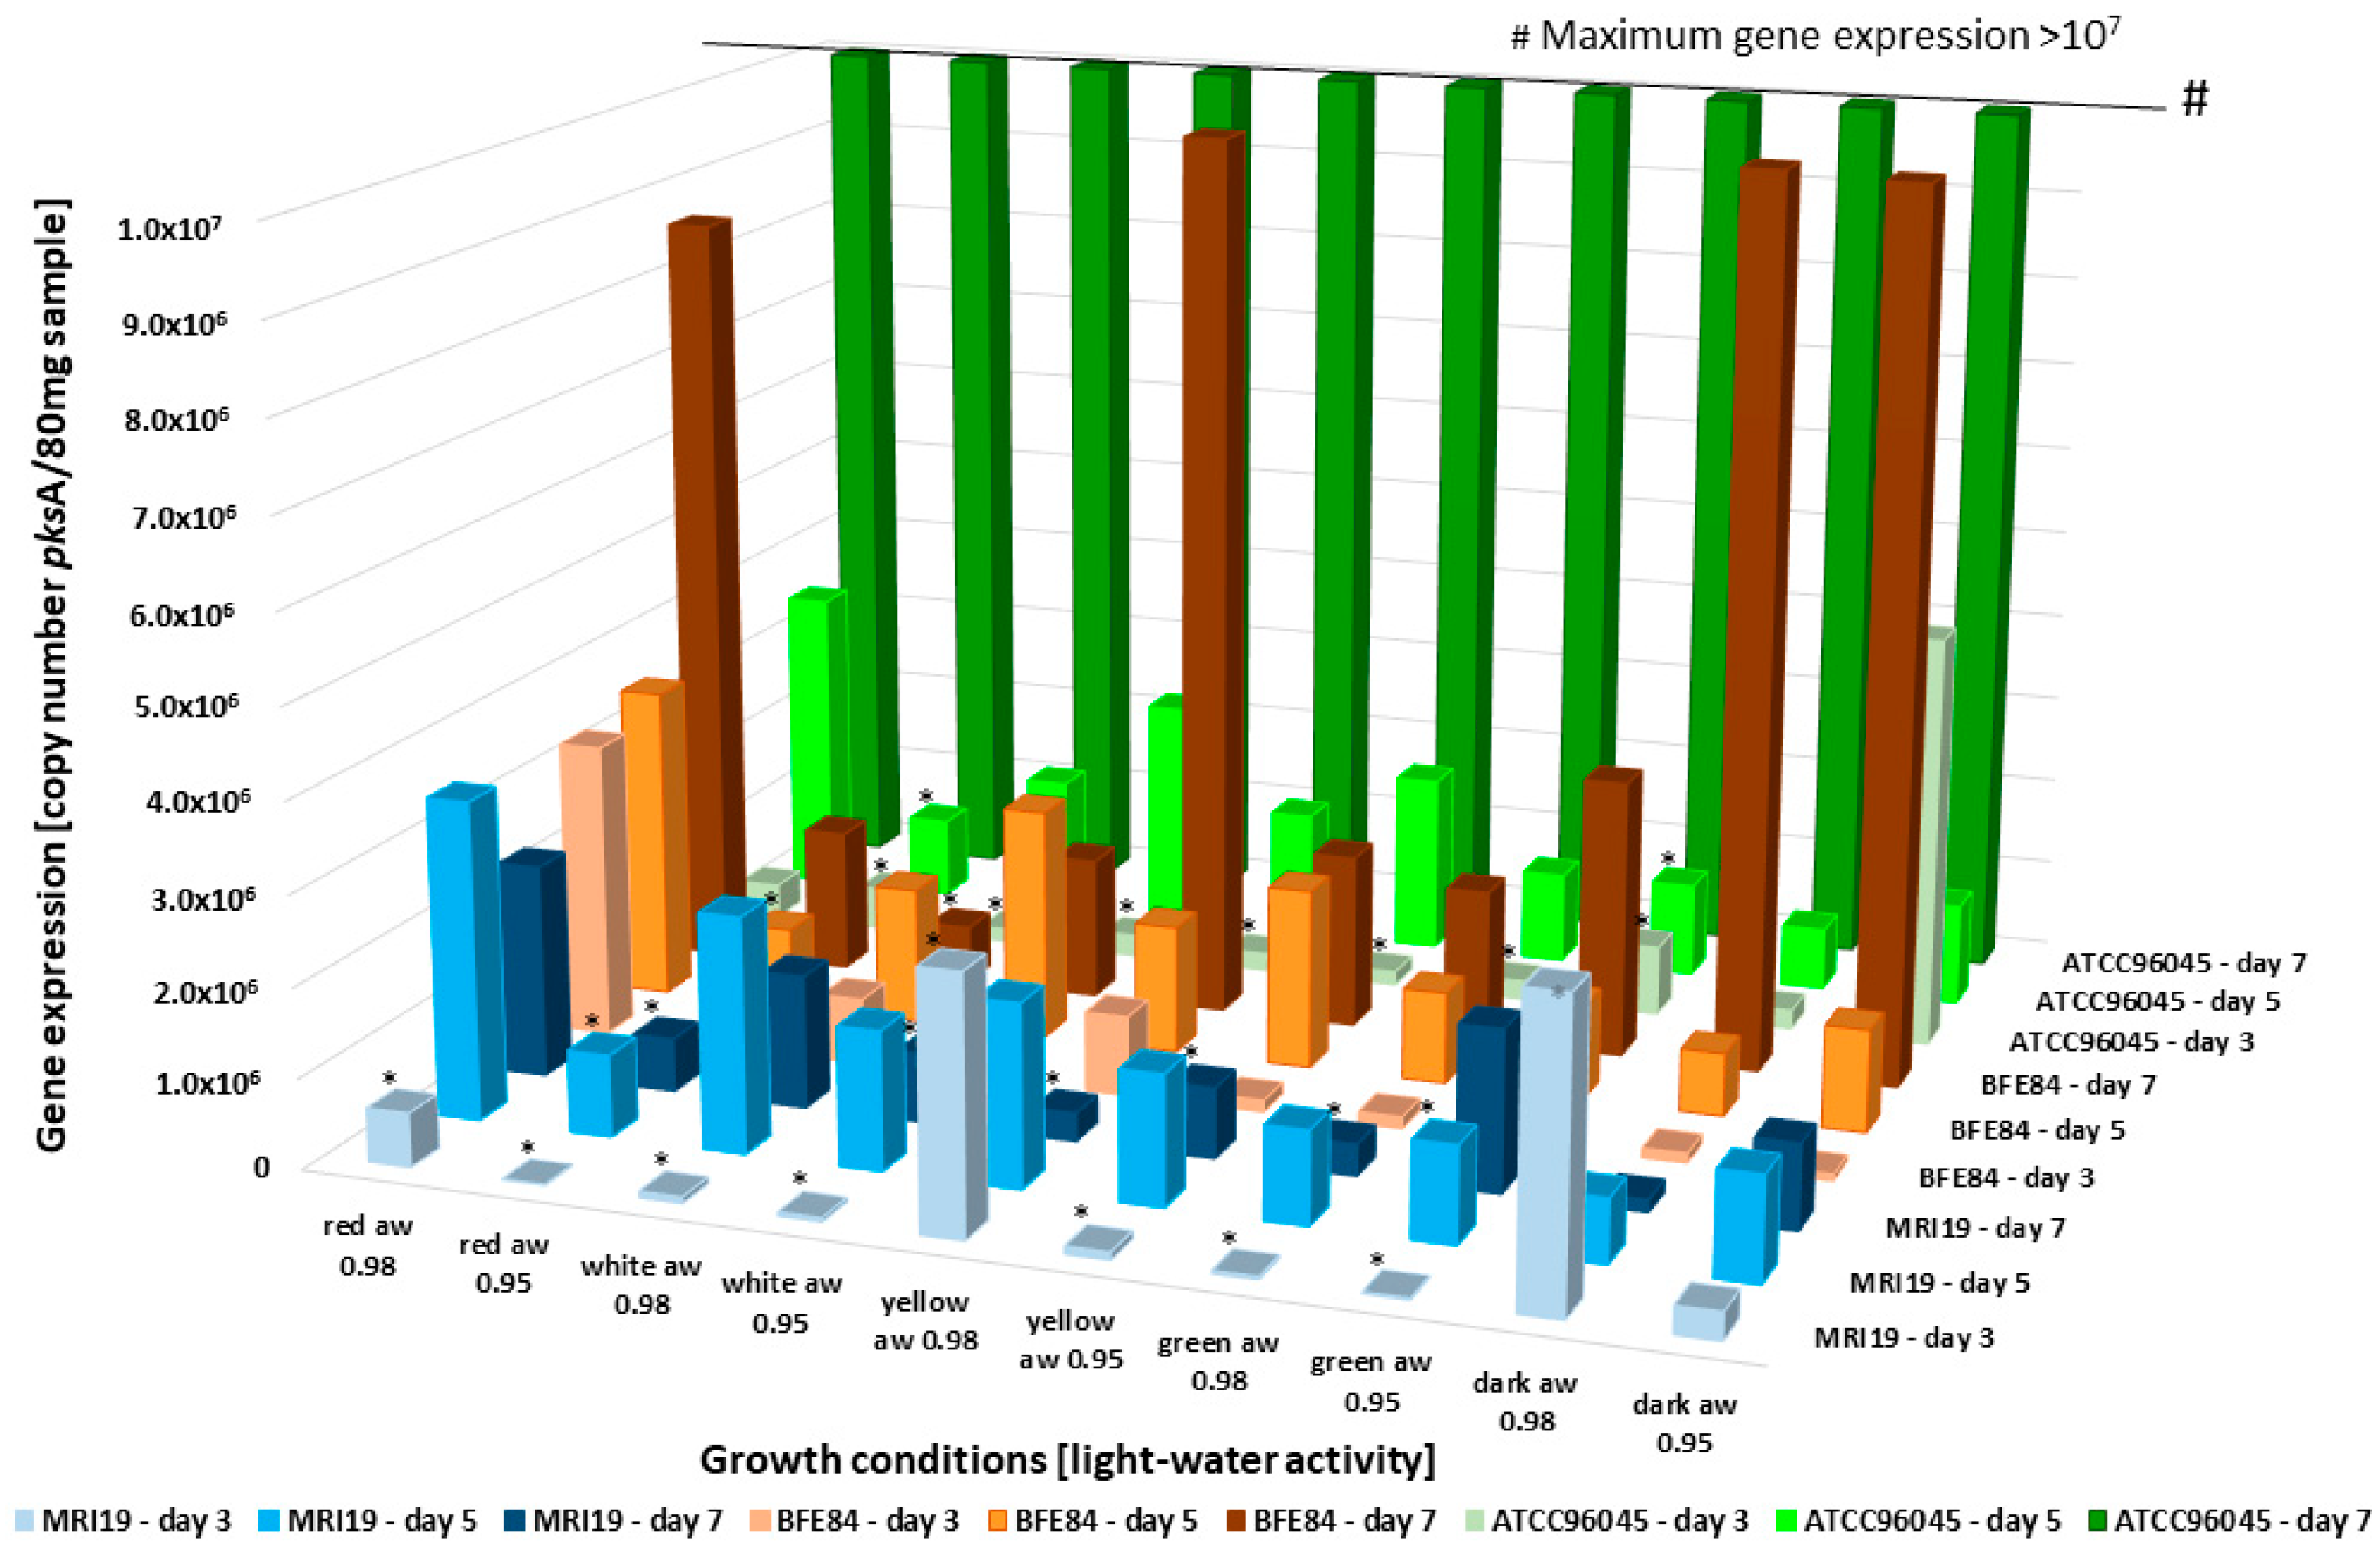
3.4. Transcriptional Activity of Mycotoxin Biosynthetic Genes in Aspergillus in Relation to Water Activity and Light

In general, it must be considered that toxin formation is an accumulated value if toxins are not metabolized further or are degraded by the fungus, whereas gene expression is a “snapshot” and thus depends on mRNA stability and other factors that are continuously changing [53,54]. Depending on the physiological status of the fungal cell, the gene expression shows a direct correlation to mycotoxin formation or has more of a predictive value [32]. Nevertheless, it has been shown that gene expression can be used as an early indication of active mycotoxin biosynthesis [55]. In order to investigate the phenotypic mycotoxin formation in relation to the transcriptional activity of aflatoxin biosynthetic genes, real-time PCR gene expression analyses were carried out, which targeted the polyketide synthase gene pksA from the aflatoxin cluster and the hybrid PKS-NRPS gene cpaA, which is involved in cyclopiazonic acid formation. The gene expression analyses were compared to the measured aflatoxin data, and as shown in Figure 5, the pksA expression was reduced even under slight drought stress. The highest pksA expressions were measured after red and yellow light irradiation, as well as in the dark and with a water activity of aw 0.98. In these cases, the expression of pksA was already increased on day 3, whereas the upregulation under the other conditions began within the fifth day. The transcriptional activity of the pksA gene increased proportionally to the formation of aflatoxin under the given conditions and with the duration of the experiment. A lower water activity of the medium was associated with reduced toxin formation and reduced expression of the polyketide synthase gene pksA. In addition, the differences in gene expression and aflatoxin formation with regard to light wavelength are interesting. Toxin formation and pksA gene expression were paralleled under the influence of red light and yellow light radiation and samples incubated in the dark. PksA expression was activated immediately under these conditions, which led to earlier aflatoxin production. In general, the data show that toxin formation is negatively affected by short-wave light. It has already been described earlier that genes of different secondary metabolites are often mutually regulated in different light conditions. In this context, some secondary metabolites are induced and others are reduced [56,57].
Jayashree et al. observed that aflatoxin is formed in particular under conditions that cause oxidative stress for the fungus [58]. Oxidative stress can be induced by chemicals such as hydrogen peroxide [59], but also by short-wave light radiation [60]. A connection between oxidative stress and aflatoxin formation as a kind of compensation mechanism would be assumed, as shown in the case of the mycotoxin citrinin produced by the species Penicillium verrucosum [49,50]. In this species, citrinin acts as a radical scavenger, protecting the fungus from oxidative stress induced by short-wave light radiation. For aflatoxin, the physiological benefit for the producing fungus is not yet so clear. Kolliputi et al. found that oxygen radicals are required for aflatoxin formation, so its formation can be induced by oxidative stress [61]. For this reason, it was expected that the formation of aflatoxin would be activated by the short-wave radiation of blue light, but this was not the case in the experiments. It is possible that the oxidative stress induced by the applied short-wave light was below the threshold for an induction of aflatoxin biosynthesis. Another interesting observation was that the non-aflatoxin producing A. flavus strain ATCC96045 exhibited remarkably high pksA expression at the 7th day, especially under red light, yellow light and dark growth conditions, i.e., the growth-promoting conditions. The pksA gene expression rates were more than two orders of magnitude higher compared to the two other aflatoxin producing strains, regardless of the fact that this Aspergillus strain is not able to form aflatoxin. The reason for its inability to produce aflatoxin is apparently due to deletions which were identified in various genes of the aflatoxin cluster during detailed sequencing analyses of the genome sequence of A. flavus ATCC96045 (data not shown).
The gene expression analysis with the key gene for CPA formation, cpaA, a hybrid polyketide synthase/non-ribosomal peptide synthase gene [62], showed increased transcription activity in the strain A. flavus ATCC96045 (Figure 6) from the beginning. It is noteworthy that the gene expression under yellow light radiation and aw 0.95 was high, whereas no CPA could be detected by HPLC. This suggests that some post-translational mechanisms could hinder CPA formation in a certain step of the biosynthesis, which again shows that the regulation of mycotoxin formation is a very complex process [53].

4. Conclusions

It is shown here that the formation of aflatoxin and cyclopiazonic acid by Aspergillus flavus and Aspergillus parasiticus can be greatly reduced by using a combination of lower water activity (aw 0.95) and short-wave light (455/470 nm) and that this was paralleled by a reduced transcription activity of the corresponding mycotoxin biosynthetic genes. These conditions also led to the severe growth inhibition of all aspergilli analyzed. It is clear that these conditions can be controlled in particular in storage houses, rather than in the field. However, the results of the experiments reported in this study may allow for the prediction of how such conditions (increased sun exposure and drought) support the further spread of aflatoxin-producing fungi and the conditions that lead to increased or decreased aflatoxin production.
Global warming and cooling change at regular intervals depending on many variables, including solar activity, the amount of greenhouse gases such as CO2 in the atmosphere and indirect climate variables such as air exchange, humidity, evaporation capacity of surface water, etc. Considering the experimentally obtained data collected here, even if there were only a few isolates of A. flavus and A. parasiticus, it can be assumed, together with the optima for growth and aflatoxin biosynthesis reported in other publications [31,32,63], that an increase in drought and short-wave radiation (UV, blue) in areas that warm up and are heavily exposed to the sun leads to lower aflatoxin contamination. Overall, however, there will be further spread of aflatoxin-forming fungal species in areas that were previously too cold and dry and that are now becoming warmer and more humid due to global warming, as is already the case in parts of Europe.
Future analyses should further investigate the benefit of the formation of the secondary metabolites aflatoxin and CPA for Aspergillus and their possible involvement in physiological aspects such as virulence and adaption to habitat. This would enable the development of more effective and sustainable antifungal strategies.

Author Contributions

Conceptualization, E.-M.P. and M.S.-H.; data curation, E.-M.P.; formal analysis, E.-M.P. and M.S.-H.; funding acquisition, M.S.-H.; investigation, M.S.-H.; methodology, E.-M.P.; project administration, M.S.-H.; supervision, M.S.-H.; validation, E.-M.P. and M.S.-H.; visualization, E.-M.P. and M.S.-H.; writing—original draft, E.-M.P. and M.S.-H.; writing—review and editing, E.-M.P., R.G. and M.S.-H. All authors have read and agreed to the published version of the manuscript.

Funding

The project is being funded by the Federal Ministry of Food and Agriculture BLE under the reference AflaZ 2816PROC11.

Acknowledgments

The authors thank Karla Hell and Antje Decker for excellent technical support.

Conflicts of Interest

The authors declare no conflict of interest.

References

  1. Eskola, M.; Kos, G.; Elliott, C.T.; Hajslova, J.; Mayar, S.; Krska, R. Worldwide contamination of food-crops with mycotoxins: Validity of the widely cited ‘FAO estimate’ of 25%. Crit. Rev. Food Sci. 2020, 60, 2773–2789. [Google Scholar] [CrossRef] [PubMed]
  2. Frisvad, J.C.; Hubka, V.; Ezekiel, C.N.; Hong, S.B.; Novakova, A.; Chen, A.J.; Arzanlou, M.; Larsen, T.O.; Sklenář, F.; Mahakarnchanakul, W.; et al. Taxonomy of Aspergillus section Flavi and their production of aflatoxins, ochratoxins and other mycotoxins. Stud. Mycol. 2019, 93, 1–63. [Google Scholar] [CrossRef] [PubMed]
  3. Koehler, P.E.; Hanlin, R.T.; Beraha, L. Production of Aflatoxins B1 and G1 by Aspergillus-Flavus and Aspergillus-Parasiticus Isolated from Market Pecans. Appl. Microbiol. 1975, 30, 581–583. [Google Scholar] [CrossRef] [PubMed]
  4. Baranyi, N.; Despot, D.J.; Palagyi, A.; Kiss, N.; Kocsube, S.; Szekeres, A.; Kecskeméti, A.; Bencsik, O.; Vágvölgyi, C.; Klarić, M.Š.; et al. Identification of Aspergillus Species in Central Europe Able to Produce G-Type Aflatoxins. Acta Biol. Hung. 2015, 66, 339–347. [Google Scholar] [CrossRef] [Green Version]
  5. Horn, B.; Dorner, J. Soil populations of Aspergillus species from section Flavi along a transect through peanut-growing regions of the United States. Mycologia 1998, 90, 767–776. [Google Scholar] [CrossRef]
  6. Arrus, K.; Blank, G.; Abramson, D.; Clear, R.; Holley, R. Aflatoxin production by Aspergillus flavus in Brazil nuts. J. Stored Prod. Res. 2005, 41, 513–527. [Google Scholar] [CrossRef]
  7. Benkerroum, N. Chronic and Acute Toxicities of Aflatoxins: Mechanisms of Action. Int. J. Environ. Res. Public Health 2020, 17, 423. [Google Scholar] [CrossRef] [Green Version]
  8. Battilani, P.; Toscano, P.; Van der Fels-Klerx, H.; Moretti, A.; Leggieri, M.C.; Brera, C.; Rortais, A.; Goumperis, T.; Robinson, T. Aflatoxin B 1 contamination in maize in Europe increases due to climate change. Sci. Rep. 2016, 6, 24328. [Google Scholar] [CrossRef] [Green Version]
  9. Klich, M.; Cary, J.; Beltz, S.; Bennett, C. Phylogenetic and morphological analysis of Aspergillus ochraceoroseus. Mycologia 2003, 95, 1252–1260. [Google Scholar] [CrossRef]
  10. Bennett, J.; Klich, M. Mycotoxins. Clin. Microbiol. Rev. 2003, 16, 497–516. [Google Scholar] [CrossRef] [Green Version]
  11. Atherstone, C.; Grace, D.; Lindahl, J.F.; Kang’ethe, E.K.; Nelson, F. Assessing the impact of aflatoxin consumption on animal health and productivity. Afr. J. Food Agric. Nutr. Dev. 2016, 16, 10949–10966. [Google Scholar] [CrossRef]
  12. Fink-Gremmels, J. Mycotoxins in cattle feeds and carry-over to dairy milk: A review. Food Addit. Contam. 2008, 25, 172–180. [Google Scholar] [CrossRef] [PubMed] [Green Version]
  13. Gong, Y.Y.; Turner, P.C.; Hall, A.J.; Wild, C.P. Aflatoxin exposure and impaired child growth in West Africa: An unexplored international public health burden. In Mycotoxins Detection Methods, Management, Public Health and Agricultural Trade; CABI: Wallingford, UK, 2008; pp. 53–66. ISBN 9781845930820. [Google Scholar]
  14. Meissonnier, G.M.; Pinton, P.; Laffitte, J.; Cossalter, A.-M.; Gong, Y.Y.; Wild, C.P.; Bertin, G.; Galtier, P.; Oswald, I.P. Immunotoxicity of aflatoxin B1: Impairment of the cell-mediated response to vaccine antigen and modulation of cytokine expression. Toxicol. Appl. Pharmacol. 2008, 231, 142–149. [Google Scholar] [CrossRef] [PubMed]
  15. Oswald, I.; Marin, D.; Bouhet, S.; Pinton, P.; Taranu, I.; Accensi, F. Immunotoxicological risk of mycotoxins for domestic animals. Food Addit. Contam. 2005, 22, 354–360. [Google Scholar] [CrossRef]
  16. Hove, M.; Van Poucke, C.; Njumbe-Ediage, E.; Nyanga, L.; De Saeger, S. Review on the natural co-occurrence of AFB1 and FB1 in maize and the combined toxicity of AFB1 and FB1. Food Control 2016, 59, 675–682. [Google Scholar] [CrossRef]
  17. Vaamonde, G.; Patriarca, A.; Pinto, V.F.; Comerio, R.; Degrossi, C. Variability of aflatoxin and cyclopiazonic acid production by Aspergillus section flavi from different substrates in Argentina. Int. J. Food Microbiol. 2003, 88, 79–84. [Google Scholar] [CrossRef]
  18. Luk, K.C.; Kobbe, B.; Townsend, J.M. Production of Cyclopiazonic Acid by Aspergillus-Flavus Link. Appl. Environ. Microb. 1977, 33, 211–212. [Google Scholar] [CrossRef] [Green Version]
  19. Holzapfel, C.W.; Schabort, J. Oxidative Cyclization of Beta-Cyclopiazonic Acid in Penicillium-Cyclopium Westling. S. Afr. J. Chem. 1977, 30, 233–235. [Google Scholar]
  20. Gallagher, R.T.; Richard, J.L.; Stahr, H.M.; Cole, R.J. Cyclopiazonic Acid Production by Aflatoxigenic and Non-Aflatoxigenic Strains of Aspergillus-Flavus. Mycopathologia 1978, 66, 31–36. [Google Scholar] [CrossRef]
  21. Purchase, I.F. Acute Toxicity of Mycotoxin Cyclopiazonic Acid to Rats. Toxicol. Appl. Pharmacol. 1971, 18, 114–123. [Google Scholar] [CrossRef]
  22. Seidler, N.W.; Jona, I.; Vegh, M.; Martonosi, A. Cyclopiazonic Acid Is a Specific Inhibitor of the Ca-2+-Atpase of Sarcoplasmic-Reticulum. J. Biol. Chem. 1989, 264, 17816–17823. [Google Scholar]
  23. Rangel, D.E.; Finlay, R.D.; Hallsworth, J.E.; Dadachova, E.; Gadd, G.M. Fungal strategies for dealing with environment-and agriculture-induced stresses. Fungal Biol. 2018, 122, 602–612. [Google Scholar] [CrossRef] [Green Version]
  24. Maggon, K.K.; Gupta, S.K.; Venkitasubramanian, T.A. Biosynthesis of aflatoxins. Bacteriol. Rev. 1977, 41, 822–855. [Google Scholar] [CrossRef]
  25. Yu, J.J.; Chang, P.K.; Ehrlich, K.C.; Cary, J.W.; Bhatnagar, D.; Cleveland, T.E.; Payne, G.A.; Linz, J.E.; Woloshuk, C.P.; Bennett, J.W. Clustered pathway genes in aflatoxin biosynthesis. Appl. Environ. Microb. 2004, 70, 1253–1262. [Google Scholar] [CrossRef] [PubMed] [Green Version]
  26. Caceres, I.; Al Khoury, A.; El Khoury, R.; Lorber, S.; Oswald, I.P.; Khoury, A.E.; Atoui, A.; Puel, O.; Bailly, J.D. Aflatoxin Biosynthesis and Genetic Regulation: A Review. Toxins 2020, 12, 150. [Google Scholar] [CrossRef] [PubMed] [Green Version]
  27. Schmidt-Heydt, M.; Geisen, R. A microarray for monitoring the production of mycotoxins in food. Int. J. Food Microbiol. 2007, 117, 131–140. [Google Scholar] [CrossRef] [PubMed]
  28. Baquiao, A.C.; Rodriges, A.G.; Lopes, E.L.; Tralamazza, S.M.; Zorzete, P.; Correa, B. Expression of Genes by Aflatoxigenic and Nonaflatoxigenic Strains of Aspergillus flavus Isolated from Brazil Nuts. Foodborne Pathog. Dis. 2016, 13, 434–440. [Google Scholar] [CrossRef]
  29. Schmidt-Heydt, M.; Magan, N.; Geisen, R. Stress induction of mycotoxin biosynthesis genes by abiotic factors. FEMS Microbiol. Lett. 2008, 284, 142–149. [Google Scholar] [CrossRef] [Green Version]
  30. Schmidt-Heydt, M.; Rufer, C.E.; Abdel-Hadi, A.; Magan, N.; Geisen, R. The production of aflatoxin B1 or G1 by Aspergillus parasiticus at various combinations of temperature and water activity is related to the ratio of aflS to aflR expression. Mycotoxin Res. 2010, 26, 241–246. [Google Scholar] [CrossRef] [Green Version]
  31. Medina, A.; Rodriguez, A.; Magan, N. Effect of climate change on Aspergillus flavus and aflatoxin B1 production. Front. Microbiol. 2014, 5, 348. [Google Scholar] [CrossRef]
  32. Schmidt-Heydt, M.; Abdel-Hadi, A.; Magan, N.; Geisen, R. Complex regulation of the aflatoxin biosynthesis gene cluster of Aspergillus flavus in relation to various combinations of water activity and temperature. Int. J. Food Microbiol. 2009, 135, 231–237. [Google Scholar] [CrossRef] [PubMed] [Green Version]
  33. Keller, N.P.; Nesbitt, C.; Sarr, B.; Phillips, T.D.; Burow, G.B. pH regulation of sterigmatocystin and aflatoxin biosynthesis in Aspergillus spp. Phytopathology 1997, 87, 643–648. [Google Scholar] [CrossRef] [PubMed] [Green Version]
  34. Crosthwaite, S.K.; Dunlap, J.C.; Loros, J.J. Neurospora wc-1 and wc-2: Transcription, photoresponses, and the origins of circadian rhythmicity. Science 1997, 276, 763–769. [Google Scholar] [CrossRef] [PubMed]
  35. Fanelli, F.; Schmidt-Heydt, M.; Haidukowski, M.; Geisen, R.; Logrieco, A.; Mulè, G. Influence of light on growth, fumonisin biosynthesis and FUM1 gene expression by Fusarium proliferatum. Int. J. Food Microbiol. 2012, 153, 148–153. [Google Scholar] [CrossRef] [PubMed]
  36. Fanelli, F.; Geisen, R.; Schmidt-Heydt, M.; Logrieco, A.; Mulè, G. Light regulation of mycotoxin biosynthesis: New perspectives for food safety. World Mycotoxin J. 2016, 9, 129–146. [Google Scholar] [CrossRef]
  37. Igbalajobi, O.; Yu, Z.; Fischer, R. Red-and Blue-Light Sensing in the Plant Pathogen Alternaria alternata Depends on Phytochrome and the White-Collar Protein LreA. mBio 2019, 10, e00371-19. [Google Scholar] [CrossRef] [Green Version]
  38. Schmidt-Heydt, M.; Rüfer, C.; Raupp, F.; Bruchmann, A.; Perrone, G.; Geisen, R. Influence of light on food relevant fungi with emphasis on ochratoxin producing species. Int. J. Food Microbiol. 2011, 145, 229–237. [Google Scholar] [CrossRef]
  39. Suzuki, T. Light-Irradiation Wavelength and Intensity Changes Influence Aflatoxin Synthesis in Fungi. Toxins 2018, 10, 31. [Google Scholar] [CrossRef] [Green Version]
  40. Aziz, N.; Moussa, L. Influence of white light, near-UV irradiation and other environmental conditions on production of aflatoxin B1 by Aspergillus flavus and ochratoxin A by Aspergillus ochraceus. Food Nahr. 1997, 41, 150–154. [Google Scholar] [CrossRef]
  41. Yu, Z.; Fischer, R. Light sensing and responses in fungi. Nat. Rev. Microbiol. 2019, 17, 25–36. [Google Scholar] [CrossRef]
  42. Stoll, D.; Schmidt-Heydt, M.; Geisen, R. Differences in the regulation of ochratoxin A by the HOG pathway in Penicillium and Aspergillus in response to high osmolar environments. Toxins 2013, 5, 1282–1298. [Google Scholar] [CrossRef] [PubMed] [Green Version]
  43. Schmidt-Heydt, M.; Stoll, D.A.; Mrohs, J.; Geisen, R. Intraspecific variability of HOG1 phosphorylation in Penicillium verrucosum reflects different adaptation levels to salt rich habitats. Int. J. Food Microbiol. 2013, 165, 246–250. [Google Scholar] [CrossRef] [PubMed]
  44. Graf, E.; Schmidt-Heydt, M.; Geisen, R. HOG MAP kinase regulation of alternariol biosynthesis in Alternaria alternata is important for substrate colonization. Int. J. Food Microbiol. 2012, 157, 353–359. [Google Scholar] [CrossRef]
  45. Liu, W.; Soulie, M.C.; Perrino, C.; Fillinger, S. The osmosensing signal transduction pathway from Botrytis cinerea regulates cell wall integrity and MAP kinase pathways control melanin biosynthesis with influence of light. Fungal Genet. Biol. 2011, 48, 377–387. [Google Scholar] [CrossRef] [PubMed]
  46. Magan, N.; Cayley, G.R.; Lacey, J. Effect of Water Activity and Temperature on Mycotoxin Production by Alternaria-Alternata in Culture and on Wheat-Grain. Appl. Environ. Microb. 1984, 47, 1113–1117. [Google Scholar] [CrossRef] [Green Version]
  47. Schmidt-Heydt, M.; Bode, H.; Raupp, F.; Geisen, R. Influence of light on ochratoxin biosynthesis by Penicillium. Mycotoxin Res. 2010, 26, 1–8. [Google Scholar] [CrossRef] [PubMed]
  48. Gibson, A.M.; Baranyi, J.; Pitt, J.I.; Eyles, M.J.; Roberts, T.A. Predicting fungal growth: The effect of water activity on Aspergillus flavus and related species. Int. J. Food Microbiol. 1994, 23, 419–431. [Google Scholar] [CrossRef]
  49. Sandven, P. Does the mycotoxin citrinin function as a sun protectant in conidia from Penicillium verrucosum. Mycopathologia 1998, 142, 43–47. [Google Scholar]
  50. Schmidt-Heydt, M.; Stoll, D.; Schütz, P.; Geisen, R. Oxidative stress induces the biosynthesis of citrinin by Penicillium verrucosum at the expense of ochratoxin. Int. J. Food Microbiol. 2015, 192, 1–6. [Google Scholar] [CrossRef]
  51. Bennett, J.; Fernholz, F.; Lee, L. Effect of light on aflatoxins, anthraquinones, and sclerotia in Aspergillus flavus and A. parasiticus. Mycologia 1978, 70, 104–116. [Google Scholar] [CrossRef]
  52. Joffe, A.; Lisker, N. Effects of light, temperature, and pH value on aflatoxin production in vitro. Appl. Environ. Microbiol. 1969, 18, 517–518. [Google Scholar] [CrossRef]
  53. Plotnikov, V.K.; Bakaldina, N.B.; Novikov, B.N.; Alekseenko, Z.V.; Bibishev, V.; Polezhaev, S.L.; Riadchikov, V.G. Post-transcriptional regulation of gene expression in eukaryotes: Effect of stressors on mRNA stability in vitro. Genetika 1998, 34, 1205–1211. [Google Scholar]
  54. Liebhaber, S.A. mRNA stability and the control of gene expression. Nucleic Acids Symp. Ser. 1997, 36, 29–32. [Google Scholar]
  55. Abdel-Hadi, A.; Schmidt-Heydt, M.; Parra, R.; Geisen, R.; Magan, N. A systems approach to model the relationship between aflatoxin gene cluster expression, environmental factors, growth and toxin production by Aspergillus flavus. J. R. Soc. Interface 2012, 9, 757–767. [Google Scholar] [CrossRef] [PubMed] [Green Version]
  56. Bayram, O.; Feussner, K.; Dumkow, M.; Herrfurth, C.; Feussner, I.; Braus, G.H. Changes of global gene expression and secondary metabolite accumulation during light-dependent Aspergillus nidulans development. Fungal Genet. Biol. 2016, 87, 30–53. [Google Scholar] [CrossRef] [Green Version]
  57. Fanelli, F.; Schmidt-Heydt, M.; Haidukowski, M.; Geisen, R.; Logrieco, A.; Mulé, G. Influence of light on growth, conidiation and the mutual regulation of fumonisin B2 and ochratoxin A biosynthesis by Aspergillus niger. World Mycotoxin J. 2012, 5, 169–176. [Google Scholar] [CrossRef]
  58. Jayashree, T.; Subramanyam, C. Oxidative stress as a prerequisite for aflatoxin production by Aspergillus parasiticus. Free Radic. Biol. Med. 2000, 29, 981–985. [Google Scholar] [CrossRef]
  59. Sies, H. Hydrogen peroxide as a central redox signaling molecule in physiological oxidative stress: Oxidative eustress. Redox Biol. 2017, 11, 613–619. [Google Scholar] [CrossRef] [PubMed]
  60. Santosa, S.; Jones, P.J.H. Ophthalmology-Oxidative stress in ocular disease: Does lutein play a protective role? Can. Med. Assoc. J. 2005, 173, 861–862. [Google Scholar] [CrossRef] [PubMed] [Green Version]
  61. Narasaiah, K.V.; Sashidhar, R.B.; Subramanyam, C. Biochemical analysis of oxidative stress in the production of aflatoxin and its precursor intermediates. Mycopathologia 2006, 162, 179–189. [Google Scholar] [CrossRef] [PubMed]
  62. Boettger, D.; Hertweck, C. Molecular diversity sculpted by fungal PKS–NRPS hybrids. ChemBioChem 2013, 14, 28–42. [Google Scholar] [CrossRef] [PubMed]
  63. Miraglia, M.; Marvin, H.; Kleter, G.; Battilani, P.; Brera, C.; Coni, E.; Cubadda, F.; Croci, L.; De Santis, B.; Dekkers, S.; et al. Climate change and food safety: An emerging issue with special focus on Europe. Food Chem. Toxicol. 2009, 47, 1009–1021. [Google Scholar] [CrossRef] [PubMed]
Figure 1. (a) Phenotypic growth of the analyzed Aspergillus isolates dependent on different combinations of light and water activity. (b) Growth rates of the analyzed Aspergillus isolates dependent on different combinations of light and water activity. Standard deviations are given for each parameter. * = The growth was significantly reduced in relation to the control (dark).
Microorganisms 08 02000 g001aMicroorganisms 08 02000 g001b
Figure 2. Aflatoxin B1 (a) and B2 (b) formation by Aspergillus flavus MRI19; aflatoxin B1 (c) and B2 (d) formation by Aspergillus parasiticus BFE84, dependent on different combinations of light and water activity. No aflatoxin was detectable in the case of A. parasiticus BFE84 under white light, aw 0.98 and aw 0.95; green light and aw 0.95; and blue/royal blue light. Standard deviations are given for each parameter. * = The toxin production was significantly reduced in relation to the control (dark). For B2-aflatoxins the measured values were too low for statistical significance analysis.
Microorganisms 08 02000 g002aMicroorganisms 08 02000 g002b
Figure 3. Aflatoxin G1 (a) and G2 (b) formation by Aspergillus parasiticus BFE84, dependent on different combinations of light and water activity. No aflatoxin formation was detectable under white light, aw 0.98 and aw 0.95; green light and aw 0.95; and blue/royal blue light. Standard deviations are given for each parameter. The measured values were too low for statistical significance analysis.
Microorganisms 08 02000 g003
Figure 4. Cyclopiazonic Acid (CPA) formation in the analyzed Aspergillus isolates, dependent on different combinations of light and water activity. No CPA was detectable on day 10 by MRI19 and BFE84 under white light at aw 0.98, aw 0.95 and green light at aw 0.95 and blue/royal blue light. Standard deviations are given for each parameter. The measured values were too low for statistical significance analysis.
Microorganisms 08 02000 g004
Figure 5. Expression of the pksA gene over 3 days in the analyzed Aspergillus isolates, dependent on different combinations of light and water activity. * = The gene expression was significantly reduced in relation to the control (dark).
Microorganisms 08 02000 g005
Figure 6. Expression of the cpaA PKS-NRPS gene over 3 days in the analyzed Aspergillus isolates, dependent on different combinations of light and water activity. * = The gene expression was significantly reduced in relation to the control (dark).
Microorganisms 08 02000 g006
Publisher’s Note: MDPI stays neutral with regard to jurisdictional claims in published maps and institutional affiliations.

