1. Introduction
Enterohemorrhagic
Escherichia coli (EHEC) O157:H7 is a clinically important foodborne and waterborne pathogen [
1]. Infection with EHEC O157:H7 can lead to a wide range of clinical manifestations, including asymptomatic infections, mild diarrhea, or severe diseases such as hemorrhagic colitis and hemolytic uremic syndrome [
2]. The main virulence factor of EHEC O157:H7, such as the production of Shiga toxins (
Stx), is located on the pathogenicity island and intestinal cell exfoliation site through signal transduction and close adhesion [
3]. The pathogenic mechanism of EHEC O157:H7 is mediated by a series of effectors which are secreted by encoding the translocated intimin receptor (Tir), bacterial encoded receptor, as well as Type III secretory system [
4]. Historically, serotype O157 has been the most investigated, even though other serotypes have been involved in several epidemic situations. Between 1978 and 2006, a large number of cases of EHEC O157:H7 infection were reported in Japan, Germany, the United States, and China [
5,
6,
7]. Until now, standardized procedures to detect the presence of these pathogens in food samples have depended on microbiological culturing methods, taking five days to get results [
8]. Meanwhile, the traditional culture-based methods usually include an agglutination assay (detecting the O157 or H7 antigen) that is not specific, since the O157 and H7 antigens exist in other
E. coli species. These antibodies can also cross-react with other
E. coli serotypes and other members of the Enterobacteriaceae family [
9]. In order to reduce the analysis time and improve the rapid, sensitive, and specific detection of pathogens, alternative techniques like molecular methods have been applied for detection from various sample types [
10].
General PCR is based on the amplification of species-specific genes or genes related to pathogenicity or virulence. The pathogenic
E. coli O157:H7 contamination in samples can be rapidly detected together with the results of gel electrophoresis [
11]. Recently, the detection of viable but non-culturable (VBNC)
E. coli O157:H7 in food products and raw materials [
12,
13] was accomplished by propidium monoazide (PMA)-PCR techniques when samples were preprocessed with PMA, which passed through the cell membrane of dead bacteria and forms covalent carbon-nitrogen bonds with intracellular DNA, and allowed for the determination of dead bacterial DNA [
14]. Moreover, real-time PCR is widely applied for bacterial detection and quantification of the initial target DNA of foodborne pathogens [
15,
16]. Unfortunately, amplification efficiencies can be inhibited due to the presence of inhibitory factors, including food matrix residues, organic solvents from DNA extraction, or other unknown factors. Even when using external controls, quantification doesn’t always provide the correct calculation of the initial target in each sample. The risk of false-negative results is still one limitation that cannot be ignored [
17]. To address this problem, the relevant literature reported that the minimum detection limit was reduced to 5 CFU/g by removing possible PCR inhibitors using activated carbon coated with bentonite [
18]. However, it is not known whether the introduction of new substances has an effect on the accuracy of the detection limit. To eliminate this drawback, another nucleic acid sequence was suggested to serve as an internal amplification control (IAC) to monitor amplification processes during PCR and to distinguish false-negatives from true-negative results [
19,
20].
In this study, firstly, a real-time fluorescent PCR-IAC-based method was performed for the specific detection of E. coli O157:H7. The applicability of the method was determined with respect to sensitivity and accuracy. Secondly, a competitive internal amplification control (IAC) system, which shared the same primer (a compound primer containing target genes) was constructed to eliminate false negative results. Its influence on the sensitivity, precision and accuracy was respectively evaluated. Finally, the applicability of the quantification of initial target DNA using the real-time fluorescent PCR-IAC-based method was investigated in artificially contamination-simulated water samples, and both the quantification threshold and detection limit of E. coli O157:H7 were evaluated.
2. Materials and Methods
2.1. Design of Primers and TaqMan Probes
The target gene used in this experiment is based on the highly conserved
rfbE gene in
E. coli O157:H7. The primer sequence was designed by Primer premier 5.0 software (
http://www.premierbiosoft.com/primerdesign/). PCR amplification products were submitted to electrophoresis on 2% agarose gel (Gene Tech, Co., Ltd., Shanghai, China) with 158 bp ladder and visualized by Golden view staining (Sigma, America). In addition, with regard to the selection of TaqMan probes, the molecular beacons employed a double labeled probe which included 5’ end tagged reporter group with 6-carboxy-fluorescein (FAM) and 3’ end labeled quenching group BHQ
1. The TaqMan probe D-P (5′ TGCAGATAAACTCATCGAAACAAGGCC 3′) of the
rfbE gene was designed to specifically hybridize to the
rfbE-coding DNA at 56.8 °C up to 64.8 °C, and was labeled at the 5′ end with FAM and at the 3′ end with BHQ
1. The design principles of TaqMan probe primers are as follows: primarily, the melting temperature of the TaqMan probe is 5–10 degrees higher than that of the primer. Generally speaking, the length of the probe is less than 30 nucleotides. The 5’ end of the probe cannot be base G because the fluorescence signal can be quenched by base G. Further, the optimum GC content ranged from 30% to 80%, and the content of G is higher than that of C. Ultimately, the location of the probe design is as close as possible to the upstream primers.
The sequences of primers and probes for the
hly gene detection of
Listeria monocytogenes were derived from the literature [
21]. Both ends of a 64 bp conserved sequence (
hly gene) were connected with the primer sequence of the
rfbE gene for
E. coli O157:H7 and used to develop an IAC for real-time PCR. The TaqMan probe IAC-P (Cy5-CGCCTGCAAGTCCTAAGACGCCA- BHQ2) was labeled at the 5′ end with Cy5 and at the 3′ end with BHQ
2. Finally, all primers and probes (
Table 1) have been constructed using specific matching and blast analysis at the National Centre for Biotechnology Information (NCBI) (
http://www.ncbi.nlm.nih.gov/blast/) and were synthesized (Stargene, Co., Ltd., Wuhan, China).
2.2. Bacterial Strains and Growth Conditions
The
E. coli O157:H7 (ATCC 43895),
S. aureus (ATCC 13565),
Salmonella (ATCC 13076) and
Listeria monocytogenes (ATCC 19115) strains were kindly provided by the Food Science and Engineering Microbiology Laboratory of Wuhan Institute of Technology. The four kinds of strains were placed in 20% glycerol (Guoyao, Co., Ltd., Shanghai, China) and stored at −80 °C, were inoculated on LB agar medium (OXOID, Britain) by the parallel scribing method [
22], and cultured in a 37 °C incubator for 24 h. Single colonies that grew well on the LB agar medium were picked into LB liquid medium and grown overnight at 37 °C with shaking at 200 rpm, and then a 10-fold dilution series was made ranging from 10
8 CFU/mL down to 10
1 CFU/mL by using LB liquid medium. The bacterial suspension was placed in a refrigerator (Gree, Co., Ltd., Guangdong, China) at 4 °C until used.
2.3. DNA Extraction of E. coli O157:H7
To analyze and compare the influence on the DNA detection sensitivity between routine PCR (BIORAD, Shanghai, China) and fluorescent quantitative PCR (BIORAD, Shanghai, China), two methods—boiling water and a rapid extraction kit for bacterial genomic DNA (Sangon Biotech, Co., Ltd., Shanghai, China) [
23,
24]—were used to extract DNA from
E. coli O157:H7 suspensions.
The DNA extraction by boiling-water procedure used is the following: 1-mL E. coli O157:H7 suspension was centrifuged at 8000× g for 8 min at room temperature. Subsequently, the pellet was resuspended in 2 mM EDTA solution (500 μL) (Shengxiao, Co., Ltd., Zhejiang, China), and thoroughly mixed (2800 rpm for 1 min) until the bottom cells were completely dispersed in the liquid. Thenceforth, the solution was placed in boiling water at 100 °C for 10 min, and then immediately put on ice for 10 min. Finally, the liquid was centrifuged at 10,000× g for 10 min at 4℃ to collect the supernatant. The supernatant was placed in a refrigerator at 4 °C for later use.
As for DNA extraction using the commercial kit (Sangon Biotech, Co., Ltd., Shanghai, China), the procedures were performed according to the protocol supplied by the manufacturer.
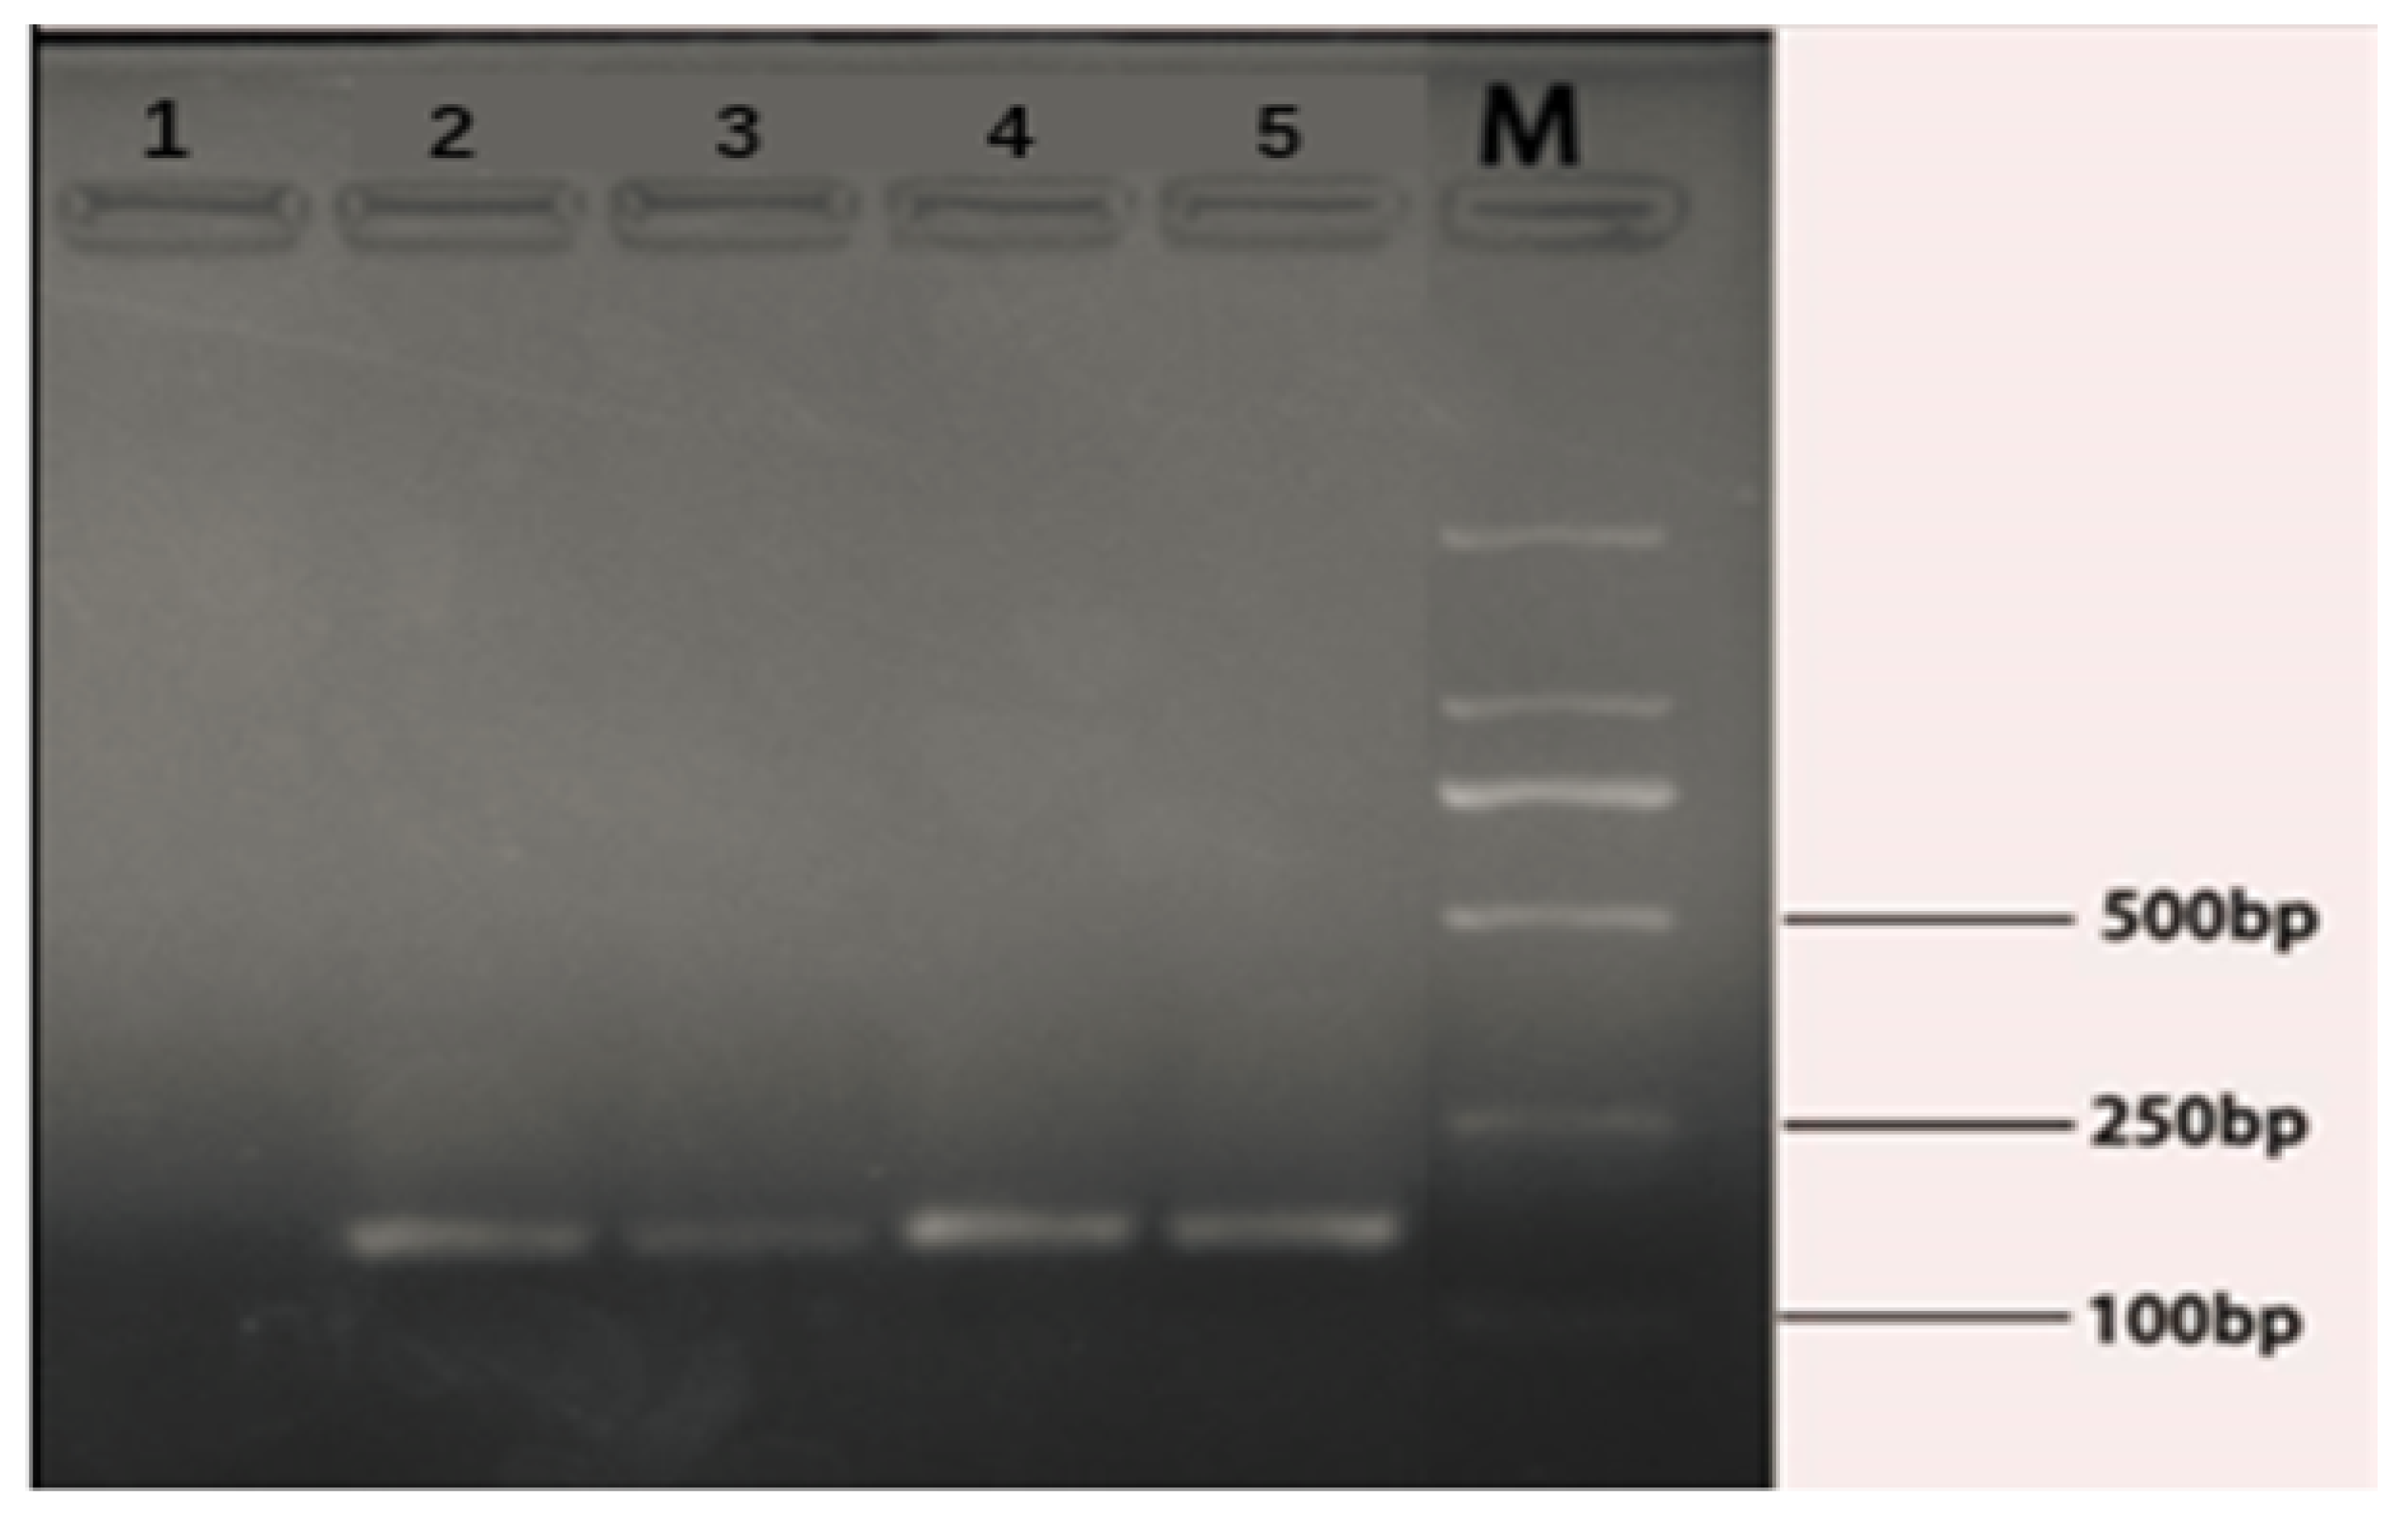
2.4. rfbE Gene Amplification of E. coli O157:H7
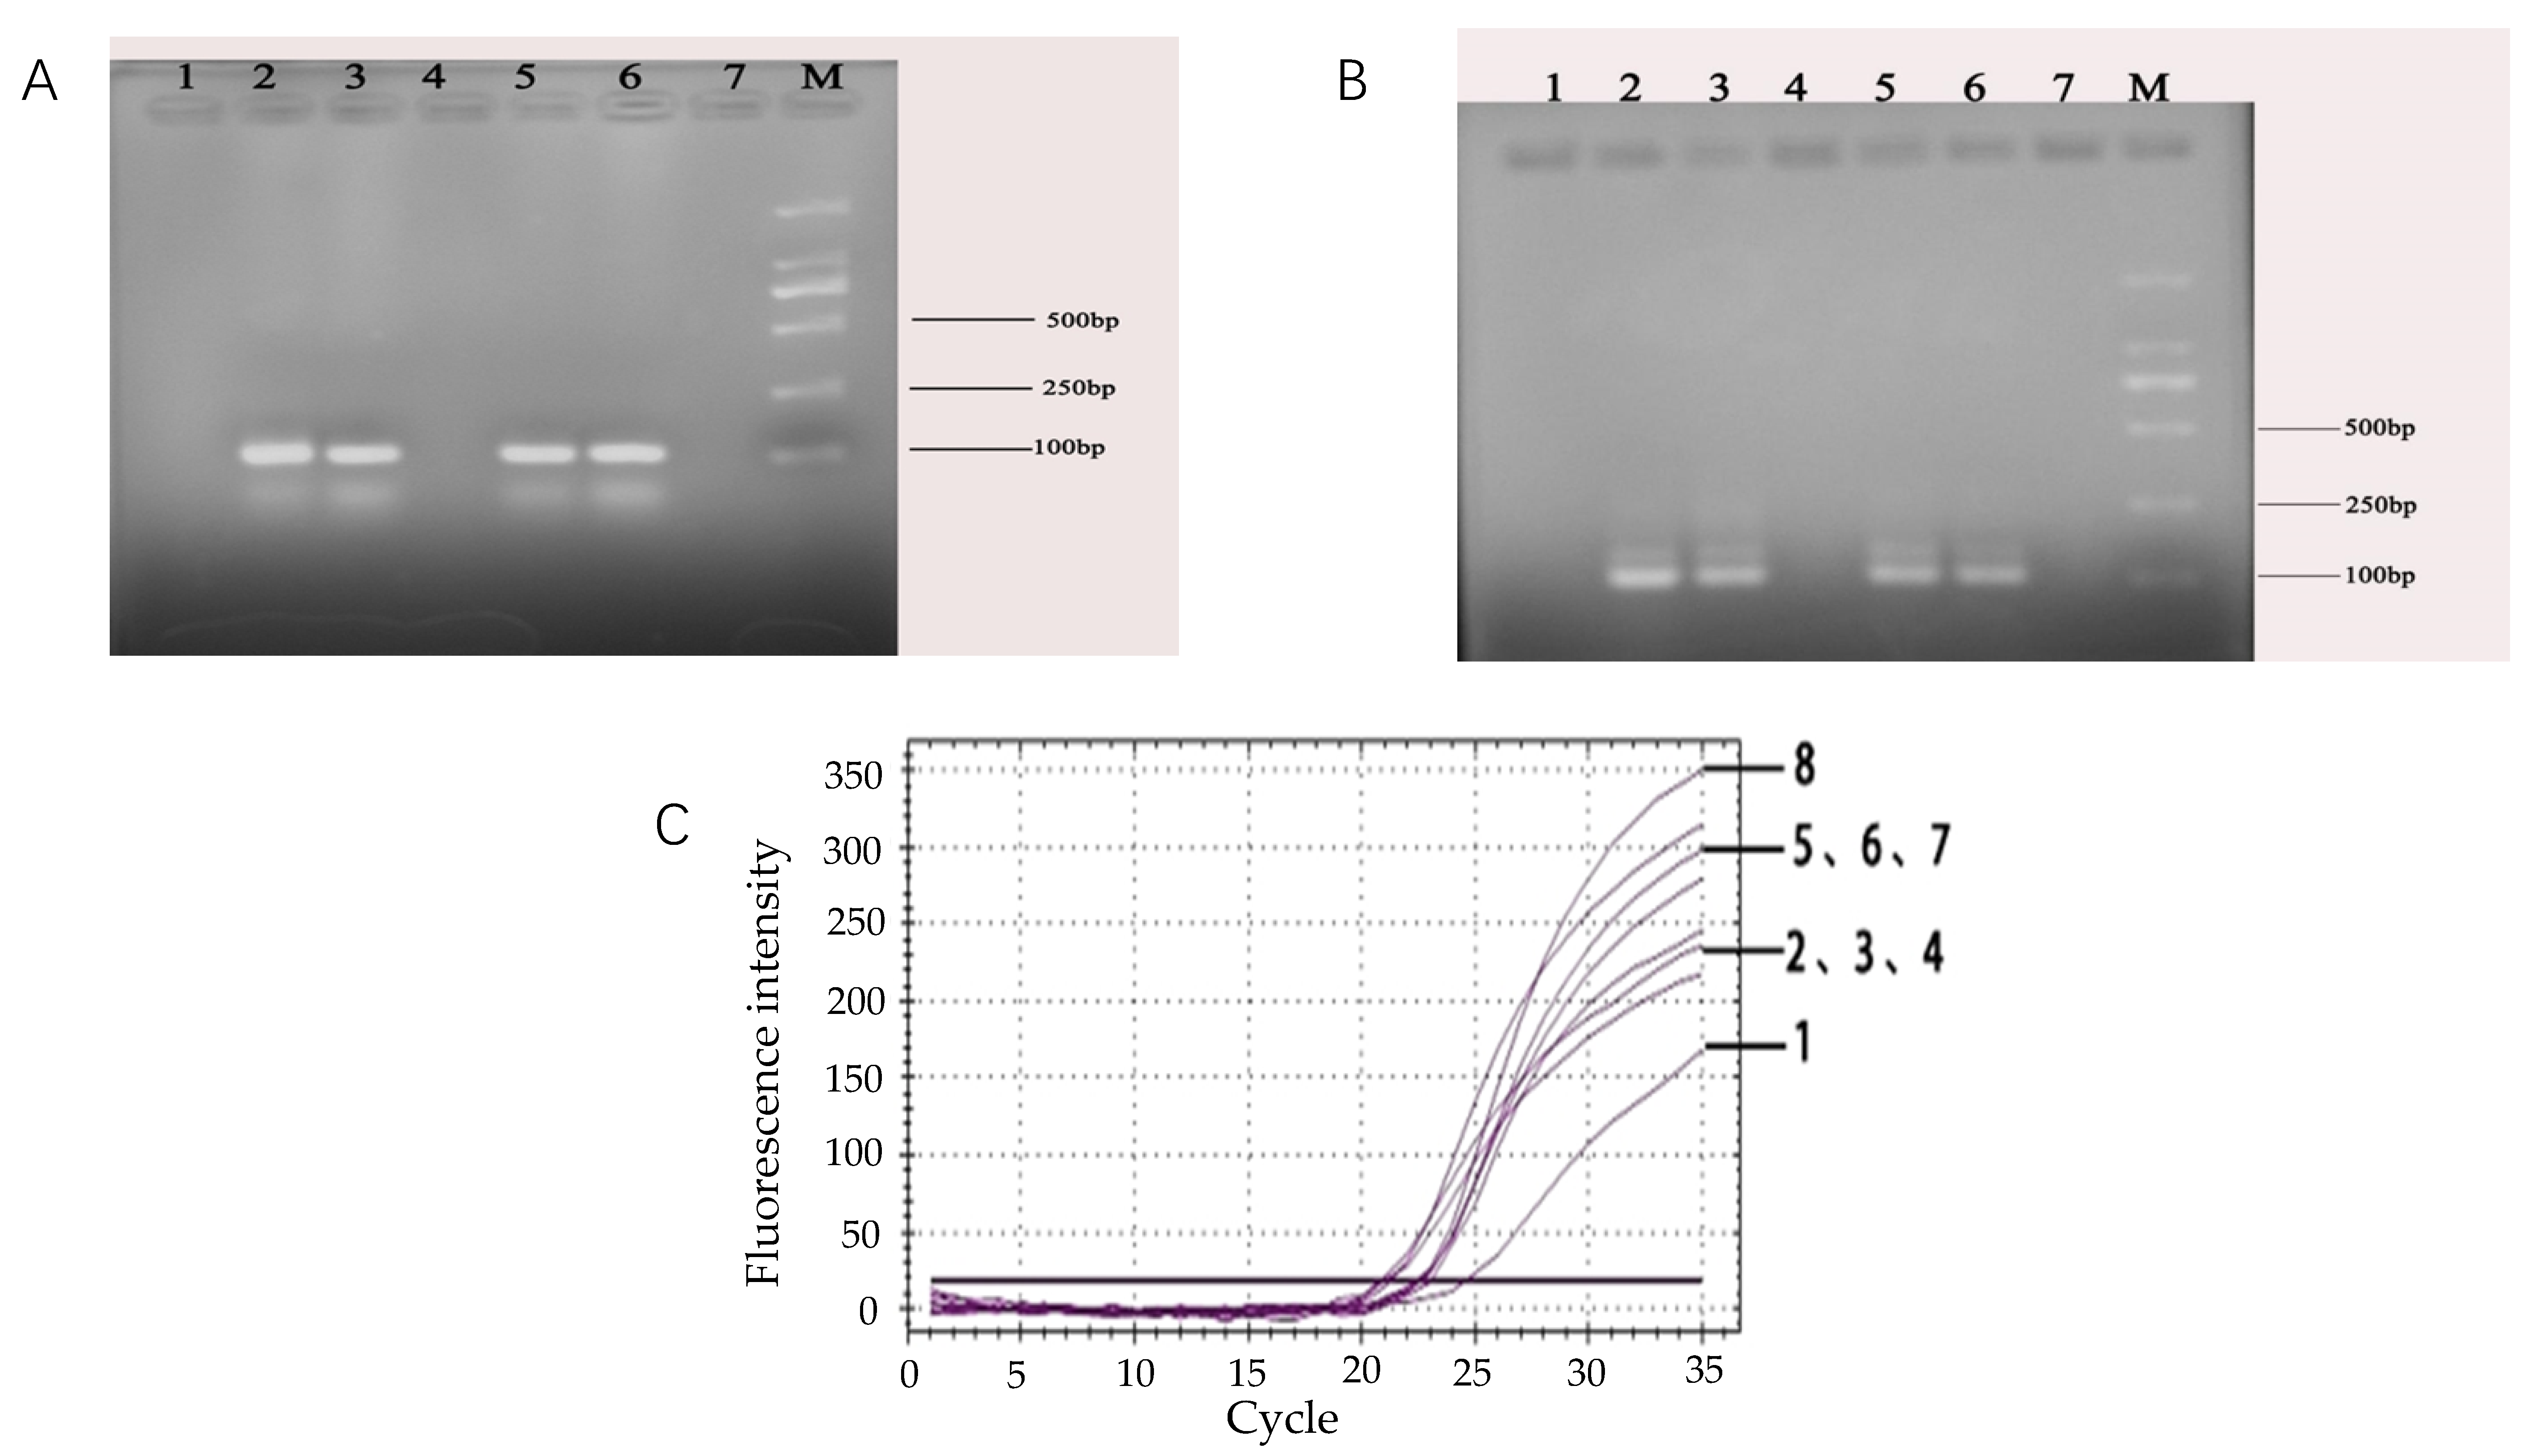
For the feasibility of the designed rfbE gene primers and the amplification production length of the primers, the conventional PCR reaction combined with 2% agarose gel electrophoresis was performed in sterile 0.2 mL eight-strip tubes. Briefly, the synthesized primers were diluted to 10 μM. The PCR reaction system was as follows: 2.0 μL of dNTP, 2.5 μL of 10 × PCR buffer (Mg2+), 0.2 μL of TaqDNA polymerase, 1.0 μL of DNA template, 1.0 μL of the upstream (D-F) and downstream (D-R) primers. The total PCR reaction volume was adjusted to 25 μL with aseptic ultrapure water. The temperature profile of the PCR reaction had an initial denaturation step of 95 °C for 5 min followed by 30 cycles (30 s at 94 °C, 30 s at 60 °C, 30 s at 72 °C) and extended at 72 °C for 6 min in a PCR thermal cycler (BIORAD, Shanghai, China). Then, 2% agarose gel electrophoresis was performed as follows. Firstly, 2% (Wt/Vol) agarose gel was formulated with TAE buffer solution (Dongsheng Biotech, Co., Ltd., Guangdong, China). After heating for 4 min with 2% gel prepared in a TAE buffer solution, the Golden View dye was added at a ratio of 1:20,000 when it was cooled to 60–70 °C. The solution was poured into a glue mold (Liuyi, Co., Ltd., Beijing, China) and cooled down to room temperature. Secondly, The PCR product sample was uniformly mixed with the 5x loading buffer in a ratio of 1:4. Finally, the samples were added into the gel hole, and gel electrophoresis was performed at 90 V for 45 min and visualized under UV light (BIORAD, Shanghai, China).
2.5. Theoretical Evaluation of the Target Gene Probe Performance
The real-time fluorescent PCR reaction was performed in 25 μL of a reaction mixture comprised of the following: 2.0 μL of dNTP, 2.5 μL of 10 x PCR buffer (Mg2+), 0.2 μL of TaqDNA polymerase, 1 μL of template DNA, 0.5 μL of TaqMan probes, 1 μL of the upstream (D-F) and downstream (D-R) primers and 16.8 μL of aseptic ultrapure water. Briefly, the real-time fluorescent PCR reaction was followed by monitoring the fluorescence probe change in real-time and carried out in three steps: initial denaturation at 95 °C for 3 min followed by 40 cycles (20 s at 95 °C, 20 s at 60 °C) and the reaction was extended at 72 °C for 30 s (the ramp speeds of the PCR steps was 0.5 °C/s) in a BIO-RAD CFX series real-time fluorescent PCR instrument (BIORAD, Shanghai, China).
2.6. Optimization of the Real-Time Fluorescent PCR Reaction System
The optimization of conditions was carried out to improve the analytical sensitivity, specificity, as well as to achieve a lower detection limit of the real-time fluorescent PCR reaction. For this purpose, the concentrations of primers and probes, as well as their annealing temperature were optimized as follows.
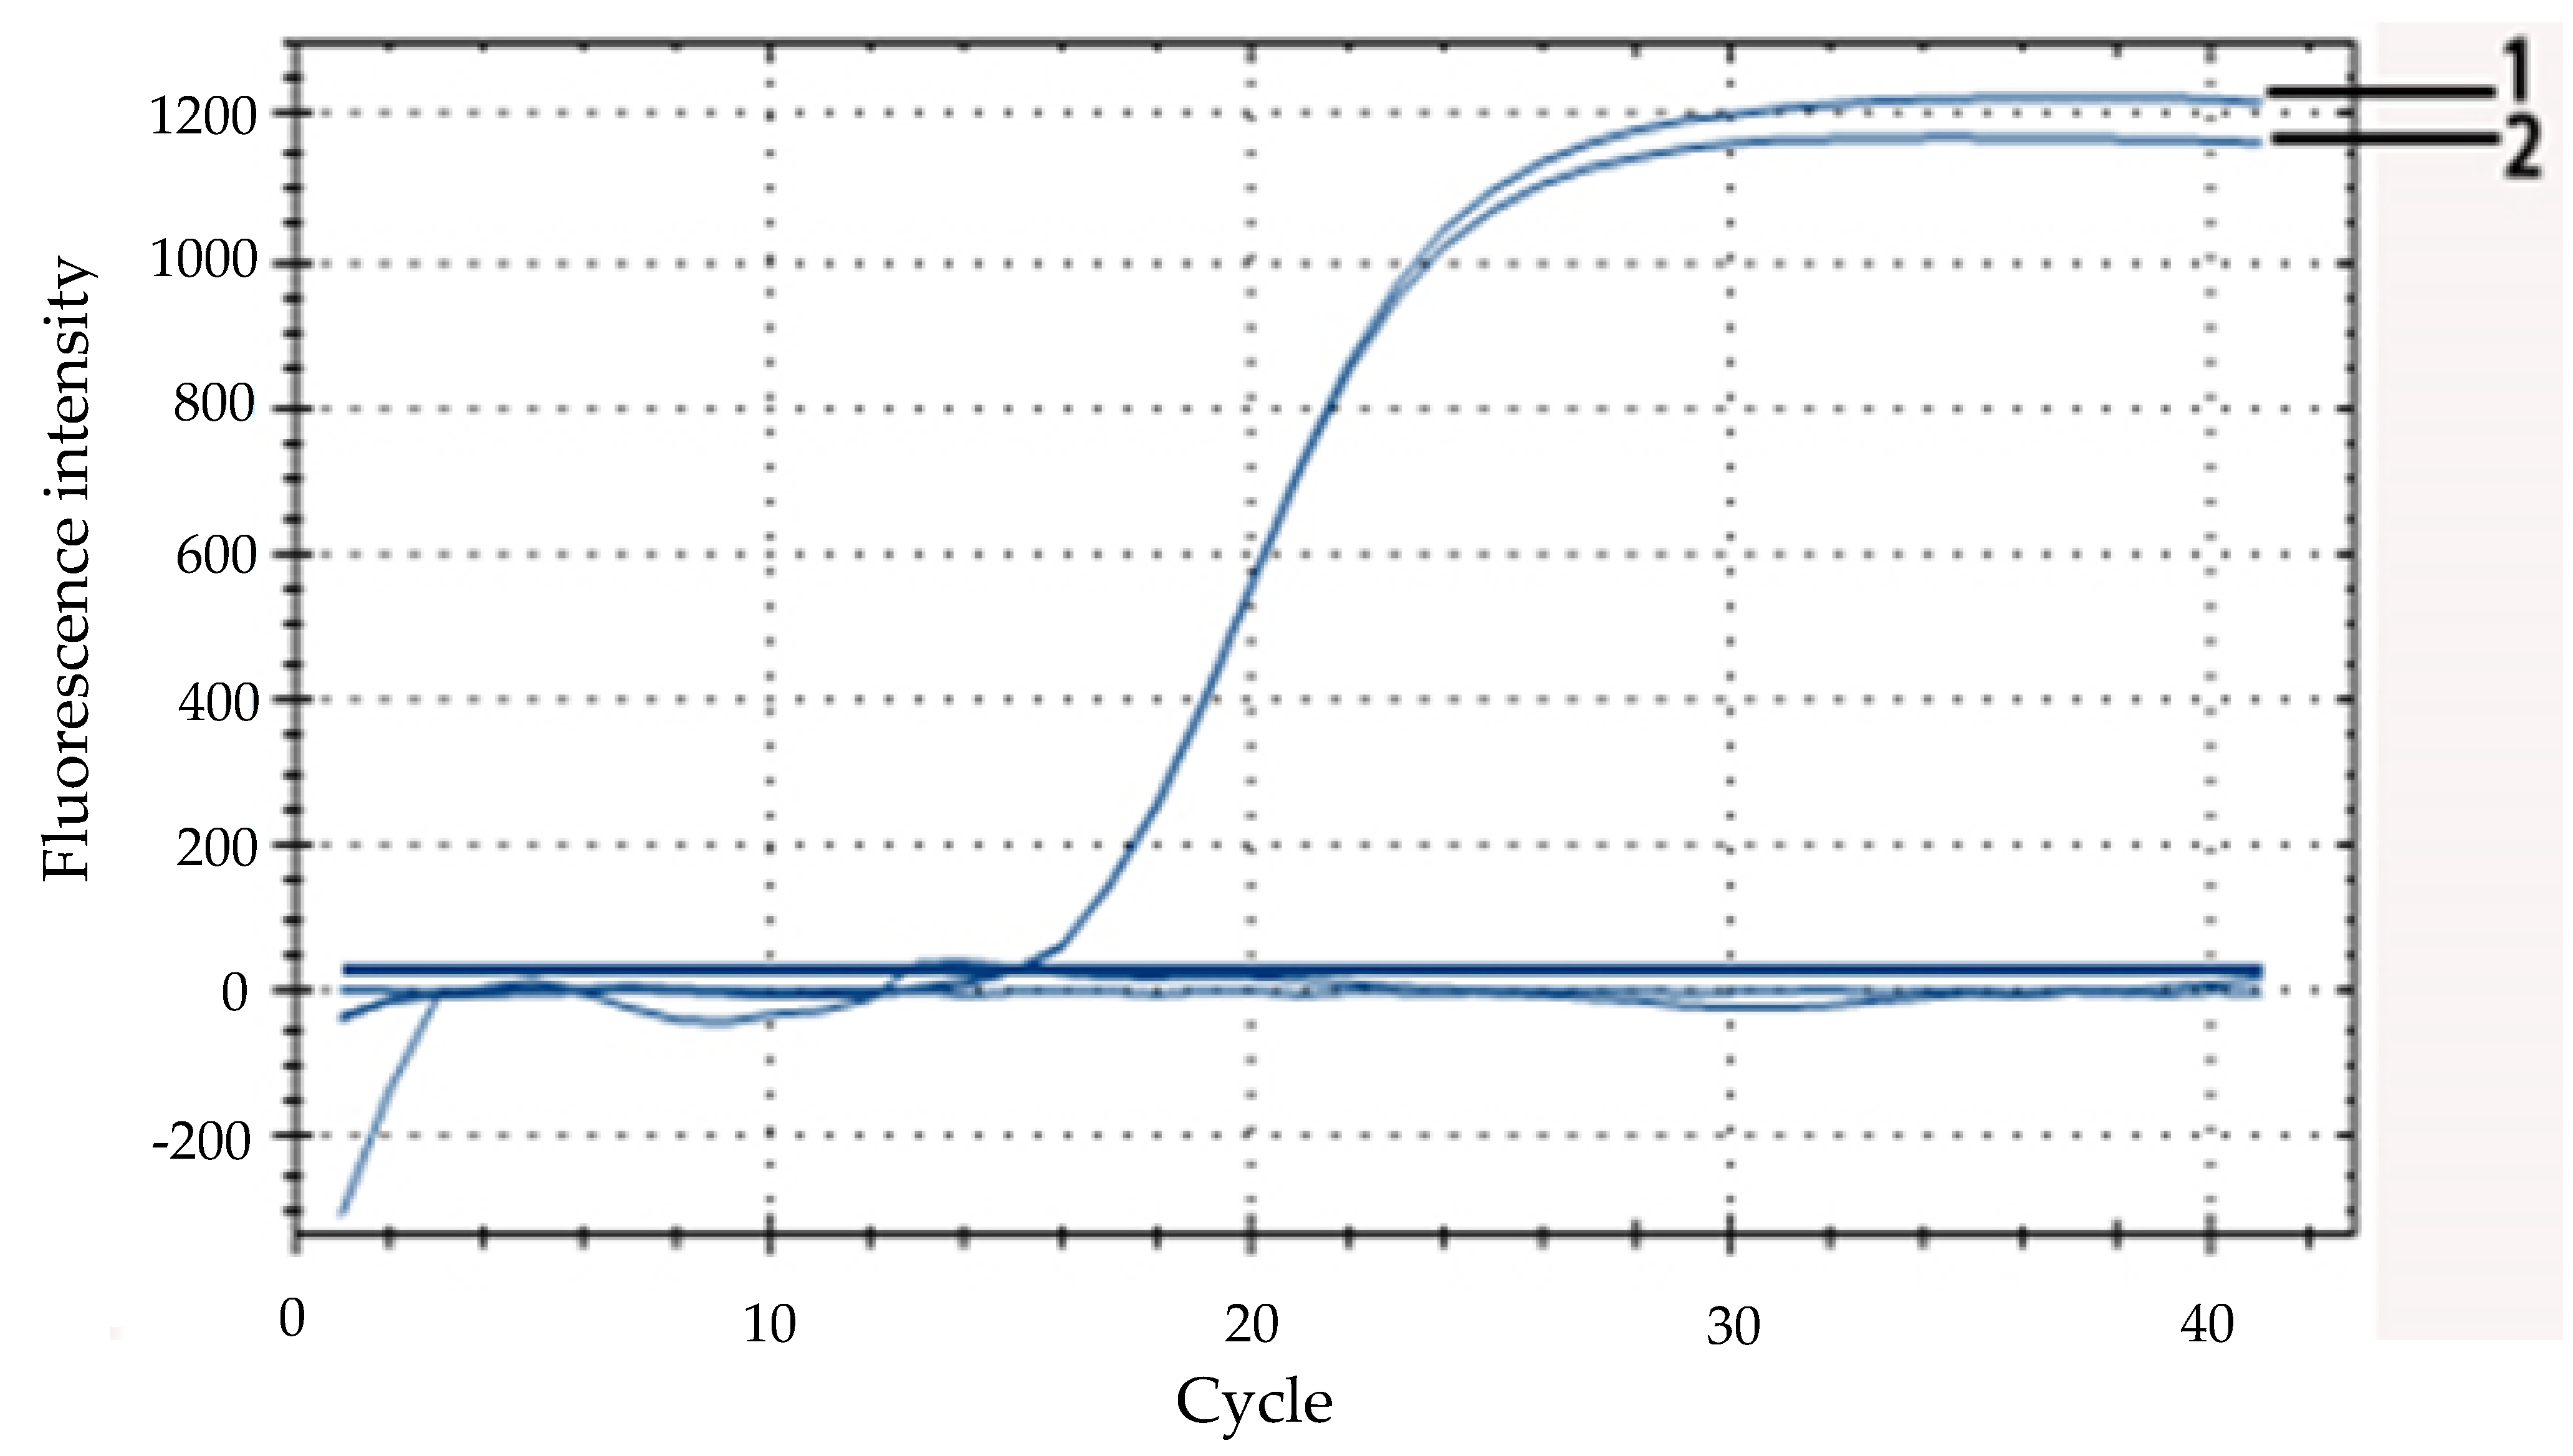
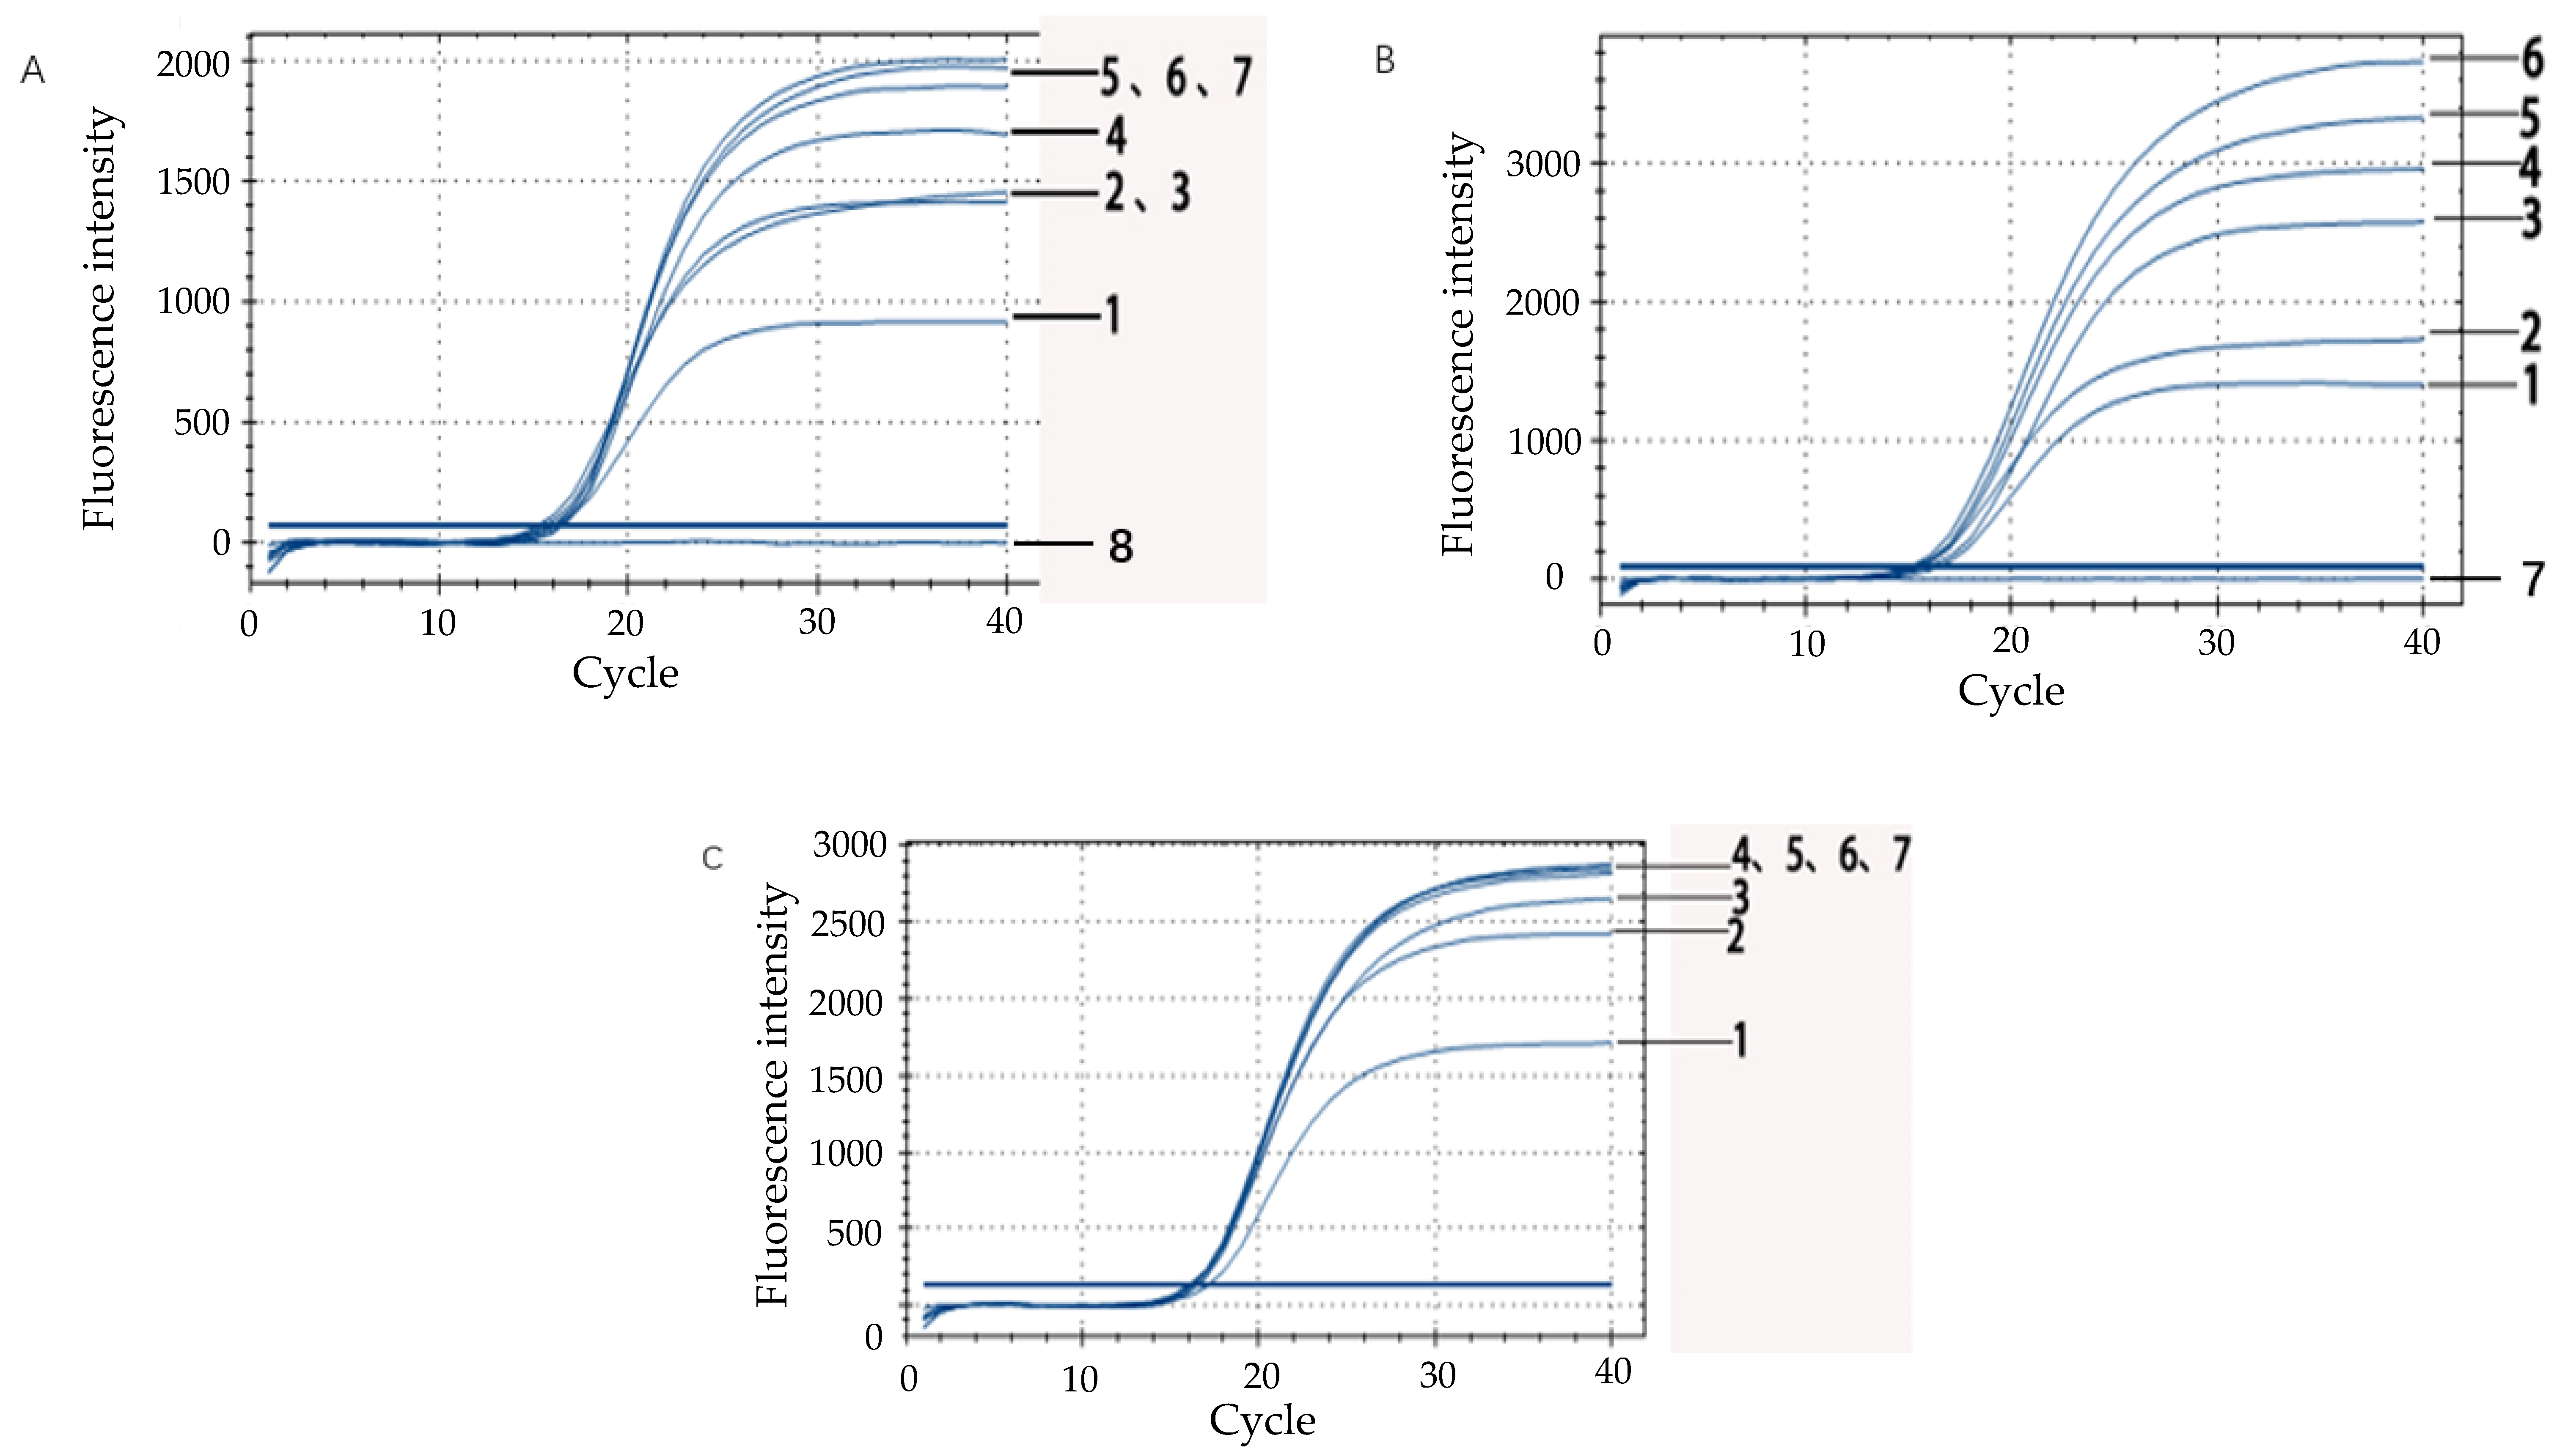
2.6.1. Volume Improvement of Primer Addition
To find the best primer concentration for the real-time fluorescent PCR reaction system, the volume of the TaqMan probe B was determined as 0.5 μL, and A was set as 0.4, 0.6, 0.8, 1.0, 1.2, 1.4, 1.6 in turn. Next, it was well blended with other components (except the primer) shown in
Table 2. At the same time, nuclease-free water instead of DNA extract was used as the no template or negative control. The temperature profile of the real-time fluorescent PCR reaction had an initial denaturation step at 95 °C for 3 min followed by 40 cycles (20 s at 95 °C, 20 s at 60 °C, the ramp speeds of the PCR steps was 0.5 °C/s) and extended at 72 °C for 30 s.
2.6.2. Determination of the TaqMan Probe Dosage
The optimum probe volume of B for the TaqMan probe was evaluated at 0.3, 0.5, 0.7, 0.9, 1.1, and 1.3 μL. Subsequently, the next procedure was consistent with the reaction procedure in
Section 2.6.1.
2.6.3. Annealing Temperature Optimization of the Reaction System
The reaction system was studied with various annealing temperatures (64.8 °C, 64.4 °C, 63.5 °C, 61.9 °C, 60.0 °C, 58.4 °C, 57.3 °C, and 56.8 °C). The DNA template was replaced with aseptic ultrapure water for the negative control. The later processing profile was consistent with temperature profile in
Section 2.6.1.
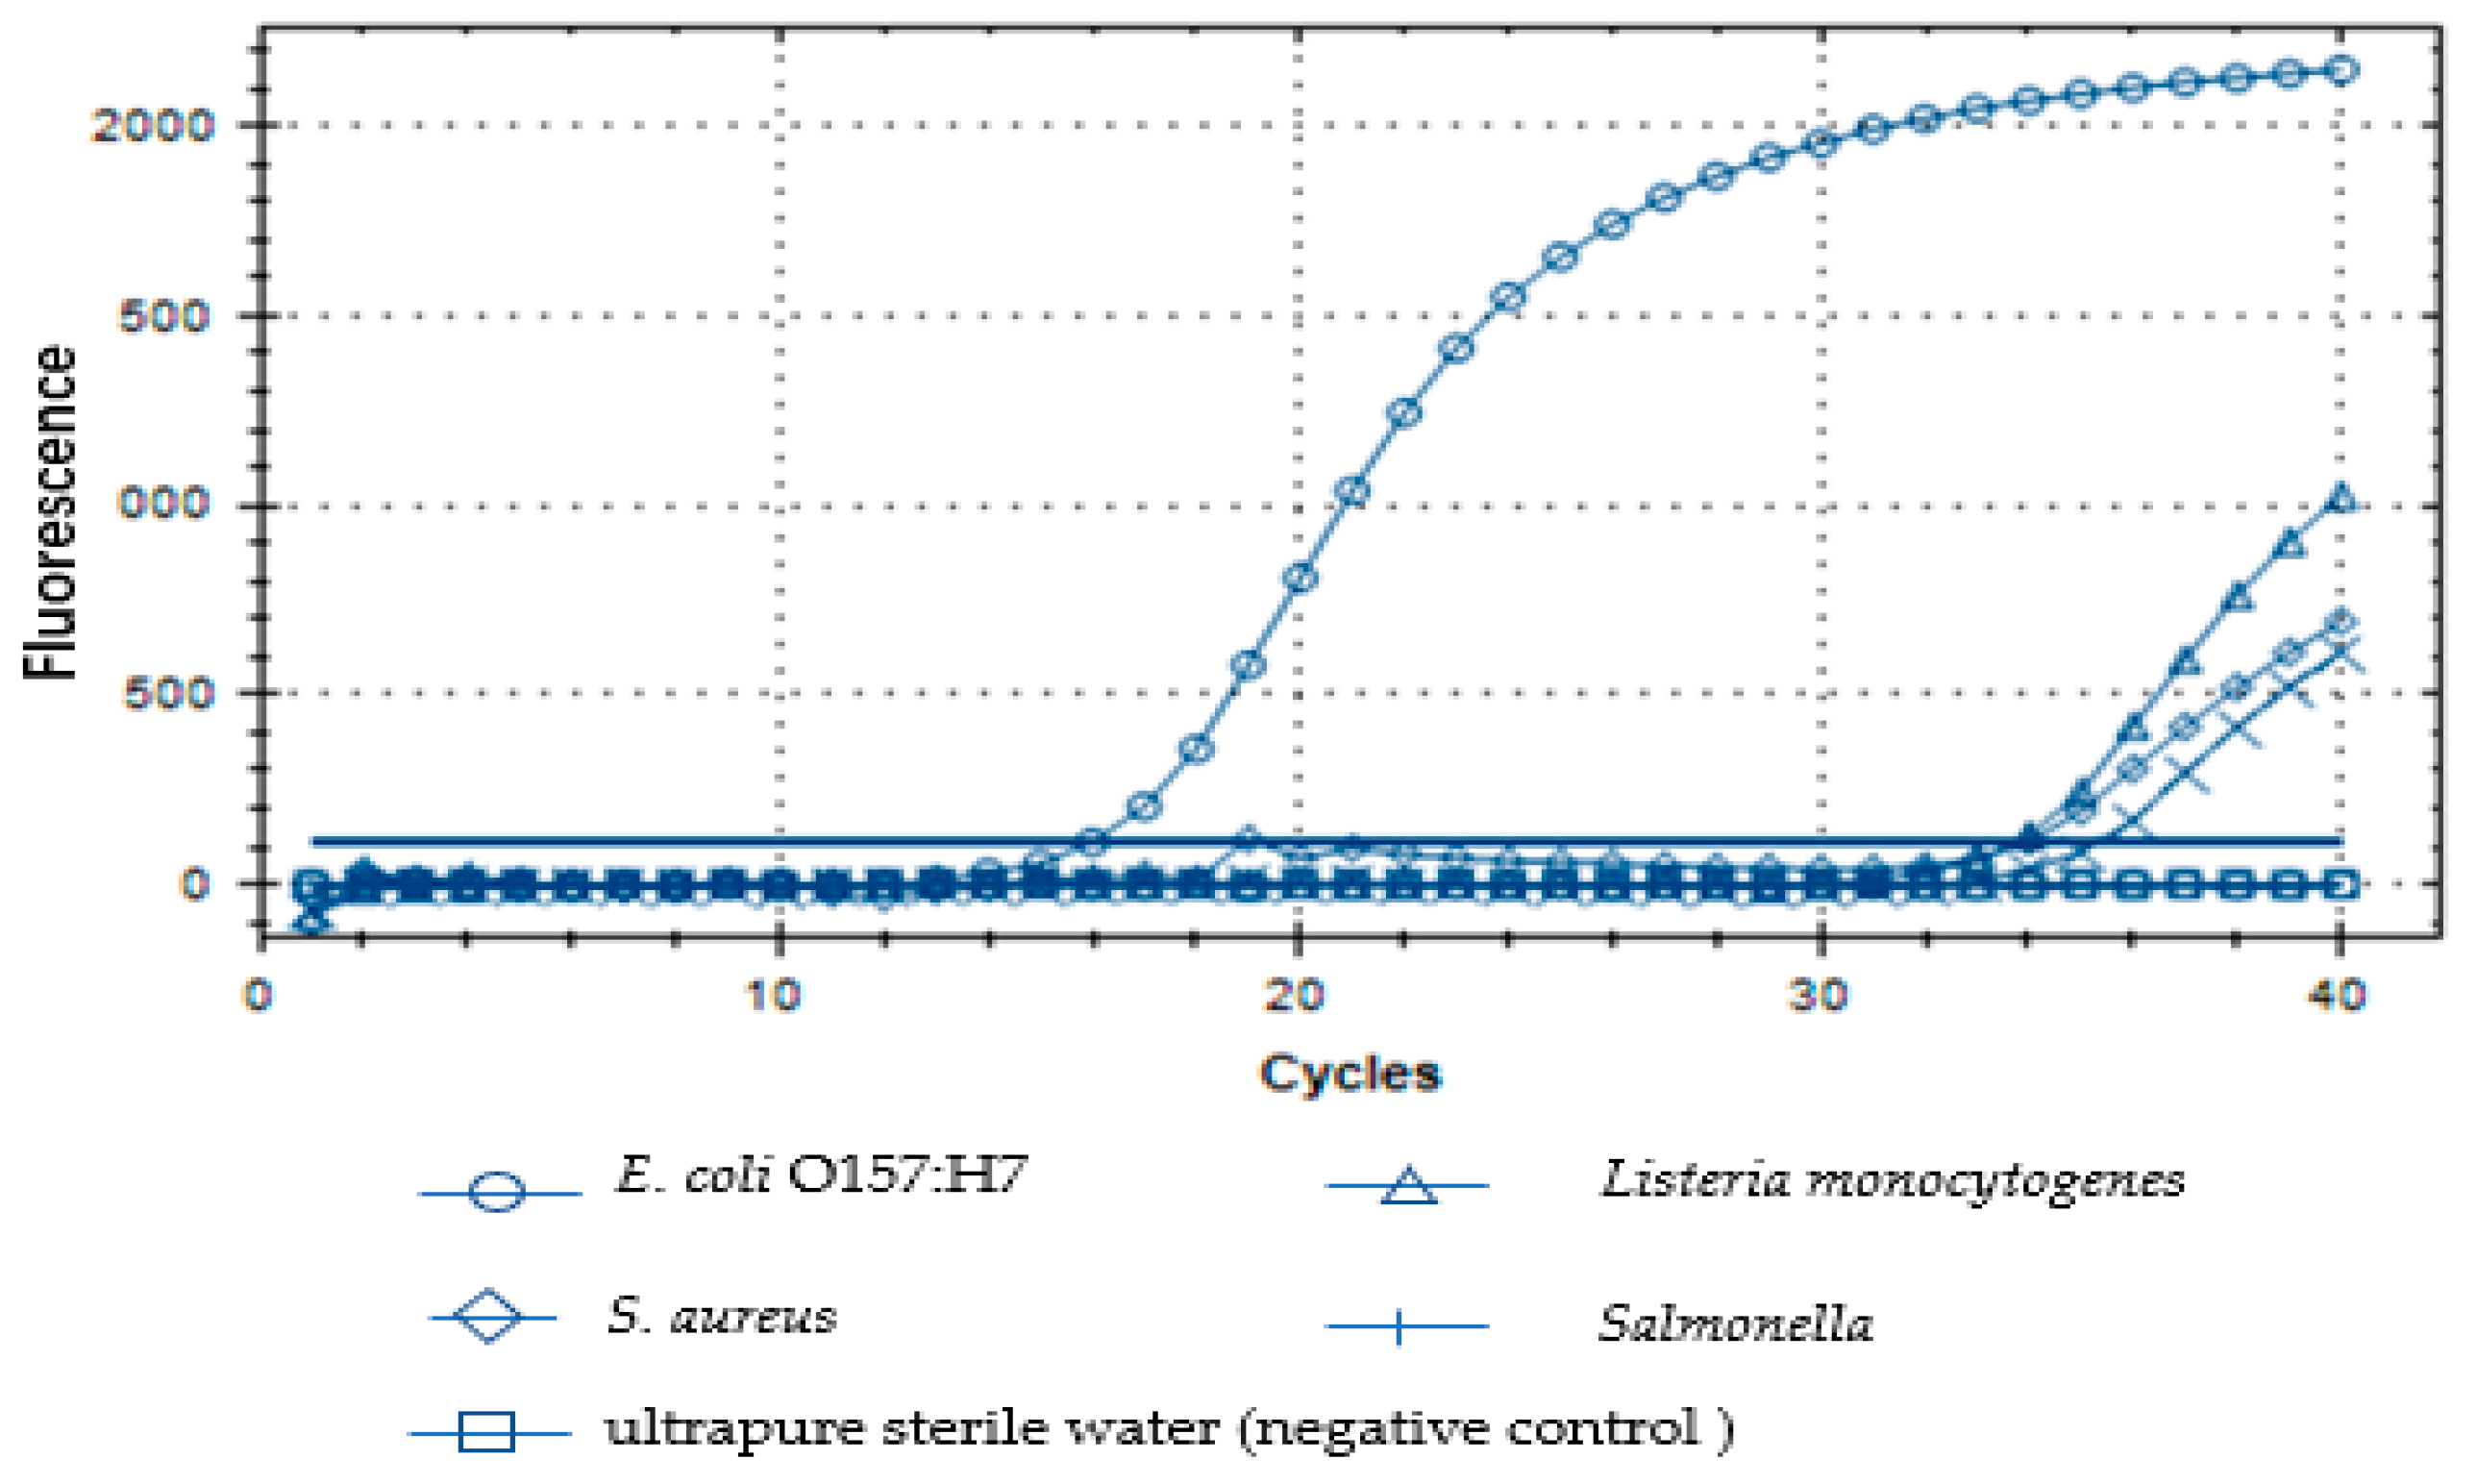
2.7. Assay Specificity of the Target Fragment Primer in Real-Time PCR
The specificity of the designed primers for the target fragment was tested. The primers were used to amplify other bacterial DNA such as E. coli O157:H7, S. aureus, Salmonellas well as Listeria monocytogenes. The specificity of the primers for the target fragment was confirmed by observing the amplification curves. The temperature profile of the real-time fluorescent PCR reaction was set for denaturation at 95 °C for 3 min followed by 40 cycles (20 s at 95 °C, 20 s at 60 °C. the ramp speeds of the PCR steps was 0.5 °C/s) and extended at 72 °C for 30 s.
2.8. Preparation and Optimum Concentration of IAC
The IAC was constructed using PCR as previously reported [
21], and the influence of the amount of IAC was evaluated.
Listeria monocytogenes was cultured overnight in a shaking bed (200 rpm) at 37 °C until the density of bacteria increased to 10
8 CFU/mL. The DNA template was extracted from a 1-mL solution of
Listeria monocytogenes via the boiling method and amplified by PCR. The IAC preparation involved two PCR amplifications [
25]. The first step of PCR amplification employed a total reaction volume of 25 μL: 1 μL of DNA template,2 μL dNTP, 2.5 μL 10x PCR buffer (Mg
2+), 1 μL of the upstream (IAC-F, 10 μmol/L) heterozygous primers, 1 μL of downstream (IAC-R, 10μmol/L) heterozygous primers. The PCR reaction conditions used were a denaturation step at 94 °C for 5 min, followed by 30 cycles (94 °C for 30 s, 60 °C for 30 s, 72 °C for 30 s) and extended at 72 °C for 6 min. The amplicon obtained from the first PCR was recovered following gel electrophoresis and purified by a DNA gel extraction kit according to the kit instructions. The second step of PCR amplification was to dilute the purified product from the first step at a ratio of 1:1000 with nuclease-free water. The diluted product (3 μL) was further amplified by PCR reaction. The procedure of the second PCR reaction, which confirmed that the first round of PCR product (hybrid DNA) contained the target primers [
26], was the same as that of the first step PCR.
To select the smallest amount of positive fluorescence signals, the artificially created DNA was used as an internal amplification control (IAC) in every reaction mixture. The different volumes of IAC (0.3 μL, 0.6 μL, 0.9μL, 1.0 μL, 1.2 μL, 1.5 μL, 1.8 μL, and 2.1 μL) were added to the reaction system which did not contain the E. coli O157:H7 DNA. The IAC was detected by the real-time PCR assay using the probe.
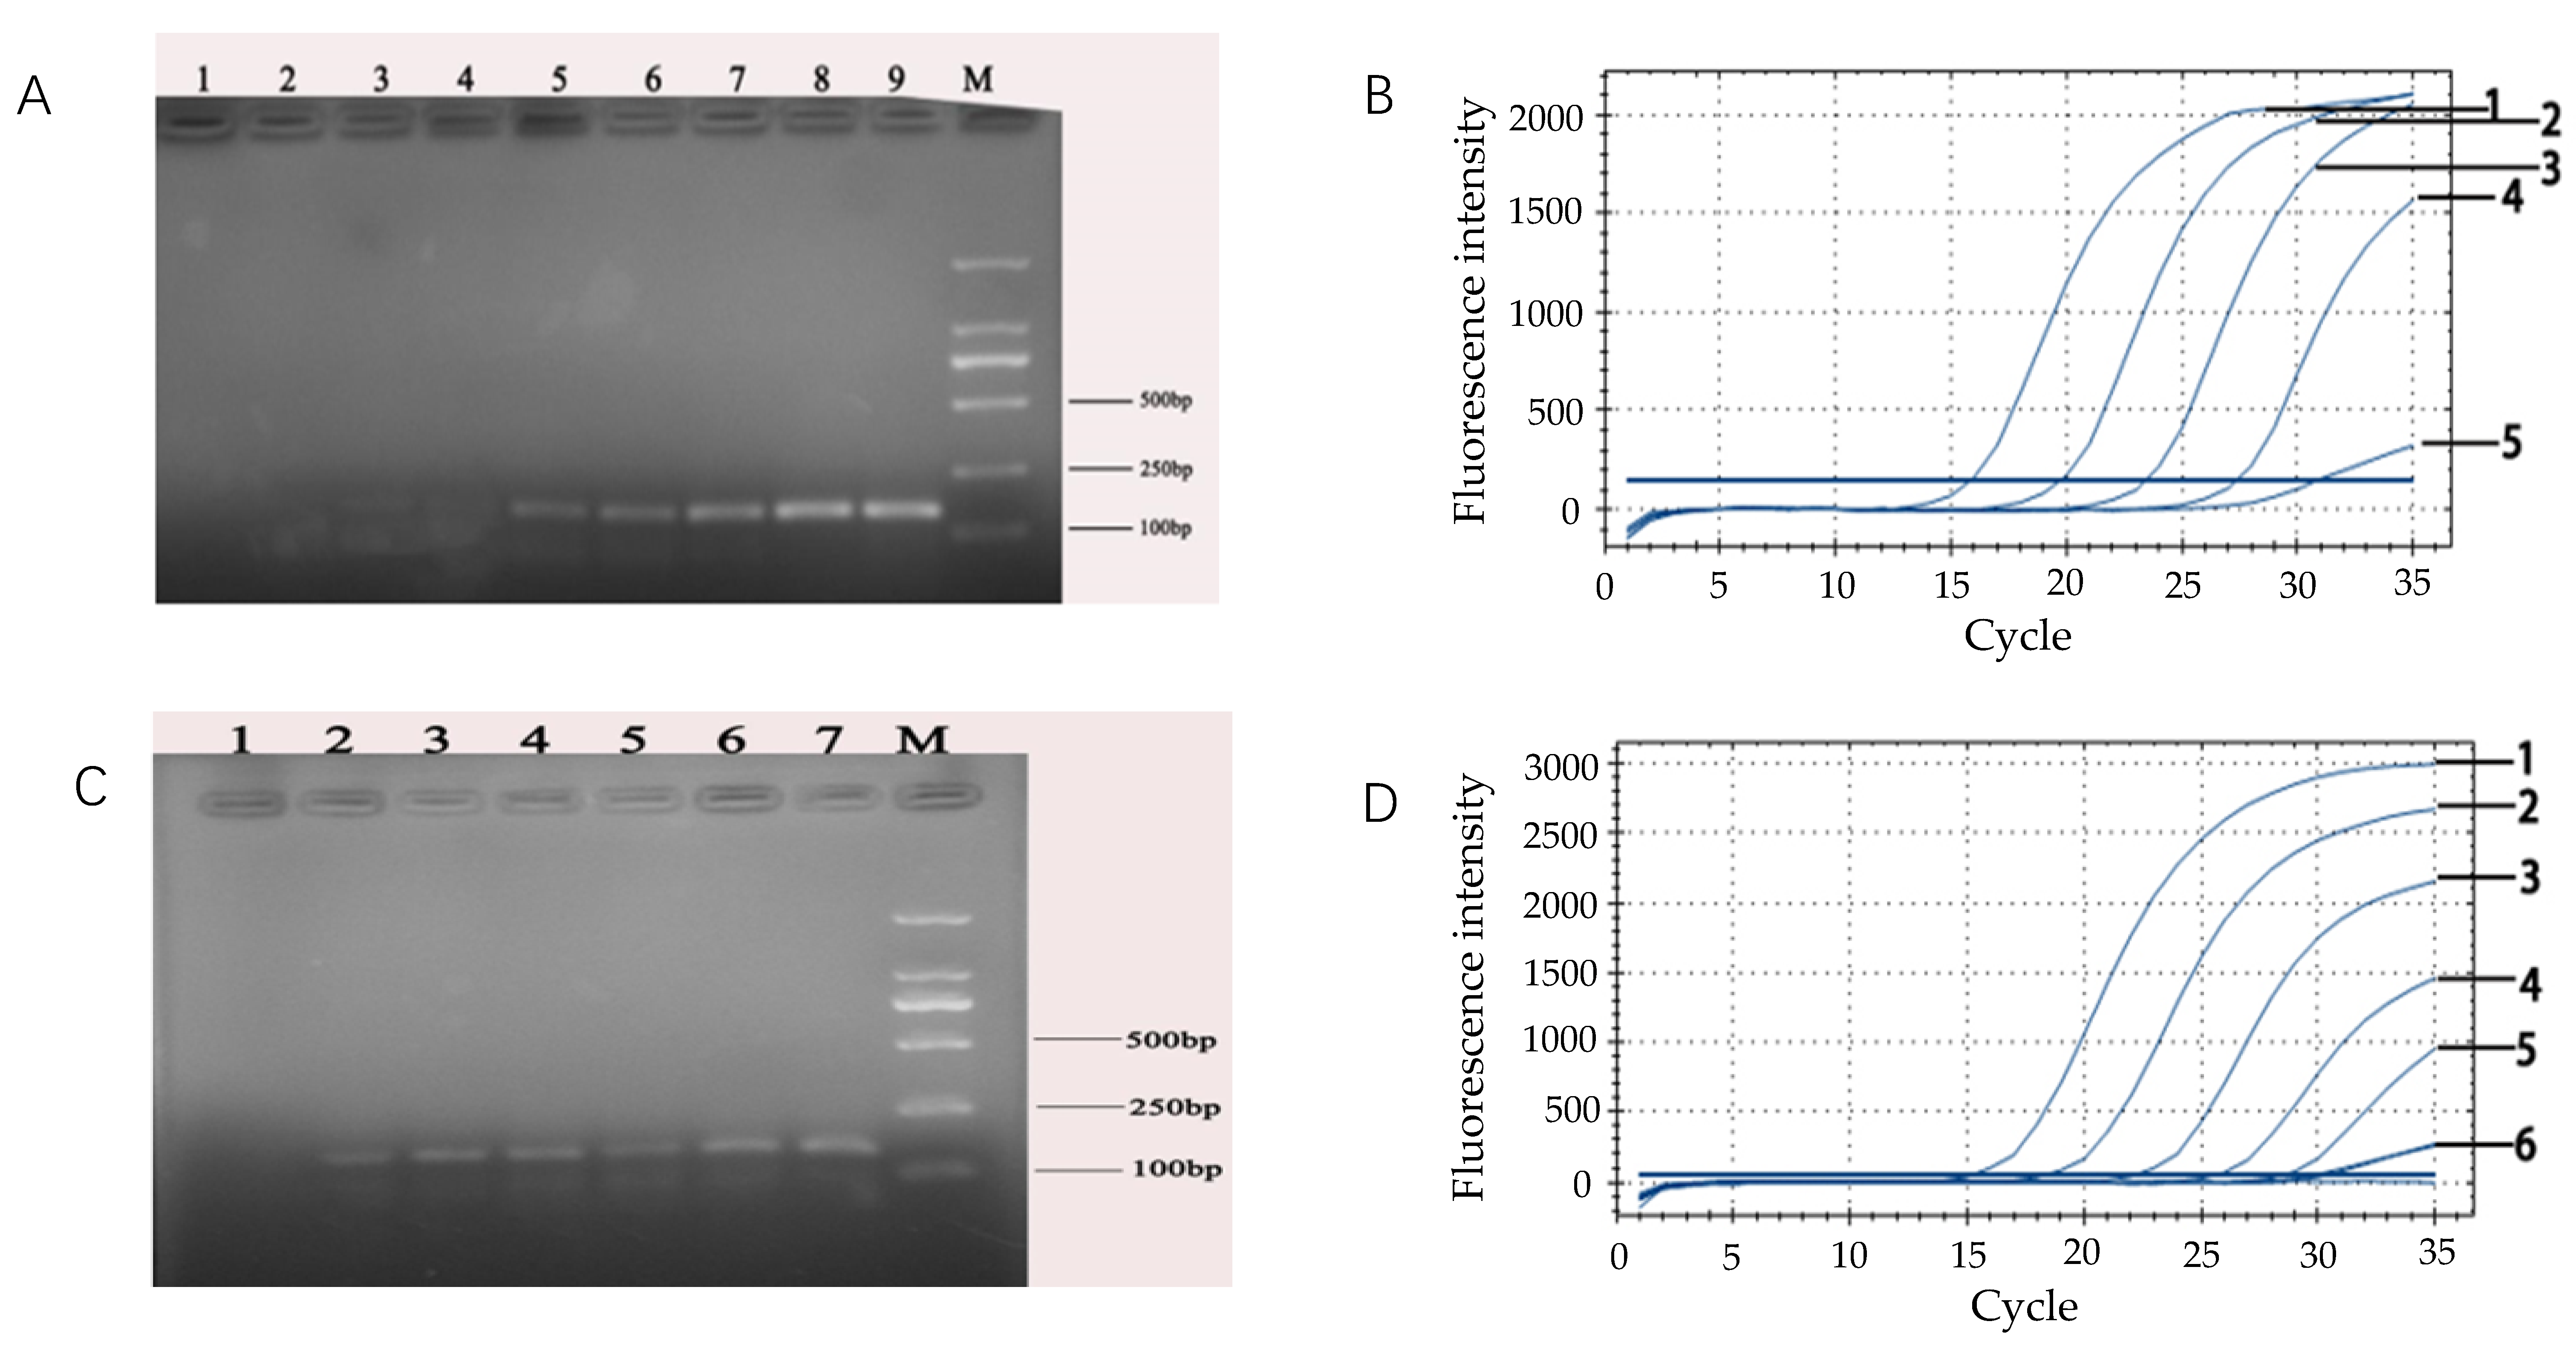
2.9. Analytical Sensitivity of the Real-Time Fluorescent PCR Detection of E. coli O157:H7
A 10-fold bacterial suspension dilution series ranging from 108 CFU/mL down to 101 CFU/mL for E. coli O157:H7 and including a negative control, was prepared in duplicate. DNA of E. coli O157:H7 (1 mL) was respectively extracted by the boiling water method and by the commercial kit method. For each method, the changes of the fluorescence signal were measured in real-time during amplification using a BIO-RAD CFX fluorescent detector. To analyze the PCR data, the threshold (the minimal fluorescence which the signal of sample was detected by the fluorescence detector) was calculated. Subsequently, the Ct-value for each PCR sample was determined by the threshold from each PCR method. In addition, the analytical sensitivity of this technique was also compared with that of conventional PCR.
2.10. Detection of Simulated Drinking Water Samples
Simulated drinking water samples were prepared to test the applicability of IAC. The bacterial suspension of overnight culture, which reached 4.0 × 10⁸ CFU/mL, was carried out in a 10-fold dilution series with saline. After centrifugation for 5 min at 8000× g at room temperature, the supernatant was removed, and then the sediment at the bottom was retained and resuspended with the drinking mineral water. The final concentration of E. coli O157:H7 in drinking mineral water was 108 CFU/mL, 107 CFU/mL, 106 CFU/mL, 105 CFU/mL, 104 CFU/mL, 103 CFU/mL, 102 CFU/mL, 101 CFU/mL, respectively. DNA was extracted by using the boiling water method. The IAC probes were added to the fluorescent quantitative PCR system to test the applicability of IAC in simulated drinking water samples.
4. Discussion
E. coli O157:H7 is one of the three major foodborne pathogenic bacteria in the world. When the intake reaches a certain amount, public health will be threatened. Once an outbreak reaches epidemic proportions, it will cause an inestimable economic burden [
27]. Until now, with the continuous development of PCR technology [
28], fluorescent quantitative PCR has been widely used for the detection of foodborne pathogens. The most precise, accurate and sensitive real-time PCR methods were all TaqMan-based methods rather than molecular beacon-based methods. Nevertheless, the precision, accuracy, and sensitivity of a PCR-based method are not defined by the choice of detection probe, but mainly by the PCR performance itself (which is influenced by the primer sequence, primer specificity, annealing temperature, etc.). The fluorescent quantitative PCR can monitor the amplification process through fluorescence. However, despite the improvement of PCR technology, false-negative results in PCR detection remain as an unresolved issue, which may reduce the detection accuracy [
29]. To address this challenge, an internal amplification control (IAC), which is a non-target DNA fragment introduced into the PCR detection system and is co-amplified with the target sequence so as to exclude false negative results produced by the PCR inhibitors in the samples.
Cankar et al. affirmed that the presence of large amounts of background DNA could also have effect on the target DNA amplification [
30]. It is generally assumed that changes in PCR efficiency may occur due to extraneous substances in the isolated DNA, such as enhancers or inhibitors of the PCR reaction, originating either from the sample matrix or from the DNA extraction solution [
30]. Some methods showed an important reduction of the analytical sensitivity when samples were tested in comparison to purified DNA, suggesting that the DNA purification step was crucial for the PCR yield. Since most procedures lacked internal amplification controls, discrimination between true and false negative results could often not be assessed. Indeed, PCR cannot illuminate diagnostic results before it includes an internal amplification control. So it is necessary to use IAC with real-time PCR detection to identify false negative results and to control for the presence of amplification inhibitors via different fluorescent signals emitted by their respective specific probes, especially for certified routine diagnostic laboratories. Further, Jebbink et al. [
31] found no difference in accuracy and reliability between real-time PCR assays using TaqMan probes and molecular beacons for quantitative analysis of Epstein-Barr virus and Cytomegalovirus. Thus, using molecular beacons or TaqMan probes for real-time PCR detection will not affect the sensitivity, precision or accuracy of the method.
In previous reports, a non-competitive IAC with two pairs of primers being complementary to both the target DNA and non-target DNA was used to indicate PCR inhibition. However, the inclusion of additional primer sets in the reaction invariably results in a higher probability of mis-priming and primer dimerization [
32]. It is difficult to avoid the interference among primer sets and reaction conditions for all primer sets must be optimized. The purpose of this paper is to establish a real-time fluorescence PCR detection system for detection of
E. coli O157:H7 by adding a competitive internal amplification control (IAC) which could indicate the false-negative results without the decrease of detection sensitivity [
33]. But, due to the co-amplification of the IAC, a reduction in target sensitivity was observed. This is not surprising, since such a reduction is inherent to the simultaneous amplification of different targets in one reaction. However, introducing co-amplification of the IAC has only a minor influence on target sensitivity.
Furthermore, in this study, the DNA of
E. coli O157:H7 in pure culture medium was extracted by both the water-boiling method and commercial kit. The results showed that the detection limit of DNA extracted by the commercial kit (10
3 CFU/mL) was higher (10-fold) than the sensitivity of DNA extracted by boiling method (10
4 CFU/mL). With regard to the boiling method, it has the advantages of simple operation, low cost and strong economic applicability although water-boiling is time-consuming. On the other hand, the DNA template with higher purity can be extracted by the kit extraction method which can be used for the detection of complex samples. Meanwhile, the results showed that the fluorescence quantitative PCR method established in this paper is consistent with the traditional PCR method. It demonstrated that the real-time monitoring of the process does not require post-amplification treatment of the samples, such as gel electrophoresis, which reduces the time of analysis and risk of cross-contamination [
16]. The detection limit of DNA extraction is in line with Teegan et al. [
34] who indicated that the PVPP spun columns and the UltraClean kit had the best detection limit, detecting 20 pg of
E. coli DNA (about 2 × 10
3 cells) per 100 mg of manure.
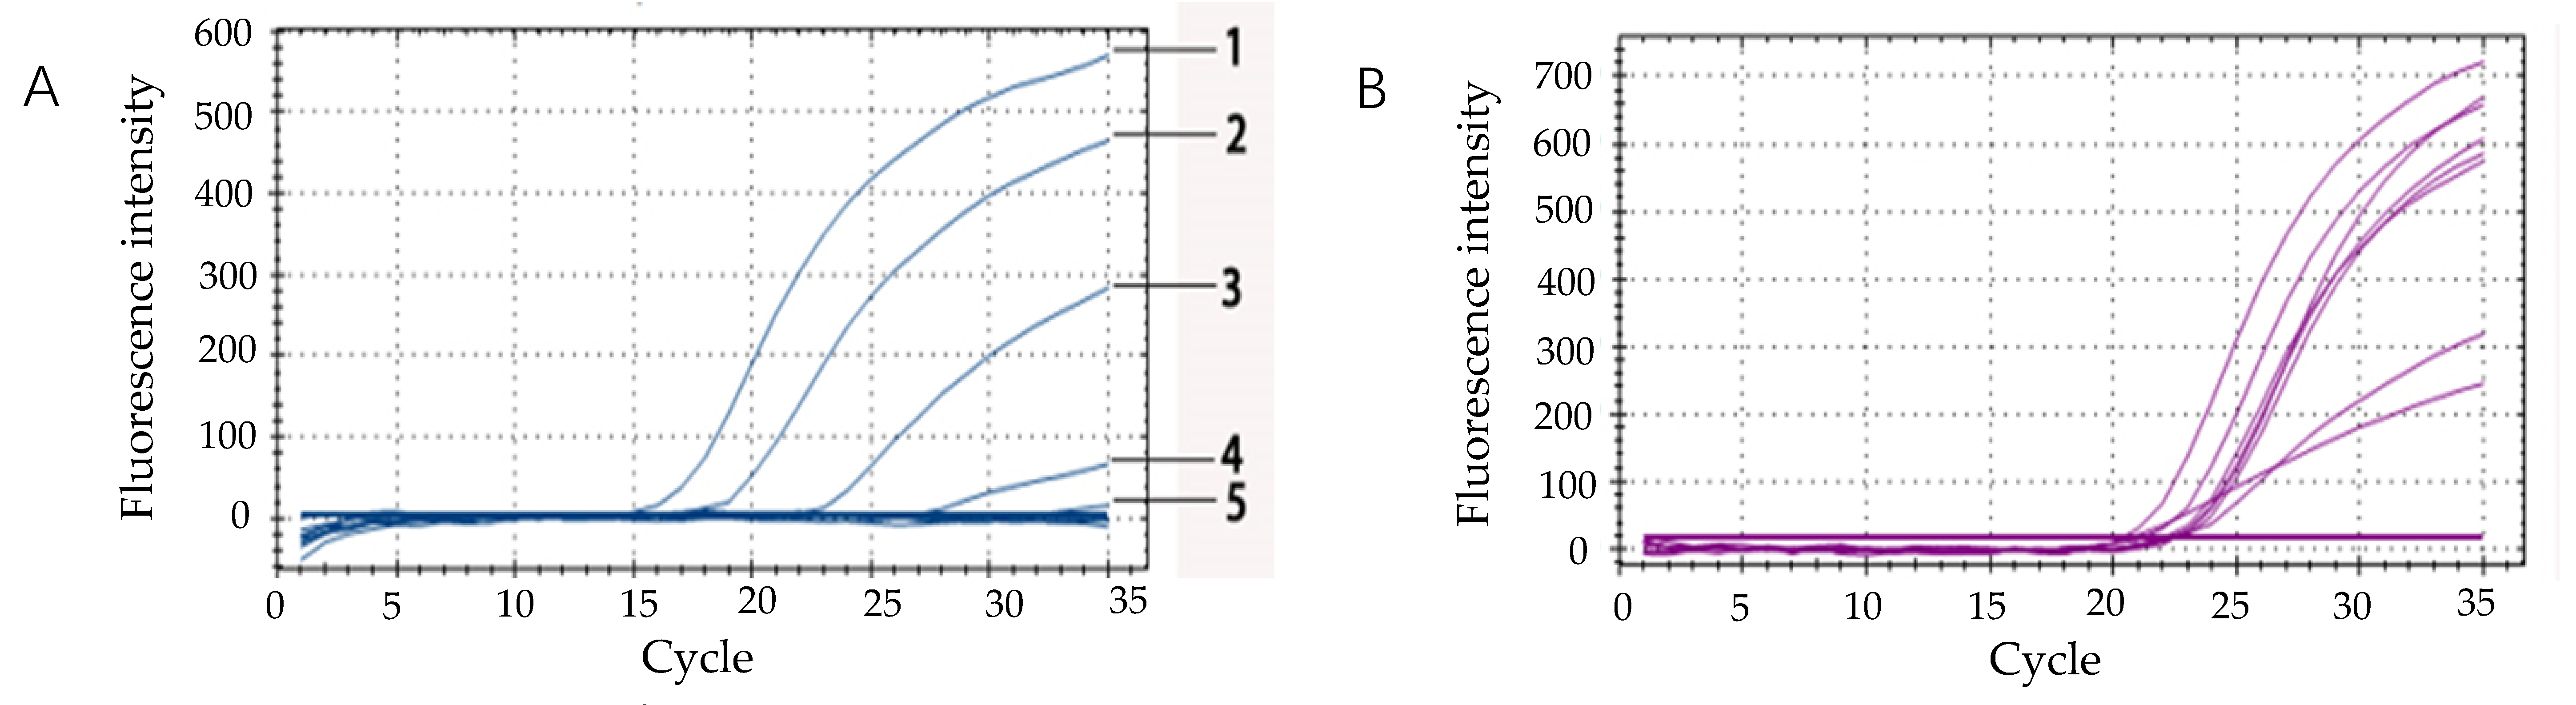
The method of using the Ct values of IAC products from all samples tested in every PCR run was carried out to validate qPCR results, the detect outlier values of IAC-PCR would indicate poor DNA yield or inhibition, leading to a false negative result. In this work, the sensitivity of the
E. coli O157:H7 detection limit was not changed after the introduction of IAC. At the same time, an IAC positive signal appeared in each sample, indicating that the false positive result was absent during the PCR reaction. Interestingly, our finding was quite similar to the study of Wang et al. [
35], showing a detection limit of 1.2 × 10
3 CFU/mL in pure culture as well as infant formula. However, this newly developed qRT-PCR assay reduced the cycles from 30 to 20 compared with Seo and Brackett [
36], preventing the self-degradation and fluorescent signal release after 30 cycles. The Ct-values of the IAC were stable between 20 and 25 cycles in simulated drinking water samples. Therefore, our results indicated that the qRT-PCR assay could detect
E. coli O157:H7 from samples and avoid false negatives by using an internal amplification control.
In conclusion, an IAC control, of competitive traits, was constructed for an E. coli O157:H7 PCR assay to monitor the amplification. The optimized real-time PCR detection with IAC for E. coli O157:H7 may provide an improved, sensitive, precise, and accurate method. It is applicable for rapid analysis and routine diagnosis, preventing false negative reactions and providing a tool for the accurate quantification of E. coli O157:H7.
5. Conclusions
In this study, the real-time PCR detection system using a competitive IAC with a target gene presented a highly specific (only positive for E. coli O157:H7), sensitive (103~104 CFU/mL of purified genomic DNA), and faster (compared to traditional cultural method) method for the detection of E. coli O157:H7 in water samples. It ensures the low homology between the amplified internal target and the target gene so that the two sequences would not affect the detection sensitivity through the combination of complementary chains, and the NCBI search was used to ensure the extremely low homology between the IAC probe and the target species DNA. These sequences were constructed into a competitive amplification internal standard to avoid the interference with primers in the PCR reaction system. Different fluorescent group probes were used to amplify the internal standard and target genes, and various different fluorescent signals were emitted during the reaction so as to achieve the purpose of indicating false negatives. This study indicated that the real-time fluorescent PCR-IAC method established in the experiment was more applicable and reproducible for eliminating false negatives in food samples.
The optimized methods for the detection of E. coli O157:H7 with introducing the IAC described in this study are useful tools for the analysis of target DNA. However, in this paper only DNA extracted from pure cultures was tested. The detection of E. coli O157:H7 in substrates like fruit, meat, or poultry might introduce a reduction in sensitivity, precision, or accuracy. Therefore, the general applicability of IAC-PCR technology in different samples needs further confirmation.


