Article

Urbanization Altered Bacterial and Archaeal Composition in Tidal Freshwater Wetlands Near Washington DC, USA, and Buenos Aires, Argentina

Environmental Science and Technology Department, University of Maryland, College Park, MD 20742, USA
*
Author to whom correspondence should be addressed.
Microorganisms 2019, 7(3), 72; https://doi.org/10.3390/microorganisms7030072
Submission received: 12 December 2018 / Revised: 14 February 2019 / Accepted: 2 March 2019 / Published: 6 March 2019
(This article belongs to the Special Issue Wetland Soil Microbiology)

Abstract

:
Urban expansion causes coastal wetland loss, and environmental stressors associated with development can lead to wetland degradation and loss of ecosystem services. This study investigated the effect of urbanization on prokaryotic community composition in tidal freshwater wetlands. Sites in an urban, suburban, and rural setting were located near Buenos Aires, Argentina, and Washington D.C., USA. We sampled soil associated with two pairs of functionally similar plant species, and used Illumina sequencing of the 16S rRNA gene to examine changes in prokaryotic communities. Urban stressors included raw sewage inputs, nutrient pollution, and polycyclic aromatic hydrocarbons. Prokaryotic communities changed along the gradient (nested PerMANOVA, Buenos Aires: p = 0.005; Washington D.C.: p = 0.001), but did not differ between plant species within sites. Indicator taxa included Methanobacteria in rural sites, and nitrifying bacteria in urban sites, and we observed a decrease in methanogens and an increase in ammonia-oxidizers from rural to urban sites. Functional profiles in the Buenos Aires communities showed higher abundance of pathways related to nitrification and xenobiotic degradation in the urban site. These results suggest that changes in prokaryotic taxa across the gradient were due to surrounding stressors, and communities in urban and rural wetlands are likely carrying out different functions.

1. Introduction

Global urbanization has rapidly increased throughout the last 60 years, and by 2050, two-thirds of the world population will live in urban settlements [1]. Population growth and the resulting urban expansion is a major cause of wetland loss worldwide [2,3]. Coastal wetlands are particularly susceptible to loss and habitat degradation, as the most dramatic population growth has occurred in cities located near coastlines [4,5].
Urban development has a direct effect on wetland ecosystem services, and the loss and degradation of these systems can impact human health and well-being [6]. Increased impervious surfaces facilitate the transport of pollutants into waterways and directly impact wetland habitat quality [7]. On average, in the United States, urban storm water runoff can carry 0.26 mg/L of phosphorus, 0.2 mg/L of nitrogen, and 54.5 mg/L of suspended sediments [8], which can transport various contaminants like heavy metals and polycyclic aromatic hydrocarbons (PAHs) [9,10]. As a result, urban wetlands tend to have more non-native plant species, typically favored by nutrient inputs, and higher sediment concentrations of heavy metals and organic chemicals [11,12].
Changes in urban wetland habitat can affect the diversity and richness of biota. For example, urbanization has been seen to reduce macro-organism species diversity by creating homogeneous plant and animal assemblages [13,14]. Johnson et al. [15] reported that urban wetlands had significantly less richness of aquatic insects, mollusks, amphibians, aquatic reptiles, and crayfish than wetlands in non-urban systems. A study on urban rivers, which are subject to similar stressors as urban wetlands, found microbial richness decreased in the urban areas and had higher abundance of genes related to xenobiotic metabolism [16]. To our knowledge, no studies have looked at the effects of urbanization on tidal freshwater wetlands (TFW) prokaryotic communities, but it is expected that they would also be susceptible to anthropogenic disturbances [17,18].
Wetland prokaryotic communities may change directly in response to added nutrients or shifts in the length and intensity of the hydroperiod, but may also indirectly be impacted by vegetation. In order to investigate the role of different plant functional groups on wetland prokaryotic communities, we sampled the root zones of two plant species. Root morphology and plant type can influence rhizosphere prokaryotic communities through plant exudates and oxygen release [19,20]. Some studies have found that prokaryotic community structure can vary between wetland plant species [21] and even between lineages of the same species [22,23]. Other studies reported site-specific effects [24] or found that soil characteristics were the main drivers of microbial community composition [18].
We examined the prokaryotic communities in TFWs located near two major capital cities: Buenos Aires (Argentina), and Washington, D.C. (United States). Tidal freshwater wetlands are located in the upper part of estuaries and are characterized by salinity levels lower than 0.5% [25], and daily tidal fluctuations due to the influence of the nearby estuary. Their location often represents the most inland point that can still be reached by ships in the estuary, supporting early settlements in these tidal areas that continued to develop over the next few centuries [26]. As a result of increased economic activity and population growth, tidal wetlands are particularly vulnerable to environmental degradation and loss associated with urban development [27,28].
Our study used next-generation DNA sequencing to test three hypotheses: (1) Prokaryotic community composition and function will vary across the established urban gradient; (2) prokaryotic communities will differ between plant species at each site; and (3) specific prokaryotic taxa will be indicative of urban wetlands, regardless of geographic location of the city.

2. Materials and Methods

2.1. Site Description

The cities of Buenos Aires and Washington D.C. are two examples of large cities that developed near tidal freshwater wetlands. Both cities are located at similar latitudes North and South of the Equator (Buenos Aires: 34.6037° S; D.C.: 38.9072° N) and have experienced significant population growth over the last few decades. This trend is expected to continue in both areas, and current population estimates are around 3 million people in Buenos Aires with ~376,000 residents in the county where we sampled [29], and almost 700,000 in Washington D.C. [30].
Argentinian sites were located in the Lower Paraná Delta, in the upper portion of Rio de la Plata estuary. Islands formed in this area in the last ~750 years and the delta continues to expand due to sediment deposition [31]. About half of this area has been affected by human activities, mainly forestry and development associated with tourism and recreation [32]. To allow these activities, hydrological modifications like levees and dikes were constructed, which altered the natural environment and affected hydrologic regimes [33]. Wetlands in the Lower Paraná delta have been increasingly lost to urban expansion [34]. Most of the developed area uses septic systems, and as drainfields become less effective over time, wastewater is released into the waterways. Water quality in this area is also affected by inadequate disposal of solid wastes, industrial pollution, and fuel spills from heavy boat traffic [35,36].
The United States sites were located in the Chesapeake Bay estuary. These tidal marshes originated during the Holocene (~10,000 years ago), when Pleistocene valleys were gradually inundated by rising sea level [37]. As a result of human intervention and sea level rise, over half of the tidal wetlands in the Bay are considered to be degraded [38]. The main perturbations associated with development near these wetlands are pollutant runoff that is promoted by large impervious surfaces [27,39] and nutrient enrichment from agriculture and sewage treatment facilities [40]. Washington D.C. has a combined sewer overflow system, so after heavy rainfalls a mix of storm water and sewage is released into nearby waterways, introducing bacterial pathogens and degrading water quality [41].
The study sites are located in freshwater tidal wetlands in the Paraná River delta (Buenos Aires, Argentina), and in the Chesapeake Bay (Maryland, USA). Within each region, sites corresponding to urban, suburban, and rural environments were identified (Figure 1).
In Buenos Aires the sites were located in the Lower Paraná Delta, just north of the City of Buenos Aires. The urban gradient was established by locating sites that had varying degrees of development. The urban site is on the Sarmiento River near its confluence with the Luján River (34°24’48.81”S, 58°34’1.76”W), which is considered to be highly contaminated with wastewater and industrial waste [42]. The selected area is influenced by tidal inputs from the Luján River, experiences heavy boat traffic, and has been modified to accommodate residential houses. The suburban site (34°23’8.27”S, 58°34’6.30”W) is located upriver from the urban site, and the rural site is located on the Unión River (34°22’55.73”S, 58°31’38.77”W) on unmanaged land with no signs of human development upstream.
In Maryland the sites are located in the Anacostia River (38°92′41.1′’N, 76°94′58.8′’W; soil series Zekiah and Issue), Patuxent River (38°78’58′’N, 76°71′30.8′’W; soil series Nanticoke and Mannington), and Choptank River (38°48’52.67”N, 75°53’19.82”W; soil series Nanticoke and Mannington). The Anacostia River runs along the border of Washington D.C. and is highly urbanized and affected by industrial activities and sewage inputs from the city’s combined sewer system. The Patuxent watershed is located between Washington D.C. and Baltimore, representing a site of intermediate urban development, and the Choptank River is located across the Chesapeake Bay in Eastern Maryland, where agriculture is the predominant land use [43].
We selected two species that have different morphological features at each site. In Washington D.C. the selected species were Phragmites australis (Cav.) Trin. ex Steud., and Peltandra virginica (L.) Schott, and in Buenos Aires, Hymenachne grumosa and Sagittaria montevidensis. Phragmites and Hymenachne are clonal grasses that have thick rhizomes, tall and rigid stems, and horizontal cable-like stolons. Peltandra and Sagittaria have fleshy triangular leaves and a shallower root system with bulbous vertical corms or tubers. In addition, Phragmites is an invasive species that has higher nutrient requirements [44] and produces more biomass than other native species [45].

2.2. Sample Collection

Samples were collected on a summer day at each location (January in Buenos Aires and August in Maryland). In Maryland, three soil samples were collected from the rhizosphere of Phragmites australis, and three from Peltandra virginica at each of the sites. We used a half circle Russian peat borer (Eijelkamp, Giesbeek, Netherlands) to collect a 50-cm deep soil sample next to the stem to get plant-influenced soil. In Buenos Aires four soil samples were collected from the rhizosphere of Hymenachne grumosa and Sagittaria montevidensis. We used a spade shovel with measurement markings to collect soils from a depth of 30 cm, as these plants have a shallower root system than those sampled near D.C. Approximately 2 g of homogenized rhizosphere soil were added into sterile Falcon tubes that contained 4 mL of LifeGuard soil preservation solution (MoBio Laboratories, Carlsbad, CA) and shipped to the University of Maryland for soil and prokaryotic community analysis.

2.3. Soil Analysis

Key soil properties known to have a significant impact on prokaryotic ecology were analyzed using the methods outlined by Yarwood et al. [22]. Total C and N content were determined by combustion analysis at 950°C and soil organic matter was calculated using loss-on-ignition (550 °C for 24 hr). To measure pH, five grams of soil were added to 25 mL of distilled water to make a 1:5 ratio slurry, which was then measured using a pH electrode. Finally, particle size analysis (PSA) was carried out using the hydrometer method for the Washington D.C. samples and the pipette method [46] for the Buenos Aires samples. Logistics of working in different countries prevented the use of the same core type and particle size analysis method.

2.4. DNA Extraction and Illumina Library Preparation

DNA extractions were carried out using the Qiagen DNeasy PowerLyzer PowerSoil kit (Qiagen, Hilden, Germany). The Buenos Aires samples were centrifuged, and the excess solution drained before beginning the extractions. These were carried out following the manufacturer’s instructions, except for the homogenization step that was done using a FastPrep-24 (45 s at 6 m/s; MP Biomedicals, LLC, Solon, OH). Samples were quantified using a Qubit 2.0 fluorometer (Invitrogen) and diluted to 5ng/ul for PCR amplification and subsequent amplicon sequencing. The 16S rRNA region was targeted using the primers 515F+adapter (5′-TCGTCGGCAGCGTCAGATGTGTATAAGAGACAGGTGCCAGCMGCCGCGGTAA-3′) and 806R+adapter (5′-GTCTCGTGGGCTCGGAGATGTGTATAAGAGACAGGGACTACVSGGGTATCTAAT -3′) [47]. The PCR reaction had 3.5 uL of DNA, 17.5 uL of ThermoScientific TM PhusionTM Flash High-Fidelity PCR Mastermix (Thermo Fisher Scientific), and 7 uL of each primer (1 ng/uL). The PCR product was then processed for Illumina sequencing using the 16S Metagenomic Sequencing Library Preparation protocol (Part # 15044223 Rev. B, support.illumina.com). The cleanup was carried out using AMPure XP beads (Beckman Coulter, Pasadena, CA), and the Nextera XT 96 index kit (Illumina) was used for sample indexing. Samples were pooled, and amplicon size of the library was checked using a Bioanalyzer 2100 (Agilent Technologies). Q-PCR was used for library quantification, and the final library was diluted to 12 pM, spiked with 30% PhiX (Illumina), and run on an Illumina MiSeq using a 600-cycle v3 cartridge.

2.5. Data Analysis

R was used for statistical analysis and drawing figures [48]. Illumina sequencing output was processed using the dada2 package (version 1.6) [49] for filtering, dereplication, sample inference, merging of pair end reads, and chimera checking. The algorithm used for chimera checking in this performs a Needleman-Wunsch global alignment of each sequence to compare it with more abundant sequences, and check if the “child” sequence can be obtained from exact combinations of right and left segments of “parent “sequences, which would classify them as chimeras. Taxonomic assignments were carried out by matching sequences to the SILVA database (SILVA v128, arb-silva.de) and the resulting amplicon sequence variant table was analyzed using the phyloseq (v1.2) [50] and vegan (v2.4-4) [51] R packages. Samples were rarefied to the minimum sequence number for each data set (Buenos Aires = 11,811, Maryland = 59,939). Rarefaction curves were produced and confirmed that coverage of sampling was appropriate, as all but one sample curve leveled off at the proposed sequence cut-off (Figure S1 in supplementary materials). Non-metric multidimensional scaling (NMDS) based on a Bray-Curtis dissimilarity matrix was used to visualize differences between sites and plant species, and homogeneity of group dispersion was checked using the vegan functions betadisper and permutest. Nested PERMANOVA was used to test for statistical differences with the adonis function and a calculated p value < 0.05 was considered significant. Significant factors identified through permutational multivariate analysis of variance (PERMANOVA) were further examined with pairwise comparisons using permutation MANOVAs to assess differences between group levels. This was done using the pairwise.perm.manova function from the RVaideMemoire package [52] with 999 permutations on the Bray-Curtis distance matrix and Bonferroni corrections to adjust p-values after multiple testing. The associations between community composition and the most abundant phyla were evaluated using the envfit function, and vectors that showed significant correlations were fitted to the non-metric multidimensional scaling (NMDS) ordination. Correlations between community composition and soil variables were also evaluated with the envfit function to identify significant environmental factors. Prokaryotic amplicon sequence variants (ASVs) were classified into urban or rural habitat generalist or specialist using a multinomial species classification method (CLAMtest) in vegan. We used a coverage limit of 10, an alpha of 0.005, and a specialization value of 0.67, which is considered conservative [53]. Furthermore, indicator taxa for urban and rural habitats were identified using the multipatt function in the indispecies package [54], and significant associations between taxa and sites were evaluated using permutation tests. The t4f (Tax4Fun) function in the R package of the metagenomics [55] was used to explore functional traits and predict metabolic capabilities based on 16S rRNA sequencing data and the KEGG pathway database. Mean relative abundance of prokaryotic taxa were calculated by dividing the number of sequences of that taxa by the total number of sequences in a sample. We used either t-tests for pairwise comparisons or ANOVA (using Type III Sums of Squares for Argentina samples) to examine differences in mean relative abundance of certain taxa between sites. Log transformations of the data were carried out when assumptions of normality or homogeneity of variances were not met.

3. Results

Soil analysis revealed few differences between urban, suburban, and rural sites in Buenos Aires, and only soil organic matter (%SOM) increased from rural to urban (Table 1). In Washington D.C., pH increased from rural to urban sites, while %SOM decreased along the gradient. Prokaryotic communities in each area were correlated to different soil parameters. In Buenos Aires, %SOM and %clay were significantly correlated to community composition (R2 = 0.63, p = 0.001 and R2 = 0.41, p = 0.014, respectively), and those variables were correlated to each other (r = 0.78). The Washington D.C. soil variables associated with prokaryotic communities were pH and soil organic matter (R2 = 0.58, p = 0.001 and R2 = 0.48, p = 0.009, respectively), and these variables were also correlated to each other (r = −0.75).
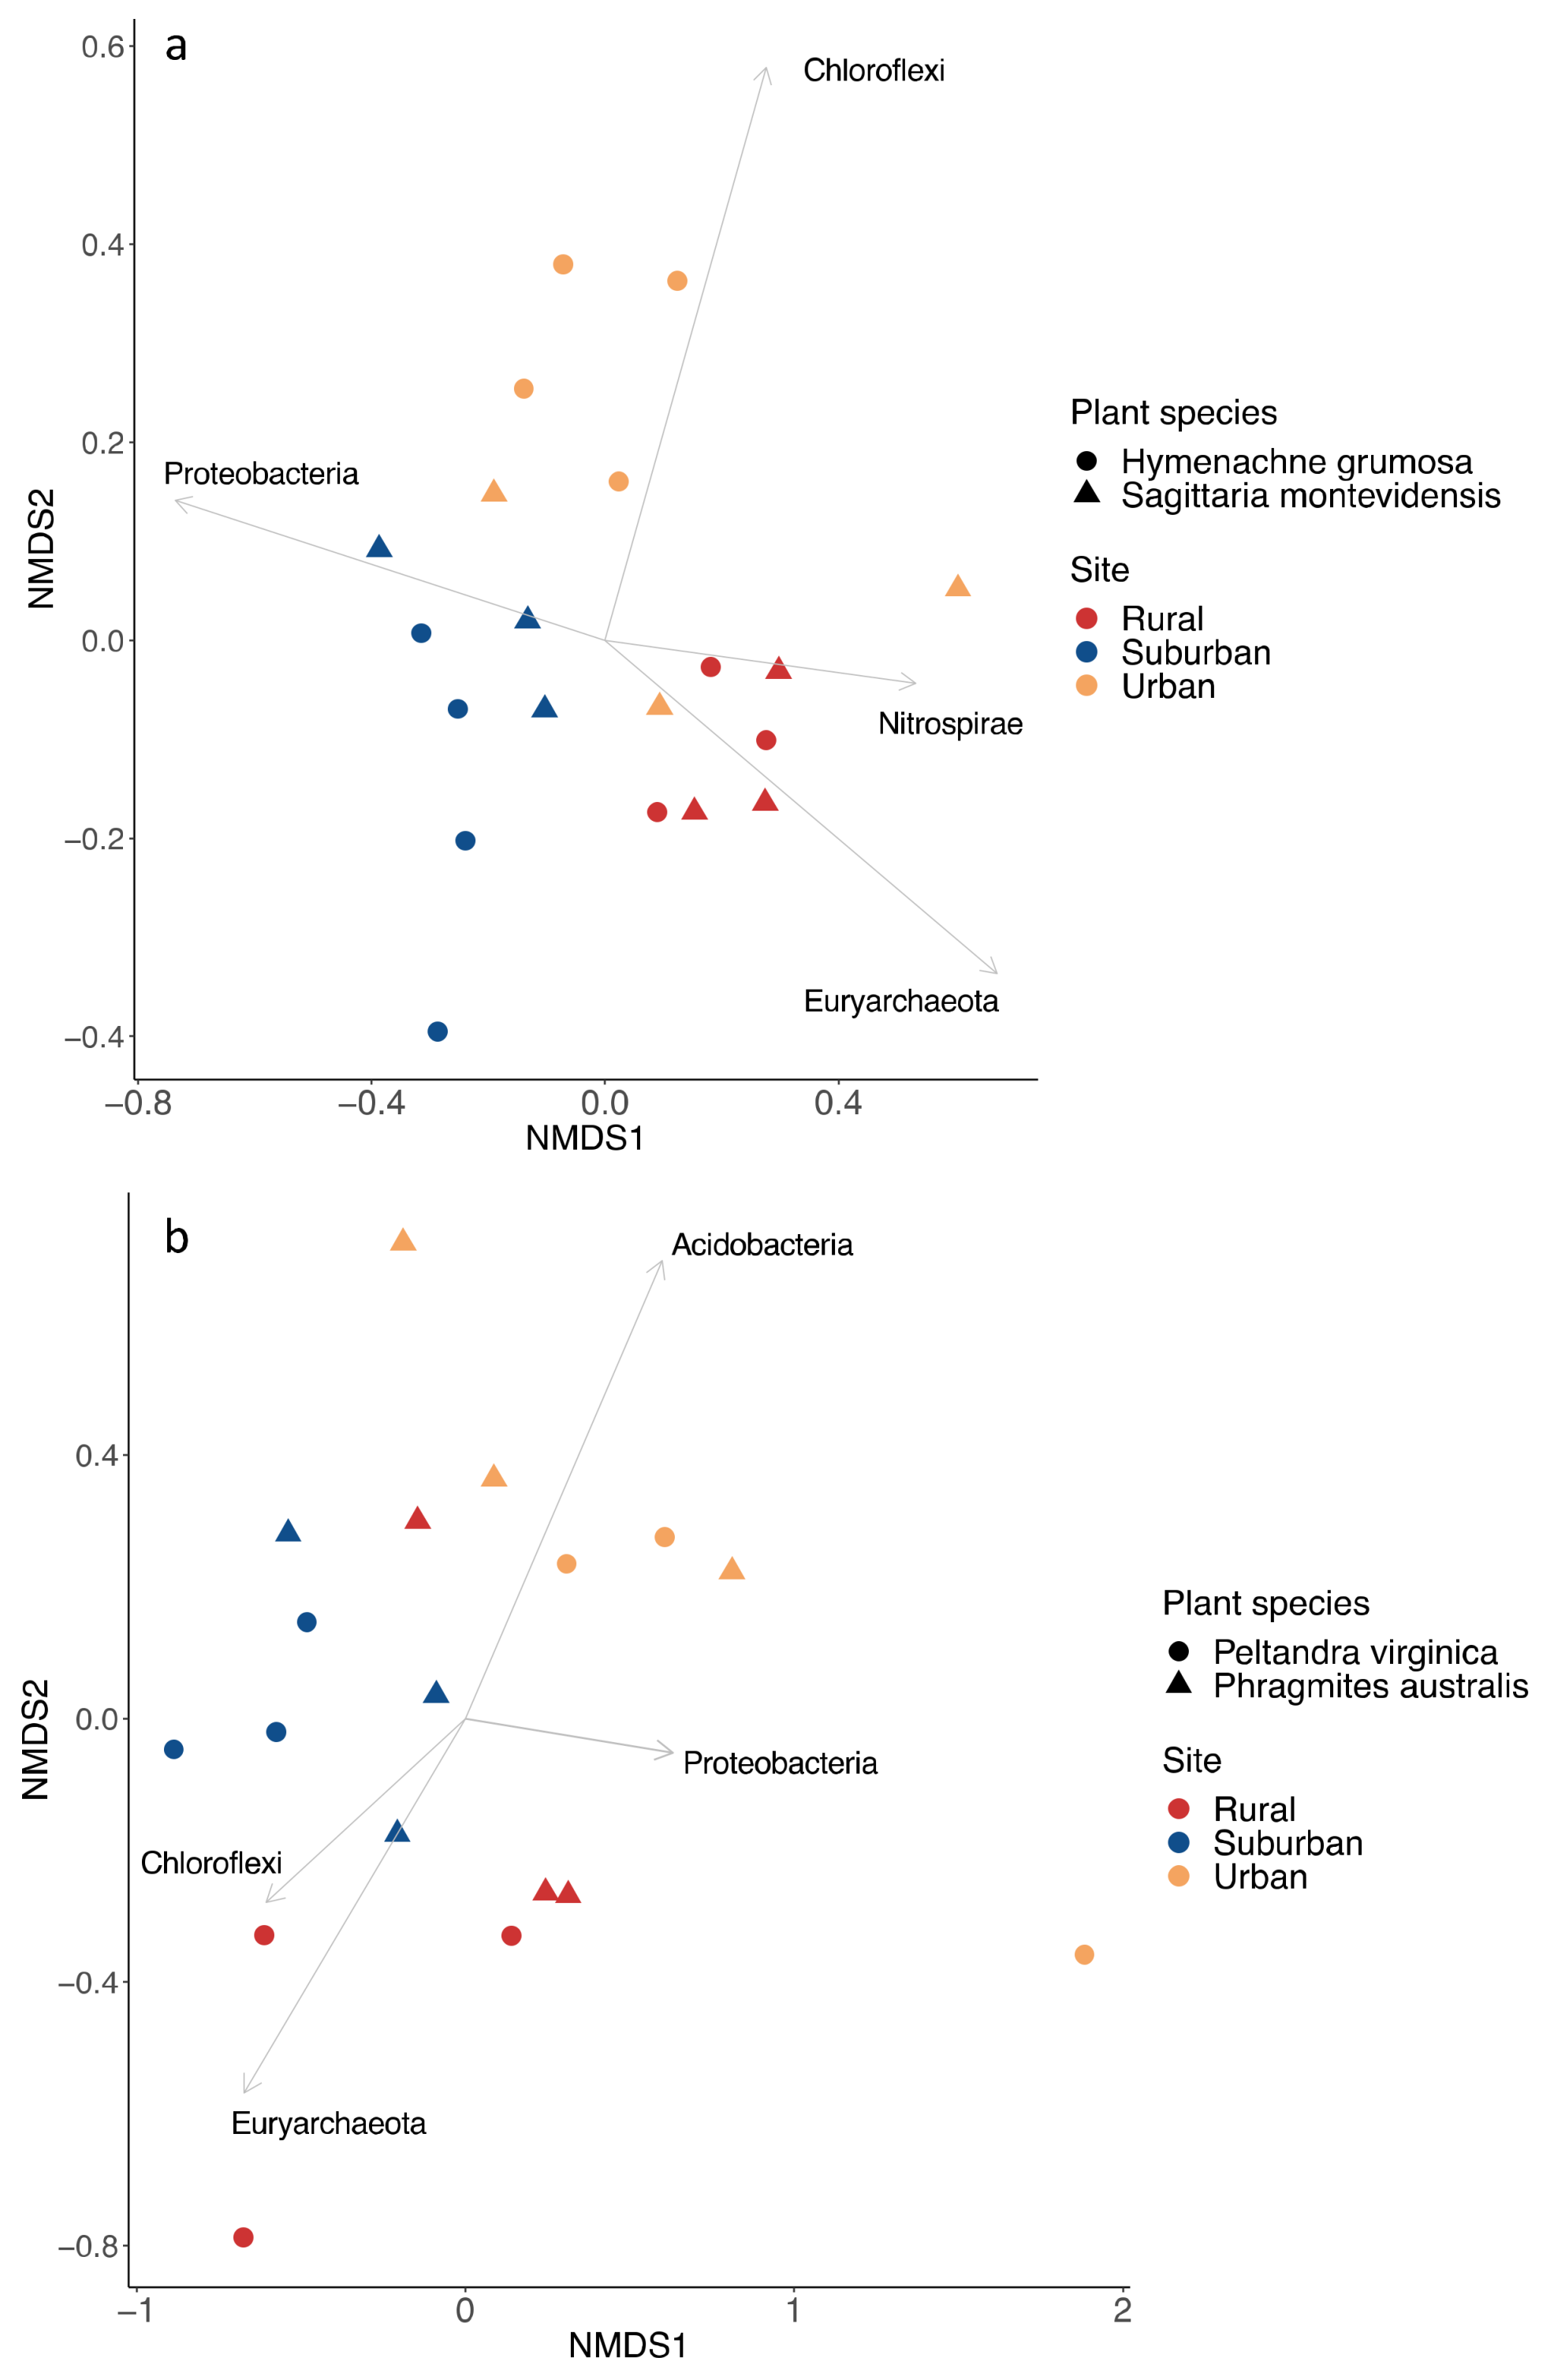
Illumina sequencing generated approximately 3.7 million high quality sequences with a median of 76,000 sequences per sample (min = 11,811, max = 910,766). Nested PerMANOVA revealed that prokaryotic communities were significantly different along the urban gradient in Buenos Aires and in Washington D.C. (Buenos Aires: F = 2.6, p = 0.005; Washington D.C.: F = 2.3, p = 0.001), and differed between plant types at the p < 0.1 significance level (Buenos Aires: F = 1.5, p = 0.089; Washington D.C.: F = 1.3, p = 0.085) (Figure 2). Pairwise comparisons of the different sites showed that in Buenos Aires only urban and rural sites differed in community composition (p = 0.006), while in Washington D.C. the urban site communities differed from both the suburban and rural sites (p = 0.018 and p = 0.015 respectively). Shannon and Simpson diversity indexes did not differ between sites at either location (results not shown). The average ASV richness in urban, suburban, and rural sites in Buenos Aires was 751, 220, and 503, respectively. In Washington D.C., 2382 taxa were identified for the urban, 2347 for the suburban, and 2379 for the rural site.
The most abundant bacterial phyla were Proteobacteria (63.9%), Firmicutes (7.8%), and Chloroflexi (7.4%) in Buenos Aires; and Proteobacteria (16.5%), Chloroflexi (13%), and Acidobacteria (11.5%) in Washington D.C. The most abundant archaea phylum was Euryarchaeota in both areas (1.8% in Buenos Aires; 9.3% in Washington D.C.). In Buenos Aires, Chloroflexi was strongly correlated to urban communities, Proteobacteria to urban and suburban, and Euryarchaeota to communities in rural samples (Figure 2a). In Washington D.C., Proteobacteria and Acidobacteria were correlated to urban prokaryotic communities, while Chloroflexi and Euryarchaeota were better correlated to rural communities (Figure 2b). In both areas the most abundant class within Euryarchaeota was Methanomicrobia (56.5% in Buenos Aires; 44.9% in Washington D.C.).
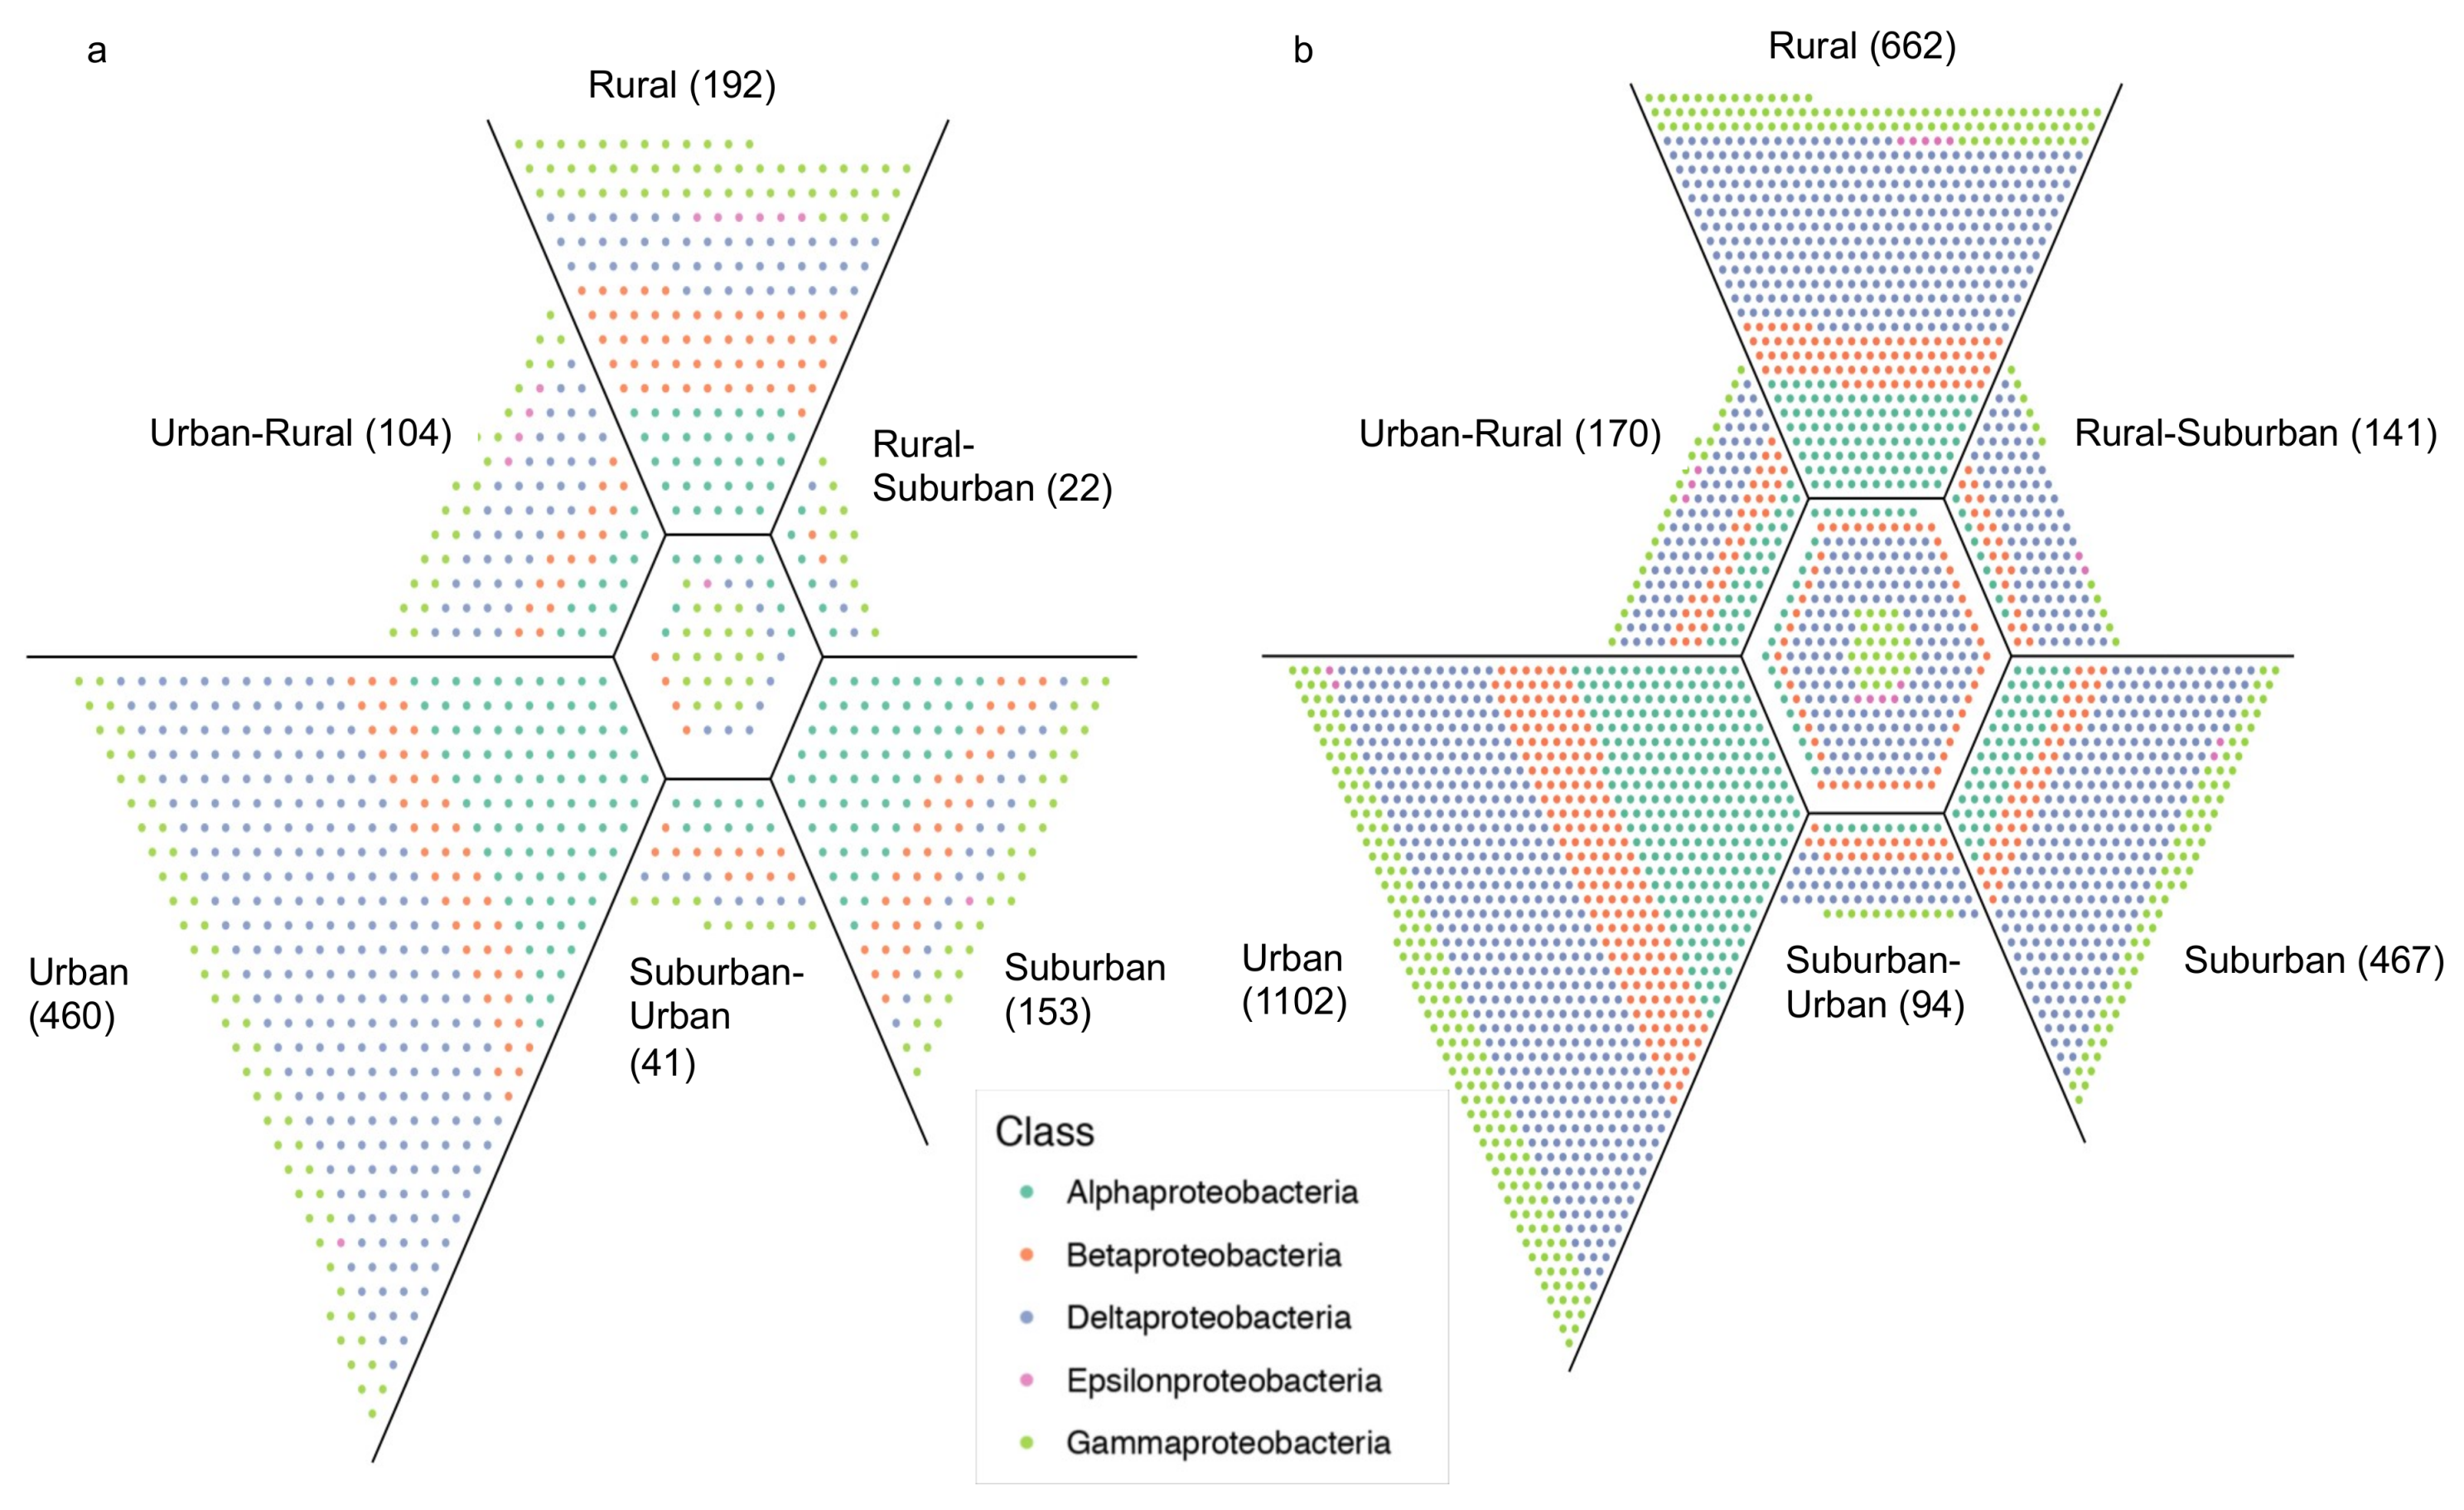
Both urban sites had more unique Proteobacteria ASVs than suburban or rural sites (460 in Buenos Aires and 1102 in Washington D.C.) (Figure 3). Most unique ASVs in those urban sites belonged to the Class Deltaproteobacteria, with 201 unique ASVs in Buenos Aires and 493 in Washington D.C. This was particularly surprising in Buenos Aires, where relative abundance of Deltaproteobacteria did not differ between sites (F = 3.03, p = 0.075), while Gammaproteobacteria significantly increased from rural to urban sites (t = −2.26, p = 0.047), and comprised 93.4% of all Proteobacteria ASVs in the urban site.
Within the Gammaproteobacteria, Enterobacteriaceae were most abundant in Buenos Aires and significantly higher in the urban site compared to the rural site (t = 3.6, p = 0.005). Bacteria putatively identified in the genus Escherichia/Shigella were exclusively found within the urban site. There was markedly higher relative abundance of coliform bacterial families in the suburban and urban sites compared with the rural site, which was mostly driven by Enterobacter and Citrobacter (Figure S2a in supplementary materials).
In Washington D.C., Xanthomonadales was the most abundant taxon within the Gammaproteobacteria and also showed a higher relative abundance in the urban than rural site (t = 2.58, p = 0.028). Members of the Xanthomonadales have the ability to break down PAHs, as well as other complex substrates [57,58]. Following this observation, other bacterial groups that have that capability were further explored. The relative abundance of members of the Xanthomonadales order (Arenimonas, Dyella, Luteimonas, Lysobacter, Rhodanobacter, and Xanthomonas), as well as other bacterial genera known to break down PAHs [59], were significantly higher in the urban sites relative to the suburban and rural sites (F = 4.4, p = 0.013) (Figure S2b in supplementary materials).
KEGG metabolic pathways of the prokaryotic communities, and specifically those associated to xenobiotic biodegradation and nitrification, were investigated (Table S1 in supplementary materials). For the Buenos Aires samples, most ASVs could be mapped to KEGG organisms, allowing a relatively good functional prediction based on 16S rRNA data. The average FTU, which indicates the fraction of ASVs that could not be mapped to KEGG organisms, was 55% for rural, 36% for suburban, and 31% for urban sites. The obtained KEGG profiles suggest that functional traits were more similar between urban and suburban sites, while rural communities appear to be more functionally distinct (Figure S3a in supplementary materials). Metabolic pathways associated with expected urban stressors, such as pollution and excess nitrogen, were further analyzed. There was a significant enrichment in xenobiotic degradation pathways in the urban site relative to the rural site (t = 2.29, p = 0.05) and the same pattern was observed for nitrification pathways (t = 2.7, p = 0.025) (Figure 4a). In Washington DC, sites exhibited distinct metabolic capabilities (PerMANOVA F = 4.17, p = 0.007) (Figure S3b in supplementary materials), and an enrichment of xenobiotic degradation pathways in the urban relative to the rural site (t = 2.4, p = 0.049) was observed. Nitrification capacity was lowest in the suburban site and similar in the rural and urban sites (F = 4.52, p = 0.029) (Figure 4b). However, the average FTUs for the prokaryotic communities in Washington D.C. was much higher (around 92.5% on average), so only a small portion of the total community was represented in the KEGG profiles. Therefore, prediction of functional traits from taxonomic data in Washington D.C. would be inaccurate.
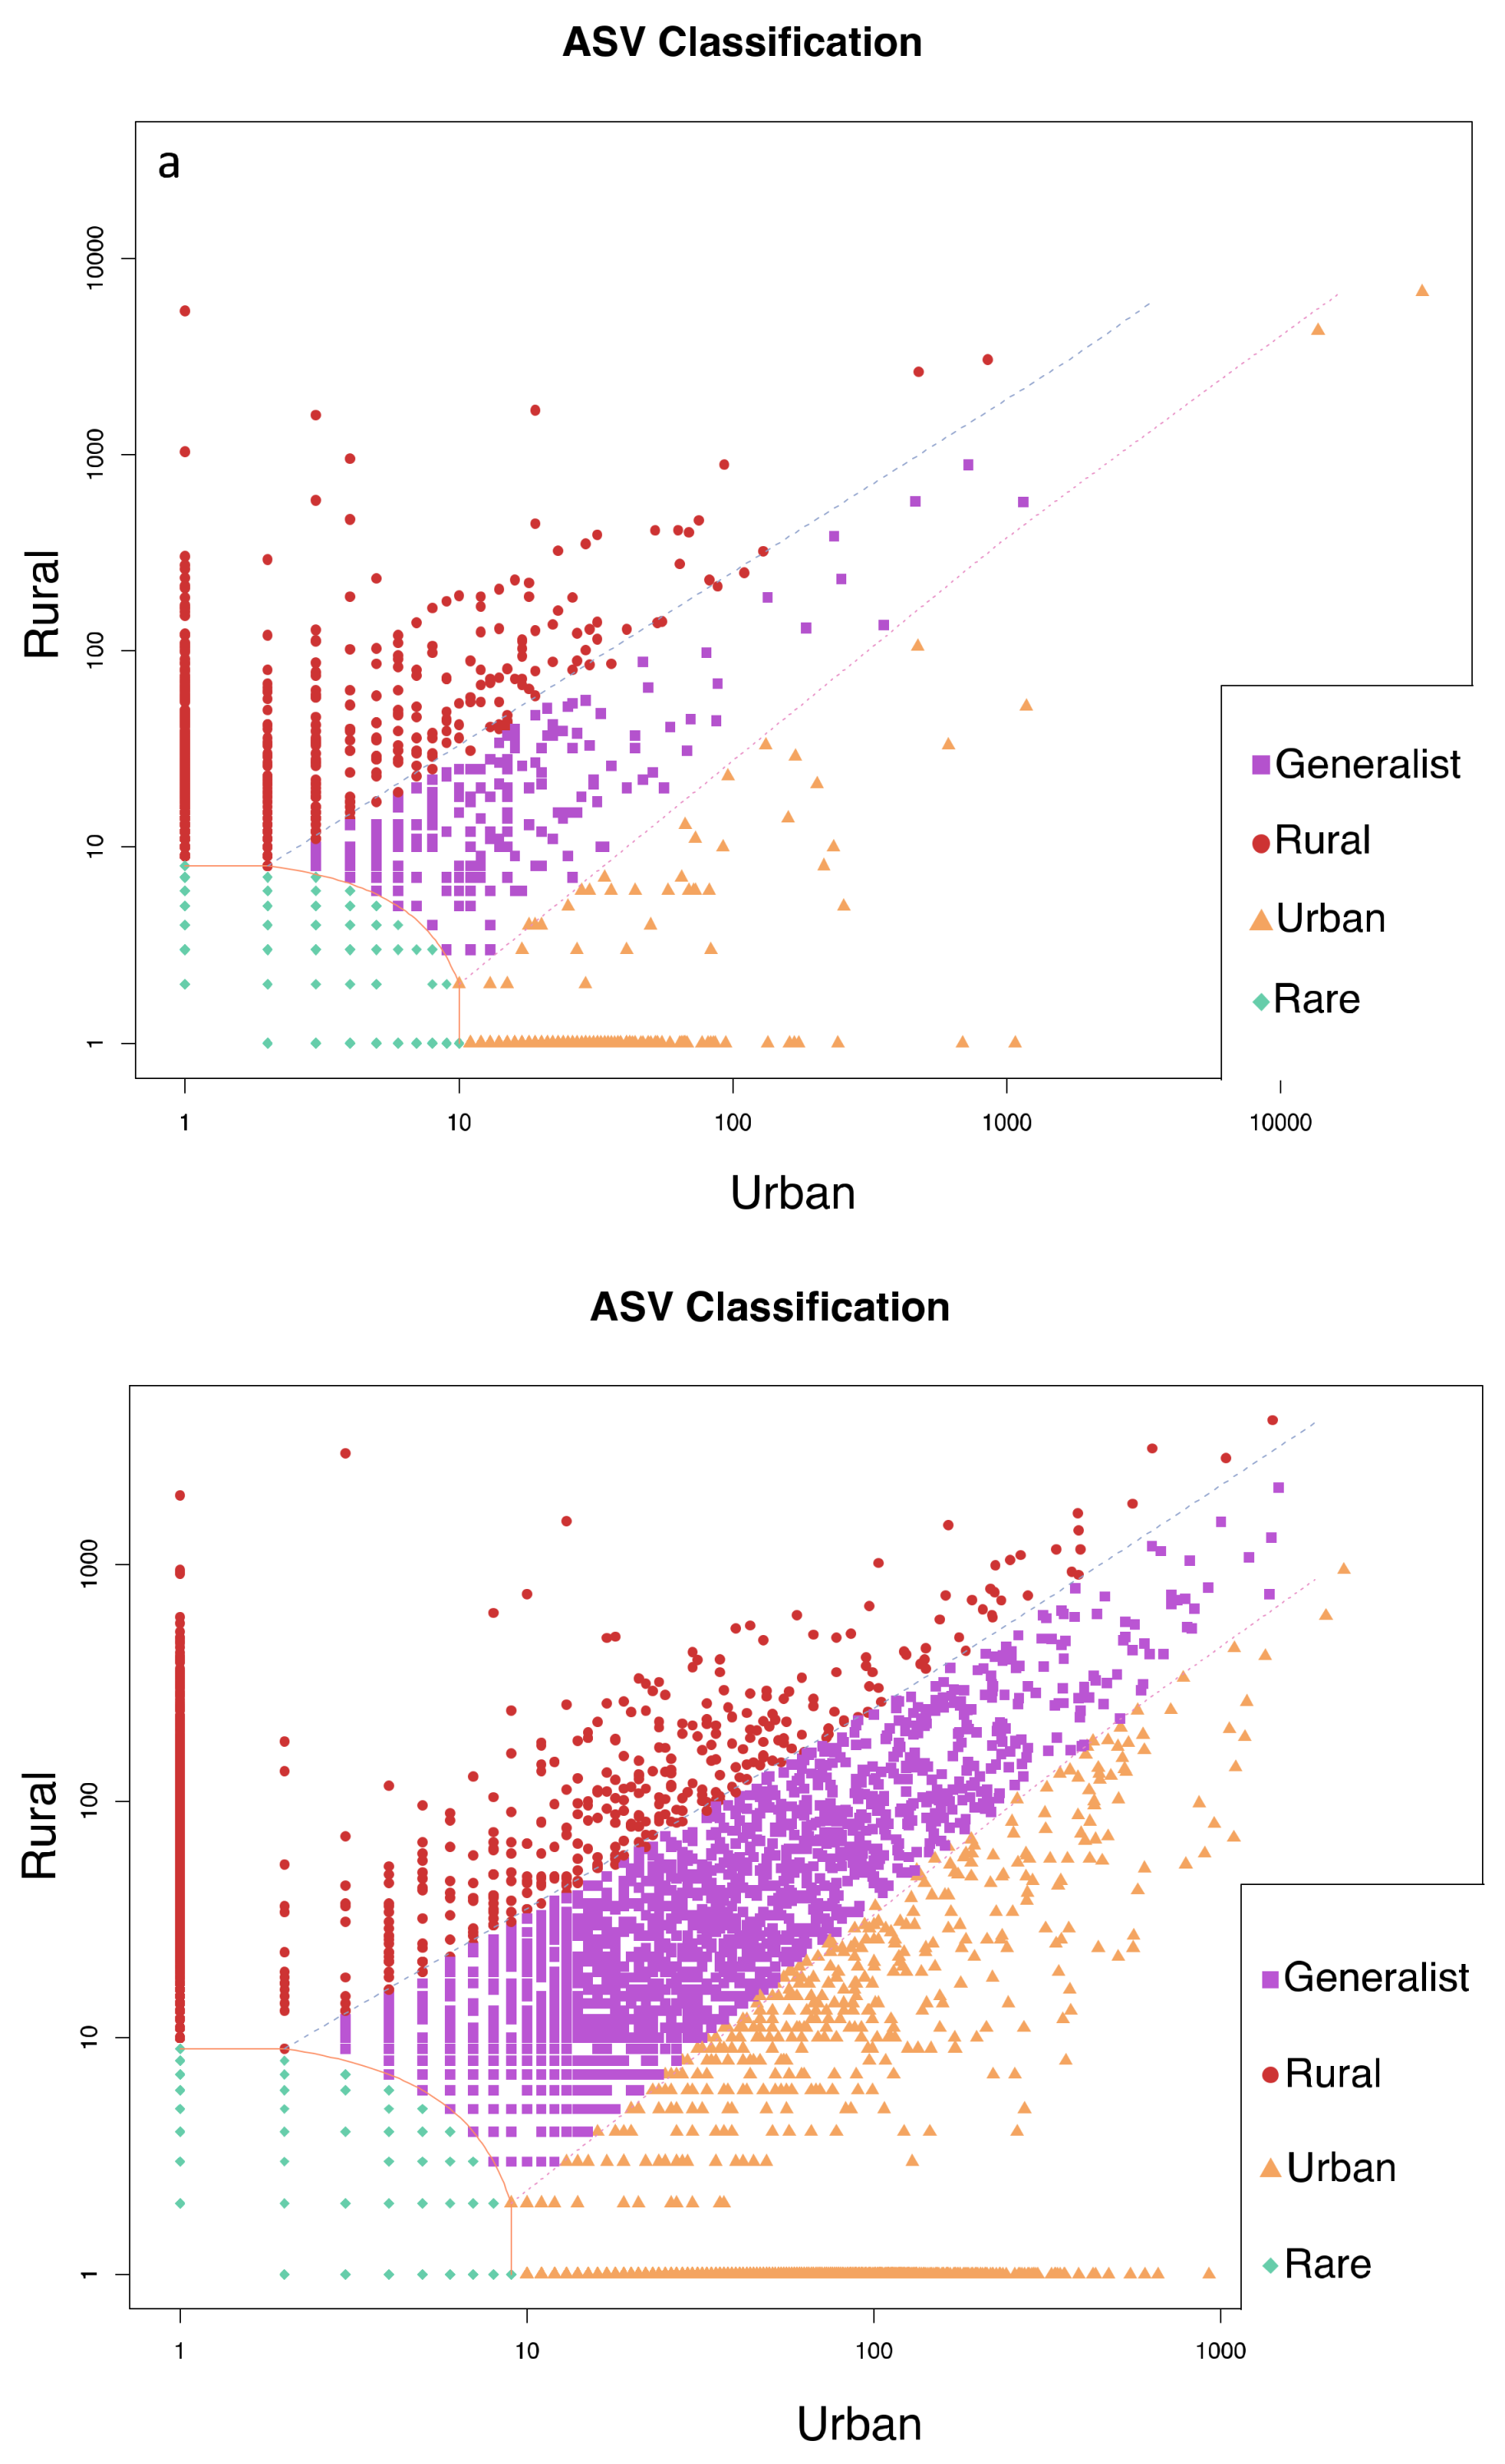
Urban and rural sites in Buenos Aires and Washington D.C. contained ASVs that were classified as specialists for each habitat based on the CLAM test (Figure 5). In Buenos Aires, 5% were classified as urban specialists and 9% as rural specialists, while 82% of ASVs were too rare to classify. In Washington D.C., 21% were urban specialists, 16% were rural specialists, and 52% were too rare to classify.
In Buenos Aires only 12 taxa were indicators of the urban site while 182 were identified in the rural site. In Washington D.C. there were 153 indicator taxa of the urban and 130 of the rural site. Among these indicator taxa, those that had the highest fidelity and specificity values as defined by Dufrêne and Legendre [60] were further examined to identify useful indicator taxa and compared between Buenos Aires. This resulted in 6 urban and 46 rural indicator taxa in Buenos Aires and 26 urban and 37 rural indicators in Washington D.C. (Table S2 in supplementary materials).
Nitrite-oxidizing bacteria of the genus Nitrospira and Nitrolancea were indicators of the urban environments in Washington D.C. and Buenos Aires, respectively. Bacteria of the family Nitrospiraceae were also relevant indicators of the rural environments at both sites. In Buenos Aires, ammonia-oxidizing archaea within the Thaumarchaeota were indicators of the urban location and had significantly higher relative abundance in the urban site (F = 7.4, p = 0.006) (Figure S4 in supplementary materials).
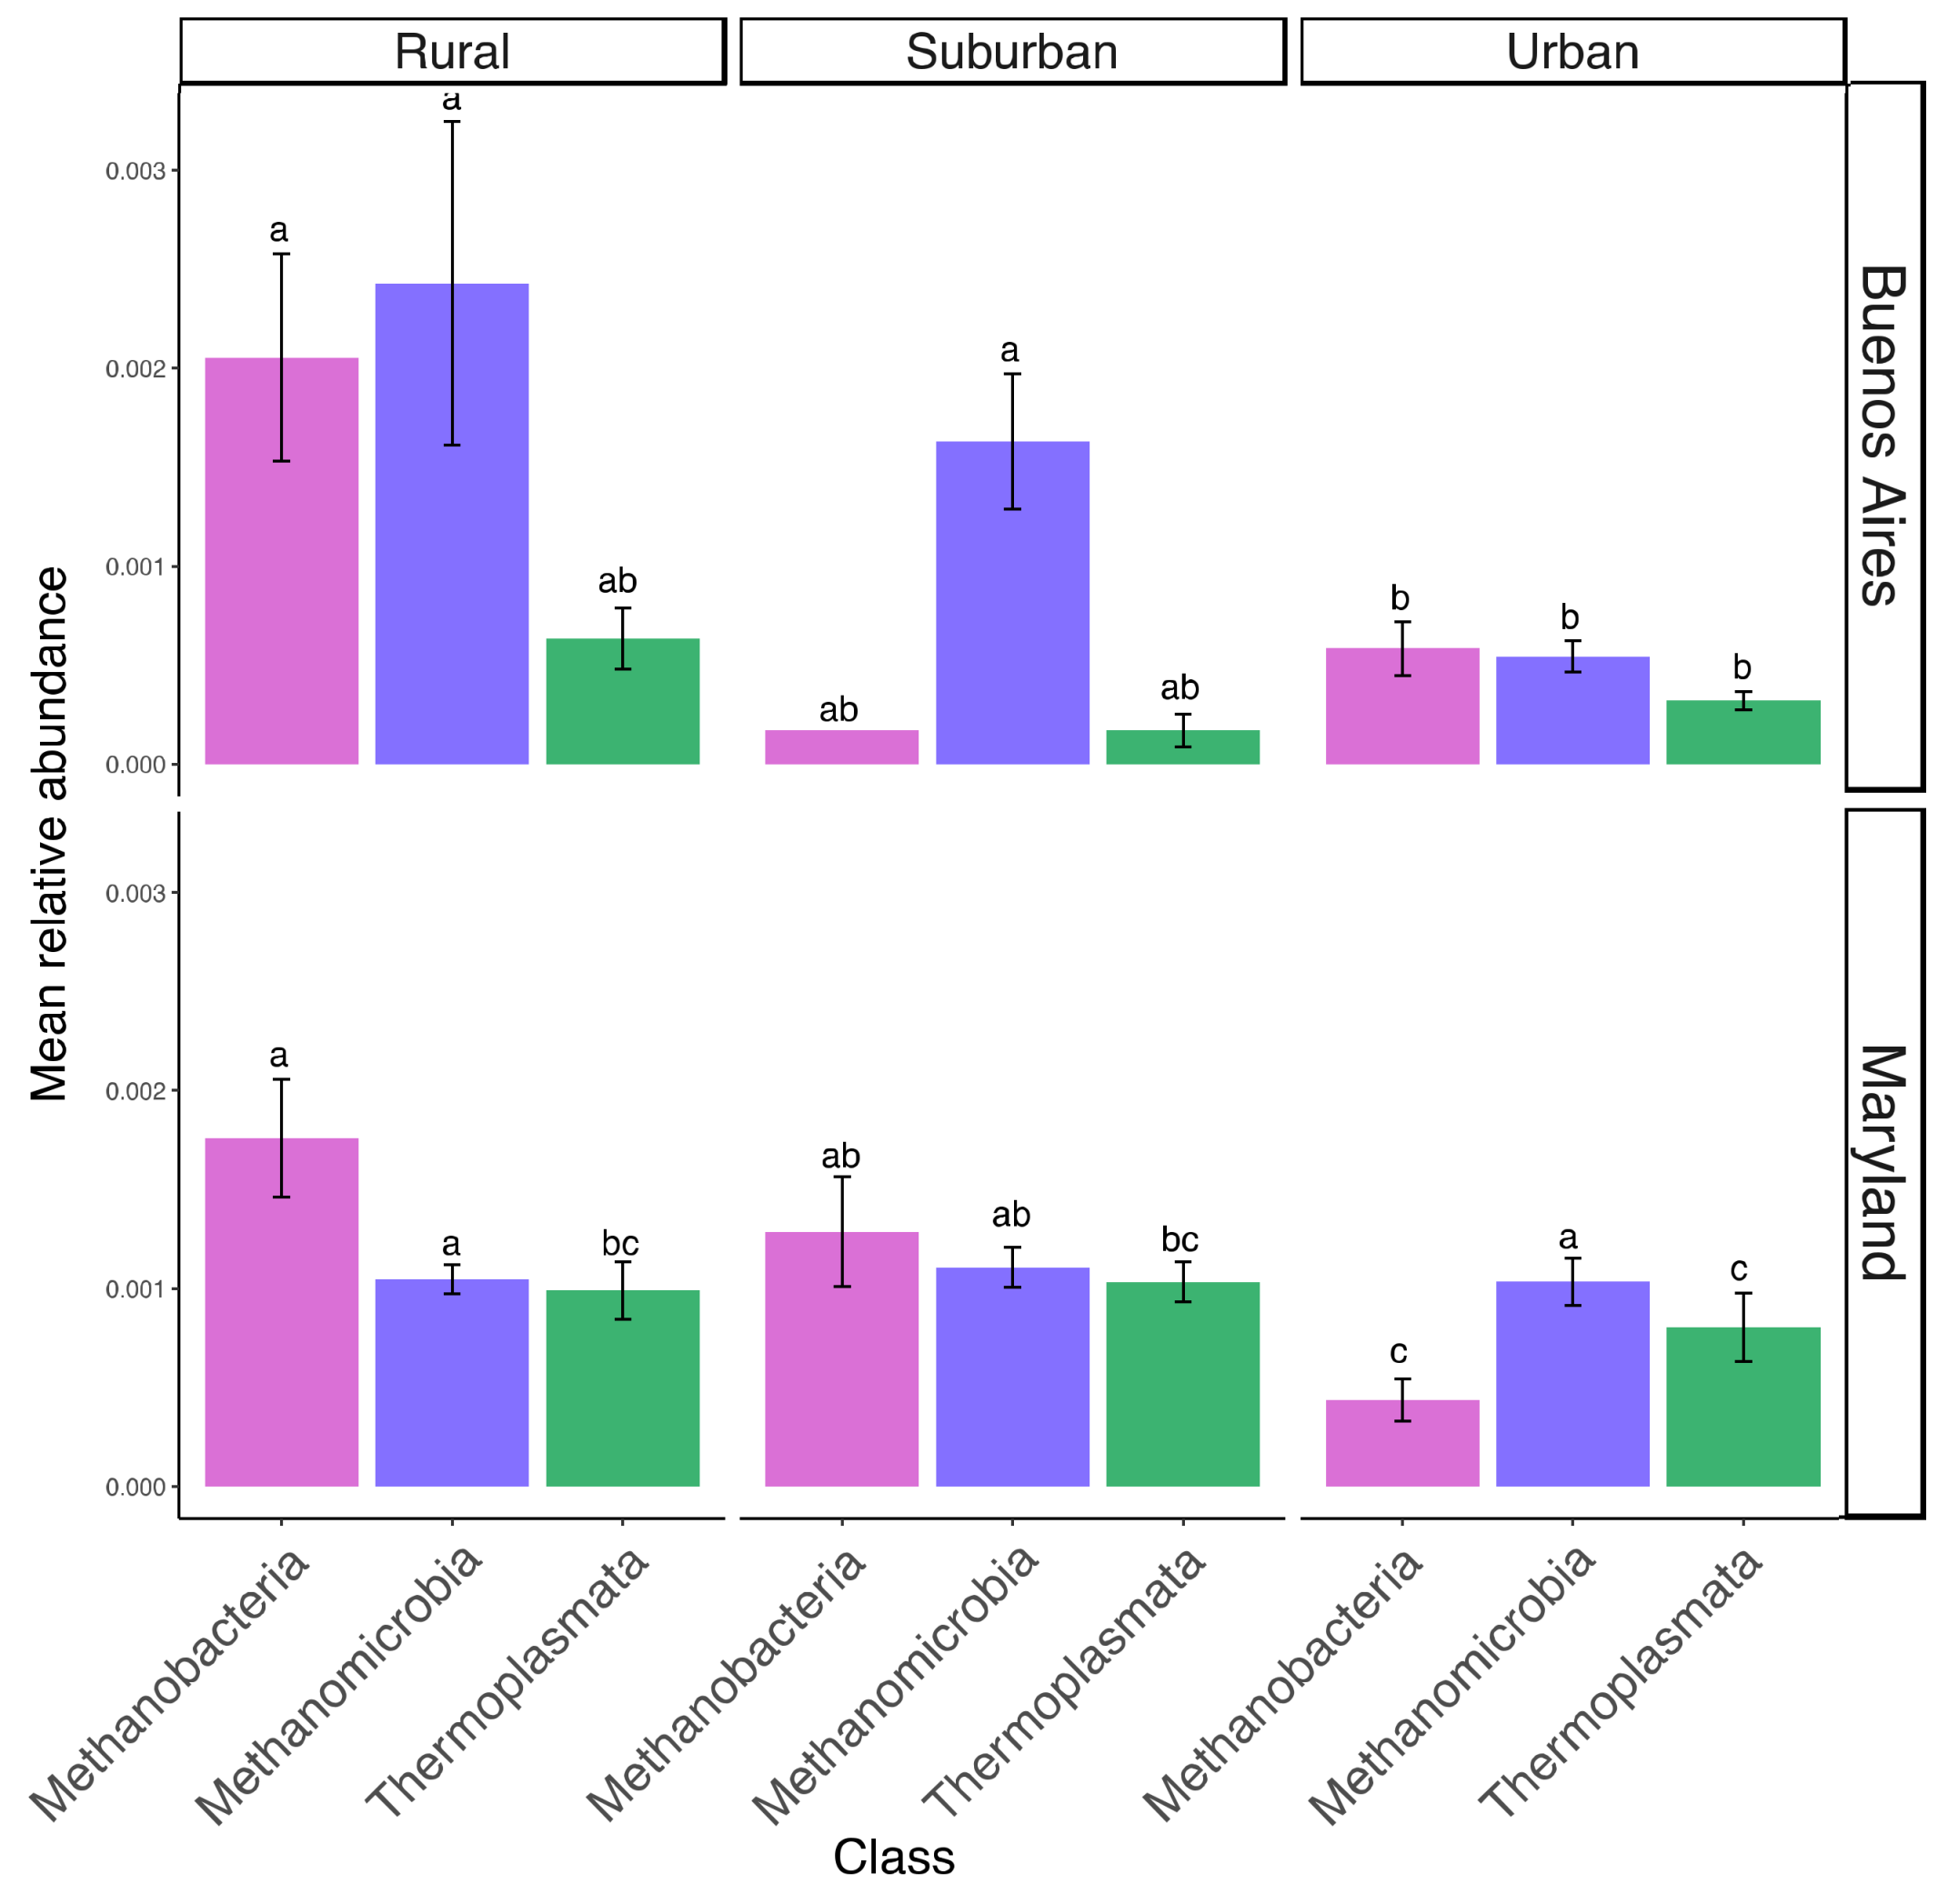
In addition to being highly correlated to rural sites in Buenos Aires and Maryland (Figure 2), Methanobacteria within the phylum Euryarchaeota were identified as rural indicators in both regions. Relative abundance of this phylum was significantly lower in urban than rural sites (Buenos Aires: t = 2.47, p = 0.03; Washington D.C.: t = 2.53, p = 0.03) and was mostly driven by a decrease in Methanobacteriales in both areas (Buenos Aires: t= 2.35, p = 0.04; Washington D.C.: t = 5.9, p < 0.001) (Figure 6).

4. Discussion

In support of hypothesis one, we observed differences in the prokaryotic community composition across the urban to rural gradient (Figure 2). A common factor that shapes prokaryotic community structure is soil pH [18,61]. In our study, pH did not vary significantly across the urbanization gradient in Buenos Aires, but did increase with urbanization in Washington D.C. Additionally, pH was negatively correlated to %SOM. In contrast, SOM was higher in urban than rural sites in Buenos Aires. In both cases, %SOM was significantly correlated to community composition along the gradient. A study by Arroyo et al. [62] found similar results in natural and constructed wetlands, where SOM and not pH was the main soil variable related to microbial communities.
Species richness and diversity did not change significantly across the urban gradient in either location. Our results differ from those of other studies that found urbanization was negatively related to species richness and diversity in urban rivers [63,64], but agrees with one study on headwater streams, where alpha diversity did not change due to urbanization [65]. Even though we did observe enrichment of certain bacterial groups in the urban sites (Figure S2 in supplementary materials), richness and diversity indexes did not differ across the established gradient at either area.
Consistent with previous studies in freshwater systems, Proteobacteria were the most abundant taxa in all sites [66,67]. This phylum was correlated with urban prokaryotic communities in Buenos Aires and Washington D.C. (Figure 2), and the Class Gammaproteobacteria was the main driver of that relationship in both cities. Associations between Proteobacteria and urbanization have been reported in other systems [63,68,69], and urban sites in our study had the greatest number of unique ASV’s (Figure 3). The nature of this association has been related to nutrient enrichment [63,70], which would be common in areas receiving sewage inputs or stormwater runoff.
Within the Class Gammaproteobacteria, the order Enterobacteriales was the most prevalent across sites in Buenos Aires, while the order Xanthomonadales was the most abundant in Washington D.C. These orders were significantly more prevalent in urban rather than rural sites, suggesting that this could be related to specific environmental stressors at each of the urban sites. For example, some members of the Enterobacteriales are widely used as indicators of fecal contamination [71], and the presence of E. coli and other gastrointestinal associated bacteria in the urban site in Buenos Aires (Figure S2a in supplementary materials) was likely related to sewage flow in that area [34]. In addition to being common residents of the human intestinal tract, Enterobacter and Citrobacter are capable of degrading various types of hydrocarbons [72,73]. The increase of these genera in suburban and urban sites (Figure S2a in supplementary materials) may be attributed to heavy boat traffic and industrialization. This observation was supported by the community’s KEGG functional profiles that showed an enrichment in xenobiotic biodegradation pathways in the urban site (Figure 4a).
In the Washington D.C. urban site, contamination with PAHs of industrial origin is a major environmental concern [74,75]. Although our study did not specifically test for PAHs, other studies observed an increase in these compounds in our specific urban location. Studies by Pinkney et al. [76,77] found that sediment PAH concentrations were considerably higher in the Anacostia than in the Choptank River (15–39mg/kg and 1.5 mg/kg dry weight respectively), where our urban and rural samples were collected. In our study, we found that there was a marked increase in the relative abundance of bacterial genera capable of degrading PAHs at the urban location relative to the rural and suburban sites (Figure S2b in supplementary materials). Our KEGG functional profiles were very limited at these sites, but the small subset of data obtained suggested that pathways associated to xenobiotic metabolism were more prevalent in the urban site, and these sites were functionally distinct from the rural sites (Figure 4b). We speculate that specific phyla were enriched in the urban sites in Buenos Aires and Washington D.C. as a result of major environmental pollutants affecting those areas, but functional gene analyses in future studies would help to corroborate this conclusion.
Archaea of the class Methanobacteria were relevant indicators in rural sites of Buenos Aires and Maryland, and were significantly more abundant in soils from rural compared to urban locations (Figure 6). Nutrient additions have been related to decreases in methanogenesis [78,79], and nitrate concentrations were found to be relevant in structuring archaeal communities in an urban river [63]. Our urban sites did not have significantly higher levels of total nitrogen, but inputs of mineral nitrogen associated with more impervious surfaces and sewage inputs could explain the observed reduction in Methanobacteria. This can be confirmed for our Washington D.C. sites, where levels of ammonia were significantly higher in our urban compared to our rural site [22,24]. Even though we lack mineral nitrogen data for the Buenos Aires sites, metabolic pathways associated with nitrification were more prevalent in the urban than rural sites (Figure 4a), and ammonia oxidizing archaea that are stimulated by high organic nitrogen loads [80] were identified as relevant indicators of the urban site in Buenos Aires. In addition, we observed a significant increase in ammonia-oxidizing archaea and bacteria in the urban sites relative to the suburban or rural sites in Buenos Aires and Washington D.C. (Figure S3 in supplementary materials). These results suggest that excess nitrogen inputs are likely related to changes in prokaryotic community composition in our urban sites.
The largest number of unique ASVs corresponded to the Deltaproteobacteria in Buenos Aires and Washington D.C. (Figure 3). Deltaproteobacteria are capable of anaerobic respiration of nitrogen and sulfur compounds and degradation of organic compounds in wetlands [67]. This group includes multiple families of sulfate reducing bacteria, which can utilize a variety of C sources, including lipids and PAHs, to carry out dissimilatory sulfate reduction [81,82,83]. Some sulfate reducing bacteria can remove toxic materials from the water [84], and increases in these bacterial groups have been related to wastewater loadings in some freshwater wetlands [85]. In our urban sites, factors like stormwater runoff, hydrocarbon pollution, and sewage inputs could therefore explain the unique community of Deltaproteobacteria.
Chloroflexi were significant components of the prokaryotic communities in both cities (Figure 2) and were predominantly represented by bacteria of the class Anaerolineae. A study on low tidal flats of an estuarine wetland found that the Class Anaerolineae was significantly correlated to total nitrogen and soil microbial respiration [86]. Members of the Class Anaerolineae are common components of anaerobic digesters, which would suggest that these bacteria could have an important role as part of the microbial heterotrophic community, but their ecological roles are still unknown [87]. Even though the functions of Anaerolineae remain elusive, they appear to be relevant in soil community structure and establish interactions with other groups of bacteria [88,89].
Acidobacteria belonging to the Class Subgroup 6 were the main group associated with urban communities in Maryland (Figure 2b). Bacteria belonging to this group have a complete set of genes to carry out assimilatory nitrate reduction and contain operons for detoxification of heavy metals [90]. Members of Subgroup 6 are abundant in nutrient rich soils and multiple groups of Acidobacteria can tolerate pollutants, such as PCBs and petroleum compounds. This has led to speculation that Acidobacteria might play a role in the degradation of such compounds [91].
Our results suggest that urban sites in Washington D.C. and Buenos Aires are subject to similar stressors, particularly higher concentrations of pollutants, and the shifts in prokaryotic community composition and putative functions reflected these conditions. Sewage inputs are also a concern at both urban sites and the presence of fecal bacteria in the Buenos Aires site was expected, as there is no sewage infrastructure. Our urban site in Washington D.C. also experiences frequent contamination from sewage [92], but our sampling time likely corresponded to a time when sewage concentrations were low. The closest combined sewer overflow outfall is located downstream of our sampling location and there were no heavy rainfall around our sampling date that would have resulted in overflow and subsequent upstream transport due to tides.
Our second and third hypotheses were not fully supported. Concerning hypothesis 2, which stated that prokaryotic communities would differ between plant species, we found that plant identity had a relatively small influence on community composition at each site (Figure 2). Therefore, factors associated with site differences had a greater role in structuring prokaryotic communities than plant properties. It is likely that other factors related to urbanization, such as various pollutants, override plant differences. Other studies in freshwater wetlands have found similar results, and concluded that either edaphic factors [93], site-specific factors [24], or certain landscape factors [94] have a greater effect in structuring prokaryotic communities.
Concerning our third hypothesis, we did not find a specific indicator taxa that was common for both urban locations. This is in part due to the large difference between prokaryotic communities in the two regions. When we compared the two regions, they were more different from each other than across the gradients (data not shown). We did, however, observe that methanogens were relevant indicators of both rural locations, and identified other functionally similar indicators at the different sites. Nitrite-oxidizing bacteria were indicators of urban and rural areas in Washington D.C., and those belonging to the Nitrospira have been previously identified as common indicators of freshwater sediments [16]. Some organisms within the genus Nitrospira can carry out complete nitrification [95], which would make them a relevant functional group in urban as well as in rural sites, where agriculture is the prevalent land use. In Buenos Aires, Chloroflexi bacteria belonging to the genus Nitrolancea were indicators of the urban site. These nitrite-oxidizing bacteria have only recently been described, and are considered to be better competitors at higher levels of nitrite than Nitrospira [96]. The identification of similar functions among the different indicator taxa at each location suggests that studies of functional traits rather than specific taxa would be a better approach to characterize prokaryotic communities in these urban wetlands.
The results of this study should be interpreted in light of the following limitations: we were unable to collect contaminant data for the different sites which could have helped support our findings, and functional data had to be inferred from community composition. In addition, sample size was low, and even though it was enough to detect site differences, a larger sample size might have allowed a better resolution of community differences between plant types. Studies of the proposed patterns and processes in other urban wetlands would be of interest.

5. Conclusions

Prokaryotic community composition shifted along the urban gradient in TFWs in Buenos Aires and Washington D.C. Given the important roles of bacteria and archaea in biogeochemical cycles, changes in community composition in these systems could have an effect on ecosystem function. In our study, differences in prokaryotic groups between sites likely reflected variation in environmental stressors, such as nutrient and hydrocarbon pollution. A loss of methanogens and an increase in nitrifying bacteria across the rural to urban gradient at both locations could have implications for nutrient and carbon processing in these systems, and might serve as an indicator of an altered state. Future studies of prokaryotic communities in other cities that experience either similar or different stressors would help confirm our observations. Our results also suggest that prokaryotic communities in these urban wetlands could be carrying out different functions than those in rural sites, particularly concerning pollutant transformation or removal.

Supplementary Materials

The following are available online at https://www.mdpi.com/2076-2607/7/3/72/s1. Figure S1: Rarefaction curves. Figure S2: Enterobacteriaceae and PAH degrading bacteria. Figure S2: NMDS of KEGG metabolic profiles. Figure S3: Relative abundance of AOA, AOB, and NOB. Table S1: Functional traits. Table S2: Indicator species.

Author Contributions

Conceptualization, M.G.M. and S.A.Y.; methodology, M.G.M., S.A.Y., C.P.M.,C.E.P., and A.H.B.; software, M.G.M.; validation, M.G.M.G., S.A.Y., and A.H.B.; formal analysis, M.G.M. and S.A.Y.; investigation, M.G.M., C.P.M., and C.E.P.; resources, S.A.Y. and A.H.B.; data curation, M.G.M.; writing—original draft preparation, M.G.M.; writing—review and editing, M.G.M., S.A.Y., A.H.B., and C.P.M.; visualization, M.G.M.; supervision, S.A.Y.; project administration, S.A.Y. and M.G.M.; funding acquisition, S.A.Y.

Funding

This work was supported by the Maryland Agriculture Experimental Station (MAES) and the United States Department of Agriculture National Institute of Food and Agriculture (project number MD-ENST-8752).

Acknowledgments

We want to thank John Federico Cantilli, Joshua Edward Drucker, Lindsay Volz, and Mark Brandon Mediate who helped with sample processing, Christine Maietta who contributed with soil texture data, and Benjamín Gonzalez Mateu who helped improve some of the figures. We want to thank Los Enanos Isla, and Verónica Salgado and Fabián Rodríguez for their hospitality and sampling assistance in Buenos Aires. Also, Aquiles Pirovano, who lent us his boat and assisted with field sampling together with Alejandra Mateu in the Buenos Aires locations.

Conflicts of Interest

The authors declare no conflict of interest.

References

  1. United Nations, Department of Economic and Social Affairs, Population Division. World Urbanization Prospects: The 2014 Revision; ST/ESA/SER.A/366; United Nations: New York, NY, USA, 2015. [Google Scholar]
  2. Zedler, J.B.; Kercher, S. WETLAND RESOURCES: Status, Trends, Ecosystem Services, and Restorability. Annu. Rev. Environ. Resour. 2005, 30, 39–74. [Google Scholar] [CrossRef]
  3. Van Asselen, S.; Verburg, P.H.; Vermaat, J.E.; Janse, J.H. Drivers of Wetland Conversion: A Global Meta-Analysis. PLoS ONE 2013, 8, e81292. [Google Scholar] [CrossRef] [PubMed]
  4. Tibbetts, J. Coastal Cities: Living on the Edge. Environ. Health Perspect. 2002, 110, A674–A681. [Google Scholar] [CrossRef] [PubMed]
  5. Urbanization as a Major Cause of Biotic Homogenization. Biol. Conserv. 2006, 127, 247–260. [CrossRef]
  6. Millennium Ecosystem Assesment. Ecosystems and Human Well-Being: Wetlands and Water Synthesis. Millennium Ecosystem Assessment Report to the Ramsar Convention; World Resources Institute: Washington, DC, USA, 2005. [Google Scholar]
  7. Arnold, C.L.; Gibbons, C.J. Impervious Surface Coverage: The Emergence of a Key Environmental Indicator. J. Am. Plan. Assoc. 1996, 62, 243–258. [Google Scholar] [CrossRef]
  8. Schueler, T. Impacts of Impervious Cover on Aquatic Systems; Watershed Protection Research Monograph No 1; Center for Watershed Protection: Ellicot City, MD, USA, 2003. [Google Scholar]
  9. Hupp, C.R.; Woodside, M.D.; Yanosky, T.M. Sediment and Trace Element Trapping in a Forested Wetland, Chickahominy River, Virginia. Wetlands 1993, 13, 95–104. [Google Scholar] [CrossRef]
  10. Kimbrough, K.L.; Dickhut, R.M. Assessment of Polycyclic Aromatic Hydrocarbon Input to Urban Wetlands in Relation to Adjacent Land Use. Mar. Pollut. Bull. 2006, 52, 1355–1363. [Google Scholar] [CrossRef] [PubMed]
  11. Ehrenfeld, J.G. Evaluating Wetlands within an Urban Context. Ecol. Eng. 2000, 15, 253–265. [Google Scholar] [CrossRef]
  12. Baldwin, A.H. Restoring Complex Vegetation in Urban Settings: The Case of Tidal Freshwater Marshes. Urban Ecosyst. 2004, 7, 125–137. [Google Scholar] [CrossRef]
  13. McKinney, M.L.; Lockwood, J.L. Biotic Homogenization: A Few Winners Replacing Many Losers in the next Mass Extinction. Trends Ecol. Evol. 1999, 14, 450–453. [Google Scholar] [CrossRef]
  14. Baiser, B.; Olden, J.D.; Record, S.; Lockwood, J.L.; McKinney, M.L. Pattern and Process of Biotic Homogenization in the New Pangaea. Proc. R. Soc. Lond. B Biol. Sci. 2012, 279, 4772–4777. [Google Scholar] [CrossRef] [PubMed]
  15. Johnson, P.T.; Hoverman, J.T.; McKenzie, V.J.; Blaustein, A.R.; Richgels, K.L.; Cadotte, M. Urbanization and wetland communities: Applying metacommunity theory to understand the local and landscape effects. J. Appl. Ecol. 2013, 50, 34–42. [Google Scholar] [CrossRef]
  16. Wang, S.; Wang, Y.; Feng, X.; Zhai, L.; Zhu, G. Quantitative Analyses of Ammonia-Oxidizing Archaea and Bacteria in the Sediments of Four Nitrogen-Rich Wetlands in China. Appl. Microbiol. Biotechnol. 2011, 90, 779–787. [Google Scholar] [CrossRef] [PubMed]
  17. Andersen, R.; Chapman, S.J.; Artz, R.R.E. Microbial Communities in Natural and Disturbed Peatlands: A Review. Soil Biol. Biochem. 2013, 57, 979–994. [Google Scholar] [CrossRef]
  18. Hartman, W.H.; Richardson, C.J.; Vilgalys, R.; Bruland, G.L. Environmental and Anthropogenic Controls over Bacterial Communities in Wetland Soils. Proc. Natl. Acad. Sci. USA 2008, 105, 17842–17847. [Google Scholar] [CrossRef] [PubMed]
  19. De Boer, W.; Kowalchuk, G.A.; van Veen, J.A. ‘Root-Food’ and the Rhizosphere Microbial Community Composition. New Phytol. 2006, 170, 3–6. [Google Scholar] [CrossRef] [PubMed]
  20. Neori, A.; Agami, M. The Functioning of Rhizosphere Biota in Wetlands—A Review. Wetlands 2017, 37, 615–633. [Google Scholar] [CrossRef]
  21. Cadillo-Quiroz, H.; Yavitt, J.B.; Zinder, S.H.; Thies, J.E. Diversity and Community Structure of Archaea Inhabiting the Rhizoplane of Two Contrasting Plants from an Acidic Bog. Microb. Ecol. 2010, 59, 757–767. [Google Scholar] [CrossRef] [PubMed]
  22. Yarwood, S.A.; Baldwin, A.H.; Mateu, M.G.; Buyer, J.S. Archaeal Rhizosphere Communities Differ between the Native and Invasive Lineages of the Wetland Plant Phragmites australis (Common Reed) in a Chesapeake Bay Subestuary. Biol. Invas. 2016, 18, 2717–2728. [Google Scholar] [CrossRef]
  23. Bowen, J.L.; Kearns, P.J.; Byrnes, J.E.; Wigginton, S.; Allen, W.J.; Greenwood, M.; Tran, K.; Yu, J.; Cronin, J.T.; Meyerson, L.A. Lineage Overwhelms Environmental Conditions in Determining Rhizosphere Bacterial Community Structure in a Cosmopolitan Invasive Plant. Nat. Commun. 2017, 8, 433. [Google Scholar] [CrossRef] [PubMed]
  24. Prasse, C.E.; Baldwin, A.H.; Yarwood, S.A. Site History and Edaphic Features Override the Influence of Plant Species on Microbial Communities in Restored Tidal Freshwater Wetlands. Appl. Environ. Microbiol. 2015, 81, 3482–3491. [Google Scholar] [CrossRef] [PubMed] [Green Version]
  25. Cowardin, L.M.; Carter, V.; Golet, F.C.; LaRoe, E.T. Classification of Wetlands and Deepwater Habitats of the United States; U.S. Fish and Wildlife Service Report No. FWS/ OBS/-79/31; U.S. Fish and Wildlife Service: Washington, DC, USA, 1979.
  26. Whigham, D.F.; Baldwin, A.H.; Barendregt, A. Tidal Freshwater Wetlands” in Coastal Wetlands: An Integrated Ecosystem Approach; Elsevier: Amsterdam, the Netherlands, 2009. [Google Scholar]
  27. Simpson, R.L.; Good, R.E.; Leck, M.A.; Whigham, D.F. The Ecology of Freshwater Tidal Wetlands. BioScience 1983, 33, 255–259. [Google Scholar] [CrossRef]
  28. Barendregt, A.; Swarth, C.W. Tidal Freshwater Wetlands: Variation and Changes. Estuar. Coasts 2013, 36, 445–456. [Google Scholar] [CrossRef]
  29. Instituto Nacional de Estadística y Censos. Censo Nacional de Población, Hogares y Viviendas 2010. Available online: https://www.indec.gov.ar/nivel4_default.asp?id_tema_1=2&id_tema_2=41&id_tema_3=135 (accessed on 27 April 2018).
  30. DC Office of Planning. 2017 Annual Estimates of Population. Available online: https://planning.dc.gov/node/1296421 (accessed on 27 April 2018).
  31. Iriondo, M. The Littoral Complex at the Paraná Mouth. Q. Int. 2004, 114, 143–154. [Google Scholar] [CrossRef]
  32. Kandus, P.; Malvárez, A.I. Vegetation Patters and Change Analysis in the Lower Delta Islands of the Parana River (Argentina). Wetlands 2004, 24, 620–632. [Google Scholar] [CrossRef]
  33. Minotti, P.G.; Kandus, P. Actualización y Profundización del Mapa de Endicamientos y Terraplenes de la Región del Delta del Paraná. 2013. Available online: https://lac.wetlands.org/publicacion/actualizacion-y-profundizacion-del-mapa-de-endicamientos-y-terraplenes-de-la-region-del-delta-del-parana-2013/ (accessed on 27 April 2018).
  34. Fabricante, I.; Minotti, P.; Kandus, P. Urbanizaciones Cerradas en Humedales: Análisis espacial en el Delta del Paraná y en las Llanuras Aluviales de sus Principales Tributarios en Sector Continental de la Provincia de Buenos Aires. Urbanization in Wetlands. Fundación Humedales/Wetlands International; Laboratorio de Ecología Teledetección y Ecoinformática (LETyE) Instituto de Investigación e Ingeniería Ambiental (3iA) Universidad Nacional de General San Martín (UNSAM): San Martín, Argentina, 2012. [Google Scholar]
  35. Bisogno, M.C. Sustentabilidad de la Actividad Turística en la Primera Sección de Islas del Bajo Delta del Paraná (Tigre). Ph.D. Thesis, Universidad de Buenos Aires, Buenos Aires, Argentina, 2005. [Google Scholar]
  36. Fundación Metropolitana and Municipalidad de Tigre. Documento Base-Plan de Manejo Islas del Delta Tigre. 2012. Available online: http://metropolitana.org.ar/wp-content/uploads/downloads/2013/03/Plan-de-Manejo-Delta-Tigre-Documento-Base.pdf (accessed on 27 April 2018).
  37. Odum, W.E.; Smith, T.J.I.; Hoover, J.K.; McIvor, C.C. The Ecology of Tidal Freshwater Marshes of the United States East Coast: A Community Profile; FWS/OBS-83/17; U.S. Fish and Wildlife Service: Washington, DC, USA, 1984.
  38. Boesch, D.F.; Greer, J. Chesapeake Futures: Choices for the 21st Century; Chesapeake Research Consortium, Inc.: Edgewater, MD, USA, 2003. [Google Scholar]
  39. Dauer, D.M.; Ranasinghe, J.A.; Weisberg, S.B. Relationships between Benthic Community Condition, Water Quality, Sediment Quality, Nutrient Loads, and Land Use Patterns in Chesapeake Bay. Estuaries 2000, 23, 80–96. [Google Scholar] [CrossRef]
  40. Kemp, W.M.; Boynton, W.R.; Adolf, J.E.; Boesch, D.F.; Boicourt, W.C.; Brush, G.; Cornwell, J.C.; Fisher, T.R.; Glibert, P.M.; Hagy, J.D.; et al. Eutrophication of Chesapeake Bay: Historical Trends and Ecological Interactions. Mar. Ecol. Prog. Ser. 2005, 303, 1–29. [Google Scholar] [CrossRef]
  41. Ellis, J.B.; Wang, Y. Bacteriology of Urban Runoff: The Combined Sewer as a Bacterial Reactor and Generator. Water Sci. Technol. 1995, 31, 303. [Google Scholar] [CrossRef]
  42. Castañé, P.M.; Sánchez-Caro, A.; Salibián, A. Water Quality of the Luján River, a Lowland Watercourse near the Metropolitan Area of Buenos Aires (Argentina). Environ. Monit. Assess. 2015, 187, 645. [Google Scholar] [CrossRef] [PubMed]
  43. Fisher, T.R.; Hagy, J.D.; Boynton, W.R.; Williams, M.R. Cultural Eutrophication in the Choptank and Patuxent Estuaries of Chesapeake Bay. Limnol. Oceanogr. 2006, 51, 435–447. [Google Scholar] [CrossRef]
  44. Mozdzer, T.J.; Zieman, J.C. Ecophysiological Differences between Genetic Lineages Facilitate the Invasion of Non-native Phragmites Australis in North American Atlantic Coast Wetlands. J. Ecol. 2010, 98, 451–458. [Google Scholar] [CrossRef]
  45. League, M.T.; Colbert, E.P.; Seliskar, D.M.; Gallagher, J.L. Rhizome Growth Dynamics of Native and Exotic Haplotypes of Phragmites Australis (Common Reed). Estuar. Coasts 2006, 29, 269–276. [Google Scholar] [CrossRef]
  46. Gee, W.G.; Or, D. Particle-Size Analysis. In Methods of Soil Analysis: Part 4 Physical Methods; Soil Science Society of America, Inc.: Madison, WI, USA, 2002; pp. 255–293. [Google Scholar]
  47. Caporaso, J.G.; Lauber, C.L.; Walters, W.A.; Berg-Lyons, D.; Huntley, J.; Fierer, N.; Owens, S.M.; Betley, J.; Fraser, L.; Bauer, M.; et al. Ultra-high-throughput microbial community analysis on the Illumina HiSeq and MiSeq platforms. ISME J. 2012, 6, 1621–1624. [Google Scholar] [CrossRef] [PubMed] [Green Version]
  48. RStudio Team. RStudio: Integrated Development for R; RStudio, Inc.: Boston, MA, USA, 2006. [Google Scholar]
  49. Callahan, B.J.; McMurdie, P.J.; Rosen, M.J.; Han, A.W.; Johnson, A.J.A.; Holmes, S.P. DADA2: High-resolution sample inference from Illumina amplicon data. Nat. Methods 2016, 13, 581–583. [Google Scholar] [CrossRef] [PubMed] [Green Version]
  50. McMurdie, P.J.; Holmes, S. Phyloseq: An R Package for Reproducible Interactive Analysis and Graphics of Microbiome Census Data. PLoS ONE 2013, 8, e61217. [Google Scholar] [CrossRef] [PubMed]
  51. Oksanen, J.; Blanchet, F.G.; Kindt, R.; Legendre, P.; O’hara, R.B.; Simpson, G.L.; Solymos, P.; Stevens, M.H.; Wagner, H. Vegan: Community Ecology Package. R Package Version 2.4-6. 2018. Available online: https://CRAN.R-project.org/package=vegan (accessed on 27 April 2018).
  52. Hervé, M. RVAideMemoire: Testing and Plotting Procedures for Biostatistics, R package Version 0.9-69. Available online: https://CRAN.R-project.org/package=RVAideMemoire (accessed on 6 March 2019).
  53. Chazdon, R.L.; Chao, A.; Colwell, R.K.; Lin, S.Y.; Norden, N.; Letcher, S.G.; Clark, D.B.; Finegan, B.; Arroyo, J.P. A Novel Statistical Method for Classifying Habitat Generalists and Specialists. Ecology 2011, 92, 1332–1343. [Google Scholar] [CrossRef] [PubMed]
  54. De Caceres, M.; Legendre, P. Associations between species and groups of sites: Indices and statistical inference. Ecology 2009, 90, 3566–3574. [Google Scholar] [CrossRef] [PubMed]
  55. Woloszynek, S.; Mell, J.C.; Simpson, G.; Rosen, G.L. Exploring thematic structure in 16S rRNA marker gene surveys. bioRxiv 2017. [Google Scholar] [CrossRef]
  56. Wilkins, D.; Unioinplot. Github Repository. 2016. Available online: https://github.com/wilkox/unionplot (accessed on 1 February 2018).
  57. Hamann, C.; Hegemann, J.; Hildebrandt, A. Detection of polycyclic aromatic hydrocarbon degradation genes in different soil bacteria by polymerase chain reaction and DNA hybridization. FEMS Microbiol. Lett. 1999, 173, 255–263. [Google Scholar] [CrossRef] [PubMed] [Green Version]
  58. Shuai, J.J.; Tian, Y.S.; Yao, Q.H.; Peng, R.H.; Xiong, F.; Xiong, A.S. Identification and Analysis of Polychlorinated Biphenyls (PCBs)-Biodegrading Bacterial Strains in Shanghai. Curr. Microbiol. 2010, 61, 477–483. [Google Scholar] [CrossRef] [PubMed]
  59. Ghosal, D.; Ghosh, S.; Dutta, T.K.; Ahn, Y. Current State of Knowledge in Microbial Degradation of Polycyclic Aromatic Hydrocarbons (PAHs): A Review. Front. Microbiol. 2016, 7, 01369. [Google Scholar] [CrossRef] [PubMed]
  60. Dufrêne, M.; Legendre, P. Species Assemblages and Indicator Species:The need for a flexible asymmetrical approach. Ecol. Monogr. 1997, 67, 345–366. [Google Scholar] [CrossRef]
  61. Lauber, C.L.; Hamady, M.; Knight, R.; Fierer, N. Pyrosequencing-Based Assessment of Soil PH as a Predictor of Soil Bacterial Community Structure at the Continental Scale. Appl. Environ. Microbiol. 2009, 75, 5111–5120. [Google Scholar] [CrossRef] [PubMed]
  62. Arroyo, P.; de Miera, L.E.S.; Ansola, G. Influence of Environmental Variables on the Structure and Composition of Soil Bacterial Communities in Natural and Constructed Wetlands. Sci. Total Environ. 2015, 506, 380–390. [Google Scholar] [CrossRef] [PubMed]
  63. Wang, L.; Zhang, J.; Li, H.; Yang, H.; Peng, C.; Peng, Z.; Lu, L. Shift in the Microbial Community Composition of Surface Water and Sediment along an Urban River. Sci. Total Environ. 2018, 627, 600–612. [Google Scholar] [CrossRef] [PubMed]
  64. Jani, K.; Ghattargi, V.; Pawar, S.; Inamdar, M.; Shouche, Y.; Sharma, A. Anthropogenic Activities Induce Depletion in Microbial Communities at Urban Sites of the River Ganges. Curr. Microbiol. 2018, 75, 79–83. [Google Scholar] [CrossRef] [PubMed]
  65. Hosen, J.D.; Febria, C.M.; Crump, B.C.; Palmer, M.A. Watershed Urbanization Linked to Differences in Stream Bacterial Community Composition. Front. Microbiol. 2017, 8, 01452. [Google Scholar] [CrossRef] [PubMed]
  66. Nold, S.C.; Zwart, G. Patterns and Governing Forces in Aquatic Microbial Communities. Aquat. Ecol. 1998, 32, 17–35. [Google Scholar] [CrossRef]
  67. Lv, X.; Yu, J.; Fu, Y.; Ma, B.; Qu, F.; Ning, K.; Wu, H. A Meta-Analysis of the Bacterial and Archaeal Diversity Observed in Wetland Soils. Sci. World J. 2014. [Google Scholar] [CrossRef] [PubMed]
  68. Guan, X.; Zhu, L.; Li, Y.; Xie, Y.; Zhao, M.; Luo, X. Composition and Variation of Sediment Bacterial and NirS-Harboring Bacterial Communities at Representative Sites of the Bohai Gulf Coastal Zone, China. World J. Microbiol. Biotechnol. 2014, 30, 1291–1300. [Google Scholar] [CrossRef] [PubMed]
  69. Parajuli, A.; Grönroos, M.; Siter, N.; Puhakka, R.; Vari, H.K.; Roslund, M.I.; Jumpponen, A.; Nurminen, N.; Laitinen, O.H.; Hyöty, H.; et al. Urbanization Reduces Transfer of Diverse Environmental Microbiota Indoors. Front. Microbiol. 2018, 9, 84. [Google Scholar] [CrossRef] [PubMed]
  70. Fierer, N.; Bradford, M.A.; Jackson, R.B. Toward an ecological classification of soil bacteria. Ecology 2007, 88, 1354–1364. [Google Scholar] [CrossRef] [PubMed]
  71. Cabral, J.P.S. Water Microbiology. Bacterial Pathogens and Water. Int. J. Environ. Res. Public Health 2010, 7, 3657–3703. [Google Scholar] [CrossRef] [PubMed] [Green Version]
  72. Lors, C.; Damidot, D.; Ponge, J.; Périé, F. Comparison of a Bioremediation Process of PAHs in a PAH-Contaminated Soil at Field and Laboratory Scales. Environ. Pollut. 2012, 165, 11–17. [Google Scholar] [CrossRef] [PubMed]
  73. Selvakumaran, S.; Kapley, A.; Kashyap, S.M.; Daginawala, H.F.; Kalia, V.C.; Purohit, H.J. Diversity of Aromatic Ring-Hydroxylating Dioxygenase Gene in Citrobacter. Bioresour. Technol. 2011, 102, 4600–4609. [Google Scholar] [CrossRef] [PubMed]
  74. Foster, G.D.; Roberts, E.C.; Gruessner, B.; Velinsky, J. Hydrogeochemistry and transport of organic contaminants in an urban watershed of Chesapeake Bay (USA). Appl. Geochem. 2000, 15, 901–915. [Google Scholar] [CrossRef]
  75. Hwang, H.M.; Foster, G.D. Polychlorinated Biphenyls in Stormwater Runoff Entering the Tidal Anacostia River, Washington, DC, through Small Urban Catchments and Combined Sewer Outfalls. J. Environ. Sci. Health Part A 2008, 43, 567–575. [Google Scholar] [CrossRef] [PubMed]
  76. Pinkney, A.E.; Harshbarger, J.C.; Rutter, M.A. Tumors in Brown Bullheads in the Chesapeake Bay Watershed: Analysis of Survey Data from 1992 through 2006. J. Aquat. Anim. Health 2009, 21, 71–81. [Google Scholar] [CrossRef] [PubMed]
  77. Pinkney, A.E.; Harshbarger, J.C.; Karouna-Renier, N.K.; Jenko, K.; Balk, L.; Skarphéðinsdóttir, H.; Liewenborg, B.; Rutter, M.A. Tumor Prevalence and Biomarkers of Genotoxicity in Brown Bullhead (Ameiurus Nebulosus) in Chesapeake Bay Tributaries. Sci. Total Environ. 2011, 410, 248–257. [Google Scholar] [CrossRef] [PubMed]
  78. Bodelier, P.L.E. Interactions between Nitrogenous Fertilizers and Methane Cycling in Wetland and Upland Soils. Curr. Opin. Environ. Sustain. 2011, 3, 379–388. [Google Scholar] [CrossRef]
  79. Liu, H.; Wu, X.; Li, Z.; Wang, Q.; Liu, D.; Liu, G. Responses of Soil Methanogens, Methanotrophs, Methane Fluxes to Land-Use Conversion and Fertilization in a Hilly Red Soil Region of Southern China. Environ. Sci. Pollut. Res. Int. 2017, 24, 8731–8743. [Google Scholar] [CrossRef] [PubMed]
  80. Höfferle, Š.; Nicol, G.W.; Pal, L.; Hacin, J.; Prosser, J.I.; Mandić-Mulec, I. Ammonium Supply Rate Influences Archaeal and Bacterial Ammonia Oxidizers in a Wetland Soil Vertical Profile. FEMS Microbiol. Ecol. 2010, 74, 302–315. [Google Scholar] [CrossRef] [PubMed]
  81. Jorgensen, B.B.; Postgate, J.R. Ecology of the Bacteria of the Sulphur Cycle with Special Reference to Anoxic-Oxic Interface Environments. Philos. Trans. R. Soc. Lond. Ser. B 1982, 298, 543–561. [Google Scholar] [CrossRef] [PubMed]
  82. Suárez-Suárez, A.; López-López, A.; Tovar-Sánchez, A.; Yarza, P.; Orfila, A.; Terrados, J.; Arnds, J.; Marqués, S.; Niemann, H.; Schmitt-Kopplin, P.; et al. Response of Sulfate-reducing Bacteria to an Artificial Oil-spill in a Coastal Marine Sediment. Environ. Microbiol. 2011, 13, 1488–1499. [Google Scholar] [CrossRef] [PubMed]
  83. Muyzer, G.; Stams, A.J.M. The Ecology and Biotechnology of Sulphate-Reducing Bacteria. Nat. Rev. Microbiol. 2008, 6, 441–454. [Google Scholar] [CrossRef] [PubMed]
  84. Li, Y.H.; Zhu, J.N.; Zhai, Z.H.; Zhang, Q. Endophytic Bacterial Diversity in Roots of Phragmites australis in Constructed Beijing Cuihu Wetland (China). FEMS Microbiol. Lett. 2010, 309, 84–93. [Google Scholar] [CrossRef] [PubMed]
  85. Feng, J.; Hsieh, Y.P. Sulfate Reduction in Freshwater Wetland Soils and the Effects of Sulfate and Substrate Loading. J. Environ. Qual. 1998, 27, 968–972. [Google Scholar] [CrossRef]
  86. Hu, Y.; Wang, L.; Fu, X.; Yan, J.; Wu, J.; Tsang, Y.; Le, Y.; Sun, Y. Salinity and Nutrient Contents of Tidal Water Affects Soil Respiration and Carbon Sequestration of High and Low Tidal Flats of Jiuduansha Wetlands in Different Ways. Sci. Total Environ. 2016, 565, 637–648. [Google Scholar] [CrossRef] [PubMed]
  87. Xia, Y.; Wang, Y.; Wang, Y.; Chin, F.Y.L.; Zhang, T. Cellular Adhesiveness and Cellulolytic Capacity in Anaerolineae Revealed by Omics-Based Genome Interpretation. Biotechnol. Biofuels 2016, 9, 111. [Google Scholar] [CrossRef] [PubMed]
  88. Cardinale, M.; Grube, M.; Erlacher, A.; Quehenberger, J.; Berg, G. The lettuce root microbiota. Environ. Microbiol. 2015, 17, 239–252. [Google Scholar] [CrossRef] [PubMed]
  89. Yarwood, S.A.; Högberg, M.N. Soil Bacteria and Archaea Change Rapidly in the First Century of Fennoscandian Boreal Forest Development. Soil Biol. Biochem. 2017, 114, 160–167. [Google Scholar] [CrossRef]
  90. Huang, S.; Vieira, S.; Bunk, B.; Riedel, T.; Spröer, C.; Overmann, J. First Complete Genome Sequence of a Subdivision 6 Acidobacterium Strain. Genome Announ. 2016, 4, e00469-16. [Google Scholar] [CrossRef] [PubMed]
  91. Kielak, A.M.; Barreto, C.C.; Kowalchuk, G.A.; van Veen, J.A.; Kuramae, E.E. The Ecology of Acidobacteria: Moving beyond Genes and Genomes. Front. Microbiol. 2016, 7. [Google Scholar] [CrossRef] [PubMed]
  92. Velinsky, D.J.; Riedel, G.F.; Ashley, J.T.F.; Cornwell, J.C. Historical Contamination of the Anacostia River, Washington, D.C. Environ. Monit. Assess. 2011, 183, 307. [Google Scholar] [CrossRef] [PubMed]
  93. Otto, S.; Groffman, P.M.; Findlay, S.E.G.; Arreola, A.E. Invasive Plant Species and Microbial Processes in a Tidal Freshwater Marsh. J. Environ. Qual. 1999, 28, 1252–1257. [Google Scholar] [CrossRef]
  94. Peralta, A.L.; Matthews, J.W.; Flanagan, D.N.; Kent, A.D. Environmental Factors at Dissimilar Spatial Scales Influence Plant and Microbial Communities in Restored Wetlands. Wetlands 2012, 32, 1125–1134. [Google Scholar] [CrossRef]
  95. Daims, H.; Lebedeva, E.V.; Pjevac, P.; Han, P.; Herbold, C.; Albertsen, M.; Jehmlich, N.; Palatinszky, M.; Vierheilig, J.; Bulaev, A.; et al. Complete Nitrification by Nitrospira Bacteria. Nature 2015, 528, 504–509. [Google Scholar] [CrossRef] [PubMed]
  96. Sorokin, D.Y.; Lücker, S.; Vejmelkova, D.; Kostrikina, N.A.; Kleerebezem, R.; Rijpstra, W.I.; Damsté, J.S.; Le Paslier, D.; Muyzer, G.; Wagner, M.; et al. Nitrification Expanded: Discovery, Physiology and Genomics of a Nitrite-Oxidizing Bacterium from the Phylum Chloroflexi. ISME J. 2012, 6, 2245–2256. [Google Scholar] [CrossRef] [PubMed]
Figure 1. Location of sampling sites in Buenos Aires (a) and Washington D.C. (b). U = urban, S = suburban, and R = Rural. Base map: OpenStreetMap (https://www.openstreetmap.org).
Microorganisms 07 00072 g001
Figure 2. Non-metric multidimensional scaling ordination (NMDS) constructed using a Bray-Curtis dissimilarity matrix. Each point represents a sample with colors corresponding to sites, and shapes to plant species. The final stress values were 0.193 and 0.124 for the Buenos Aires (a) and Washington D.C. (b) ordinations, respectively. Vectors show the correlation of the most abundant phyla to community composition at the different sites.
Microorganisms 07 00072 g002
Figure 3. Venn-like representation of overlap between ASVs at urban, suburban, and rural sites for the phylum Proteobacteria. Each point represents an individual ASV with colors corresponding to different classes of Proteobacteria. Numbers in parenthesis indicate the total number of unique ASVs at each site. The center hexagon contains ASVs shared by all sites, while the trapezoids contain ASVs either exclusive to each site or those shared between two of them. In Buenos Aires (a) there were 45 ASVs shared by all sites and in Washington D.C. (b) 280. The plots were created using the unionplot R package [56].
Microorganisms 07 00072 g003
Figure 4. Bar plot showing mean abundance and standard error of metabolic pathways of nitrification and xenobiotic biodegradation across sites in Buenos Aires (a) and Washington D.C. (b).
Microorganisms 07 00072 g004
Figure 5. CLAM test results showing the classification of ASVs as habitat specialists or generalists based on relative abundance of species at each site for Buenos Aires (a) and Washington D.C. (b). ASVs were divided into four categories: urban specialists (Urban), rural specialists (Rural), generalists with no habitat preference, and too rare to classify (Rare). Note: some points are stacked so that specific values for each category can be found in the text.
Microorganisms 07 00072 g005
Figure 6. Mean relative abundance of Euryarchaeota classes for Buenos Aires and Washington D.C. in urban, suburban, and rural sites. Bars represent standard errors and different letters indicate significant differences between means (Tukey p < 0.05). Unclassified archaea are not included and only comprised 0.2% of total Euryarchaeota.
Microorganisms 07 00072 g006
Table 1. Soil characteristics for the urban, suburban, and rural sites within each area. Results are arithmetic means ± standard errors, except for texture results that are shown as percent values per site.
ParameterBuenos AiresMaryland
RuralSuburbanUrbanRuralSuburbanUrban
pH6.4 ± 0.25.4 ± 0.085.8 ± 0.14 ± 0.34.7 ± 0.15.7 ± 0.1
SOM (%)11.6 ± 0.56.6 ± 0.0224.7 ± 2.235.6 ± 0.511.8 ± 1.26.5 ± 0.7
C (%)2.7 ± 0.21.7 ± 0.13.54 ± 0.719 ± 0.25.6 ± 0.63 ± 0.4
N (%)0.2 ± 0.020.2 ± 0.010.32 ± 0.10.12 ± 0.10.4 ± 0.10.2 ± 0.03
C/N1311.6711.7715.6314.115.7
Sand (%)0.310.380.330.260.350.17
Silt (%)0.430.40.420.340.530.58
Clay (%)0.250.220.250.40.120.26