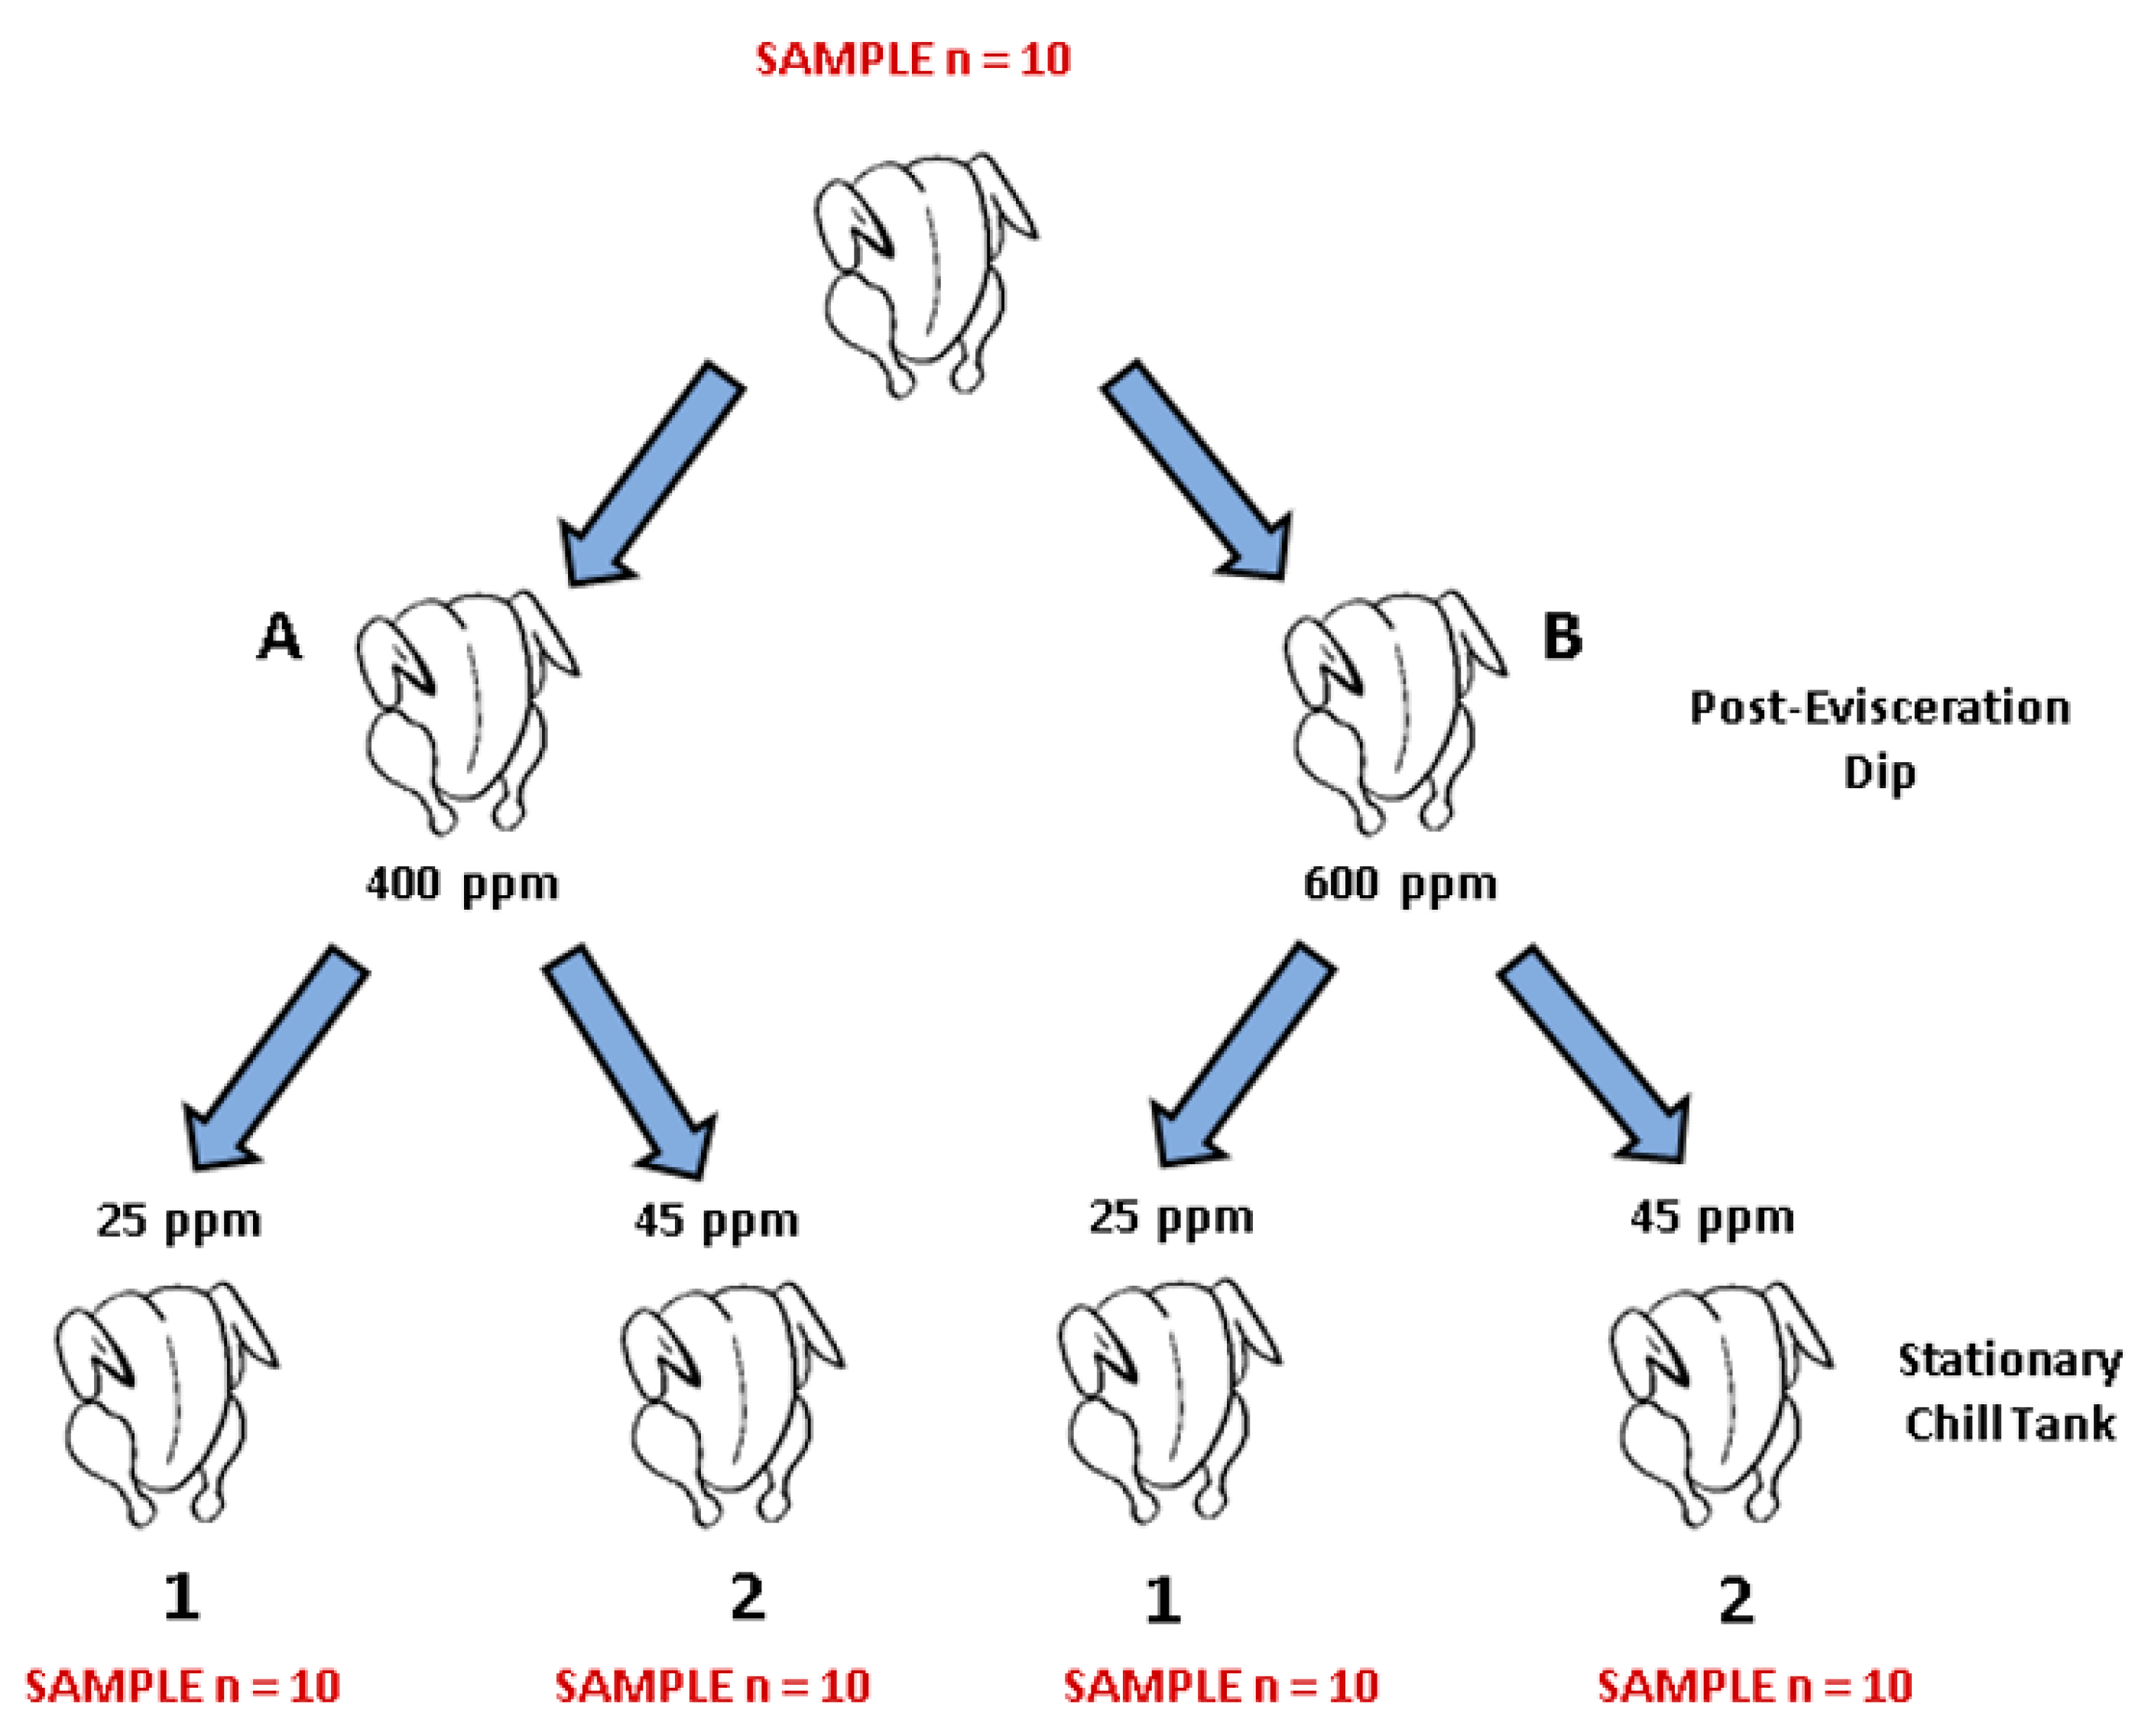
Figure 1.
Schematic of the sampling procedure followed in the current experiment. A total of 150 broilers were processed at the University of Arkansas poultry pilot processing plant, where sampling took place. For each PAA sanitizer tested (PeraClean, Competitor 1, and Competitor 2), ten birds were rinsed in 400 mL of neutralizing buffered peptone water (nBPW) for 1 min by manual shaking after manual evisceration took place and were discarded. Following this, forty birds were eviscerated and dipped in solution containing 400 or 600 ppm of PAA for ten seconds immediately after evisceration and then placed into four separate stationary chillers containing either 25 or 45 ppm of PAA sanitizers for 1 h. After birds had been chilled, carcasses were rinsed in nBPW and discarded. Rinsates were collected in specimen cups, stored on ice, and transported to the Center for Food Safety at the University of Arkansas for processing.
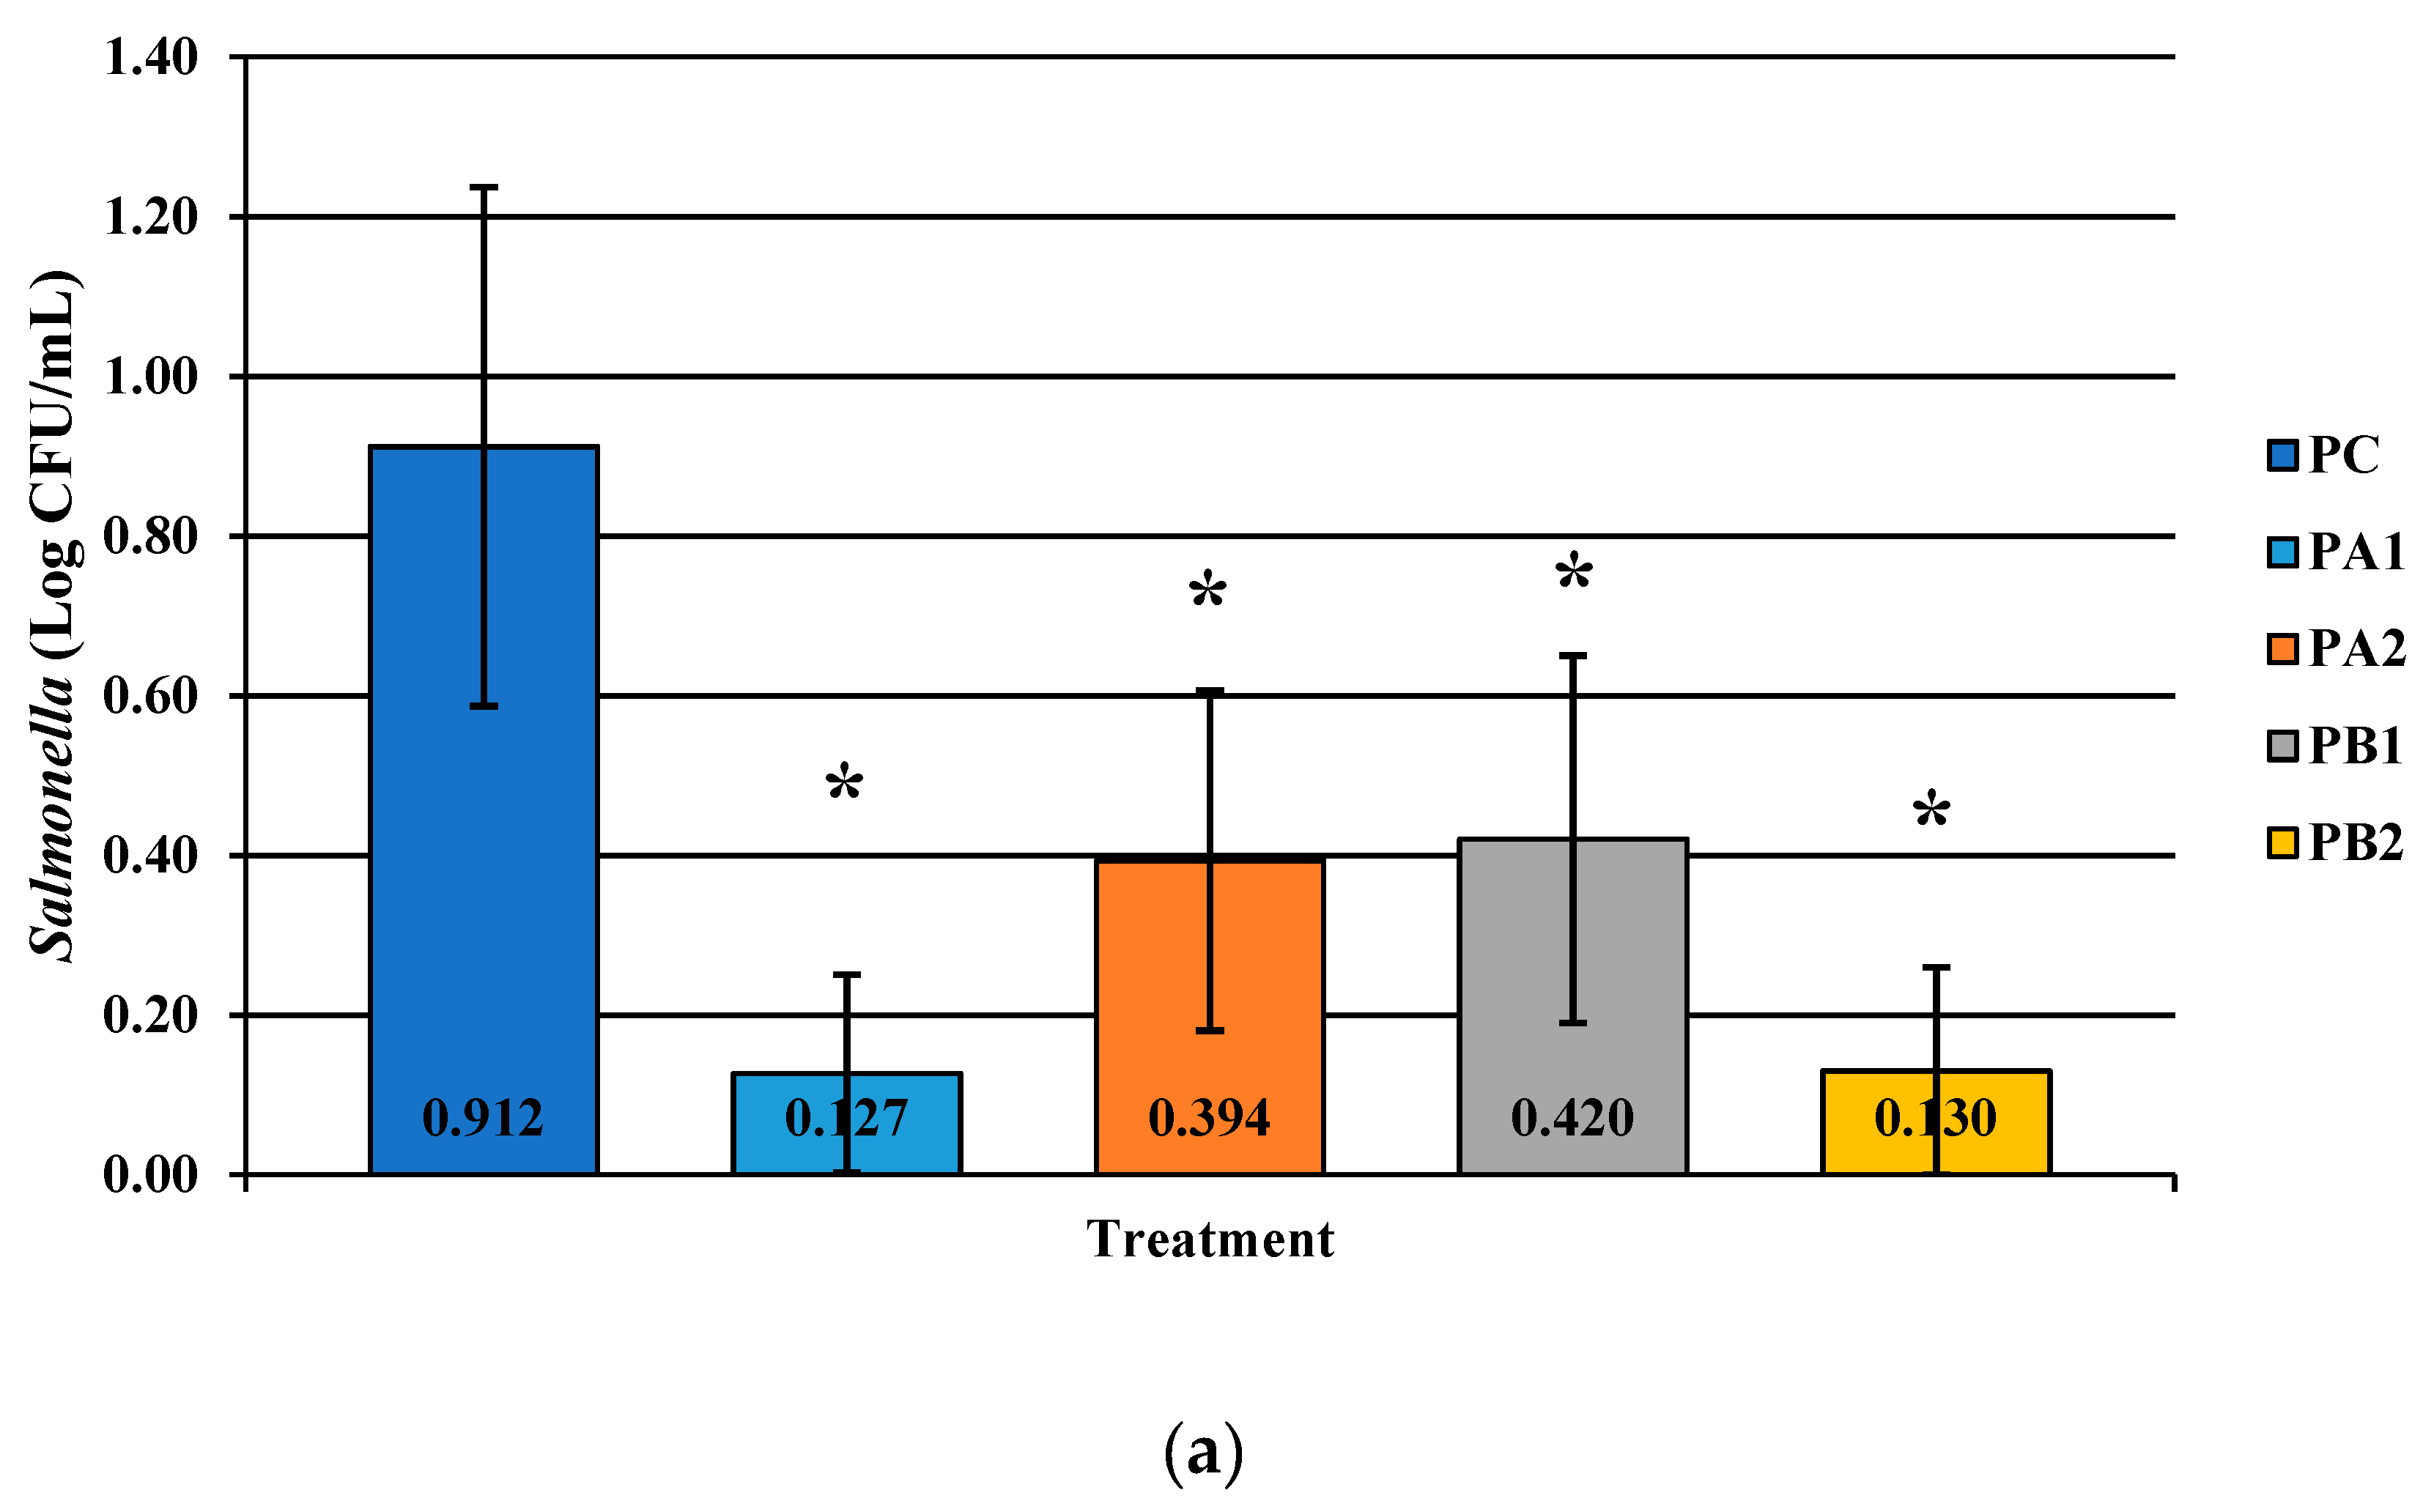
Figure 2.
The effect of PeraClean, a PAA acid sanitizer, used as an antimicrobial dip (400 or 600 ppm) and in a stationary chilling tank (25 or 45 ppm) on the load of Salmonella (a), total coliforms (b), and Campylobacter (c) present in the rinsates of 42-d-old Ross 708 broilers. The means are numerically stated on the bar graph. N = 50, n = 10, p < 0.0001 (a); N = 50, n = 10, p < 0.0001 (b); N = 50, n = 10, p < 0.0001 (c). PA1 refers to a 400 ppm/25 ppm treatment, PA2 refers to a 400 ppm/45 ppm treatment, PB1 refers to a 600 ppm/25 ppm treatment, and PB2 refers to a 600 ppm/45 ppm treatment, with each treatment being first a post-evisceration dip followed by an immersion chill.
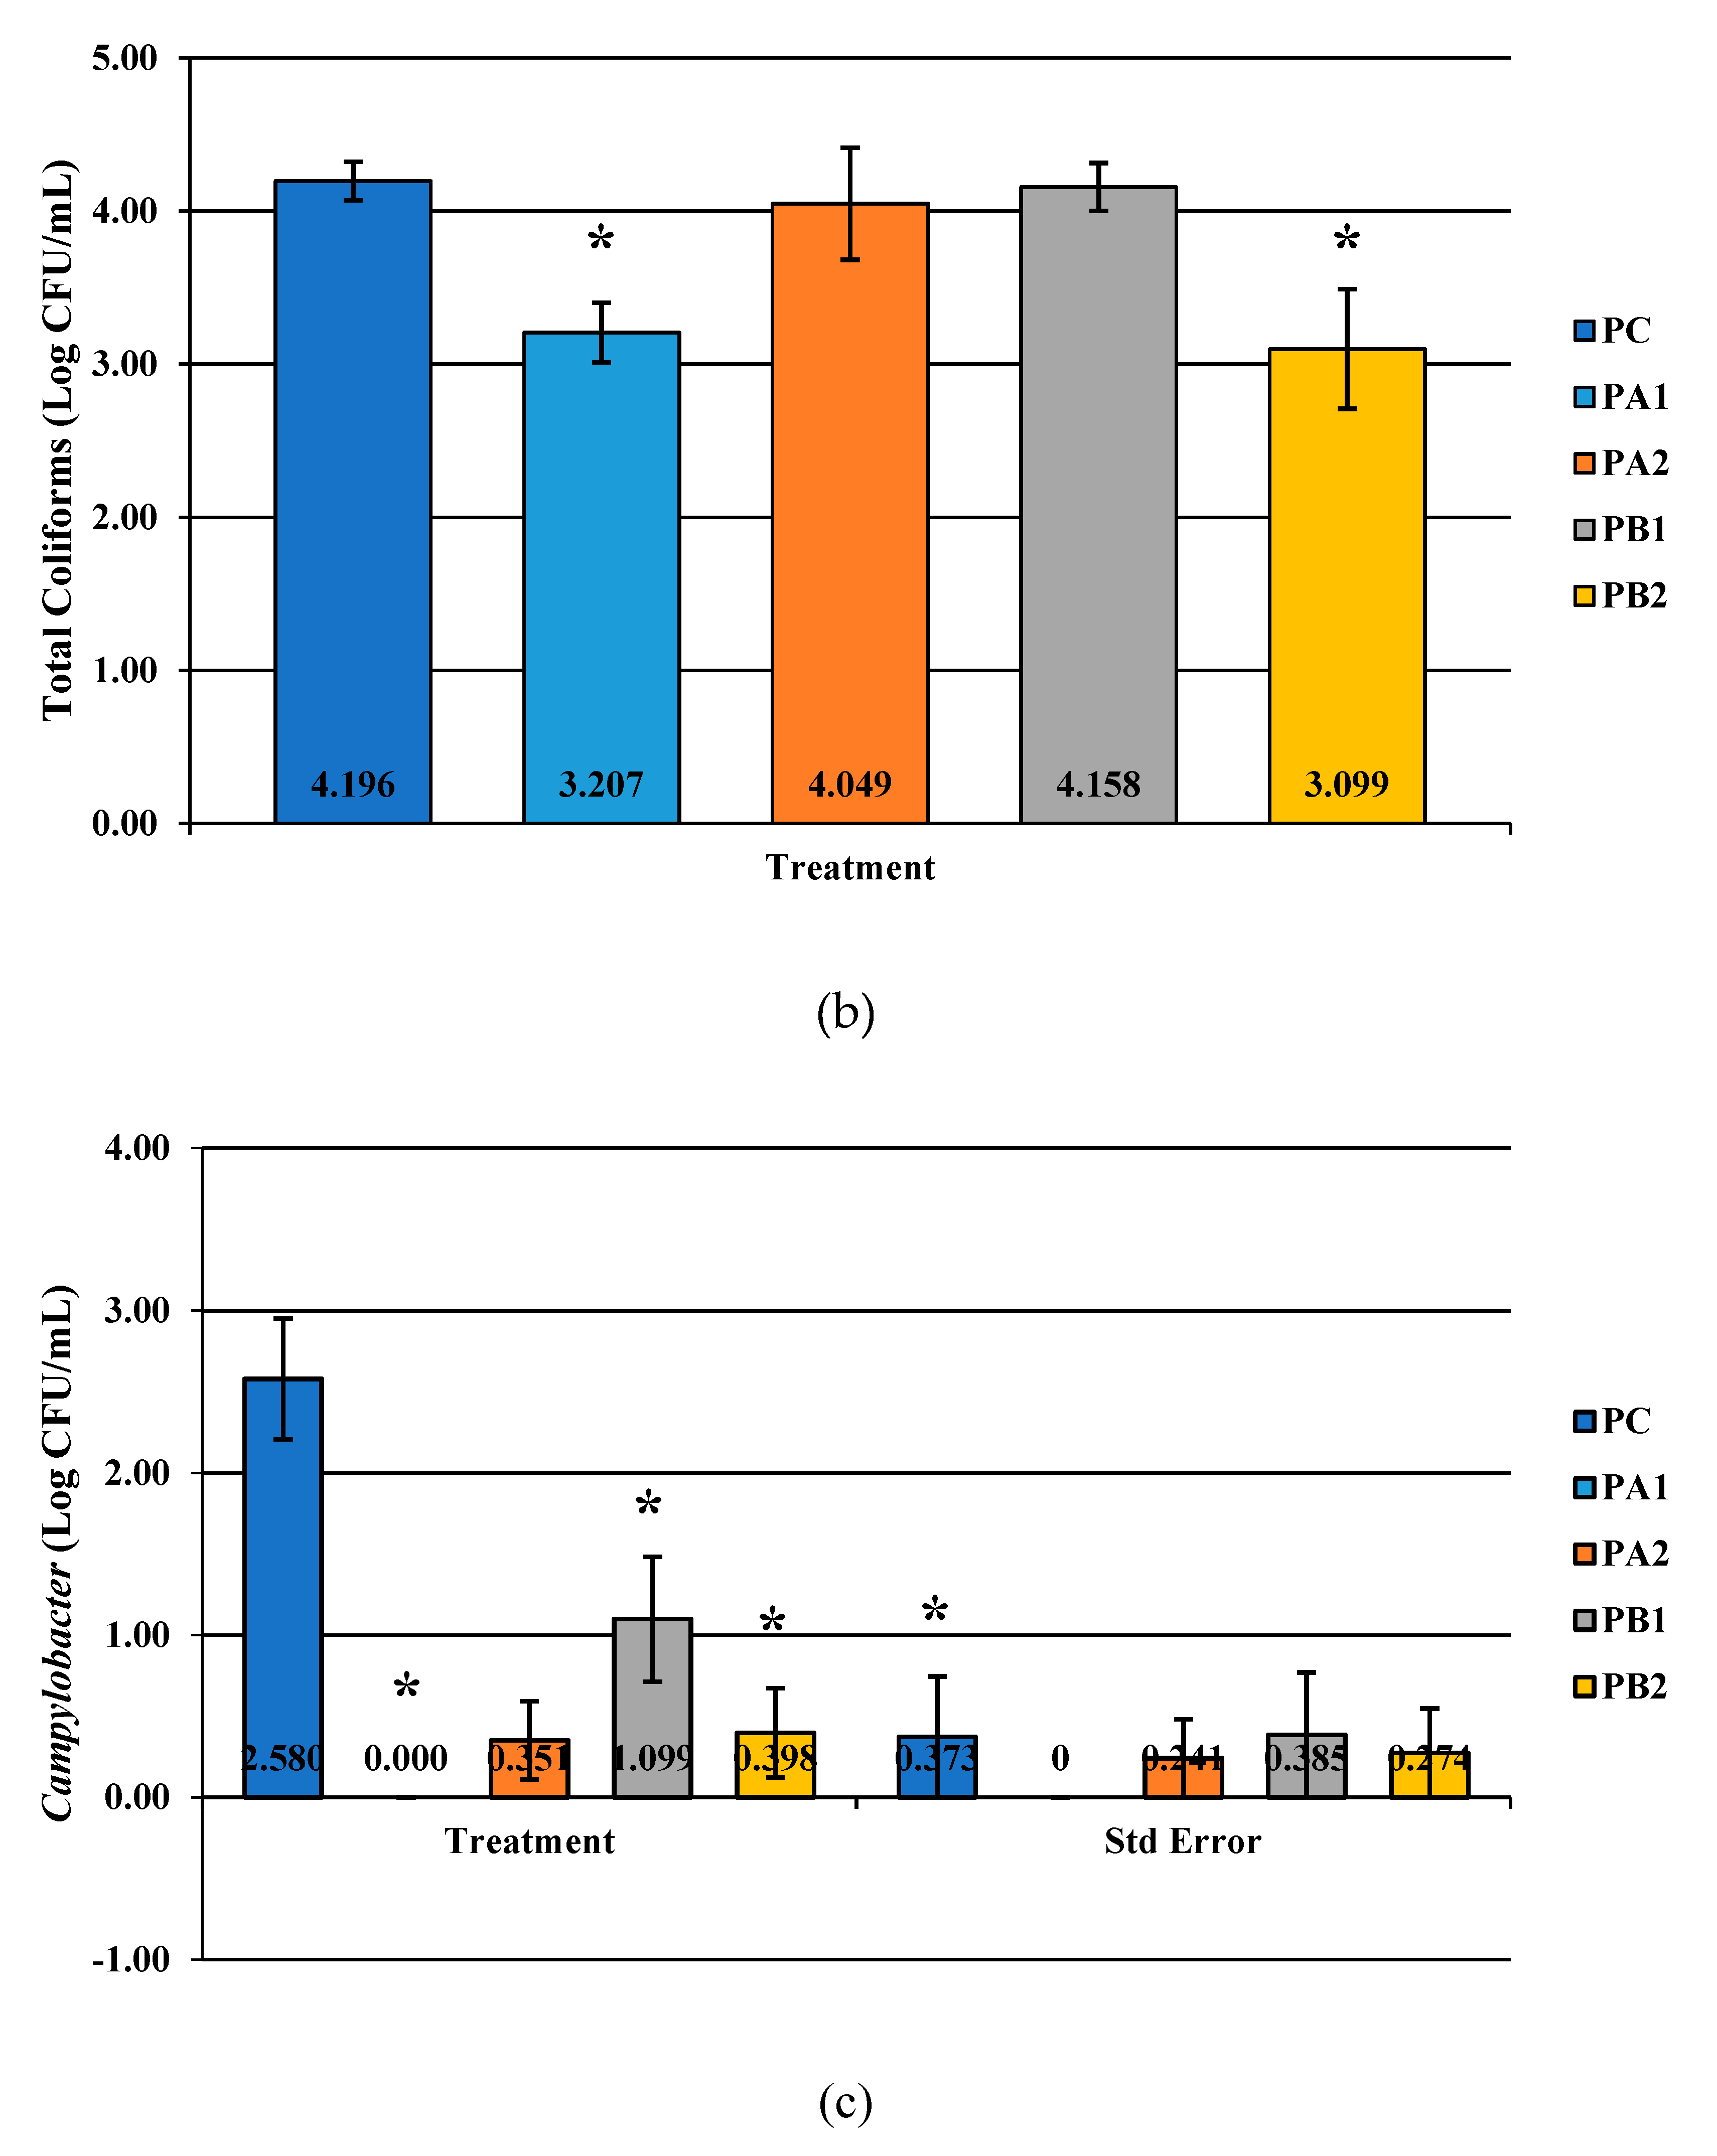
Figure 3.
The effect of PeraClean, a PAA sanitizer, used as an antimicrobial dip (400 or 600 ppm) and in a stationary chilling tank (25 or 45 ppm) on the prevalence of Campylobacter present in the rinsates of 42-d-old Ross 708 broilers. N = 50, n = 10, p < 0.0001. PA1 refers to a 400 ppm/25 ppm treatment, PA2 refers to a 400 ppm/45 ppm treatment, PB1 refers to a 600 ppm/25 ppm treatment, and PB2 refers to a 600 ppm/45 ppm treatment, with each treatment being first a post-evisceration dip followed by an immersion chill.
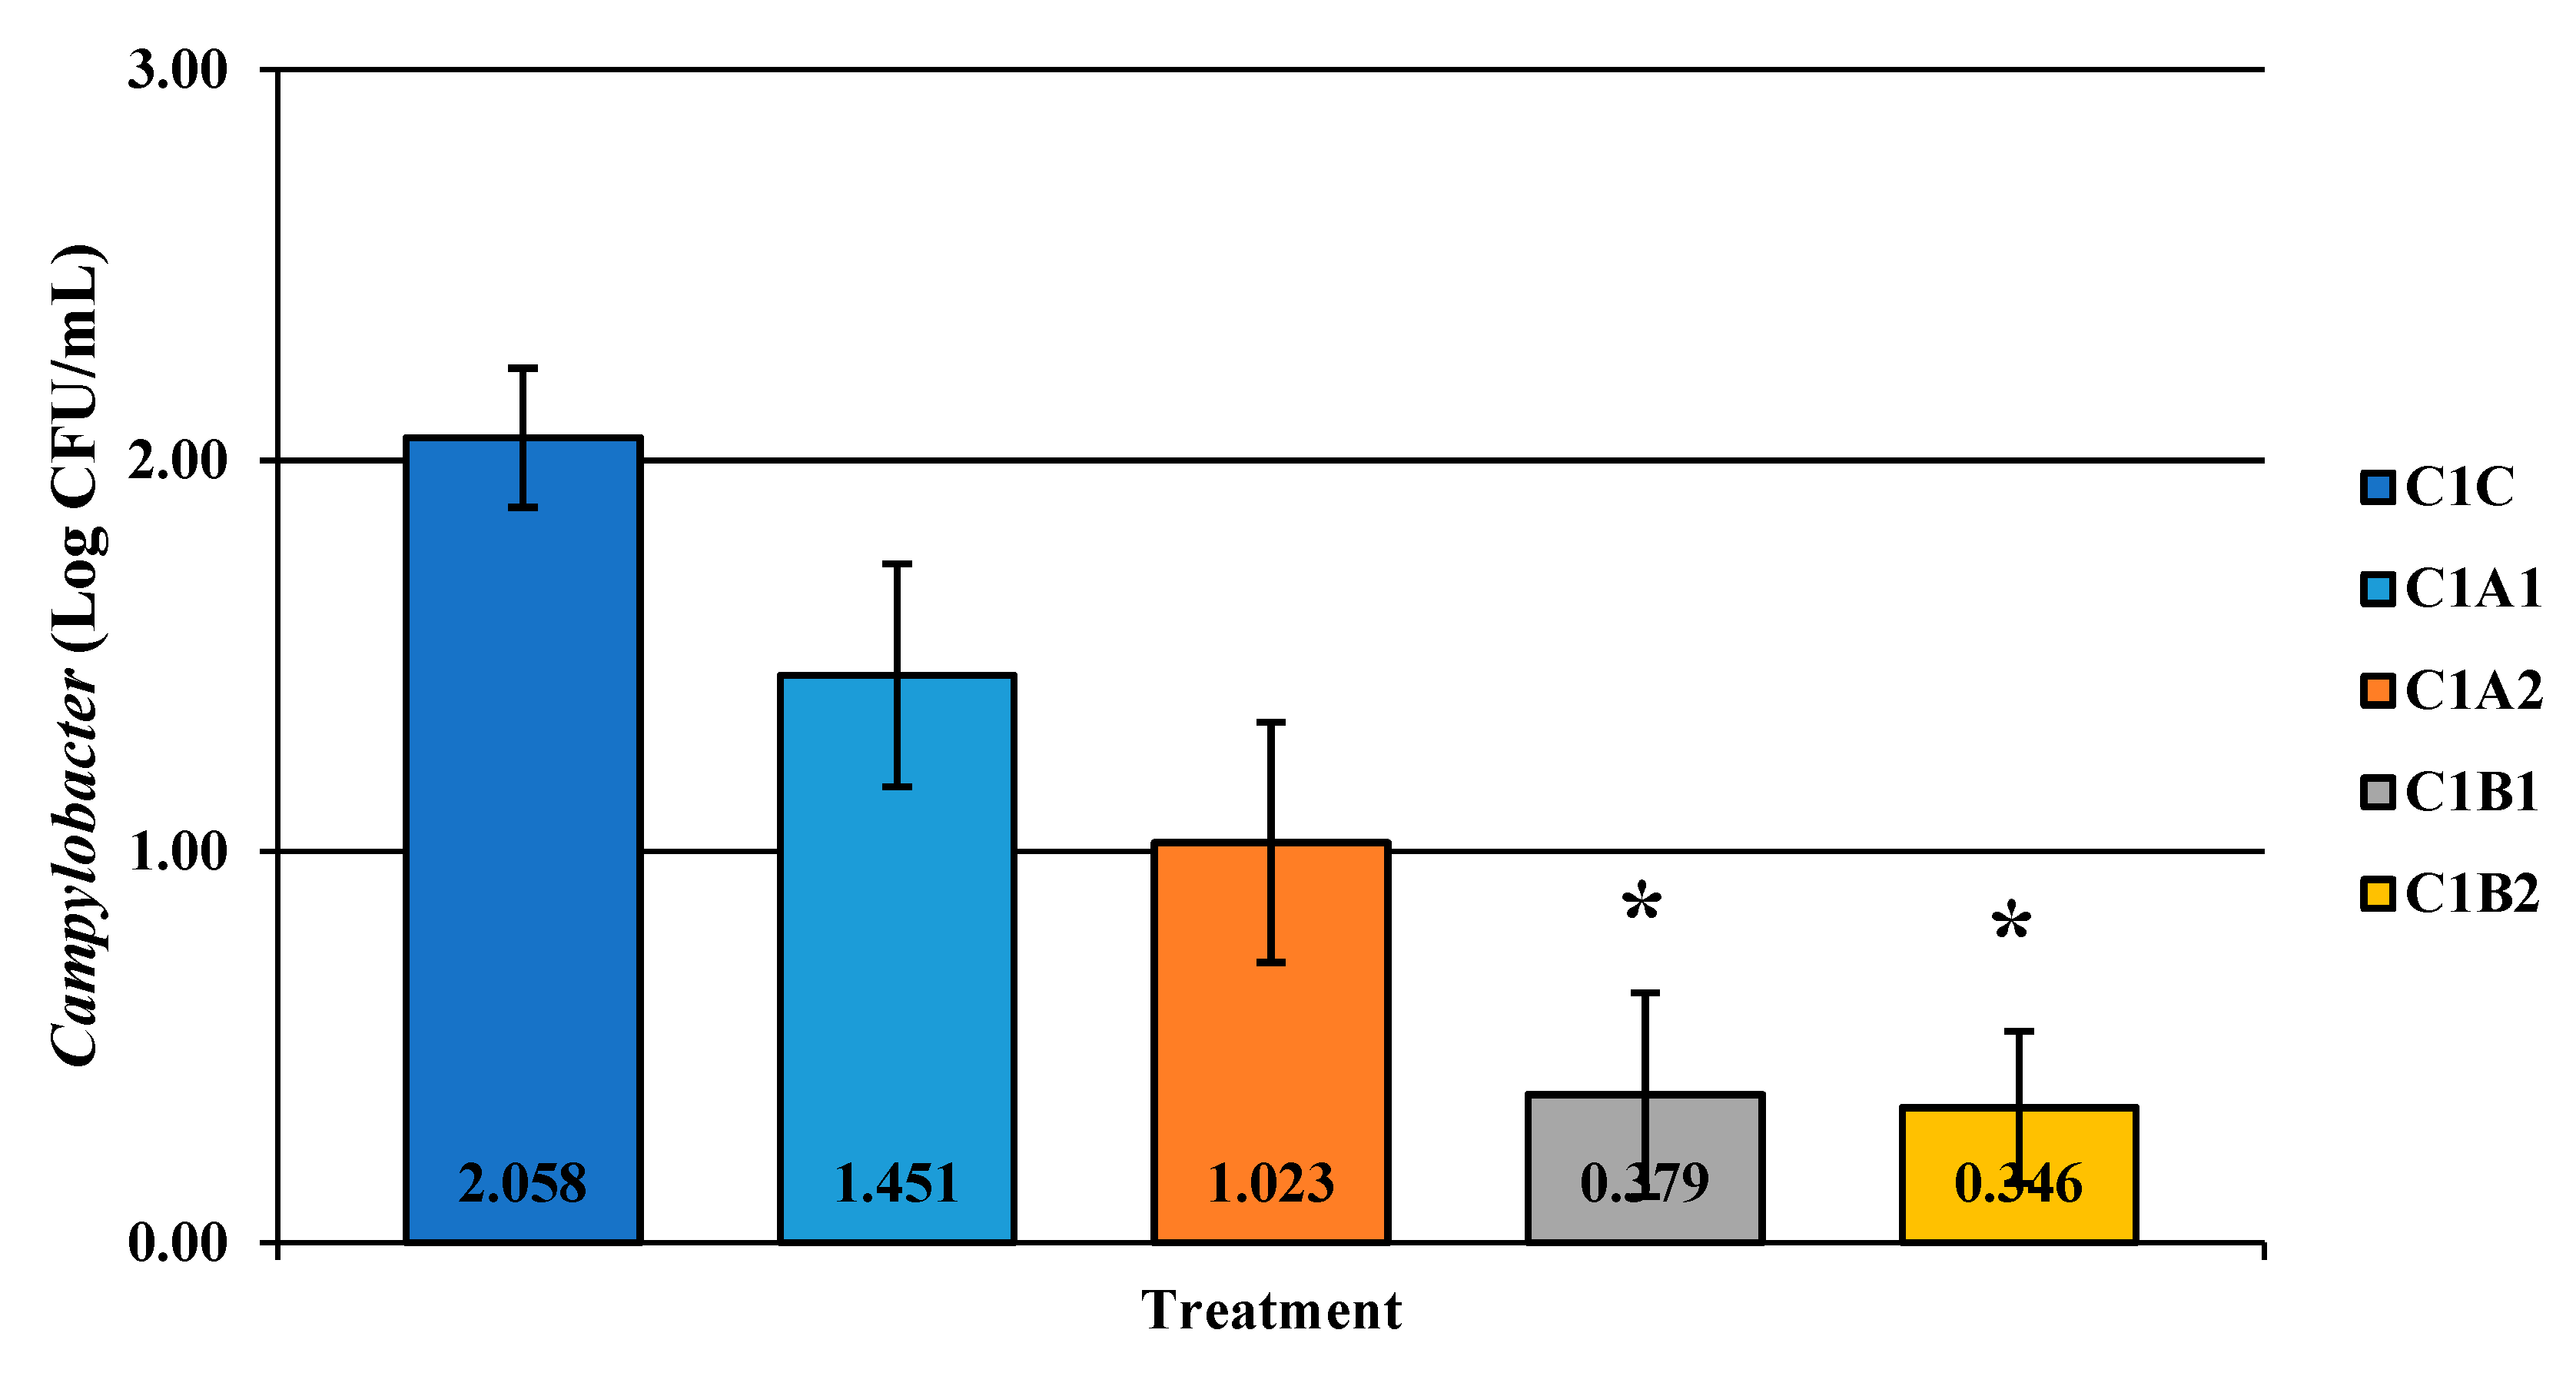
Figure 4.
The effect of Competitor 1, a PAA sanitizer used as an antimicrobial dip (400 or 600 ppm) and in a stationary chilling tank (25 or 45 ppm) on the load of Campylobacter present in the rinsates of 42-d-old Ross 708 broilers. The means are numerically stated on the bar graph. N = 50, n = 10, p = 0.0022. CA1 refers to a 400 ppm/25 ppm treatment, CA2 refers to a 400 ppm/45 ppm treatment, CB1 refers to a 600 ppm/25 ppm treatment, and CB2 refers to a 600 ppm/45 ppm treatment, with each treatment being first a post-evisceration dip followed by an immersion chill.
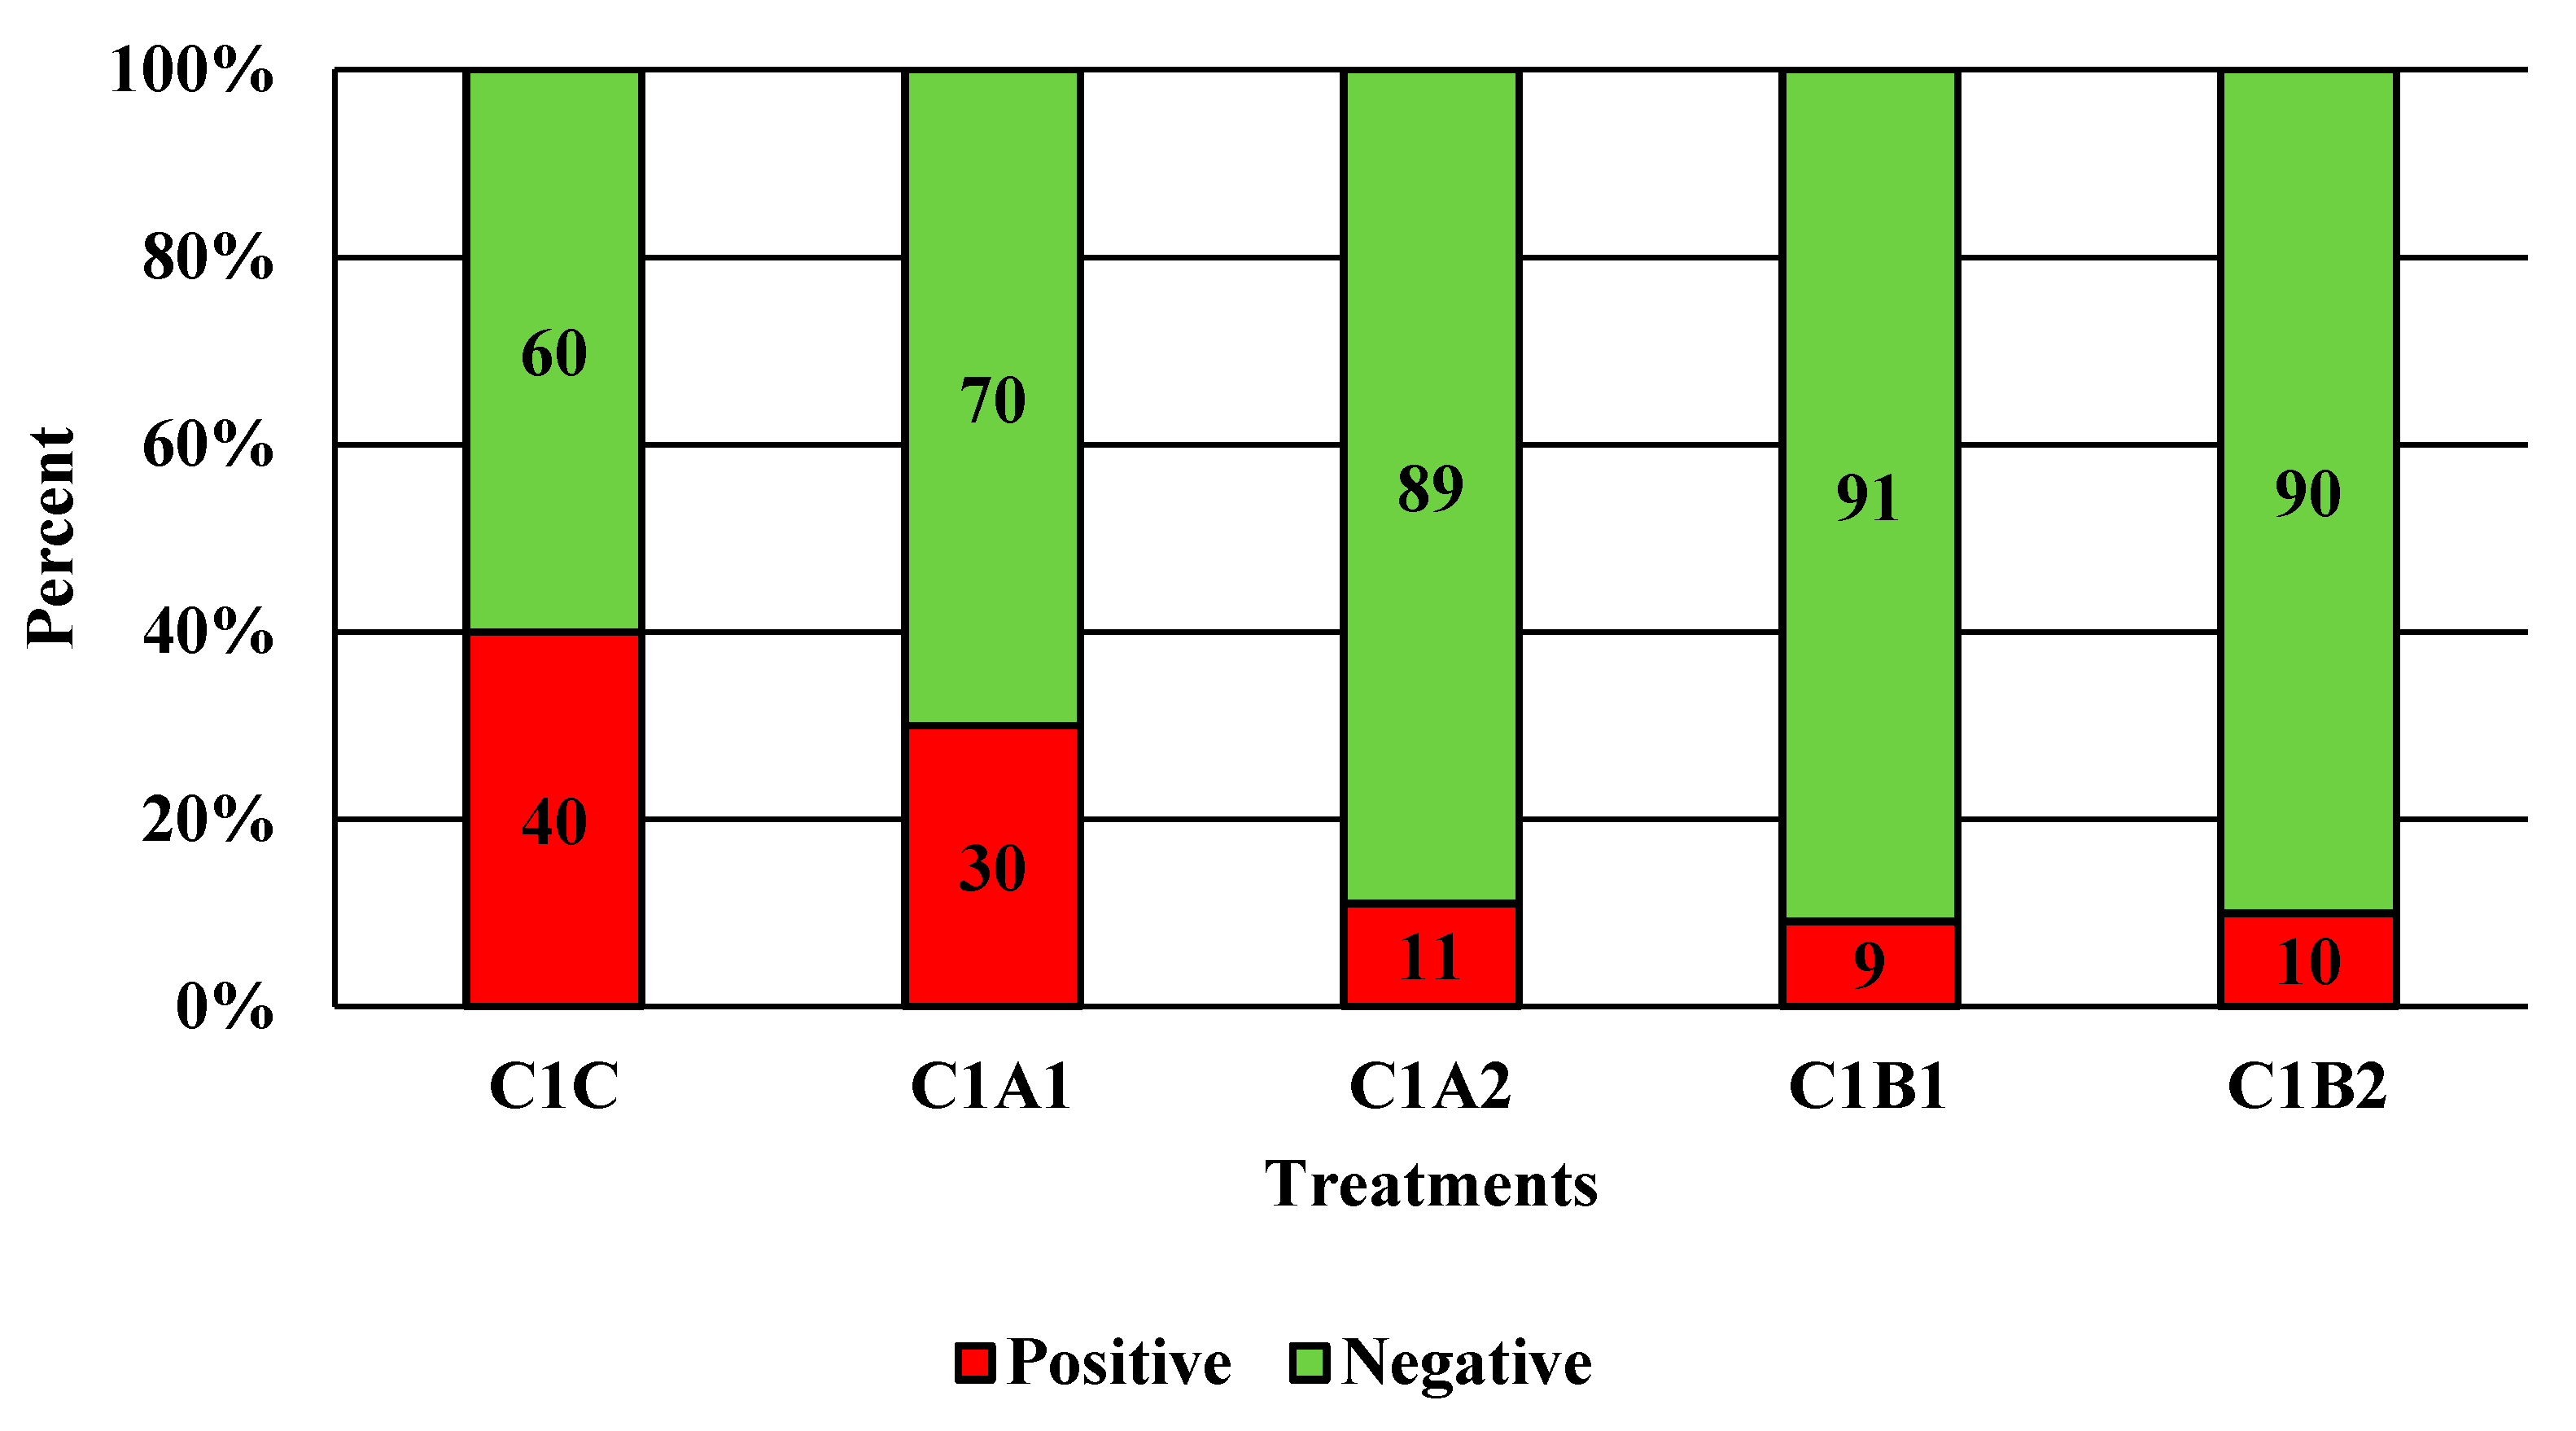
Figure 5.
The effect of Competitor 1, a PAA sanitizer used as an antimicrobial dip (400 or 600 ppm) and in a stationary chilling tank (25 or 45 ppm) on the prevalence of Campylobacter present in the rinsates of 42-d-old Ross 708 broilers. N = 50, n = 10, p = 0.0013. CA1 refers to a 400 ppm/25 ppm treatment, CA2 refers to a 400 ppm/45 ppm treatment, CB1 refers to a 600 ppm/25 ppm treatment, and CB2 refers to a 600 ppm/45 ppm treatment, with each treatment being first a post-evisceration dip followed by an immersion chill.
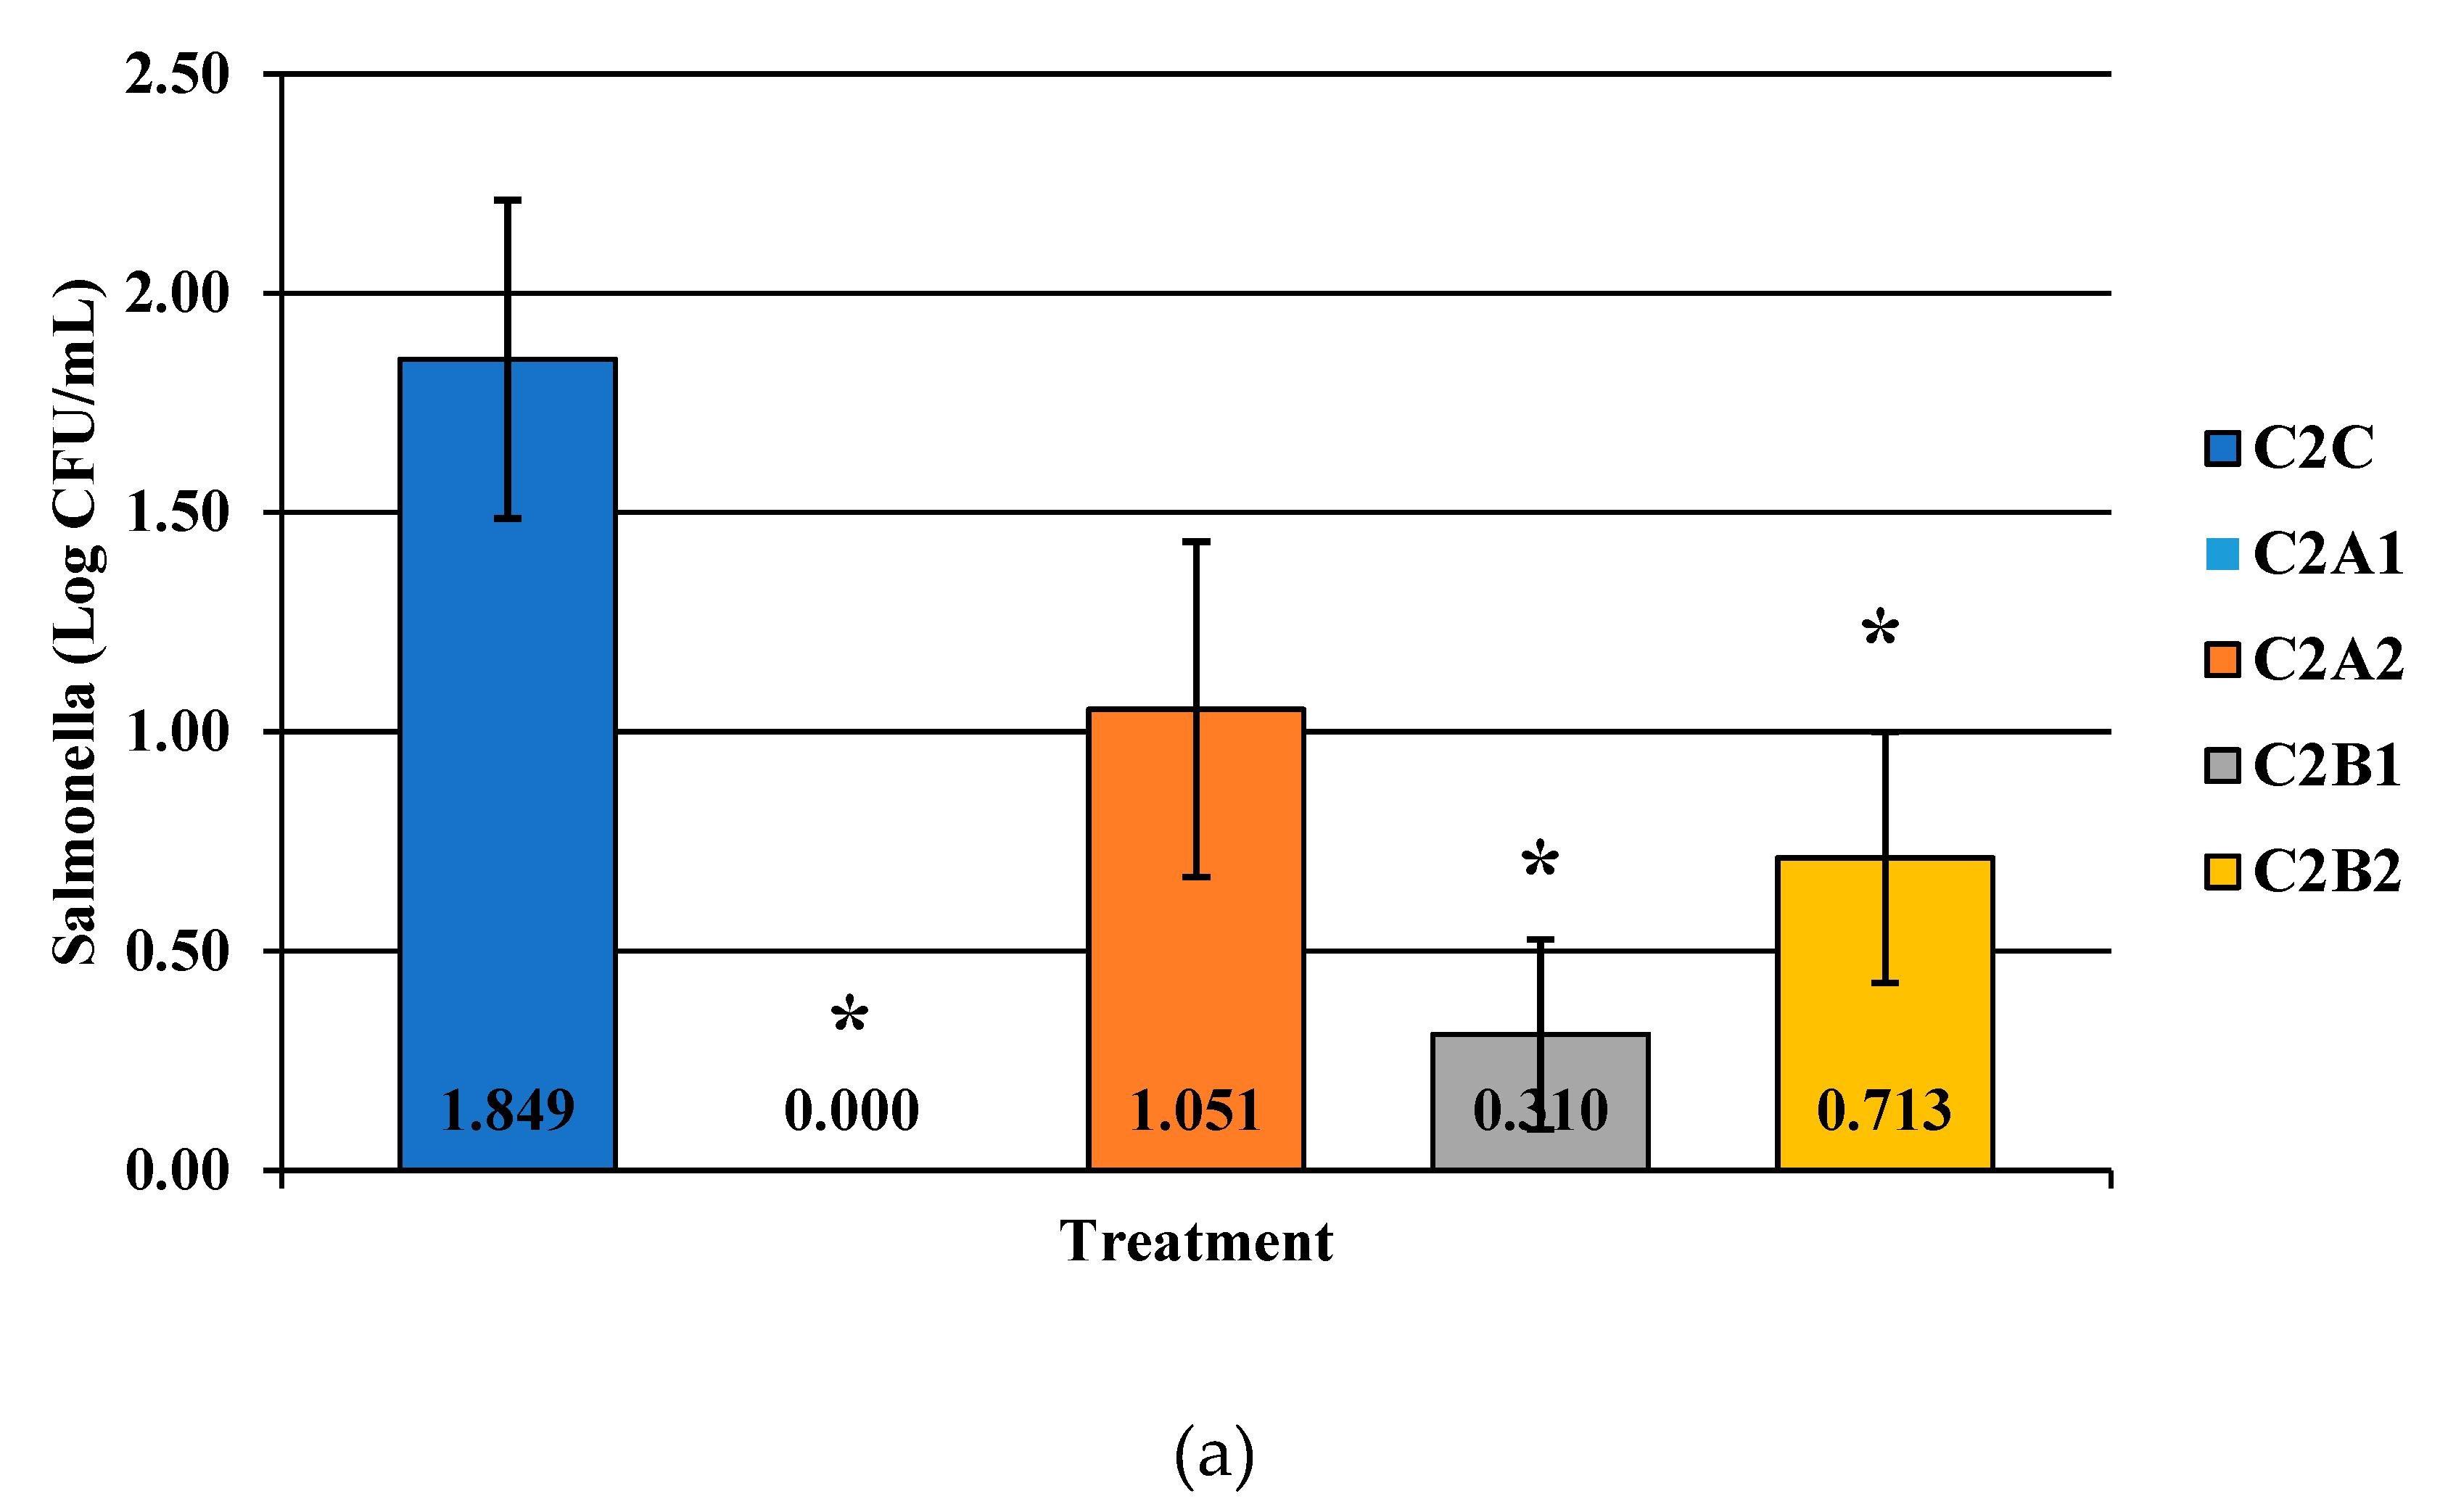
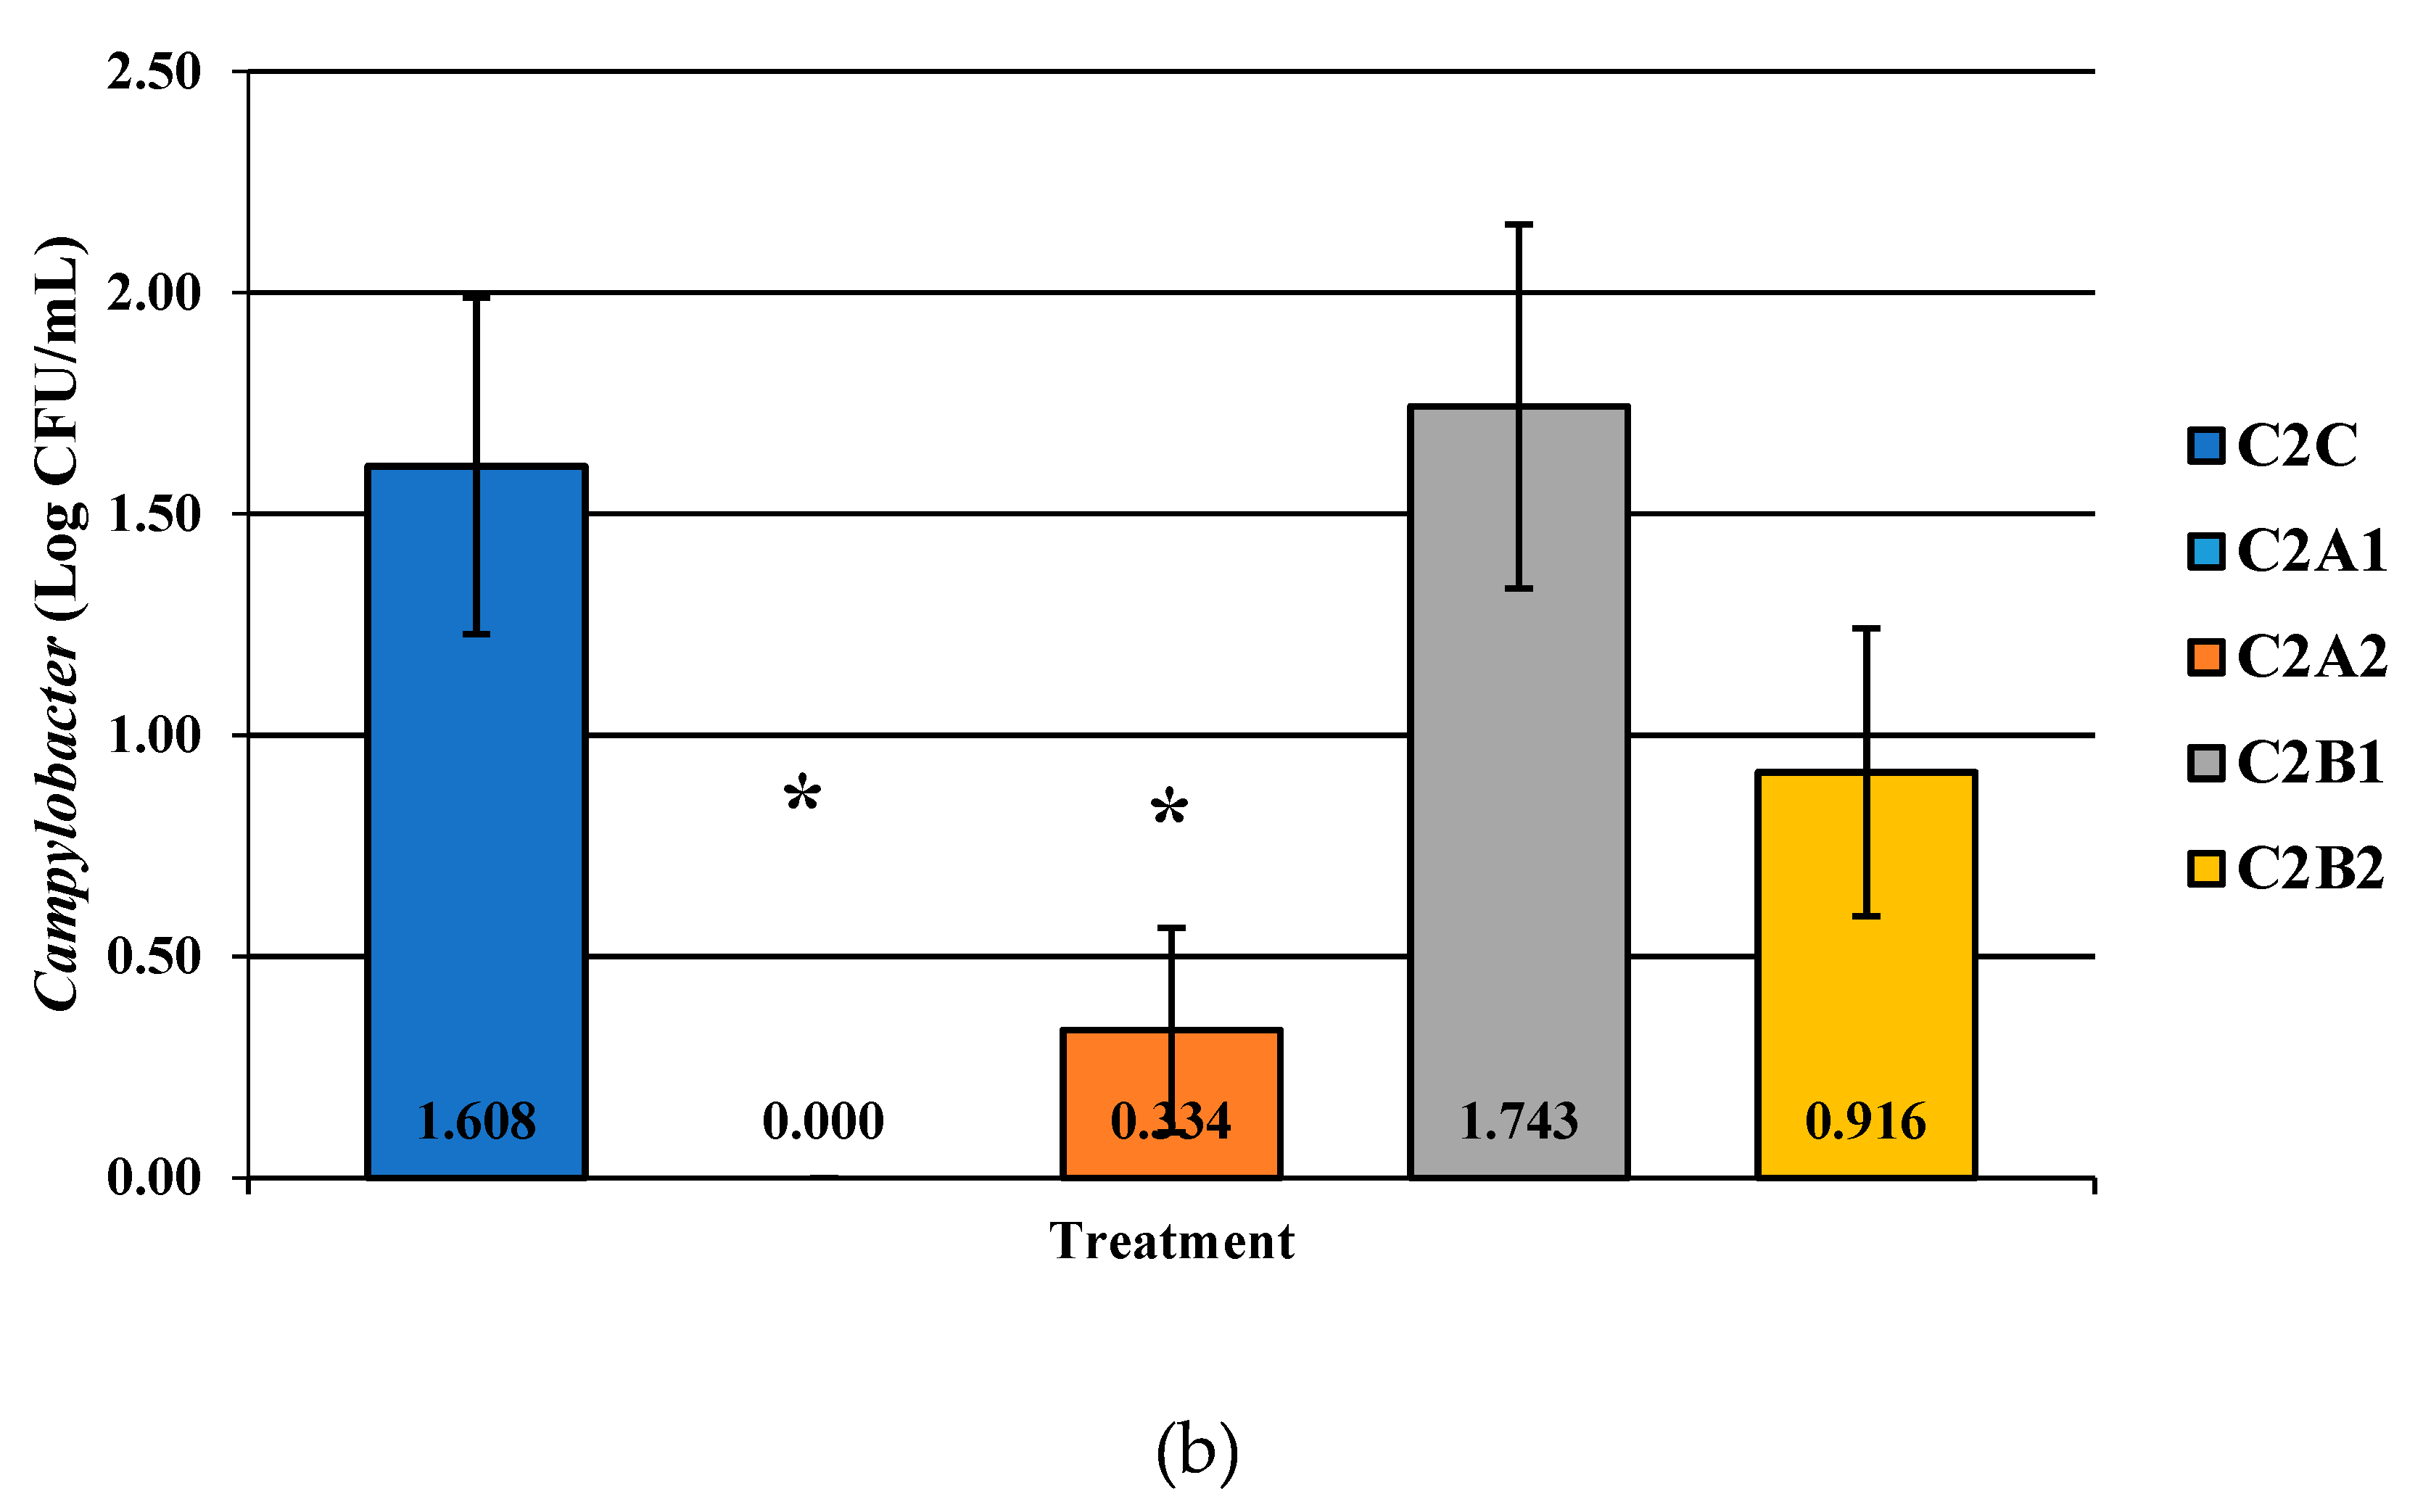
Figure 6.
The effect of Competitor 2, a PAA sanitizer used as an antimicrobial dip (400 or 600 ppm) and in a stationary chilling tank (25 or 45 ppm) on the load of Salmonella (a), total aerobic bacteria (b), and Campylobacter present in the rinsates of 42-d-old Ross 708 broilers. The means are labeled on the bar graph. The main effect was significant N = 50, n = 10, p < 0.0001 (a); N = 50, n = 10, p = 0.0479 (b); N = 50, n = 10, p = 0.0002 (c). C2A1 refers to a 400 ppm/25 ppm treatment, C2A2 refers to a 400 ppm/45 ppm treatment, C2B1 refers to a 600 ppm/25 ppm treatment, and C2B2 refers to a 600 ppm/45 ppm treatment, with each treatment being first a post-evisceration dip followed by an immersion chill.
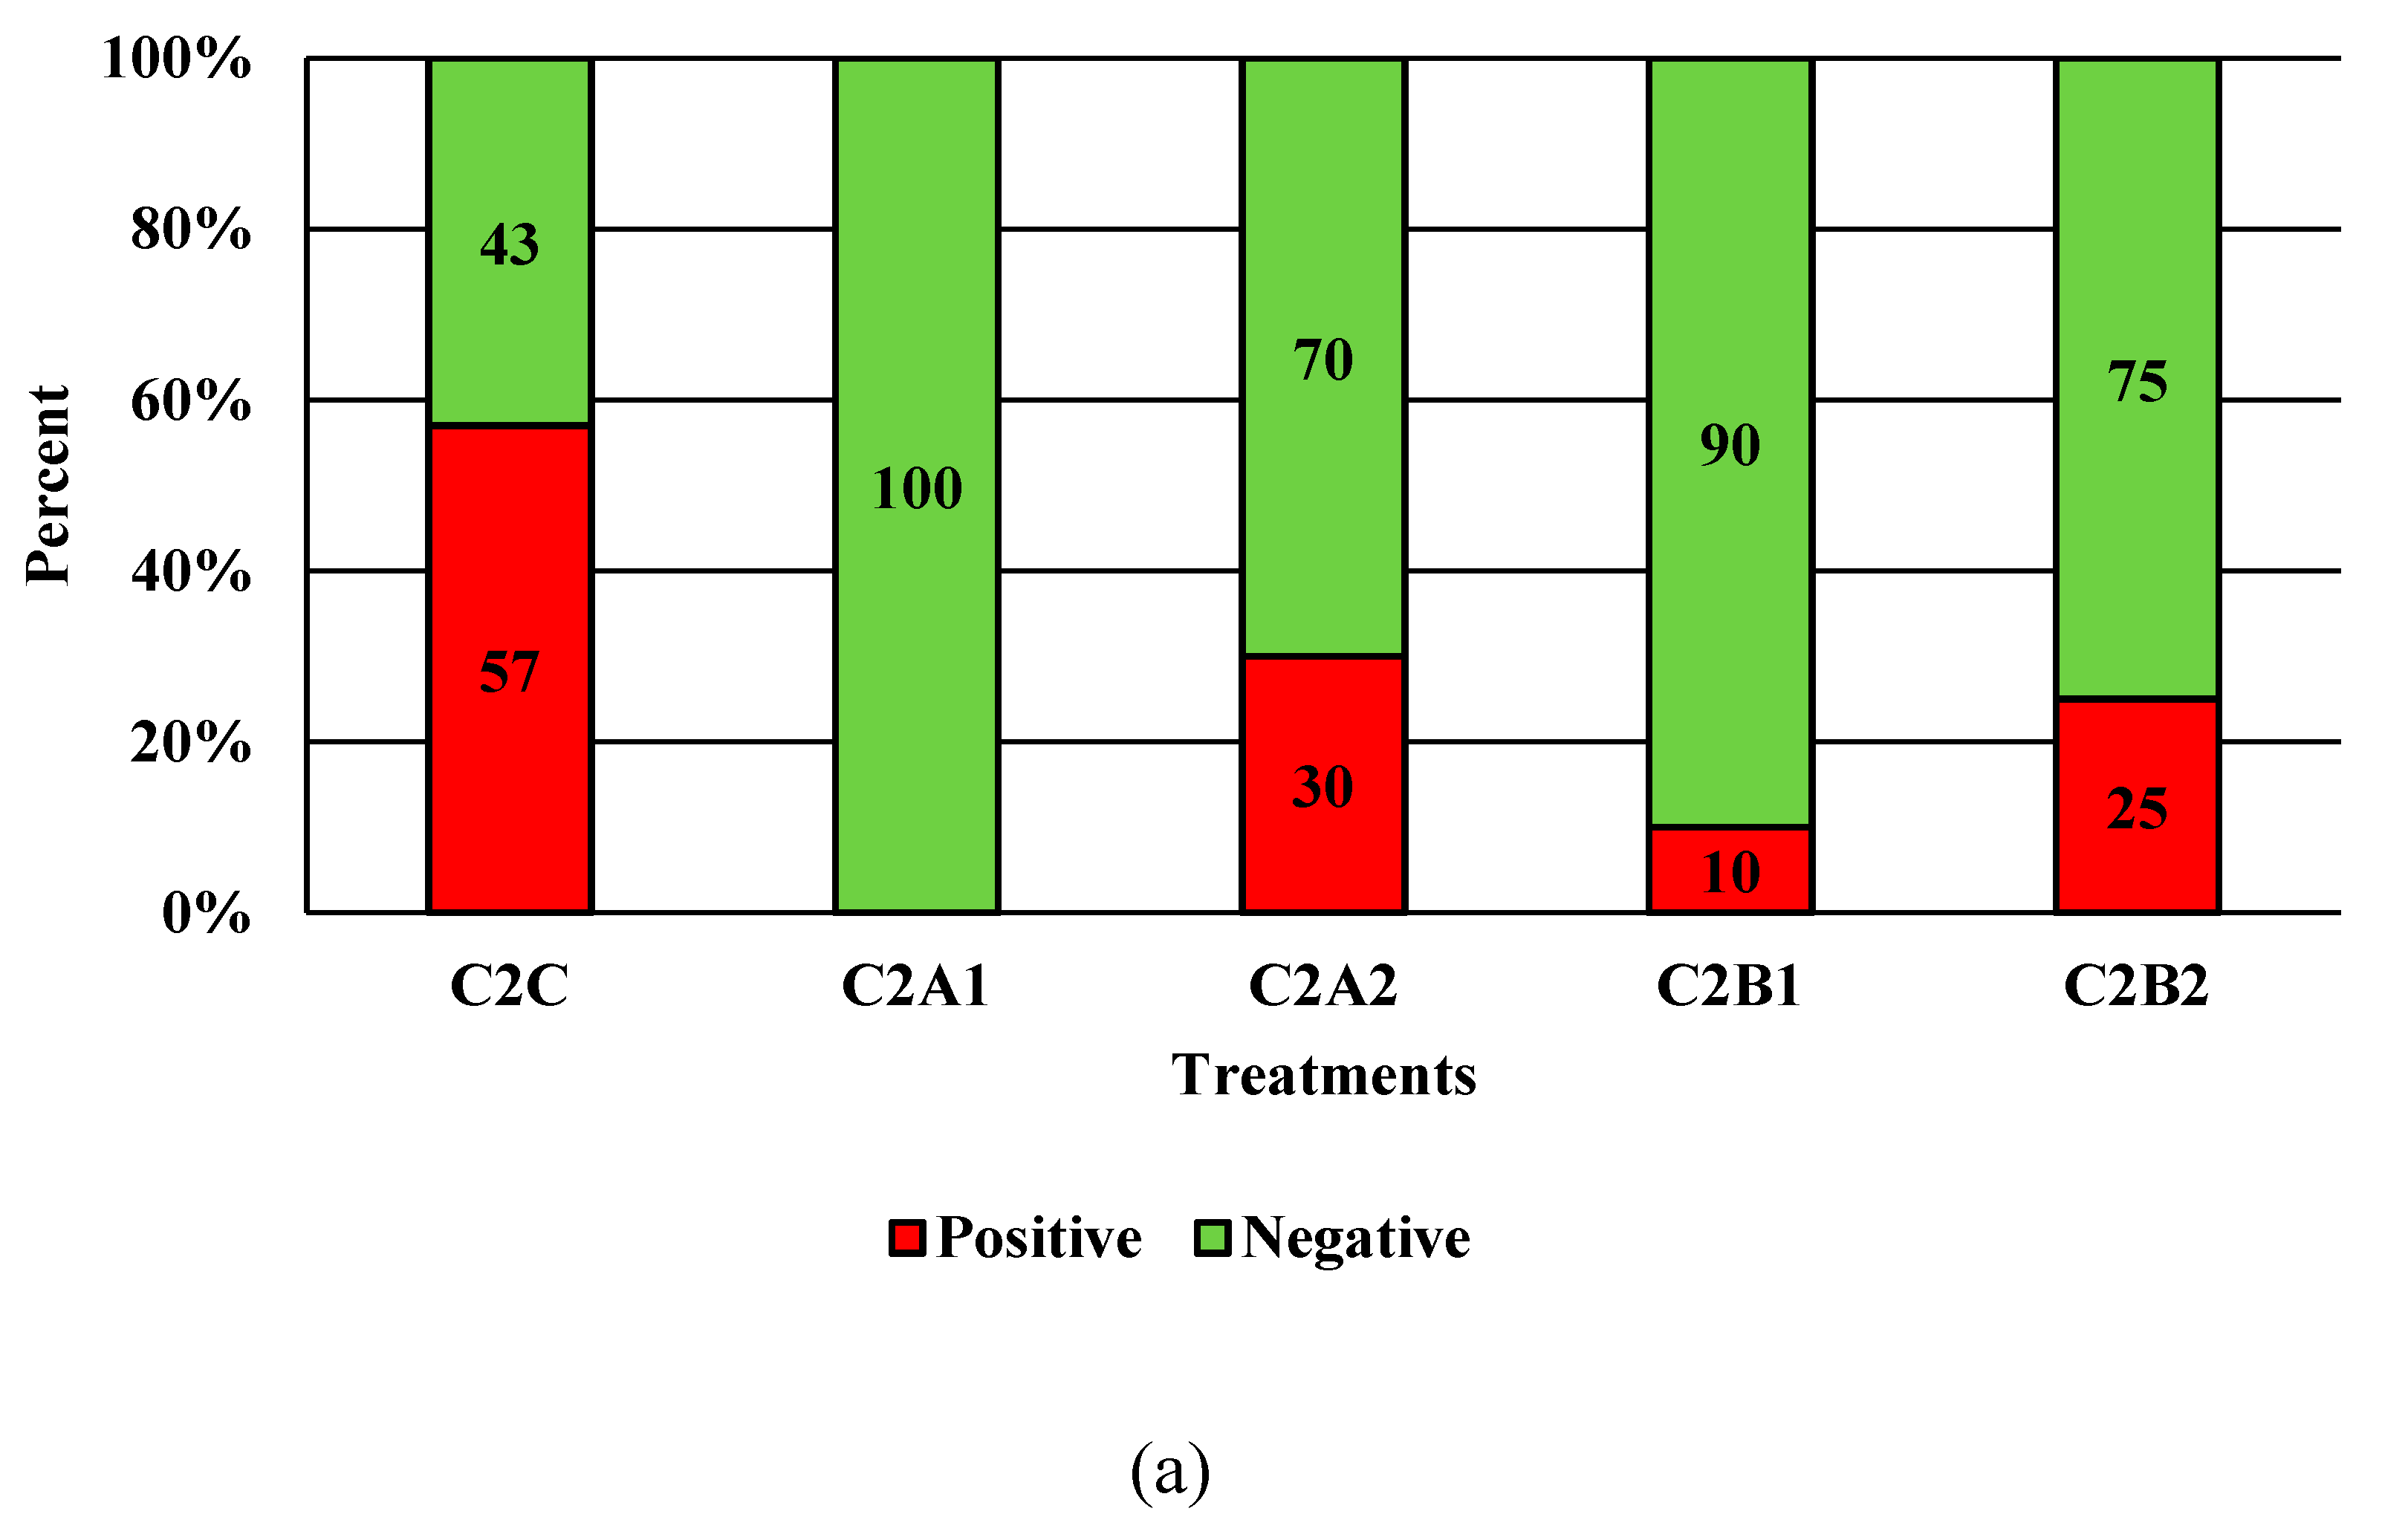
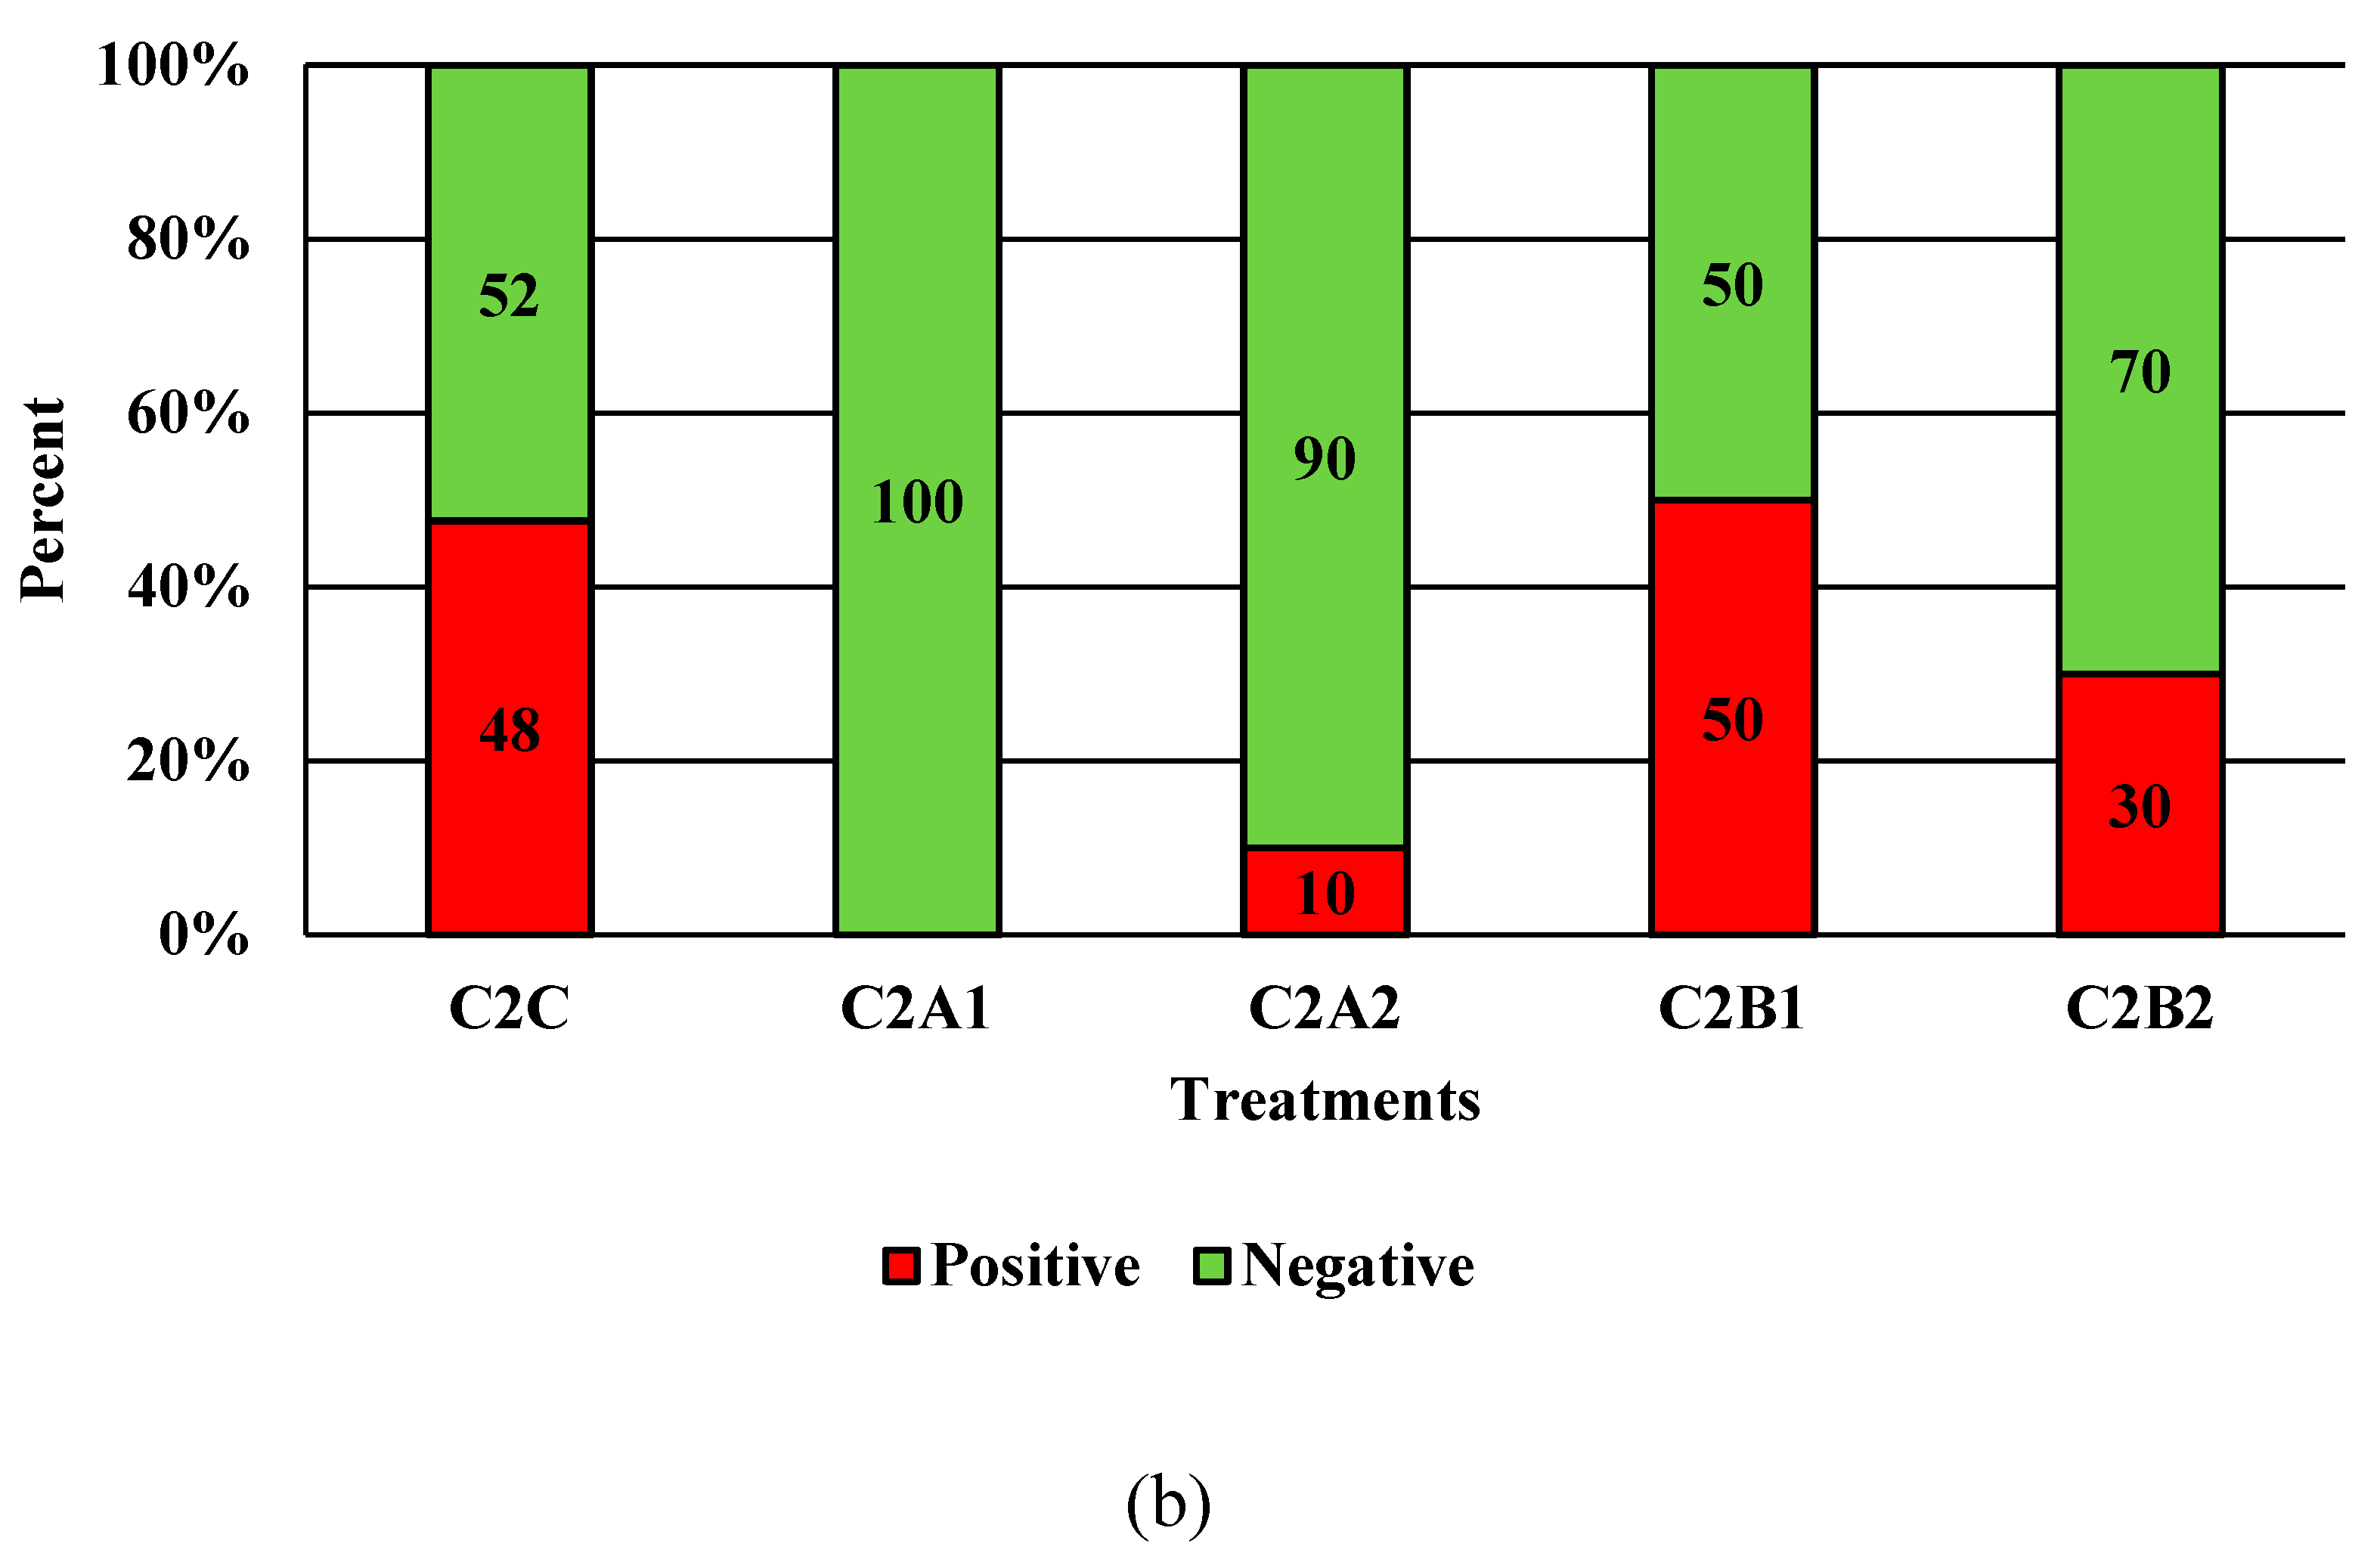
Figure 7.
The effect of Competitor 2, a peracetic acid sanitizer used as an antimicrobial dip (400 and 600 ppm) and in a stationary chilling tank (25 and 45 ppm) on the prevalence of Salmonella (a), and Campylobacter (b) present in the rinsates of 42 d old Ross 708 broilers. N = 50, n = 10, p < 0.0001 (a); N = 50, n = 10, p < 0.0001 (b).
Table 1.
The PAA concentrations of the products as described by the chemistry documentation.
Table 1.
The PAA concentrations of the products as described by the chemistry documentation.
| Product | % PAA |
|---|
| PeraClean | 23% PAA |
| Competitor 1 | 22% PAA |
| Competitor 2 | 22% PAA |


