Ecophysiology of Chloromonas hindakii sp. nov. (Chlorophyceae), Causing Orange Snow Blooms at Different Light Conditions


Abstract
1. Introduction
2. Materials and Methods
2.1. Sampling and Snow Characteristics
2.2. Strain Isolation
2.3. Light and Electron Microscopy
2.4. Isolation of DNA, PCR, Sequencing
2.5. ITS2 rRNA Secondary Structure Prediction and Phylogenetic Analysis
2.6. Photosynthesis
2.7. Pigment Analysis
2.8. Lipid Extraction and Fatty Acid Methyl Esters Analysis (FAMEs)
3. Results
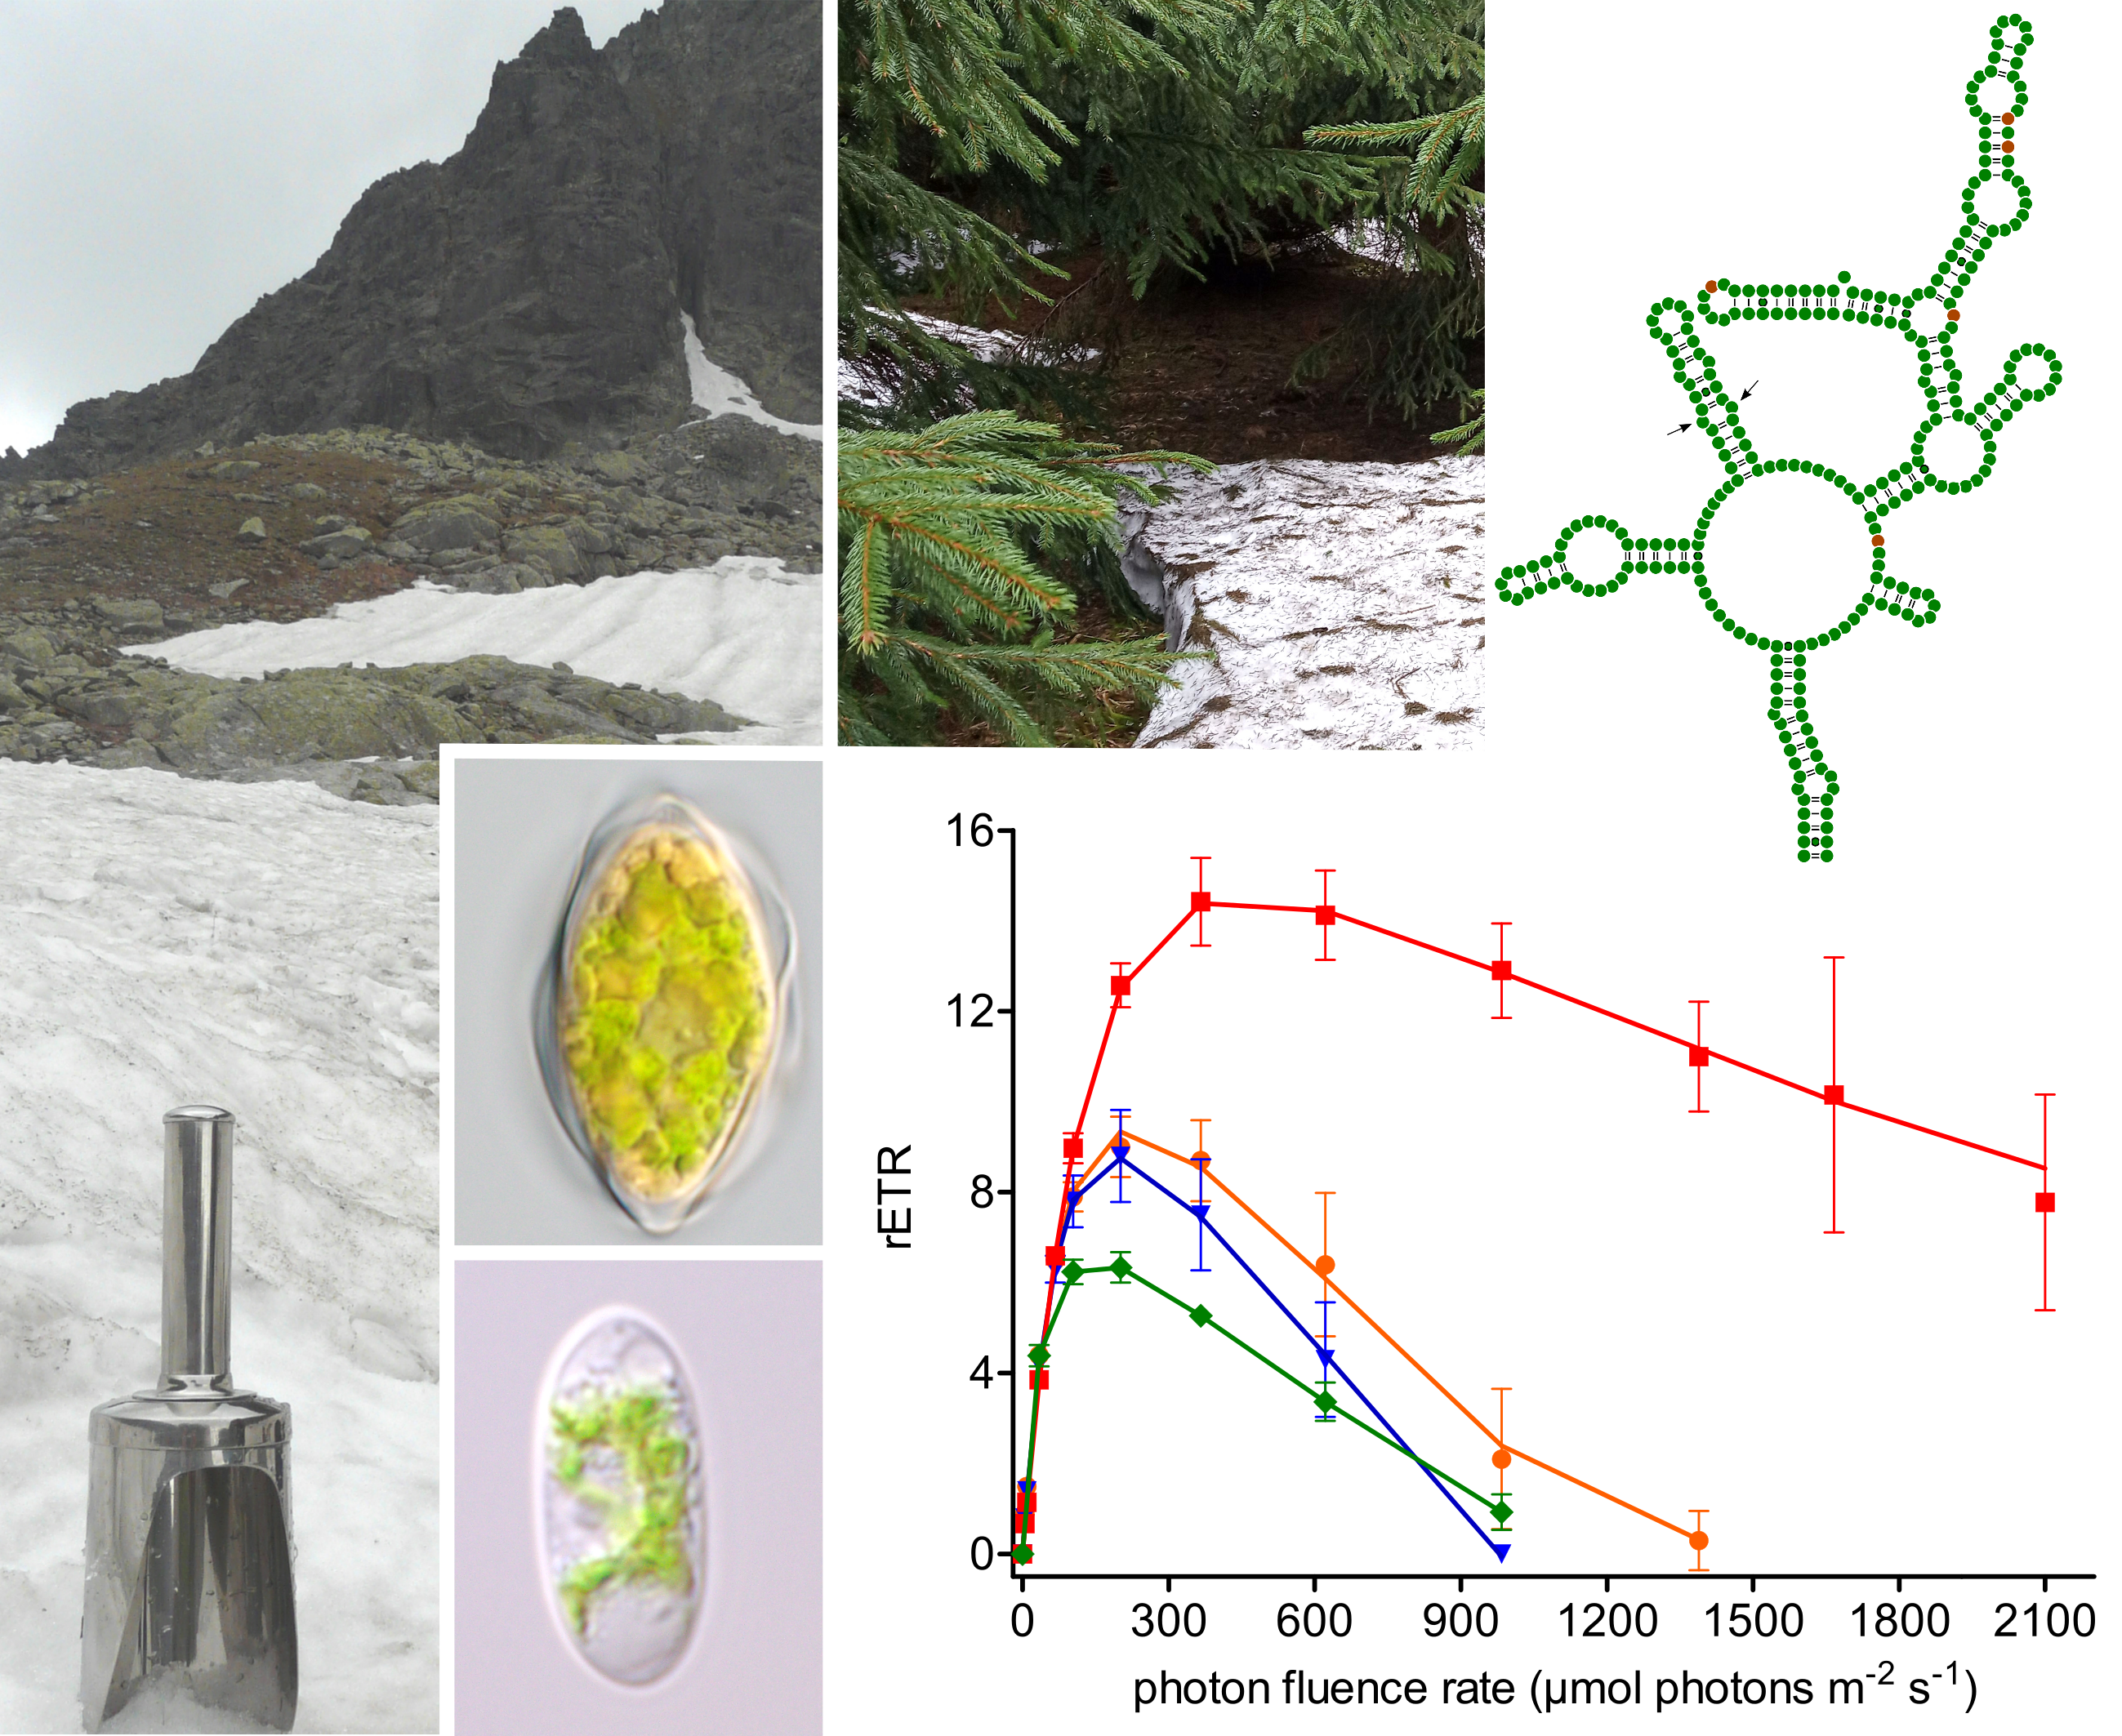
3.1. Habitat Conditions
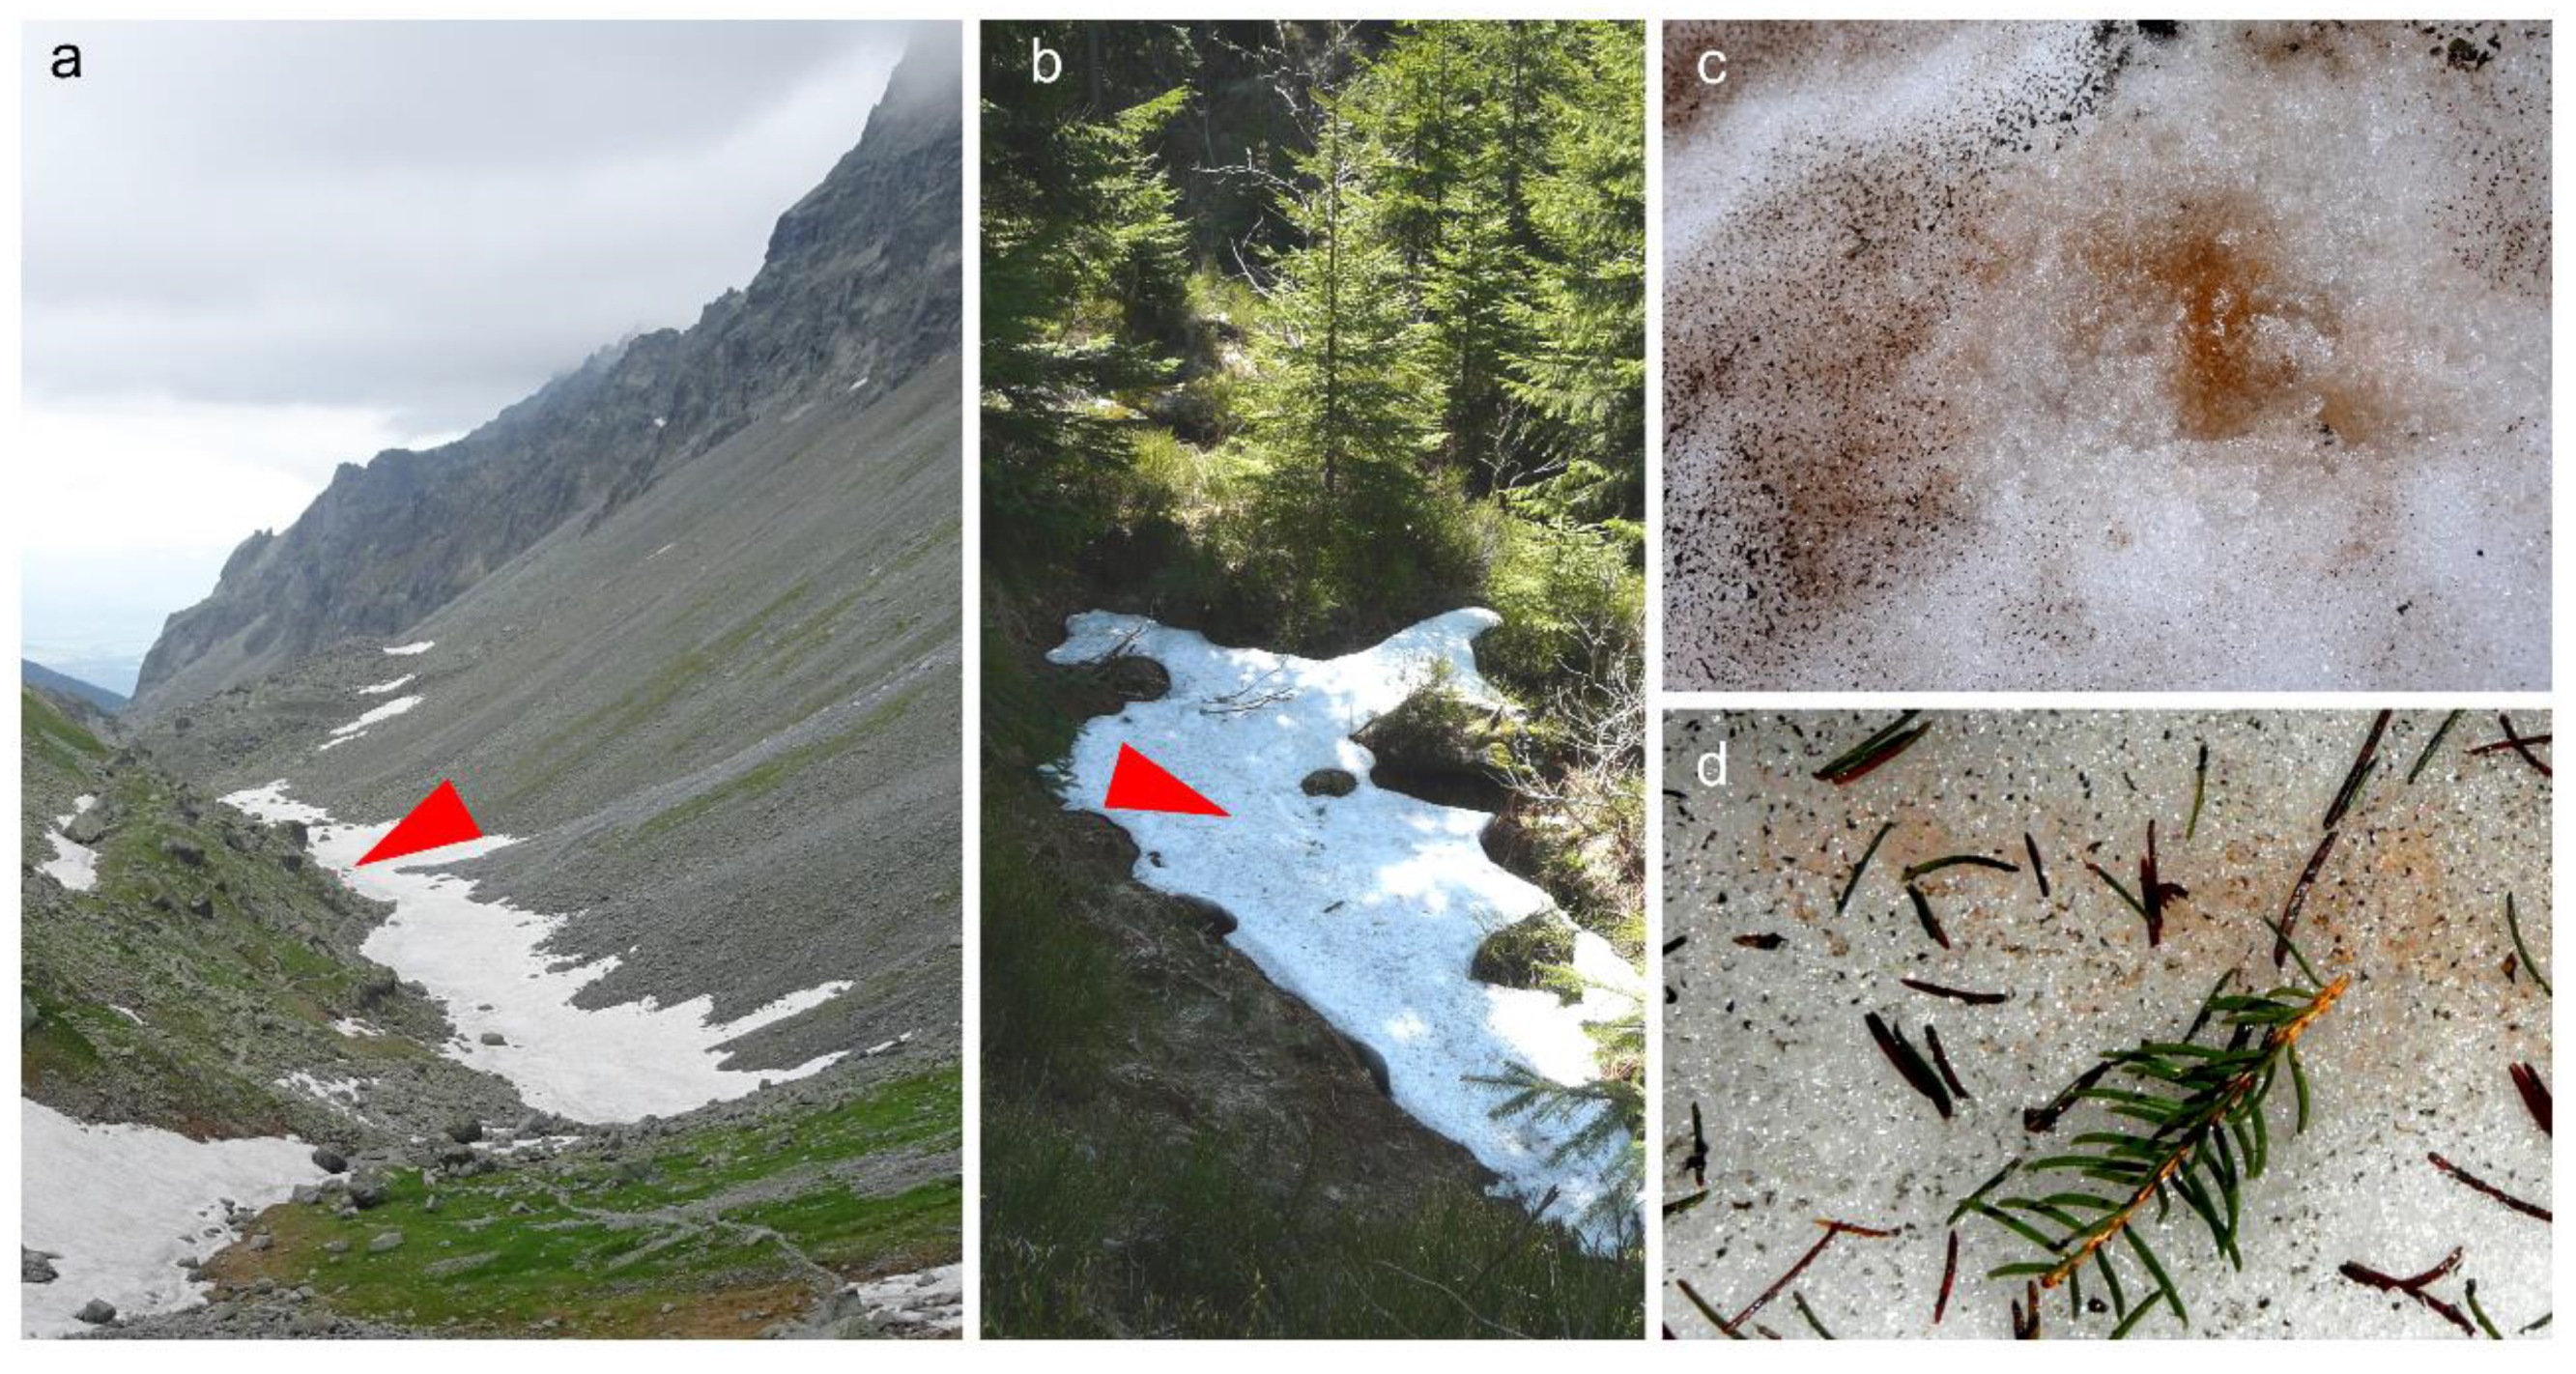
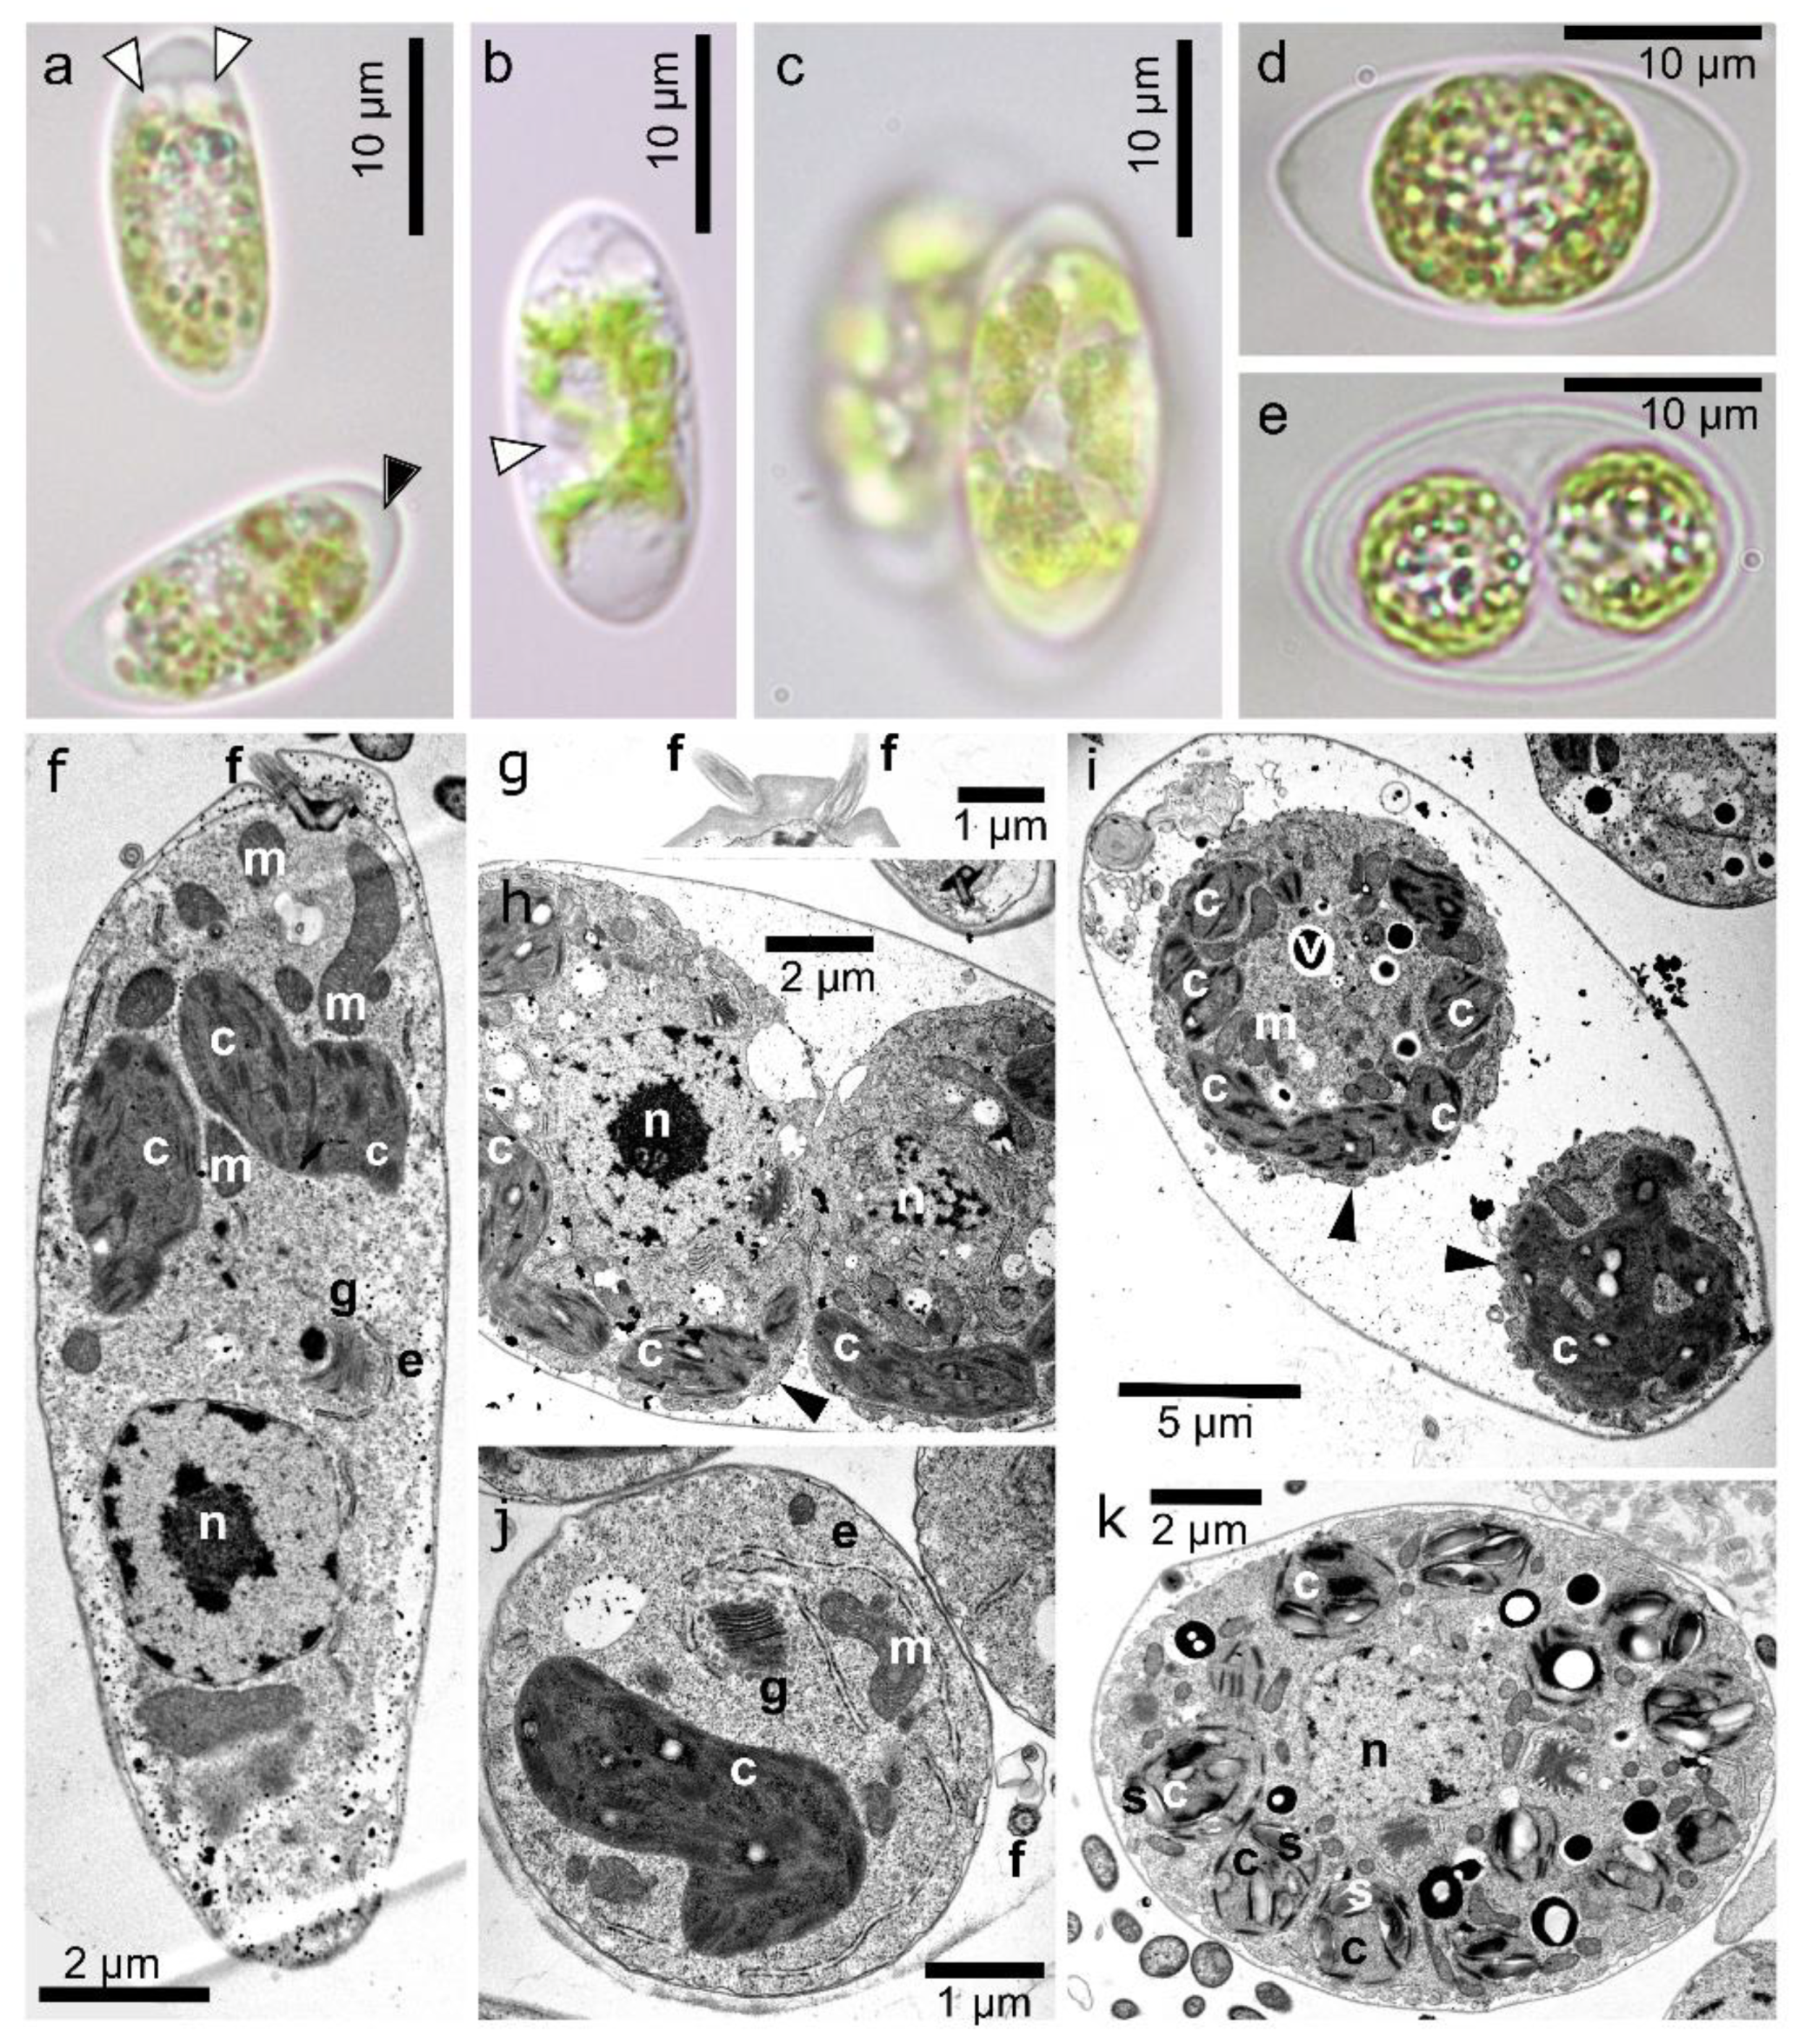
3.2. Maximal Population Density and Morphology of Field-Collected Cysts
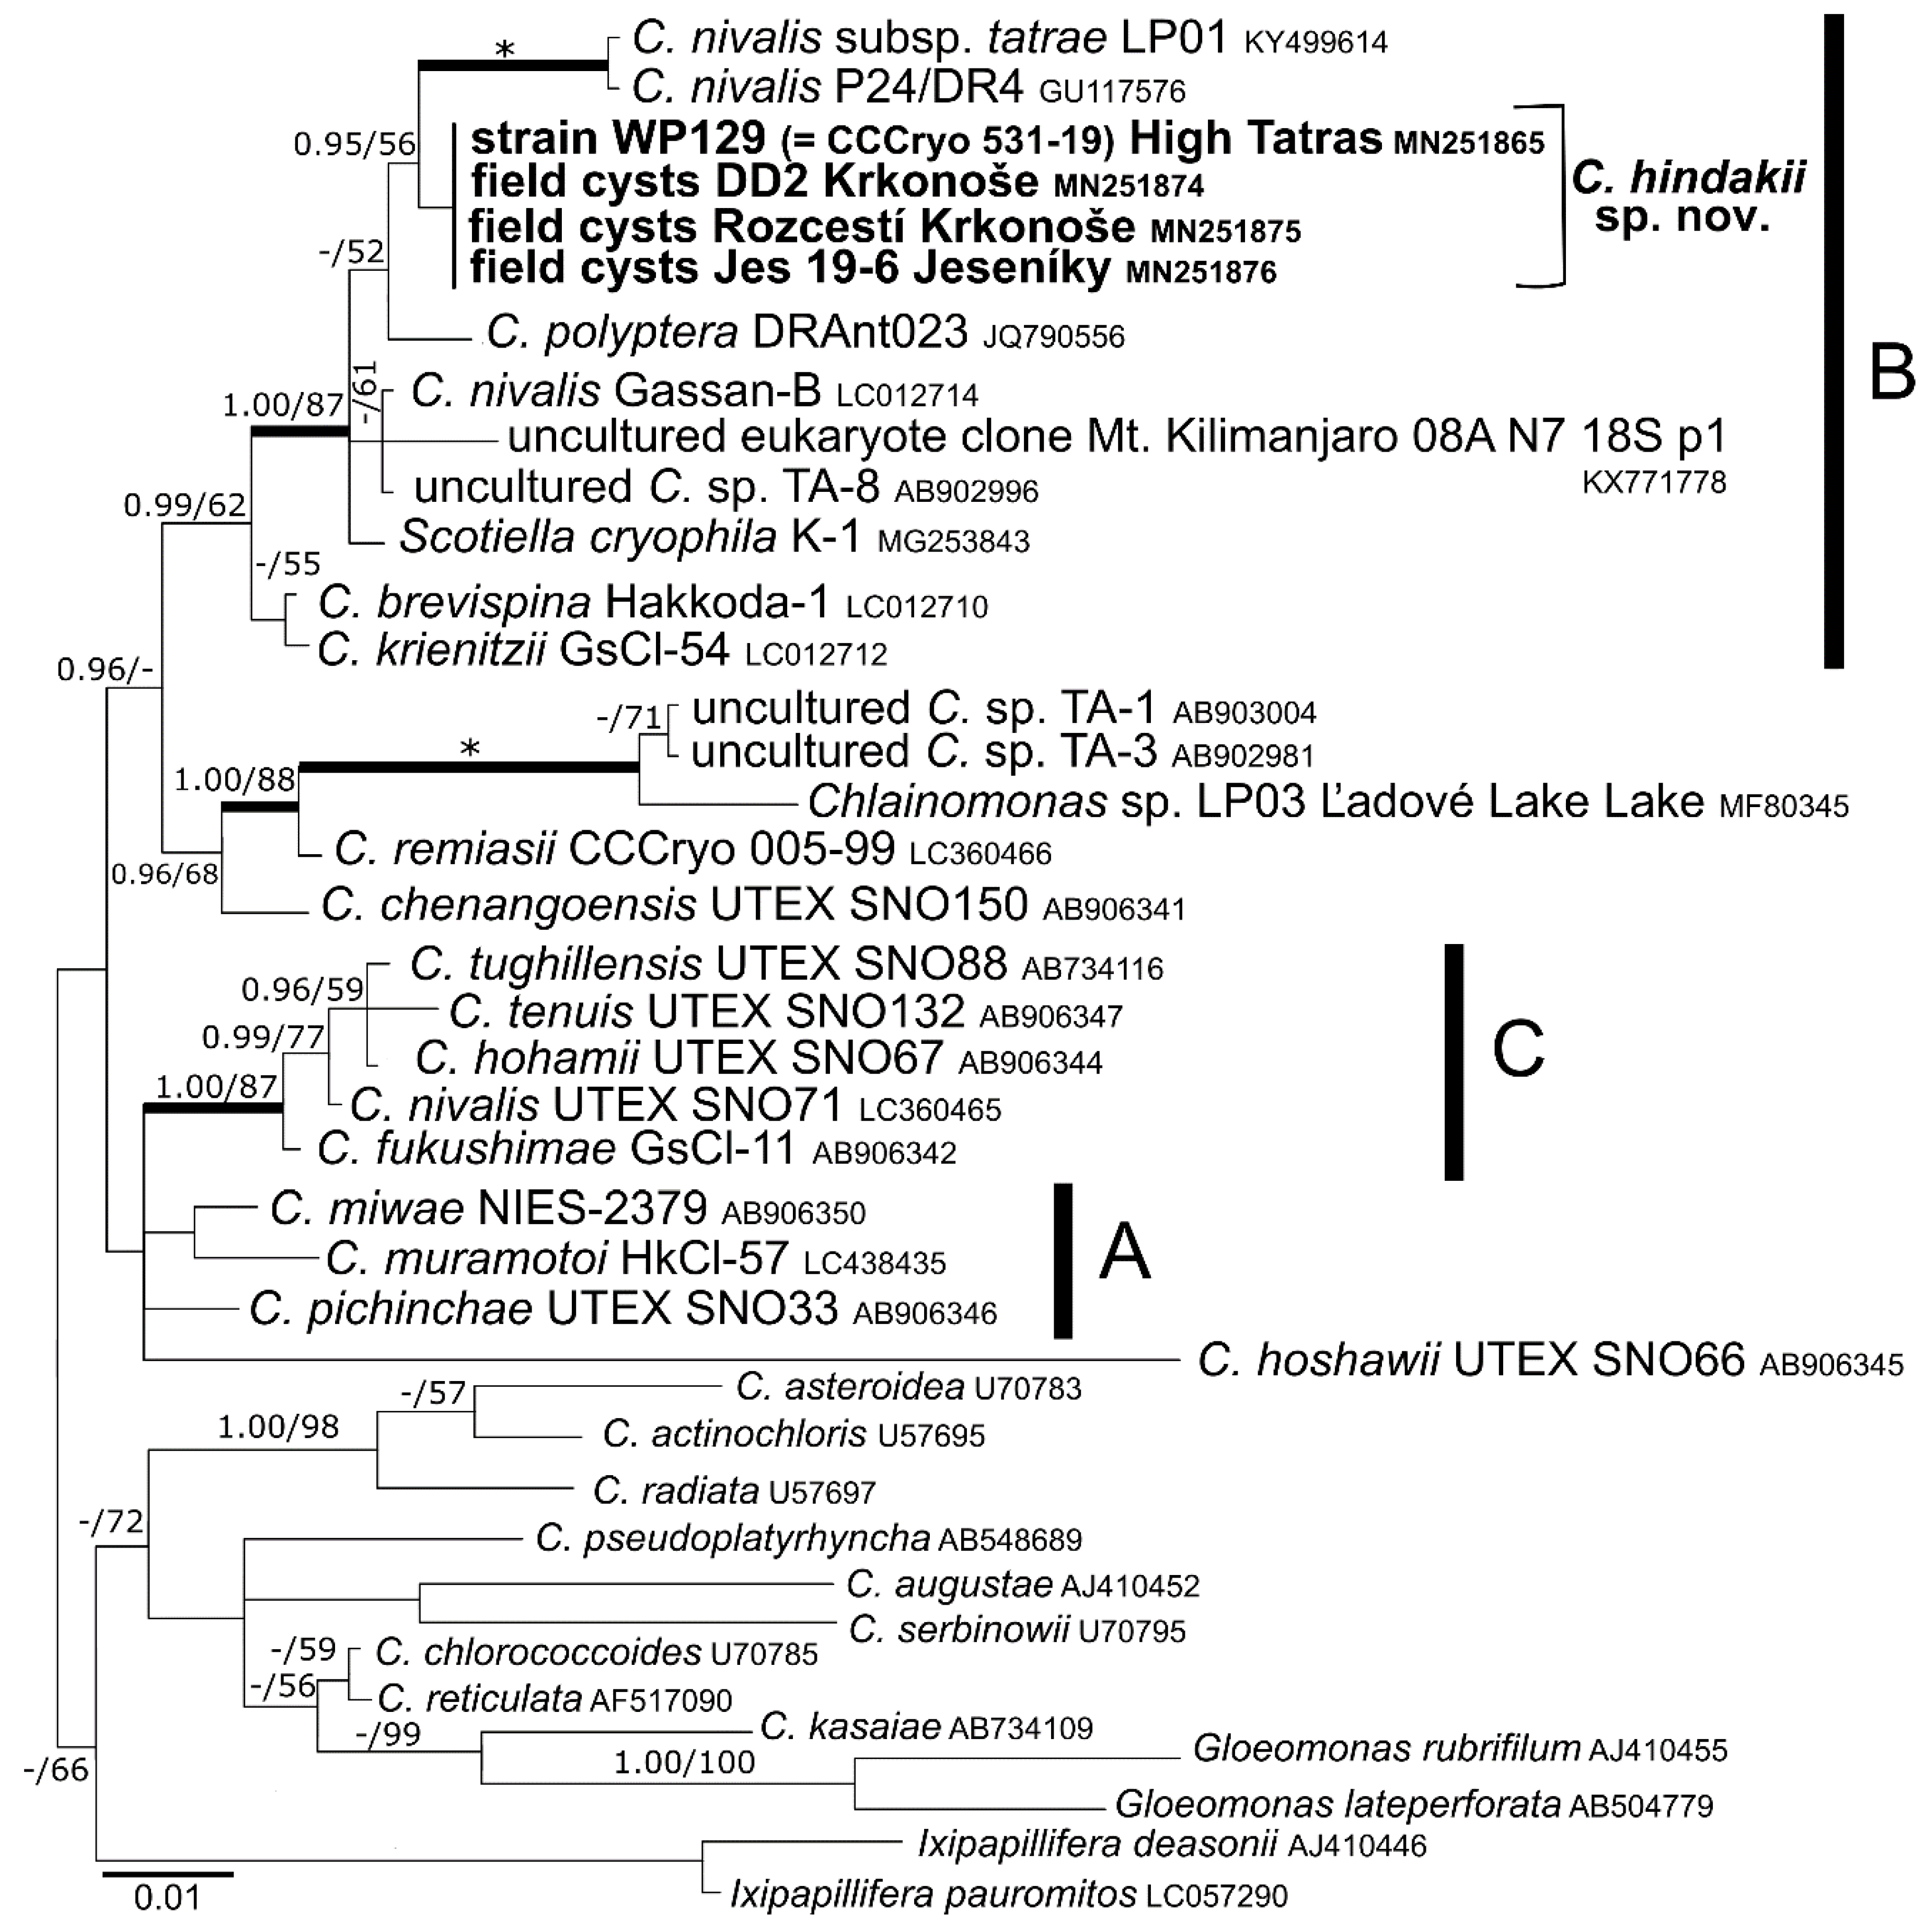
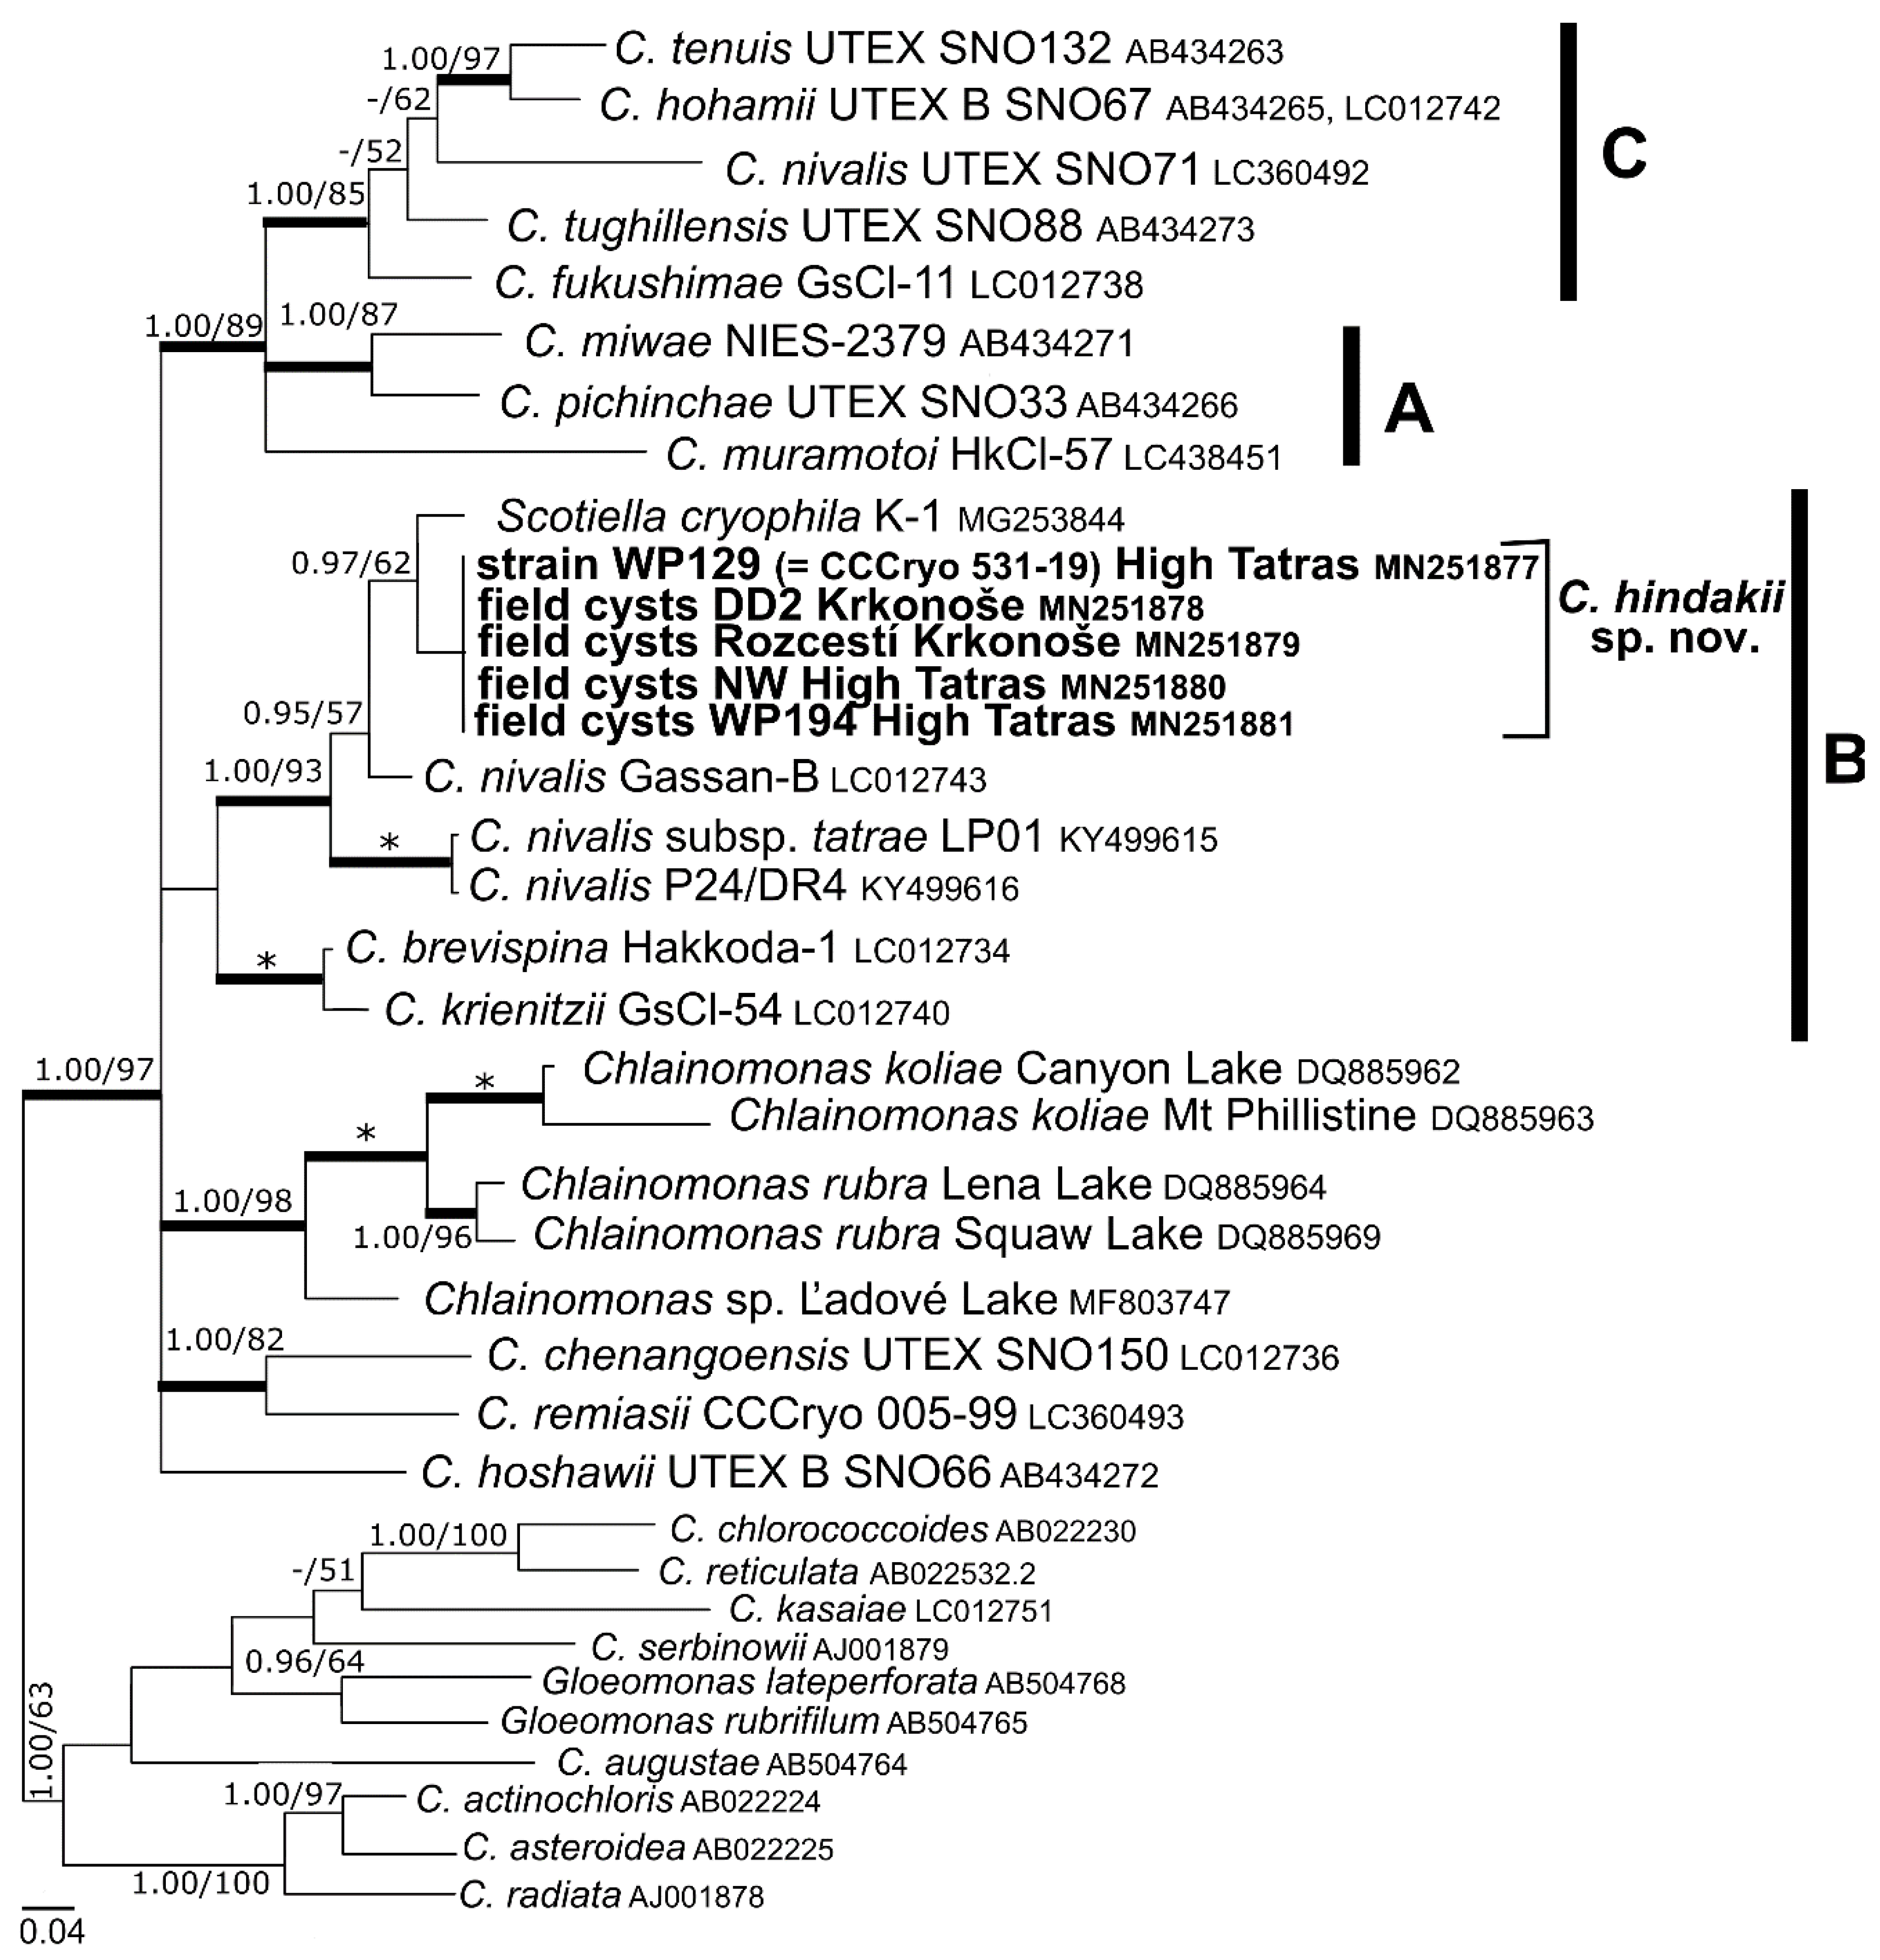
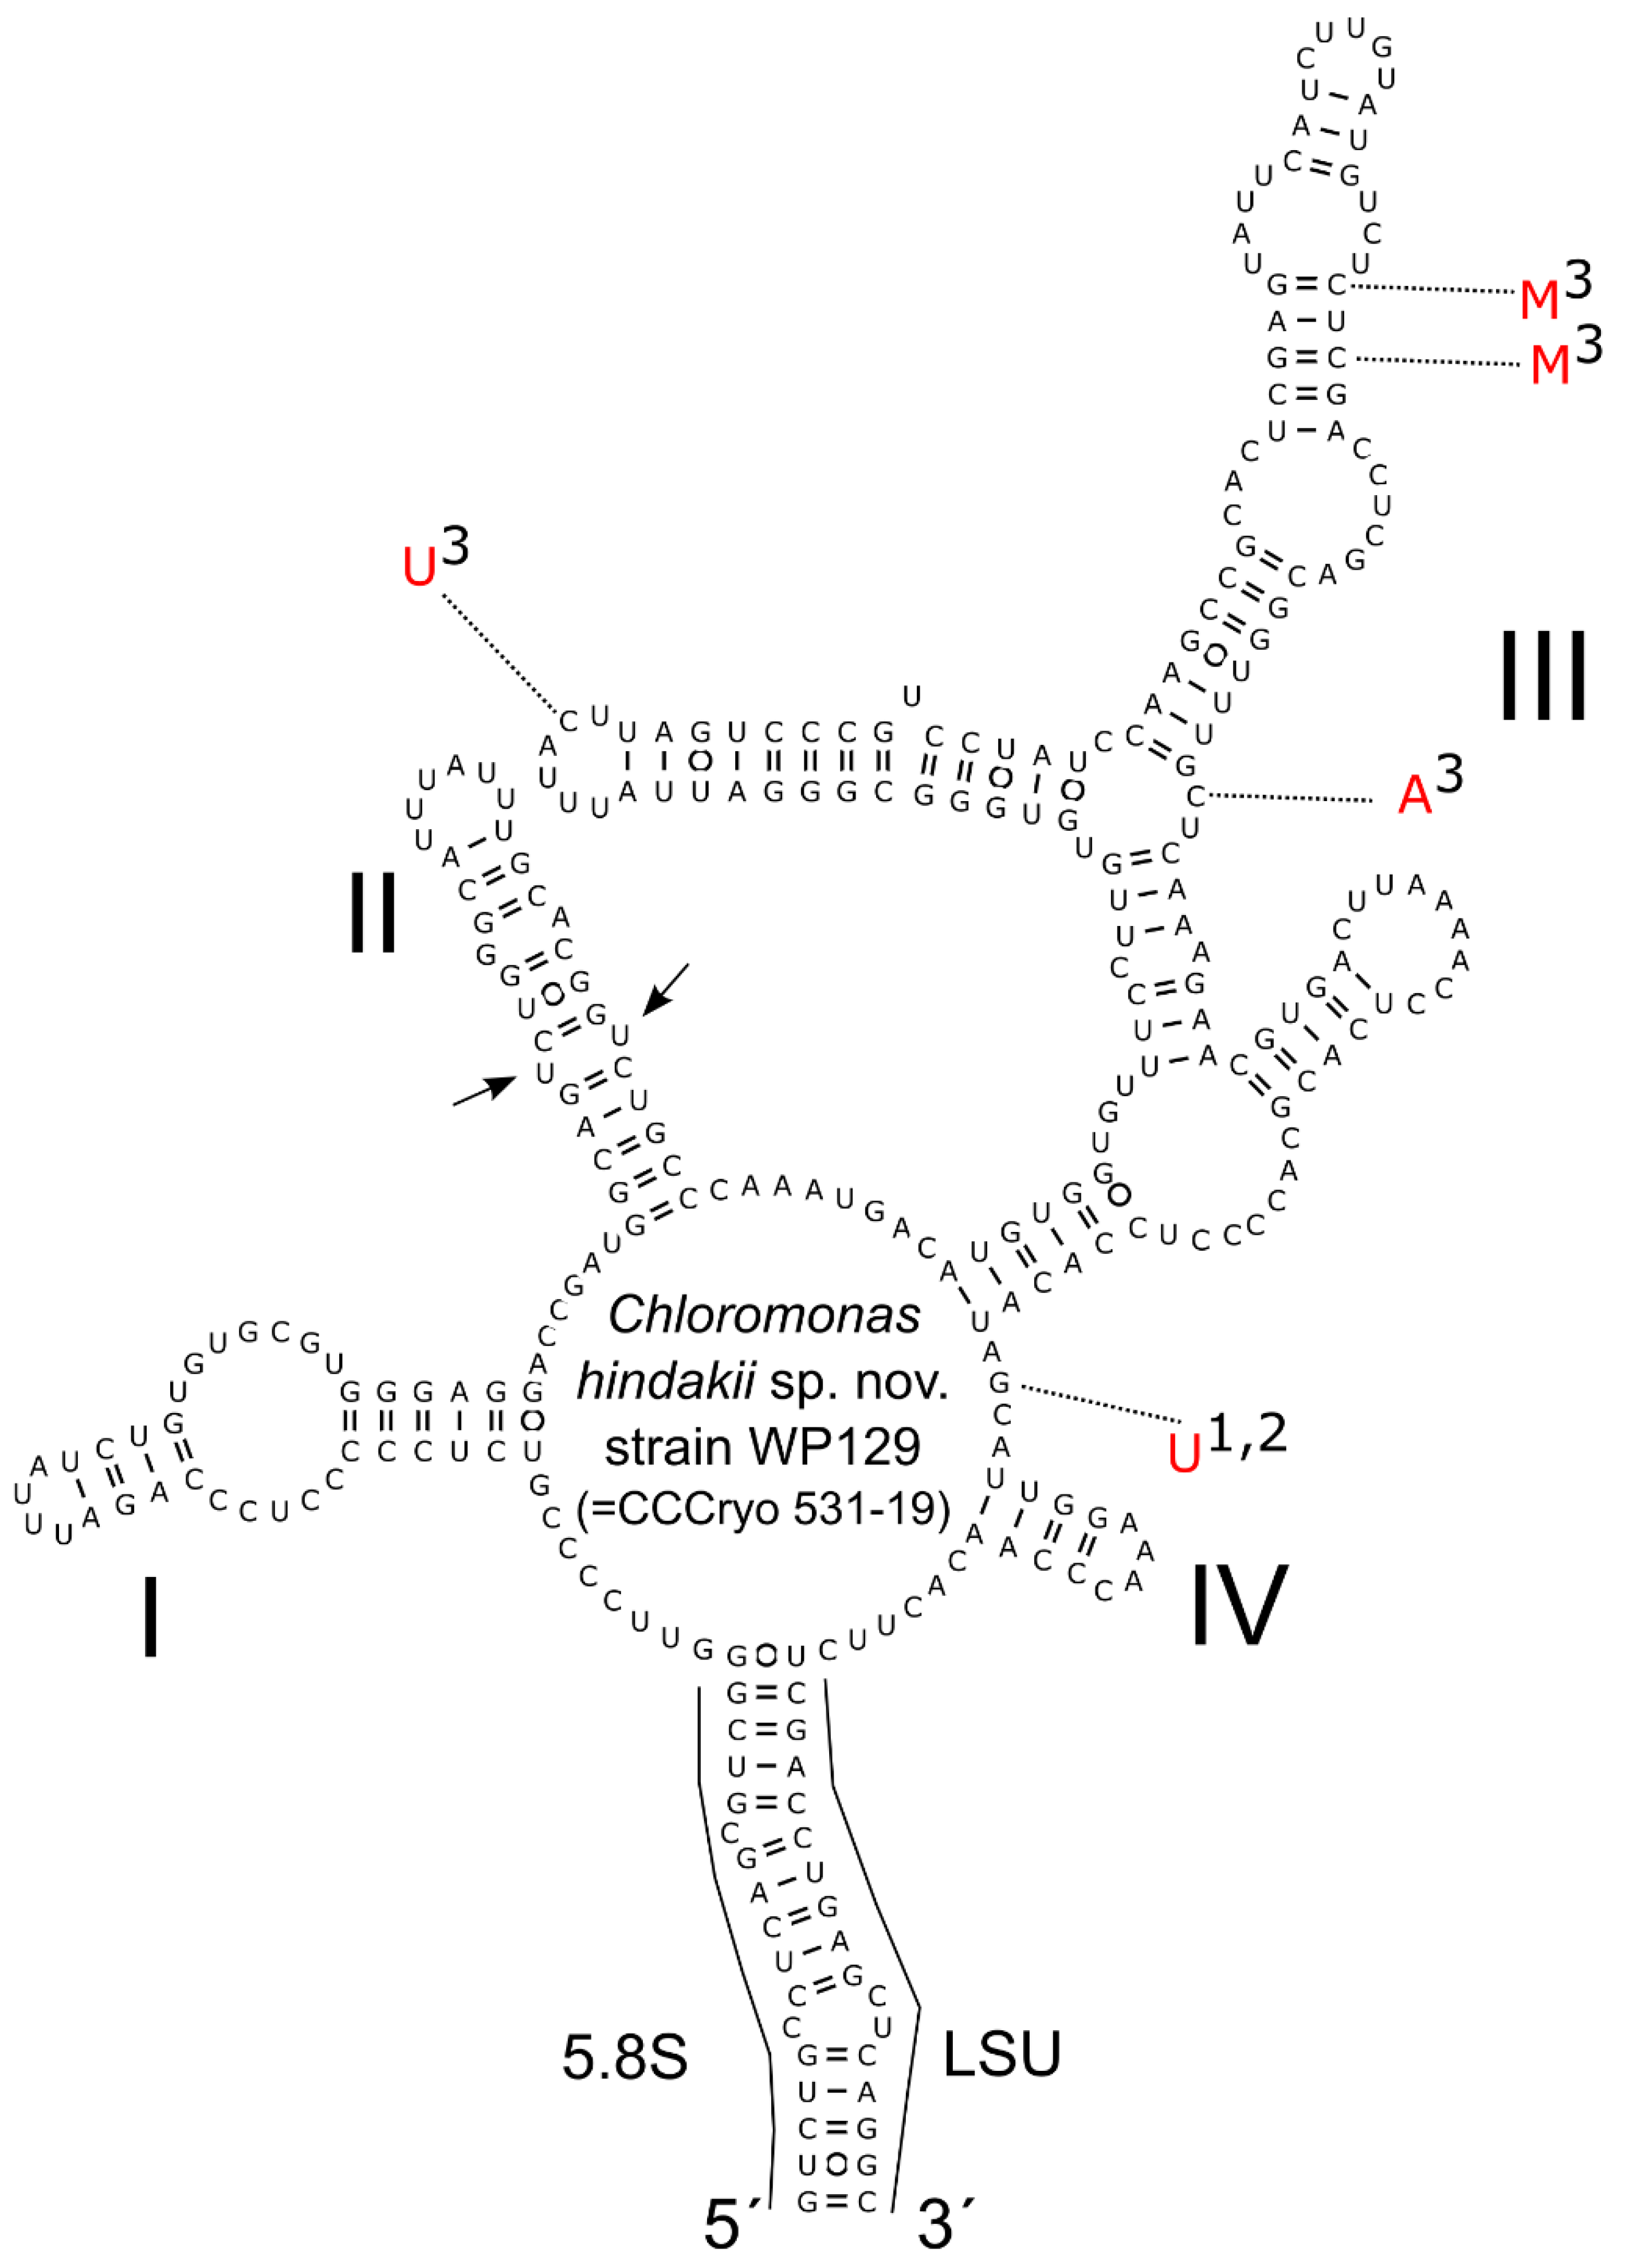
3.3. Phylogeny and Comparative Analysis of Internal Transcribed Spacer 2
3.4. Morphology of Vegetative Cells of Chloromonas hindakii sp. nov.
3.5. Taxonomic Treatment
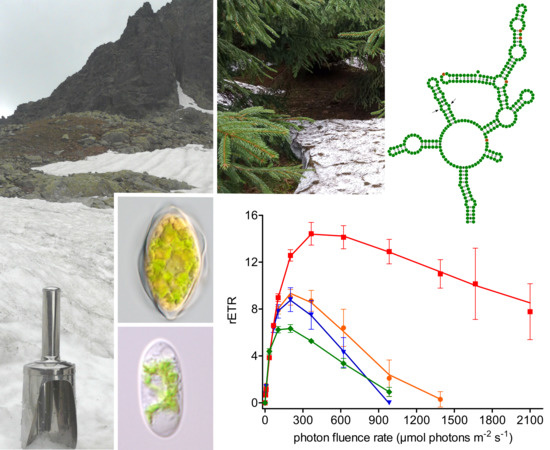
3.6. Photosynthesis
3.7. Pigment Composition
3.8. Fatty Acid (FA) Composition
4. Discussion
4.1. Geographic Distribution and Ecology
4.2. Taxonomy and Related Species
4.3. Morphology of the Field Cysts
4.4. Morphology of the Strain and Context to C. nivalis
4.5. Photobiology of Field Cysts vs. Laboratorial Strain
4.6. Pigments and Fatty Acid Composition
5. Conclusions
Supplementary Materials
Author Contributions
Funding
Acknowledgments
Conflicts of Interest
References
- Davey, M.P.; Norman, L.; Sterk, P.; Huete-Ortega, M.; Bunbury, F.; Loh, B.K.W.; Stockton, S.; Peck, L.S.; Convey, P.; Newsham, K.K.; et al. Snow algae communities in Antarctica—Metabolic and taxonomic composition. New Phytol. 2019, 222, 1242–1255. [Google Scholar] [CrossRef]
- Anesio, A.M.; Lutz, S.; Chrismas, N.A.M.; Benning, L.G. The microbiome of glaciers and ice sheets. NPJ Biofilms Microbiomes 2017, 3, 10. [Google Scholar] [CrossRef] [PubMed]
- Cvetkovska, M.; Hüner, N.P.A.; Smith, D.R. Chilling out: The evolution and diversification of psychrophilic algae with a focus on Chlamydomonadales. Polar Biol. 2017, 40, 1169–1184. [Google Scholar] [CrossRef]
- Matsuzaki, R.; Nozaki, H.; Takeuchi, N.; Hara, Y.; Kawachi, M. Taxonomic re-examination of “Chloromonas nivalis (Volvocales, Chlorophyceae) zygotes” from Japan and description of C. muramotoi sp. nov. PLoS ONE 2019, 14, e0210986. [Google Scholar] [CrossRef] [PubMed]
- Procházková, L.; Leya, T.; Křížková, H.; Nedbalová, L. Sanguina nivaloides and Sanguina aurantia gen. et spp. nov. (Chlorophyta): The taxonomy, phylogeny, biogeography and ecology of two newly recognised algae causing red and orange snow. FEMS Microbiol. Ecol. 2019, 95, fiz064. [Google Scholar] [CrossRef] [PubMed]
- Vimercati, L.; Solon, A.J.; Krinsky, A.; Arán, P.; Porazinska, D.L.; Darcy, J.L.; Dorador, C.; Schmidt, S.K. Nieves penitentes are a new habitat for snow algae in one of the most extreme high-elevation environments on Earth. Arct. Antarct. Alp. Res. 2019, 51, 190–200. [Google Scholar] [CrossRef]
- Terashima, M.; Umezawa, K.; Mori, S.; Kojima, H.; Fukui, M. Microbial community analysis of colored snow from an alpine snowfield in Northern Japan reveals the prevalence of Betaproteobacteria with snow algae. Front. Microbiol. 2017, 8, 1481. [Google Scholar] [CrossRef] [PubMed]
- Brown, S.P.; Olson, B.J.S.C.; Jumpponen, A. Fungi and algae co-occur in snow: An issue of shared habitat or algal facilitation of heterotrophs? Arct. Antarct. Alp. Res. 2015, 47, 729–749. [Google Scholar] [CrossRef]
- Bidigare, R.R.; Ondrusek, M.E.; Kennicutt II, M.C.; Iturriaga, R.; Harvey, H.R.; Hoham, R.W.; Macko, S.A. Evidence for a photoprotective function for secondary carotenoids of snow algae. J. Phycol. 1993, 29, 427–434. [Google Scholar] [CrossRef]
- Hamilton, T.L.; Havig, J. Primary productivity of snow algae communities on stratovolcanoes of the Pacific Northwest. Geobiology 2017, 15, 280–295. [Google Scholar] [CrossRef]
- Thackeray, C.W.; Derksen, C.; Fletcher, C.G.; Hall, A. Snow and climate: Feedbacks, drivers, and indices of change. Curr. Clim. Chang. Rep. 2019, 1–12. [Google Scholar] [CrossRef]
- Mudryk, L.R.; Kushner, P.J.; Derksen, C.; Thackeray, C. Snow cover response to temperature in observational and climate model ensembles. Geophys. Res. Lett. 2017, 44, 919–926. [Google Scholar] [CrossRef]
- Marty, C.; Schlögl, S.; Bavay, M.; Lehning, M. How much can we save? Impact of different emission scenarios on future snow cover in the Alps. Cryosphere 2017, 11, 517–529. [Google Scholar] [CrossRef]
- Morgan-Kiss, R.M.; Priscu, J.C.; Pocock, T.; Gudynaite-Savitch, L.; Huner, N.P.A. Adaptation and acclimation of photosynthetic microorganisms to permanently cold environments. Microbiol. Mol. Biol. R. 2006, 70, 222–252. [Google Scholar] [CrossRef] [PubMed]
- Gorton, H.L.; Vogelmann, T.C. Ultraviolet radiation and the snow alga Chlamydomonas nivalis (Bauer) Wille. Photochem. Photobiol. 2003, 77, 608–615. [Google Scholar] [CrossRef]
- Procházková, L.; Remias, D.; Holzinger, A.; Řezanka, T.; Nedbalová, L. Ecophysiological and morphological comparison of two populations of Chlainomonas sp. (Chlorophyta) causing red snow on ice-covered lakes in the High Tatras and Austrian Alps. Eur. J. Phycol. 2018, 53, 230–243. [Google Scholar] [CrossRef] [PubMed]
- Remias, D. Cell structure and physiology of alpine snow and ice algae. In Plants in Alpine Regions. Cell physiology of Adaption and Survival Strategies; Lütz, C., Ed.; Springer: Berlin/Heidelberg, Germany, 2012; pp. 175–186. [Google Scholar]
- Remias, D.; Karsten, U.; Lűtz, C.; Leya, T. Physiological and morphological processes in the Alpine snow alga Chloromonas nivalis (Chlorophyceae) during cyst formation. Protoplasma 2010, 243, 73–86. [Google Scholar] [CrossRef] [PubMed]
- Remias, D.; Wastian, H.; Lütz, C.; Leya, T. Insights into the biology and phylogeny of Chloromonas polyptera (Chlorophyta), an alga causing orange snow in Maritime Antarctica. Antarct. Sci. 2013, 25, 648–656. [Google Scholar] [CrossRef]
- Procházková, L.; Remias, D.; Řezanka, T.; Nedbalová, L. Chloromonas nivalis subsp. tatrae, subsp. nov. (Chlamydomonadales, Chlorophyta): Re–examination of a snow alga from the High Tatra Mountains (Slovakia). Fottea 2018, 18, 1–18. [Google Scholar]
- Kvíderová, J.; Stibal, M.; Nedbalová, L.; Kaštovská, K. The first record of snow algae vitality in situ by variable fluorescence of chlorophyll. Czech Phycol. 2005, 5, 69–77. [Google Scholar]
- Remias, D.; Procházková, L.; Holzinger, A.; Nedbalová, L. Ecology, cytology and phylogeny of the snow alga Scotiella cryophila K-1 (Chlamydomonadales, Chlorophyta) from the Austrian Alps. Phycologia 2018, 57, 581–592. [Google Scholar] [CrossRef] [PubMed]
- Remias, D.; Lütz-Meindl, U.; Lütz, C. Photosynthesis, pigments and ultrastructure of the alpine snow alga Chlamydomonas nivalis. Eur. J. Phycol. 2005, 40, 259–268. [Google Scholar] [CrossRef]
- Bischoff, H.W.; Bold, H.C. Phycological studies. IV. Some soil algae from Enchanted Rock and related algal species. Univ. Texas Publ. 1963, 6318, 95. [Google Scholar]
- Remias, D.; Pichrtová, M.; Pangratz, M.; Lütz, C.; Holzinger, A. Ecophysiology, secondary pigments and ultrastructure of Chlainomonas sp. (Chlorophyta) from the European Alps compared with Chlamydomonas nivalis forming red snow. FEMS Microbiol. Ecol. 2016, 92, fiw030. [Google Scholar] [CrossRef] [PubMed]
- Piercey-Normore, M.D.; DePriest, P.T. Algal switching among lichen symbioses. Am. J. Bot. 2001, 88, 1490–1498. [Google Scholar] [CrossRef] [PubMed]
- White, T.J.; Bruns, T.; Lee, S.; Taylor, J. Amplification and direct sequencing of fungal ribosomal RNA Genes for phylogenetics. In PCR Protocols—A Guide to Methods and Applications; Innis, M.A., Gelfand, D.H., Sninsky, J.J., White, T.J., Eds.; Academic Press: Cambridge, MA, USA, 1990; Volume 18, pp. 315–322. [Google Scholar]
- Helms, G.; Friedl, T.; Rambold, G.; Mayrhofer, H. Identification of photobionts from the lichen family Physiaceae using algal-specific ITS rDNA sequencing. Lichenologist 2001, 33, 73–86. [Google Scholar] [CrossRef]
- Vilgalys, R.; Hester, M. Rapid genetic identification and mapping of enzymatically amplified ribosomal DNA from several Cryptoccocus species. J. Bacteriol. 1990, 172, 4238–4246. [Google Scholar] [CrossRef]
- Katana, A.; Kwiatowski, J.; Spalik, K.; Zakryś, B.; Szalacha, E.; Szymańska, H. Phylogenetic position of Koliella (Chlorophyta) as inferred from nuclear and chloroplast small subunit rDNA. J. Phycol. 2001, 37, 443–451. [Google Scholar] [CrossRef]
- Hoham, R.W.; Bonome, T.A.; Martin, C.W.; Leebens-Mack, J.H. A combined 18S rDNA and rbcL phylogenetic analysis of Chloromonas and Chlamydomonas (Chlorophyceae, Volvocales) emphasizing snow and other cold-temperature habitats. J. Phycol. 2002, 38, 1051–1064. [Google Scholar] [CrossRef]
- Darty, K.; Denise, A.; Ponty, Y. VARNA: Interactive drawing and editing of the RNA secondary structure. Bioinformatics 2009, 25, 1974–1975. [Google Scholar] [CrossRef]
- Pröschold, T.; Marin, B.; Schlösser, U.G.; Melkonian, M. Molecular phylogeny and taxonomic revision of Chlamydomonas (Chlorophyta). I. Emendation of Chlamydomonas Ehrenberg and Chloromonas Gobi, and description of Oogamochlamys gen. nov. and gen. nov. and Lobochlamys gen. nov. Protist 2001, 152, 265–300. [Google Scholar] [CrossRef]
- Nakada, T.; Misawa, K.; Nozaki, H. Molecular systematics of Volvocales (Chlorophyceae, Chlorophyta) based on exhaustive 18S rRNA phylogenetic analyses. Mol. Phylogenet. Evol. 2008, 48, 281–291. [Google Scholar] [CrossRef] [PubMed]
- Posada, D. jModelTest: Phylogenetic model averaging. Mol. Biol. Evol. 2008, 25, 1253–1256. [Google Scholar] [CrossRef] [PubMed]
- Nedbalová, L.; Mihál, M.; Kvíderová, J.; Procházková, L.; Řezanka, T.; Elster, J. Identity, ecology and ecophysiology of planktic green algae dominating in ice-covered lakes on James Ross Island (northeastern Antarctic Peninsula). Extremophiles 2017, 21, 187–200. [Google Scholar] [CrossRef] [PubMed]
- Bligh, E.G.; Dyer, W.J. A rapid method of total lipid extraction and purification. Can. J. Biochem. Phys. 1959, 37, 911–917. [Google Scholar] [CrossRef]
- Saunders, R.D.; Horrocks, L.A. Simultaneous extraction and preparation for high-performance liquid chromatography of prostaglandins and phospholipids. Anal. Biochem. 1984, 143, 71–75. [Google Scholar] [CrossRef]
- Řezanka, T. Identification of very long polyenoic acids as picolinyl esters by Ag+ ion-exchange high-performance liquid chromatography, reversed-phase high-performance liquid chromatography and gas chromatography—mass spectrometry. J. Chromatogr. A 1990, 513, 344–348. [Google Scholar] [CrossRef]
- Dembitsky, V.M.; Řezanka, T.; Bychek, I.A.; Shustov, M.V. Identification of fatty acids from Cladonia lichens. Phytochemistry 1991, 30, 4015–4018. [Google Scholar] [CrossRef]
- Hoham, R.W.; Mullet, J.E. The life history and ecology of the snow alga Chloromonas cryophila sp. nov. (Chlorophyta, Volvocales). Phycologia 1977, 16, 53–68. [Google Scholar] [CrossRef]
- Coleman, A.W. Pan-eukaryote ITS2 homologies revealed by RNA secondary structure. Nucleic Acids Res. 2007, 35, 3322–3329. [Google Scholar] [CrossRef]
- Hindák, F. Brownish snow in the High Tatras. Biologia 1969, 80–85. [Google Scholar]
- Javornický, P.; Hindák, F. Cryptomonas frigoris spec. nova (Cryptophyceae), the new cyst-forming flagellate from the snow of the High Tatras. Biologia 1970, 25, 241–250. [Google Scholar] [PubMed]
- Hindák, F.; Komárek, J. Cultivation of cryosestonic alga Koliella (Kol) Hind. Biol. Plant. 1968, 10, 95–97. [Google Scholar] [CrossRef]
- Walsby, A.E. Modelling the daily integral of photosynthesis by phytoplankton: Its dependence on the mean depth of the population. Hydrobiologia 1997, 349, 65–74. [Google Scholar] [CrossRef]
- Chytrý, M. Current Vegetation of the Czech Republic. In Flora and Vegetation of the Czech Republic; Chytrý, M., Danihelka, J., Kaplan, Z., Pyšek, P., Eds.; Springer: Cham, Switzerland, 2017; pp. 229–337. [Google Scholar]
- Nedbalová, L.; Kociánová, M.; Lukavský, J. Ecology of snow algae in the Giant Mts. Opera Corcon. 2008, 45, 59–68. [Google Scholar]
- Hanzelová, M.; Vido, J.; Škvarenina, J.; Nalevanková, P.; Perháčová, Z. Microorganisms in summer snow patches in selected high mountain ranges of Slovakia. Biologia 2018, 73, 1177–1186. [Google Scholar] [CrossRef]
- Lukavský, J.; Furnadzhieva, S.; Nedbalová, L. First record of cryoseston in the Vitosha Mountains (Bulgaria). Nova Hedwig. 2009, 88, 97–110. [Google Scholar] [CrossRef]
- Frey, B.; Bühler, L.; Schmutz, S.; Zumsteg, A.; Furrer, G. Molecular characterization of phototrophic microorganisms in the forefield of a receding glacier in the Swiss Alps. Environ. Res. Lett. 2013, 8, 15033. [Google Scholar] [CrossRef]
- Matsuzaki, R.; Kawai-Toyooka, H.; Hara, Y.; Nozaki, H. Revisiting the taxonomic significance of aplanozygote morphologies of two cosmopolitan snow species of the genus Chloromonas (Volvocales, Chlorophyceae). Phycologia 2015, 54, 491–502. [Google Scholar] [CrossRef]
- Kociánová, M.; Štursová, H.; Štursa, J.; Vaněk, J.; Vávra, V. Nové nálezy červeného sněhu v Krkonoších. [New records of red snow in the Krkonoše Mountains]. Opera Corcon. 1989, 26, 151–158. [Google Scholar]
- Stibal, M. Ecological and physiological characteristics of snow algae from Czech and Slovak mountains. Czech Phycol. 2003, 3, 141–152. [Google Scholar]
- Komárek, J.; Nedbalová, L. Green cryosestic algae. In Algae and Cyanobacteria in Extreme Environments; Seckbach, J., Ed.; Springer: Berlin/Heidelberg, Germany, 2007; pp. 321–342. [Google Scholar]
- Jehlička, J.; Culka, A.; Nedbalová, L. Colonization of snow by microorganisms as revealed using miniature Raman spectrometers—Possibilities for detecting carotenoids of psychrophiles on Mars? Astrobiology. 2016, 16, 1–12. [Google Scholar] [CrossRef] [PubMed]
- Lukavský, J. Algal flora of lakes in the High Tatra Mountains (Slovakia). Hydrobiologia 1994, 274, 65–74. [Google Scholar] [CrossRef]
- Kol, E. Cryobiological researches in the High Tatra I. Acta Bot. Hung. 1975, 21, 61–75. [Google Scholar]
- Kol, E. Cryobiological researches in the High Tatra II. Acta Bot. Hung. 1975, 21, 279–287. [Google Scholar]
- Osterrothová, K.; Culka, A.; Němečková, K.; Nedbalová, L.; Procházková, L.; Jehlička, J. Analyzing carotenoids of snow algae by Raman microspectroscopy and high-performance liquid chromatography. Spectrochim. Acta Part A 2019, 212, 262–271. [Google Scholar] [CrossRef] [PubMed]
- Matsuzaki, R.; Nozaki, H.; Kawachi, M. Taxonomic revision of Chloromonas nivalis (Volvocales, Chlorophyceae) strains, with the new description of two snow-inhabiting Chloromonas species. PLoS ONE 2018, 13, e0193603. [Google Scholar] [CrossRef]
- Matsuzaki, R.; Hara, Y.; Nozaki, H. A taxonomic study of snow Chloromonas species (Volvocales, Chlorophyceae) based on light and electron microscopy and molecular analysis of cultured material. Phycologia 2014, 53, 293–304. [Google Scholar] [CrossRef]
- Ling, H.U.; Seppelt, R.D. Snow algae of the Windmill Islands, continental Antarctica. 3. Chloromonas polyptera (Volvocales, Chlorophyta). Polar Biol. 1998, 20, 320–324. [Google Scholar] [CrossRef]
- Starmach, K.; Kawecka, B. The yellowish-green snow in the valley Za Mnichem in the Tatra Mountains. Limnol. Investig. Tatra Mt. Dunajec River Basin 1965, 11, 75–80. [Google Scholar]
- Ling, H.U.; Seppelt, R.D. Snow algae of the Windmill Islands, continental Antarctica. 2. Chloromonas rubroleosa sp. nov. (Volvocales, Chlorophyta), an alga of red snow. Eur. J. Phycol. 1993, 28, 77–84. [Google Scholar] [CrossRef]
- Chodat, R. Algues vertes de la Suisse, A. Pleurococcoïdes–Chroolépoïdes; K.J.Wyss: Berne, Switzerland, 1902; pp. 145–146. [Google Scholar]
- Stibal, M.; Elster, J. Seasonal and diel changes in photosynthetic activity of the snow alga Chlamydomonas nivalis (Chlorophyceae) from Svalbard determined by pulse amplitude modulation fluorometry. FEMS Microbiol. Ecol. 2007, 59, 265–273. [Google Scholar] [CrossRef] [PubMed]
- Molino, A.; Iovine, A.; Casella, P.; Mehariya, S.; Chianese, S.; Cerbone, A.; Rimauro, J.; Musmarra, D. Microalgae characterization for consolidated and new application in human food, animal feed and nutraceuticals. Int. J. Environ. Res. Pu. 2018, 15, 2436. [Google Scholar] [CrossRef] [PubMed]
- Leya, T. Snow algae: Adaptation strategies to survive on snow and ice. In Polyextremophiles. Life Under Multiple Forms of Stress; Seckbach, J., Oren, A., Stan-Lotter, H., Eds.; Springer: Berlin/Heidelberg, Germany, 2013; Volume 27, pp. 401–423. [Google Scholar]
- Osipova, S.; Dudareva, L.; Bondarenko, N.; Nasarova, A.; Sokolova, N.; Obolkina, L.; Glyzina, O.; Timoshkin, O. Temporal variation in fatty acid composition of Ulothrix zonata (Chlorophyta) from ice and benthic communities of Lake Baikal. Phycologia 2009, 48, 130–135. [Google Scholar] [CrossRef]
- Spijkerman, E.; Wacker, A.; Weithoff, G.; Leya, T. Elemental and fatty acid composition of snow algae in Arctic habitats. Front. Microbiol. 2012, 3, 1–15. [Google Scholar] [CrossRef] [PubMed]
- Ishihara, K.; Murata, M.; Kaneniwa, M.; Saito, H.; Komatsu, W.; Shinohara, K. Purification of stearidonic acid (18:4(n-3)) and hexadecatetraenoic acid (16:4(n-3)) from algal fatty acid with lipase and medium pressure liquid chromatography. Biosci. Biotech. Bioch. 2000, 64, 2454–2457. [Google Scholar] [CrossRef]
- Ishihara, K.; Murata, M.; Kaneniwa, M.; Saito, H.; Shinohara, K.; Maeda-Yamamoto, M. Inhibition of icosanoid production in MC/9 mouse mast cells by n-3 polyunsaturated fatty acids isolated from edible marine algae. Biosci. Biotech. Bioch. 1998, 62, 1412–1415. [Google Scholar] [CrossRef]
- Calder, P.C. Polyunsaturated fatty acids and inflammatory processes: New twists in an old tale. Biochimie 2009, 91, 791–795. [Google Scholar] [CrossRef]
- Suzuki, H.; Hulatt, C.J.; Wijffels, R.H.; Kiron, V. Growth and LC-PUFA production of the cold-adapted microalga Koliella antarctica in photobioreactors. J. Appl. Phycol. 2019, 31, 981–997. [Google Scholar] [CrossRef]
- Řezanka, T.; Nedbalová, L.; Lukavský, J.; Střížek, A.; Sigler, K. Pilot cultivation of the green alga Monoraphidium sp. producing a high content of polyunsaturated fatty acids in a low-temperature environment. Algal Res. 2017, 22, 160–165. [Google Scholar] [CrossRef]
- Lang, I.; Hodač, L.; Friedl, T.; Feussner, I. Fatty acid profiles and their distribution patterns in microalgae: A comprehensive analysis of more than 2000 strains from the SAG culture collection. BMC Plant Biol. 2011, 11, 124. [Google Scholar] [CrossRef] [PubMed]
- La Rocca, N.; Sciuto, K.; Meneghesso, A.; Moro, I.; Rascio, N.; Morosinotto, T. Photosynthesis in extreme environments: Responses to different light regimes in the Antarctic alga Koliella antarctica. Physiol. Plantarum. 2015, 153, 654–667. [Google Scholar] [CrossRef] [PubMed]


| Sample | Date | Location | Altitude | GPS |
|---|---|---|---|---|
| DD2 | 11.5.2017 | CZ (1), Krkonoše, Dlouhý důl | 984 | N50°43.231 E15°39.433 |
| Rozcestí | 12.5.2017 | CZ (2), Krkonoše, close to Na Rozcestí | 1349 | N50°42.327 E15°40.368 |
| Jes19-1 | 8.5.2019 | CZ (3), Jeseníky, close to U Výrovky | 1137 | N50°06.673 E17°10.967 |
| Jes19-6 | 9.5.2019 | CZ (4), Jeseníky, next to Sněžná kotlina | 1157 | N50°08.121 E17°08.817 |
| LP06 | 14.6.2017 | PL (5), H. Tatras, Dolina za Mnichem | 1858 | N49°11.656 E20°03.146 |
| WP129 | 15.6.2017 | PL (6), H. Tatras, Dolina za Mnichem | 2082 | N49°11.424 E20°03.153 |
| WP130 | 15.6.2017 | PL (7), H.Tatras, ice-covered Zadni Mnichowy L. | 2038 | N49°11.403 E20°03.101 |
| WP136 | 15.6.2017 | SK (8), H. Tatras, Mengusovská dolina | 1976 | N49°10.475 E20°04.910 |
| NW | 18.6.2017 | SK (9), H. Tatras, shore of Nižné Wahlenberg.L. | 2061 | N49°9.543 E20°1.612 |
| WP194 | 17.6.2018 | SK (10), H. Tatras, Velká Studená dolina | 2022 | N49°10.540 E20°09.414 |
| Primer | Marker | Direction | Sequence | Reference |
|---|---|---|---|---|
| SSU | ITS2 | F | CTGCGGAAGGATCATTGATTC | [26] |
| LSU | ITS2 | R | AGTTCAGCGGGTGGTCTTG | [26] |
| ITS5 | ITS2 | F | GGAAGTAAAAGTCGTAACAAGG | [27] |
| ITS1 | ITS2 | F | TCCGTAGGTGAACCTGCGG | [27] |
| ITS4 | ITS2 | R | TCCTCCGCTTATTGATATGC | [27] |
| Al1500af | ITS2 | F | GCGCGCTACACTGATGC | [28] |
| LR3 | ITS2 | R | GGTCCGTGTTTCAAGACGG | [29] |
| 18F2 | 18S | F | AACCTGGTTGATCCTGCCAGT | [30] |
| 18R2 | 18S | R | TGATCCTTCTGCAGGTTCACCTACG | [30] |
| rbcL1F | rbcL | F | CTGCTTTATACTGCGAAACTGC | [31] |
| rbcL7R | rbcL | R | AAATAAATACCACGGCTACG | [31] |
| Sample/Strain Code | NCBI Accession Numbers | ||
|---|---|---|---|
| ITS2 rDNA | 18S rDNA | rbcL | |
| WP129 (= CCCryo 531-19) | MN251865 | MN251865 | MN251877 |
| DD2 | MN251866 | MN251874 | MN251878 |
| Rozcestí | MN251867 | MN251875 | MN251879 |
| Jes19-1 | MN251868 | ||
| Jes19-6 | MN251869 | MN251876 | |
| LP06 | MN251870 | ||
| WP136 | MN251871 | ||
| NW | MN251872 | MN251880 | |
| WP194 | MN251873 | MN251881 | |
| Sample | EC | pH | SWE | Cells Per mL Meltwater | Cell Length | Cell Width | L:W Ratio |
|---|---|---|---|---|---|---|---|
| DD2 | 14 | 5.7 | 48.7 ± 0.3 | 19,950 ± 2000 | 25.5 ± 2 | 16.3 ± 1.4 | 1.57 ± 0.1 |
| Rozcestí | 9 | 5.9 | - | - | 25.0 ± 2.1 | 16.6 ± 1.5 | 1.51 ± 0.1 |
| Jes19-1 | 28 | 7.0 | - | 60,800 ± 6080 | 27.3 ± 2.1 | 17.9 ± 2.2 | 1.53 ± 0.1 |
| Jes19-6 | 33 | 6.9 | - | 43,050 ± 4300 | 30.3 ± 2.1 | 19.7 ± 1.7 | 1.54 ± 0.1 |
| LP06 | 5.2 | 5.5 | 55.9 ± 2.1 | 54,150 ± 5400 | 25.2 ± 2 | 16.4 ± 1.5 | 1.54 ± 0.1 |
| WP129 | - | - | - | - | 23.7 ± 1.2 | 15.0 ± 0.8 | 1.52 ± 0.1 |
| WP130 | - | - | - | 47,100 ± 4700 | - | - | - |
| WP136 | - | - | - | 79,100 ± 7900 | 23.5 ± 2.3 | 15.6 ± 2.1 | 1.52 ± 0.1 |
| NW | - | - | - | - | 23.0 ± 2.1 | 15.0 ±1.4 | 1.54 ± 0.1 |
| WP194 | 5.1 | 6.8 | 60.8 ± 5.97 | 21,900 ± 2100 | 26.8 ± 1.4 | 17.6 ± 1.4 | 1.53 ± 0.1 |
| Sample | N&V | Lut | Zea | Chl b | β-car | Ast | Ast-E | Ast-tot | α-toc |
|---|---|---|---|---|---|---|---|---|---|
| WP194 | 0.120 | 0.315 | n.d. | 0.227 | 0.014 | 0.037 | 0.385 | 0.422 | 0.085 |
| LP06 | 0.135 | 0.277 | n.d. | 0.273 | 0.020 | 0.012 | 0.476 | 0.488 | 0.080 |
| Fatty Acid | WP129 (= CCCryo 531-19) | Rozcestí | |||
|---|---|---|---|---|---|
| TL | NL | PL | GL | TL | |
| 14:0 | 0.7 ± 0.5 | 0.8 ± 0.6 | 1.1 ± 0.3 | 0 | 0.5 |
| 16:0 | 14.7 ± 6.1 | 15.6 ± 8.3 | 15.7 ± 1.4 | 10.4 ± 0.9 | 19.2 |
| 16:1 (9Z) | 0.3 ± 0.1 | 0 | 2.5 ± 1.3 | 0 | 1.9 |
| 16:1 (7Z) | 0.4 ± 0.3 | 0.5 ± 0.5 | 0 | 0 | 2.1 |
| 3t-16:1 | 0 | 0 | 4.6 ± 0.1 | 0 | 0 |
| 16:2 (7Z,10Z) | 0 | 0 | 0 | 0 | 3.2 |
| 16:3 (4Z,7Z,10Z) | 0 | 0 | 0 | 0 | 0.3 |
| 16:3 (7Z,10Z,13Z) | 2.1 ± 1.1 | 1.9 ± 1.4 | 1.5 ± 0.2 | 3.6 ± 0.3 | 2.7 |
| 16:4 (4Z,7Z,11Z,13Z) | 28.5 ± 4.6 | 30.6 ± 6.1 | 12.1 ± 0.6 | 29.5 ± 1.6 | 10.3 |
| 18:0 | 7.3 ± 6.8 | 6.7 ± 8.9 | 1.5 ± 0.6 | 14.5 ± 3.6 | 1.3 |
| 18:1 (11Z) | 0.5 ± 0.3 | 0.5 ± 0.4 | 1.1 ± 0.3 | 0 | 7.5 |
| 18:1 (9Z) | 9.8 ± 3.6 | 12.1 ± 5.2 | 8.4 ± 1.1 | 0 | 9.4 |
| 18:2 (9Z,12Z) | 3.4 ± 0.8 | 3.9 ± 1.0 | 3.4 ± 0.1 | 1.2 ± 0.7 | 4.8 |
| 18:3 (9Z,12Z,15Z) | 25.9 ± 3.7 | 21.4 ± 3.7 | 44.7 ± 1.7 | 33.2 ± 8.4 | 31.6 |
| 18:3 (6Z,9Z,12Z) | 0 | 0 | 0 | 0 | 0.5 |
| 18:4 (6Z,9Z,12Z,15Z) | 5.9 ± 0.2 | 6.0 ± 1.6 | 3.3 ± 1.1 | 7.4 ± 4.7 | 4.7 |
| SAFA | 22.7 ± 10.9 | 23.1 ± 13.5 | 18.4 ± 1.0 | 25.0 ± 3.6 | 21 |
| MUFA | 11.5 ± 3.6 | 13.1 ± 5.0 | 16.6 ± 0.8 | 0 | 20.9 |
| PUFA | 65.8 ± 9.9 | 63.8 ± 8.5 | 65.1 ± 1.5 | 75.0 ± 3.6 | 58.1 |
© 2019 by the authors. Licensee MDPI, Basel, Switzerland. This article is an open access article distributed under the terms and conditions of the Creative Commons Attribution (CC BY) license (http://creativecommons.org/licenses/by/4.0/).
Share and Cite
Procházková, L.; Remias, D.; Řezanka, T.; Nedbalová, L. Ecophysiology of Chloromonas hindakii sp. nov. (Chlorophyceae), Causing Orange Snow Blooms at Different Light Conditions. Microorganisms 2019, 7, 434. https://doi.org/10.3390/microorganisms7100434
Procházková L, Remias D, Řezanka T, Nedbalová L. Ecophysiology of Chloromonas hindakii sp. nov. (Chlorophyceae), Causing Orange Snow Blooms at Different Light Conditions. Microorganisms. 2019; 7(10):434. https://doi.org/10.3390/microorganisms7100434
Chicago/Turabian StyleProcházková, Lenka, Daniel Remias, Tomáš Řezanka, and Linda Nedbalová. 2019. "Ecophysiology of Chloromonas hindakii sp. nov. (Chlorophyceae), Causing Orange Snow Blooms at Different Light Conditions" Microorganisms 7, no. 10: 434. https://doi.org/10.3390/microorganisms7100434
APA StyleProcházková, L., Remias, D., Řezanka, T., & Nedbalová, L. (2019). Ecophysiology of Chloromonas hindakii sp. nov. (Chlorophyceae), Causing Orange Snow Blooms at Different Light Conditions. Microorganisms, 7(10), 434. https://doi.org/10.3390/microorganisms7100434