Article

Acute Toxoplasma gondii Infection Drives Gut Microbiome Dysbiosis and Functional Disruption in Mice as Revealed by Metagenomic Sequencing

1
Faculty of Animal Science and Technology, Yunnan Agricultural University, Kunming 650201, China
2
The Yunnan Key Laboratory of Veterinary Etiological Biology, College of Veterinary Medicine, Yunnan Agricultural University, Kunming 650201, China
3
Animal Research and Resource Center, School of Life Sciences, Yunnan University, Kunming 650201, China
4
Yunnan Province Center for Animal Disease Control and Prevention, Kunming 650201, China
*
Authors to whom correspondence should be addressed.
These authors contributed equally to this work.
Microorganisms 2025, 13(9), 2056; https://doi.org/10.3390/microorganisms13092056
Submission received: 13 July 2025 / Revised: 10 August 2025 / Accepted: 30 August 2025 / Published: 4 September 2025
(This article belongs to the Section Microbiomes)

Abstract

Toxoplasma gondii is a widely distributed intracellular parasite that disrupts host immune and metabolic homeostasis. Although accumulating evidence highlights the role of gut microbiota in parasitic infections, the effects of acute T. gondii infection on host gut microbial ecology remain poorly understood. In this study, metagenomic sequencing technology was used to systematically analyze the composition and functional alterations of the ileal microbiota in BALB/c mice on day 10 post-infection. Compared to uninfected controls, T. gondii infected mice exhibited a significant reduction in microbial diversity and a pronounced shift in community structure. Notably, there was an expansion of Proteobacteria, particularly the Enterobacteriaceae family, alongside a marked decline in beneficial taxa such as Actinobacteria and Bacillota. Functional annotation using the KEGG and CAZy databases revealed enrichment of metabolic pathways related to glycolysis/gluconeogenesis, O-antigen nucleotide sugar biosynthesis, bacterial secretion systems, and biofilm formation-Escherichia coli in the infected microbiota. These findings provide novel insights into the dysbiosis of gut microbiota and host-microbe interactions during acute T. gondii infection.

1. Introduction

T. gondii is an obligate intracellular parasite that is widely distributed globally and infects approximately one-third of humans and a wide range of warm-blooded animals [1,2]. Hosts with a robust immune function often exhibit no symptoms or only mild symptoms after infection. However, in individuals with weakened immunity and congenital infections, acute toxoplasmosis can lead to severe and potentially life-threatening pathological outcomes [3].
T. gondii is primarily transmitted through the oral route. Upon the ingests the cysts or oocysts, the parasites invade the epithelial cells of the small intestine and spread to various tissues and organs throughout the body to reproduce asexually [4]. Traditionally, the pathogenic mechanism of T. gondii infection has been mainly attributed to the host immune response and the manipulation of host cell signaling pathways by the parasite [5,6]. It is worth noting that the intestine is not only the gateway for T. gondii to invade, but also harbors a complex gut microbiota that may play a potential key regulatory role in the infection process [7]. Recent studies have demonstrated that under normal physiological conditions, T. gondii infection can activate the synergistic defense mechanisms of the mucosal immune system and the gut microbiota. However, microbial disruption may exacerbate disease severity by synergistically promoting gut inflammation in conjunction with T. gondii [4]. These findings suggest the existence of a dynamic and complex interaction network among T. gondii, the host mucosal immune system, and the gut microbiota during infection.
The gut microbiota constitutes a highly complex and dynamic ecosystem that plays a critical role in host nutrient metabolism, immune homeostasis, and maintenance of the gut barrier function [8]. Dysbiosis of the gut flora has been closely associated with the onset and progression of various diseases, including infections, inflammatory conditions, and metabolic disorders [9]. While interactions between bacterial or viral infections and the gut microbiota have been extensively studied, the effects of protozoan parasites, particularly T. gondii, on gut microbial composition and function remain largely underexplored. Previous studies have shown that parasitic infections can significantly alter the gut microbiota, leading to reduced species diversity and abnormal proliferation of opportunistic pathogens [10,11]. However, the comprehensive effects of acute T. gondii infection on microbial taxonomic structure, functional capacity, and microbiota-mediated pathogenic mechanisms remain poorly understood.
To address this gap, the present study employed metagenomic sequencing to comprehensively characterize the ileal microbiota of mice during acute T. gondii infection. High-resolution taxonomic profiling was conducted alongside in-depth functional annotation using the KEGG and CAZy databases. By integrating taxonomic and functional analyses, this study aims to elucidate the mechanisms by which T. gondii disrupts gut microbial ecology and identify potential functional pathways involved in infection-induced dysbiosis. These findings will provide new theoretical insights and experimental evidence to advance our understanding of the complex interplay among the gut microbiota, T. gondii, and host immune responses.

2. Materials and Methods

2.1. Experimental Design and Sample Collection

Eight-week-old female BALB/c mice were purchased from Yunnan University. All mice were housed in individually ventilated cages and had ad libitum access to food and water. The ME49 strain of T. gondii (Type II), used for constructing infectious models, was obtained from Yunnan University. After 1 week of acclimatization, the mice were randomly divided into two groups (n = 3 per group): an acute infection (BCA) group and a control group for the acute phase (BCN). The mice in the infected groups were orally infected with 100 T. gondii cysts, whereas those in the control groups received 0.2 mL of sterile phosphate-buffered solution. On day 10 post-infection (acute phase; BCA), the mice were euthanized, and at least 2 g of ileal content was aseptically collected and stored at −80 °C for subsequent DNA extraction. The Yunnan University Ethics Committee approved all animal experiments (Approval No. YNU20241024; date: 2 February 2024).

2.2. DNA Extraction, Metagenomic Library Preparation, and Sequencing

DNA was extracted from samples using the MagPure Stool DNA KF Kit B (MAGEN, Guangzhou, China). For metagenomic library preparation, the BGI Optimal DNA Library Prep Kit (BGI, Shenzhen, China) was employed. Briefly, the extracted DNA underwent fragmentation and size selection via magnetic bead purification, followed by end repair and adenylation. Subsequently, sequencing adapters were ligated to the fragments, followed by PCR amplification and quality control of the library. After library quality assessment, the double-stranded DNA libraries were denatured into single strands and circularized. Linear DNA remnants were then removed via enzymatic digestion, and the circular single-stranded DNA templates were amplified using rolling circle amplification (RCA) with phi29 polymerase to produce DNA nanoballs (DNBs).

2.3. Bioinformatics Analysis of Metagenomic Sequencing Data

All the raw data were trimmed by SOAPnuke v.1.5.2 [12]. The trimmed reads were mapped to the host genome using SOAP2 v.2.21 [13] software to identify and remove host-originated reads (only for samples of host origin). High-quality reads were then subjected to de novo assembly using MEGAHIT v.1.2.9 software [14]. Contigs shorter than 200 base pairs were excluded from further analysis. Genes were predicted over contigs using MetaGeneMark v.3.38 [15], followed by removal of redundant gene sequences via CD-HIT v.4.8.1 [16] at a sequence identity cutoff of 95% and coverage cutoff of 90%. To construct the gene abundance matrix, the Salmon v.1.6.0 software [17] is used for quantification. For functional annotation, predicted gene protein sequences were aligned against functional databases (e.g., KEGG, CAZy) using DIAMOND v.2.1.8 [18] with an E-value cutoff of 1 × 10⁻⁵. Taxonomic annotations were assigned based on the Kraken v.2 LCA algorithm [19].

2.4. Differential Abundance Analysis and Statistical Assessment of Diversity Across Groups

Species annotations were obtained from the NR database, and species abundance was determined based on the relative expression levels of corresponding genes. The α diversity was quantified using the Chao1 index, as well as the Simpson and Shannon indices, based on species-level relative abundance profiles in R. The β diversity was calculated using Bray-Curtis distance. The Linear Discriminant Analysis (LDA) Effect Size (LEfSe) method [20] was employed to compute LDA scores for the ileum microbiota. Statistical analysis using the Wilcoxon rank test and the Kruskal-Wallis H test was performed to evaluate the significant differences in the diversity index and relative abundance of taxa, KOs, KEGG pathways, and CAZy families. The results were visualized using a heatmap (p < 0.05). Differentially enriched KEGG pathways were identified according to reporter scores [21], with an absolute score threshold of 1.65 used to determine statistical significance.

2.5. Statistical Analysis

Statistical analyses were performed using the IBM SPSS Statistics program (version 21). Based on the abundance profiles, the features with significantly differential abundances across groups were identified using the Wilcoxon rank-sum test and the Kruskal-Wallis H test [22], with the Benjamini-Hochberg post hoc correction [23] applied. Pairwise comparisons were performed using the Wilcoxon signed-rank test. p < 0.05 was considered statistically significant, and p < 0.01 indicated highly significant differences.

3. Results

3.1. Metagenomic Sequencing Quality and Data Overview

In this study, metagenomic sequencing was performed on the ileal contents of six BALB/c mice, comprising three T. gondii-infected groups (BCA1-BCA3) and three uninfected controls (BCN1-BCN3). Paired-end sequencing (PE150) was performed using the DNBSeq platform. On average, approximately 104.36 million raw reads were generated per sample, equivalent to 15.70 GB of raw sequencing data. After quality filtering by fastp, an average of 100.26 million high-quality clean reads were retained, corresponding to a retention rate of 95.43%. The average Q20 and Q30 values were 98.08% and 94.53%, respectively, indicating high sequencing quality. The average GC content was 44.13%, with minimal variation among samples (range: 42.65–48.68%). To remove host-derived sequences, clean read segments were aligned to the mouse reference genome (GRCm39) using Bowtie2. On average, 89.46% of the clean reads were retained as non-host (microbial) sequences. The host contamination rate in the BCA group was consistently lower than that observed in the BCN group, with the lowest rate recorded in the BCA2 subgroup (3.35%). In contrast, the average host contamination rate in the BCN group was approximately 12.11% (Table S1). Overall, these results indicate that the metagenomic sequencing data obtained in this study were of high quality, with good consistency among samples, and are very suitable for subsequent studies on microbial community structure and function analysis. These high-quality metagenomic data were subsequently used for de novo assembly, microbial taxonomy analysis, functional annotation, and subsequent comparative analysis.

3.2. T. gondii Infection Leads to Changes in Gut Microbial Diversity in Mice

The α diversity represents species richness and diversity. To assess the diversity of the gut microbiota in mice, we aligned the clean read sequences with the genomic catalogue, quantified and depicted the relative abundance of bacterial species at the phylum, family, and genus levels. Overall, the gut bacterial diversity of mice was reduced after T. gondii infection (Figure 1A). Specifically, the Chao1, Simpson, and Shannon indices of the acute infected group (BCA) were lower than those of the control group (BCN), indicating that acute infection reduced the diversity of gut microorganisms. The Wilcoxon rank sum test revealed no statistically significant differences in the Chao1, Simpson, and Shannon indices between the groups (p > 0.05).
For β diversity analysis, a Bray-Curtis distance dissimilarity matrix was constructed, and principal coordinates analysis (PCoA) was used to visualize changes in microbial community composition (Figure 1B). PC1 and PC2 accounted for 99.46% and 0.33% of the total variance, respectively. PCoA showed clear separation of microbial communities between different groups. The BCA group formed a distinct cluster on the right side of the graph, clearly separated from the BCN group. NMDS further confirmed that T. gondii infection induced a significant alteration in the overall structure of the gut microbiota, with the BCA group and the BCN group clearly separated along the NMDS1 axis (Figure 1C, PERMANOVA, p < 0.001). These findings suggest that the significant clinical symptoms observed during acute T. gondii infection may be partly due to disturbances in the gut microbiota, with changes in the microbial community being more pronounced during the acute stage than during the uninfected stage.

3.3. Disturbance of Gut Microbiome Composition in Diseased Mice

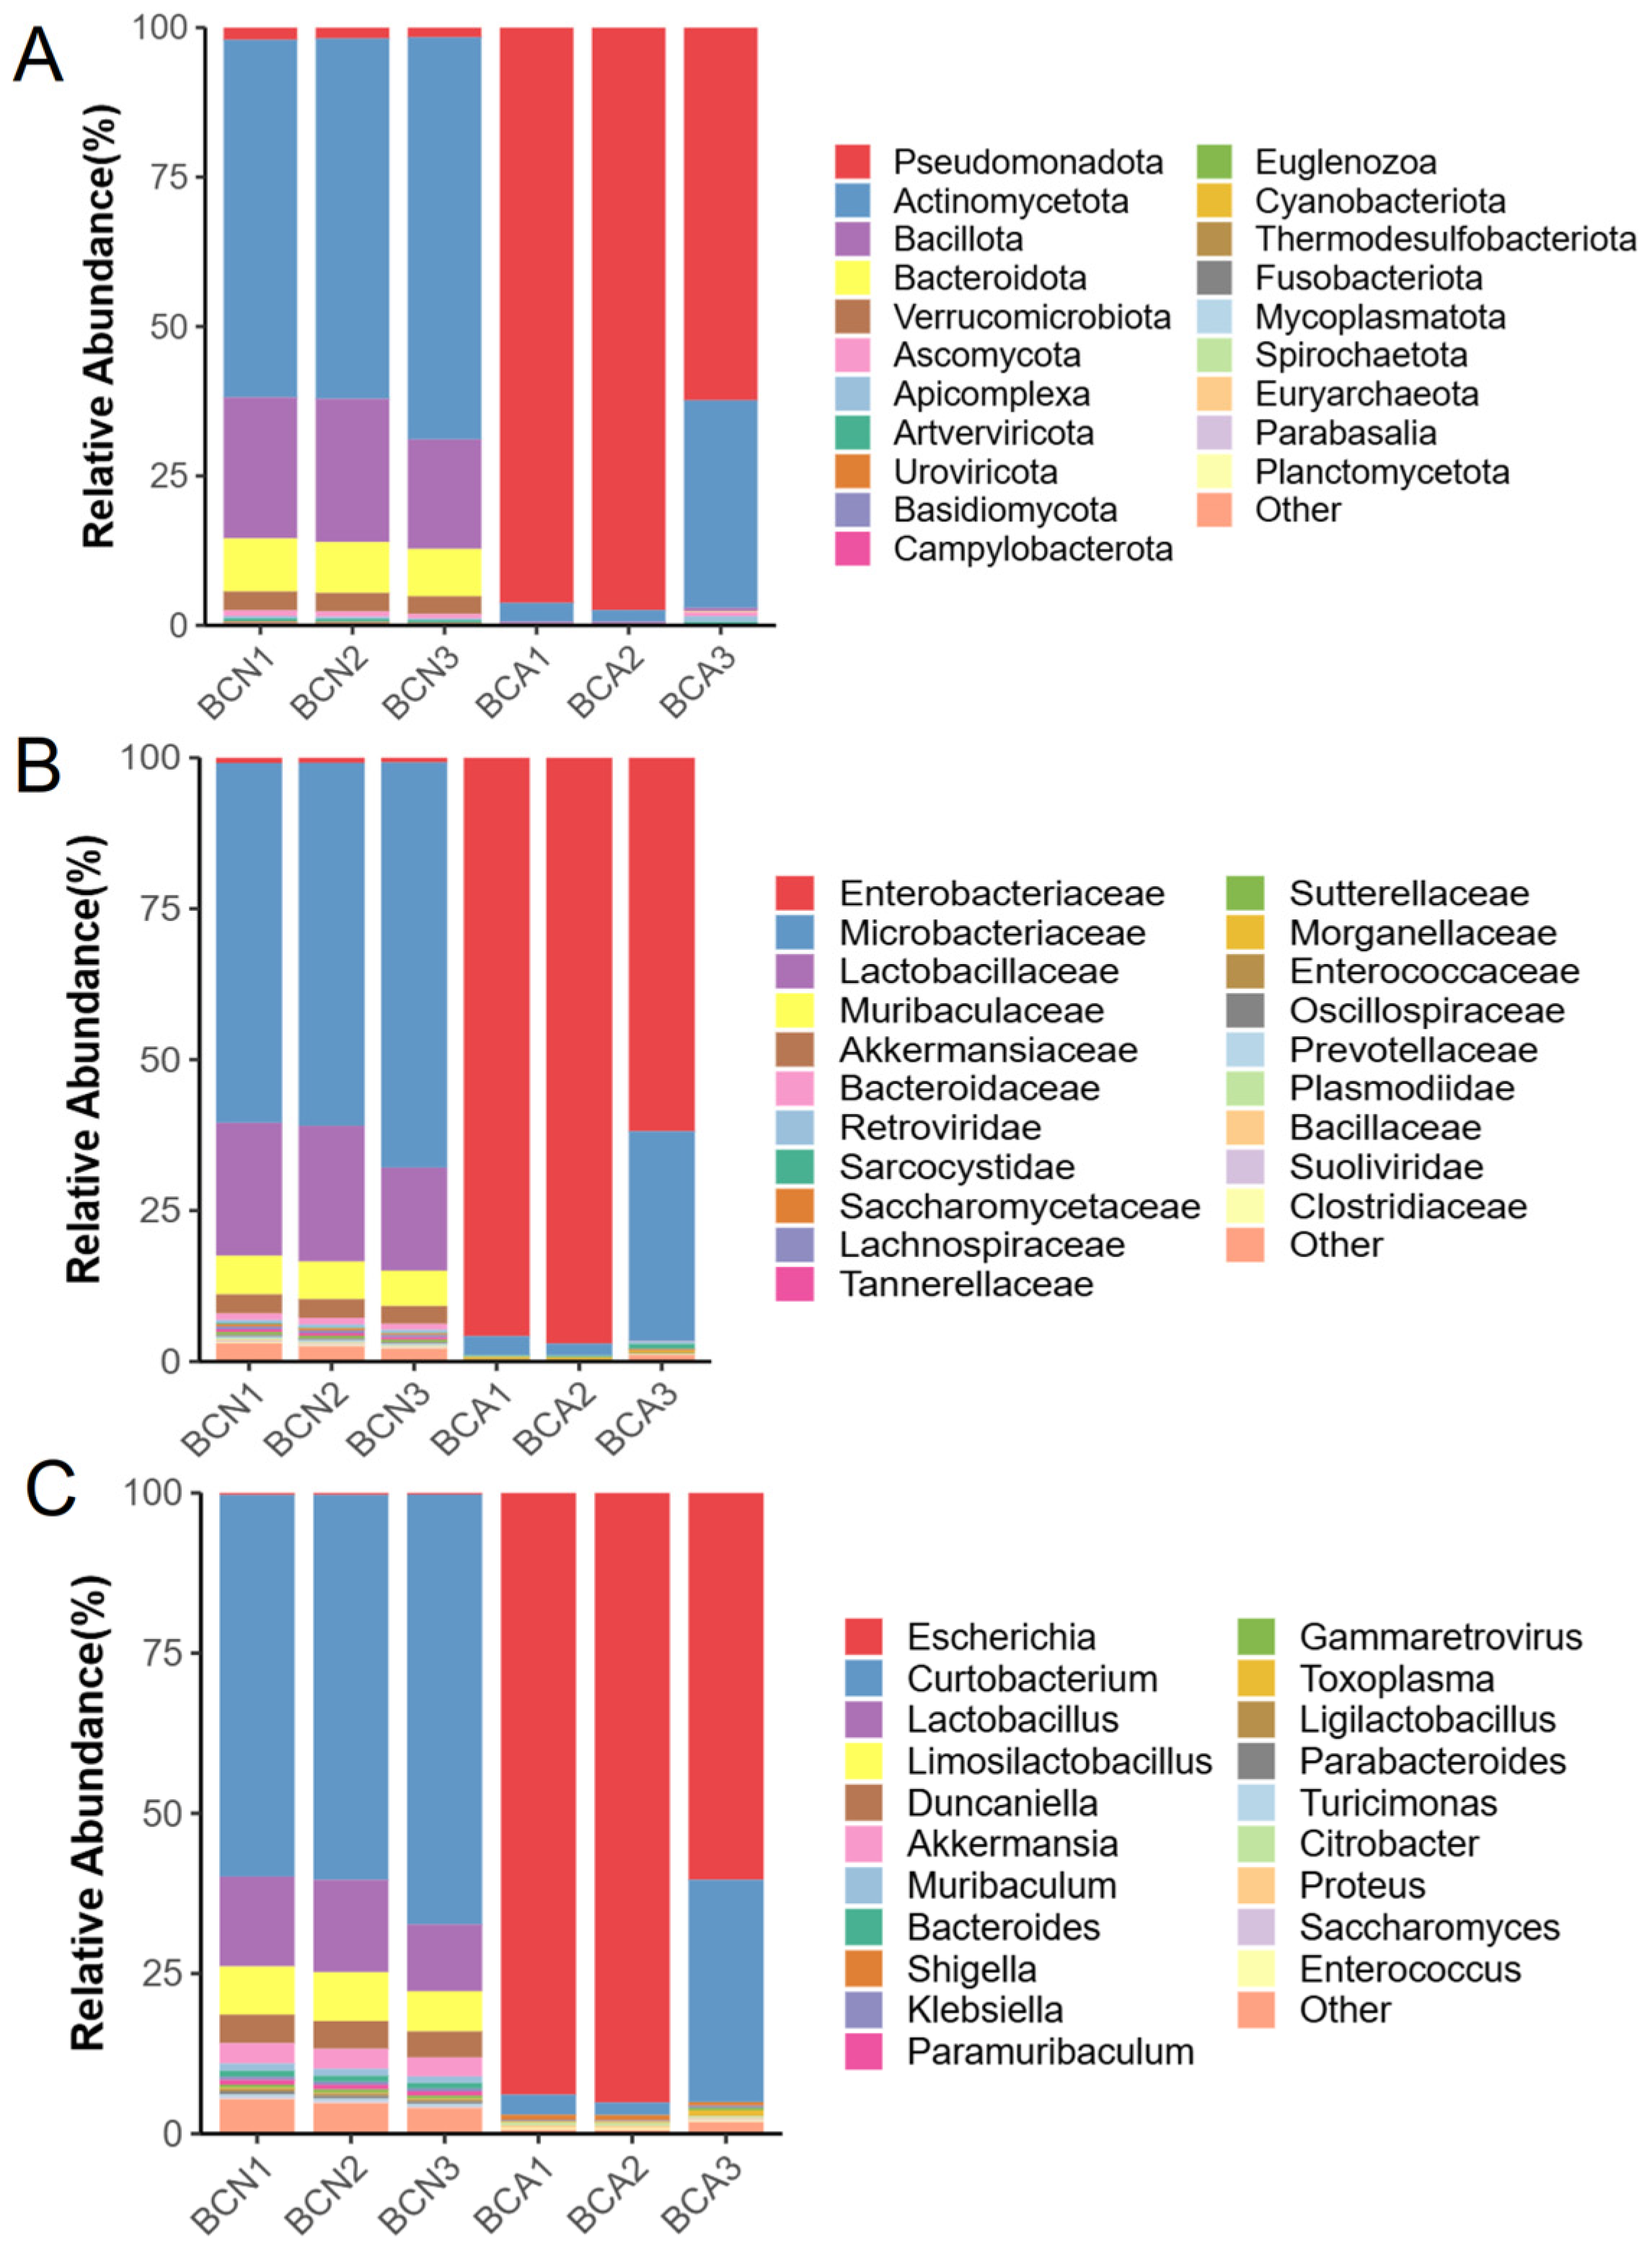
Based on metagenomic data, we systematically compared the composition of gut microbial communities in mice from the BCN and BCA groups at the phylum, family, and genus levels (Figure 2A–C, Table S2). Figure 2A–C show the relative abundance of the phylum, family, and genus levels for each group of overall microbial communities. At the phylum level, the gut microbiota of the control mice (BCN) was dominated by Actinomycetota (62.46%), followed by Bacillota (21.97%) and Bacteroidota (8.43%). The proportions of these phyla decreased significantly in the infected group; in contrast, the Pseudomonadota increased markedly by 83.35% 10 days after infection.
When comparing the microbial communities at the family and genus levels, the control group (BCN) was predominantly composed of Micrococcaceae (62.26%), Lactobacillaceae (20.52%), and Muribaculaceae (6.16%), followed by Akkermansiaceae (3.08%) and Enterobacteriaceae (0.83%). In contrast, 10 days after infection with T. gondii in mice, the abundance of Escherichia species within the Enterobacteriaceae family increased significantly, reaching 84.9%. The relative abundance of Curtobacterium from the Microbacteriaceae family dropped to 13.26%, and the relative abundance of Lactobacillus from the Lactobacillaceae family dropped to 0.04%. At the genus level, the abundance of Shigella and Escherichia increased significantly in the BCA group. These results suggest that acute infection with T. gondii induces notable alterations in the ileal microbial community structure of BALB/c mice.
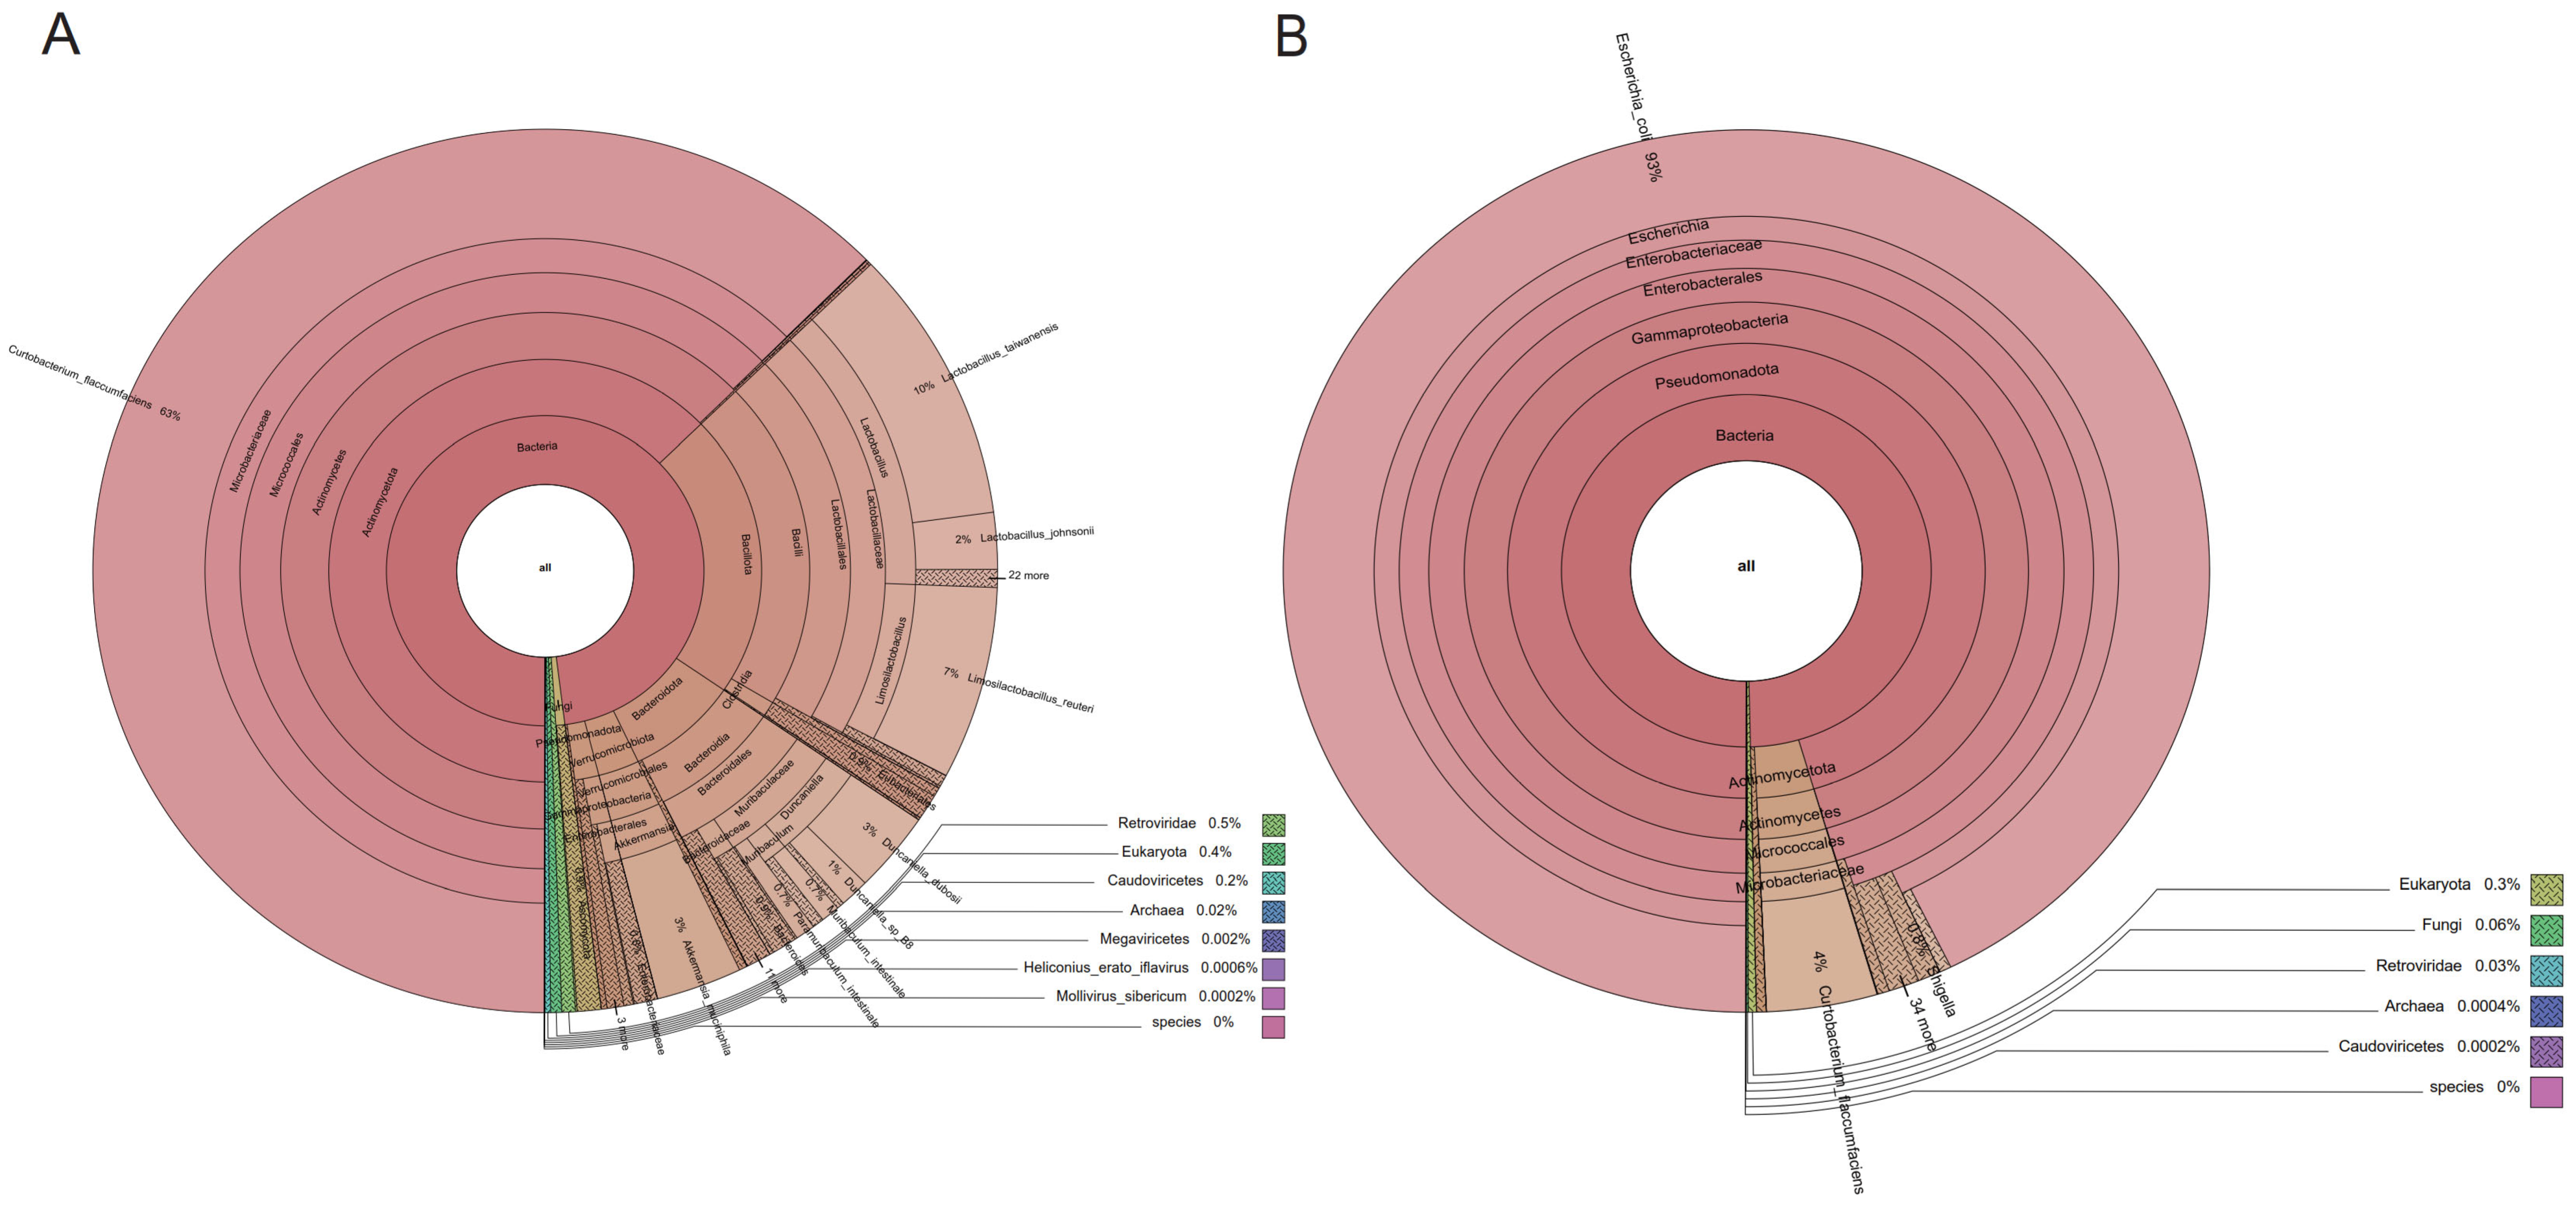
To more intuitively illustrate the composition of the gut microbiota, we constructed a Krona plot for representative samples from each experimental group based on metagenomic sequencing data, thereby visualizing the relative abundance of taxonomic units across all taxonomic levels. The microbiota of the control group exhibited highly diverse taxonomic characteristics, including Bacteroidota and Actinomycetota, as well as various commensal bacterial genera (Figure 3A), with a stable and diverse community structure. In contrast, the microbiota structure of the infected group was highly simplified, with E. coli accounting for the vast majority of reads (Figure 3B). This marked difference reflects the presence of ileal microbial disturbances caused by infection and overgrowth of opportunistic bacteria.
The phylogenetic tree based on LEfSe visualized the significantly enriched taxa in the BCN and BCA groups (Figure 4, Table S3). There was a significant difference in taxonomic composition between the two groups (p < 0.05). The control group (BCN) was predominantly composed of Lactobacillaceae, Muribaculaceae, and Prevotellaceae, as well as several common commensal genera belonging to the phylum Actinobacteria. In contrast, the BCA group exhibited significant enrichment in various Gram-negative opportunistic pathogens, primarily within the family Enterobacteriaceae, including the genera Escherichia and Shigella, as well as other conditionally pathogenic genera classified under the phylum Pseudomonadota.

3.4. Functional Changes in the Gut Microbiome of Infected Mice

To explore the effects of acute T. gondii infection on the functional potential of mouse ileal microorganisms, we functionally annotated the metagenomic data using the KEGG database and identified a total of 4766 KO members, corresponding to 28 major metabolic and regulatory pathways in 6 samples (Table S4). These pathways mainly involve nutrient metabolism, signal transduction, immune-related mechanisms, and microbial environmental adaptation. The first-level functional classification in KEGG indicates that the primary functions of the gut microbiota are predominantly associated with the Metabolism pathway, representing 76.55%. Other notable categories include environmental information processing (9.48%), genetic information processing (6.30%), cellular processes (5.15%), human diseases (2.24%), and organism systems (0.27%). In the secondary KEGG classification, the global and overview maps (41.33%) of the overall metabolic pathways still dominated, followed by carbohydrate metabolism (11.53%), membrane transport (6.38%), amino acid metabolism (4.85%), and energy metabolism (4.09%) (Table S5).
We further screened the 30 most abundant secondary and tertiary KEGG pathways and drew heatmaps (Figure 5, Table S6) to evaluate the systematic differences between BCA and BCN at the microbial functional level. As shown in the heatmap, several metabolic pathways are significantly enriched in the BCA group, including glycolysis/gluconeogenesis, the pentose phosphate pathway, amino sugar and nucleotide sugar metabolism, microbial metabolism in diverse environments, and ABC transporters. At the same time, it was observed that microbial-related signaling systems, such as flagellar assembly, bacterial secretion systems, and biofilm formation in E. coli, were upregulated in the infected group, suggesting that T. gondii infection may induce functional reconstruction by regulating the metabolic capacity of the bacterial flora.
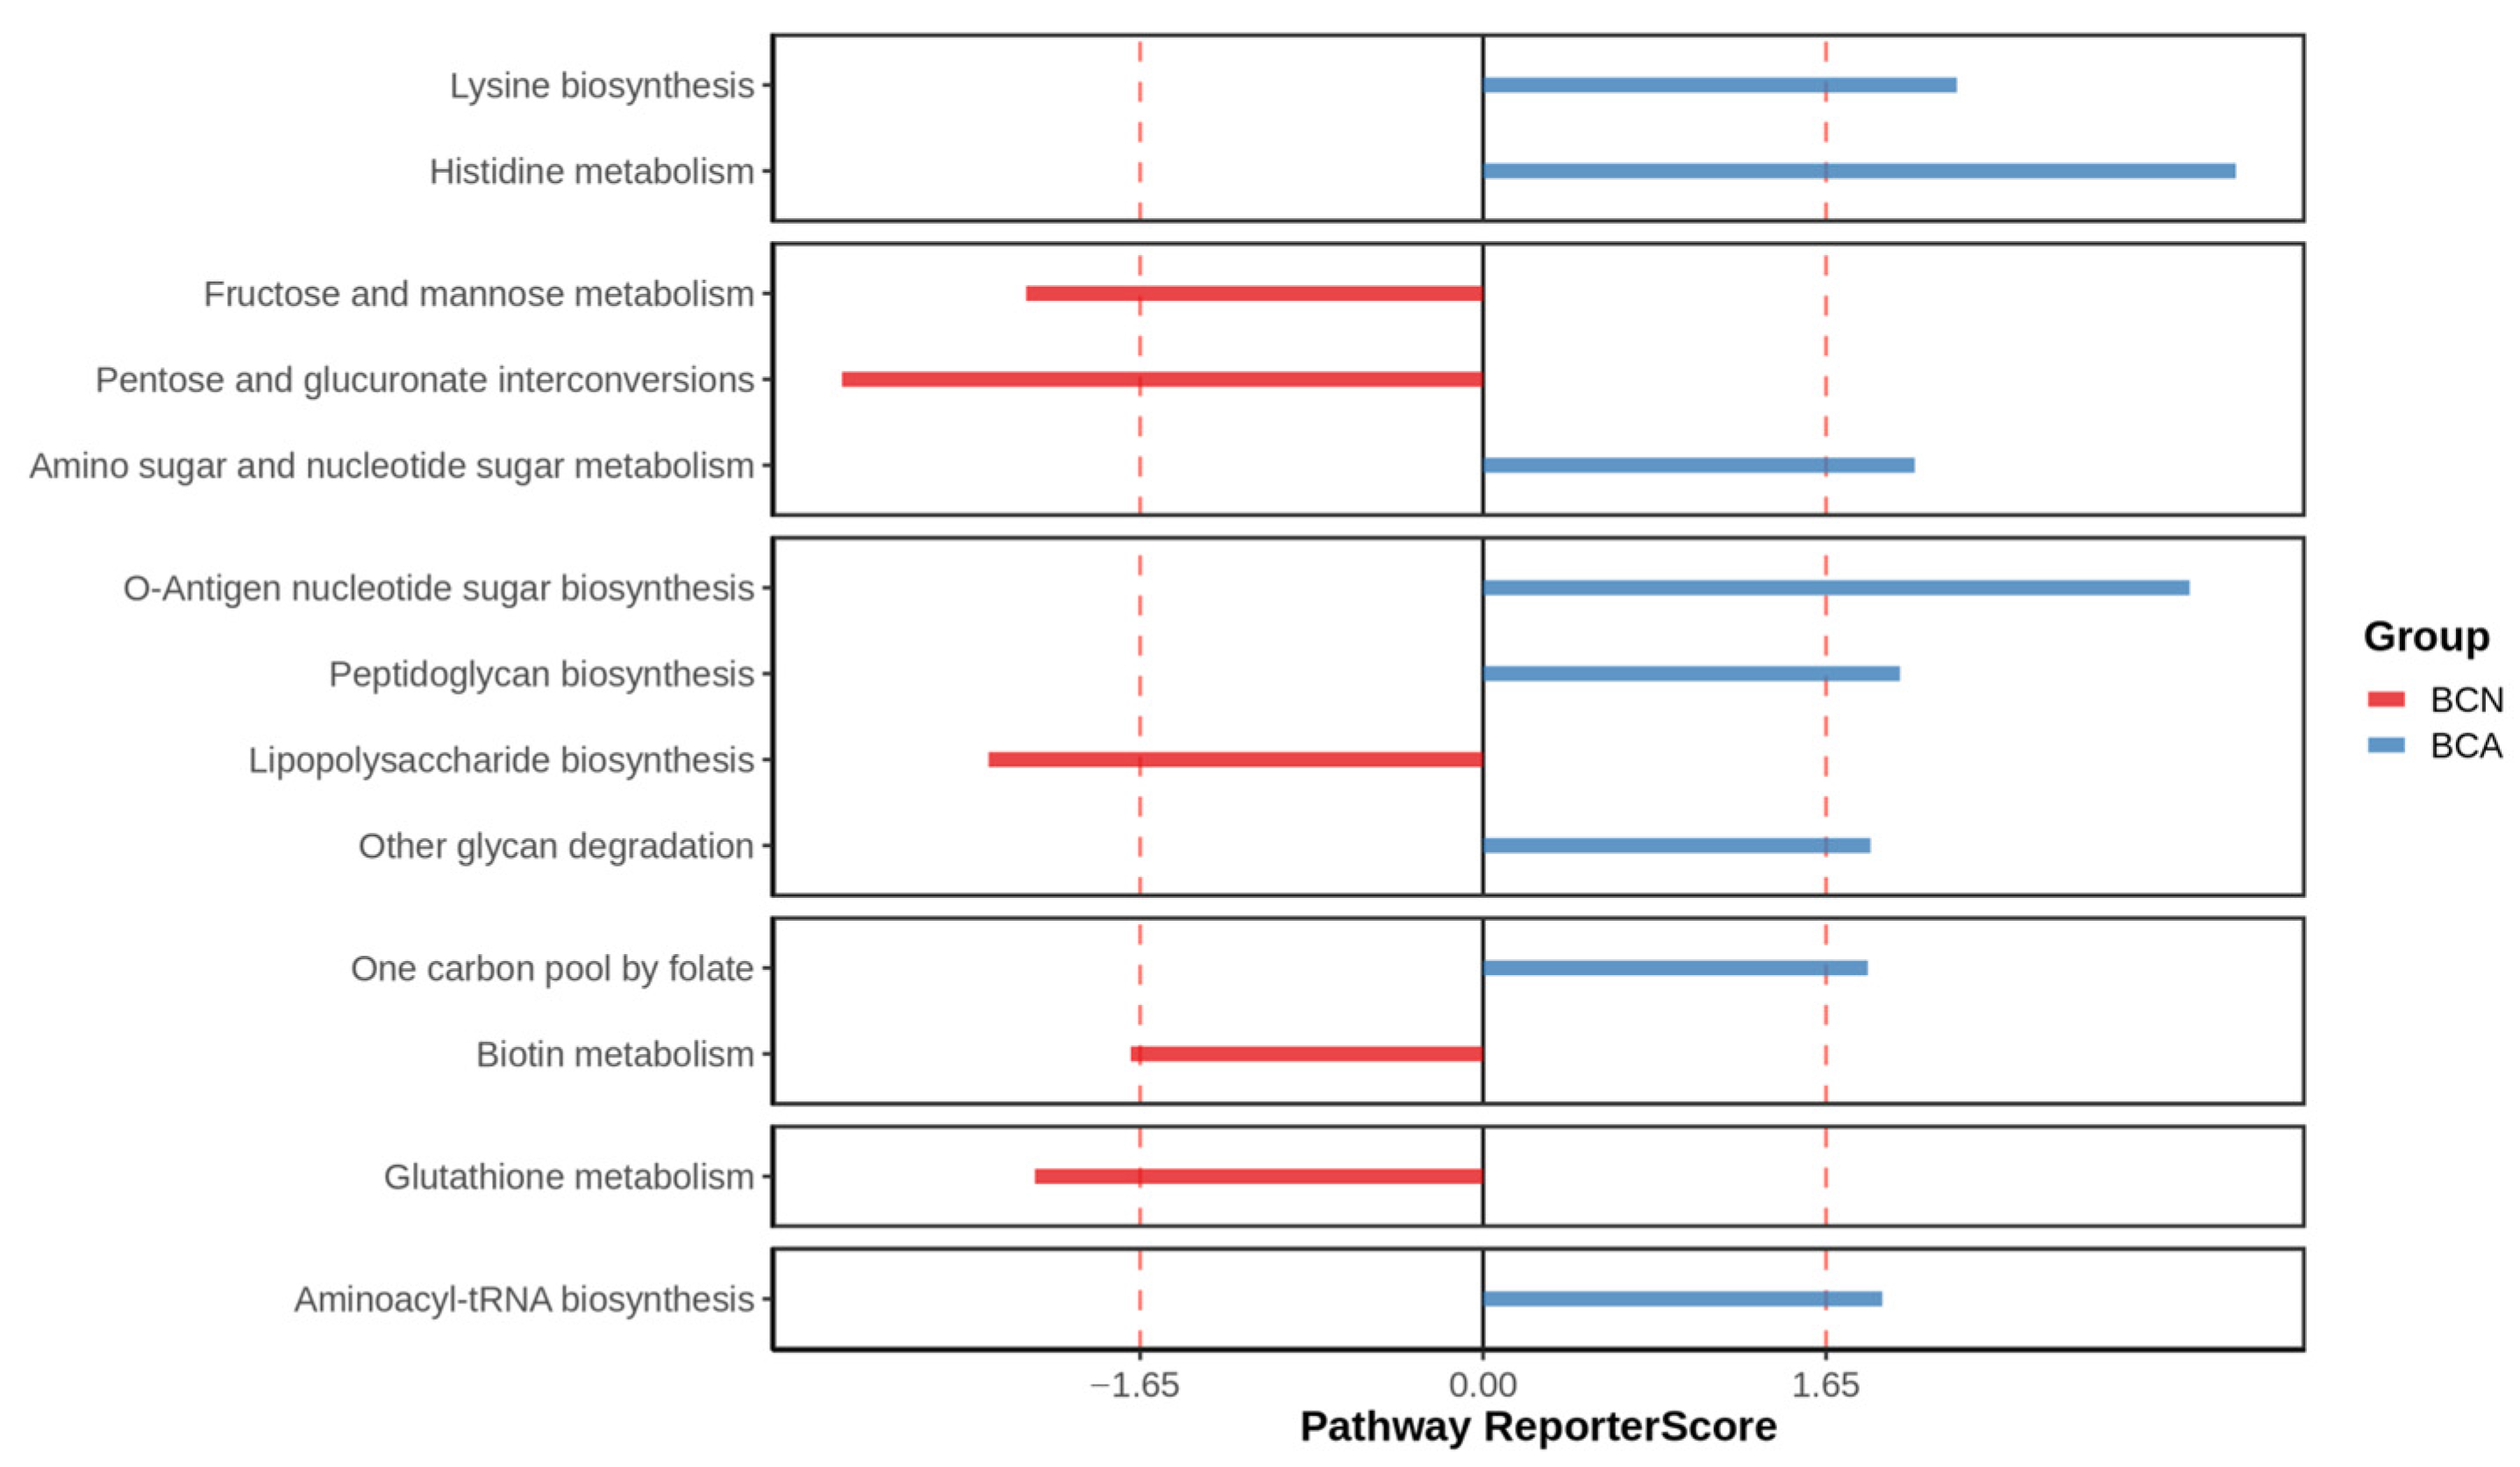
Based on metagenomic sequencing data, reporter score analysis was performed to compare the differences in key functional metabolic pathways between the control group (BCN) and the infected group (BCA; Figure 6). The results showed that the two groups exhibited significantly different functional enrichments in multiple important pathways, suggesting that the infection induced gut microbiota functional profile reconstruction. Significant upregulation of the histidine metabolism and O-Antigen nucleotide sugar biosynthesis pathways was observed in the BCA group. Meanwhile, amino sugar and nucleotide sugar metabolism, as well as phenylalanine, tyrosine, and tryptophan biosynthesis, were also active. In contrast, the BCN group showed significantly suppressed fructose and mannose metabolism, pentose and glucuronate interconversions, lipopolysaccharide (LPS) biosynthesis, bioin metabolism, and glutathione metabolism.
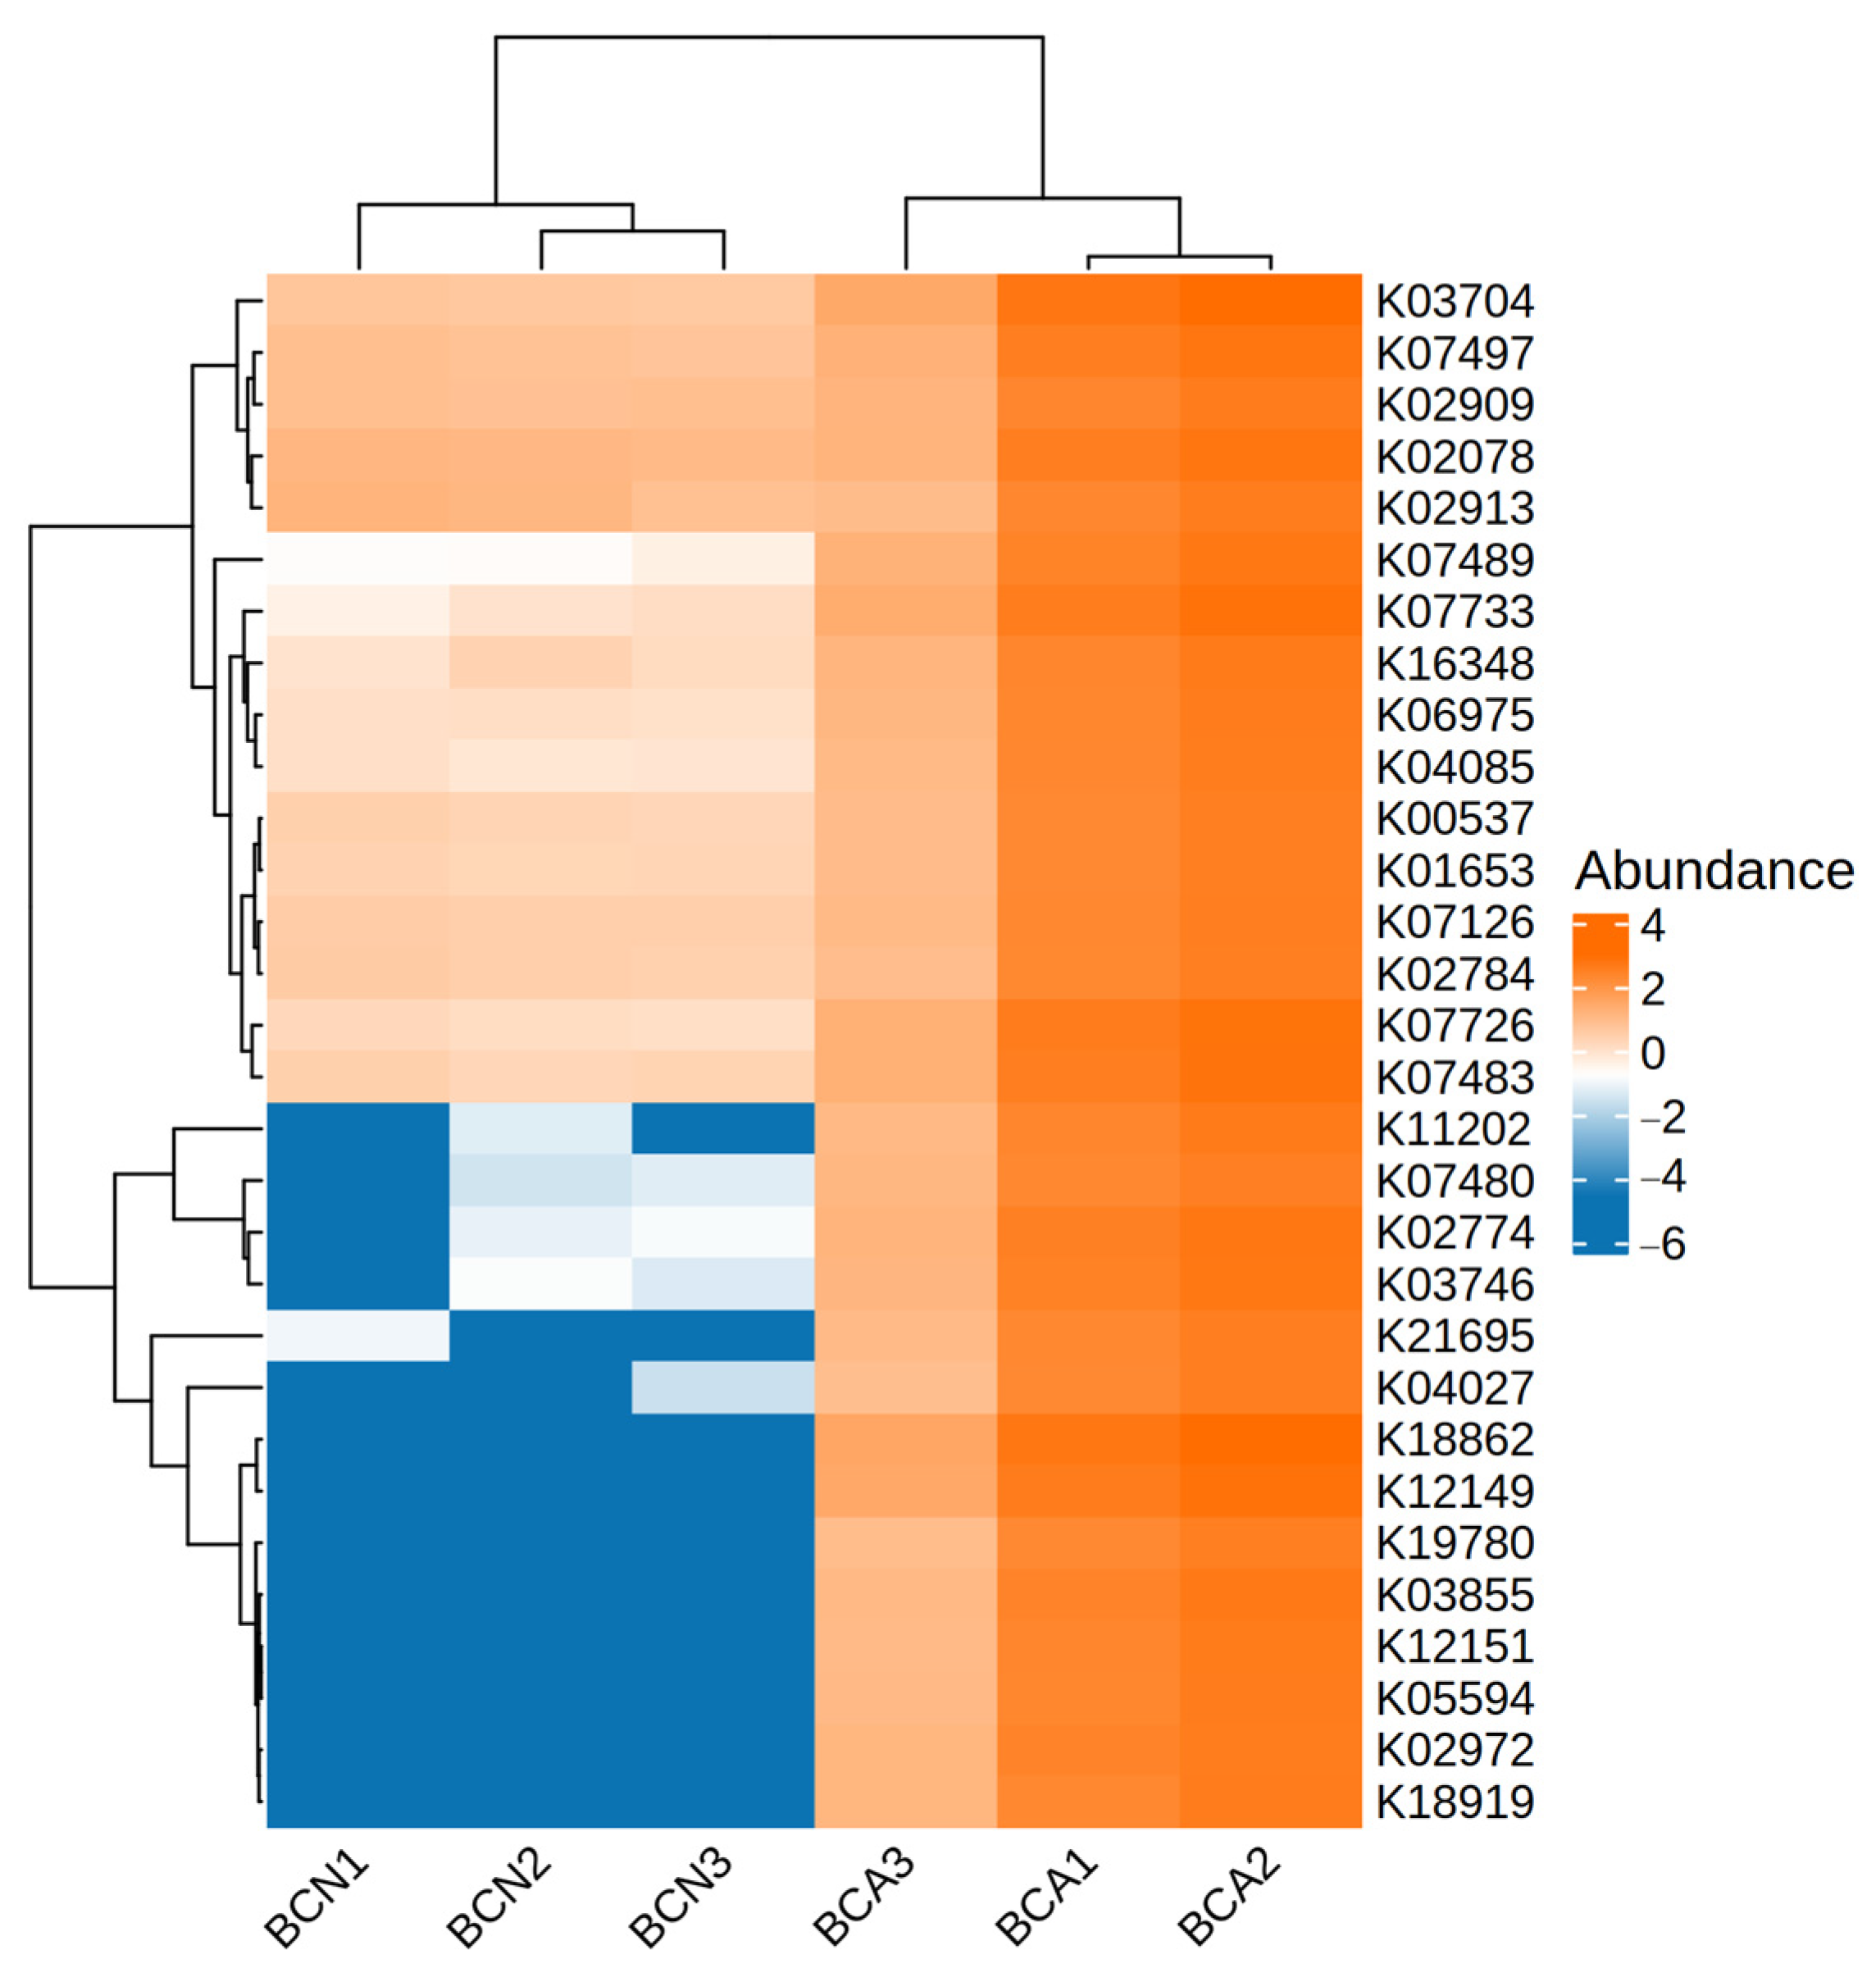
To further verify the effect of acute T. gondii infection on gut microbiota functions and composition, we conducted a cluster analysis of the abundance of functional genes in the gut microbiota of mice in the BCN and BCA groups based on KEGG Orthologs (Figure 7, Table S7). The heatmap shows the differential expression trends of multiple KO pathways closely related to bacterial structure and function in the two groups of samples. The results showed a series of significantly upregulated functional genes in the BCA group, such as K02784, K02078, K02774, and K04085. In contrast, the expression levels of these KO pathways were significantly reduced in the BCN group, and some pathways were even missing, suggesting that their microecosystems are more inclined to a stable symbiotic environment.
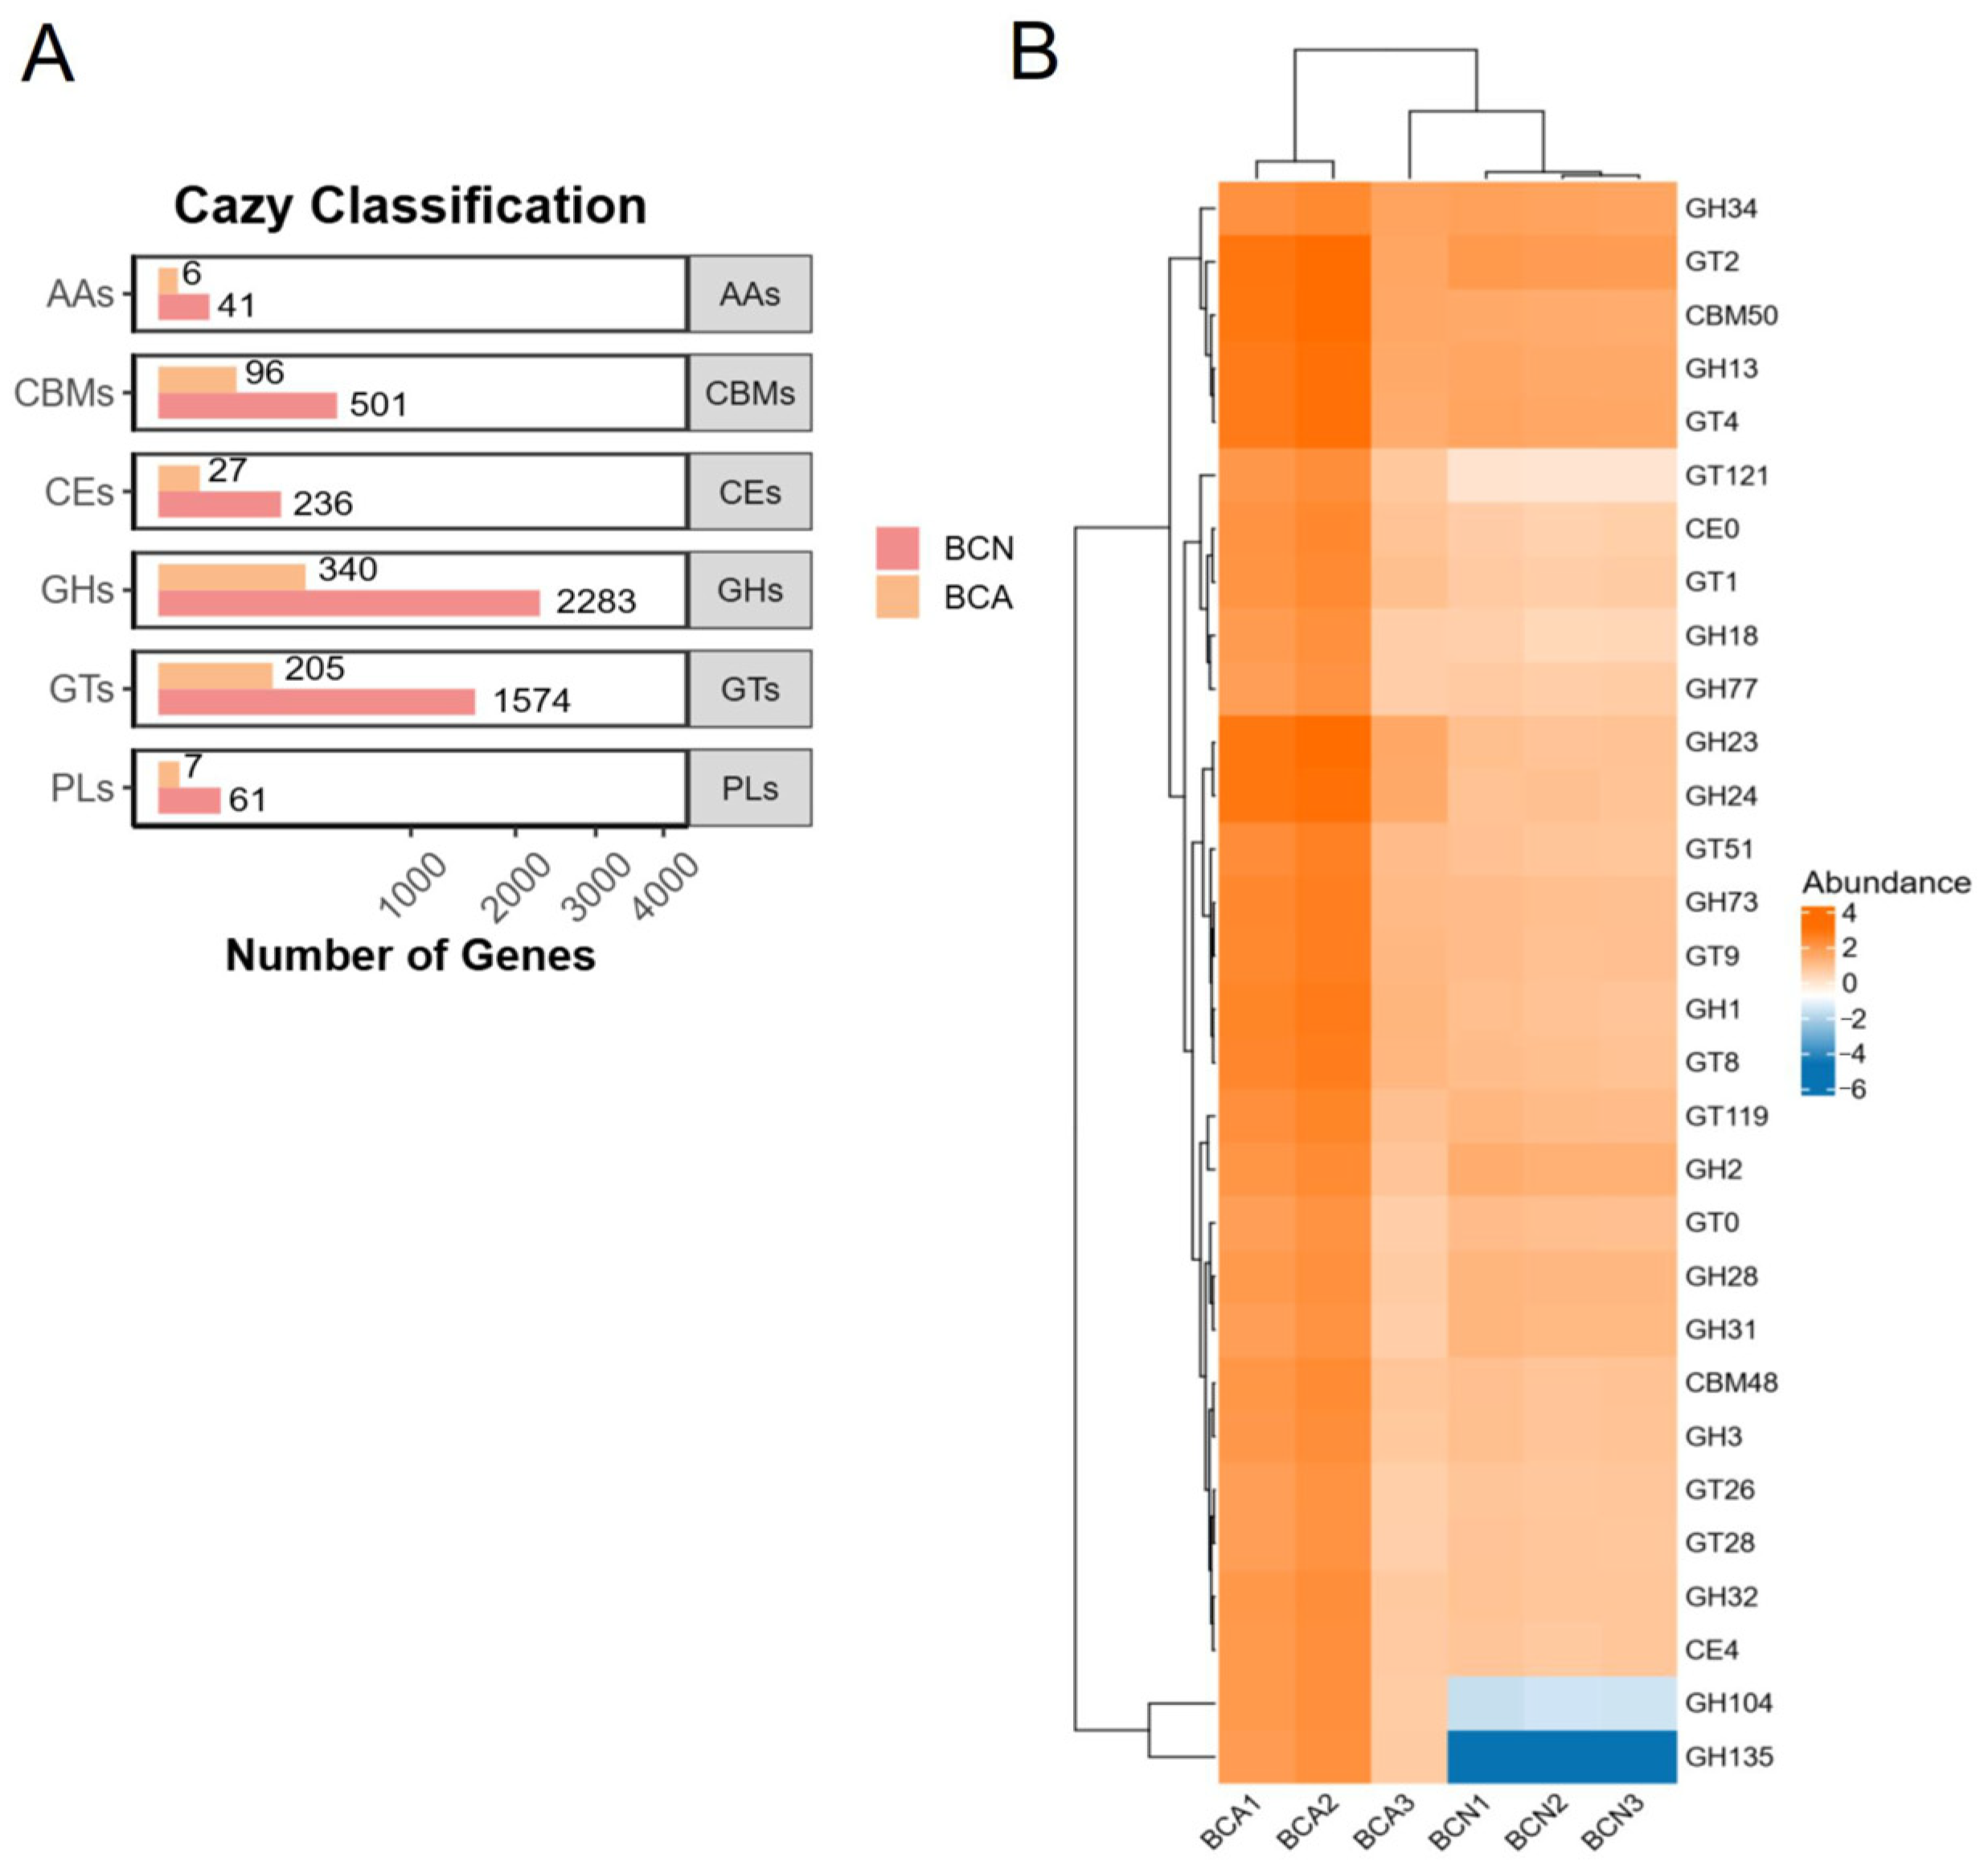
To further analyze the effect of acute T. gondii infection on the carbohydrate metabolic potential of host gut microbiota, an annotation analysis was performed for the BCA and BCN groups on the Carbohydrate-Active enZymes (CAZy) database. As shown in Figure 8A, the number of annotated genes across all six classes of enzymes (GHs, GTs, CBMs, CEs, PLs, and AAs) was significantly higher in the BCN group than in the BCA group. Among them, the difference in glycoside hydrolases (GHs) was the most significant (BCN: 2283 vs. BCA: 340). Similar trends were also observed in glycosyltransferases (GTs; BCN: 1574 vs. BCA: 205), carbohydrate binding modules (CBMs; 501 vs. 96), carboxylesterases (CEs; 236 vs. 27), polysaccharide lyases (PLs; 61 vs. 7), and auxiliary activity enzymes (AAs; 41 vs. 6). In addition, we identified functional pathways that differed significantly between groups before and after T. gondii infection. At the enzyme family level, it manifested as upregulation of glycoside hydrolases (GHs) and glycosyltransferases (GTs), including the significantly upregulated expression in several CAZy families like GH23, GH24, GT4, and GT2 (Figure 8B, Table S8), indicating that T. gondii infection triggered marked restructuring of the CAZy enzyme profile of the gut microbiota.

4. Discussion

Oral ingestion of T. gondii cysts or oocysts constitutes the primary transmission route for toxoplasmosis in humans and animals [24]. Murine models of oral infection consistently demonstrate profound disruption of gut homeostasis, with disease progression closely linked to gut microbiota dynamics [25]. Recent reviews synthesize evidence that acute-phase T. gondii infection remodels gut microbiome composition, notably through decreased Bacillota abundance and increased Bacteroidota [26,27]. While these taxonomic shifts are increasingly documented, the molecular mechanisms governing functional interactions between T. gondii and commensal microbiota remain poorly defined. To address this gap, we characterized gut microbial communities in a murine infection model at peak acute phase (day 10 post-infection), with particular focus on functional metagenomic alterations and associated metabolic pathway dysregulation.
Our results clearly showed that acute T. gondii infection significantly disrupts the gut microbiota composition and function of the host. On day 10 post-infection, the gut microbiota of infected mice showed significantly decreased α diversity (Figure 1A), suggesting reduced microecosystem complexity and stability. PCoA analysis further confirmed that T. gondii infection significantly altered the overall microbial community structure (Figure 1B), consistent with previous findings that parasitic infection induces microbiota remodeling [6,28,29]. In terms of taxonomic structure, the proportion of common commensal bacteria, such as Actinobacteriota, Bacillota, and Bacteroidota, in the infected group was significantly reduced compared to the uninfected control group. In contrast, potential opportunistic pathogens, such as Pseudomonadota, increased greatly, resulting in a severe imbalance in the gut microbiota structure (Figure 2A). Evidence suggests that the relative abundance of Pseudomonadota is related to the ecological imbalance of the gut microbial community in the host with enteritis, making it a potential diagnostic marker [30].
Notably, this study highlights the sensitivity of Actinobacteriota in T. gondii infection. Although previous research mostly focused on the changes in Bacillota, Bacteroidota, and Pseudomonadota after infection [7,11], This study found a significant decrease in Actinobacteriota in the infected group (Figure 2A), suggesting their important role in maintaining gut homeostasis and resisting pathogen invasion, aligned with the results of recent studies focusing on their function in maintaining the gut barrier [31]. Genus-level analysis showed the significant enrichment of multiple opportunistic pathogens under Pseudomonadota in the gut of infected mice. Metagenomic data showed significantly amplified Enterobacteriaceae bacteria in the infected group, especially Escherichia (83.14%), Shigella (0.73%), Citrobacter (0.35%), Proteus (0.33%), Salmonella (0.27%), and a small amount of Pseudomonas (0.01%) (Figure 2B,C). These bacteria typically possess a strong ability to induce inflammation and compromise the mucosal barrier, and their proliferation is often closely linked to microecological dysbiosis and inflammation [32,33].
This study found that the structural changes in microbiota caused by T. gondii infection largely overlap with the characteristics of inflammatory bowel disease (IBD). On the one hand, the rapid E. coli amplification during T. gondii infection and the significant upregulation of LPS-related biosynthetic pathways are known landmark changes in IBD [34]. Multiple studies have reported a decreased ratio of Actinobacteria to Bacteroidetes [35,36,37,38,39] and the abnormal expansion of Enterobacteriaceae [40,41] in IBD patients, which is similar to the microbiota structure changes of the infected group in this study. In addition, LPS can induce the release of pro-inflammatory cytokines such as TNF-α and IL-6 by activating the TLR4 signaling pathway, which destroys the gut epithelial barrier and increases gut permeability, thereby forming a positive inflammatory feedback loop [34,42]. These mechanisms suggest that, in addition to causing gut microbiota imbalance, T. gondii infection also creates a pathological environment similar to IBD through abnormal activation of metabolic pathways. Furthermore, this study found that the ratio of Bacillota to Bacteroidota decreased significantly in the infected group, and this indicator has been widely used to assess gut inflammatory status, especially in IBD and irritable bowel syndrome [43,44]. In addition, Su et al. found that removing the gut commensal microbiota prolonged the survival time of mice infected with T. gondii, whereas the pathological exacerbation of interferon-γ (IFN-γ) on T. gondii induced intestinal pathology depends on the presence of commensal microbiota, further supporting the synergistic pathogenesis among T. gondii, microbiota, and immune system [45]. Based on the above findings, we observed significant enrichment of Enterobacteriaceae in the infected mice (Figure 2, Figure 3 and Figure 4). The high abundance of pathogenic E. coli is consistent with species composition results, which may lead to gut inflammation and dysfunction after T. gondii infection [46].
In terms of functional analysis, the KEGG annotation results showed the enrichment of a large number of metabolic pathways supporting pathogen growth in the infected group, such as the significant upregulation of metabolic pathways, bacterial secretion system, biofilm formation of E. coli, and microbial metabolism in diverse environments (Figure 5), suggesting that T. gondii infection induces broad functional shifts of microbiota functions and metabolism. The Reporter Score analysis results, particularly the significantly upregulated O-Antigen nucleotide sugar biosynthesis pathway, are consistent with the abnormal amplification of Gram-negative bacteria such as E. coli (Figure 6). As the outermost variable structure domain of LPS, O-antigen consists of repeated oligosaccharide units [47], and its synthesis is one of the key steps in LPS synthesis [48,49]. LPS is a potent pro-inflammatory microbial product that stimulates cytokine cascade reactions and caspase activation mediated by Toll-like receptor 4 (TLR4) [50]. In addition to causing local gut inflammation in the host, LPS also crosses the damaged barrier into the circulation, where it interacts with cytokines, leading to systemic inflammation [39,42,51]. The clinical manifestation of gut inflammation after T. gondii infection may be partially attributed to the genes of the large number of LPS that bind to the inflammasome sensors. This study found relatively higher expression levels of multiple KOs, such as K02078 and K02774, in the infected group (BCA), which are genes widely involved in cell wall assembly, LPS synthesis, membrane protein transport, and other bacterial processes (Figure 7). In contrast, the abundance of these genes was generally low in the control group (BCN), and some pathways were even completely missing, suggesting that the microecosystem trends toward stable commensalism and a low inflammatory environment. K02078 encodes LpxC (a deacetylase), which catalyzes the first step of LPS synthesis (UDP-3-O-(R-3-hydroxyacyl)-N-acetylglucosamine deacetylase) [52] and the speed-limiting step of LPS synthesis [53,54]. Lipid A is the hydrophobic core of LPS and is critical to its structure and function. On the other hand, K02774 encodes WaaG, a glycosyltransferase involved in the synthesis of LPS core oligosaccharides [55] and catalyzes the addition of glucose to lipid A core oligosaccharides by UDP-glucose, and its structural diversity affects the immunogenicity of LPS and the pathogenicity of bacteria [56].
In addition, this study also showed enhanced synthetic pathways of phenylalanine, tyrosine, and tryptophan in the acute T. gondii infection group (Figure 6). T. gondii infection limits the availability of tryptophan in the host since it is an essential amino acid of T. gondii [57]. During infection, IFN-γ stimulates the release of indoleamine-pyrrole 2,3-dioxygenase (IDO) from the host cell, resulting in increased tryptophan decomposition [58]. The tryptophan catabolites kynurenic acid and quinolinic acid increase oxidative stress in the brain, destroy cells, and eventually lead to apoptosis [59]. Tryptophan is also a precursor in the synthesis of neurotransmitter serotonin, and its metabolic changes may reflect the utilization of host amino acids by T. gondii or the neurotransmitter metabolism disorders during acute infection. On the other hand, the tryptophan metabolism of gram-negative microbes may produce metabolites that affect pathological and immune responses through the AhR signaling pathway [60]. Dos Santos et al. demonstrated that antibiotic-induced gut microbiota depletion enhances resistance to T. gondii infection, and this depletion protects mice from ileitis caused by T. gondii [61]. The depletion of gram-negative bacteria results in systemic elevation of tryptophan levels but does not affect the activity of IDO in mice, thereby enhancing defense against infection. The depletion of gram-positive bacteria has no such effect. These findings suggest that the gut microbiota regulates host-microbiota interactions during T. gondii infection by regulating the availability of tryptophan.
Several limitations of this study warrant consideration. Firstly, the findings are derived from a murine model of acute oral infection. While this model is valuable for mechanistic insights, the epidemiology, disease progression, and host immune responses to T. gondii differ between mice and humans, limiting direct extrapolation of results. Secondly, the small sample size (n = 3 per group) reduces statistical power and may constrain the generalizability of some observations. Future studies with larger cohorts are needed to confirm these findings. Thirdly, our analysis focused exclusively on the acute phase (day 10 post-infection). The dynamics of gut microbiota dysbiosis and functional alterations during the chronic phase of infection, which is highly relevant to human toxoplasmosis, remain unexplored.
To sum up, we speculate that the metabolic landscape shaped by T. gondii infection involves a precise balance between the parasites’ nutritional resource “competition” with the host and the microbiota and the “defense” of the host and the microbiota to maintain homeostasis. The observed microbiota metabolic alterations may support T. gondii replication and infection establishment by potentially providing substances and energy, while also potentially triggering host defensive responses. Dysregulated gut microbiota may play dual roles in this process. As a metabolic hub, it may nourish the parasite while indirectly participating in host immune regulation. Understanding the pathways of these specific perturbations is crucial for elucidating the pathogenesis of T. gondii. For example, controlling amino acid and energy intake by regulating diet or colonizing beneficial bacteria may provide a strategy for influencing host metabolism, thereby preventing or treating toxoplasmosis. In the case of the CAZy family, studies have shown that the glycosyltransferase families GT2 and GT4 enriched in infected mice are involved in LPS biosynthesis, playing a key role in the synthesis of O-antigen polysaccharides, which appear to be the cause of gut inflammation [49,62].
Collectively, this study provides a detailed characterization of acute gut microbiota dysbiosis and functional reprogramming in a murine model of T. gondii infection. We identified specific taxonomic shifts (e.g., depletion of Actinobacteriota, enrichment of Enterobacteriaceae) and functional alterations (e.g., upregulation of O-antigen biosynthesis, tryptophan pathways) linked to inflammation and barrier disruption. While acknowledging the limitations of the murine model and acute phase focus, these findings offer mechanistic insights into host-microbiota-parasite interactions. The parallels observed between infection-induced dysbiosis and IBD-like features suggest potential shared pathogenic mechanisms involving microbial metabolites (e.g., LPS) and immune activation. Further investigation in human cohorts and chronic infection models is essential to determine the translational relevance of these microbial and metabolic signatures for understanding toxoplasmosis pathogenesis.

5. Conclusions

In summary, this study systematically characterizes acute T. gondii infection-induced gut microbiota dysbiosis in mice, revealing significant microbial ecosystem destabilization through reduced microbial diversity, community restructuring, and impaired metabolic functions. Critically, infection promoted the proliferation of opportunistic pathogens such as Pseudomonas, accompanied by upregulation of metabolic pathways including O-antigen nucleotide sugar biosynthesis and tryptophan biosynthesis. These alterations suggest potential mechanisms through which microbiota dysbiosis may exacerbate host inflammation and disease progression, potentially involving immune activation, gut barrier disruption, and metabolic imbalance. Collectively, our findings advance the understanding of host–microbiota interactions during T. gondii infection and highlight the critical role of microbiota dysbiosis in mediating intestinal inflammation and pathology. This work provides foundational insights into the dynamic regulatory mechanisms of the “gut microbiota–immunity–T. gondii” axis, which may inform future investigations into preventive and therapeutic approaches.

Supplementary Materials

The following supporting information can be downloaded at: https://www.mdpi.com/article/10.3390/microorganisms13092056/s1, Table S1: Summary of metagenomic sequencing quality metrics; Table S2: Differential abundance analysis of the top 30 microbiota between BNA and BCN groups at the phylum, family, genus levels; Table S3: LEfSe analysis of differential microbiota between BCA and BCN groups during the recovery period; Table S4: Predicted KEGG Orthologs (KOs) and their relative abundances in the BCA and BCN groups; Table S5: Number of microbial genes mapped to KEGG pathways at levels 1 and 2 in the BCA and BCN groups; Table S6: KEGG pathways with significant differences at level 2 and 3 between the BCA and BCN groups; Table S7: Cluster analysis of KO-based functional gene abundance in the intestinal microbiota of the BCA and BCN groups; Table S8: CAZy enzyme families with significantly different functional pathway abundances between the BCA and BCN groups.

Author Contributions

Z.L. and F.Z. conceived and designed the study. Z.L., Y.W. and C.D. performed the experiments, analyzed the data, and wrote the manuscript. M.S., P.W. and B.D. participated in the implementation of the study. Z.L. and F.Z. critically revised and edited the manuscript. F.Z. and Z.L. secured the funds. F.Z. and Z.L. supervised the project. All authors have read and agreed to the published version of the manuscript.

Funding

This work was funded by the Yunnan Key Laboratory of Veterinary Etiological Biology (Grant No. 202449CE340019), the NSFC-Yunnan Joint Fund (Grant No. U2202201), the Yunnan Fundamental Research Projects (Grant No. 202401AT070440), and the Scientific Research Fund of Education Department of Yunnan Province (Grant No. 2024Y339).

Institutional Review Board Statement

All mouse experiments were performed strictly following the Guidelines for the Management and Use of Laboratory Animals established by the Animal Research and Resource Center, Yunnan University (CNAS LA0029). The animal protocol and ethics were reviewed and approved by the university’s Institutional Animal Care and Use Committee (Code: No. YNU20241024, 2 February 2024).

Informed Consent Statement

Not applicable.

Data Availability Statement

The metagenomic sequencing data reported in this research have been deposited in the China National Center for Bioinformation (https://www.cncb.ac.cn/, accessed on 12 July 2025, accession number: PRJCA042718).

Conflicts of Interest

The authors declare no conflicts of interest.

Abbreviations

The following abbreviations are used in this manuscript:
DNBSeqDNA Nanoball Sequencing
PE150 Paired-End 150 bp Sequencing
KEGGKyoto Encyclopedia of Genes and Genomes
CAZyCarbohydrate-Active enZymes
KOKEGG Ortholog
LDALinear Discriminant Analysis
LEfSeLinear Discriminant Analysis Effect Size
PCoAPrincipal Coordinates Analysis
NMDSNon-metric Multidimensional Scaling
PERMANOVAPermutational Multivariate Analysis of Variance
LPSLipopolysaccharide
TLR4Toll-Like Receptor 4
IFN-γInterferon gamma
IDOIndoleamine 2,3-dioxygenase
AhRAryl Hydrocarbon Receptor
GHsGlycoside Hydrolases
GTsGlycosylTransferases
CBMsCarbohydrate-Binding Modules
CEsCarboxylesterases
PLsPolysaccharide Lyases
AAsAuxiliary Activityies

References

  1. Dubey, J.P.; Jones, J.L. Toxoplasma gondii infection in humans and animals in the United States. Int. J. Parasitol. 2008, 38, 1257–1278. [Google Scholar] [CrossRef] [PubMed]
  2. Montoya, J.; Liesenfeld, O. Toxoplasmosis. Lancet 2004, 363, 1965–1976. [Google Scholar] [CrossRef]
  3. Israelski, D.M.; Remington, J.S. Toxoplasmic encephalitis in patients with AIDS. Infect. Dis. Clin. N. Am. 1988, 2, 429–446. [Google Scholar] [CrossRef]
  4. Couturier-Maillard, A.; Froux, N.; Piotet-Morin, J.; Michaudel, C.; Brault, L.; Le Bérichel, J.; Sénéchal, A.; Robinet, P.; Chenuet, P.; Jejou, S.; et al. Correction: Interleukin-22-deficiency and microbiota contribute to the exacerbation of Toxoplasma gondii-induced intestinal inflammation. Mucosal Immunol. 2019, 12, 290. [Google Scholar] [CrossRef]
  5. Gay, G.; Braun, L.; Brenier-Pinchart, M.-P.; Vollaire, J.; Josserand, V.; Bertini, R.-L.; Varesano, A.; Touquet, B.; De Bock, P.-J.; Coute, Y.; et al. Toxoplasma gondii TgIST Co-Opts host chromatin repressors dampening STAT1-dependent gene regulation and IFN-γ-mediated host defenses. J. Exp. Med. 2016, 213, 1779–1798. [Google Scholar] [CrossRef]
  6. Chen, J.; Zhang, C.; Yang, Z.; Wu, W.; Zou, W.; Xin, Z.; Zheng, S.; Liu, R.; Yang, L.; Peng, H. Intestinal microbiota imbalance resulted by anti-Toxoplasma gondii immune responses aggravate gut and brain injury. Parasit Vectors 2024, 17, 284. [Google Scholar] [CrossRef] [PubMed]
  7. Meng, J.-X.; Wei, X.-Y.; Guo, H.; Chen, Y.; Wang, W.; Geng, H.-L.; Yang, X.; Jiang, J.; Zhang, X.-X. Metagenomic insights into the composition and function of the gut microbiota of mice infected with Toxoplasma gondii. Front. Immunol. 2023, 14, 1156397. [Google Scholar] [CrossRef] [PubMed]
  8. Hill, D.A.; Hoffmann, C.; Abt, M.C.; Du, Y.; Kobuley, D.; Kirn, T.J.; Bushman, F.D.; Artis, D. Metagenomic analyses reveal antibiotic-induced temporal and spatial changes in intestinal microbiota with associated alterations in immune cell homeostasis. Mucosal Immunol. 2010, 3, 148–158. [Google Scholar] [CrossRef]
  9. Cho, I.; Blaser, M.J. The human microbiome: At the interface of health and disease. Nat. Rev. Genet. 2012, 13, 260–270. [Google Scholar] [CrossRef]
  10. Yang, J.; Liu, S.; Zhao, Q.; Li, X.; Jiang, K. Gut microbiota-related metabolite alpha-linolenic acid mitigates intestinal inflammation induced by oral infection with Toxoplasma gondii. Microbiome 2023, 11, 273. [Google Scholar] [CrossRef]
  11. Shao, D.Y.; Bai, X.; Tong, M.W.; Zhang, Y.Y.; Liu, X.L.; Zhou, Y.H.; Li, C.; Cai, W.; Gao, X.; Liu, M.; et al. Changes to the gut microbiota in mice induced by infection with Toxoplasma gondii. Acta Trop. 2020, 203, 105301. [Google Scholar] [CrossRef]
  12. Chen, Y.; Chen, Y.; Shi, C.; Huang, Z.; Zhang, Y.; Li, S.; Li, Y.; Ye, J.; Yu, C.; Li, Z.; et al. SOAPnuke: A mapReduce acceleration-supported software for integrated quality control and preprocessing of high-throughput sequencing data. GigaScience 2018, 7, gix120. [Google Scholar] [CrossRef]
  13. Li, R.; Yu, C.; Li, Y.; Lam, T.-W.; Yiu, S.-M.; Kristiansen, K.; Wang, J. SOAP2: An improved ultrafast tool for short read alignment. Bioinformatics 2009, 25, 1966–1967. [Google Scholar] [CrossRef] [PubMed]
  14. Li, D.; Liu, C.-M.; Luo, R.; Sadakane, K.; Lam, T.-W. MEGAHIT: An ultra-fast single-node solution for large and complex metagenomics assembly via succinct de bruijn graph. Bioinformatics 2015, 31, 1674–1676. [Google Scholar] [CrossRef] [PubMed]
  15. Zhu, W.; Lomsadze, A.; Borodovsky, M. Ab initio gene identification in metagenomic sequences. Nucleic Acids Res. 2010, 38, e132. [Google Scholar] [CrossRef] [PubMed]
  16. Fu, L.; Niu, B.; Zhu, Z.; Wu, S.; Li, W. CD-HIT: Accelerated for clustering the next-generation sequencing data. Bioinformatics 2012, 28, 3150–3152. [Google Scholar] [CrossRef]
  17. Patro, R.; Duggal, G.; Love, M.I.; Irizarry, R.A.; Kingsford, C. Salmon provides fast and bias-aware quantification of transcript expression. Nat. Methods 2017, 14, 417–419. [Google Scholar] [CrossRef]
  18. Buchfink, B.; Xie, C.; Huson, D.H. Fast and sensitive protein alignment using DIAMOND. Nat. Methods 2015, 12, 59–60. [Google Scholar] [CrossRef]
  19. Wood, D.E.; Lu, J.; Langmead, B. Improved metagenomic analysis with Kraken 2. Genome Biol. 2019, 20, 257. [Google Scholar] [CrossRef]
  20. Segata, N.; Izard, J.; Waldron, L.; Gevers, D.; Miropolsky, L.; Garrett, W.S.; Huttenhower, C. Metagenomic biomarker discovery and explanation. Genome Biol. 2011, 12, R60. [Google Scholar] [CrossRef]
  21. Patil, K.R.; Nielsen, J. Uncovering transcriptional regulation of metabolism by using metabolic network topology. Proc. Natl. Acad. Sci. USA 2005, 102, 2685–2689. [Google Scholar] [CrossRef]
  22. Matsouaka, R.A.; Singhal, A.B.; Betensky, R.A. An optimal wilcoxon-mann-whitney test of mortality and a continuous outcome. Stat. Methods Med. Res. 2018, 27, 2384–2400. [Google Scholar] [CrossRef]
  23. Green, G.H.; Diggle, P.J. On the operational characteristics of the benjamini and hochberg false discovery rate procedure. Stat. Appl. Genet. Mol. Biol. 2007, 6, Article27. [Google Scholar] [CrossRef] [PubMed]
  24. Webster, J.P.; Dubey, J.P. Toxoplasmosis of animals and humans. Parasites Vectors 2010, 3, 112. [Google Scholar] [CrossRef]
  25. Partida-Rodríguez, O.; Serrano-Vázquez, A.; Nieves-Ramírez, M.E.; Moran, P.; Rojas, L.; Portillo, T.; González, E.; Hernández, E.; Finlay, B.B.; Ximenez, C. Human intestinal microbiota: Interaction between parasites and the host immune response. Arch. Med. Res. 2017, 48, 690–700. [Google Scholar] [CrossRef]
  26. Prandovszky, E.; Severance, E.G.; Splan, V.W.; Liu, H.; Xiao, J.; Yolken, R.H. Toxoplasma-induced behavior changes-is microbial dysbiosis the missing link? Front. Cell Infect. Microbiol. 2024, 14, 1415079. [Google Scholar] [CrossRef] [PubMed]
  27. Al-Rashidi, H.S.; El-Wakil, E.S. Parasites and microbiota: Dual interactions and therapeutic perspectives. Microorganisms 2024, 12, 2076. [Google Scholar] [CrossRef] [PubMed]
  28. Wang, S.; El-Fahmawi, A.; Christian, D.A.; Fang, Q.; Radaelli, E.; Chen, L.; Sullivan, M.C.; Misic, A.M.; Ellringer, J.A.; Zhu, X.-Q.; et al. Infection-induced intestinal dysbiosis is mediated by macrophage activation and nitrate production. mBio 2019, 10, e00935–e19. [Google Scholar] [CrossRef]
  29. Heimesaat, M.M.; Bereswill, S.; Fischer, A.; Fuchs, D.; Struck, D.; Niebergall, J.; Jahn, H.-K.; Dunay, I.R.; Moter, A.; Gescher, D.M.; et al. Gram-negative bacteria aggravate murine small intestinal Th1-type immunopathology following oral infection with Toxoplasma gondii. J. Immunol. 2006, 177, 8785–8795. [Google Scholar] [CrossRef]
  30. Walker, A.W.; Sanderson, J.D.; Churcher, C.; Parkes, G.C.; Hudspith, B.N.; Rayment, N.; Brostoff, J.; Parkhill, J.; Dougan, G.; Petrovska, L. High-throughput clone library analysis of the mucosa-associated microbiota reveals dysbiosis and differences between inflamed and non-inflamed regions of the intestine in inflammatory bowel disease. BMC Microbiol. 2011, 11, 7. [Google Scholar] [CrossRef]
  31. Aldars-García, L.; Marin, A.C.; Chaparro, M.; Gisbert, J.P. The interplay between immune system and microbiota in inflammatory bowel disease: A narrative review. Int. J. Mol. Sci. 2021, 22, 3076. [Google Scholar] [CrossRef]
  32. Fingas, F.; Volke, D.; Hassert, R.; Fornefett, J.; Funk, S.; Baums, C.G.; Hoffmann, R. Sensitive and immunogen-specific serological detection of rodentibacter pneumotropicus infections in mice. BMC Microbiol. 2019, 19, 43. [Google Scholar] [CrossRef]
  33. Hoogland, I.C.M.; Houbolt, C.; van Westerloo, D.J.; van Gool, W.A.; van de Beek, D. Systemic inflammation and microglial activation: Systematic review of animal experiments. J. Neuroinflamm. 2015, 12, 114. [Google Scholar] [CrossRef]
  34. Yang, J.-Y.; Kim, M.-S.; Kim, E.; Cheon, J.H.; Lee, Y.-S.; Kim, Y.; Lee, S.-H.; Seo, S.-U.; Shin, S.-H.; Choi, S.S.; et al. Enteric viruses ameliorate gut inflammation via toll-like receptor 3 and toll-like receptor 7-mediated interferon-β production. Immunity 2016, 44, 889–900. [Google Scholar] [CrossRef] [PubMed]
  35. Dicksved, J.; Halfvarson, J.; Rosenquist, M.; Järnerot, G.; Tysk, C.; Apajalahti, J.; Engstrand, L.; Jansson, J.K. Molecular analysis of the gut microbiota of identical twins with Crohn’s disease. ISME J. 2008, 2, 716–727. [Google Scholar] [CrossRef] [PubMed]
  36. Duranti, S.; Gaiani, F.; Mancabelli, L.; Milani, C.; Grandi, A.; Bolchi, A.; Santoni, A.; Lugli, G.A.; Ferrario, C.; Mangifesta, M.; et al. Elucidating the gut microbiome of ulcerative colitis: Bifidobacteria as novel microbial biomarkers. FEMS Microbiol. Ecol. 2016, 92, fiw191. [Google Scholar] [CrossRef] [PubMed]
  37. Sartor, R.B.; Wu, G.D. Roles for intestinal bacteria, viruses, and fungi in pathogenesis of inflammatory bowel diseases and therapeutic approaches. Gastroenterology 2017, 152, 327–339.e4. [Google Scholar] [CrossRef]
  38. Gophna, U.; Sommerfeld, K.; Gophna, S.; Doolittle, W.F.; Veldhuyzen van Zanten, S.J.O. Differences between tissue-associated intestinal microfloras of patients with Crohn’s disease and ulcerative colitis. J. Clin. Microbiol. 2006, 44, 4136–4141. [Google Scholar] [CrossRef]
  39. Candelli, M.; Franza, L.; Pignataro, G.; Ojetti, V.; Covino, M.; Piccioni, A.; Gasbarrini, A.; Franceschi, F. Interaction between lipopolysaccharide and gut microbiota in inflammatory bowel diseases. Int. J. Mol. Sci. 2021, 22, 6242. [Google Scholar] [CrossRef]
  40. Martinez-Medina, M.; Garcia-Gil, L.J. Escherichia coli in chronic inflammatory bowel diseases: An update on adherent invasive Escherichia coli pathogenicity. World J. Gastrointest. Pathophysiol. 2014, 5, 213–227. [Google Scholar] [CrossRef]
  41. Chervy, M.; Barnich, N.; Denizot, J. Adherent-invasive E. coli: Update on the lifestyle of a troublemaker in Crohn’s disease. Int. J. Mol. Sci. 2020, 21, 3734. [Google Scholar] [CrossRef]
  42. Pasternak, B.A.; D’Mello, S.; Jurickova, I.I.; Han, X.; Willson, T.; Flick, L.; Petiniot, L.; Uozumi, N.; Divanovic, S.; Traurnicht, A.; et al. Lipopolysaccharide exposure is linked to activation of the acute phase response and growth failure in pediatric Crohn’s disease and murine colitis. Inflamm. Bowel Dis. 2010, 16, 856–869. [Google Scholar] [CrossRef]
  43. Wei, S.; Bahl, M.I.; Baunwall, S.M.D.; Hvas, C.L.; Licht, T.R. Determining gut microbial dysbiosis: A review of applied indexes for assessment of intestinal microbiota imbalances. Appl. Environ. Microbiol. 2021, 87, e00395–e21. [Google Scholar] [CrossRef] [PubMed]
  44. Duan, R.; Zhu, S.; Wang, B.; Duan, L. Alterations of gut microbiota in patients with irritable bowel syndrome based on 16S rRNA-targeted sequencing: A systematic review. Clin. Transl. Gastroenterol. 2019, 10, e00012. [Google Scholar] [CrossRef] [PubMed]
  45. Su, R.; Yang, Y. Gut commensal bacteria exacerbate toxoplasmosis associated with TgSheepCHn5 (ToxoDB#2) and TgRedpandaCHn1 (ToxoDB#20) through Th1 immune response. Parasitol. Res. 2023, 122, 2795–2806. [Google Scholar] [PubMed]
  46. Karch, H.; Tarr, P.I.; Bielaszewska, M. Enterohaemorrhagic Escherichia coli in human medicine. Int. J. Med. Microbiol. 2005, 295, 405–418. [Google Scholar] [CrossRef]
  47. Ashraf, K.U.; Nygaard, R.; Vickery, O.N.; Erramilli, S.K.; Herrera, C.M.; McConville, T.H.; Petrou, V.I.; Giacometti, S.I.; Dufrisne, M.B.; Nosol, K.; et al. Structural basis of lipopolysaccharide maturation by the O-antigen ligase. Nature 2022, 604, 371–376. [Google Scholar] [CrossRef]
  48. Whitfield, C.; Williams, D.M.; Kelly, S.D. Lipopolysaccharide O-antigens—Bacterial glycans made to measure. J. Biol. Chem. 2020, 295, 10593–10609. [Google Scholar] [CrossRef]
  49. Greenfield, L.K.; Whitfield, C. Synthesis of lipopolysaccharide O-antigens by ABC transporter-dependent pathways. Carbohydr. Res. 2012, 356, 12–24. [Google Scholar] [CrossRef]
  50. An, L.; Wirth, U.; Koch, D.; Schirren, M.; Drefs, M.; Koliogiannis, D.; Nieß, H.; Andrassy, J.; Guba, M.; Bazhin, A.V.; et al. The role of gut-derived lipopolysaccharides and the intestinal barrier in fatty liver diseases. J. Gastrointest. Surg. 2022, 26, 671–683. [Google Scholar] [CrossRef]
  51. Man, S.M. Inflammasomes in the gastrointestinal tract: Infection, cancer and gut microbiota homeostasis. Nat. Rev. Gastroenterol. Hepatol. 2018, 15, 721–737. [Google Scholar] [CrossRef] [PubMed]
  52. Shu, S.; Mi, W. Regulatory Mechanisms of lipopolysaccharide synthesis in Escherichia coli. Nat. Commun. 2022, 13, 4576. [Google Scholar] [CrossRef] [PubMed]
  53. Wieczorek, A.; Sendobra, A.; Maniyeri, A.; Sugalska, M.; Klein, G.; Raina, S. A new factor LapD is required for the regulation of LpxC amounts and lipopolysaccharide trafficking. Int. J. Mol. Sci. 2022, 23, 9706. [Google Scholar] [CrossRef] [PubMed]
  54. Sorensen, P.G.; Lutkenhaus, J.; Young, K.; Eveland, S.S.; Anderson, M.S.; Raetz, C.R.H. Regulation of UDP-3-O-[R-3-Hydroxymyristoyl]-N-Acetylglucosamine deacetylase in Escherichia coli. J. Biol. Chem. 1996, 271, 25898–25905. [Google Scholar] [CrossRef]
  55. Bertani, B.; Ruiz, N. Function and biogenesis of lipopolysaccharides. EcoSal Plus. 2018, 8, 10–1128. [Google Scholar] [CrossRef] [PubMed]
  56. Raetz, C.R.H.; Whitfield, C. Lipopolysaccharide endotoxins. Annu. Rev. Biochem. 2002, 71, 635–700. [Google Scholar] [CrossRef]
  57. Cerávolo, I.P.; Chaves, A.C.; Bonjardim, C.A.; Sibley, D.; Romanha, A.J.; Gazzinelli, R.T. Replication of Toxoplasma gondii, but not trypanosoma cruzi, is regulated in human fibroblasts activated with gamma interferon: Requirement of a functional JAK/STAT pathway. Infect. Immun. 1999, 67, 2233–2240. [Google Scholar] [CrossRef]
  58. Pfefferkorn, E.R. Interferon gamma blocks the growth of Toxoplasma gondii in human fibroblasts by inducing the host cells to degrade tryptophan. Proc. Natl. Acad. Sci. USA 1984, 81, 908–912. [Google Scholar] [CrossRef]
  59. Schwarcz, R.; Bruno, J.P.; Muchowski, P.J.; Wu, H.-Q. Kynurenines in the mammalian brain: When physiology meets pathology. Nat. Rev. Neurosci. 2012, 13, 465–477. [Google Scholar] [CrossRef]
  60. Agus, A.; Planchais, J.; Sokol, H. Gut microbiota regulation of tryptophan metabolism in health and disease. Cell Host Microbe 2018, 23, 716–724. [Google Scholar] [CrossRef]
  61. Dos Santos, L.M.; Commodaro, A.G.; Vasquez, A.R.R.; Kohlhoff, M.; de Paula Guerra, D.A.; Coimbra, R.S.; Martins-Filho, O.A.; Teixeira-Carvalho, A.; Rizzo, L.V.; Vieira, L.Q.; et al. Intestinal microbiota regulates tryptophan metabolism following oral infection with Toxoplasma gondii. Parasite Immunol. 2020, 42, e12720. [Google Scholar] [CrossRef] [PubMed]
  62. Vijay-Kumar, M.; Aitken, J.D.; Carvalho, F.A.; Cullender, T.C.; Mwangi, S.; Srinivasan, S.; Sitaraman, S.V.; Knight, R.; Ley, R.E.; Gewirtz, A.T. Metabolic syndrome and altered gut microbiota in mice lacking toll-like receptor 5. Science 2010, 328, 228–231. [Google Scholar] [CrossRef] [PubMed]
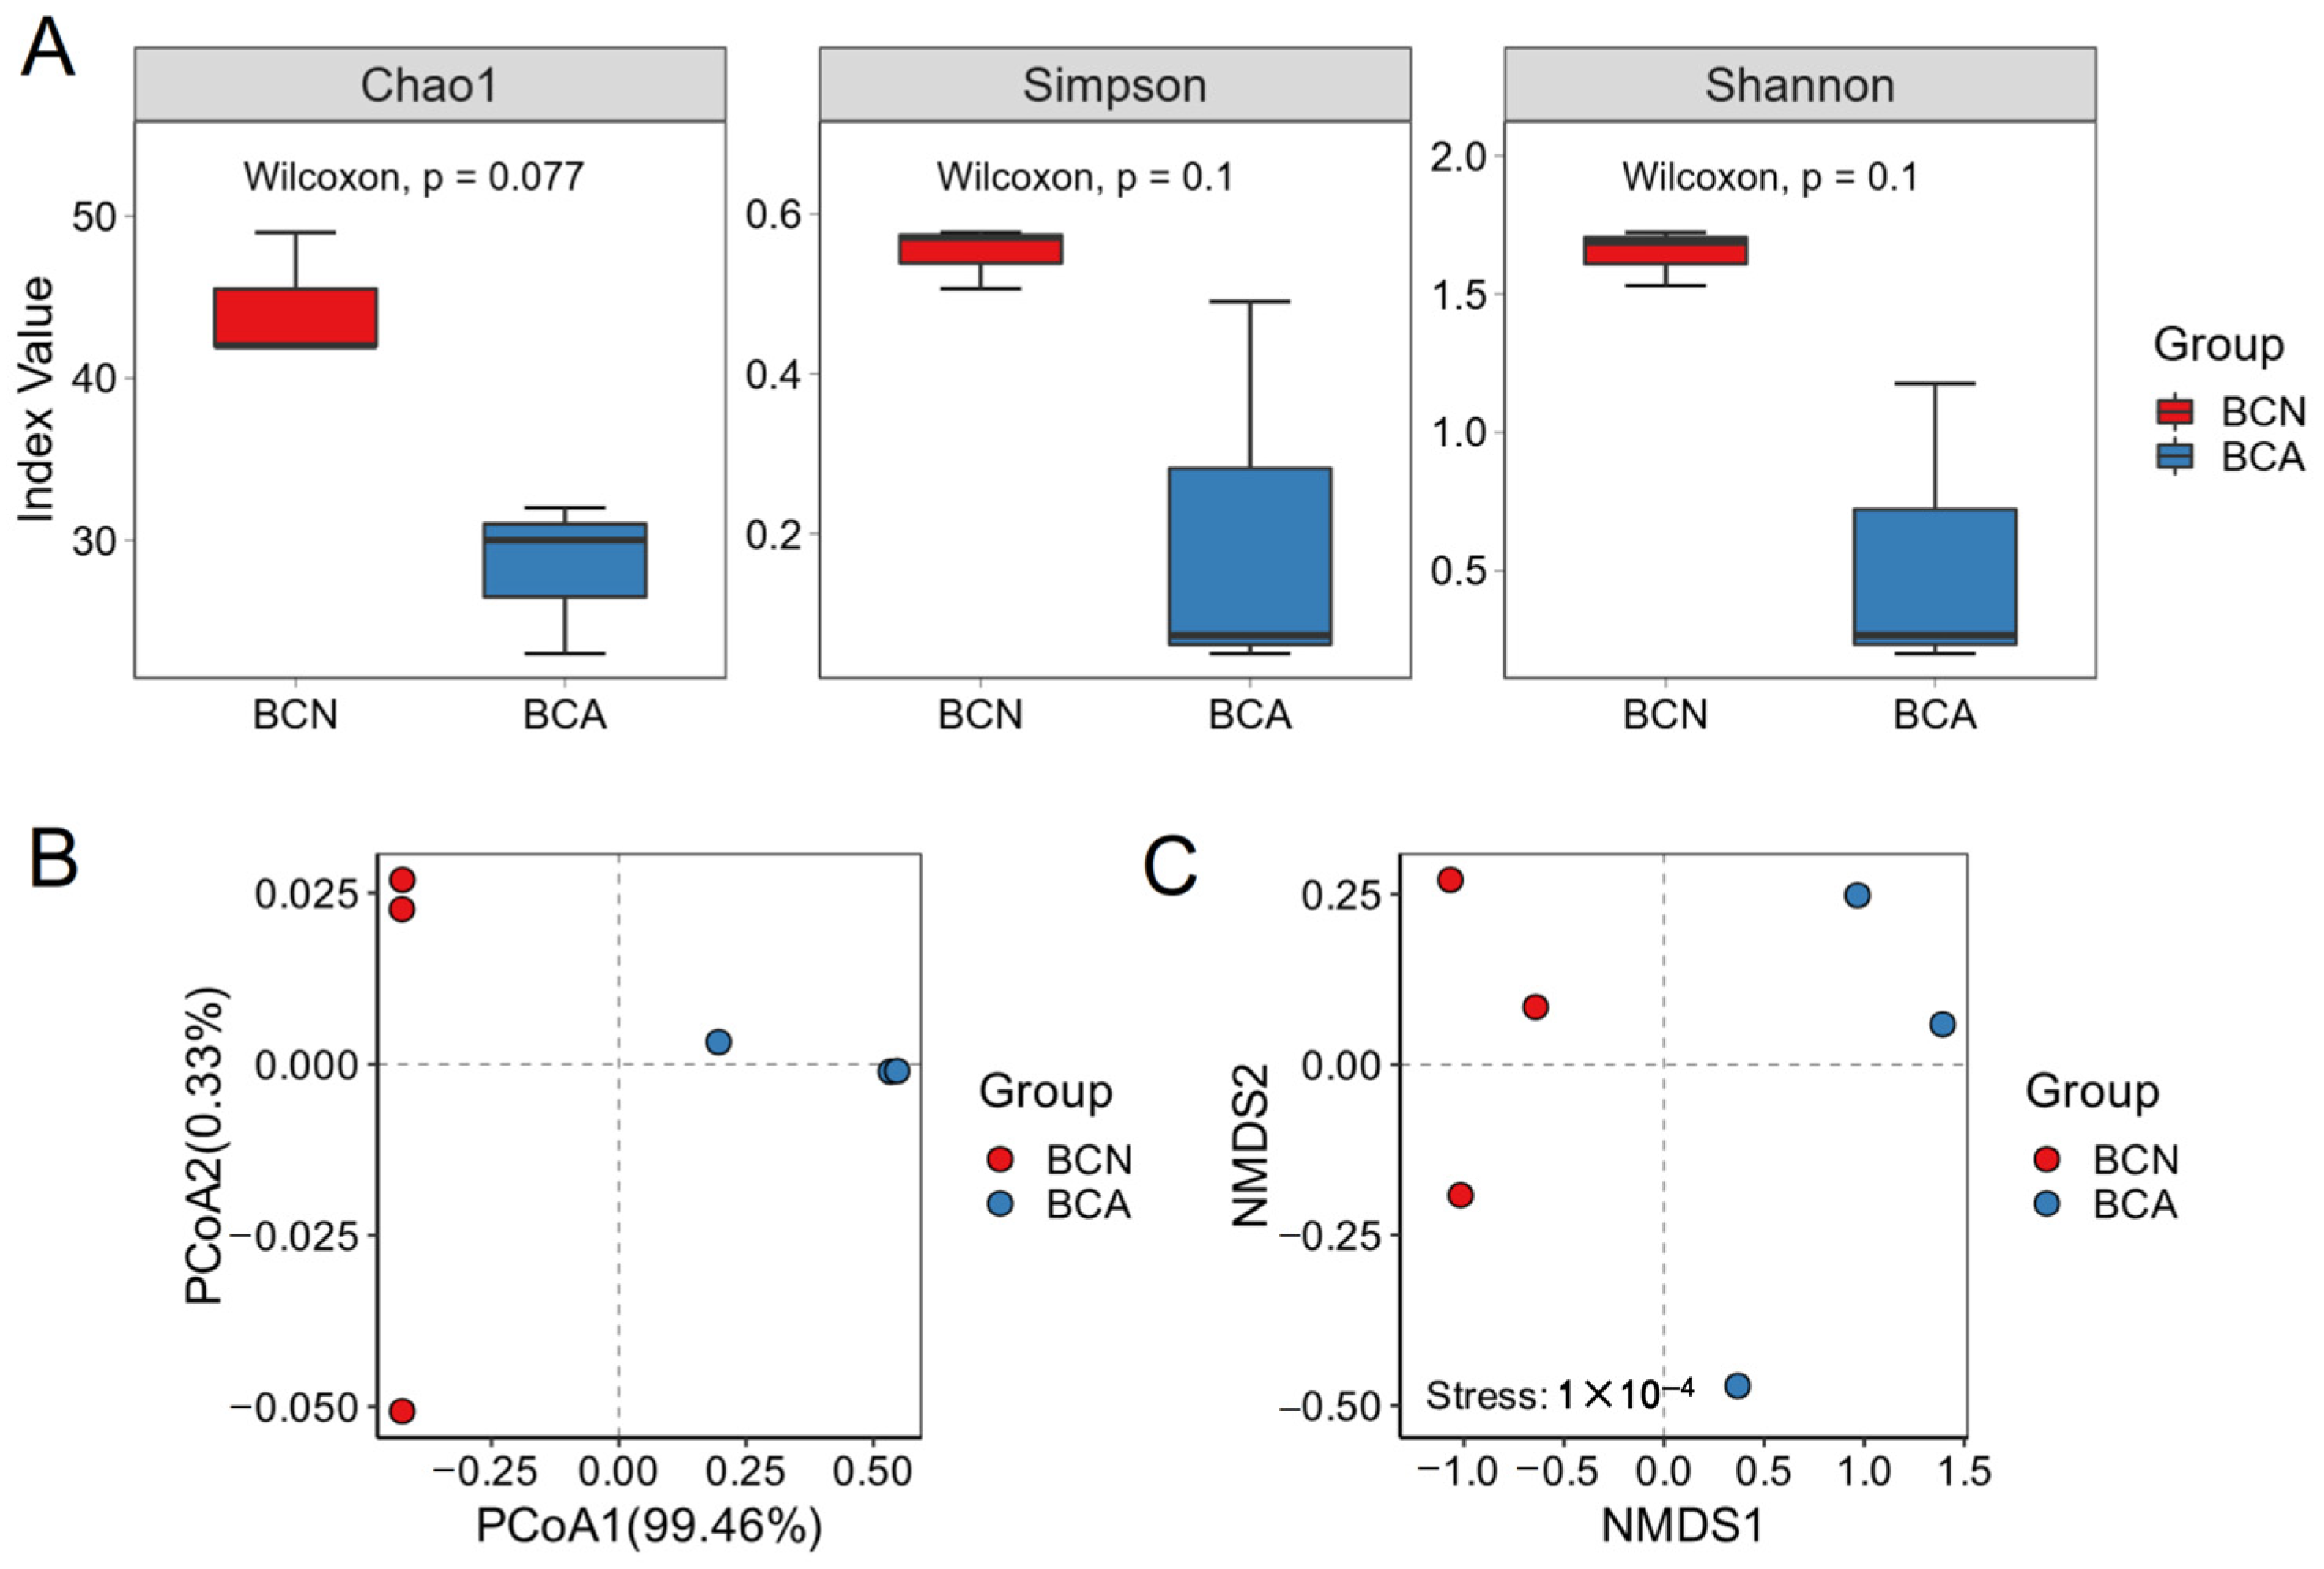
Figure 1. Diversity and composition of the ileal microbiota in mice. (A) Alpha diversity indices, including Chao1, Shannon, and Simpson indices, were used to assess microbial diversity within groups. (B) Principal coordinate analysis (PCoA) based on Bray–Curtis distances reveals distinct clustering between the BCA (acutely infected) and BCN (control) groups. (C) A non-metric multidimensional scaling (NMDS) plot based on Bray–Curtis distances further demonstrates separation between groups (PERMANOVA, p < 0.001). Statistical significance was evaluated using the Wilcoxon rank-sum test. BCN: uninfected control group; BCA: acutely infected group.
Microorganisms 13 02056 g001
Figure 2. Comparison of the relative abundance of the top 20 ileal microbial taxa between groups before and after T. gondii infection. Relative abundance at the phylum (A), family (B), and genus (C) levels in the control (BCN) and acutely infected (BCA) groups. BCN: uninfected control group; BCA: acutely infected group.
Microorganisms 13 02056 g002
Figure 3. Krona plots showing the taxonomic composition of ileal microbiota in representative samples from each group after T. gondii infection. (A) The control group (BCN) exhibited a diverse and balanced community dominated by Bacteroidota, Actinobacteriota, and Bacillota, with multiple symbiotic genera present. (B) In contrast, the infected group (BCA) displayed a reduced diversity, with E. coli emerging as the predominant species.
Microorganisms 13 02056 g003
Figure 4. LEfSe analysis showing taxonomic differences in gut microbiota between control (BCN) and acute-infected (BCA) mice. (A) Cladogram highlighting taxa enriched in the BCN group (red) and the BCA group (green). (B) Linear discriminant analysis (LDA) scores of the differential taxa between groups.
Microorganisms 13 02056 g004
Figure 5. Functional differences in gut microbiota between T. gondii-infected (BCA) and control (BCN) mice based on KEGG annotation. (A) A heatmap of KEGG level 2 pathways reveals differences in the overall functional abundance of gut microbiota between the control group (BCN) and the infected group (BCA). (B) A heatmap of KEGG level 3 pathways highlights enhanced microbial functions in the BCA group, including core metabolism (e.g., glycolysis, pentose phosphate pathway, and amino acid metabolism), signaling systems (e.g., two-component systems and bacterial secretion systems), and biofilm formation.
Microorganisms 13 02056 g005
Figure 6. Functional differences in key metabolic pathways of mouse gut microbiota before and after T. gondii infection. The bar plot displays the functional shifts in 13 major KEGG pathways, with red bars indicating the BCN group and blue bars for the BCA group. A Reporter Score > 1.65 or <−1.65 indicates significant upregulation or downregulation of the corresponding pathway.
Microorganisms 13 02056 g006
Figure 7. Heatmap of differentially abundant KEGG Orthologs (KOs) in gut microbiota between control (BCN) and acute-infected (BCA) mice. The heatmap shows normalized abundance levels of selected KO functional genes across samples. Orange indicates higher abundance, while blue represents lower expression levels. Multiple KO entries, such as K02784, K02078, and K02774, were significantly enriched in the BCA group.
Microorganisms 13 02056 g007
Figure 8. CAZy classification and abundance comparison of gut microbiota carbohydrate-active enzymes between control (BCN) and acute-infected (BCA) mice. (A) Bar graph showing that the number of genes annotated to six CAZy enzyme categories (GHs, GTs, CBMs, CEs, PLs, AAs) is significantly reduced in the BCA group compared to the BCN group, with the most marked decline in glycoside hydrolases (GHs) and glycosyltransferases (GTs). (B) Heatmap showing the abundance distribution of main CAZy families in different samples, with significant upregulations of certain families (e.g., GH23, GH24, GT4, and GT2) in the infected group.
Microorganisms 13 02056 g008
Disclaimer/Publisher’s Note: The statements, opinions and data contained in all publications are solely those of the individual author(s) and contributor(s) and not of MDPI and/or the editor(s). MDPI and/or the editor(s) disclaim responsibility for any injury to people or property resulting from any ideas, methods, instructions or products referred to in the content.