Article

Functional Genomic Characteristics of Marine Sponge-Associated Microbulbifer spongiae MI-GT

1
Marine Biotechnology Laboratory and State Key Laboratory of Microbial Metabolism, School of Life Sciences and Biotechnology, Shanghai Jiao Tong University, Shanghai 200240, China
2
School of Zoology, Faculty of Life Sciences, Tel-Aviv University, Tel-Aviv 6997801, Israel
3
Hainan Research Institute, Shanghai Jiao Tong University, Sanya 572025, China
4
Joint International Research Laboratory of Metabolic & Developmental Sciences, Shanghai Jiao Tong University, Shanghai 200240, China
*
Author to whom correspondence should be addressed.
Microorganisms 2025, 13(8), 1940; https://doi.org/10.3390/microorganisms13081940
Submission received: 28 June 2025 / Revised: 15 August 2025 / Accepted: 17 August 2025 / Published: 20 August 2025
(This article belongs to the Special Issue State-of-the-Art Environmental Microbiology in China 2025)

Abstract

The genus Microbulbifer comprises a group of marine, gram-negative bacteria known for their remarkable ability to adapt to a variety of environments. Therefore, this study aimed to investigate the genetic diversity and metabolic characteristics of M. spongiae MI-GT and three Microbulbifer reference strains by genomic and comparative genomic analysis. Compared to free-living reference strains, the lower GC content, higher number of strain-specific genes, pseudogenes, unique paralogs, dispensable genes, and mobile gene elements (MGEs) such as genomic islands (GIs) and insertion sequence (IS) elements, while the least number of CAZymes, indicates that M. spongiae MI-GT may be a facultative sponge-symbiont. Comparative genomic analysis indicates that M. spongiae MI-GT possesses a plasmid and a higher number of strain-specific genes than Microbulbifer reference strains, showing that M. spongiae MI-GT may have acquired unique genes to adapt sponge-host environment. Moreover, there are differences in the functional distribution of genes belonging to different COG-classes in four Microbulbifer strains. COG-functional analysis reveals a lower number of strain-specific genes associated with metabolism, energy production, and motility in M. spongiae MI-GT compared to Microbulbifer reference strains, suggesting that sponge-associated lifestyle may force this bacterium to acquire nutrients from the sponge host and loss motility genes. Finally, we found that several proteins associated with oxidative stress response (sodC, katA, catA, bcp, trmH, cspA), osmotic stress response (dsbG, ampG, amiD_2, czcA, czcB, and corA), and tolerance to biotoxic metal proteins (dsbG, ampG, amiD_2, czcA, czcB, and corA) are absent in M. spongiae MI-GT but present in Microbulbifer reference strains, indicating that M. spongiae MI-GT live in a stable and less stress environment provided by the sponge host than free-living Microbulbifer strains. Our results suggest M. spongiae MI-GT exhibits gene characteristics related to its adaptation to the sponge host habitat, meanwhile reflecting its evolution towards a sponge-associated lifestyle.

1. Introduction

Sponges (phylum Porifera) are the oldest multicellular animals (metazoans) and are ubiquitous in marine systems [1]. In line with the holobiont concept, sponge-associated microorganisms may contribute to many aspects of the sponge’s physiology and ecology [2,3,4]. For example, sponge-associated bacteria are thought to be essential for host health, nutrition, defence against pathogens, removal of by-products, and synthesis of bioactive compounds [5,6]. Recent studies have suggested that sponge-associated bacteria have the capacity to metabolize carbon (e.g., polysaccharides), sulfur, nitrogen, and possess diverse eukaryotic-like proteins (ELPs). Moreover, Engelberts et al. found that sponge-associated microbes can metabolize carbon, nitrogen, and sulfur, and synthesize essential B-vitamins [7,8,9,10]. Functional capacities of sponge-associated bacteria have been increasingly recognized, but their genomic characteristics remain largely unexplored. Exploration of sponge-associated bacteria offers exciting opportunities for new discoveries and evolution of novel bacterial strains.
The advancement of high-throughput sequencing technologies and comparative genomic approaches has significantly enhanced our understanding of bacterial genomes, genetic diversity, evolution, and functional capabilities [11,12]. Genome analysis also provides an ideal strategy to identify differences between species within the same genus [13,14]. Previous genomic studies reveal that bacterial strains inhabiting different environments possess various genes responsible for drug resistance, heavy metal resistance, and general stress response to survive in fluctuating and challenging environmental conditions [15]. Moreover, bacterial mobile gene elements (MGE), such as plasmids, genomic islands (GIs), insertion sequences (ISs), and CRISPR-Cas systems, are important players in bacterial evolution and contribute to the prevalence of phenomena of horizontal gene transfer (HGT) [16]. Thus, MGEs are pivotal in shaping bacterial genomes through their ability to move within a host’s genome and jump between different bacterial genomes [10,17]. These elements are key drivers of genome evolution through their roles in potentiating gene gain and loss. So, mobilomes profoundly influence bacterial fitness and survival by changing adaptability and facilitating rapid changes in gene content [18]. This change can contribute to the genetic adaptation to new environments and the emergence of divergent bacterial populations that may produce evolutionary distinct species [19].
Microbulbifer is a genus of Gammaproteobacteria that is widespread in aquatic environments. The ubiquitous distribution of Microbulbifer bacteria forces them to evolve specific biological characteristics to adapt to particular habitats [20]. These bacteria also play significant role in the degradation of organic matter and contribute to the cycling of nutrients [21,22,23,24]. For example, M. chitinilyticus, M. harenosus, and M. mangrove can degrade a wide variety of carbohydrates e.g., cellulose, starch, and xylan. Previously, carbohydrate-active enzymes, i.e., GH (glycoside hydrolase), CBM (carbohydrate binding modules), CE (carbohydrate esterase), GT (glycosyltransferase), AA (auxiliary activities), and PL (polysaccharide lyases) were identified in the genome of Microbulbifer sp. ALW1 [22,25,26]. However, genetic knowledge of Microbulbifer strains is fairly limited. Thus, further genome-based studies are required to comprehensively explore the survival mechanism of Microbulbifer group members, particularly how novel Microbulbifer species evolve and survive in their particular habitat.
To date, only a few studies have been conducted to reveal genome plasticity and evolution of sponge-associated bacterial species [18,27], particularly, no systematic functional genomic comparison between closely related sponge-associated bacteria and free-living bacteria has been conducted till now. Therefore, this study aims to provide comprehensive insights into the genomic diversity and metabolic characteristics that may lead to the evolution of the novel bacterial strain Microbulbifer spongiae MI-GT, recently isolated from the sponge Diacarnus erythraeanus [28]. Genomic and comparative genomic analysis of M. spongiae MI-GT with three Microbulbifer reference strains was conducted to identify distinct genomic features such as mobile gene elements, carbohydrate-active enzymes (CAZymes), stress response elements, and host-bacteria metabolic interaction-related features. Finally, the genes of four Microbulbifer strains were functionally classified according to COG-functional classification to reveal overall functional genetic diversity.

2. Materials and Methods

2.1. Sample Collection, Genome Sequencing, and Assembly

Marine sponge Diacarnus erythraeanus was collected from mesophotic reefs, in front of the interuniversity institute for marine sciences in Eliat, Israel (29°30′06.6″ N 34°54′59.9″ E) in December 2020. A small D. erythraeanus subsample (0.2 × 0.2 cm) was sonicated for 2 min in 1 mL 1× PBS buffer solution (KH2PO4 1.76 mM; KCl 2.67 mM; NaCl 136.89 mM; Na2HPO4 8.1 mM) (Sangon Biotech, Shanghai, China). After10-fold serial dilutions, 100 µL samples were spread on ZoBell marine agar plates (AC12065; ACMEC); individual colony was purified by repeated re-streaking after 20 days of incubation. Upon screening of all sponge-associated microbes, a novel M. spongiae MI-GT was cultured and identified using a method previously described [28,29], and stored in 30% (v/v) glycerol suspension at −80 °C.
Genomic DNA of M. spongiae MI-GT was prepared using a TIANamp bacterial genomic DNA extraction kit (Tiangen Biotech, Beijing, China), according to manufacturer’s instructions. DNA concentration was quantified using a Qubit 2.0 Fluorometer (Thermo Fischer Scientific, Waltham, MA, USA). DNA integrity and purity were detected by Agarose Gel Electrophoresis (Concentration of Agarose Gel: 0.5%, Voltage:150 V, Electrophoresis Time: 40 min) (Figure S1). The whole genome sequencing of high-quality genomic DNA of strain MI-GT was performed using a DNBSEQ (BGI) and Nanopore (ONT) platform at the Beijing Genomics Institute (BGI, Shenzhen, China) [28,30]. The methodological details are as follows: 1 ug genomic DNA was fragmented by Covaris. Fragmented genomic DNA was selected using the Agencourt AMPure XP-Medium kit to an average size of 200–400 bp. DNA fragments were end-repaired and then 3′-adenylated. After that, fragments were amplified and formatted into a final library. The library was qualified by quality control assessment (QC). The qualified libraries were sequenced by BGISEQ-500. Raw sequenced data was filtered and trimmed using SOAPnuke v 1.5.6 (Parameter: -l 20 -q 40% -n 10% -d), and Porechop v 0.2.4 with default methods [31,32]. Draft genomic unitigs were assembled using Canu v1.5 with the following parameters: estn = 24, npruseGrid = 0, corOvlMemory = 4 (https://github.com/marbl/canu/releases, accessed on 16 February 2022). After that, GATK (https://gatk.broadinstitute.org/hc/en-us, accessed on 29 January 2022) was used to make single-base corrections to improve the accuracy of the genome sequences [33].

2.2. Genome Annotation and Analysis

Gene prediction was performed on the assembled genome of M. spongiae MI-GT by GeneMarkS-2+ (http://topaz.gatech.edu/GeneMark/genemarks2.cgi) [34]. Barrnap v0.9 [35] was used to find rRNAs, tRNAscan-SE version 1.3.1 [36] was used to predict the area of tRNA and its secondary structure, and Rfam v15.0 (http://rfam.org/) was used to compare with the Rfam database and get sRNAs [37]. Island viewer 4 (https://www.pathogenomics.sfu.ca/islandviewer/) was used for genomic island analysis with Island Pathe-DIOMB, SIGI-HMM, and Island Picker method [38]. Insertion sequence (IS) finder (https://isfinder.biotoul.fr/about.php) was used to identify insertion sequence elements [39]. CRISPRCasFinder (https://crisprcas.i2bc.paris-saclay.fr/CrisprCasFinder/Index) program was used for the detection of CRISPRs and cas-genes [40]. A graphical map of the circular genome was generated using Circos (https://mycircos.iric.ca) [41].
Functional annotation of the genome was accomplished by analysis of protein sequences. Genes were aligned with databases to obtain their corresponding annotations; only the best-hit Blast alignment results were chosen as gene annotations to ensure the biological meanings. Functional annotation was completed by blasting genes with different databases using Diamond (software, v0.8.24) [42]. Seven databases i.e., Kyoto Encyclopedia of Genes and Genomes (KEGG, version 89.1), Clusters of Orthologous Groups (COG, version 2020-11-25), Gene Ontology (GO, release_2-2019_07_01), Non-Redundant Protein Database databases (NR, version 2021_11_17), Swiss-Prot (version, release-2021_04), EggNOG (version 5.0), and TrEMBL were used for gene function annotation [43,44,45,46,47]. Four databases such as Virulence Factors of Pathogenic Bacteria (VFDB, version 2021-11-25), Antibiotic Resistance Genes Database (ARDB, version 1.1), Type III secretion system effector proteins (T3SS, version 1.0), and Carbohydrate-Active enZYmes Database (CAZy, version 2021-10-13) [48,49,50] were used for pathogenicity and drug resistance analysis (Figure S3). We used hmmscan version 3.4 and dbCANv3 (https://bcb.unl.edu/dbCAN2/, accessed on 25 November 2024) web-resource to annotate CAZyme [51].

2.3. Comparative Genomic Analysis

M. spongiae MI-GT genome was compared to the genomes of three Microbulbifer reference strains that were isolated from different marine environments, i.e., M. hydrolyticus IRE31T (marine pulp mill effluent), M. thermotolerance DAU221T (deep-sea sediments), and M. variabilis ATCC700307T (marine algae). Synteny of M. spongiae MI-GT and three Microbulbifer reference strains was performed using MUMmer version 4.0 (http://mummer.sourceforge.net/), and BLAST (https://blast.ncbi.nlm.nih.gov/Blast.cgi) (e-value < = 1 × 10⁻⁵, identity > = 85%) [52]. Core and pan genes of M. spongiae MI-GT and three Microbulbifer reference strains IRE31T, DAU221T, and ATCC700307T were clustered by CD-HIT (software v4.8.1) with a threshold of 50% pairwise identity and 0.7 length difference cutoff in amino acids [53]. BLAST coverage ratio (BCR) of genes from the gene pool and query sample was calculated separately. If BCR values from reference and query samples are smaller than the setting value and the gene from the reference is not homologous with queries, then the gene from the query genome is added to the gene pool. Gene family was constructed by genes of M. spongiae MI-GT and three Microbulbifer reference strains mentioned above, integrating multi software: align the present sequence in BLAST, eliminate the redundancy by solar, and carry out gene family clustering treatment for alignment results with Hcluster_sg software [54]. Then, we convert the alignment results of proteins into those of multiple sequence amino acids in the CDS area, after multiple sequence alignments with clustered gene families by using Muscle software version 3.8.31 [55]. Phylogenomic analysis was performed by uploading genome sequence data of M. spongiae MI-GT and other closely related Microbulbifer strains to the Type Strain Genome Server (https://tygs.dsmz.de/) [56]. Single-copy orthologous cluster protein sequences were extracted by Proteinortho (Software, v6.3.4), and a neighbor-joining (NJ) phylogenetic tree was constructed from these sequences by using MEGA version 11.0 [57]. Figure S2. illustrates the workflow that outlines the step-by-step process for functionally characterizing a sponge-associated novel bacterial strain.

3. Results

3.1. Genome Features of Microbulbifer Spongiae MI-GT and Three Microbulbifer Reference Strains

The complete genome of M. spongiae MI-GT (sponge holobiont) is composed of a single circular chromosome of 4,434,601 bp with 53.5% GC content, and a single circular plasmid of 43,523 bp with 52% GC content, respectively (Figure 1; Table 1). M. spongiae MI-GT genome coverage is 267x, with 100% completeness and 0.56% contamination. The complete genome of three Microbulbifer reference strains, M. hydrolyticus IRE31T (marine pulp mill effluent), M. thermotolerance DAU221T (deep-sea sediments), and M. variabilis ATCC700307T (marine algae) is composed of a single chromosome of 4,209,307 (bp), 3,938,396 (bp), and 4,855,835 (bp), respectively, without any plasmid.
Genome of M. spongiae MI-GT contains a total of 4433 protein-coding sequences covering 83.36% of the genome with an average length of 842 bp. Whereas, genomes of Microbulbifer reference strains IRE31T, DAU221T, and ATCC700307T contain 3549, 3273, and 4253 protein-coding sequences. 50 tRNAs, 12 sRNAs, 4 ncRNAs, and 4 rRNAs (5S_rRNA, 16S_rRNA, and 23S_rRNA each) were also identified in the genome of M. spongiae MI-GT. Whereas, 66, 48, and 59 tRNAs, and 4 rRNAs (5S_rRNA, 16S_rRNA, and 23S_rRNA each), 3(5S_rRNA, 16S_rRNA, and 23S_rRNA each), and 5 (5S_rRNA, 16S_rRNA, and 23S_rRNA each), were identified in the genome of three Microbulbifer reference strains IRE31T, DAU221T, and ATCC700307T.
The proportion of functional annotation of predicted coding sequences in different databases varies, as presented in Figure S3. Functional analyses of COGs, KEGGs, and GOs in the genome of four Microbulbifer strains showed that there are major differences in the functional categories associated with metabolism, cellular, and information in COG-functional classification (Figure S4). In addition, there are also differences in the functional categories associated with metabolism, cellular process, and environmental information processing in KEGG-functional annotation (Figure S5). GO-functional annotation also reveals differences in functional categories associated with biological process and molecular process only (Figure S6).

3.2. Mobile Gene Elements in Genomes of Four Microbulbifer Strains

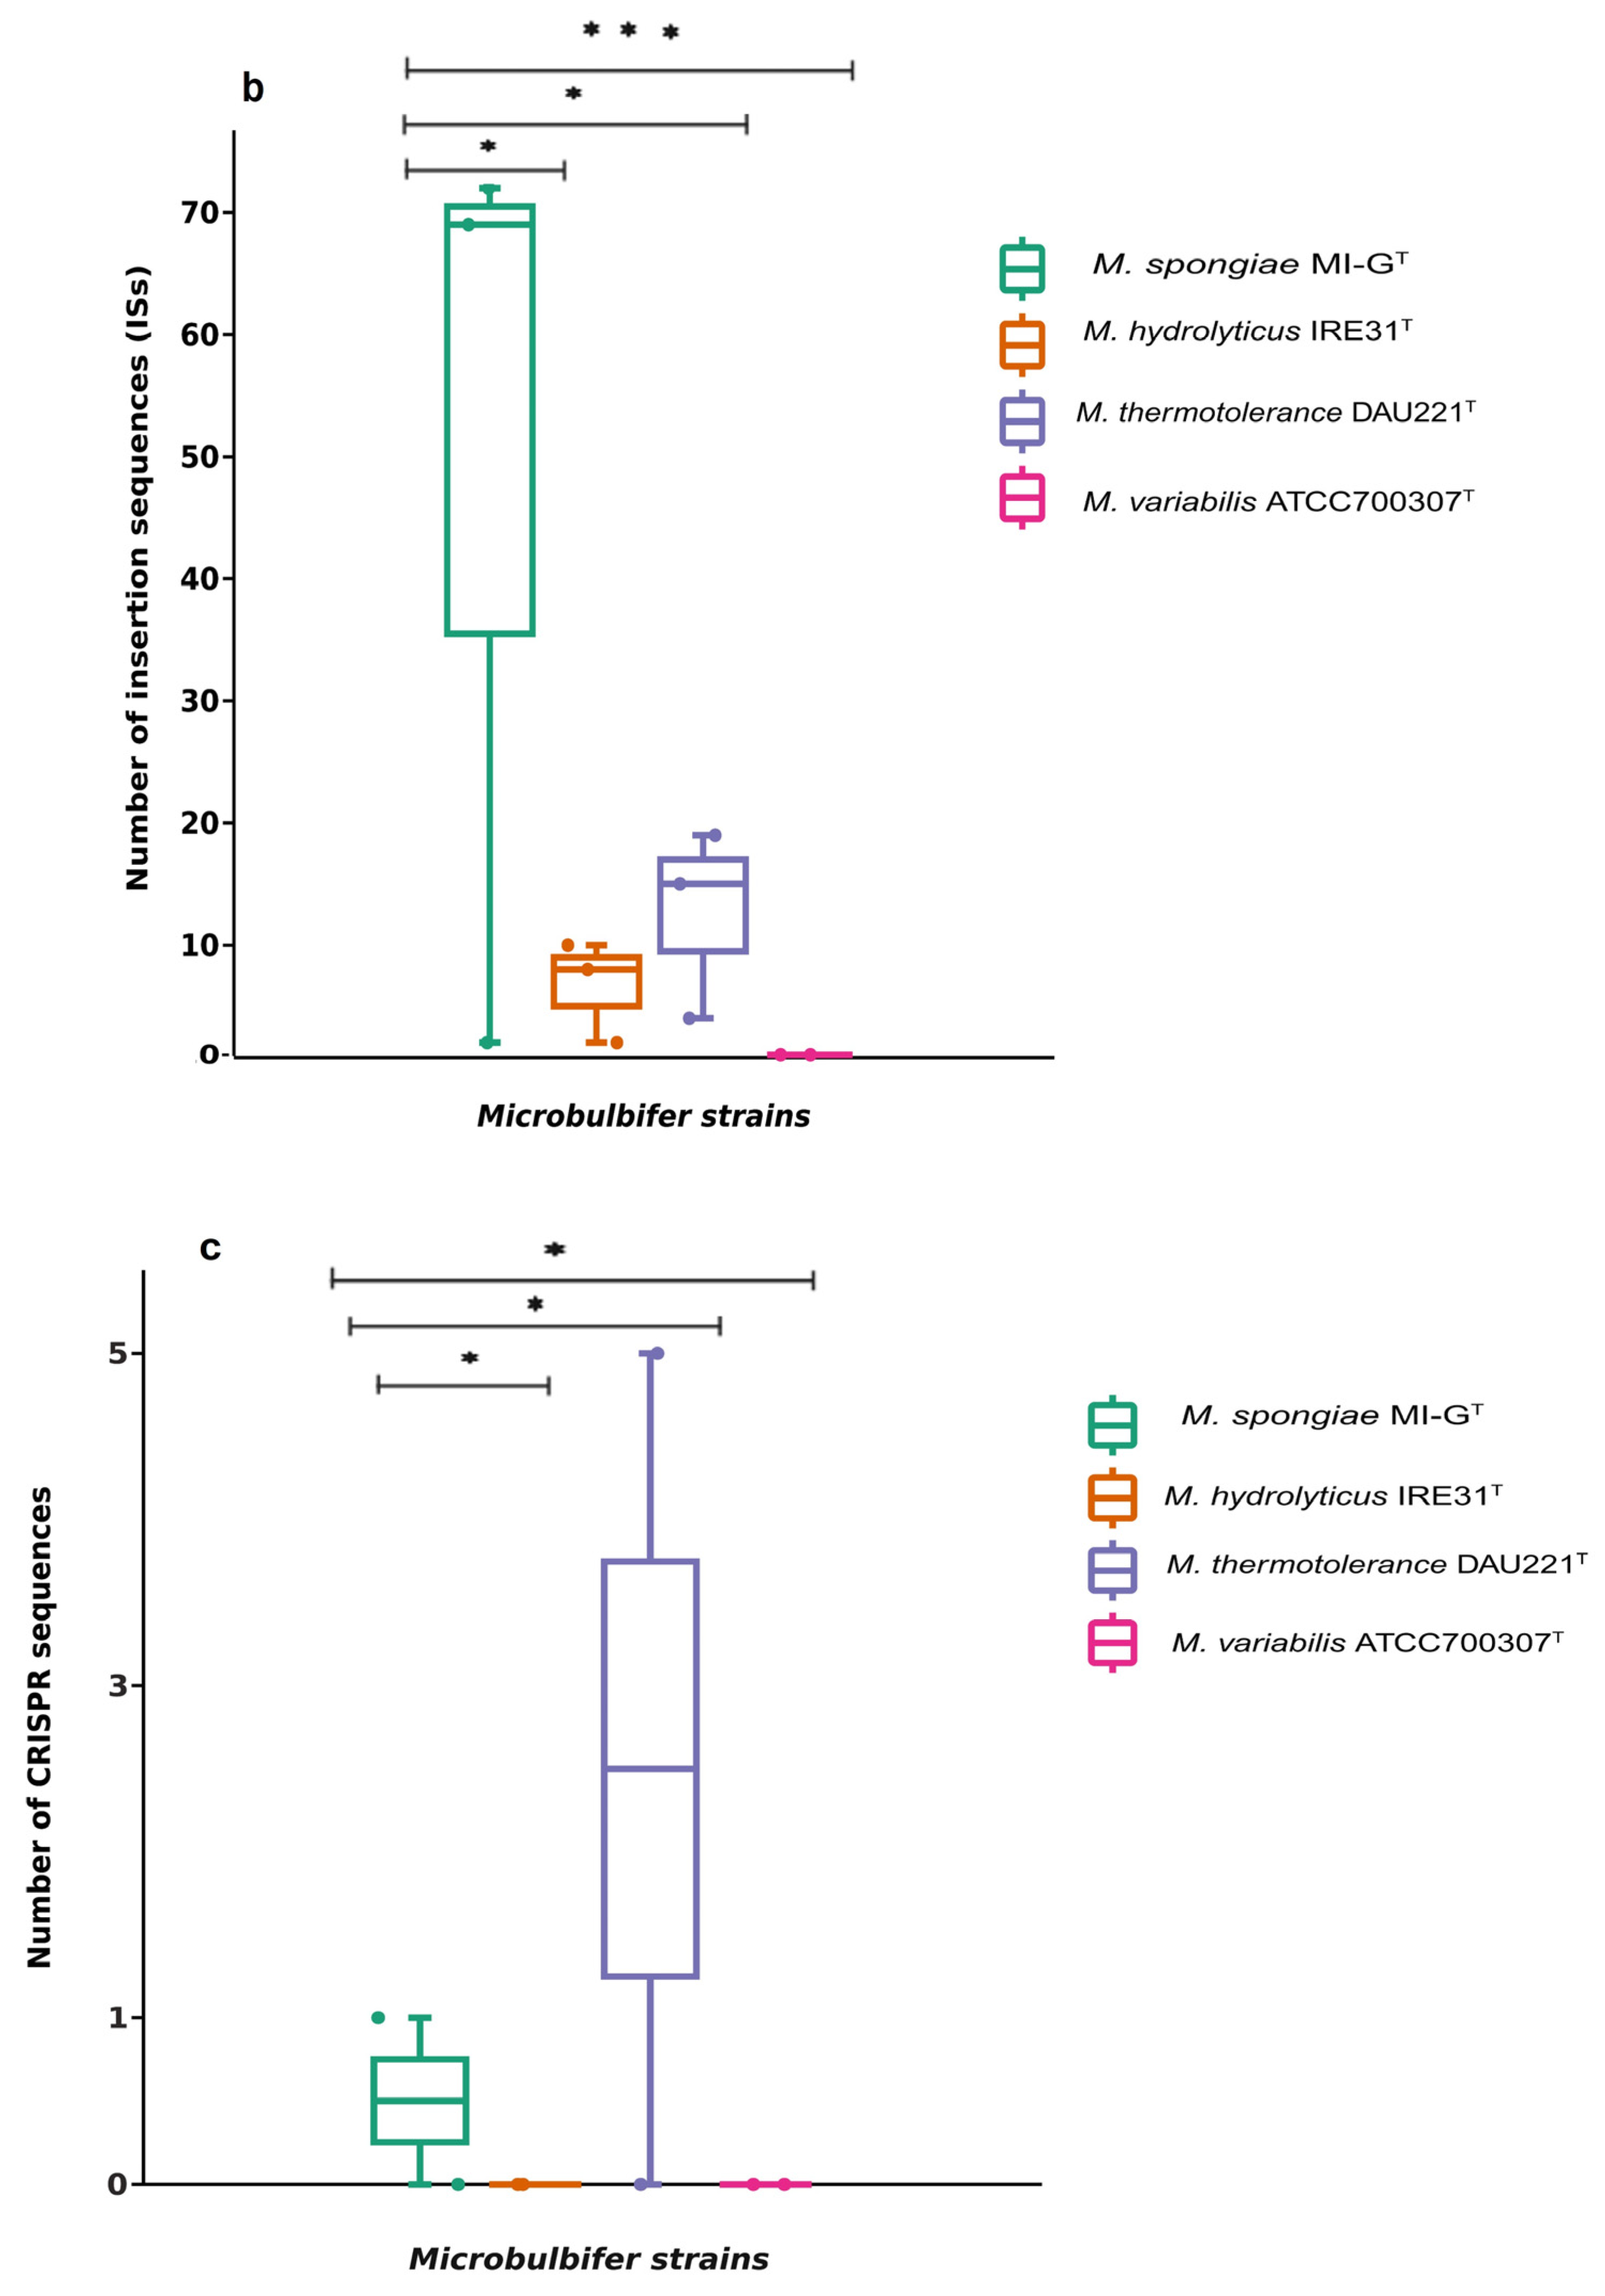
The number of genomic islands (GIs) in the genomes of four Microbulbifer strains varies as 51, 24, 52, and 35 GIs in M. spongiae MI-GT, M. hydrolyticus IRE31T, M. thermotolerance DAU221T, and M. variabilis ATCC 700307T, respectively (Table S2; Figure 2a and Figure S7). A comparatively large number of insertion sequences (ISs), 72 different ISs belonging to 9 IS families, were identified in M. spongiae MI-GT. Whereas, M. hydrolyticus IRE31T possesses 10 different ISs belonging to 7 IS families and M. thermotolerance DAU221T has 19 different ISs belonging to 7 ISs families. In contrast, M. variabilis ATCC700307T contains no transposable insertion element with significant similarity to ISs (Figure 2b; Table S3). Only one clustered regularly interspaced short palindromic repeat (CRISPR) sequence with two spacers was predicted in the genome of M. spongiae MI-GT. 5 CRISPR sequences with a varied number of spacers (50, 5, 4, 9, and 1) were predicted in the genome of M. thermotolerance DAU221T (Figure 2c; Table S4). However, the other two Microbulbifer reference strains, i.e., M. hydrolyticus IRE31T and M. variabilis ATCC700307T, do not have any CRISPR sequence (Figure 2c).

3.3. Carbohydrate Metabolism and Stress Response

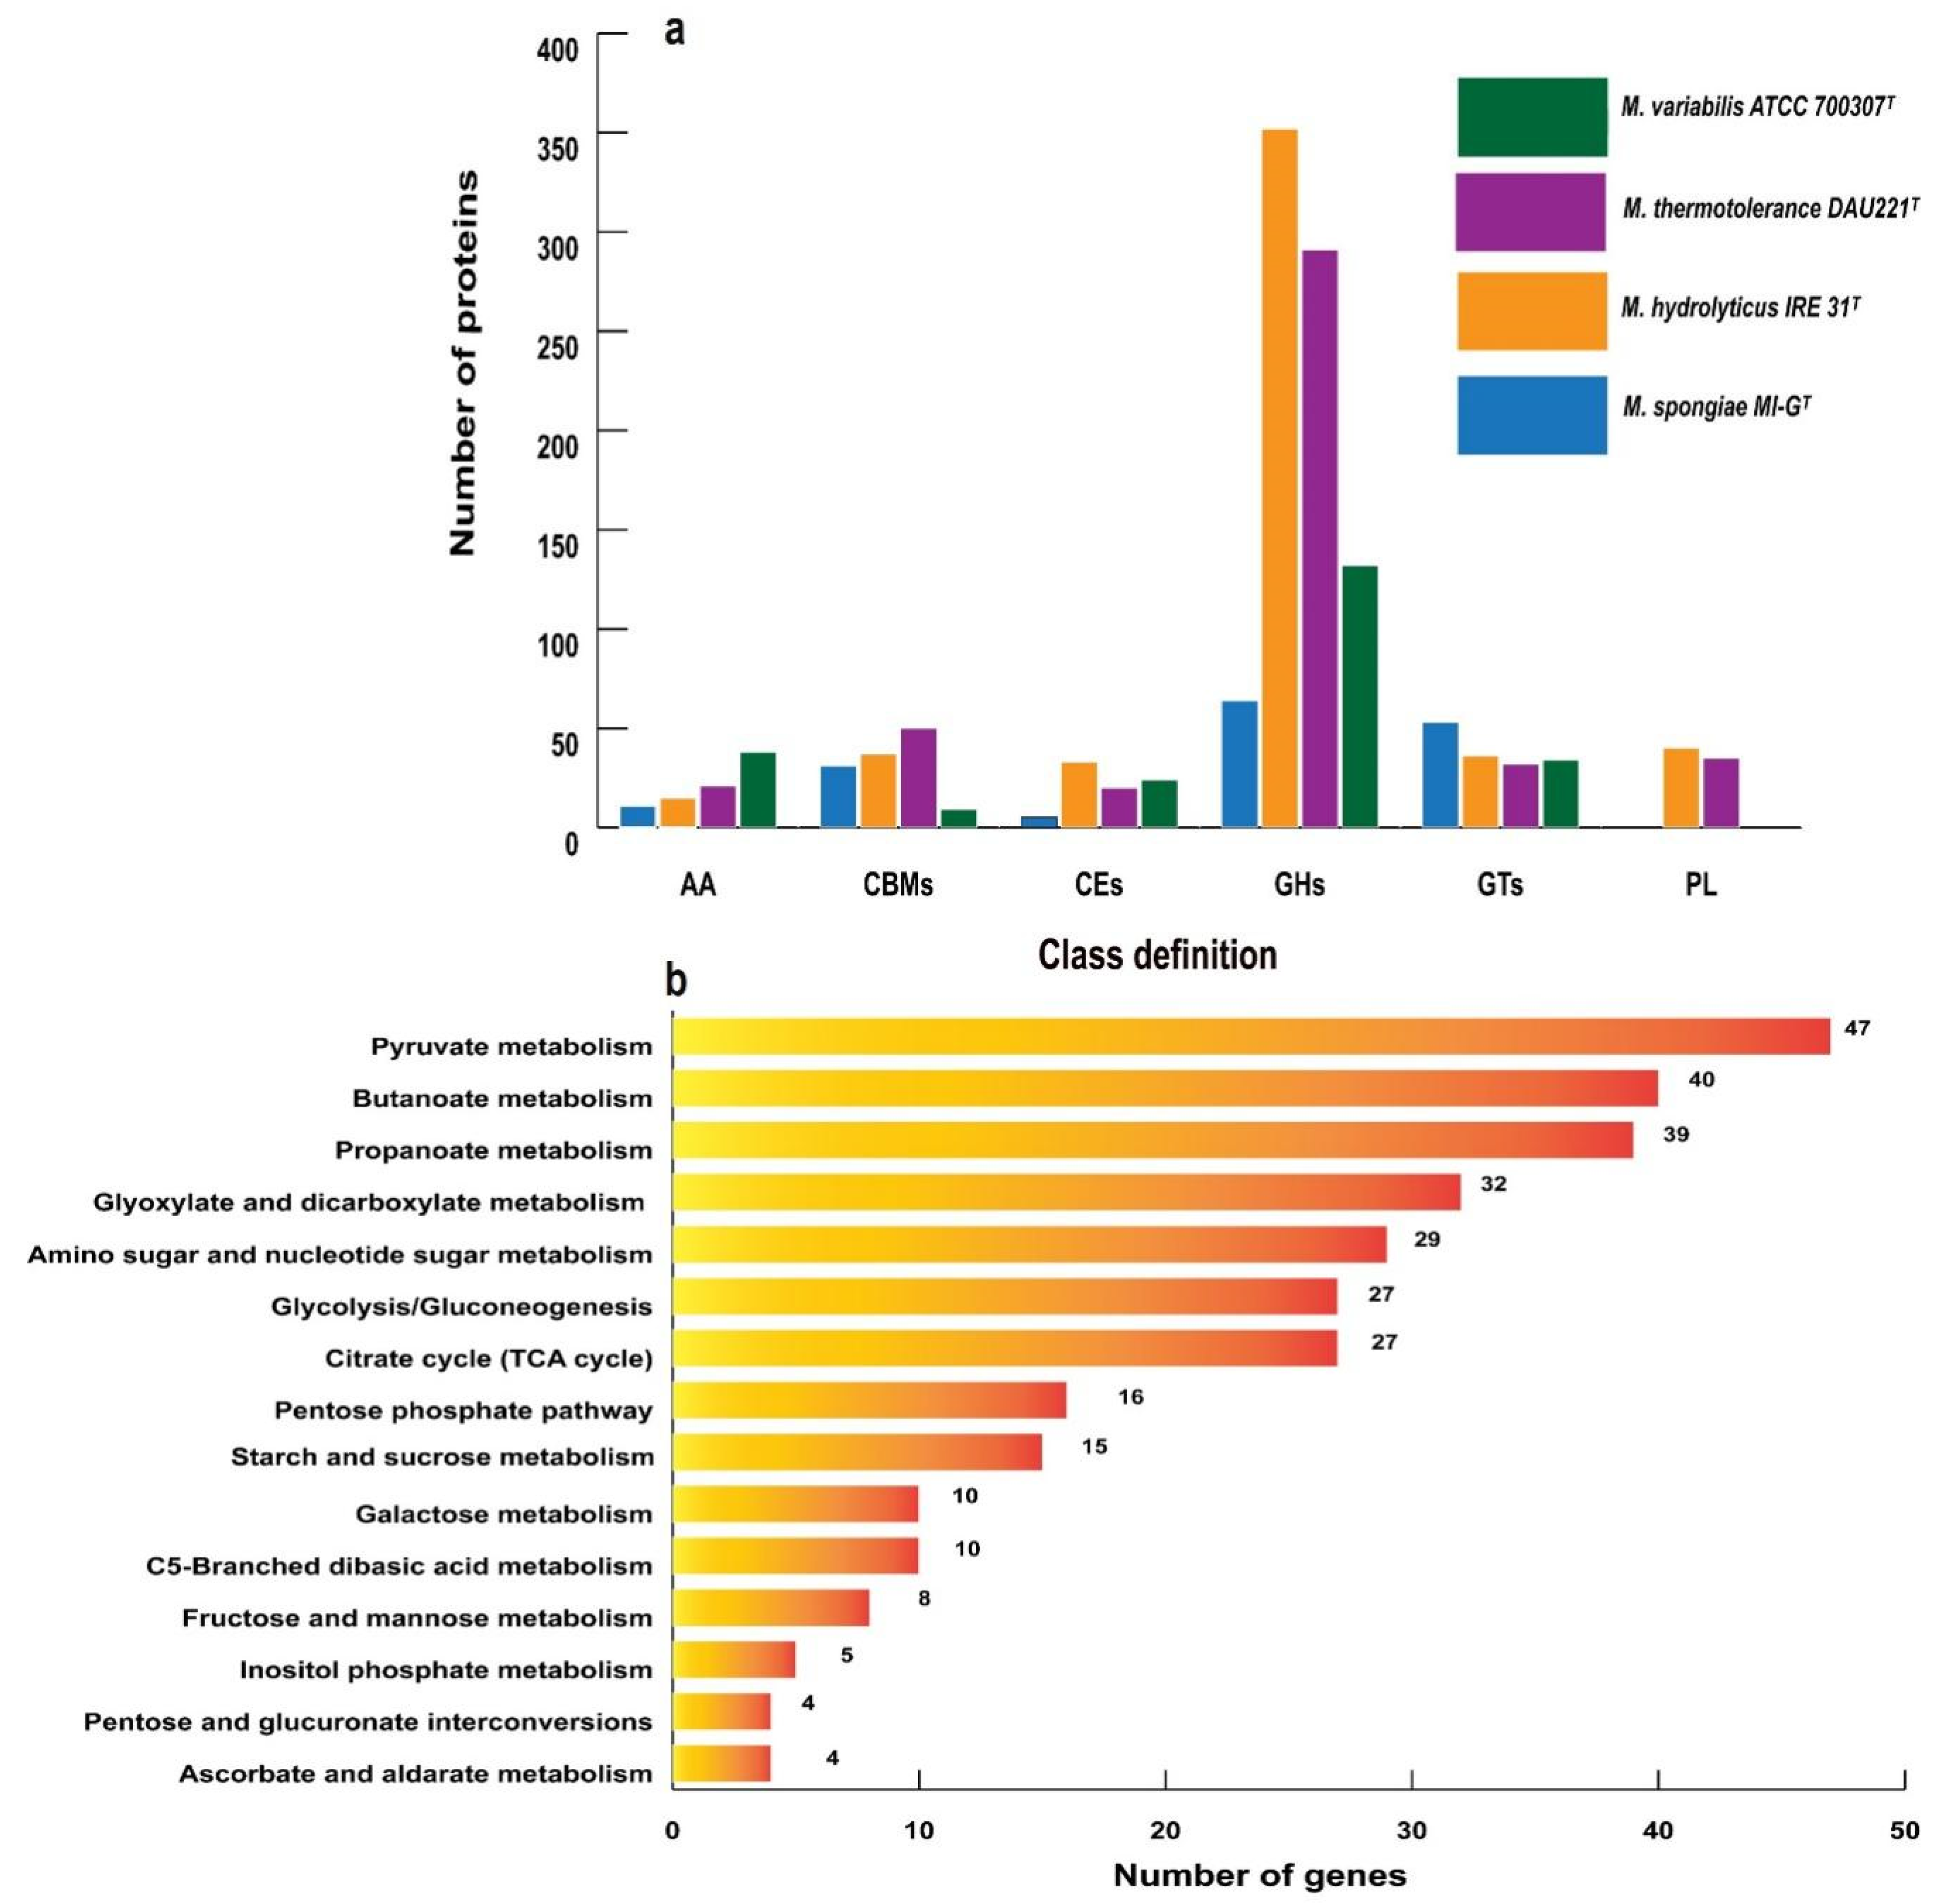
The genome of M. spongiae MI-GT was further explored by using carbohydrate-active enzyme (CAZyme) database. M. spongiae MI-GT contains 164 CAZyme enzymes belonging to five classes of CAZymes as follows: 11 auxiliary activities (AAs), 31 carbohydrate-binding modules (CBMs), 5 carbohydrate esterases (CEs), 64 glycoside hydrolases (GHs), and 53 glycosyltransferases (GTs). We did not find any polysaccharide lyases (PLs) in the genome of M. spongiae MI-GT. However, three Microbulbifer reference strains (i.e., M. hydrolyticus IRE31T, M. thermotolerance DAU221T, and M. variabilis ATCC700307T) possess a comparatively higher number of CAZymes, i.e., 513, 449, and 239, respectively, than M. spongiae MI-GT. M. hydrolyticus IRE31T possesses the highest number of CAZymes, and the number of AA, CBMs, CEs, GHs, GTs, and PL is 15, 37, 33, 352, 36, and 40, respectively. Number of AA, CBMs, CEs, GHs, GTs, and PL CAZyme-classes in M. thermotolerance DAU221T is 21, 50, 20, 291, 32, and 35, respectively. Moreover, in M. variabilis ATCC700307T, the number of these enzymes is 38, 9, 24, 132, 34, and 2, respectively (Figure 3a). A detailed description of functional CAZyme classes and associated enzymes in the genome of M. spongiae MI-GT and three Microbulbifer reference strains is listed in Table S5. These enzymes were annotated to versatile carbohydrate metabolic pathways (Figure 3b): genes associated with pyruvate metabolism, butanoate metabolism, propanoate metabolism, glyoxylate and dicarboxylate metabolism, amino sugar and nucleotide sugar metabolism, citrate cycle (TCA), and glycolysis or gluconeogenesis were more abundant than those involved in other types of carbohydrate metabolic pathways.
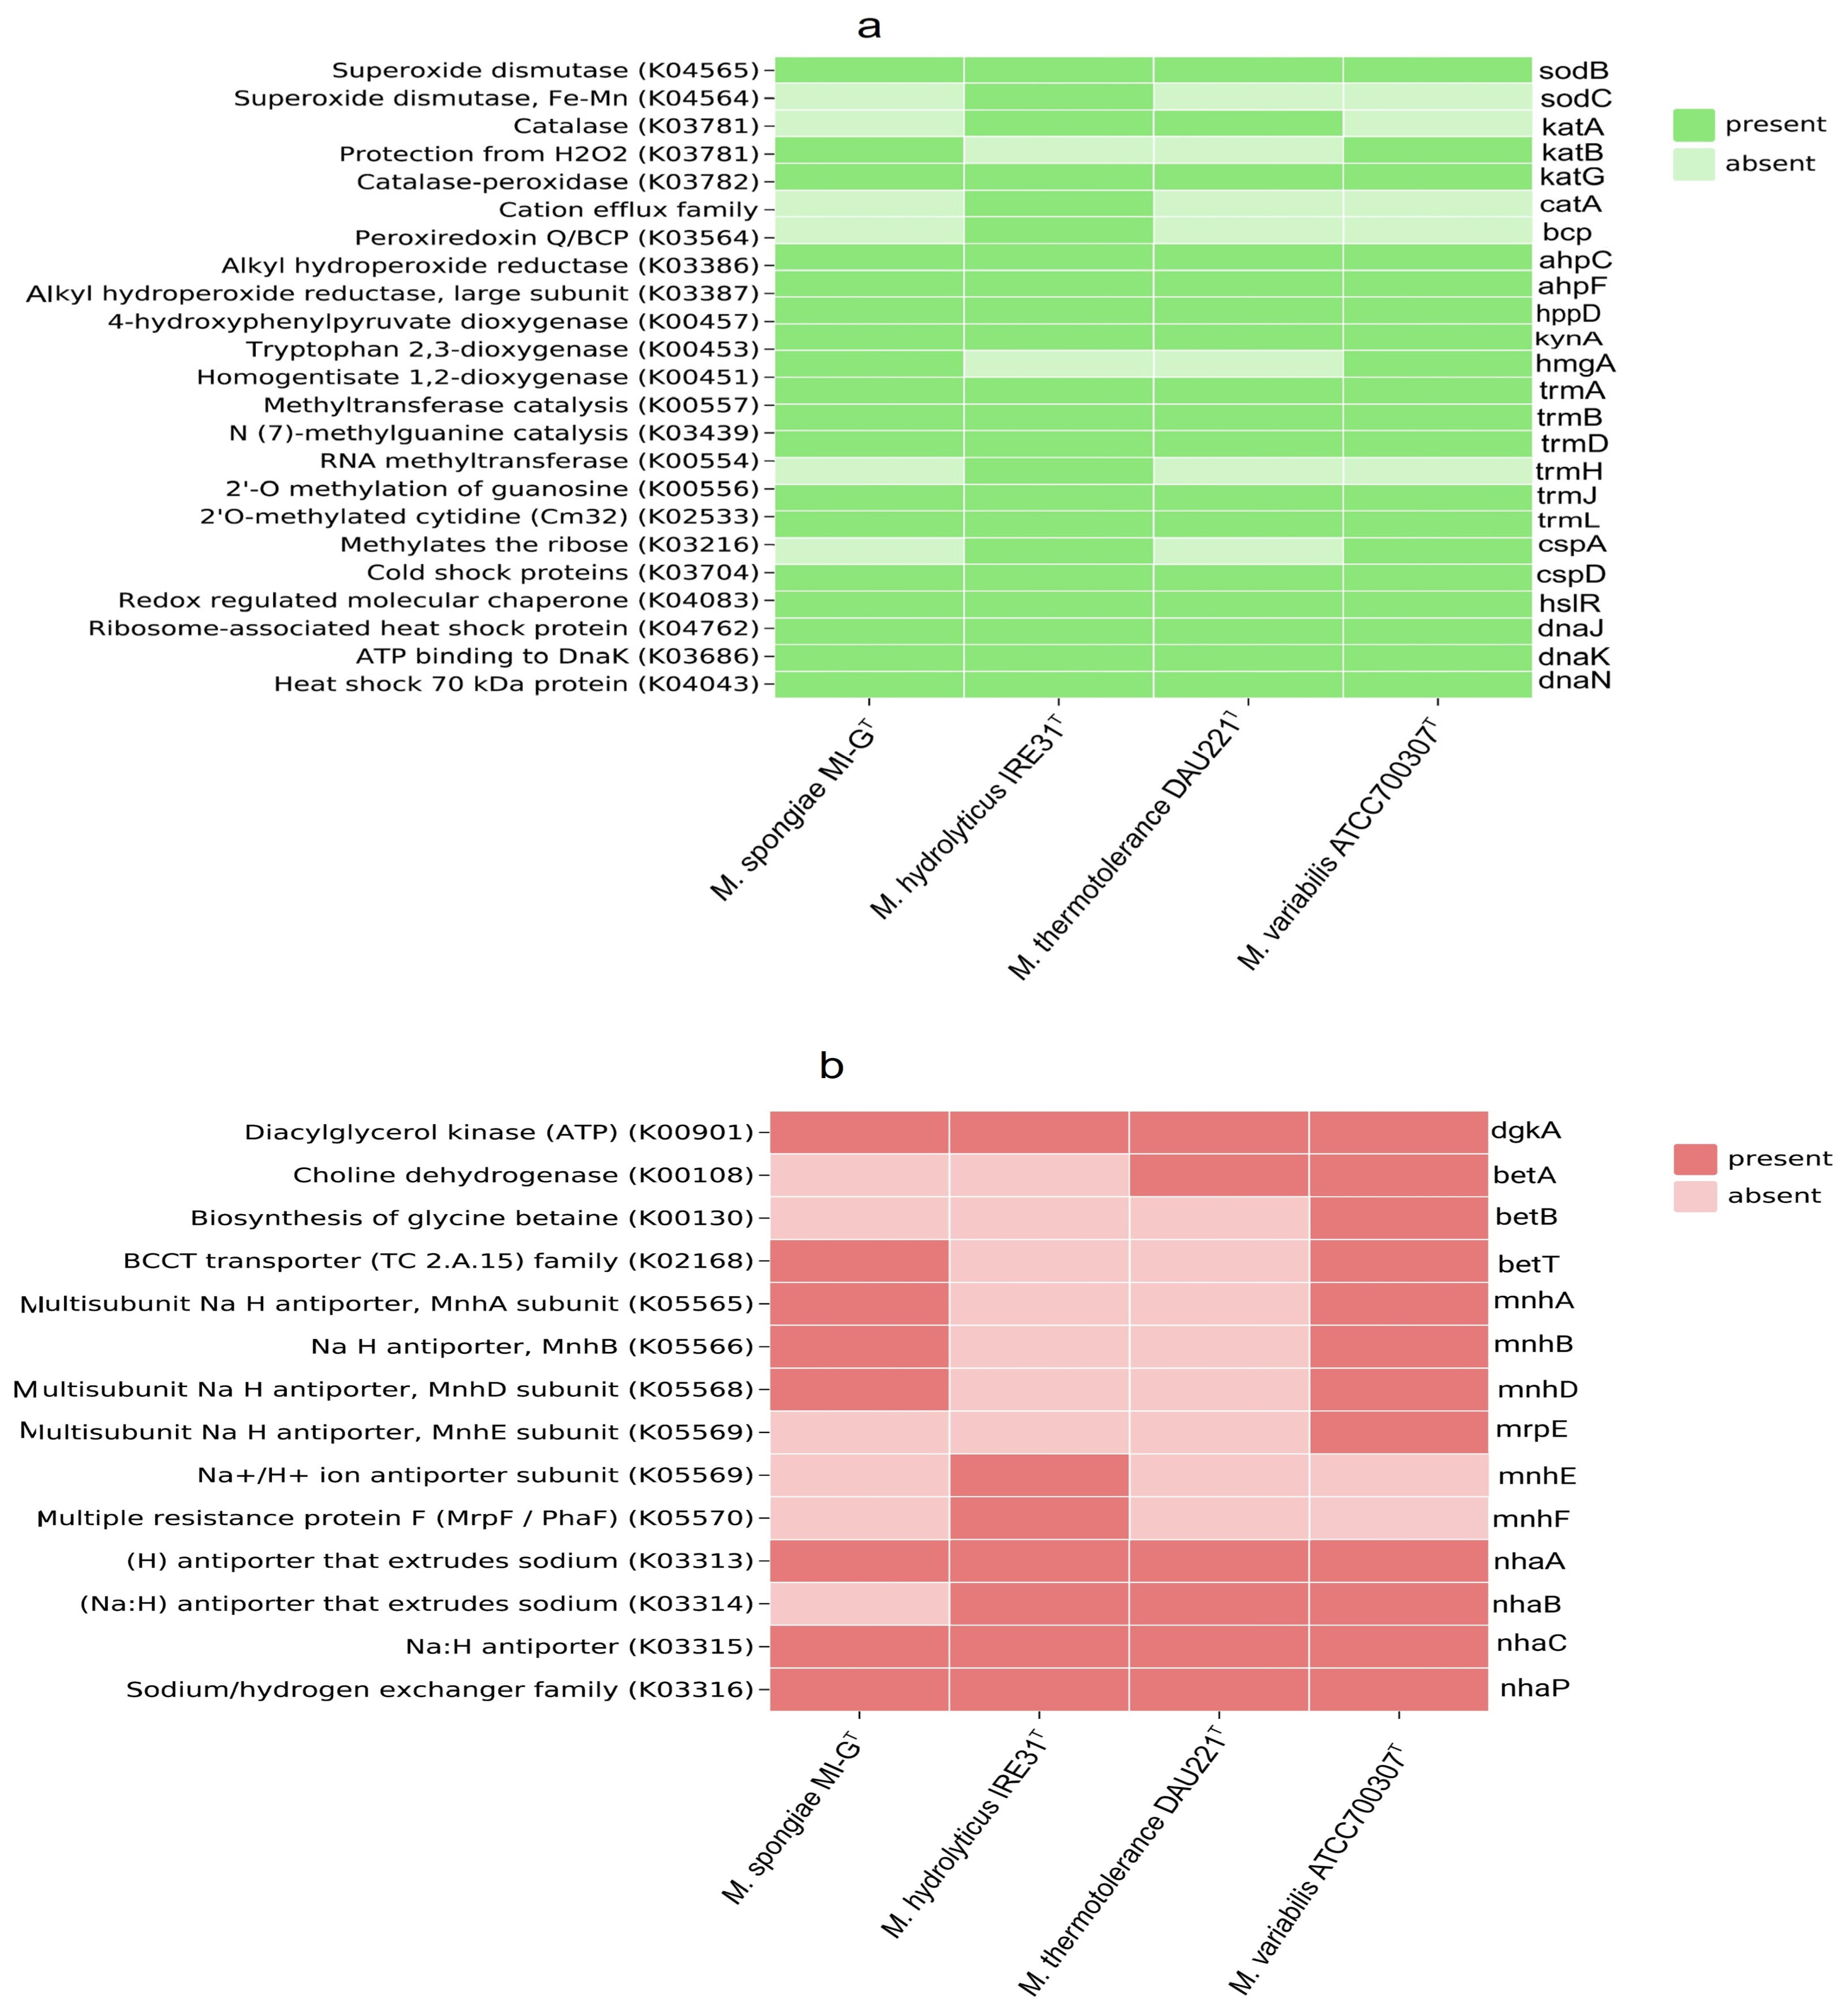
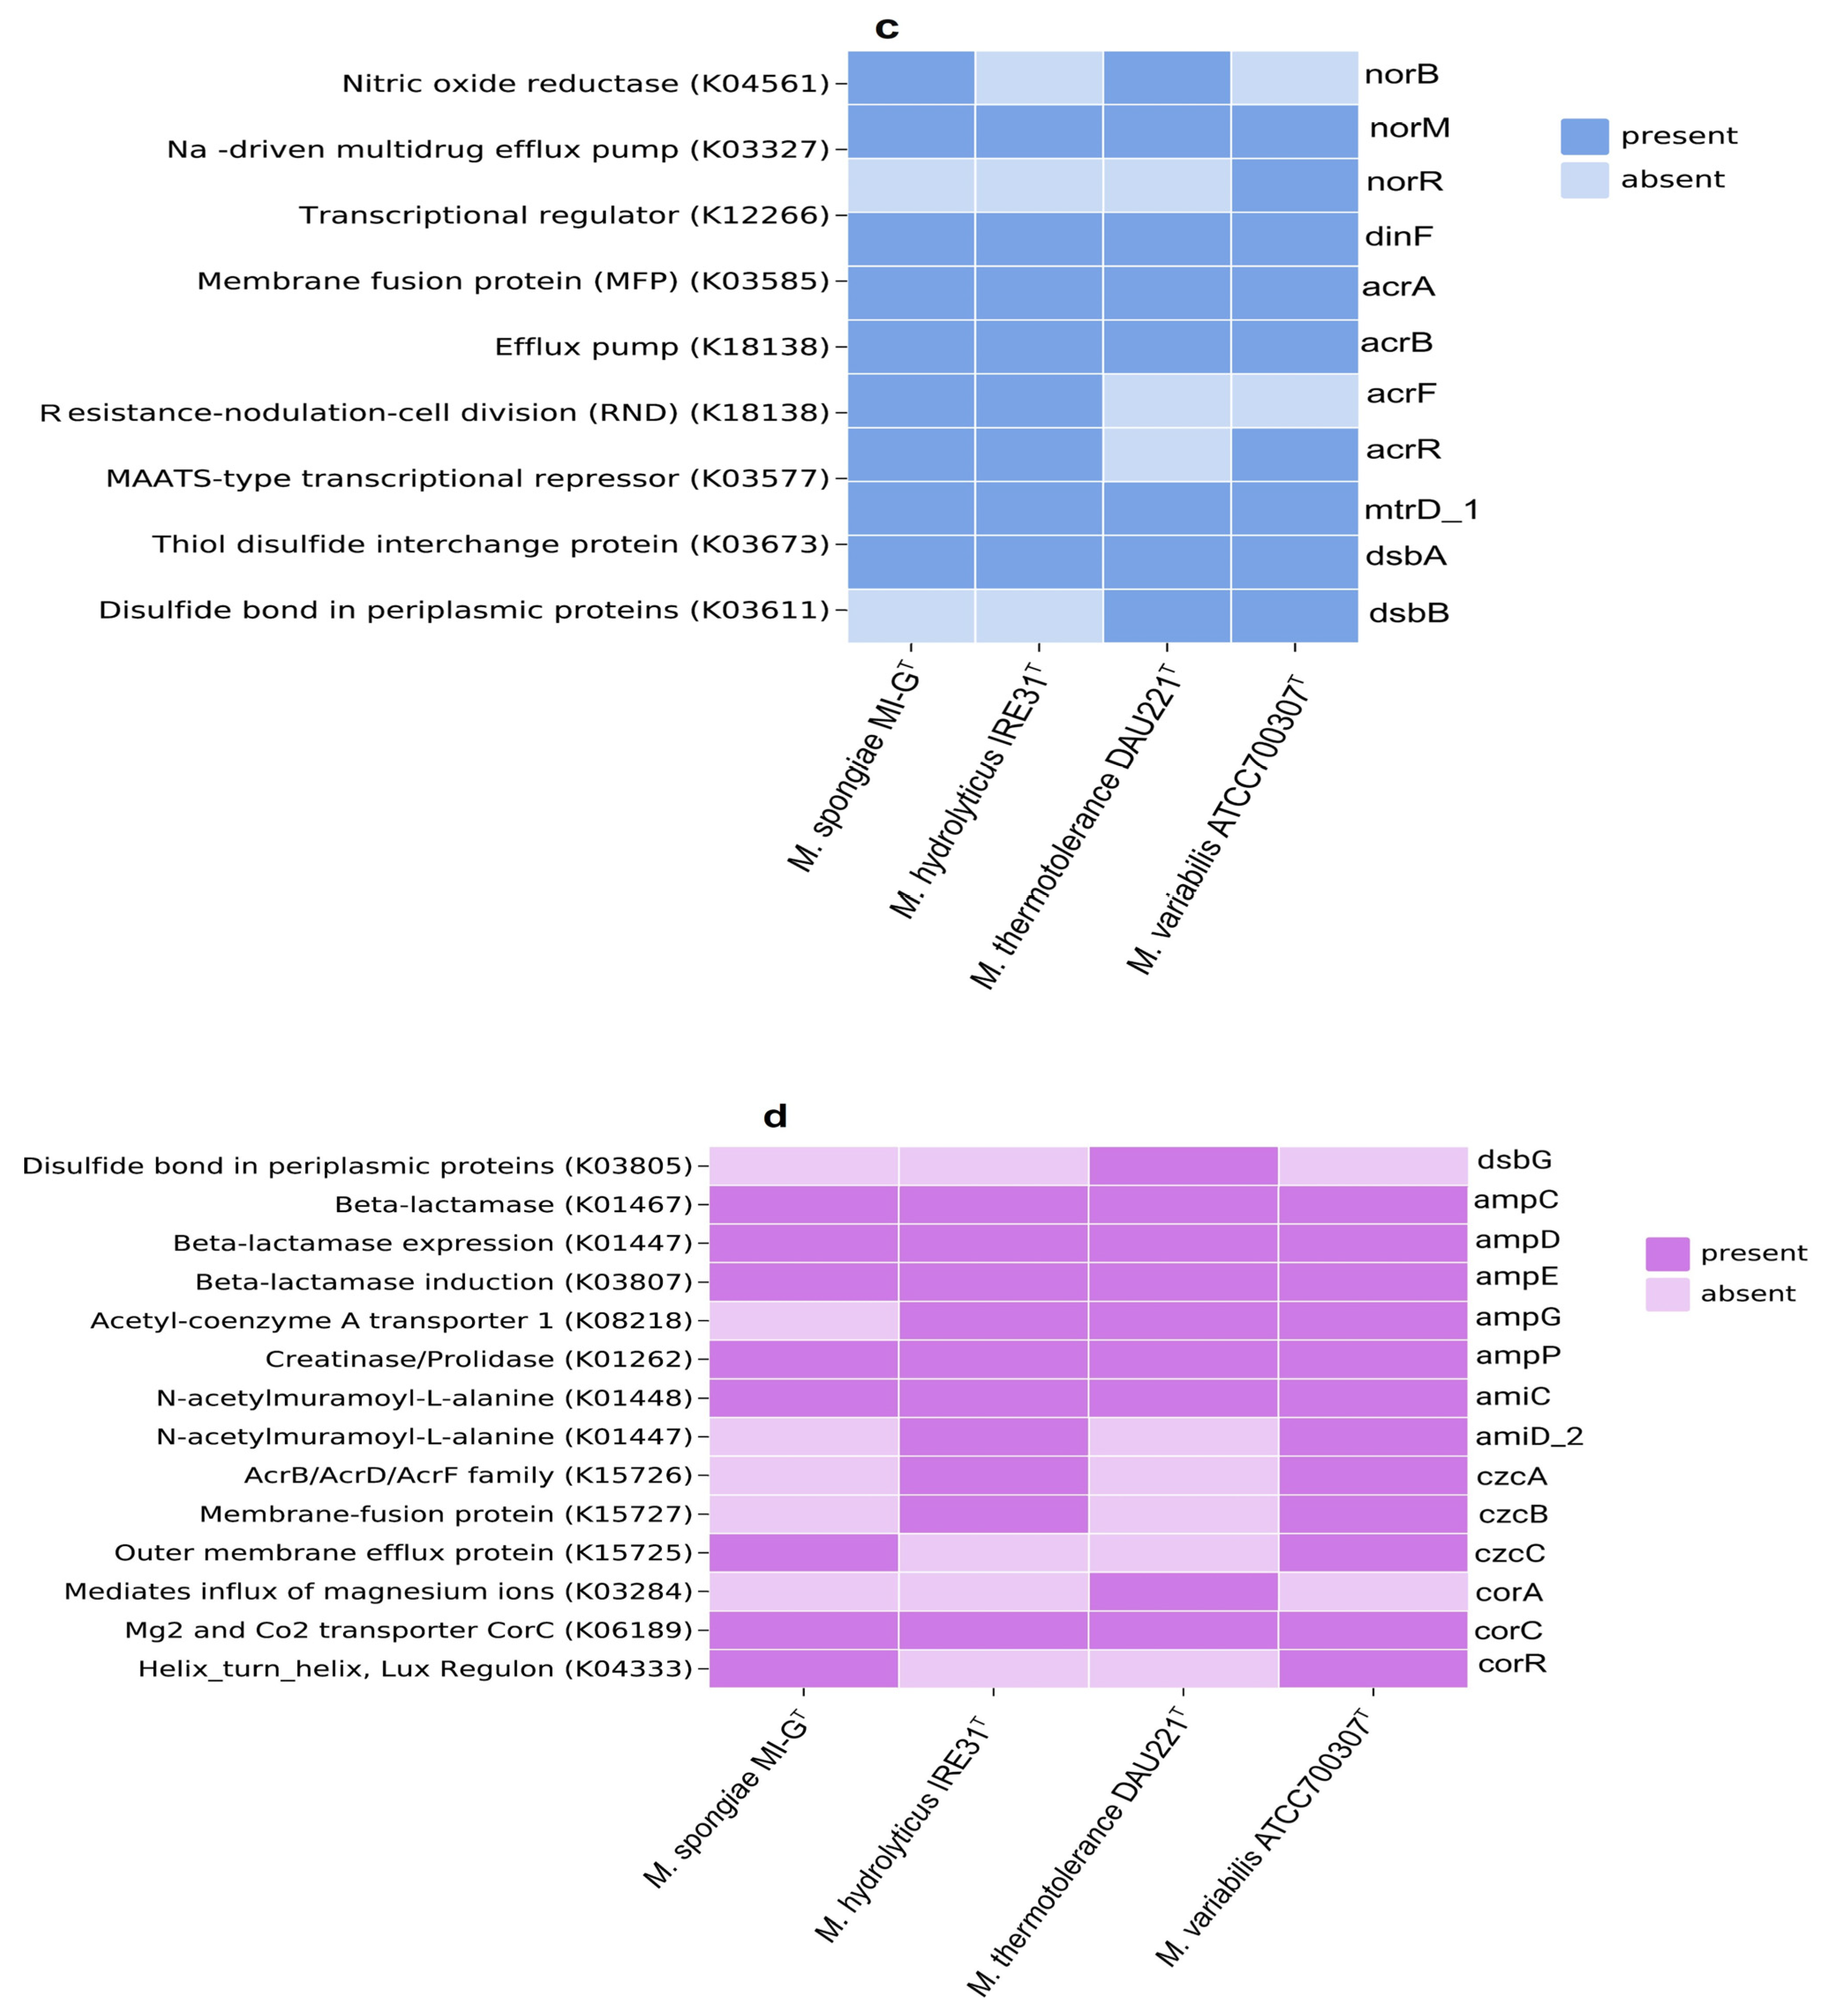
Genes associated with stress-response, such as oxidative stress, osmotic stress, resistance to antimicrobial drugs, and tolerance to biotoxic metals, were identified with differential distribution in the genomes of M. spongiae MI-GT and three Microbulbifer reference strains. However, proteins sodC, katA, catA, bcp, trmH, cspA (oxidative stress response), betA, betT, mnhE, mnhF, nhaB (osmotic stress response), and dsbG, ampG, amiD_2, czcA, czcB, and corA (tolerance to biotoxic metals) are absent in sponge-associated strain M. spongiae MI-GT but present in three Microbulbifer reference strains, as shown in Figure 4a–d and Table S1.

3.4. Different Genomic Characteristics of M. spongiae MI-GT from Other Microbulbifer Strains

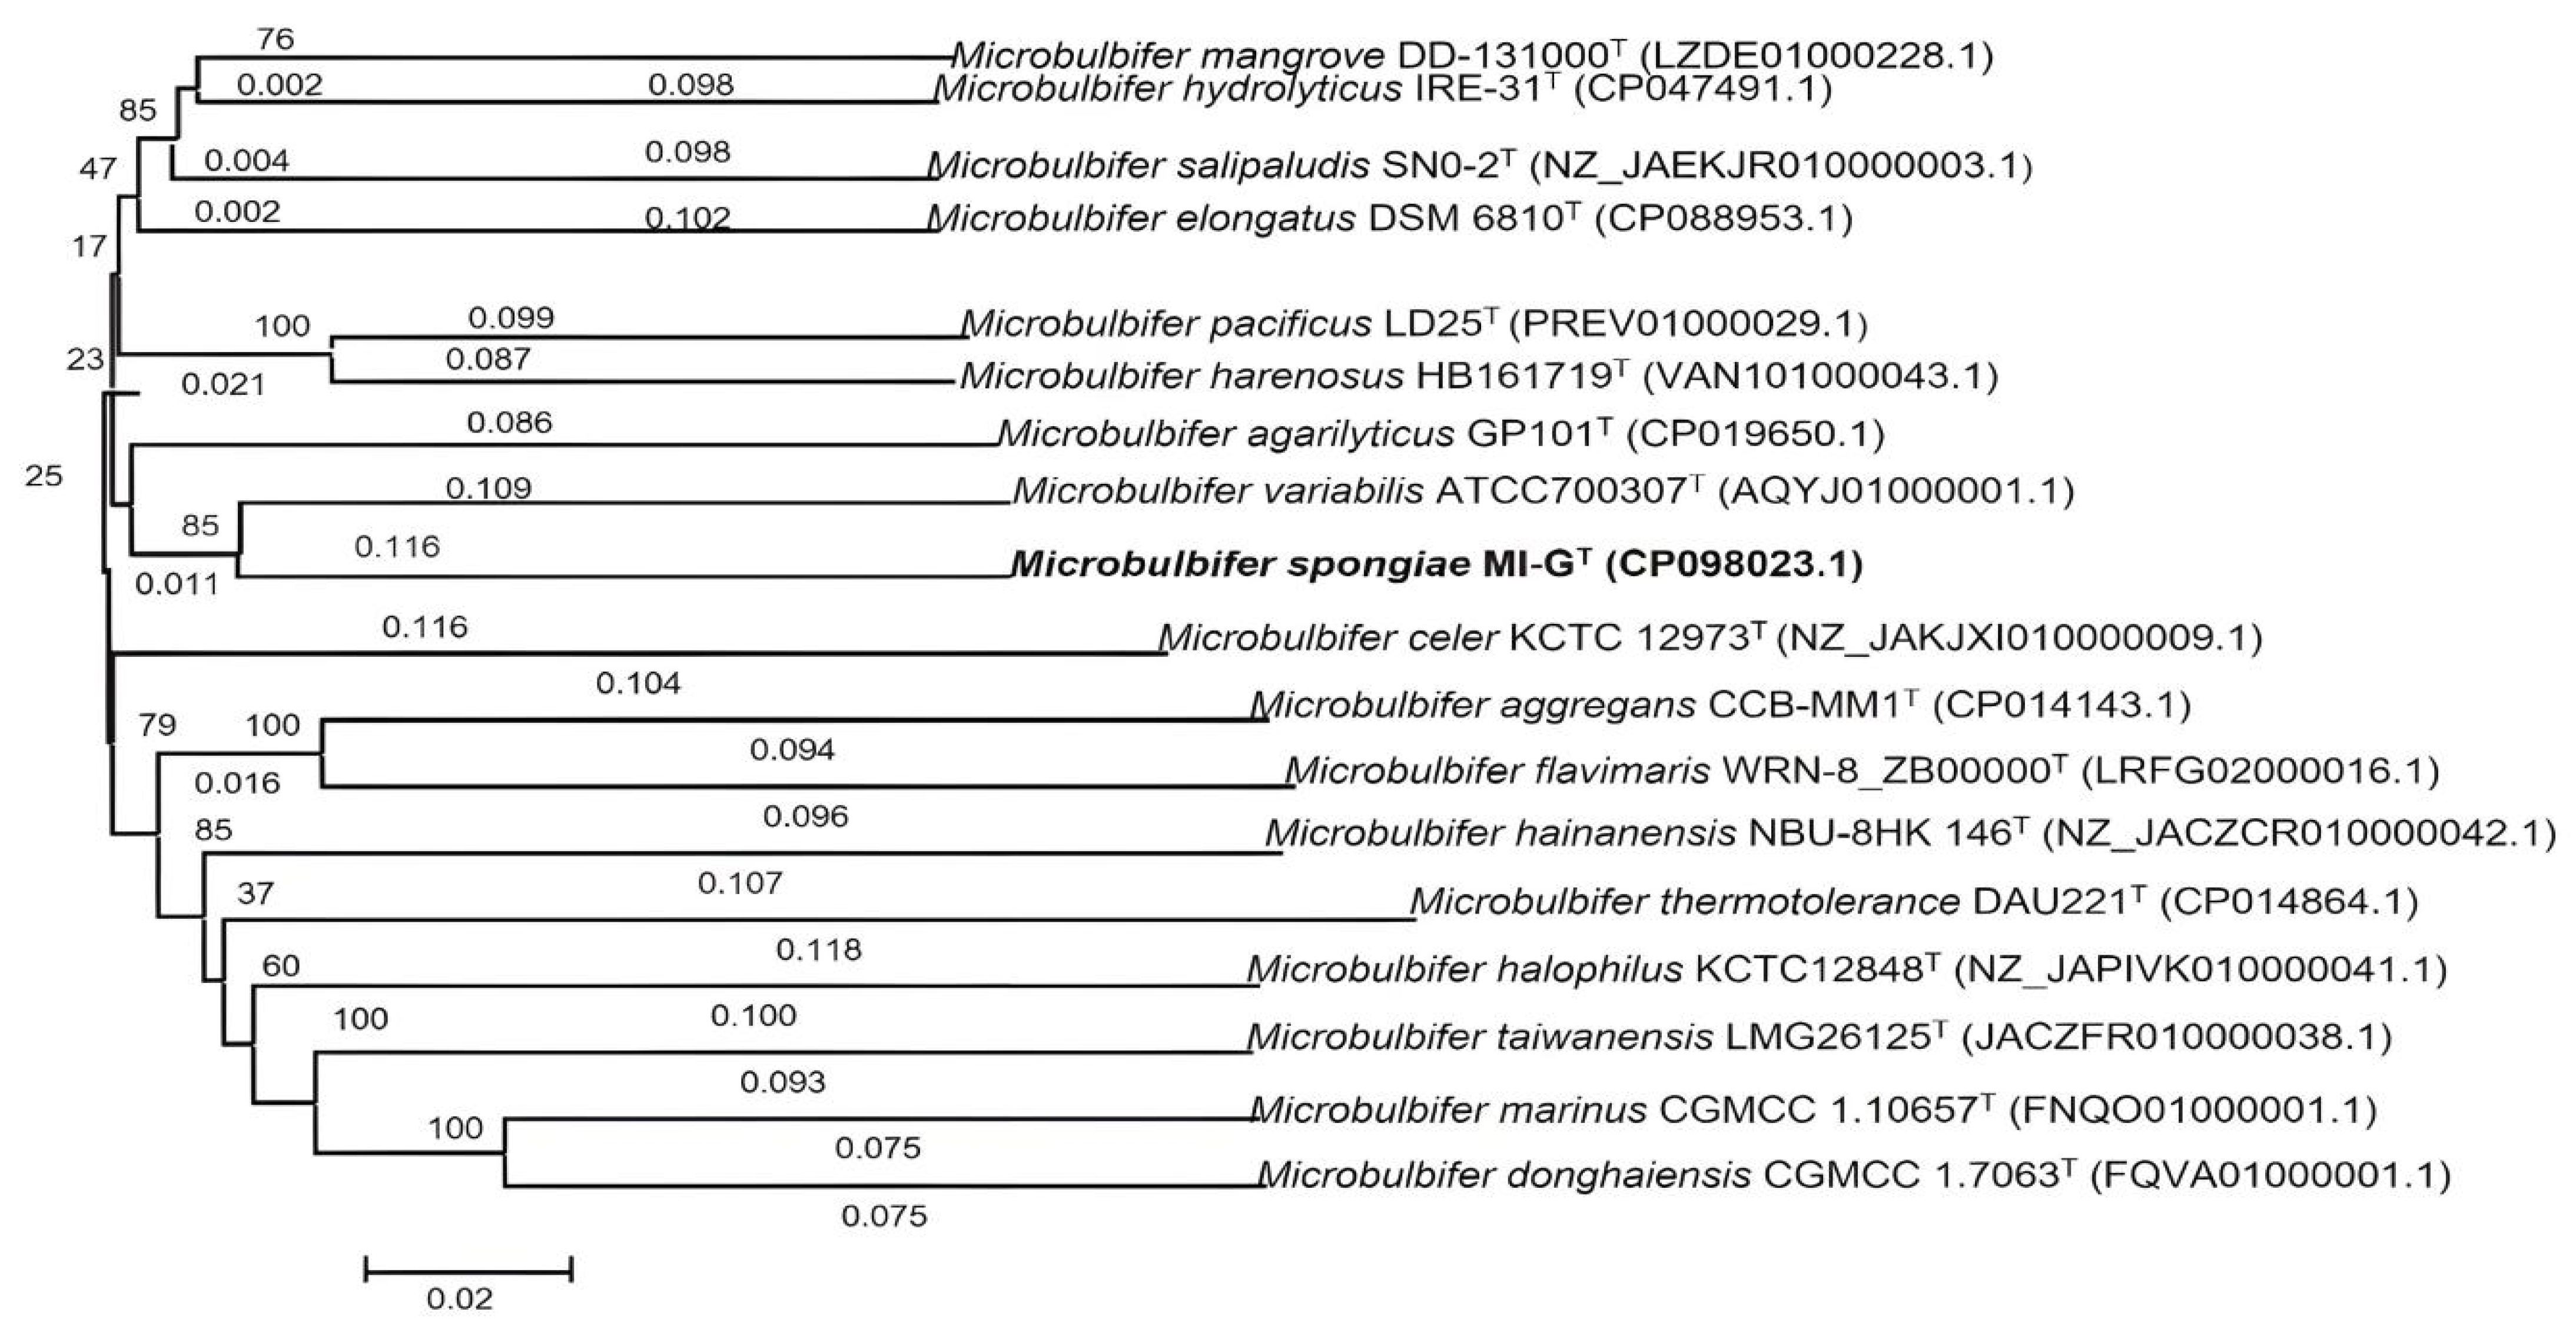
Genome size of Microbulbifer strains including M. spongiae MI-GT, M. hydrolyticus IRE31T, M. thermotolerance DAU221T, and M. variabilis ATCC700307T varies from 4.8 to 3.6 Mbp, and the average GC content ranges from 48.5 to 61.7%, signifying substantial inter-species variations. Phylogenomic analysis of the whole genome shows that M. spongiae MI-GT is more closely related to M. variabilis ATCC700307T and M. agarilyticus GP101T, indicating that M. spongiae MI-GT is a member of the genus Microbulbifer (Figure 5 and Figure S8).
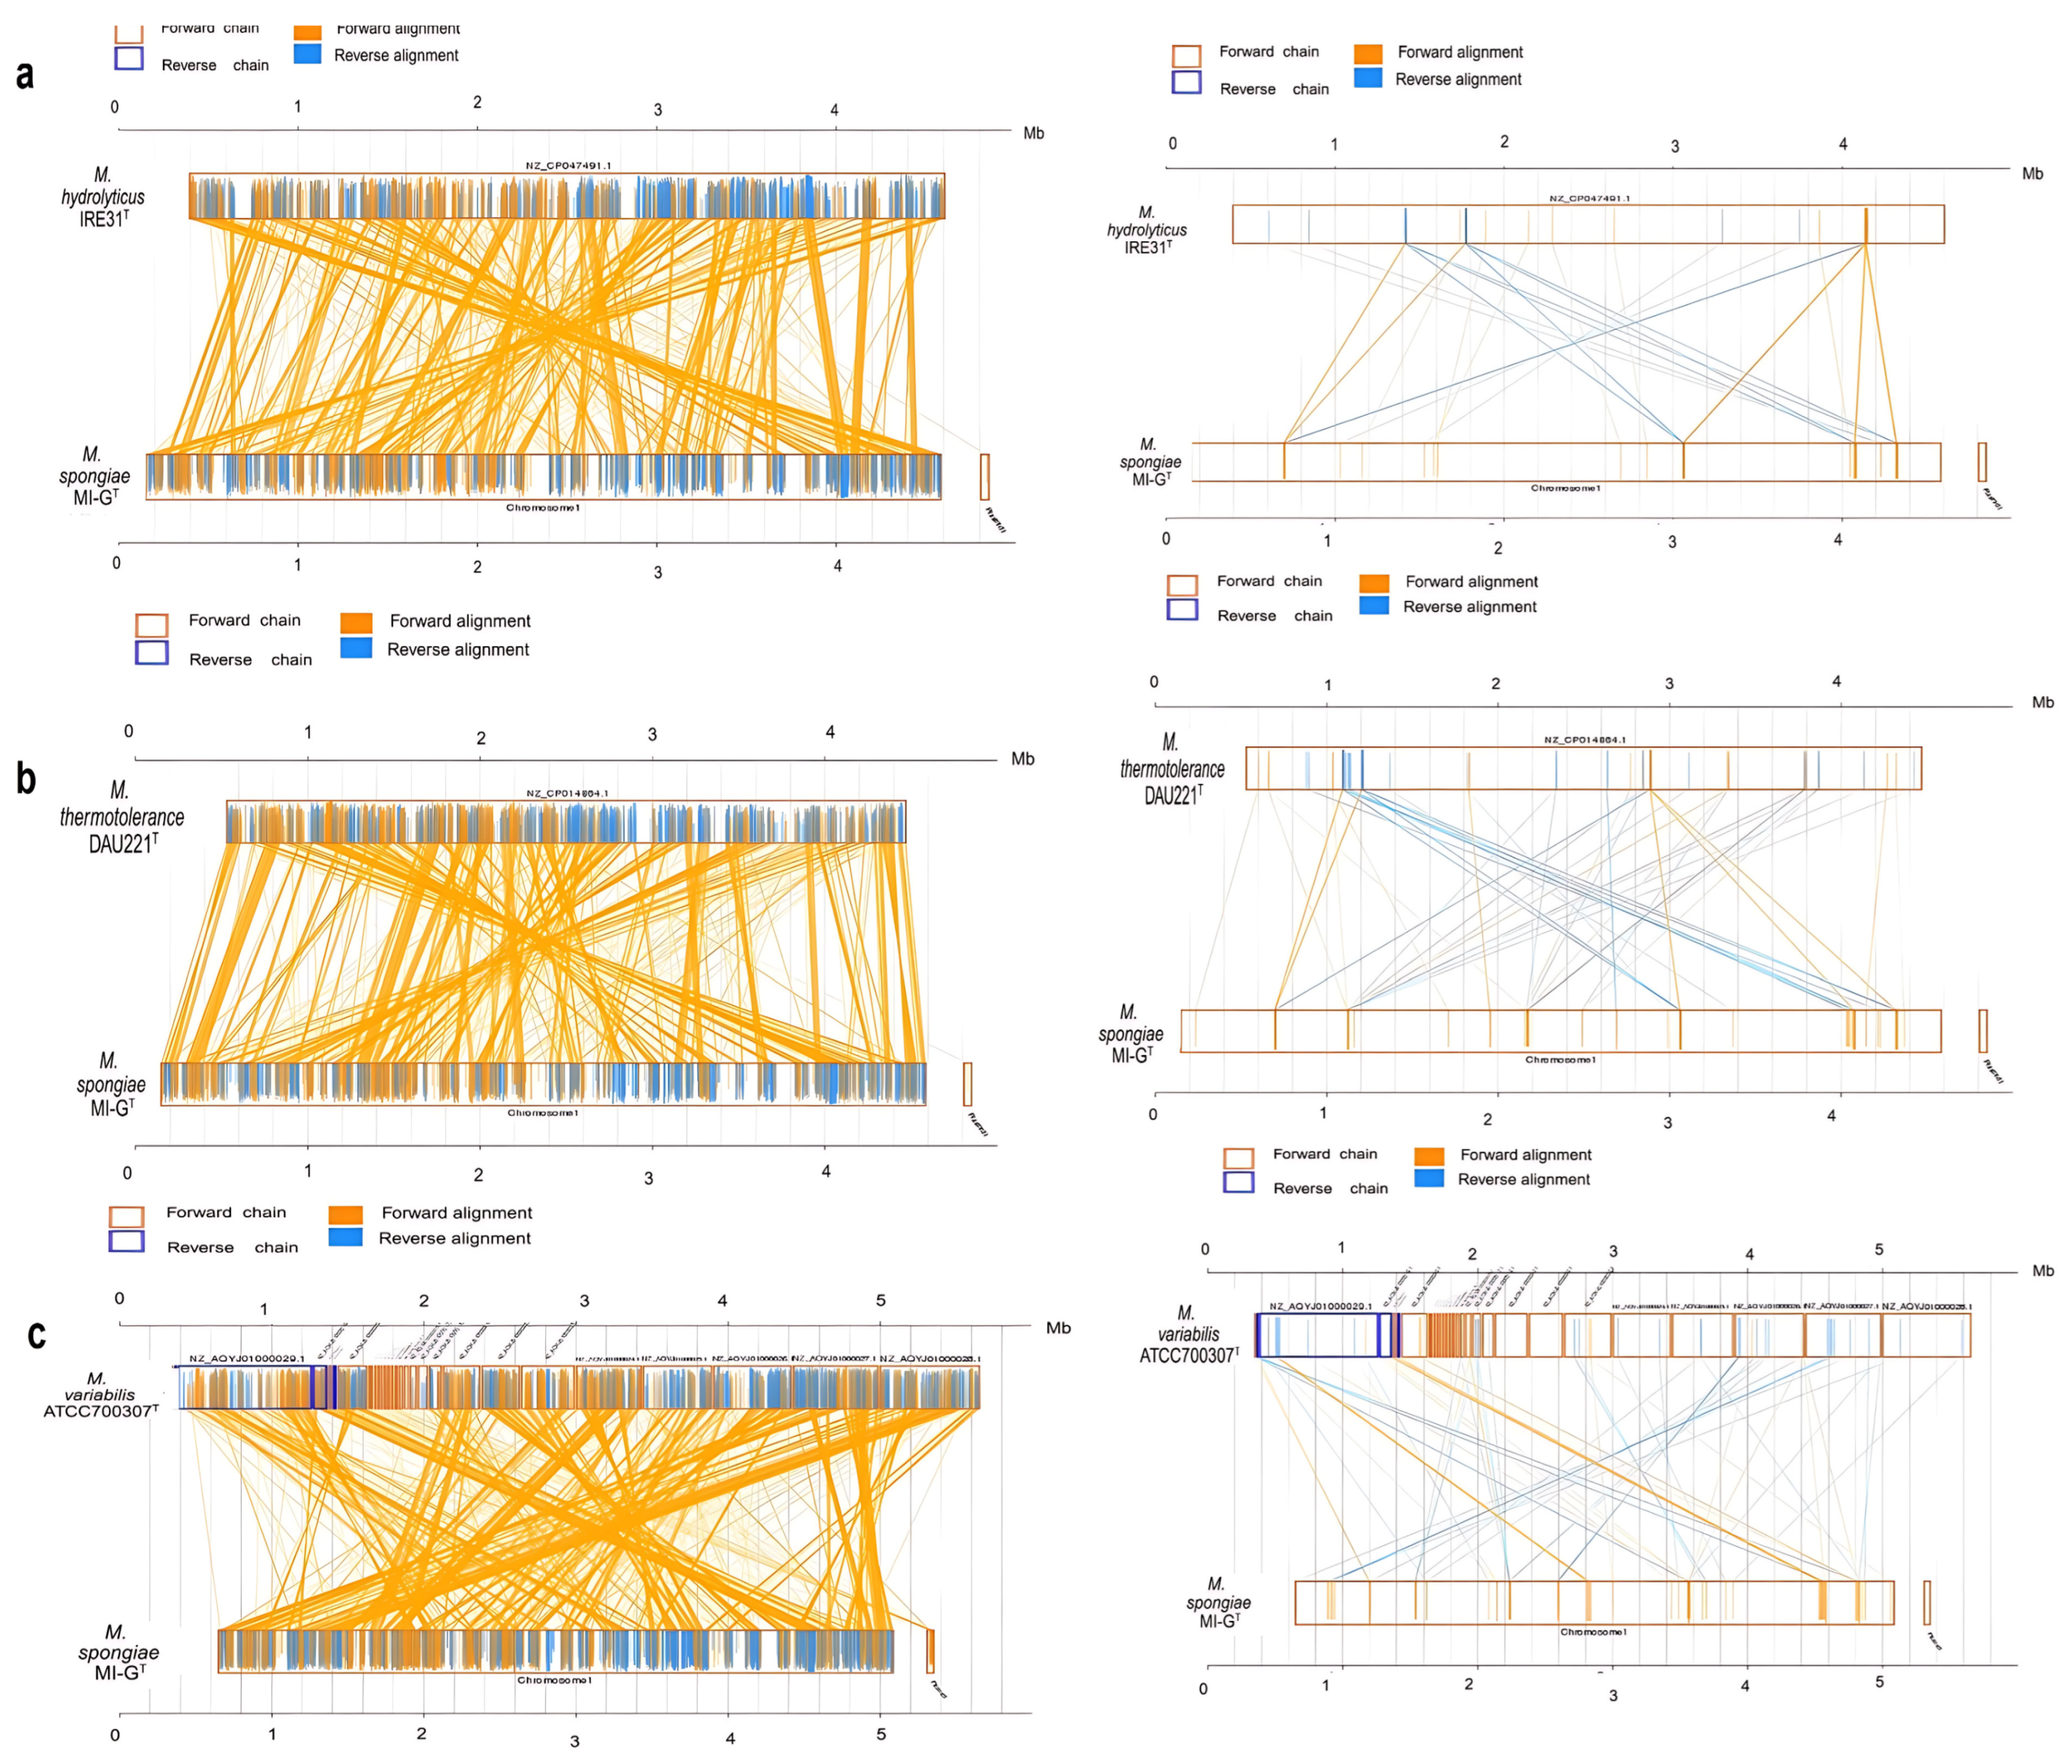
Furthermore, structural difference, mutation, and evolution between M. spongiae MI-GT and three Microbulbifer reference strains M. hydrolyticus IRE31T, M. thermotolerance DAU221T, and M. variabilis ATCC700307T were analyzed for genome-synteny. As shown in Figure 6, genome synteny results show high similarity, i.e., a lot of homologous regions exist in these four Microbulbifer strains, indicating large-scale evolutionary events have already occurred at the genus level (Figure 6a–c).
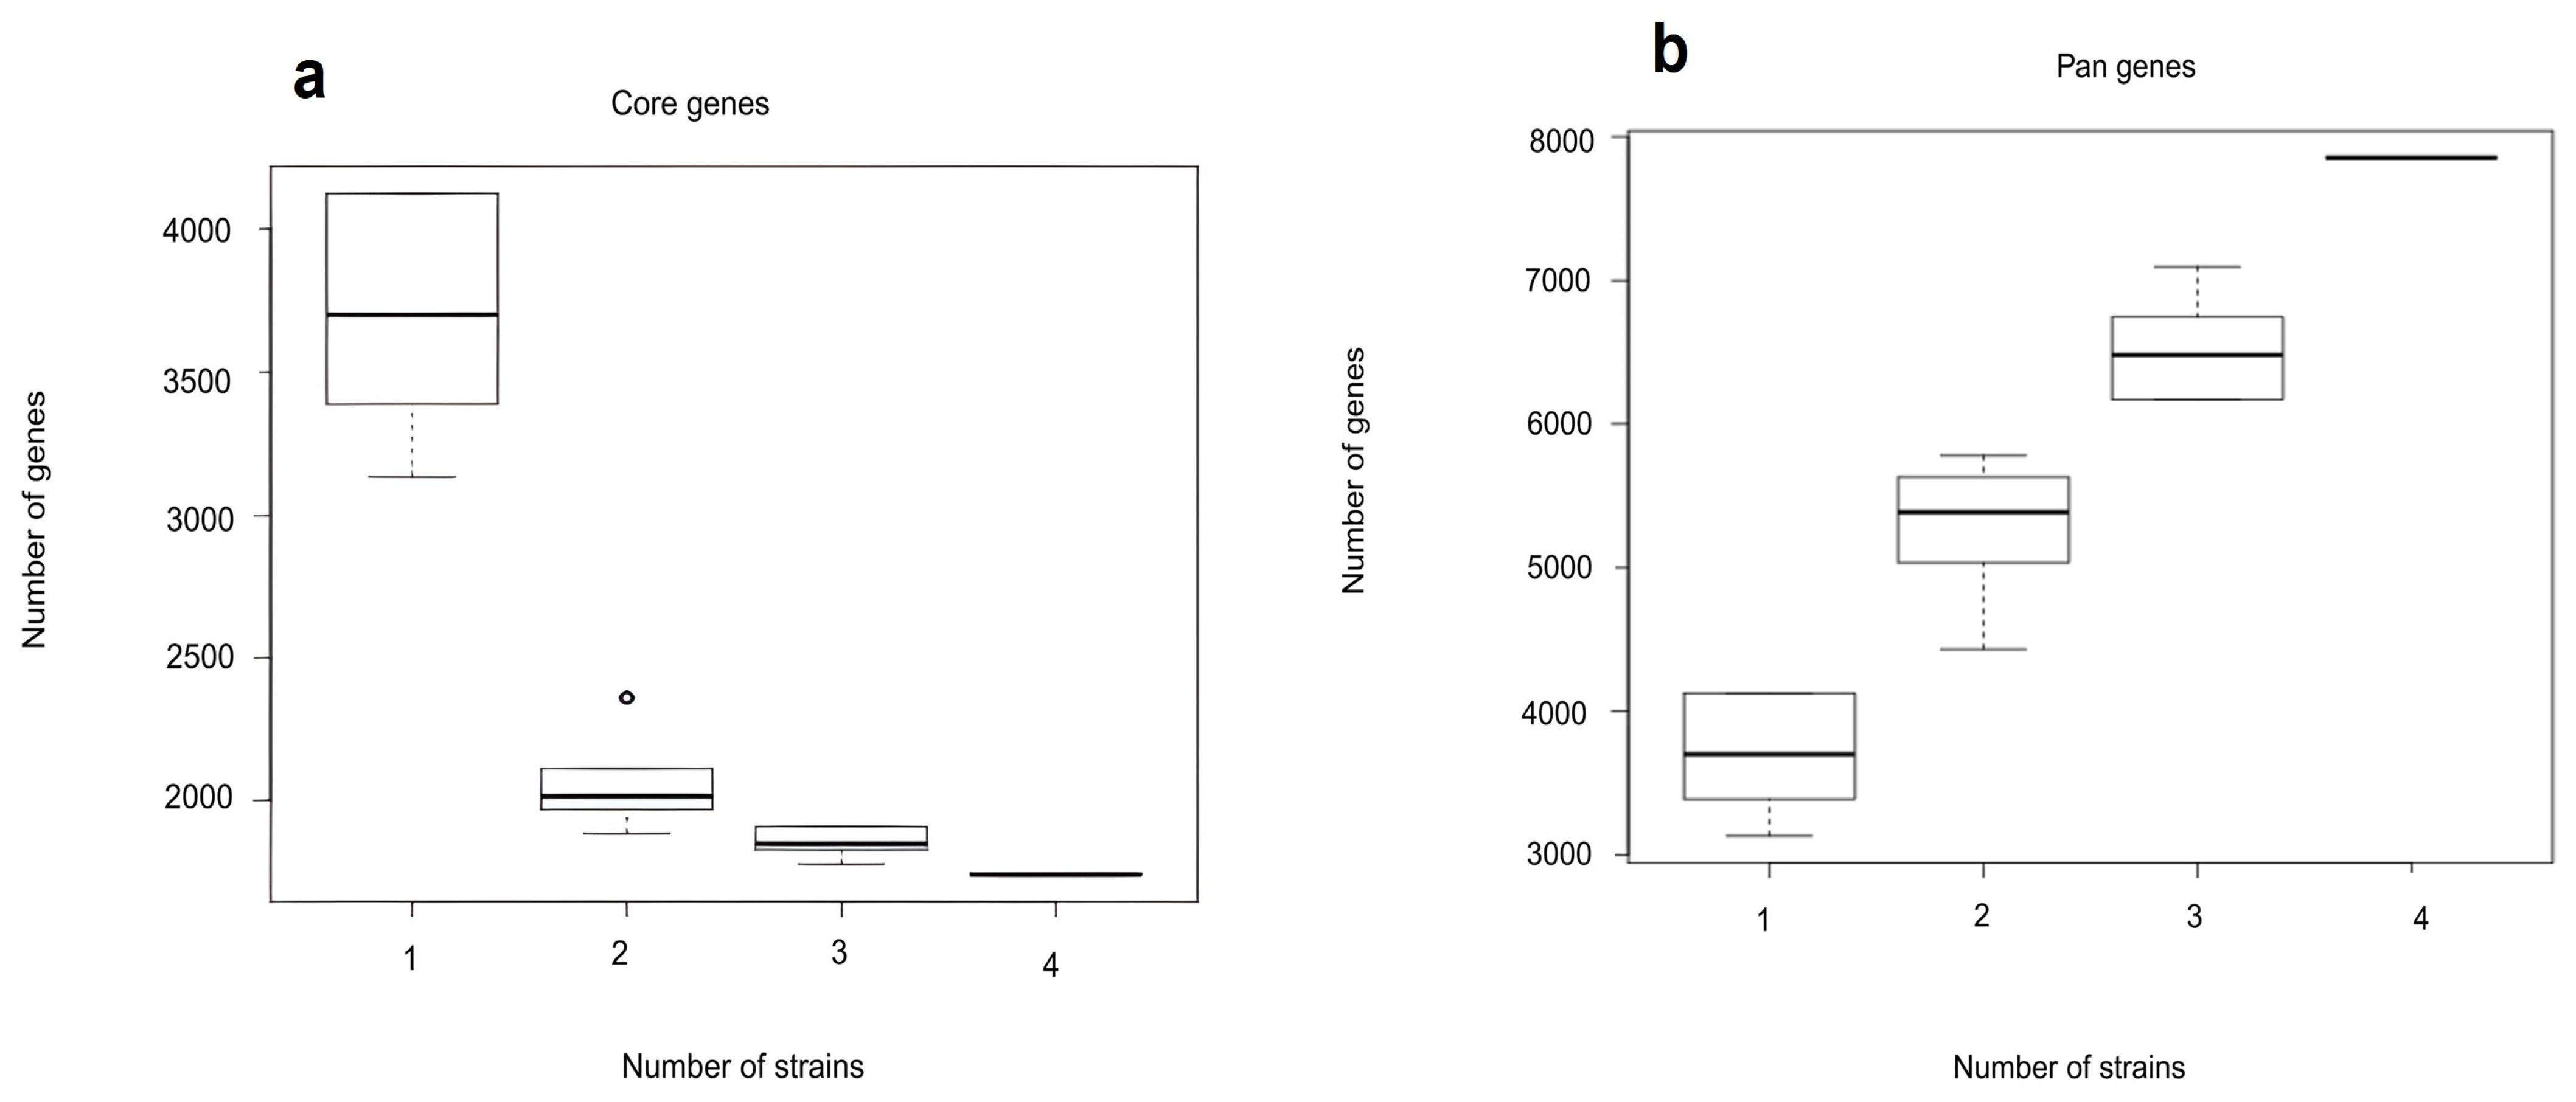
Pangenome analysis was performed to assess the overall genetic diversity of gene repertoire in M. spongiae MI-GT and three Microbulbifer reference strains. Pan-core genome analysis is important to amass molecular evidence to discriminate the diversity of genomes and to explore core, accessory, and unique genes (Figure 7a,b).
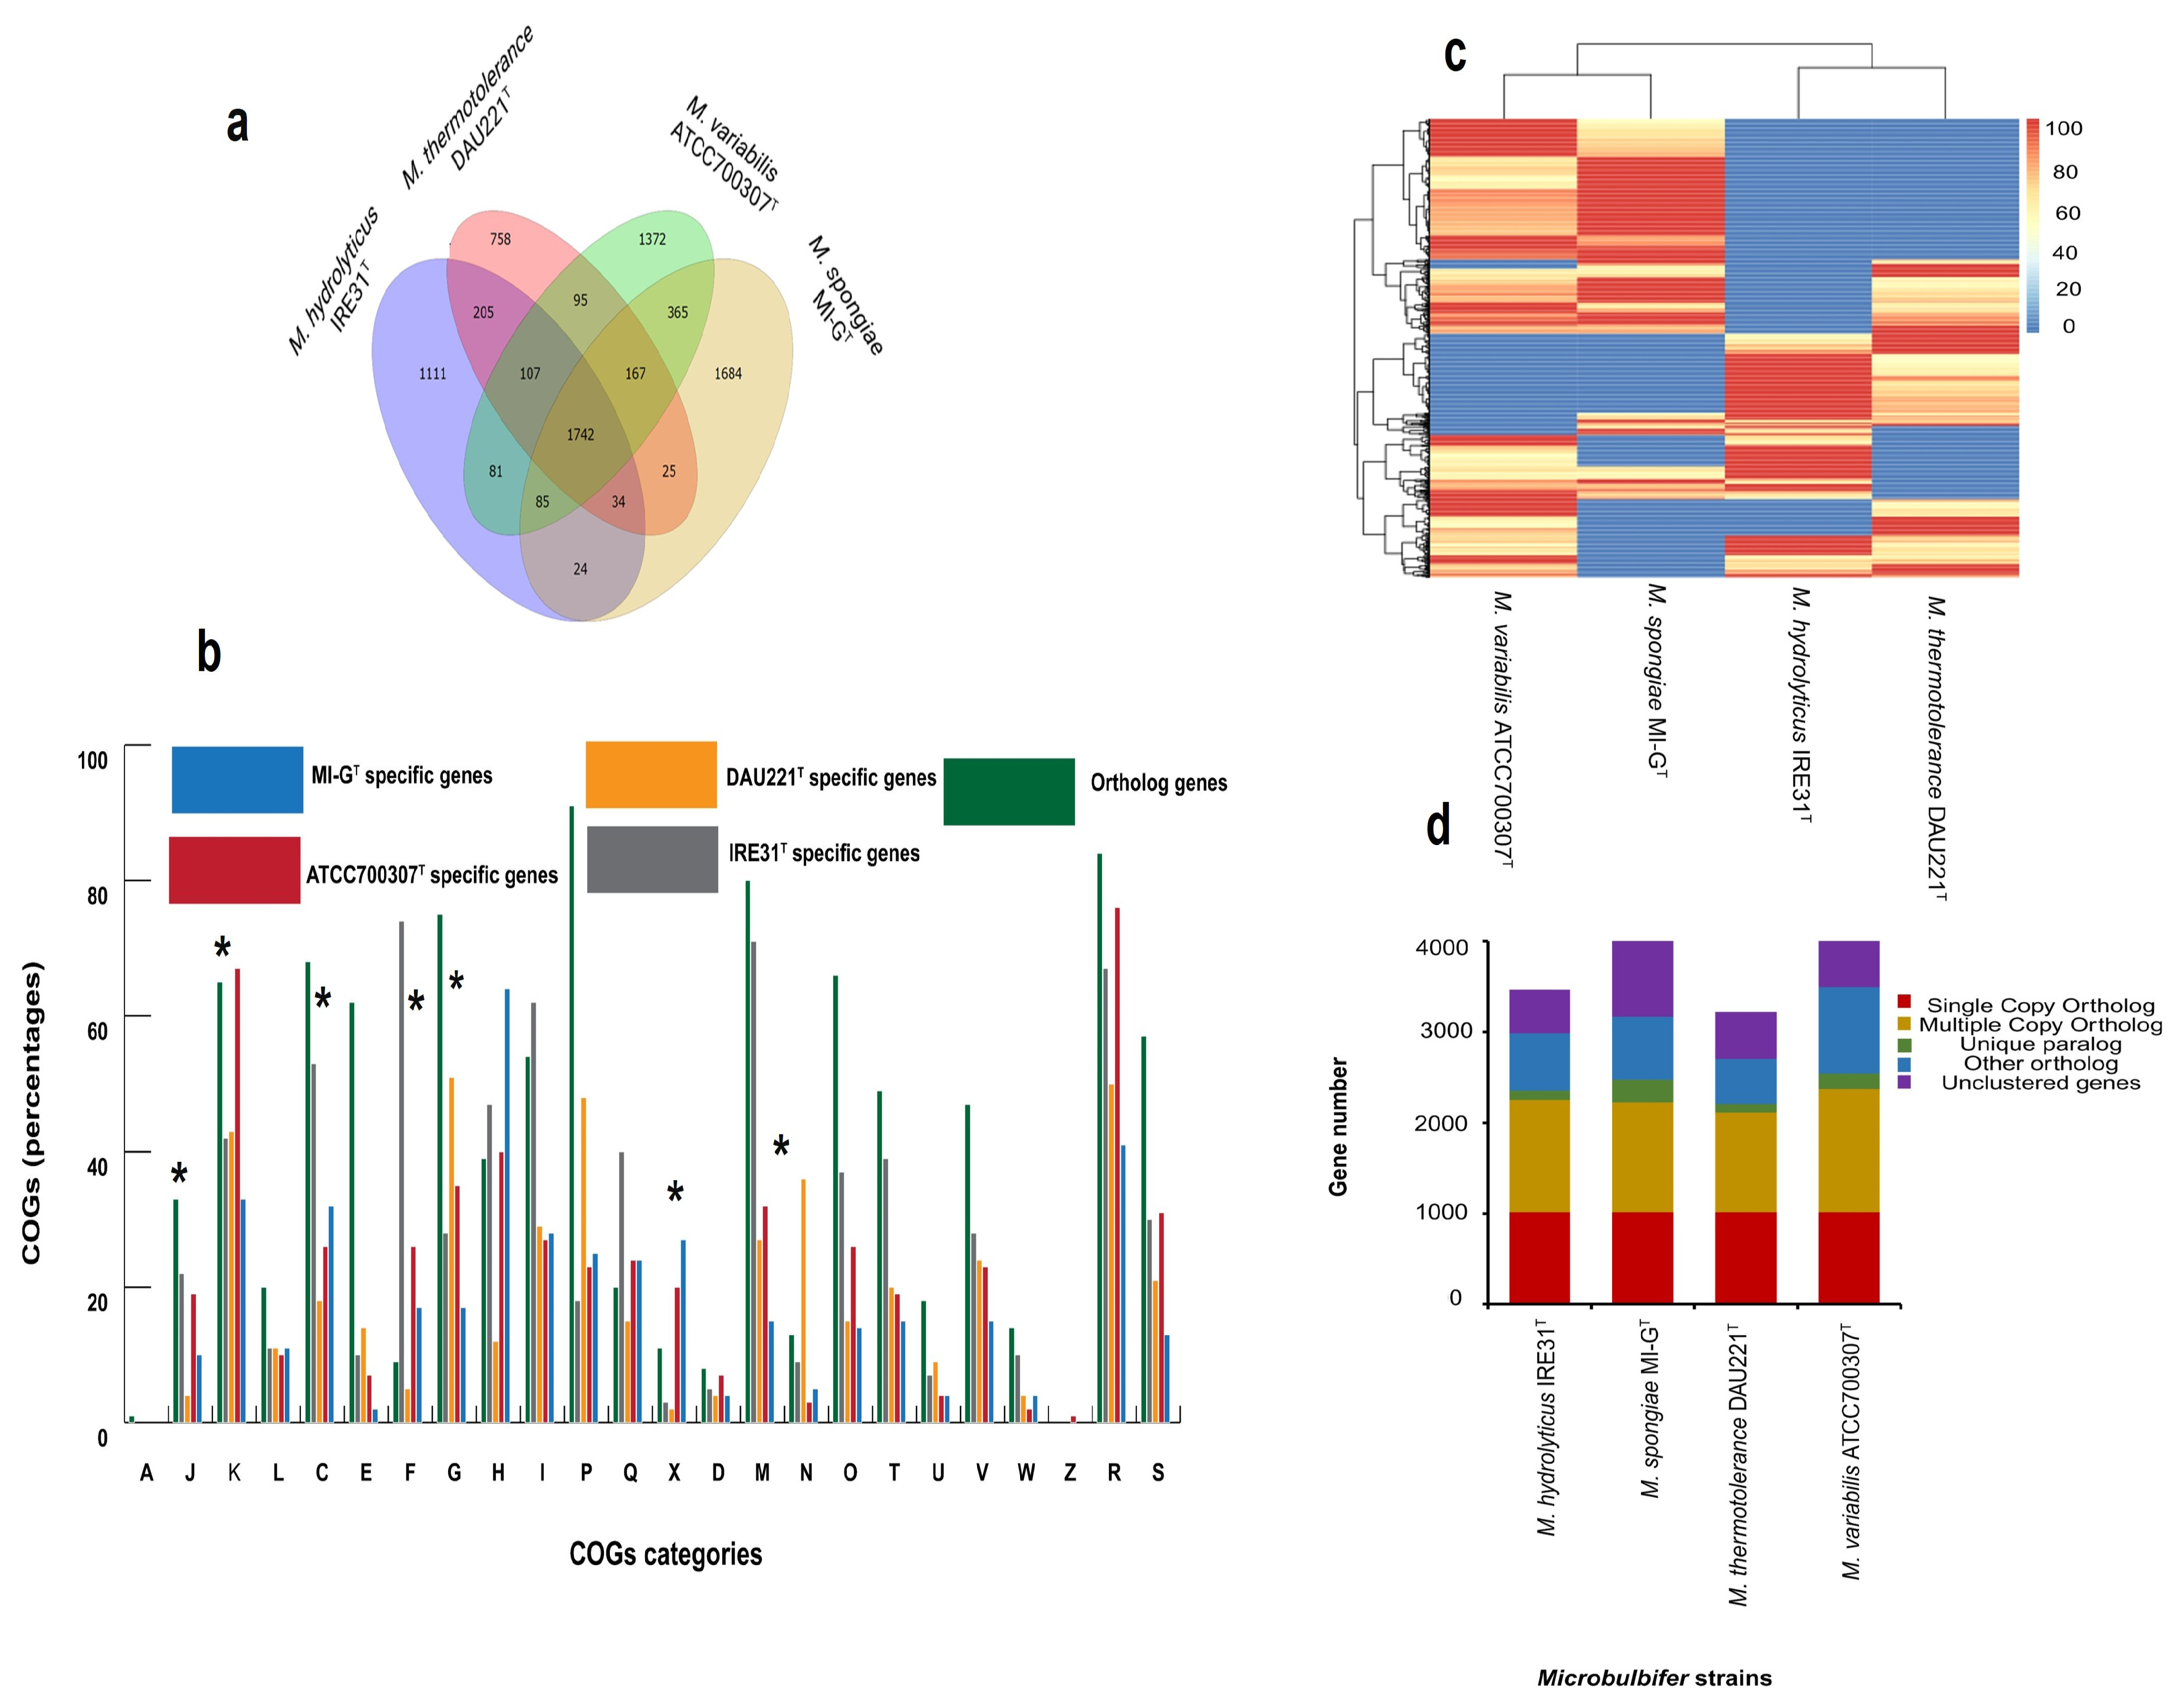
As shown in Figure 8c, the number of dispensable genes varies from 552 to 970, and M. spongiae MI-GT has 773 accessory genes (19.32% of the accessory genome), M. hydrolyticus IRE31T has 552, M. thermotolerance DAU221T has 667, and M. variabilis ATCC700307T has 970 accessory genes, respectively. According to the Venn graph (Figure 8d), the number of multiple-copy orthologs and un-clustered genes was much higher in sponge-associated M. spongiae MI-GT than 3 Microbulbifer reference strains IRE31T, DAU221T, and ATCC 700307T. Venn diagram (Figure 8a) represents unique and shared family gene number: unique gene (unique orthologous cluster) family number varies from 68, 73, 47, and 39 that are specific to Microbulbifer strains MI-GT, IRE31T, DAU221T, and ATCC700307T, respectively. Ortholog analysis led to the identification of genes present in different orthologs in these four Microbulbifer strains. As shown in (Figure 8a), 1742 core conserved genes, 7855 pan genes and 1188 dispensable genes were identified in these four Microbulbifer strains (Figure 8a). As far as the strain-specific genome is concerned, M. spongiae MI-GT has 1879 unique genes, whereas M. hydrolyticus IRE31T has 1144 unique genes, M. thermotolerance DAU221T has 784 unique genes, and M. variabilis ATCC 700307T has 1466 unique genes; the combine total unique genes are 5273 (34.39% of the pangenome); while the number of core genes ranges from 1757 to 1789, and M. spongiae MI-GT has 1781 core genes (46.26% of the core genome) (Figure 8a). As shown in Figure S9. M. spongiae MI-GT has 68 unique family gene numbers, whereas M. hydrolyticus IRE31T and M. thermotolerance DAU221T possess comparatively lower numbers of unique family gene numbers.
Genes of four Microbulbifer strains were functionally classified according to COG-functional classification (Figure 8b; Table S6). Figure S9 indicates COG-functional distribution of gene families in core genome of four Microbulbifer strains. Core genes up to 1742 are conserved in M. spongaie MI-GT and three Microbulbifer strains. Whereas, sponge-associated strain M. spongiae MI-GT has a comparatively larger number of strain-specific genes than three Microbulbifer reference strains ATCC700307T, IRE31T, and DAU221T (Figure 8a). According to our analysis (Table S6 and Figure 8b), there are differences in the functional distribution of genes belonging to different COG-classes in M. spongiae MI-GT and three Microbulbifer reference strains IRE31T, DAU221T, and ATCC700307T. Most obvious difference was noted in the functional-distribution of strain-specific genes belonging to metabolism such as nucleotide transport and metabolism (F), energy production and conversion (C), carbohydrate transport and metabolism (G), coenzyme transport and metabolism (H), lipid transport and metabolism (I), amino acid transport and metabolism (E), inorganic ion transport and metabolism (P), secondary metabolite biosynthesis, transport and catabolism (Q), mobilome: prophages, transposons (X). In cellular system, significant difference was identified in the functional distribution of strain-specific genes in 4-classes i.e., cell cycle control, cell division, chromosome partitioning (D), cell motility (N), cell wall/membrane/envelope biogenesis (M), and signal transduction mechanisms (T), while less significant difference was observed in remaining 6-classes such as posttranslational modification, protein-turnover, chaperones (O), cytoskeleton (Z), function unknown (S), intracellular trafficking, secretion, and vesicular transport (U), defense mechanisms (V) and extracellular structures (W). In information storage and processing system, most pronounced difference in functional distribution of strain-specific genes was observed in COG-classes such as transcription (K), translation, ribosomal structure and biogenesis (J), whereas, in RNA processing and modification (A), replication, recombination and repair (L), difference was decreased in four Microbulbifer strains. Moreover, strain-specific genes associated with category translation, ribosomal structure and biogenesis, transcription, nucleotide transport and metabolism, energy production and conversion, carbohydrate transport and metabolism, and cell motility are lower in sponge-associated strain M. spongiae MI-GT compared to strain-specific genes of three Microbulbifer reference strains (p < 0.05). However, strain-specific genes associated with mobilome, i.e., prophages, transposons, are exceptionally higher in M. spongiae MI-GT, compared to Microbulbifer reference strains (p < 0.05) (Table S6).

3.5. Sponge-Bacteria Metabolic Interaction Indicated by Genome Analysis

Eukaryotic-like proteins (ELPs), such as ankyrin-repeat proteins (ANKs) and tetra-tricopepetide repeat proteins (TPRs), are mostly used for the establishment of host-microbe association in the holobiont concept [59,60,61]. According to this study, we identified one ANK (COG0666) protein in M. spongiae MI-GT and M. thermotolerance DAU221T (Figure 9). M. spongiae MI-GT has 2 members, while free-living M. thermotolerance DAU221T has 3 members of the ANK (COG0666) protein. The other two Microbulbifer reference strains, M. hydrolyticus IRE31T and M. variabilis ATCC700307T, do not possess ankyrin repeat proteins. Tetra-tricopepetide repeat proteins (TPRs) were identified with differential distribution in four Microbulbifer strains. 3 members of each TPR protein (COG4783, COG0457, and COG3118) were identified in M. hydrolyticus IRE31T, while only one member of TPR protein (COG4941) was identified in free-living M. thermotolerance DAU221T. Moreover, 6 and 1 members of TPR proteins (COG4976 and COG4700) were observed only in M. variabilis ATCC700307T. However, we did not identify any TPR protein specific to M. spongiae MI-GT. It seems that most of the TPR proteins may be conserved in 4 Microbulbifer strains. According to genome analysis, vitamin B12 (cobalamin), vitamin B6 (pyridoxine), vitamin B1 (thiamine), vitamin B7 (biotin), and vitamin B2 (riboflavin) were identified with different numbers of repeats per vitamin in M. spongiae MI-GT, M. hydrolyticus IRE31T, M. thermotolerance DAU221T, and M. variabilis ATCC700307T. Fourteen type VI secretion system proteins were detected, and no type-III secretion system protein was identified (Table S7; Figure 9). Ten type-III secretion system proteins were observed only in the free-living strain M. thermotolerance DAU221T, and no protein of this system was present in M. spongiae MI-GT, M. hydrolyticus IRE31T, and M. variabilis ATCC700307T (Table S7).

4. Discussion

In this study, we investigate the genomic diversity, metabolic characteristics, and functional evolution of sponge-associated strain M. spongiae MI-GT by performing whole-genome sequencing and comparative genomic analysis. The genome size of M. spongiae MI-GT (4,478,124 bp) is slightly larger than the genome sizes of free-living strains M. hydrolyticus IRE31T (4,209,307 bp) and M. thermotolerance DAU221T (3,938,396 bp) (Table 1). Moreover, M. spongiae MI-GT had a smaller GC content than free-living strains IRE31T and DAU221T. Reduced genome size and low GC content are the main characteristics of obligate intracellular symbionts [62]. Our results indicate that sponge-associated M. spongiae MI-GT is probably a facultative sponge-symbiont [63]. M. spongiae MI-GT may have a free-living stage and therefore retain the necessary genes for both free-living and host-associated lifestyles. A higher number of pseudogenes in the genome of M. spongiae MI-GT suggests that this bacterium may possibly have undergone a process of pseudogenization as an adaptation to its host environment. This evolutionary strategy highlights how microorganisms can rapidly adjust to specific niches through genomic changes, and understanding such adaptations contributes to our knowledge of the evolution of new bacterial species [64]. This suggestion is supported by the finding that these Microbulbifer strains occupy very divergent lineages (Figure 5), and this diversity provides important clues about their adaptation to different environments [24,65]. Meanwhile, a variety of proteins related to oxidative stress, osmotic stress, resistance to antimicrobial drugs, and tolerance to biotoxic metals were identified in the genomes of M. spongiae MI-GT and three Microbulbifer reference strains (Table S1; Figure 4). Most of the proteins related to these stress response factors are conserved in four Microbulbifer strains. The identification of eukaryotic-like proteins (AR and TPR), vitamins, and type VI secretion system proteins in sponge-associated M. spongiae MI-GT and three Microbulbifer reference strains suggests that genetic material may have been transferred between different species of Microbulbifer bacteria, leading to the acquisition of new genetic traits [61,66,67]. This indicates the dynamic nature of bacterial evolution and adaptation to different environments through genetic exchange mechanisms [61,66,67].
Functional genomic analysis reveals that the M. spongiae MI-GT genome is enriched in genes and metabolic pathways for carbohydrate metabolism and stress response (Tables S1 and S5). However, M. spongiae MI-GT possesses the least number of CAZymes when compared to three Microbulbifer reference strains (Figure 3a). Among the five CAZyme classes that were observed in the genome of M. spongiae MI-GT, GHs (glycoside hydrolases) were predominant over the other types of CAZymes, and the PL (polysaccharide lyases) were the least abundant. This supports previous findings that a higher number of GHs compared to other classes of CAZymes were found in the sponge microbiomes [68,69]. GHs have been classified into various families based on their amino acid sequences and structural similarities, as shown in Table S5. GHs are generally involved in the hydrolysis of glycosidic linkages between monosaccharides, which can lead to the release of simple sugars and oligosaccharides. Polysaccharide lyases (PLs) degrade polysaccharides by cleaving glycosidic bonds through an elimination mechanism rather than hydrolysis. PLs are usually involved in the breakdown of various complex carbohydrates such as pectin’s, and alginates, facilitating their utilization by microbes and plants [70]. The absence of PLs in M. spongiae MI-GT suggests that sponge-associated bacteria may not require PLs for carbohydrate breakdown, possibly because their nutrient source differs from those of free-living or other host-associated bacteria [71,72]. M. spongiae MI-GT exhibits a higher number of genes associated with pyruvate metabolism, butanoate metabolism, propanoate metabolism, glyoxylate and dicarboxylate metabolism, amino sugar and nucleotide sugar metabolism, and citrate cycle (TCA) pathways compared to other carbohydrate metabolic pathways (Figure 3b). Genes encoding proteins required for major reactions in the glycolysis and pentose phosphate pathway, the tricarboxylic acid (TCA) cycle and oxidative phosphorylation have been identified in the genomes of sponge-associated microorganisms [73,74], whereas, in M. spongiae MI-GT, the number of these genes are lower compared to genes associated with other pathways such as pyruvate metabolism, butanoate metabolism, propanoate metabolism, glyoxylate and dicarboxylate metabolism, suggesting that M. spongiae MI-GT may use a wide range of sugar and carbon compounds to meet its nutritional needs [10].
It is known that stress-related genes play a significant role in the survival of bacterial species under stressed environmental conditions [75]. However, several proteins sodC, katA, catA, bcp, trmH, cspA (oxidative stress response), betA, betT, mnhE, mnhF, nhaB (osmotic stress response), and dsbG, ampG, amiD_2, czcA, czcB, and corA (tolerance to biotoxic metals) (Figure 4a–d), are absent in M. spongiae MI-GT but present in three Microbulbifer reference strains, suggesting that sponge-associated strain M. spongiae MI-GT may be more tolerant to environmental stress than Microbulbifer reference strains [76]. Moreover, the absence of these proteins might indicate their evolutionary divergence from Microbulbifer reference strains, because the sponge host may provide a stable environment for M. spongiae MI-GT that mitigates the need for such stress response-related factors [77]. For example, periplasmic sodC (superoxide dismutase) is absent in M. spongiae MI-GT, only identified in the free-living strain M. hydrolyticus IRE31T. SodC is a Cu/Zn periplasmic superoxide dismutase protein that is produced by bacteria to combat toxic superoxide radicals to H2O2 to O2 through the alternate oxidation and reduction of the copper ion in the active site. This suggests that sponge-associated M. spongiae MI-GT residing in the sponge host environment may not encounter toxic superoxide radicals [63]. Similarly, catalase genes katA and catA that are required for hydrogen peroxide (H2O2) resistance are also absent in M. spongiae MI-GT, but present in free-living strains M. hydrolyticus IRE31T and M. thermotolerance DAU221T, suggesting that free-living Microbulbifer strains may encounter more reactive oxygen species (ROS) than the sponge-associated strain M. spongiae MI-GT [78,79]. Moreover, glycine, betaine, and choline genes betA, betB, betT, and Na+ pump associated genes mrpE, mnhE, mnhF and nhaB that are involved in the response to osmotic stress are also absent in M. spongiae MI-GT, but present in three Microbulbifer reference strains, indicating that sponge-associated strain M. spongiae MI-GT occupies a unique niche where osmotic stress is not a significant challenge [80].
Functional analysis of COGs, KEGGs, and GOs in the genomes of four Microbulbifer strains reveals significant variations in their cellular and informational functions, which may result from various evolutionary pressures such as nutrient availability, environmental conditions, and interactions with their host [81]. It is known that the interplay between genetic drift, mutational bias towards deletion, accumulation of pseudogenes, and mobile gene elements plays a pivotal role in shaping bacterial genome size and gene content. These factors are able to influence bacterial evolution, genetic diversity, and genomic characteristics of bacterial species [82,83,84,85,86]. In this study, only one plasmid was identified in the M. spongiae MI-GT strain, whereas three Microbulbifer reference strains do not have any plasmids. Plasmids are genetic elements for colonization and replication, and they are believed to be a major driving force of bacterial evolution as they can migrate between populations to induce lateral DNA transfer [81]. Oliveira et al. highlight the importance of plasmids in transferring genetic traits putatively involved in bacterial symbiont adaptation and sponge-bacteria interaction [87]. Horizontal plasmid transfer events in the sponge microbiome may enable the symbiotic bacteria to recruit a range of accessory genes relevant to signaling, stress-responsive factors, and production of amino acids that may contribute to the establishment of a mutualistic relationship between the sponge and bacteria [88,89,90].
Higher number of mobile gene elements (MGEs) have already been reported in the genome of sponge-associated bacteria and plays a critical role in their evolution and metabolic interaction with the host organisms [18,73,91]. It seems that genetic transfer by MGEs in sponge-associated strain M. spongiae MI-GT is an indispensable phenomenon for this bacterium to adapt sponge-host environment [81]. Genomic islands (GIs) are typically acquired through horizontal gene transfer (HGT) and play a role in enhancing the survival of bacteria in diverse environments [92]. GIs are important components of bacterial genomes that contribute significantly to their evolution and adaptation [81]. A higher number of GIs detected in M. spongiae MI-GT (Figure 4a) indicates the possible role of GIs in its evolution in order to adapt to its sponge host environment. Meanwhile, M. spongiae MI-GT possesses a comparatively higher number of insertion sequence (IS) elements (72 belonging to eleven IS families) than three Microbulbifer reference strains (1–19) (Figure 4b). Our results are consistent with previous findings that sponge-associated bacteria contain almost three to five times of ISs elements compared to free-living or other host-associated bacteria [18]. Certain IS families, such as IS256 and IS66, have been found to be exclusively associated with sponge-associated bacteria [93]. IS256 is also a significant element in Enterococcus faecalis and E. faecium, closely linked to their antimicrobial resistance traits [94]. IS66 is an important IS element characterized by three ORFs (i.e., a transposase and two regulatory genes), influencing the genetic landscape and contributing to resistance to environmental stress [95]. The presence of a higher number of ISs in sponge-associated strain M. spongiae MI-GT may be linked to its adaptation to the sponge-host, as their transposition can result in gene inactivation and modulation of surrounding gene expression. Such genetic variability may enhance the bacteria’s capacity for survival and interaction within the sponge-host environment [96]. In addition to GIs and IS, clustered regularly interspaced short palindromic repeats (CRISPRs) were also identified only in M. spongiae MI-GT and M. thermotolerance DAU221T, while the other two strains do not possess any CRISPR sequences. CRISPR-Cas’s system is a type of adaptive immunity in bacteria, which protects them against invading genetic elements [97]. The presence of CRISPR-Cas system in M. spongiae MI-GT suggests that this bacterium could trigger defence mechanisms against the invasion of exogenous DNA for maintaining the stability of genetic architecture [98]. Interestingly, the number of unique paralogs is quite higher in M. spongiae MI-GT compared to the three Microbulbifer reference strains (Figure 8d). A paralog is a type of gene that arises through a gene duplication event within a genome. After duplication, these genes can evolve independently, leading to the potential acquisition of new functions within organisms. Unique paralog genes are critical in the evolutionary process, influencing both genetic diversity and emergence of new species [99]. Similarly, the number of dispensable genes is also higher in M. spongiae MI-GT than in free-living strains M. thermotolerance DAU221T and M. hydrolyticus IRE31T. Tong et al. found that dispensable genes that appear to be non-functional under normal environmental conditions become crucial when bacteria face stressful situations [100]. It can be suggested that M. spongiae MI-GT may use dispensable genes to combat environmental stress in a challenging marine environment. Moreover, the presence of a few numbers of genes related to cell motility in M. sponge MI-GT compared to three Microbulbifer reference strains also indicates a sponge-associated lifestyle of M. spongiae MI-GT. The loss of motility genes in sponge-associated bacteria has previously been reported and hypothesized to be a cause of a mutualistic lifestyle and vertical transmission of symbiotic bacteria [101,102].
Sponge-associated strain M. spongiae MI-GT possesses a higher number of strain-specific genes and unique family number genes compared to three Microbulbifer reference strains (Figure 8a and Figure S9a), which is consistent with previous findings that sponge-associated bacteria possess a comparatively higher number of strain-specific genes than other strains of the same genus isolated from other habitats [18,103]. There are differences in the functional distribution of genes belonging to different COG-categories in four Microbulbifer strains (Table S5; Figure 8b). Strain-specific genes associated with functional-category translation, ribosomal structure and biogenesis, transcription, nucleotide transport and metabolism, energy production and conversion, carbohydrate transport and metabolism, and cell motility are lower compared to those of three Microbulbifer reference strains. It is known that sponge-associated bacteria are engaged in nutritional exchange with their sponge-hosts [1,104], and have evolved metabolic dependencies on their sponge-hosts [27]. Thus, it can be hypothesized that sponge-associated strain M. spongiae MI-GT may acquire nutrients and energy from its sponge host thus possess a lower number of strain-specific genes related to metabolism and energy production compared to free-living strains.
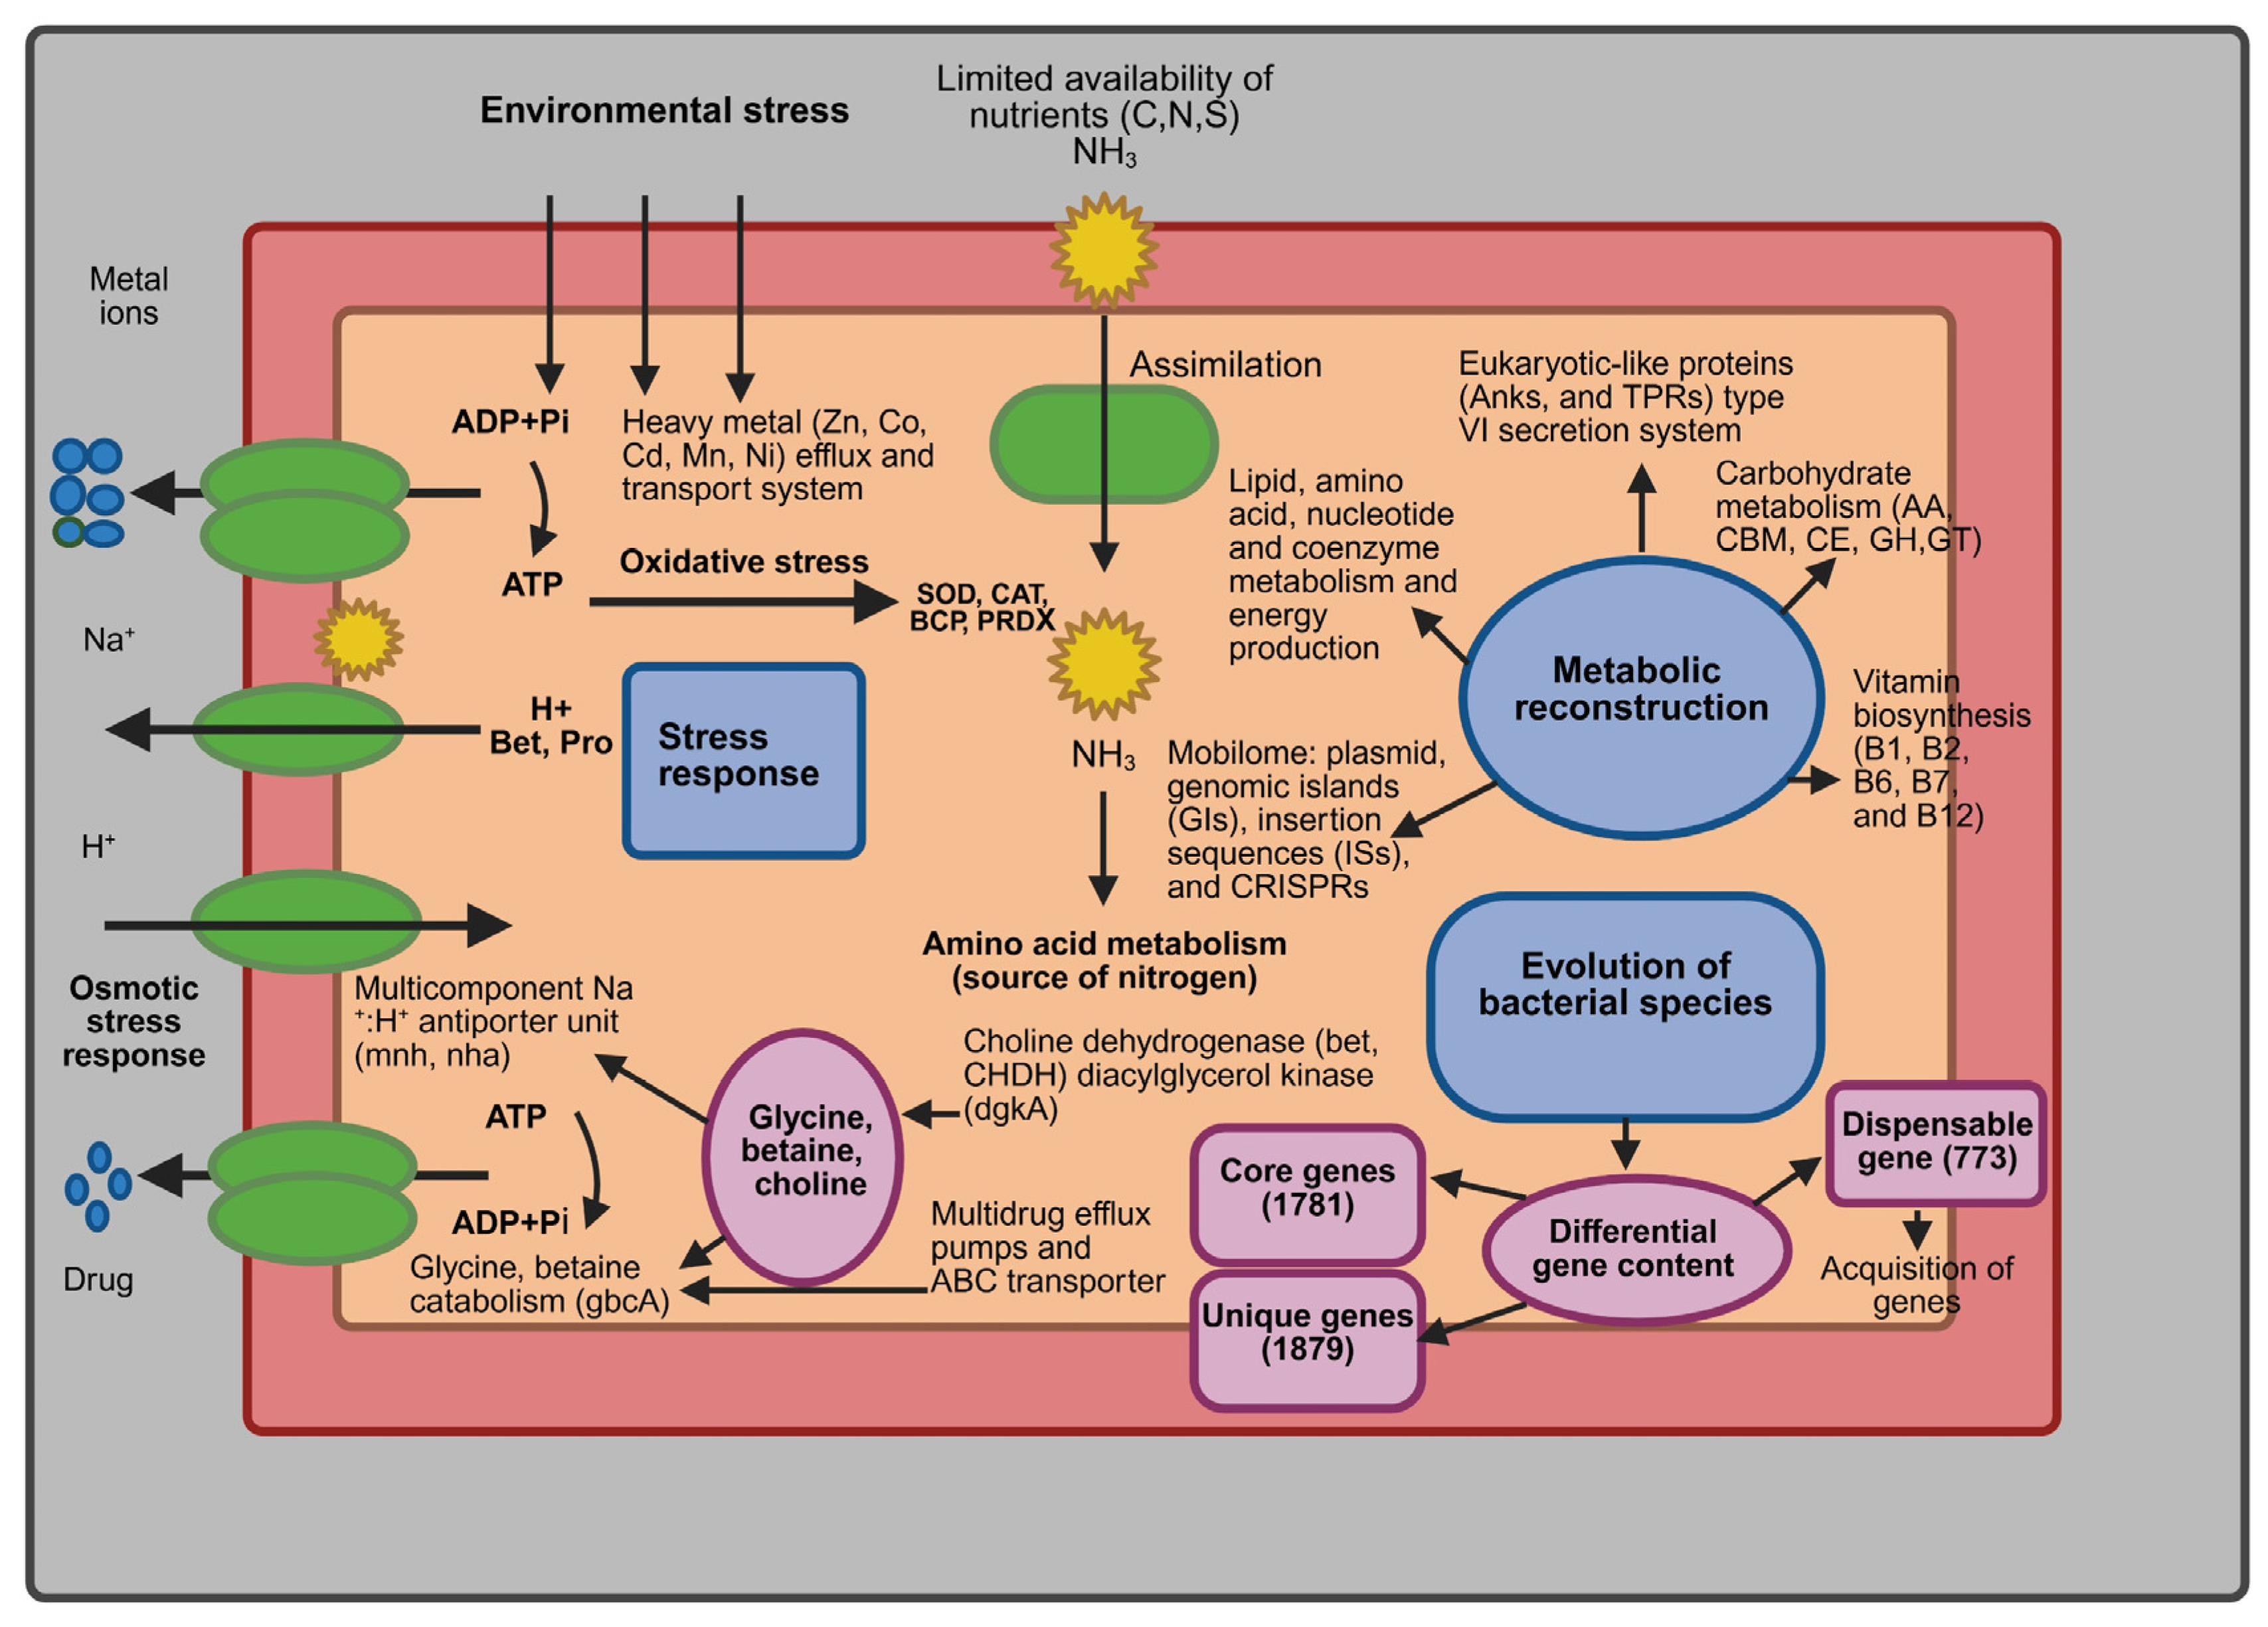
The genome and comparative genomic analysis of M. spongiae MI-GT with three Microbulbifer reference strains provide unique insights into the genomic repertoire of a given phylogenetic taxon and functional metabolic distribution. As summarized in Figure 10, sponge-associated strain M. spongiae MI-GT exhibits gene characteristics related to its adaptation to the sponge host habitat. Genomic strategies that enable M. spongiae MI-GT to adapt a sponge-host associated lifestyle include: the combined role of MGE-mediated gene transfer and reduction in metabolic, energy production, motility, certain stress responsive-related genes, and the acquisition of unique strain-specific genes in M. spongiae MI-GT offer new insights into bacterial survival in the sponge-host environment.
Previous analysis of sponge-associated bacteria is also based on metagenomic binning [105,106]. In this study, all the findings are based on genomic sequencing data, which makes our results sound robust than metagenomic binning data. However, the genome-based analyses are theoretical and require experimental validation to confirm the functional roles of identified genes or proteins. In addition, functional genomic characterization of sponge-associated bacteria M. spongiae MI-GT presents several inherent limitations that can affect the accuracy and comprehensiveness of our findings, because the interpretation of genomic data heavily relies on existing databases and annotation tools, which may not include novel genes or functions unique to M. spongiae MI-GT. Thus, the major limitation is that genome sequences may contain unannotated regions or misannotations, leading to gaps in understanding the full metabolic and functional genomic characteristics of M. spongiae MI-GT. Moreover, the suggestions of the functional genomic characteristics based on genomic analysis need to be further elucidated in the near future through genetic expression, gene knockout, and specific protein characterization experiments.

5. Conclusions

The genus Microbulbifer is an exemplary group of marine bacteria that showcases remarkable adaptability to diverse environments. This study investigates the genomic diversity, functional evolution, and metabolic characteristics of M. spongiae MI-GT by employing comprehensive genomic and comparative genomic approaches. Large genome size and lower GC content suggest that M. spongiae MI-GT may be a facultative sponge-symbiont. Comparative genomic analysis indicates that there are differences in the functional distribution of genes belonging to different COG-classes among four Microbulbifer strains. We further identified that M. spongiae MI-GT possesses a higher number of strain-specific genes than reference strains, suggesting that acquisition of unique genes is critical for this bacterium to adapt sponge-host environment. Moreover, strain-specific genes related to metabolism and energy production are significantly lower in M. spongiae MI-GT, suggesting that this bacterium may have evolved metabolic dependency on its sponge-host. The loss of motility genes in M. spongiae MI-GT is also a characteristic of a mutualistic lifestyle or sponge-associated lifestyle. Interestingly, superoxide dismutase, catalase, glycine, betaine, and choline, Na+ pump, and tolerance to biotoxic metal proteins related genes are absent in M. spongiae MI-GT but present in three reference Microbulbifer strains, indicating that the sponge-associated lifestyle of M. spongiae MI-GT enables this bacterium to withstand environmental stress more effectively than reference Microbulbifer strains. Finally, the significantly larger abundance of mobile genetic elements (MGE) is the most distinctive feature between sponge-associated strain M. spongiae MI-GT and three Microbulbifer reference strains. This could be linked to the sponge-associated lifestyle of M. spongiae MI-GT. Our results suggest a variety of ways M. spongiae MI-GT have adapted to survive in the sponge-host environment. Although key sponge-host-associated traits exist in M. spongiae MI-GT, our analysis suggests that this bacterium also carries its own unique characteristics that reflect its evolution towards a sponge-associated lifestyle.

Supplementary Materials

The following supporting information can be downloaded at: https://www.mdpi.com/article/10.3390/microorganisms13081940/s1. Figure S1: M. spongiae MI-GT DNA purity and integrity were assessed by 0.5% agarose gel electrophoresis. Figure S2: Workflow of the pipeline outlines the steps involved in processing, annotating, and analyzing the genome of M. spongiae MI-GT. Figure S3: Proportions of genes annotated in nine databases; Figure S4: COG functional distribution of gene families in genome of M. spongiae MI-GT, and three reference Microbulbifer strains M. hydrolyticus IRE31T, M. thermotolerance DAU221T, and M. variabilis ATCC700307T; Figure S5: KEGG functional distribution of gene families in genome of M. spongiae MI-GT, and three Microbulbifer reference strains M. hydrolyticus IRE31T, M. thermotolerance DAU221T, and M. variabilis ATCC700307T; Figure S6: GO functional distribution of gene families in genome of M. spongiae MI-GT, and three Microbulbifer reference strains M. hydrolyticus IRE31T, M. thermotolerance DAU221T, and M. variabilis ATCC700307T; Figure S7: Computational identification and visualization of genomic islands (GIs) in (a) M. spongiae MI-GT and three Microbulbifer reference strains (b) M. hydrolyticus IRE31T, (c) M. thermotolerance DAU221T, and (d) M. variabilis ATCC700307T; Figure S8: Neighbor-joining (NL) tree based on single-copy orthologous protein sequences of M. spongiae MI-GT and three Microbulbifer reference strains. Amino acid sequences were identified using Proteinortho version 6.0 software with cutoff criteria of e-value 1e-5, sequence identity 50%, and sequence coverage 50%. The NL tree was calculated with 1000 bootstrap replicates. Bar, 0.02 represents substitution per amino acid sequence; Figure S9: Comparative analysis of M. spongiae MI-GT with three reference Microbulbifer strains (M. hydrolyticus IRE31T, M. thermotolerance DAU221T, and M. variabilis ATCC700307T). (a) Venn diagram showing shared and unique gene family numbers among Microbulbifer strains: M. spongiae MI-GT, M. hydrolyticus IRE-31T, M. variabilis ATCC700307T, and M. thermotolerance DAU221T. (b) COG functional distribution of gene families in the core genome of four Microbulbifer strains; Table S1: Stress-responsive genes and their respective annotations in the genome of M. spongiae MI-GT and three Microbulbifer reference strains; Table S2: Genomic Island (GIs) statistics in M. spongiae MI-GT and three Microbulbifer reference strains; Table S3: Insertion sequence (ISs) element statistics in M. spongiae MI-GT and three Microbulbifer reference strains; Table S4: Predictive statistics and description of CRISPR in M. spongiae MI-GT and three Microbulbifer reference strains; Table S5. Classification of putative carbohydrate-Active enzymes, corresponding coding genes and (annotation), present in the genome of M. spongiae MI-GT and three Microbulbifer reference strains; Table S6: Comparison of COG functional classes of M. spongiae MI-GT with three Microbulbifer reference strains; Table S7: Comparison of metabolic features of M. spongiae MI-GT with three Microbulbifer reference strains.

Author Contributions

N.I.: Conceptualization, Methodology, Software, Validation, Formal analysis, Investigation, Data curation, writing—original draft, Writing—review and editing, Visualization. Q.S.: Conceptualization, Methodology, Investigation. M.I.: Samples collection, Writing—review and editing. Z.L.: Conceptualization, Resources, Supervision, funding acquisition, Writing—review and editing. All authors have read and agreed to the published version of the manuscript.

Funding

This work was supported by the Shanghai Municipal Science and Technology Major Project, National Natural Science Foundation of China (Grant No. 42176146, 31861143020), the Science and Technology Innovation Special Project, Sanya, China (2022KJCX63, Project of Sanya Yazhou Bay Science and Technology City (SKJC-JYRC-2024-51) and Israel Science Foundation (Grant No. 2577/18). We acknowledge the Center for High Performance Computing at Shanghai Jiao Tong University for computation support.

Institutional Review Board Statement

Not applicable.

Informed Consent Statement

Not applicable.

Data Availability Statement

The GenBank (https://www.ncbi.nlm.nih.gov/datasets/genome/GCF_030440425.1, accessed on 31 May 2022) accession number of the whole-genome sequence of M. spongiae MI-GT is CP098023.1, CP098024.1 for the chromosome and plasmid, respectively.

Conflicts of Interest

The authors declare that they have no known competing financial interests or personal relationships that could have appeared to influence the work reported in this paper.

References

  1. Pita, L.; Rix, L.; Slaby, B.M.; Franke, A.; Hentschel, U. The sponge holobiont in a changing ocean: From microbes to ecosystems. Microbiome 2018, 6, 46. [Google Scholar] [CrossRef]
  2. Bell, J.J.; Strano, F.; Broadribb, M.; Wood, G.; Harris, B.; Resende, A.C.; Novak, E.; Micaroni, V. Sponge functional roles in a changing world. Adv. Mar. Biol. 2023, 95, 27–89. [Google Scholar] [PubMed]
  3. Beazley, L.I.; Kenchington, E.L.; Murillo, F.J.; Sacau, M.d.M. Deep-sea sponge grounds enhance diversity and abundance of epibenthic megafauna in the Northwest Atlantic. ICES J. Mar. Sci. 2013, 70, 1471–1490. [Google Scholar] [CrossRef]
  4. Webster, N.S.; Thomas, T. The Sponge Hologenome. mBio 2016, 7. [Google Scholar] [CrossRef] [PubMed]
  5. Bordenstein, S.R.; Theis, K.R. Host Biology in Light of the Microbiome: Ten Principles of Holobionts and Hologenomes. PLoS Biol. 2015, 13, e1002226. [Google Scholar] [CrossRef]
  6. Easson, C.; Thacker, R. Phylogenetic signal in the community structure of host-specific microbiomes of tropical marine sponges. Front. Microbiol. 2014, 5, 532. [Google Scholar] [CrossRef]
  7. Rix, L.; Ribes, M.; Coma, R.; Jahn, M.T.; de Goeij, J.M.; van Oevelen, D.; Escrig, S.; Meibom, A.; Hentschel, U. Heterotrophy in the earliest gut: A single-cell view of heterotrophic carbon and nitrogen assimilation in sponge-microbe symbioses. ISME J. 2020, 14, 2554–2567. [Google Scholar] [CrossRef] [PubMed]
  8. Moeller, F.U.; Webster, N.S.; Herbold, C.W.; Behnam, F.; Domman, D.; Albertsen, M.; Mooshammer, M.; Markert, S.; Turaev, D.; Becher, D.; et al. Characterization of a thaumarchaeal symbiont that drives incomplete nitrification in the tropical sponge Ianthella basta. Environ. Microbiol. 2019, 21, 3831–3854. [Google Scholar] [CrossRef]
  9. Engelberts, J.P.; Robbins, S.J.; de Goeij, J.M.; Aranda, M.; Bell, S.C.; Webster, N.S. Characterization of a sponge microbiome using an integrative genome-centric approach. ISME J. 2020, 14, 1100–1110. [Google Scholar] [CrossRef]
  10. Hentschel, U.; Piel, J.; Degnan, S.M.; Taylor, M.W. Genomic insights into the marine sponge microbiome. Nat. Rev. Microbiol. 2012, 10, 641–654. [Google Scholar] [CrossRef]
  11. Eastman, A.W.; Heinrichs, D.E.; Yuan, Z.-C. Comparative and genetic analysis of the four sequenced Paenibacillus polymyxa genomes reveals a diverse metabolism and conservation of genes relevant to plant-growth promotion and competitiveness. BMC Genom. 2014, 15, 851. [Google Scholar] [CrossRef] [PubMed]
  12. Steiner, L.X.; Wiese, J.; Rahn, T.; Borchert, E.; Slaby, B.M.; Hentschel, U. Maribacter halichondriae sp. nov. isolated from the marine sponge Halichondria panicea, displays features of a sponge-associated life style. Antonie Van Leeuwenhoek 2024, 117, 56. [Google Scholar] [CrossRef]
  13. Yang, B.; Yue, Y.; Chen, Y.; Ding, M.; Li, B.; Wang, L.; Wang, Q.; Stanton, C.; Ross, R.P.; Zhao, J.; et al. Lactobacillus plantarum CCFM1143 Alleviates Chronic Diarrhea via Inflammation Regulation and Gut Microbiota Modulation: A Double-Blind, Randomized, Placebo-Controlled Study. Front. Immunol. 2021, 12, 746585. [Google Scholar] [CrossRef]
  14. Slaby, B.M.; Hackl, T.; Horn, H.; Bayer, K.; Hentschel, U. Metagenomic binning of a marine sponge microbiome reveals unity in defense but metabolic specialization. ISME J. 2017, 11, 2465–2478. [Google Scholar] [CrossRef]
  15. Qin, X.; Wang, H.; Miao, C.; Yang, X.; Zhang, Y.; Feng, J.; Forsythe, S.J.; Man, C.; Jiang, Y. Comparative genomics reveals environmental adaptation differences between Cronobacter species. Food Res. Int. 2021, 147, 110541. [Google Scholar] [CrossRef]
  16. Vale, F.F.; Lehours, P.; Yamaoka, Y. Editorial: The Role of Mobile Genetic Elements in Bacterial Evolution and Their Adaptability. Front. Microbiol. 2022, 13, 849667. [Google Scholar] [CrossRef]
  17. Jahn, M.T.; Lachnit, T.; Markert, S.M.; Stigloher, C.; Pita, L.; Ribes, M.; Dutilh, B.E.; Hentschel, U. Lifestyle of sponge symbiont phages by host prediction and correlative microscopy. ISME J. 2021, 15, 2001–2011. [Google Scholar] [CrossRef]
  18. Rodriguez Jimenez, A.; Guiglielmoni, N.; Goetghebuer, L.; Dechamps, E.; George, I.F.; Flot, J.F. Comparative genome analysis of Vagococcus fluvialis reveals abundance of mobile genetic elements in sponge-isolated strains. BMC Genom. 2022, 23, 618. [Google Scholar] [CrossRef] [PubMed]
  19. He, M.; Zhang, L.; Hu, H.; Liu, X.; Zhang, C.; Xin, Y.; Liu, B.; Chen, Z.; Xu, K.; Liu, Y. Complete genome sequencing and comparative genomic analyses of a new spotted-fever Rickettsia heilongjiangensis strain B8. Emerg. Microbes Infect. 2023, 12, 2153085. [Google Scholar] [CrossRef]
  20. Engel, P.; Moran, N.A. The gut microbiota of insects—Diversity in structure and function. FEMS Microbiol. Rev. 2013, 37, 699–735. [Google Scholar] [CrossRef] [PubMed]
  21. Xiong, Q.; Wang, D.; Dong, X.; Liu, D.; Liu, Y.; Li, P.; Wu, G.; Luo, Y.; Zhang, R.; Liu, S.; et al. Microbulbifer flavimaris sp. nov. a halophilic Gammaproteobacteria isolated from marine sediment of the Yellow Sea, China. Int. J. Syst. Evol. Microbiol. 2019, 69, 1135–1141. [Google Scholar] [CrossRef] [PubMed]
  22. Huang, W.C.; Hu, Y.; Zhang, G.; Li, M. Comparative genomic analysis reveals metabolic diversity of different Paenibacillus groups. Appl. Microbiol. Biotechnol. 2020, 104, 10133–10143. [Google Scholar] [CrossRef] [PubMed]
  23. Cheng, Y.; Zhu, S.; Guo, C.; Xie, F.; Jung, D.; Li, S.; Zhang, W.; He, S. Microbulbifer hainanensis sp. nov. a moderately halopilic bacterium isolated from mangrove sediment. Antonie Van Leeuwenhoek 2021, 114, 1033–1042. [Google Scholar] [CrossRef] [PubMed]
  24. Lee, J.Y.; Kim, P.S.; Hyun, D.W.; Kim, H.S.; Shin, N.R.; Jung, M.J.; Yun, J.H.; Kim, M.S.; Whon, T.W.; Bae, J.W. Microbulbifer echini sp. nov. isolated from the gastrointestinal tract of a purple sea urchin, Heliocidaris crassispina. Int. J. Syst. Evol. Microbiol. 2017, 67, 998–1004. [Google Scholar] [CrossRef]
  25. Zhang, D.S.; Huo, Y.Y.; Xu, X.W.; Wu, Y.H.; Wang, C.S.; Xu, X.F.; Wu, M. Microbulbifer marinus sp. nov. and Microbulbifer yueqingensis sp. nov. isolated from marine sediment. Int. J. Syst. Evol. Microbiol. 2012, 62 Pt 3, 505–510. [Google Scholar] [CrossRef]
  26. Wang, C.; Yu, Q.Y.; Ji, N.N.; Zheng, Y.; Taylor, J.W.; Guo, L.D.; Gao, C. Bacterial genome size and gene functional diversity negatively correlate with taxonomic diversity along a pH gradient. Nat. Commun. 2023, 14, 7437. [Google Scholar] [CrossRef]
  27. Thomas, T.; Rusch, D.; DeMaere, M.Z.; Yung, P.Y.; Lewis, M.; Halpern, A.; Heidelberg, K.B.; Egan, S.; Steinberg, P.D.; Kjelleberg, S. Functional genomic signatures of sponge bacteria reveal unique and shared features of symbiosis. ISME J. 2010, 4, 1557–1567. [Google Scholar] [CrossRef]
  28. Ishaq, N.; Zhang, M.; Gao, L.; Ilan, M.; Li, Z. Microbulbifer spongiae sp. nov. isolated from marine sponge Diacarnus erythraeanus. Int. J. Syst. Evol. Microbiol. 2024, 74. [Google Scholar] [CrossRef]
  29. Stiffler, A.K.; Hesketh-Best, P.J.; Varona, N.S.; Zagame, A.; Wallace, B.A.; Lapointe, B.E.; Silveira, C.B. Genomic and induction evidence for bacteriophage contributions to sargassum-bacteria symbioses. Microbiome 2024, 12, 143. [Google Scholar] [CrossRef]
  30. Gao, L.; Song, Q.; Sang, J.; Xiao, Y.; Li, Z. Cytobacillus spongiae sp. nov. isolated from sponge Diacarnus spinipoculum. Int. J. Syst. Evol. Microbiol. 2023, 73, 005903. [Google Scholar] [CrossRef]
  31. Chen, Y.; Chen, Y.; Shi, C.; Huang, Z.; Zhang, Y.; Li, S.; Li, Y.; Ye, J.; Yu, C.; Li, Z.; et al. SOAPnuke: A MapReduce acceleration-supported software for integrated quality control and preprocessing of high-throughput sequencing data. Gigascience 2018, 7, 1–6. [Google Scholar] [CrossRef] [PubMed]
  32. Bankevich, A.; Nurk, S.; Antipov, D.; Gurevich, A.A.; Dvorkin, M.; Kulikov, A.S.; Lesin, V.M.; Nikolenko, S.I.; Pham, S.; Prjibelski, A.D.; et al. SPAdes: A new genome assembly algorithm and its applications to single-cell sequencing. J. Comput. Biol. 2012, 19, 455–477. [Google Scholar] [CrossRef]
  33. Koren, S.; Walenz, B.P.; Berlin, K.; Miller, J.R.; Bergman, N.H.; Phillippy, A.M. Canu: Scalable and accurate long-read assembly via adaptive k-mer weighting and repeat separation. Genome Res. 2017, 27, 722–736. [Google Scholar] [CrossRef]
  34. Lomsadze, A.; Gemayel, K.; Tang, S.; Borodovsky, M. Modeling leaderless transcription and atypical genes results in more accurate gene prediction in prokaryotes. Genome Res. 2018, 28, 1079–1089. [Google Scholar] [CrossRef]
  35. Zhou, X.; Liu, X.; Liu, M.; Liu, W.; Xu, J.; Li, Y. Comparative evaluation of 16S rRNA primer pairs in identifying nitrifying guilds in soils under long-term organic fertilization and water management. Front. Microbiol. 2024, 15, 1424795. [Google Scholar] [CrossRef]
  36. Lowe, T.M.; Eddy, S.R. tRNAscan-SE: A program for improved detection of transfer RNA genes in genomic sequence. Nucleic Acids Res. 1997, 25, 955–964. [Google Scholar] [CrossRef]
  37. Ontiveros-Palacios, N.; Cooke, E.; Nawrocki, E.P.; Triebel, S.; Marz, M.; Rivas, E.; Griffiths-Jones, S.; Petrov, A.I.; Bateman, A.; Sweeney, B. Rfam 15: RNA families database in 2025. Nucleic Acids Res. 2024, 53, D258–D267. [Google Scholar] [CrossRef] [PubMed]
  38. Bertelli, C.; Laird, M.R.; Williams, K.P.; Lau, B.Y.; Hoad, G.; Winsor, G.L.; Brinkman, F.S.L. IslandViewer 4: Expanded prediction of genomic islands for larger-scale datasets. Nucleic Acids Res. 2017, 45, W30–w35. [Google Scholar] [CrossRef] [PubMed]
  39. Siguier, P.; Perochon, J.; Lestrade, L.; Mahillon, J.; Chandler, M. ISfinder: The reference centre for bacterial insertion sequences. Nucleic Acids Res. 2006, 34, D32–D36. [Google Scholar] [CrossRef]
  40. Couvin, D.; Bernheim, A.; Toffano-Nioche, C.; Touchon, M.; Michalik, J.; Néron, B.; Rocha, E.P.C.; Vergnaud, G.; Gautheret, D.; Pourcel, C. CRISPRCasFinder, an update of CRISRFinder, includes a portable version, enhanced performance and integrates search for Cas proteins. Nucleic Acids Res. 2018, 46, W246–W251. [Google Scholar] [CrossRef]
  41. Krzywinski, M.; Schein, J.; Birol, I.; Connors, J.; Gascoyne, R.; Horsman, D.; Jones, S.J.; Marra, M.A. Circos: An information aesthetic for comparative genomics. Genome Res. 2009, 19, 1639–1645. [Google Scholar] [CrossRef]
  42. Buchfink, B.; Xie, C.; Huson, D.H. Fast and sensitive protein alignment using DIAMOND. Nat. Methods 2015, 12, 59–60. [Google Scholar] [CrossRef]
  43. Galperin, M.Y.; Wolf, Y.I.; Makarova, K.S.; Vera Alvarez, R.; Landsman, D.; Koonin, E.V. COG database update: Focus on microbial diversity, model organisms, and widespread pathogens. Nucleic Acids Res. 2021, 49, D274–D281. [Google Scholar] [CrossRef] [PubMed]
  44. Kanehisa, M.; Sato, Y.; Kawashima, M.; Furumichi, M.; Tanabe, M. KEGG as a reference resource for gene and protein annotation. Nucleic Acids Res. 2016, 44, D457–D462. [Google Scholar] [CrossRef] [PubMed]
  45. Ashburner, M.; Ball, C.A.; Blake, J.A.; Botstein, D.; Butler, H.; Cherry, J.M.; Davis, A.P.; Dolinski, K.; Dwight, S.S.; Eppig, J.T.; et al. Gene Ontology: Tool for the unification of biology. Nat. Genet. 2000, 25, 25–29. [Google Scholar] [CrossRef] [PubMed]
  46. The UniProt Consortium. UniProt: A hub for protein information. Nucleic Acids Res. 2015, 43, D204–D212. [Google Scholar] [CrossRef]
  47. Kanehisa, M.; Goto, S. KEGG: Kyoto encyclopedia of genes and genomes. Nucleic Acids Res. 2000, 28, 27–30. [Google Scholar] [CrossRef]
  48. Liu, B.; Pop, M. ARDB--Antibiotic Resistance Genes Database. Nucleic Acids Res. 2009, 37, D443–D447. [Google Scholar] [CrossRef]
  49. Drula, E.; Garron, M.L.; Dogan, S.; Lombard, V.; Henrissat, B.; Terrapon, N. The carbohydrate-active enzyme database: Functions and literature. Nucleic Acids Res. 2022, 50, D571–D577. [Google Scholar] [CrossRef]
  50. Vargas, W.A.; Martín, J.M.S.; Rech, G.E.; Rivera, L.P.; Benito, E.P.; Díaz-Mínguez, J.M.; Thon, M.R.; Sukno, S.A. Plant Defense Mechanisms Are Activated during Biotrophic and Necrotrophic Development of Colletotricum graminicola in Maize. Plant Physiol. 2012, 158, 1342–1358. [Google Scholar] [CrossRef]
  51. Zheng, J.; Ge, Q.; Yan, Y.; Zhang, X.; Huang, L.; Yin, Y. dbCAN3: Automated carbohydrate-active enzyme and substrate annotation. Nucleic Acids Res. 2023, 51, W115–W121. [Google Scholar] [CrossRef]
  52. Marçais, G.; Delcher, A.L.; Phillippy, A.M.; Coston, R.; Salzberg, S.L.; Zimin, A. MUMmer4: A fast and versatile genome alignment system. PLoS Comput. Biol. 2018, 14, e1005944. [Google Scholar] [CrossRef]
  53. Fu, L.; Niu, B.; Zhu, Z.; Wu, S.; Li, W. CD-HIT: Accelerated for clustering the next-generation sequencing data. Bioinformatics 2012, 28, 3150–3152. [Google Scholar] [CrossRef]
  54. Thanki, A.S.; Soranzo, N.; Haerty, W.; Davey, R.P. GeneSeqToFamily: A Galaxy workflow to find gene families based on the Ensembl Compara GeneTrees pipeline. Gigascience 2018, 7, 1–10. [Google Scholar] [CrossRef] [PubMed]
  55. Edgar, R.C. MUSCLE: Multiple sequence alignment with high accuracy and high throughput. Nucleic Acids Res. 2004, 32, 1792–1797. [Google Scholar] [CrossRef]
  56. Meier-Kolthoff, J.P.; Göker, M. TYGS is an automated high-throughput platform for state-of-the-art genome-based taxonomy. Nat. Commun. 2019, 10, 2182. [Google Scholar] [CrossRef] [PubMed]
  57. Yin, X.; Huang, F.; Liu, X.; Guo, J.; Cui, N.; Liang, C.; Lian, Y.; Deng, J.; Wu, H.; Yin, H.; et al. Phylogenetic analysis based on single-copy orthologous proteins in highly variable chloroplast genomes of Corydalis. Sci. Rep. 2022, 12, 14241. [Google Scholar] [CrossRef] [PubMed]
  58. Cui, Y.; Cui, Z.; Xu, J.; Hao, D.; Shi, J.; Wang, D.; Xiao, H.; Duan, X.; Chen, R.; Li, W. NG-Circos: Next-generation Circos for data vis-ualization and interpretation. NAR Genome Bioinform. 2020, 2, lqaa069. [Google Scholar] [CrossRef] [PubMed] [PubMed Central]
  59. Nguyen, M.; Liu, M.; Thomas, T. Ankyrin-repeat proteins from sponge symbionts modulate amoebal phagocytosis. Mol. Ecol. 2014, 23, 1635–1645. [Google Scholar] [CrossRef]
  60. Sugden, S.; Holert, J.; Cardenas, E.; Mohn, W.W.; Stein, L.Y. Microbiome of the freshwater sponge Ephydatia muelleri shares compositional and functional similarities with those of marine sponges. ISME J. 2022, 16, 2503–2512. [Google Scholar] [CrossRef]
  61. Reynolds, D.; Thomas, T. Evolution and function of eukaryotic-like proteins from sponge symbionts. Mol. Ecol. 2016, 25, 5242–5253. [Google Scholar] [CrossRef] [PubMed]
  62. Horn, H.; Slaby, B.M.; Jahn, M.T.; Bayer, K.; Moitinho-Silva, L.; Förster, F.; Abdelmohsen, U.R.; Hentschel, U. An Enrichment of CRISPR and Other Defense-Related Features in Marine Sponge-Associated Microbial Metagenomes. Front. Microbiol. 2016, 7, 1751. [Google Scholar] [CrossRef] [PubMed]
  63. O’Brien, P.A.; Robbins, S.J.; Tan, S.; Rix, L.; Miller, D.J.; Webster, N.S.; Zhang, G.; Bourne, D.G. Comparative genomics identifies key adaptive traits of sponge-associated microbial symbionts. Environ. Microbiol. 2024, 26, e16690. [Google Scholar] [CrossRef]
  64. Goodhead, I.; Darby, A.C. Taking the pseudo out of pseudogenes. Curr. Opin. Microbiol. 2015, 23, 102–109. [Google Scholar] [CrossRef]
  65. Romanenko, L.; Kurilenko, V.; Otstavnykh, N.; Velansky, P.; Isaeva, M.; Mikhailov, V. Microbulbifer okhotskensis sp. nov. isolated from a deep bottom sediment of the Okhotsk Sea. Arch. Microbiol. 2022, 204, 548. [Google Scholar] [CrossRef]
  66. Frank, A.C. Molecular host mimicry and manipulation in bacterial symbionts. FEMS Microbiol. Lett. 2019, 366, fnz038. [Google Scholar] [CrossRef]
  67. Pan, X.; Lührmann, A.; Satoh, A.; Laskowski-Arce, M.A.; Roy, C.R. Ankyrin repeat proteins comprise a diverse family of bacterial type IV effectors. Science 2008, 320, 1651–1654. [Google Scholar] [CrossRef]
  68. O’Brien, P.A.; Tan, S.; Frade, P.R.; Robbins, S.J.; Engelberts, J.P.; Bell, S.C.; Vanwonterghem, I.; Miller, D.J.; Webster, N.S.; Zhang, G.; et al. Validation of key sponge symbiont pathways using genome-centric metatranscriptomics. Environ. Microbiol. 2023, 25, 3207–3224. [Google Scholar] [CrossRef]
  69. Kamke, J.; Sczyrba, A.; Ivanova, N.; Schwientek, P.; Rinke, C.; Mavromatis, K.; Woyke, T.; Hentschel, U. Single-cell genomics reveals complex carbohydrate degradation patterns in poribacterial symbionts of marine sponges. ISME J. 2013, 7, 2287–2300. [Google Scholar] [CrossRef]
  70. Moh, T.H.; Furusawa, G.; Amirul, A.A. Microbulbifer aggregans sp. nov. isolated from estuarine sediment from a mangrove forest. Int. J. Syst. Evol. Microbiol. 2017, 67, 4089–4094. [Google Scholar] [CrossRef] [PubMed]
  71. Berlemont, R.; Martiny, A.C. Glycoside Hydrolases across Environmental Microbial Communities. PLoS Comput. Biol. 2016, 12, e1005300. [Google Scholar] [CrossRef]
  72. Nguyen, S.T.C.; Freund, H.L.; Kasanjian, J.; Berlemont, R. Function, distribution, and annotation of characterized cellulases, xylanases, and chitinases from CAZy. Appl. Microbiol. Biotechnol. 2018, 102, 1629–1637. [Google Scholar] [CrossRef] [PubMed]
  73. Siguier, P.; Gourbeyre, E.; Chandler, M. Bacterial insertion sequences: Their genomic impact and diversity. FEMS Microbiol. Rev. 2014, 38, 865–891. [Google Scholar] [CrossRef]
  74. Hallam, S.J.; Konstantinidis, K.T.; Putnam, N.; Schleper, C.; Watanabe, Y.; Sugahara, J.; Preston, C.; de la Torre, J.; Richardson, P.M.; DeLong, E.F. Genomic analysis of the uncultivated marine crenarchaeote Cenarchaeum symbiosum. Proc. Natl. Acad. Sci. USA 2006, 103, 18296–18301. [Google Scholar] [CrossRef]
  75. Khizar, Y.; Farooq, U.; Attia, K.A.; Rehman, O.U.; Abushady, A.M.; Fiaz, S.; Zeb, U.; Iqbal, R.; Uzair, M. Genome-wide identification and characterization of stress-responsive genes in Chlorella vulgaris. BMC Genom. Data 2025, 26, 20. [Google Scholar] [CrossRef]
  76. Chattopadhyay, M.K.; Raghu, G.; Sharma, Y.V.; Biju, A.R.; Rajasekharan, M.V.; Shivaji, S. Increase in oxidative stress at low temperature in an antarctic bacterium. Curr. Microbiol. 2011, 62, 544–546. [Google Scholar] [CrossRef]
  77. Moreno-Pino, M.; Manrique-de-la-Cuba, M.F.; López-Rodríguez, M.; Parada-Pozo, G.; Rodríguez-Marconi, S.; Ribeiro, C.G.; Flores-Herrera, P.; Guajardo, M.; Trefault, N. Unveiling microbial guilds and symbiotic relationships in Antarctic sponge microbiomes. Sci. Rep. 2024, 14, 6371. [Google Scholar] [CrossRef]
  78. Chung, I.Y.; Kim, B.O.; Jang, H.J.; Cho, Y.H. Dual promoters of the major catalase (KatA) govern distinct survival strategies of Pseudomonas aeruginosa. Sci. Rep. 2016, 6, 31185. [Google Scholar] [CrossRef] [PubMed]
  79. Shin, D.H.; Choi, Y.S.; Cho, Y.H. Unusual properties of catalase A (KatA) of Pseudomonas aeruginosa PA14 are associated with its biofilm peroxide resistance. J. Bacteriol. 2008, 190, 2663–2670. [Google Scholar] [CrossRef] [PubMed]
  80. Yang, T.; Nian, Y.; Lin, H.; Li, J.; Lin, X.; Li, T.; Wang, R.; Wang, L.; Beattie, G.A.; Zhang, J.; et al. Structure and mechanism of the osmoregulated choline transporter BetT. Sci. Adv. 2024, 10, eado6229. [Google Scholar] [CrossRef]
  81. Shen, L.; Zang, X.; Sun, K.; Chen, H.; Che, X.; Sun, Y.; Wang, G.; Zhang, S.; Chen, G. Complete genome sequencing of Bacillus sp. TK-2, analysis of its cold evolution adaptability. Sci. Rep. 2021, 11, 4836. [Google Scholar] [CrossRef]
  82. Lin, J.; Xu, L.; Yang, J.; Wang, Z.; Shen, X. Beyond dueling: Roles of the type VI secretion system in microbiome modulation, pathogenesis and stress resistance. Stress. Biol. 2021, 1, 11. [Google Scholar] [CrossRef] [PubMed]
  83. Gogarten, J.P.; Doolittle, W.F.; Lawrence, J.G. Prokaryotic evolution in light of gene transfer. Mol. Biol. Evol. 2002, 19, 2226–2238. [Google Scholar] [CrossRef]
  84. Frost, L.S.; Leplae, R.; Summers, A.O.; Toussaint, A. Mobile genetic elements: The agents of open source evolution. Nat. Rev. Microbiol. 2005, 3, 722–732. [Google Scholar] [CrossRef] [PubMed]
  85. Treangen, T.J.; Rocha, E.P. Horizontal transfer, not duplication, drives the expansion of protein families in prokaryotes. PLoS Genet. 2011, 7, e1001284. [Google Scholar] [CrossRef]
  86. Bobay, L.M.; Ochman, H. The Evolution of Bacterial Genome Architecture. Front. Genet. 2017, 8, 72. [Google Scholar] [CrossRef] [PubMed]
  87. Oliveira, V.; Polónia, A.R.M.; Cleary, D.F.R.; Huang, Y.M.; de Voogd, N.J.; Keller-Costa, T.; Costa, R.; Gomes, N.C.M. Assessing the genomic composition, putative ecological relevance and biotechnological potential of plasmids from sponge bacterial symbionts. Microbiol. Res. 2022, 265, 127183. [Google Scholar] [CrossRef]
  88. Stasiak, G.; Mazur, A.; Wielbo, J.; Marczak, M.; Zebracki, K.; Koper, P.; Skorupska, A. Functional relationships between plasmids and their significance for metabolism and symbiotic performance of Rhizobium leguminosarum bv. trifolii. J. Appl. Genet. 2014, 55, 515–527. [Google Scholar] [CrossRef]
  89. Yang, L.-L.; Jiang, Z.; Li, Y.; Wang, E.-T.; Zhi, X.-Y. Plasmids Related to the Symbiotic Nitrogen Fixation Are Not Only Cooperated Functionally but Also May Have Evolved over a Time Span in Family Rhizobiaceae. Genome Biol. Evol. 2020, 12, 2002–2014. [Google Scholar] [CrossRef]
  90. Gil, R.; Sabater-Muñoz, B.; Perez-Brocal, V.; Silva, F.J.; Latorre, A. Plasmids in the aphid endosymbiont Buchnera aphidicola with the smallest genomes. A puzzling evolutionary story. Gene 2006, 370, 17–25. [Google Scholar] [CrossRef]
  91. Touchon, M.; Rocha, E.P.C. Causes of Insertion Sequences Abundance in Prokaryotic Genomes. Mol. Biol. Evol. 2007, 24, 969–981. [Google Scholar] [CrossRef]
  92. Munshi, I.D.; Mathuria, A.; Sharma, H.; Acharya, M.; Chaudhary, A.; Jain, K.; Ragini; Dahiya, S.; Arora, R.; Singh, V.; et al. Emerging concept of genomic islands in bacterial adaptation and pathogenicity. Res. Microbiol. 2025, 104303. [Google Scholar] [CrossRef]
  93. Valle, J.; Vergara-Irigaray, M.; Merino, N.; Penadés, J.R.; Lasa, I. sigmaB regulates IS256-mediated Staphylococcus aureus biofilm phenotypic variation. J. Bacteriol. 2007, 189, 2886–2896. [Google Scholar] [CrossRef]
  94. Leavis, H.L.; Willems, R.J.; van Wamel, W.J.; Schuren, F.H.; Caspers, M.P.; Bonten, M.J. Insertion sequence-driven diversification creates a globally dispersed emerging multiresistant subspecies of E. faecium. PLoS Pathog. 2007, 3, e7. [Google Scholar] [CrossRef]
  95. Siegl, A.; Kamke, J.; Hochmuth, T.; Piel, J.; Richter, M.; Liang, C.; Dandekar, T.; Hentschel, U. Single-cell genomics reveals the lifestyle of Poribacteria, a candidate phylum symbiotically associated with marine sponges. ISME J. 2011, 5, 61–70. [Google Scholar] [CrossRef] [PubMed]
  96. Vandecraen, J.; Chandler, M.; Aertsen, A.; Van Houdt, R. The impact of insertion sequences on bacterial genome plasticity and adaptability. Crit. Rev. Microbiol. 2017, 43, 709–730. [Google Scholar] [CrossRef] [PubMed]
  97. Han, R.; Hong, Y.; Xu, R.; Guo, W.; Zhang, M.; Lu, Z.; Han, Q.; Mo, Z.; Dan, X.; Li, Y. Genomic evidence of genetic diversity and functional evolution in Flavobacterium columnare. Front. Microbiol. 2023, 14, 1240471. [Google Scholar] [CrossRef]
  98. Zhang, Q.; Rho, M.; Tang, H.; Doak, T.G.; Ye, Y. CRISPR-Cas systems target a diverse collection of invasive mobile genetic elements in human microbiomes. Genome Biol. 2013, 14, R40. [Google Scholar] [CrossRef]
  99. Deem, K.D.; Brisson, J.A. Problems with Paralogs: The Promise and Challenges of Gene Duplicates in Evo-Devo Research. Integr. Comp. Biol. 2024, 64, 556–564. [Google Scholar] [CrossRef] [PubMed]
  100. Tong, M.; French, S.; El Zahed, S.S.; Ong, W.K.; Karp, P.D.; Brown, E.D. Gene Dispensability in Escherichia coli Grown in Thirty Different Carbon Environments. mBio 2020, 11, e02259-20. [Google Scholar] [CrossRef]
  101. Karimi, E.; Ramos, M.; Gonçalves, J.M.S.; Xavier, J.R.; Reis, M.P.; Costa, R. Comparative Metagenomics Reveals the Distinctive Adaptive Features of the Spongia officinalis Endosymbiotic Consortium. Front. Microbiol. 2017, 8, 2499. [Google Scholar] [CrossRef]
  102. Konstantinou, D.; Popin, R.V.; Fewer, D.P.; Sivonen, K.; Gkelis, S. Genome Reduction and Secondary Metabolism of the Marine Sponge-Associated Cyanobacterium Leptothoe. Mar. Drugs 2021, 19, 298. [Google Scholar] [CrossRef] [PubMed]
  103. Karimi, E.; Keller-Costa, T.; Slaby, B.M.; Cox, C.J.; da Rocha, U.N.; Hentschel, U.; Costa, R. Genomic blueprints of sponge-prokaryote symbiosis are shared by low abundant and cultivatable Alphaproteobacteria. Sci. Rep. 2019, 9, 1999. [Google Scholar] [CrossRef]
  104. Li, Q.; Zheng, L.; Guo, Z.; Tang, T.; Zhu, B. Alginate degrading enzymes: An updated comprehensive review of the structure, catalytic mechanism, modification method and applications of alginate lyases. Crit. Rev. Biotechnol. 2021, 41, 953–968. [Google Scholar] [CrossRef] [PubMed]
  105. Fan, L.; Reynolds, D.; Liu, M.; Stark, M.; Kjelleberg, S.; Webster, N.S.; Thomas, T. Functional equivalence and evolutionary convergence in complex communities of microbial sponge symbionts. Proc. Natl. Acad. Sci. USA 2012, 109, E1878–E1887. [Google Scholar] [CrossRef] [PubMed]
  106. Knobloch, S.; Jóhannsson, R.; Marteinsson, V. Genome analysis of sponge symbiont ‘Candidatus Halichondribacter symbioticus’ shows genomic adaptation to a host-dependent lifestyle. Environ. Microbiol. 2020, 22, 483–498. [Google Scholar] [CrossRef]
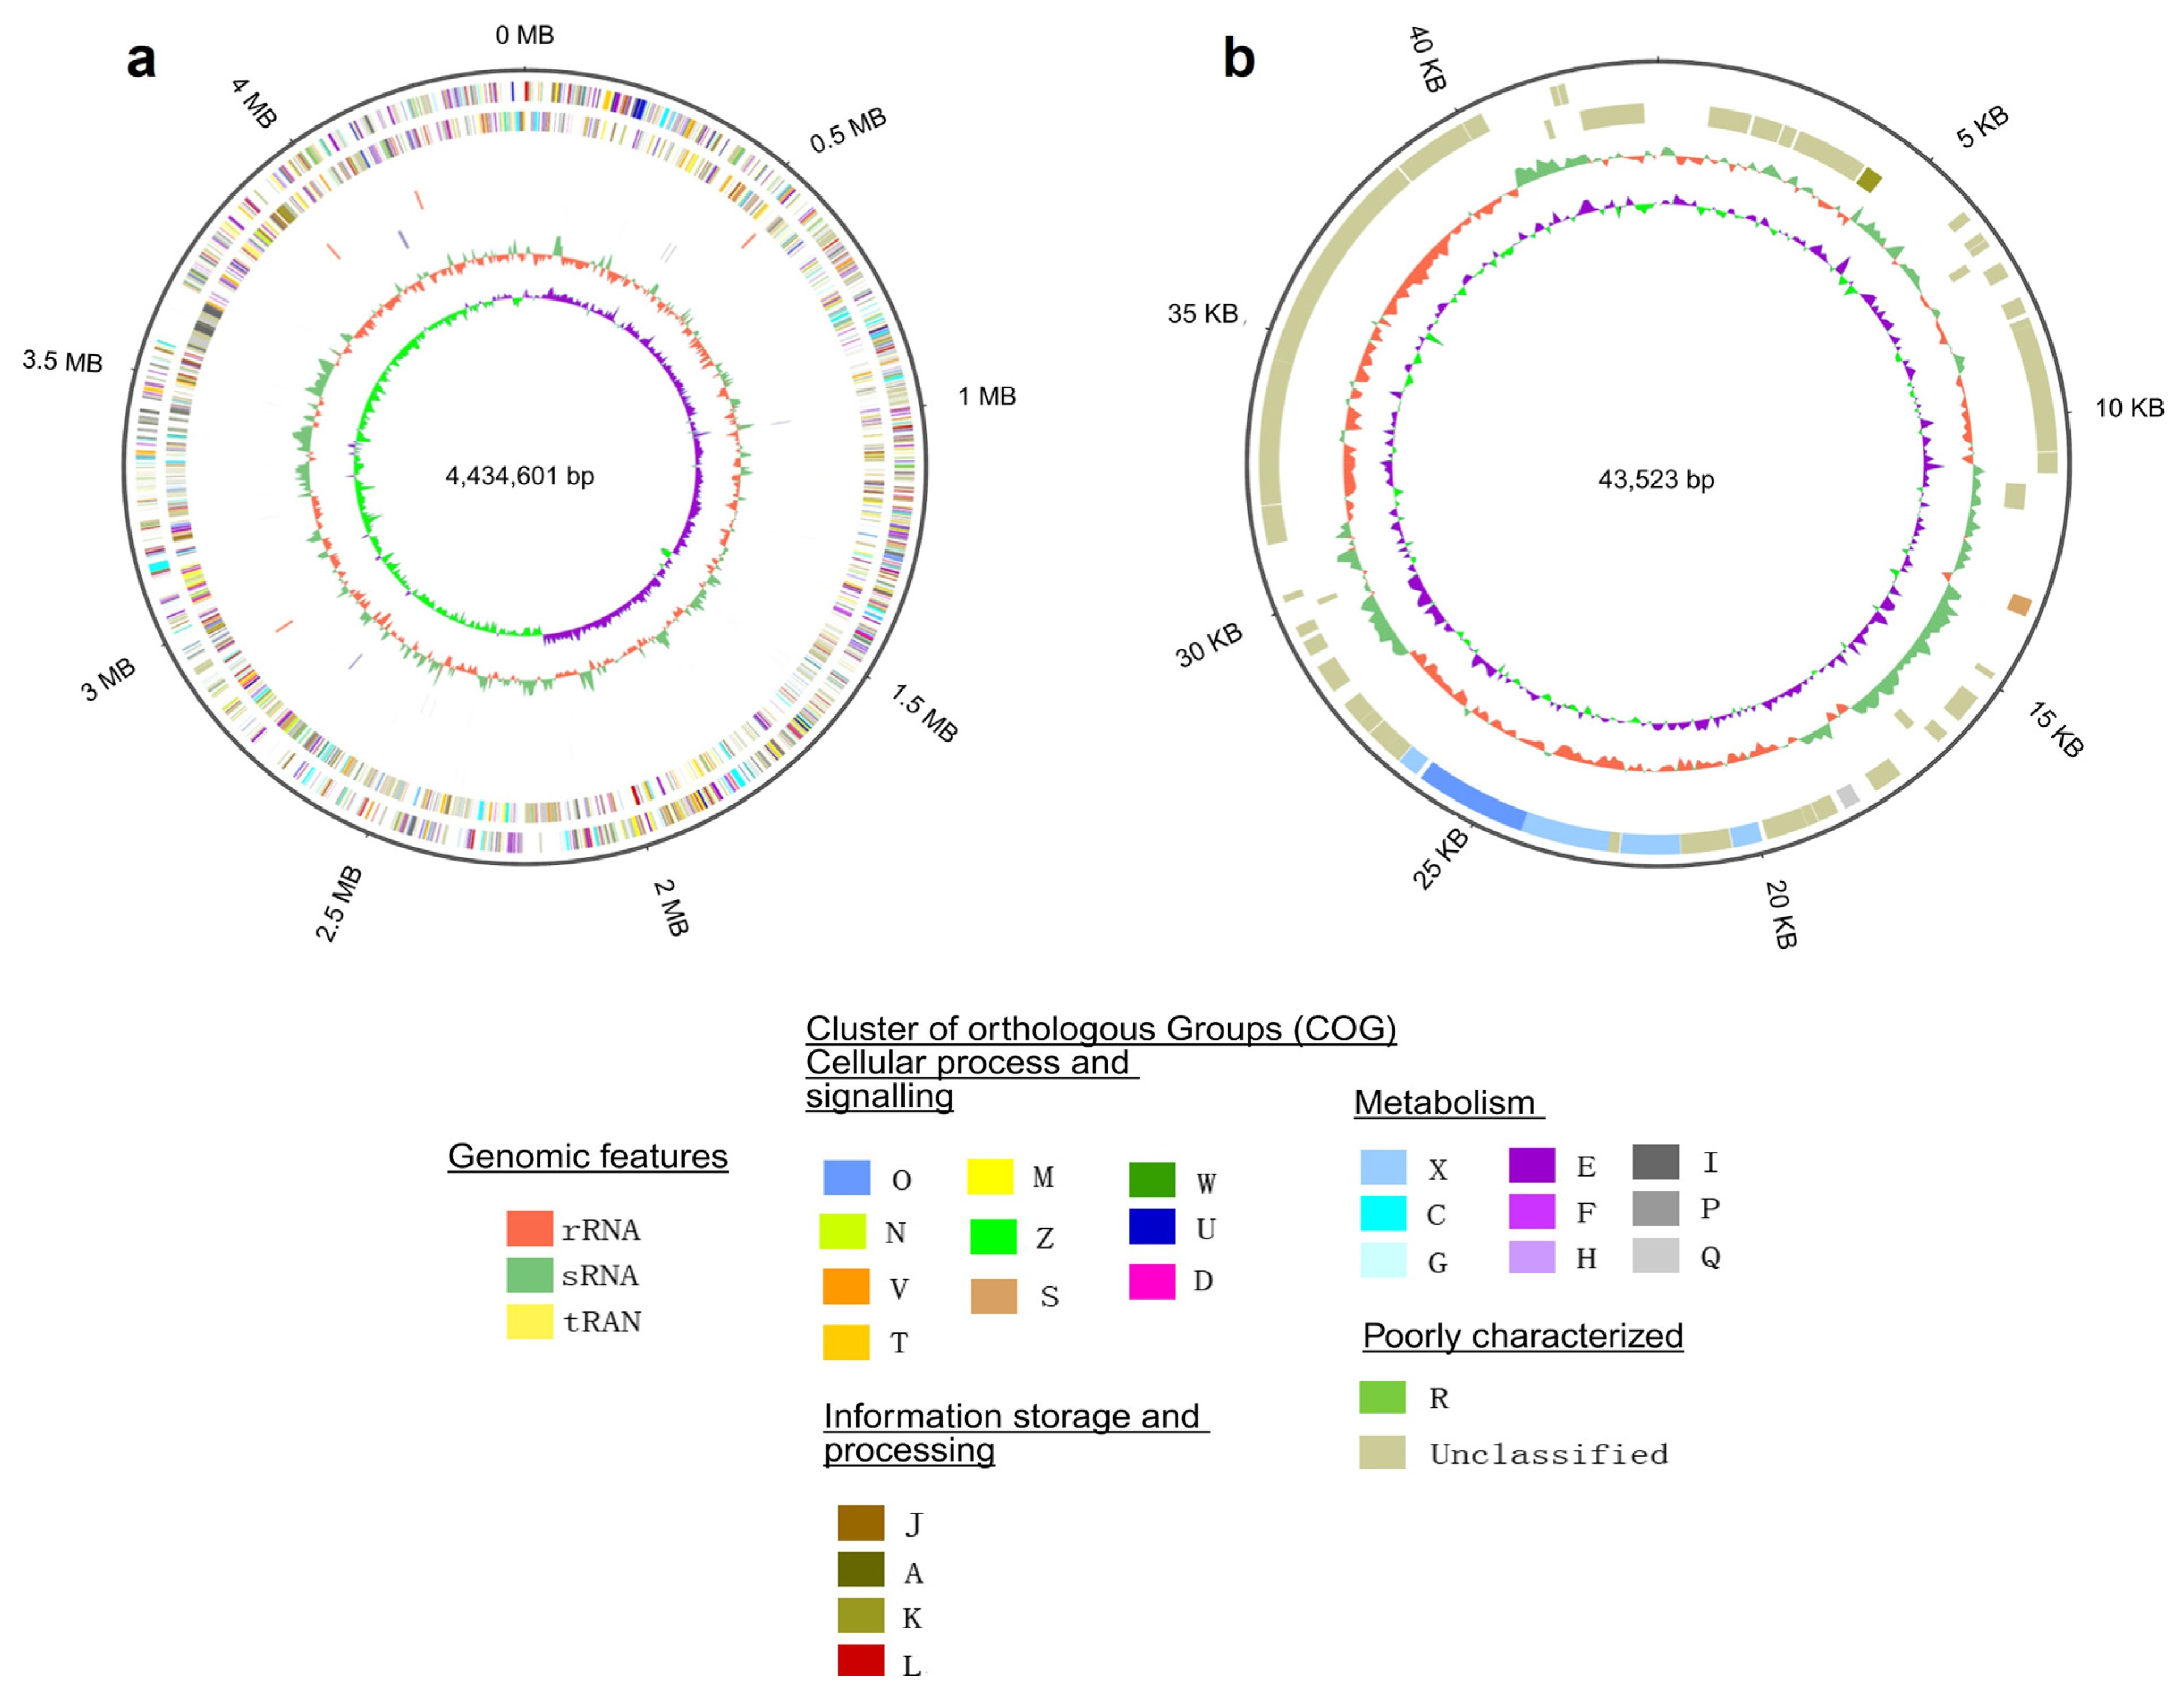
Figure 1. Circular representation of genome maps (a) Chromosome (CP098023.1), (b) Plasmid (CP098024.1) of M. spongiae MI-GT, generated using the Circos software (https://wlcb.oit.uci.edu/NG-Circos) (https://github.com/YaCui/NG-Circos) (Cui et al. 2020) [58]. (a) Chromosome (from outer to the inner): outermost circle depicts the genome size; forward strand gene, colored according to cluster of orthologous groups (COG) classification; reverse strand gene, colored according to cluster of orthologous groups (COG) classification; forward strand ncRNA; reverse strand ncRNA; repeat; GC content; GC skew. (b) Plasmid: (from outer to inner) genome size; forward strand gene, colored according to COG classification; reverse strand gene, colored according to COG classification; GC content; GC-SKEW. COG-classification includes the following categories: (O) Posttranslational modification, protein turnover, chaperons, (D) Cell cycle control, cell division, chromosome partitioning, (N) Cell motility, (M) Cell wall, membrane envelope, biogenesis, (Z) Cytoskeleton, (S) Function unknown, (T) Signal transduction mechanisms, (U) Intracellular trafficking, secretion, and vesicular transport, (V) Defense mechanisms, (W) Extracellular structures, (A) RNA processing and modification, (J) Translation, ribosomal structure and biogenesis, (K) Transcription, (L) Replication, recombination and repair, (F) Nucleotide transport, and metabolism, (C) Energy production and conversion, (G)Carbohydrate transport and metabolism, (H) Coenzyme transport and metabolism, (I) Lipid transport and metabolism, (E) Amino acid transport and metabolism, (P) Inorganic ion transport and metabolism, (Q) Secondary metabolites biosynthesis, transport and catabolism, (X) Mobilome: prophages, transposons, (R) General function prediction only.
Microorganisms 13 01940 g001
Figure 2. Abundance of mobile gene elements (MGEs) in the genome of sponge-associated strain M. spongiae MI-GT and three Microbulbifer reference strains. Boxplots show the abundance of (a) genomic islands (GIs), (b) insertion sequences (ISs), and (c) CRISPR’s sequences in the genomes of M. spongiae MI-GT, M. hydrolyticus IRE31T, M. thermotolerance DAU221T, and M. variabilis ATCC700307T. Boxes represent the interquartile range (IQR), and the horizontal range line indicates the position of the median. Each dot represents one data point. The p-value of the statistical test on the means is indicated (* p < 0.05, *** p < 0.01, ns = non-significant).
Microorganisms 13 01940 g002aMicroorganisms 13 01940 g002b
Figure 3. Carbohydrate metabolism of M. spongiae MI-GT and three Microbulbifer reference strains. (a) Proportion of carbohydrate metabolism-related enzymes, annotated using the Carbohydrate-Active enzymes database. AA (auxiliary activity); CBM (carbohydrate binding module); CE (carbohydrate esterase); GH (glycoside hydrolases); GT (glycosyl transferases); PL (polysaccharide lyase) in the genomes of M. spongiae MI-GT (blue), M. hydrolyticus IRE31T (orange), M. thermotolerance DAU221T (purple), and M. variabilis ATCC700307T (green). (b) Abundance of genes annotated to versatile carbohydrate metabolic pathways in the genome of M. spongiae MI-GT.
Microorganisms 13 01940 g003
Figure 4. Heatmap displays the comparison of stress response proteins among sponge-associated strain M. spongiae MI-GT and three Microbulbifer reference strains M. hydrolyticus IRE31T, M. thermotolerance DAU21T, and M. variabilis ATCC700307T. The color scale ranges from light green, light red, light blue, and light purple (absent) to dark green, dark red, dark blue, and dark purple, respectively (present). (a) Oxidative stress response in M. spongiae MI-GT and three Microbulbifer reference strains. (b) Osmotic stress response in M. spongiae MI-GT and three Microbulbifer reference strains. (c) Resistance to antimicrobial drugs in M. spongiae MI-GT and three Microbulbifer reference strains. (d) Tolerance to biotoxic metals in M. spongiae MI-GT and three Microbulbifer reference strains.
Microorganisms 13 01940 g004aMicroorganisms 13 01940 g004b
Figure 5. Phylogenomic tree based on genome sequences of M. spongiae MI-GT and seventeen Microbulbifer reference strains using the genome blast distance phylogeny (GBDP) method. Branch lengths are scaled in terms of the GBDP distance formula d5. Numbers above branches are GBDP pseudo-bootstrap support values > 60% from 100 replications, with an average branch support of 65.4%. GenBank accession numbers are included in parentheses. Bar, 0.02 represents substitutions per nucleotide position.
Microorganisms 13 01940 g005
Figure 6. Comparative genomic analysis of M. spongiae MI-GT with three Microbulbifer reference strains. (a) Genome-to-genome alignment of amino acid and nucleotide level sequences of M. spongiae MI-GT to M. hydrolyticus IRE 31T. (b) Genome-to-genome alignment of amino acid and nucleotide level sequences of M. spongiae MI-GT to M. thermotolerance DAU221T. (c) Genome-to-genome alignment of amino acid and nucleotide level sequences of M. spongiae MI-GT to M. variabilis ATCC700307T based on MUMmer version 3.22. In the diagram, yellow box stands for the forward chain and blue box stands for the reverse chain within the upper and following sequence region. In the box of sequence, yellow region stands for the nucleic acid sequence in forward chain of this genome sequence, and blue region stands for nucleic acid sequence in reverse chain of this genome sequence. In the middle region of two sequences, yellow line stands for forward alignment and blue line stands for reverse complementary alignment.
Microorganisms 13 01940 g006
Figure 7. Comparative genomic analysis of M. spongiae MI-GT with three Microbulbifer reference strains. (a,b) Dilution curve of core genome and pangenome.
Microorganisms 13 01940 g007
Figure 8. Comparative genomic analysis of M. spongiae MI-GT with three Microbulbifer reference strains. (a) Venn diagram of orthologous, core genes, and strain-specific genes in each strain. (b) COG categories of orthologous and strain-specific genes in each strain. A, RNA processing and modifications; J, Translation, ribosomal structure and biogenesis; K, Transcription; L, Replication, recombination and repair; C, Energy production and conversion; E, Amino acid transport and metabolism; F, Nucleotide transport and metabolism; G, Carbohydrate transport and metabolism; H, Coenzyme transport and metabolism; I, Lipid transport and metabolism; P, Inorganic ion transport and metabolism; Q, Secondary metabolites biosynthesis, transport and metabolism; X, Mobilomes: Prophages, transposons; D, Cell cycle control, cell division, chromosome partitioning, M, Cell wall/membrane/envelope biogenesis; N, Cell motility; O, Posttranslational modification, protein turnover, chaperons; T, Signal transduction mechanisms; U, Intracellular trafficking, secretion and vesicular transport; V, Defense mechanisms; W, Extracellular structures; Z, Cytoskeleton. Asterisks indicate (p < 0.05 in t-test). (c) Dispensable gene heatmap of four Microbulbifer strains: below are each strain name, left are dispensable gene clusters, top are strain clusters, similarities of genes are shown in the middle, with different colors representing different coverage by heat map. Color/depth in top right pic. (d) Gene family analysis showing the orthologs among four Microbulbifer strains: M. spongiae MI-GT, M. hydrolyticus IRE31T, M. variabilis ATCC700307T, and M. thermotolerance DAU221T.
Microorganisms 13 01940 g008
Figure 9. Bubble plots show the difference in abundance and statistical significance of specific COGs related to metabolic interaction-related features in core genome (green color), dispensable genome (orange color), M. spongiae MI-GT (purple color), and three Microbulbifer reference strains M. hydrolyticus IRE31T (pink color), M. variabilis ATCC700307T (yellow color), and M. thermotolerance DAU221T (light-green color). The size of the circle indicates statistically significant difference (p < 0.05, in t-test), with larger circles representing a greater number of counts per COGs, representing smaller p-values and thus more pronounced difference.
Microorganisms 13 01940 g009
Figure 10. Schematic overview of genomic characteristics that reflect evolutionary adaptation of M. spongiae MI-GT.
Microorganisms 13 01940 g010
Table 1. General genome features of M. spongiae MI-GT, and three Microbulbifer reference strains.
CategoryMI-GTIRE31TDAU221TATCC700307T
Genome size (nt)4,478,124 (bp)4,209,307 (bp)3,938,396 (bp)4,855,835 (bp)
Plasmid1N/AN/AN/A
GC content (%)54.5157.656.649.5
Protein-coding genes4433354932734253
Genes with functions3683344031454142
Contig Number2111
Completeness (%)10010099.4499.44
Contamination (%)0.560.5600.56
ncRNA4444
tRNA50664859
5s_rRNA4435
16s_rRNA4435
23s_rRNA4435
Pseudogenes83276733
Genome coverage267.0x400.0x197.8x100x
Note: M. spongiae MI-GT (this study) (CP098023.1; Chromosome), M. spongiae MI-GT (this study) (CP098024.1; Plasmid), M. hydrolyticus IRE31T (CP047491.1), M. thermotolerance DAU221T (CP014864.1), M. variabilis ATCC700307T (CP092418.1). ‘T’ superscript indicates that the bacterial strain is a type-strain.
Disclaimer/Publisher’s Note: The statements, opinions and data contained in all publications are solely those of the individual author(s) and contributor(s) and not of MDPI and/or the editor(s). MDPI and/or the editor(s) disclaim responsibility for any injury to people or property resulting from any ideas, methods, instructions or products referred to in the content.