
Optimization of Fermentation Conditions for the Production of 2,3,5-Trimethylpyrazine by Recombinant Bacillus licheniformis

 ,
,
Abstract
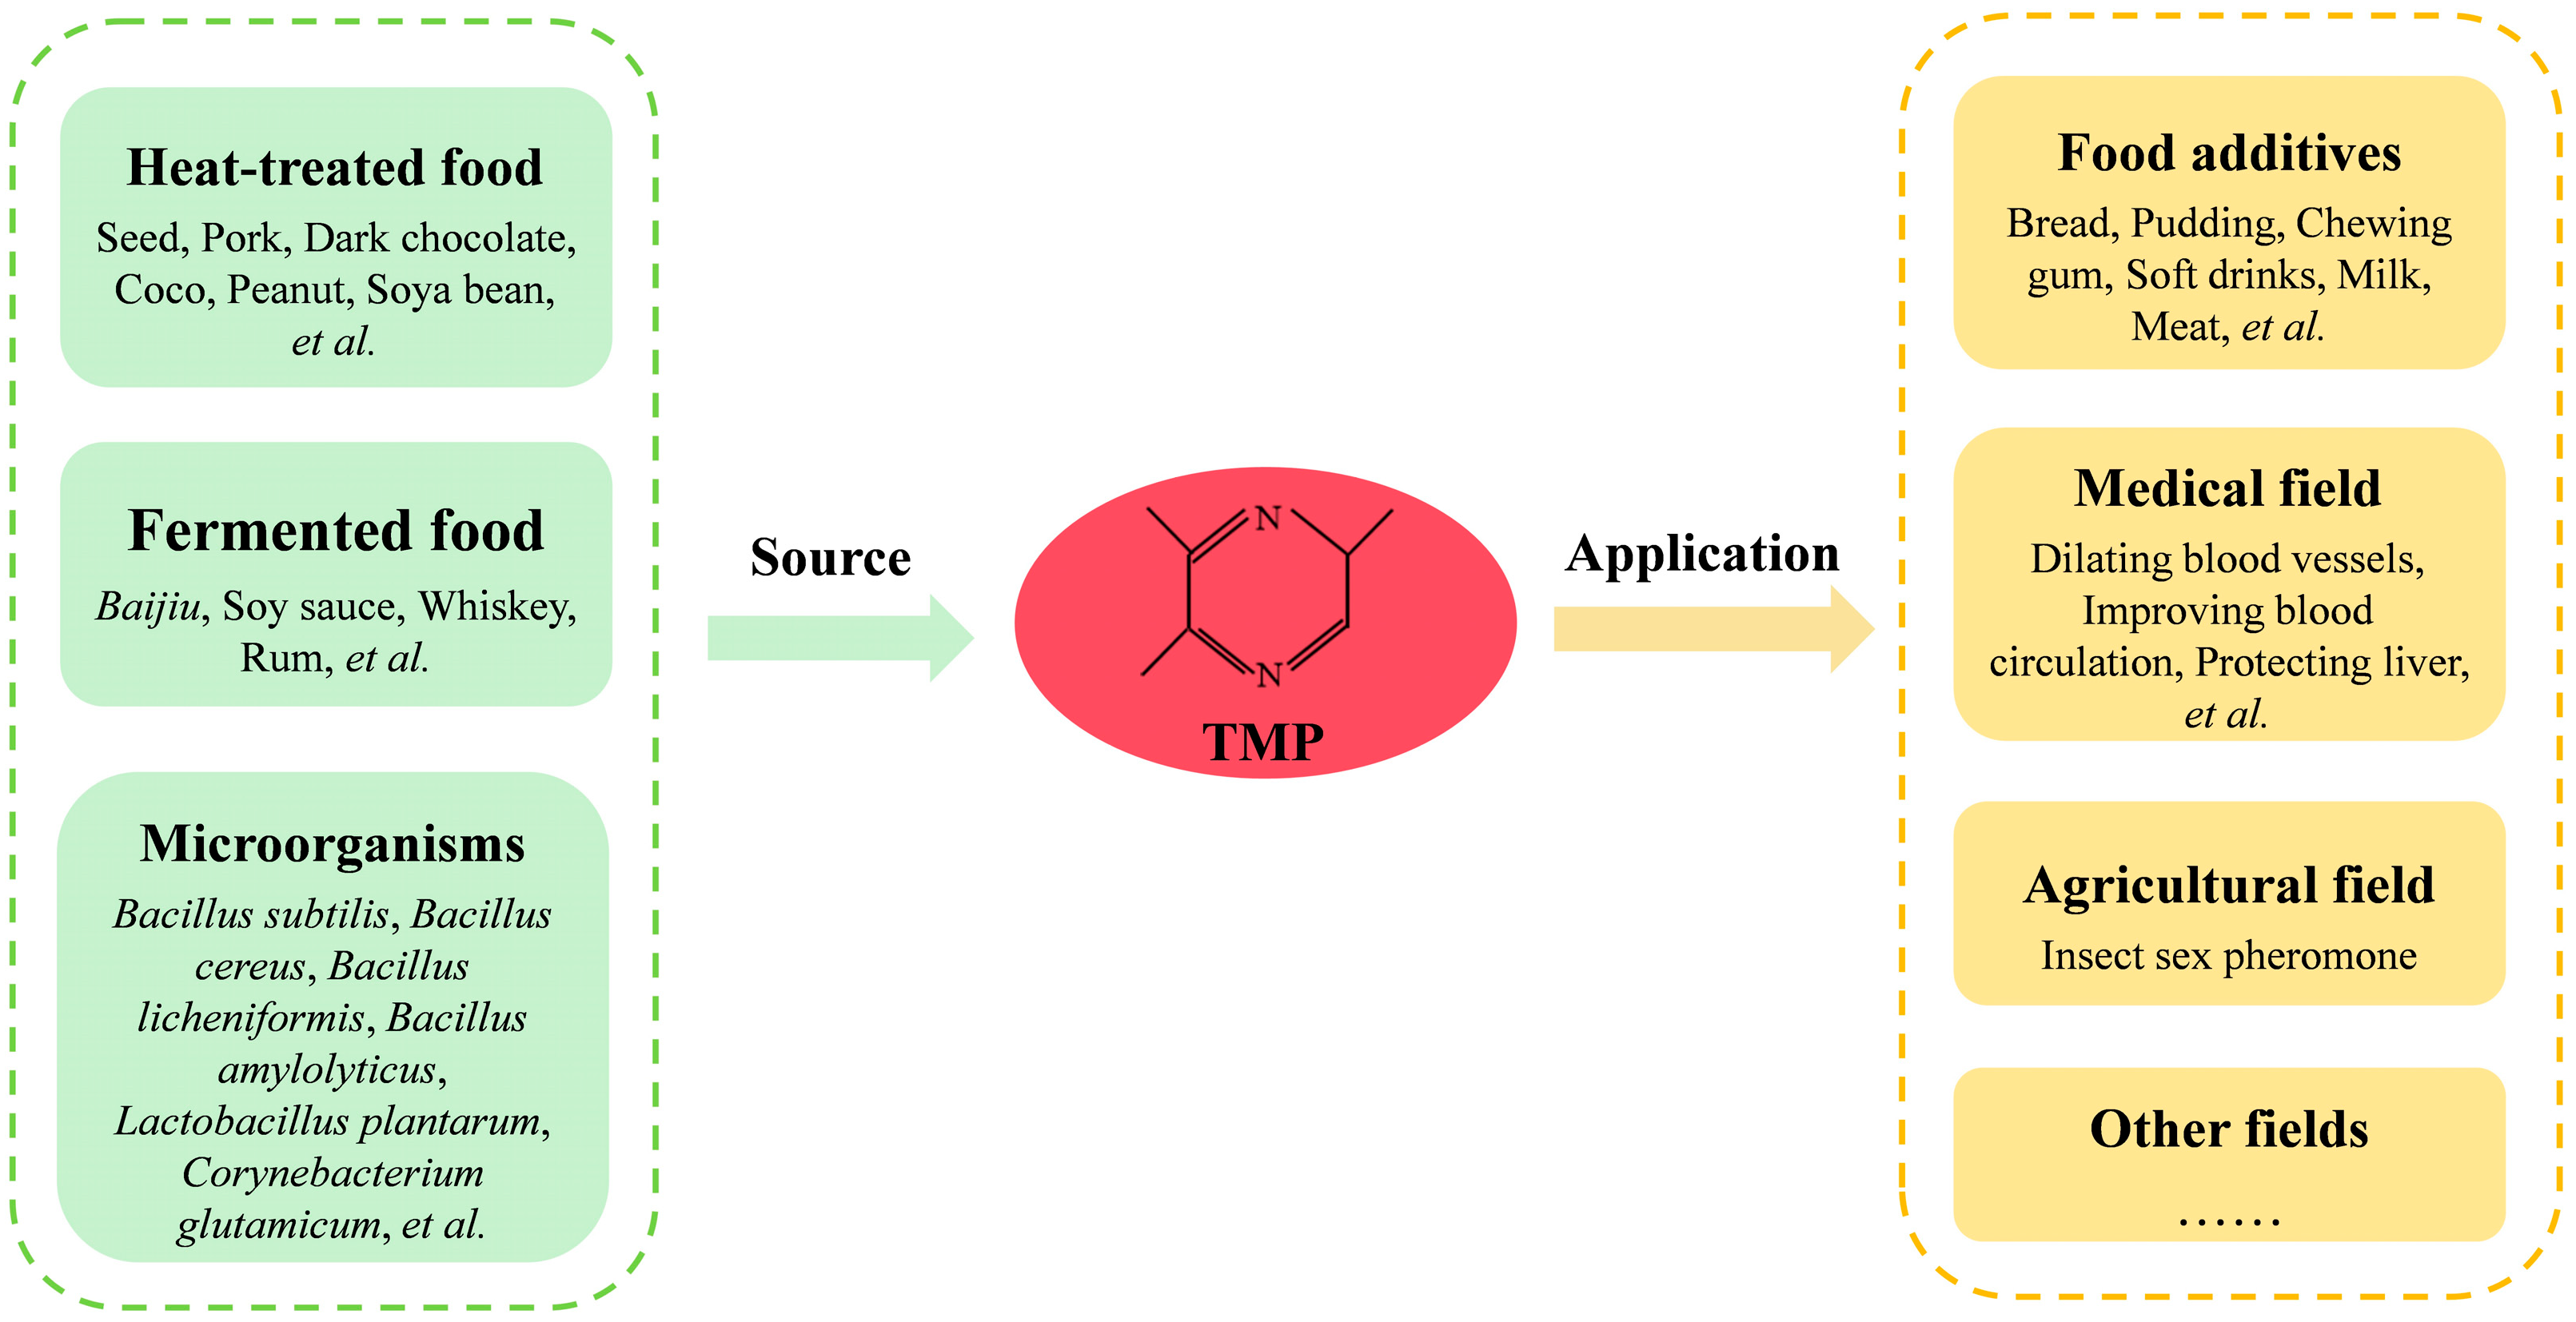
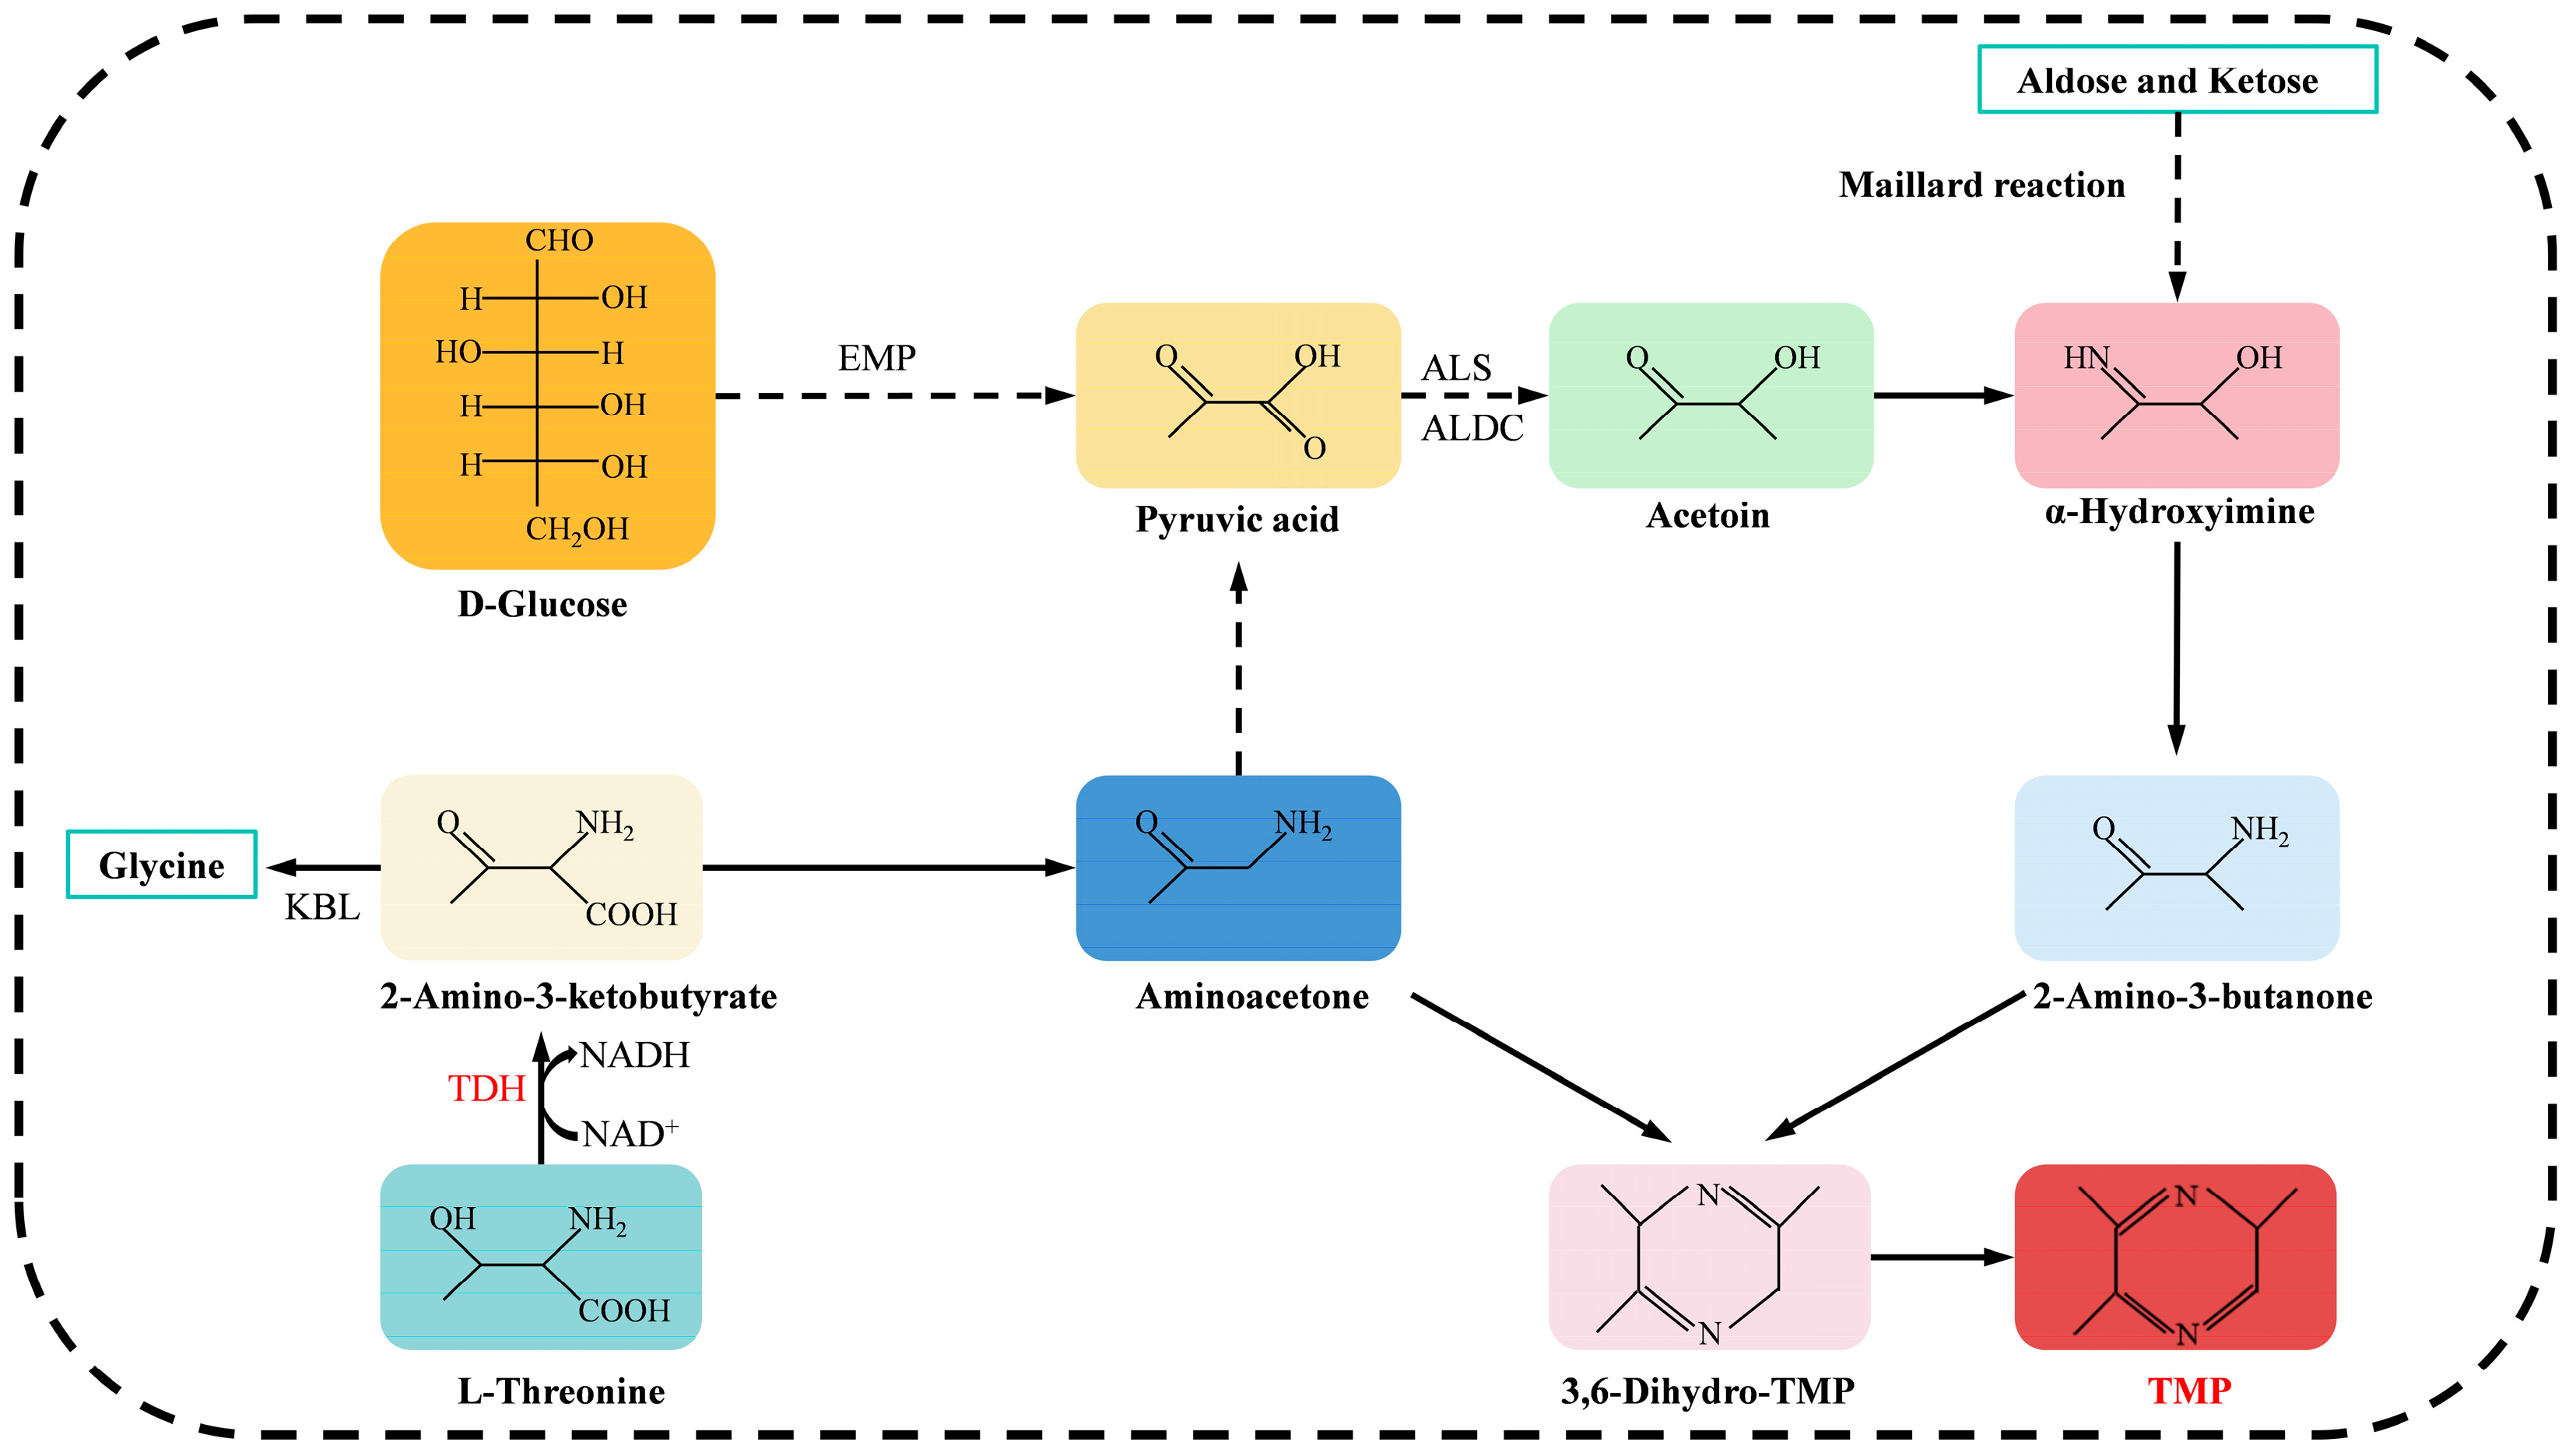
1. Introduction
2. Materials and Methods
2.1. Materials and Culture Medium
2.1.1. Strains and Plasmids
2.1.2. Culture Medium
2.2. Construction of Recombinant Strains
2.3. Determination of TMP Yield of Recombinant Strains
2.4. Single-Factor Experimental Design
2.5. Box–Behnken Design
3. Results
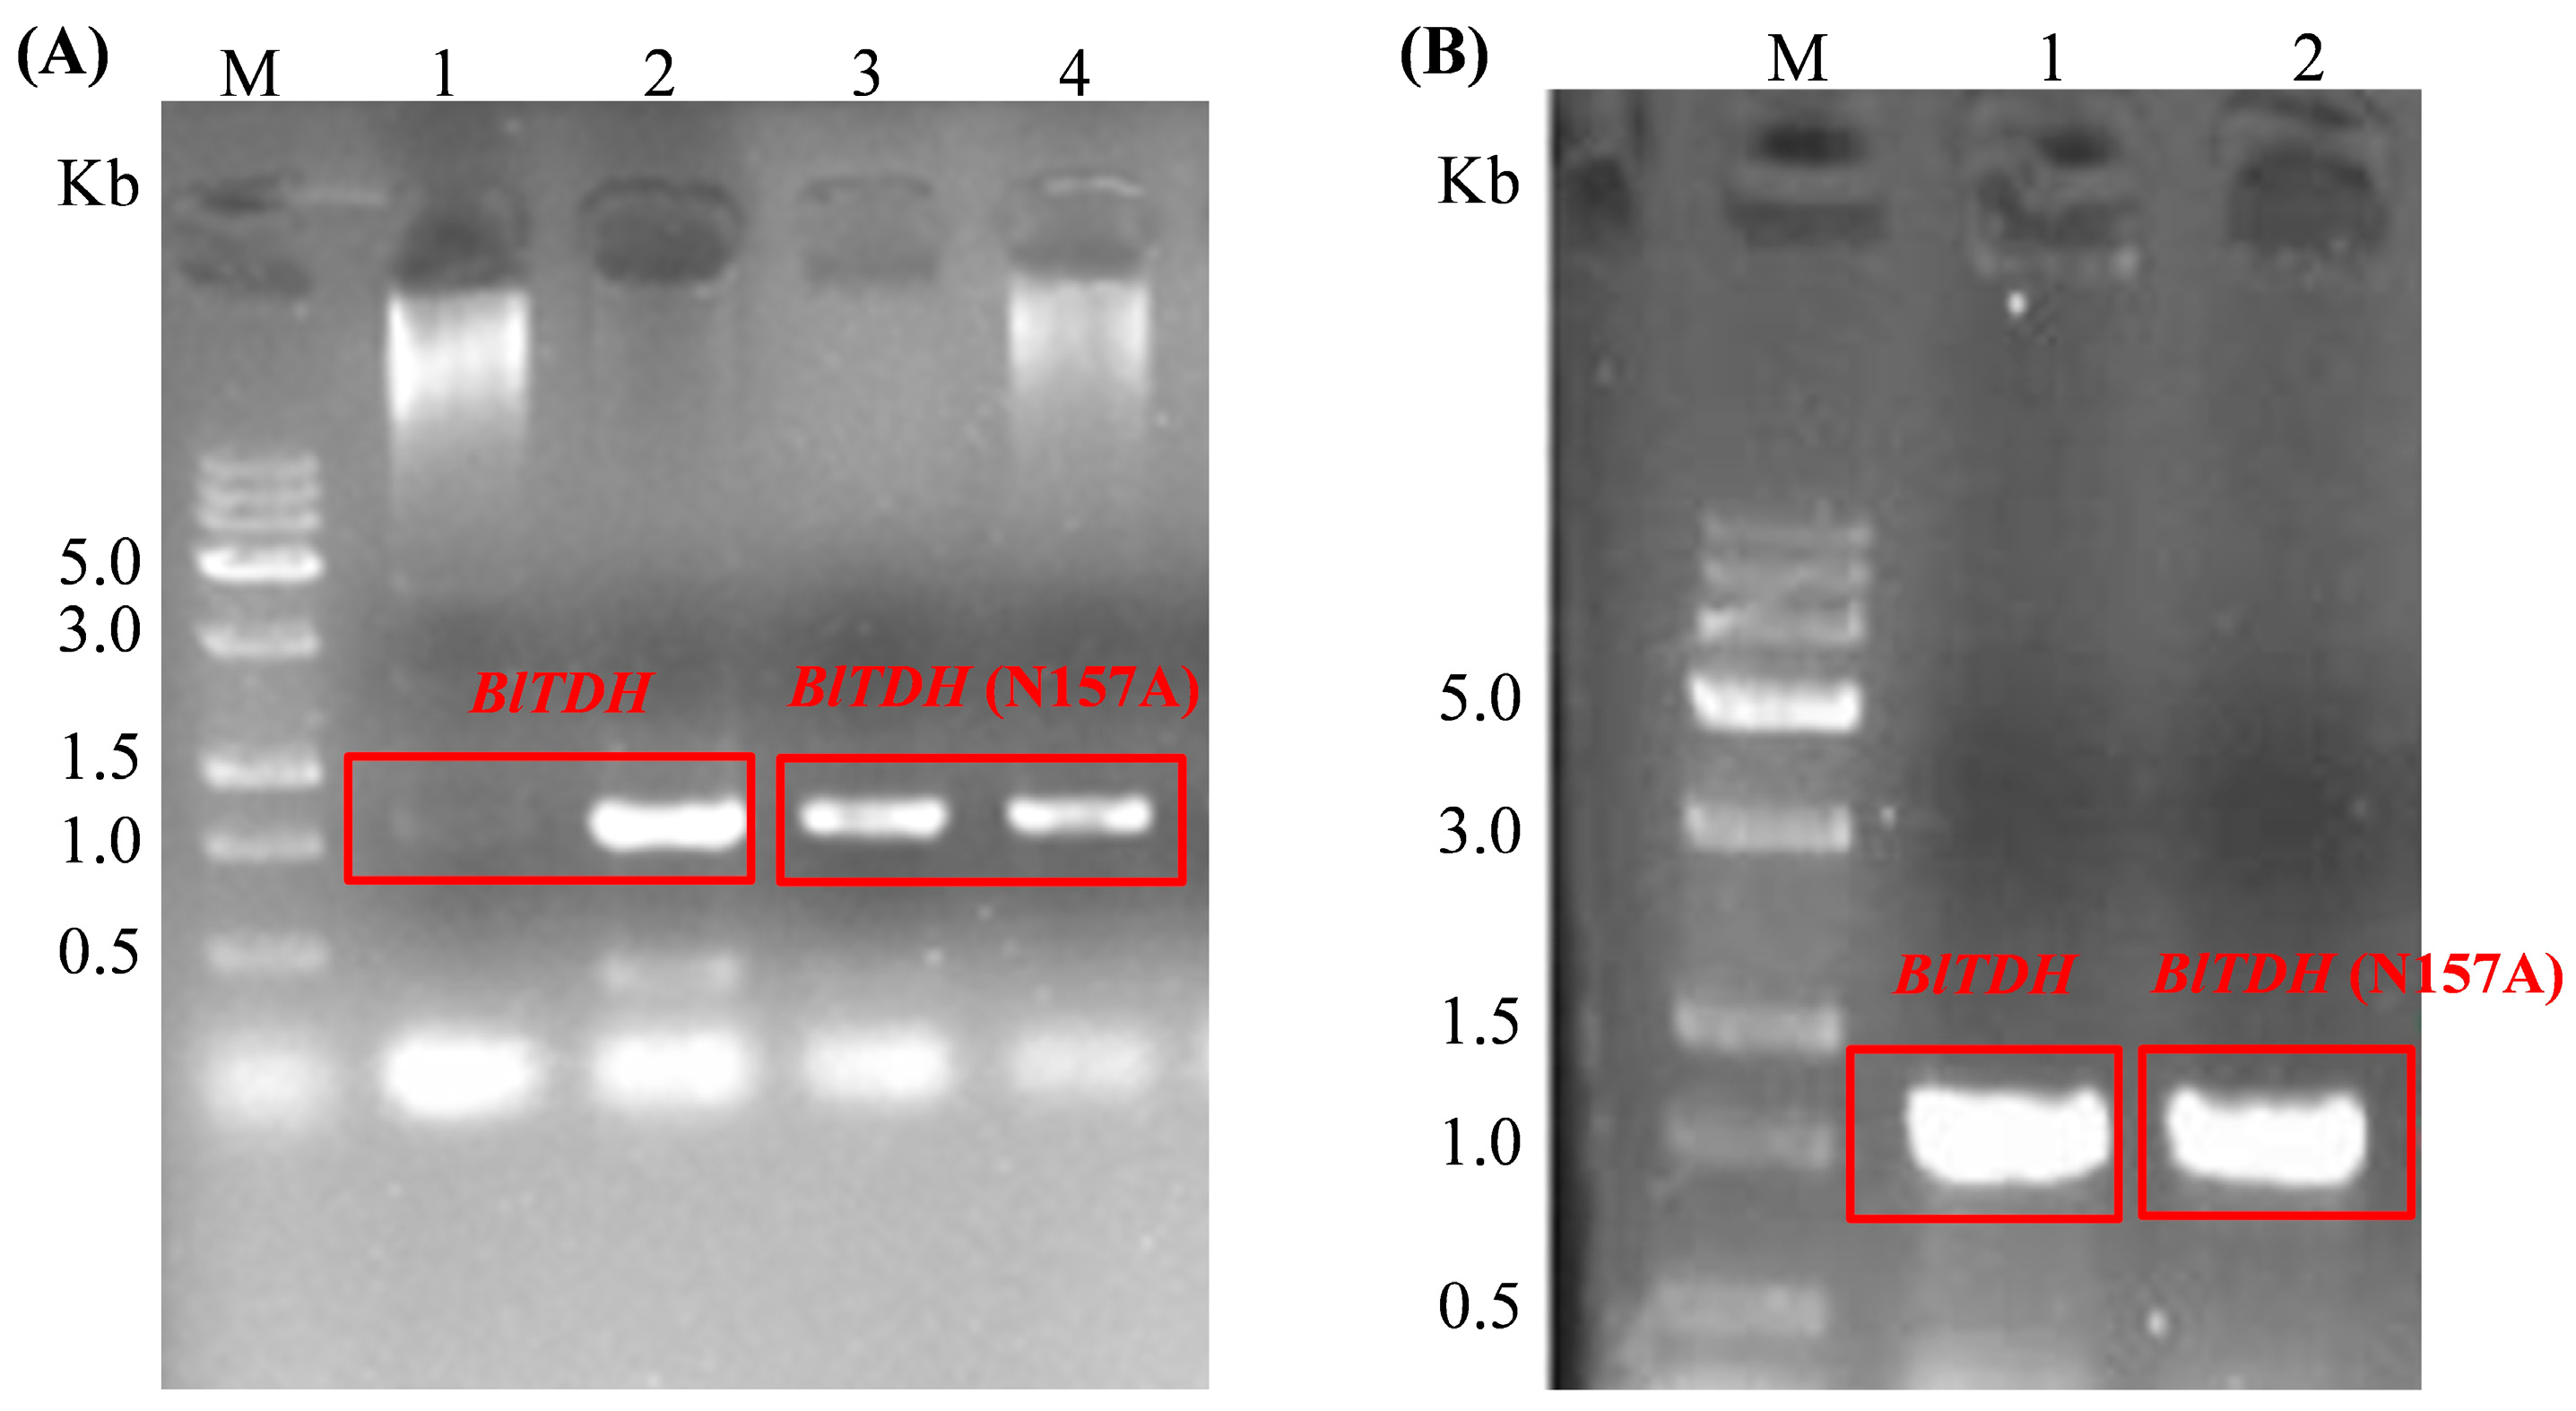
3.1. Construction of BlTDH and BlTDH (N157A) Overexpression Strains
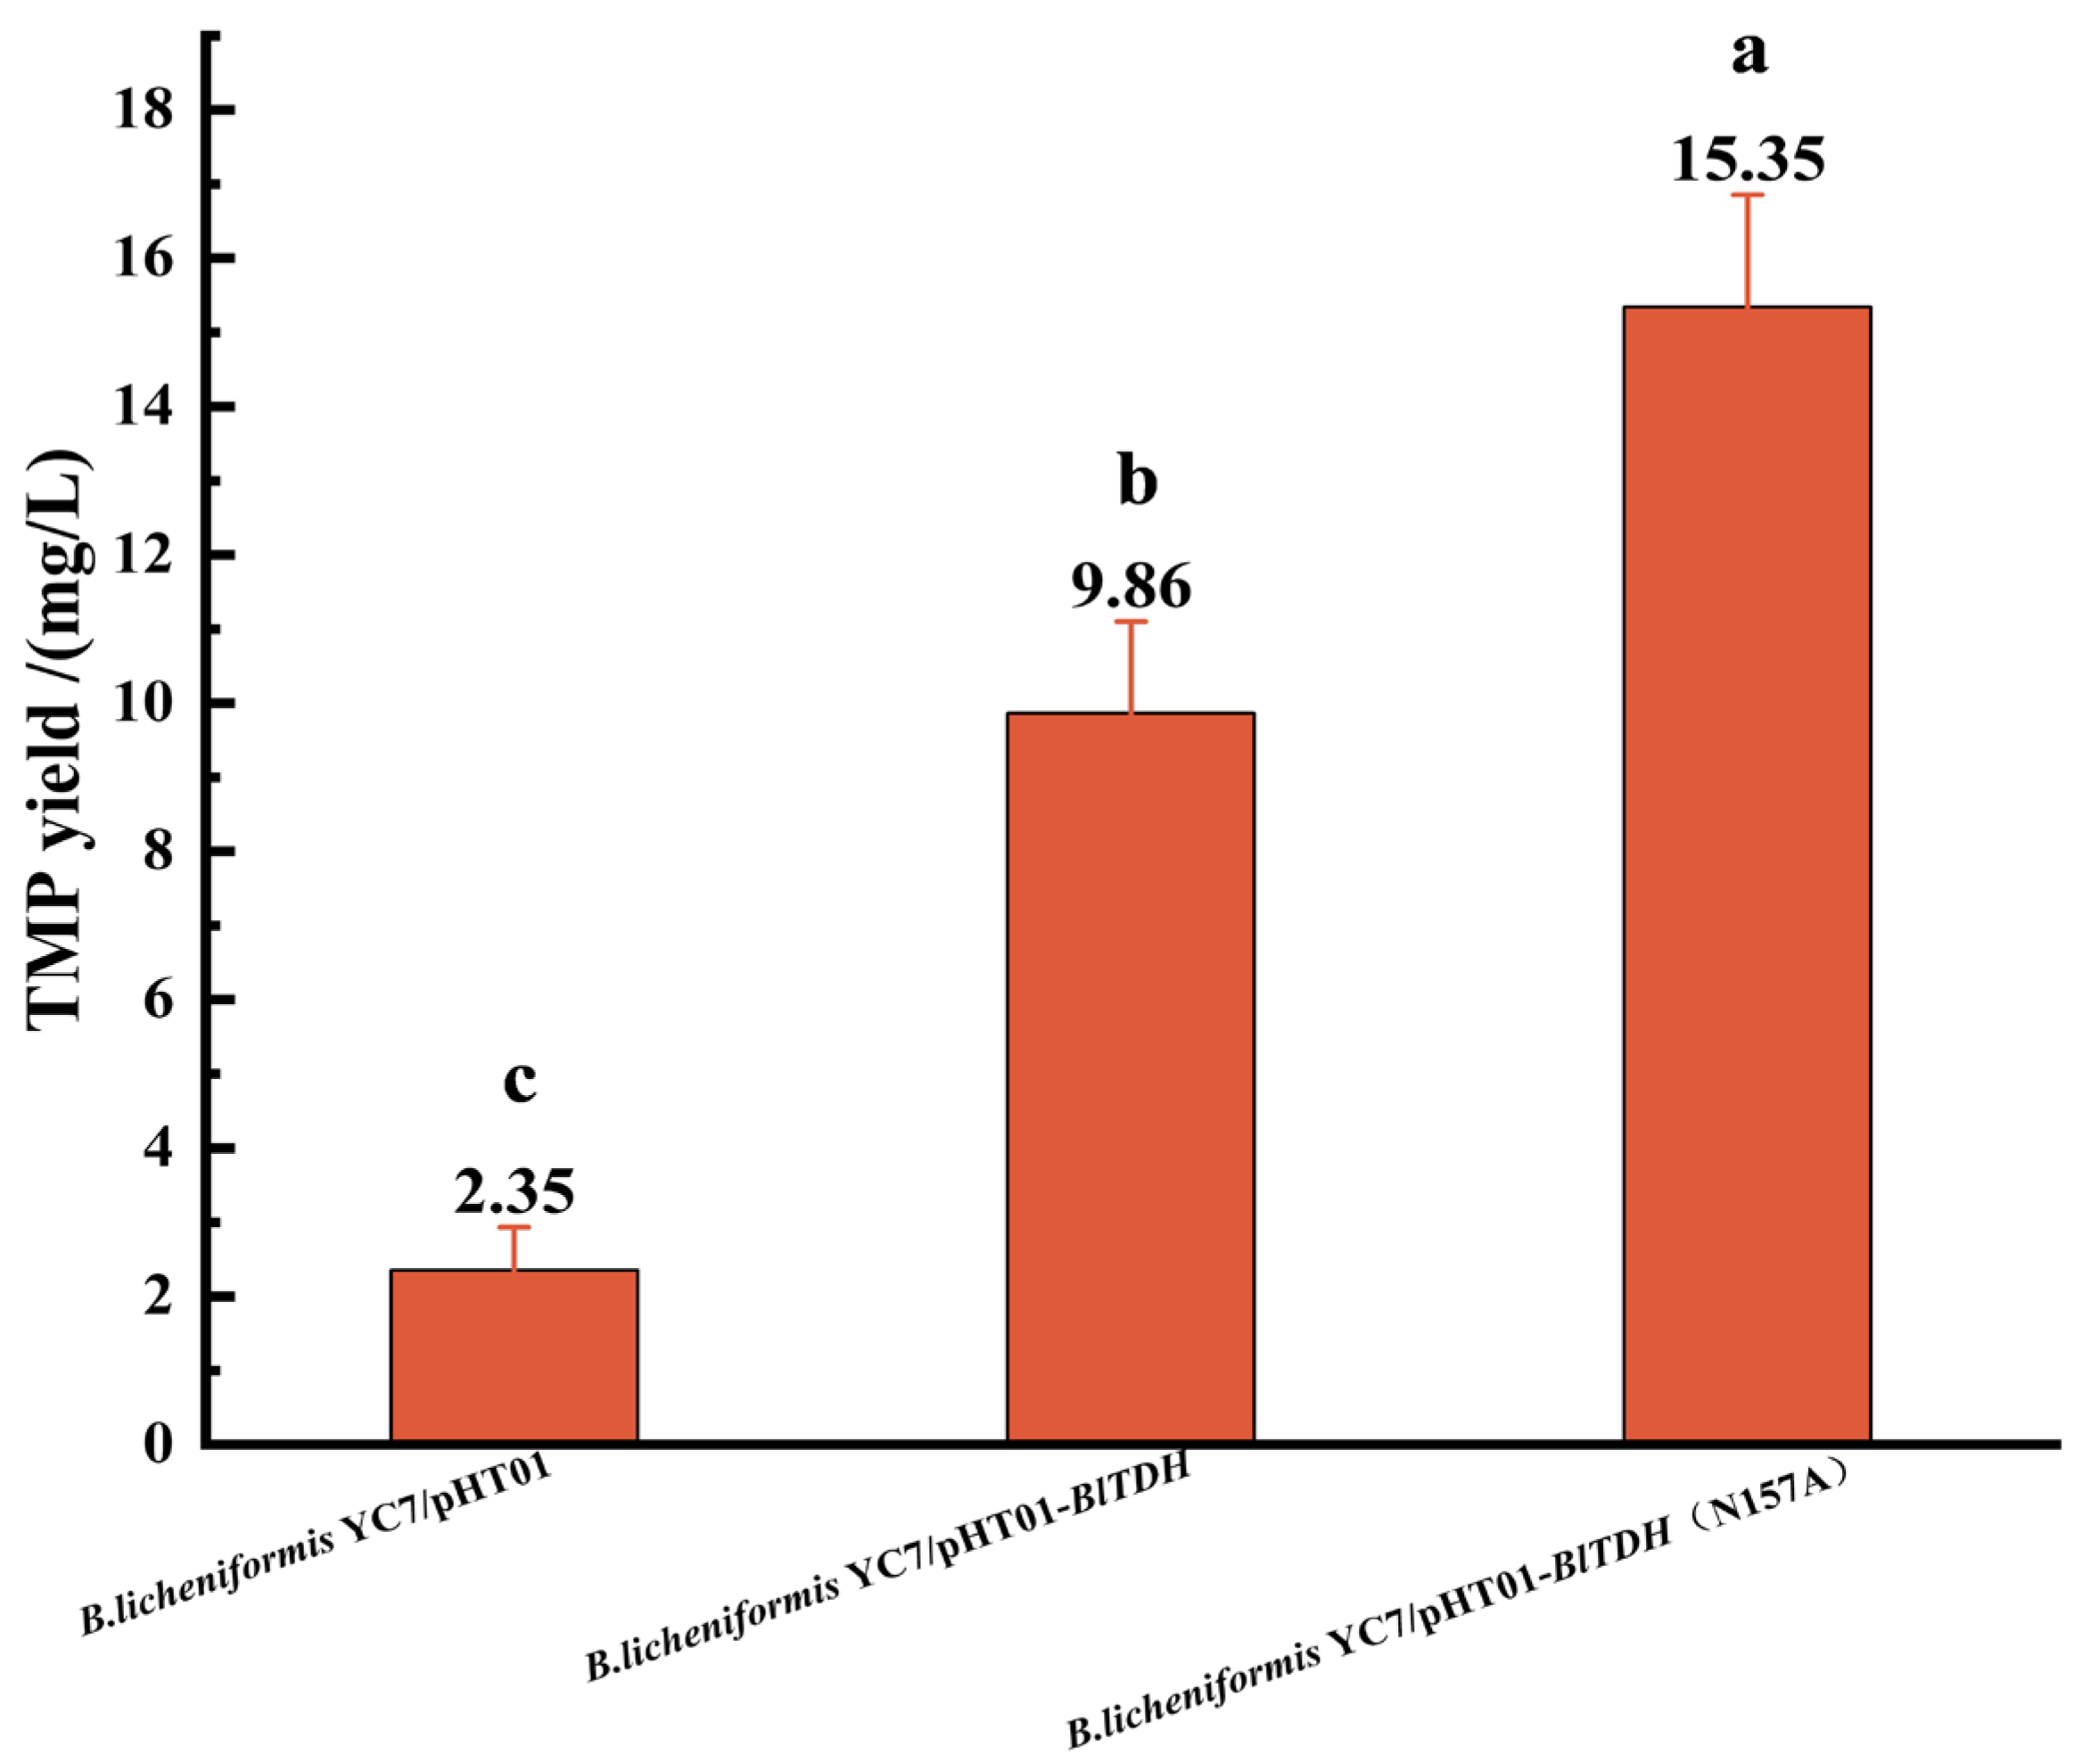
3.2. Fermentation Verification of BlTDH and BlTDH (N157A) Overexpression Strains
3.3. Single-Factor Analysis
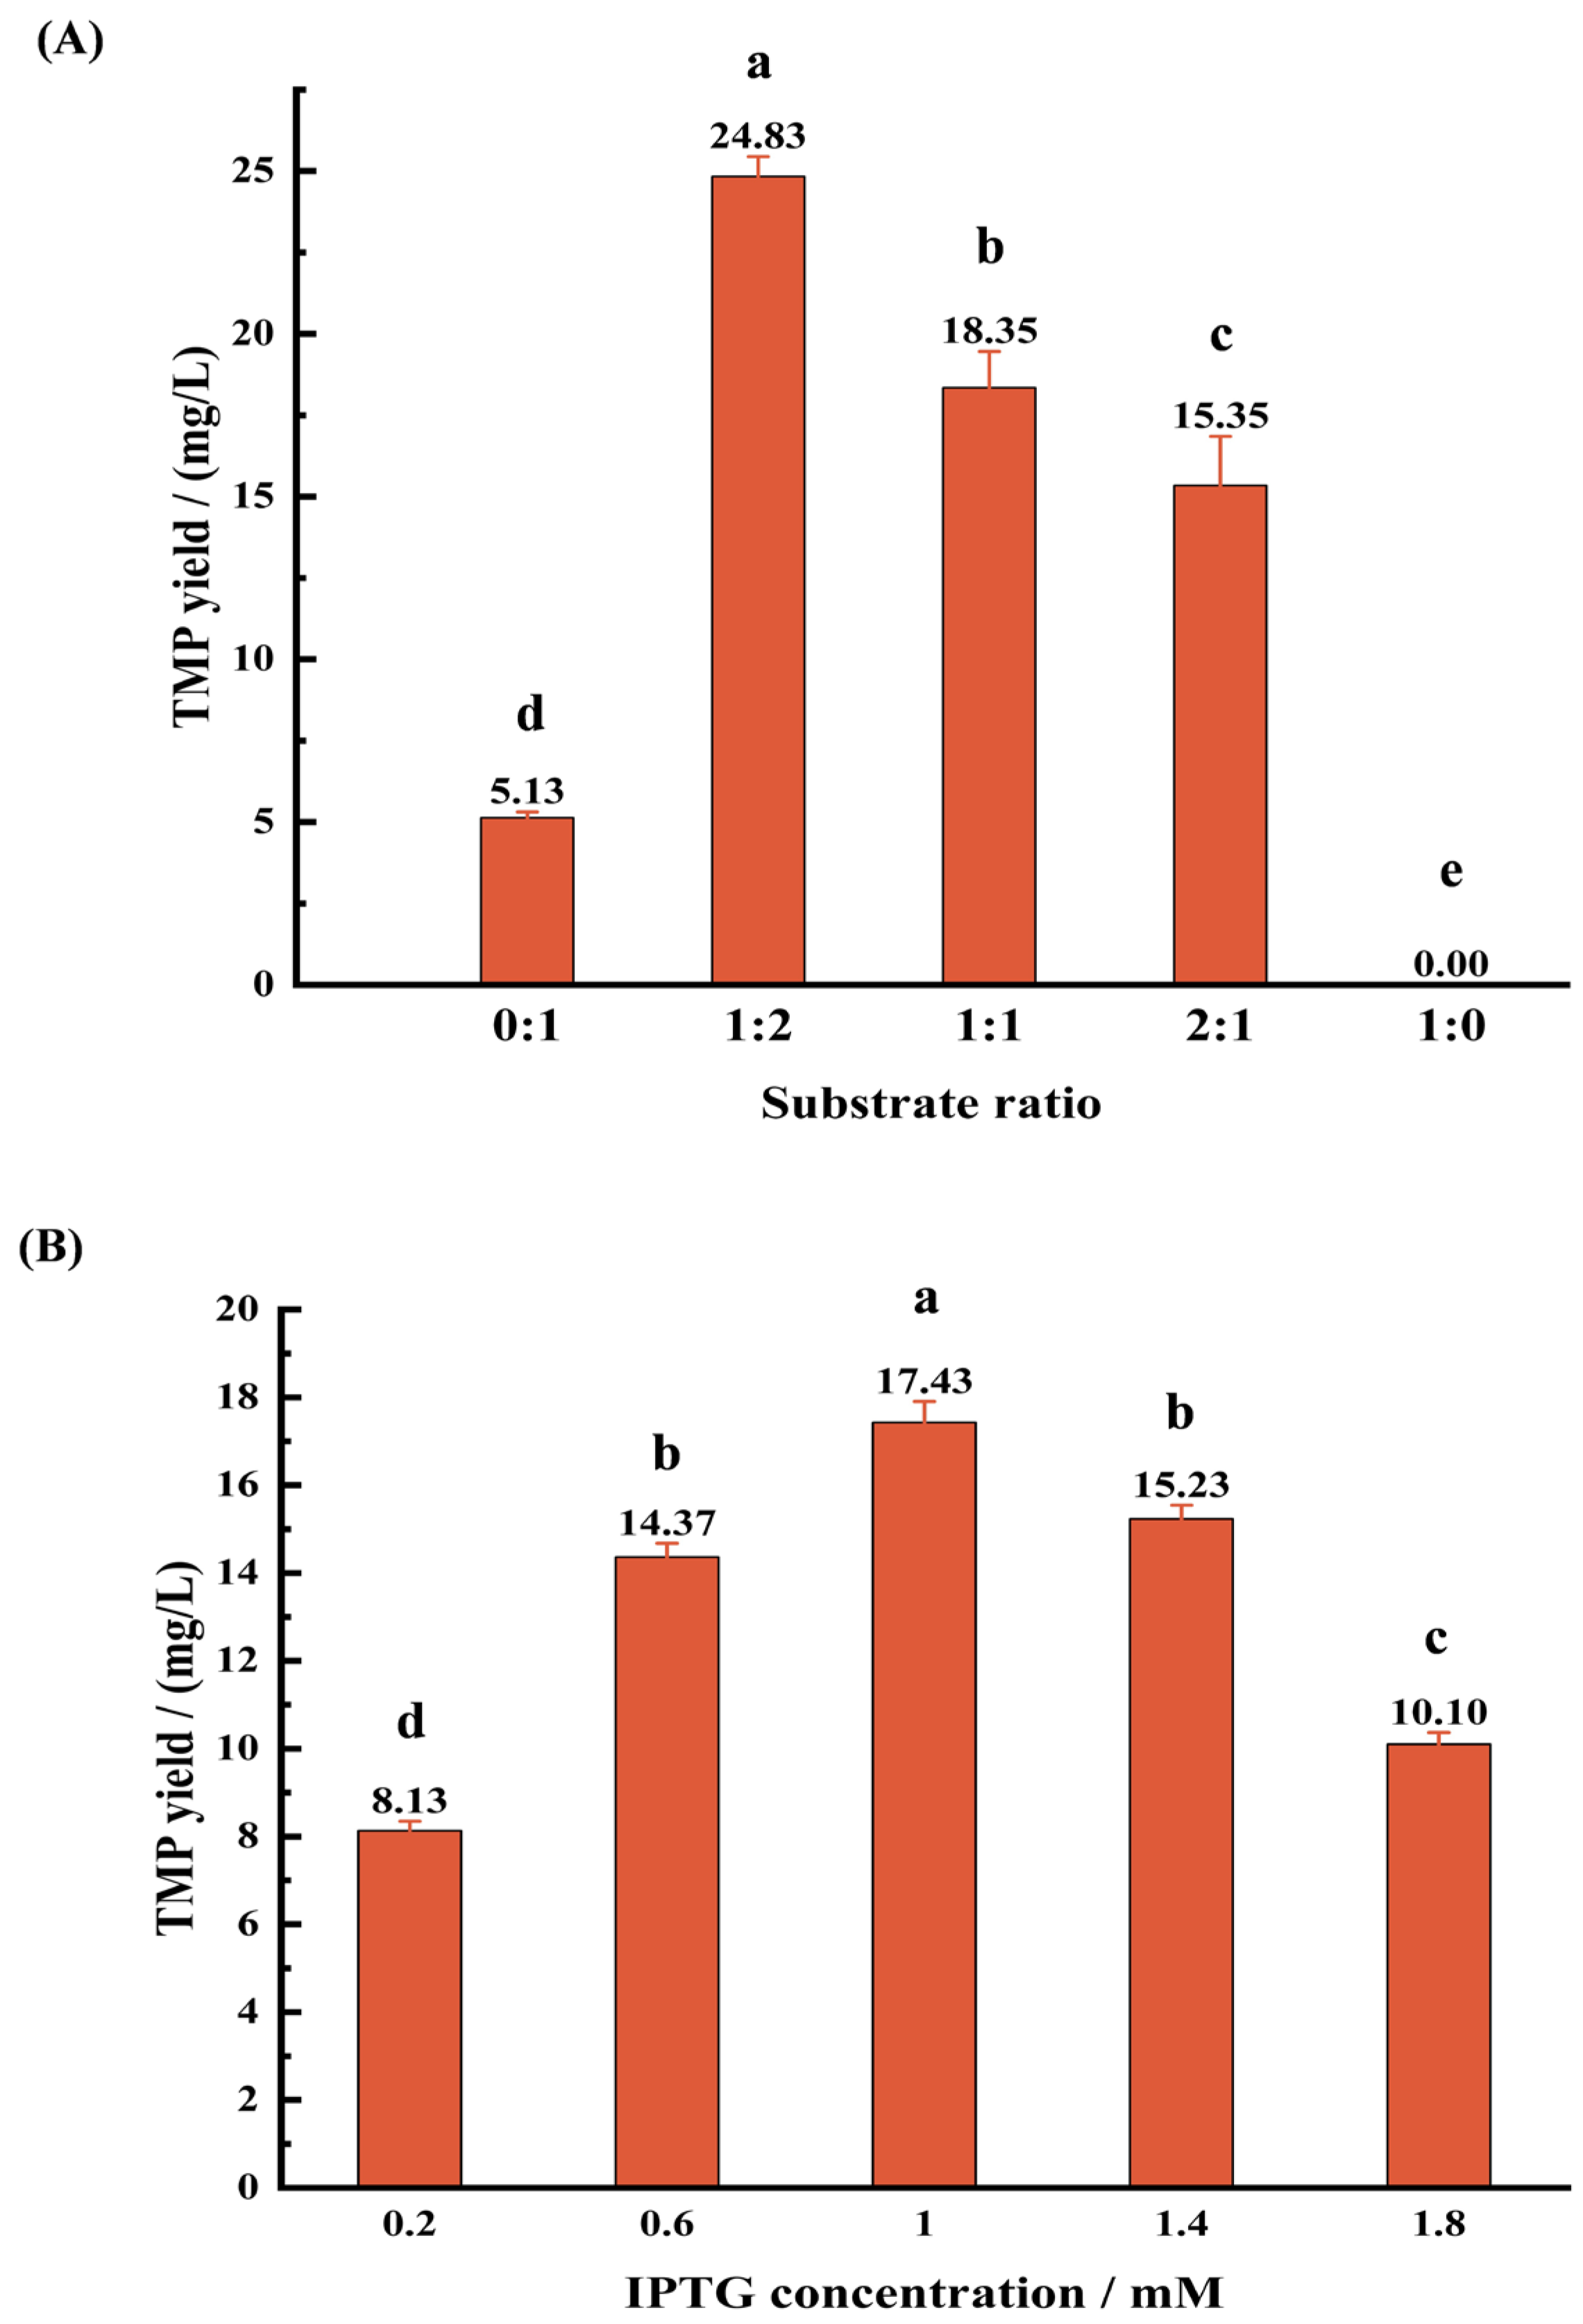
3.3.1. Effect of Substrate Ratio on TMP Production
3.3.2. Effect of IPTG Concentration on TMP Production
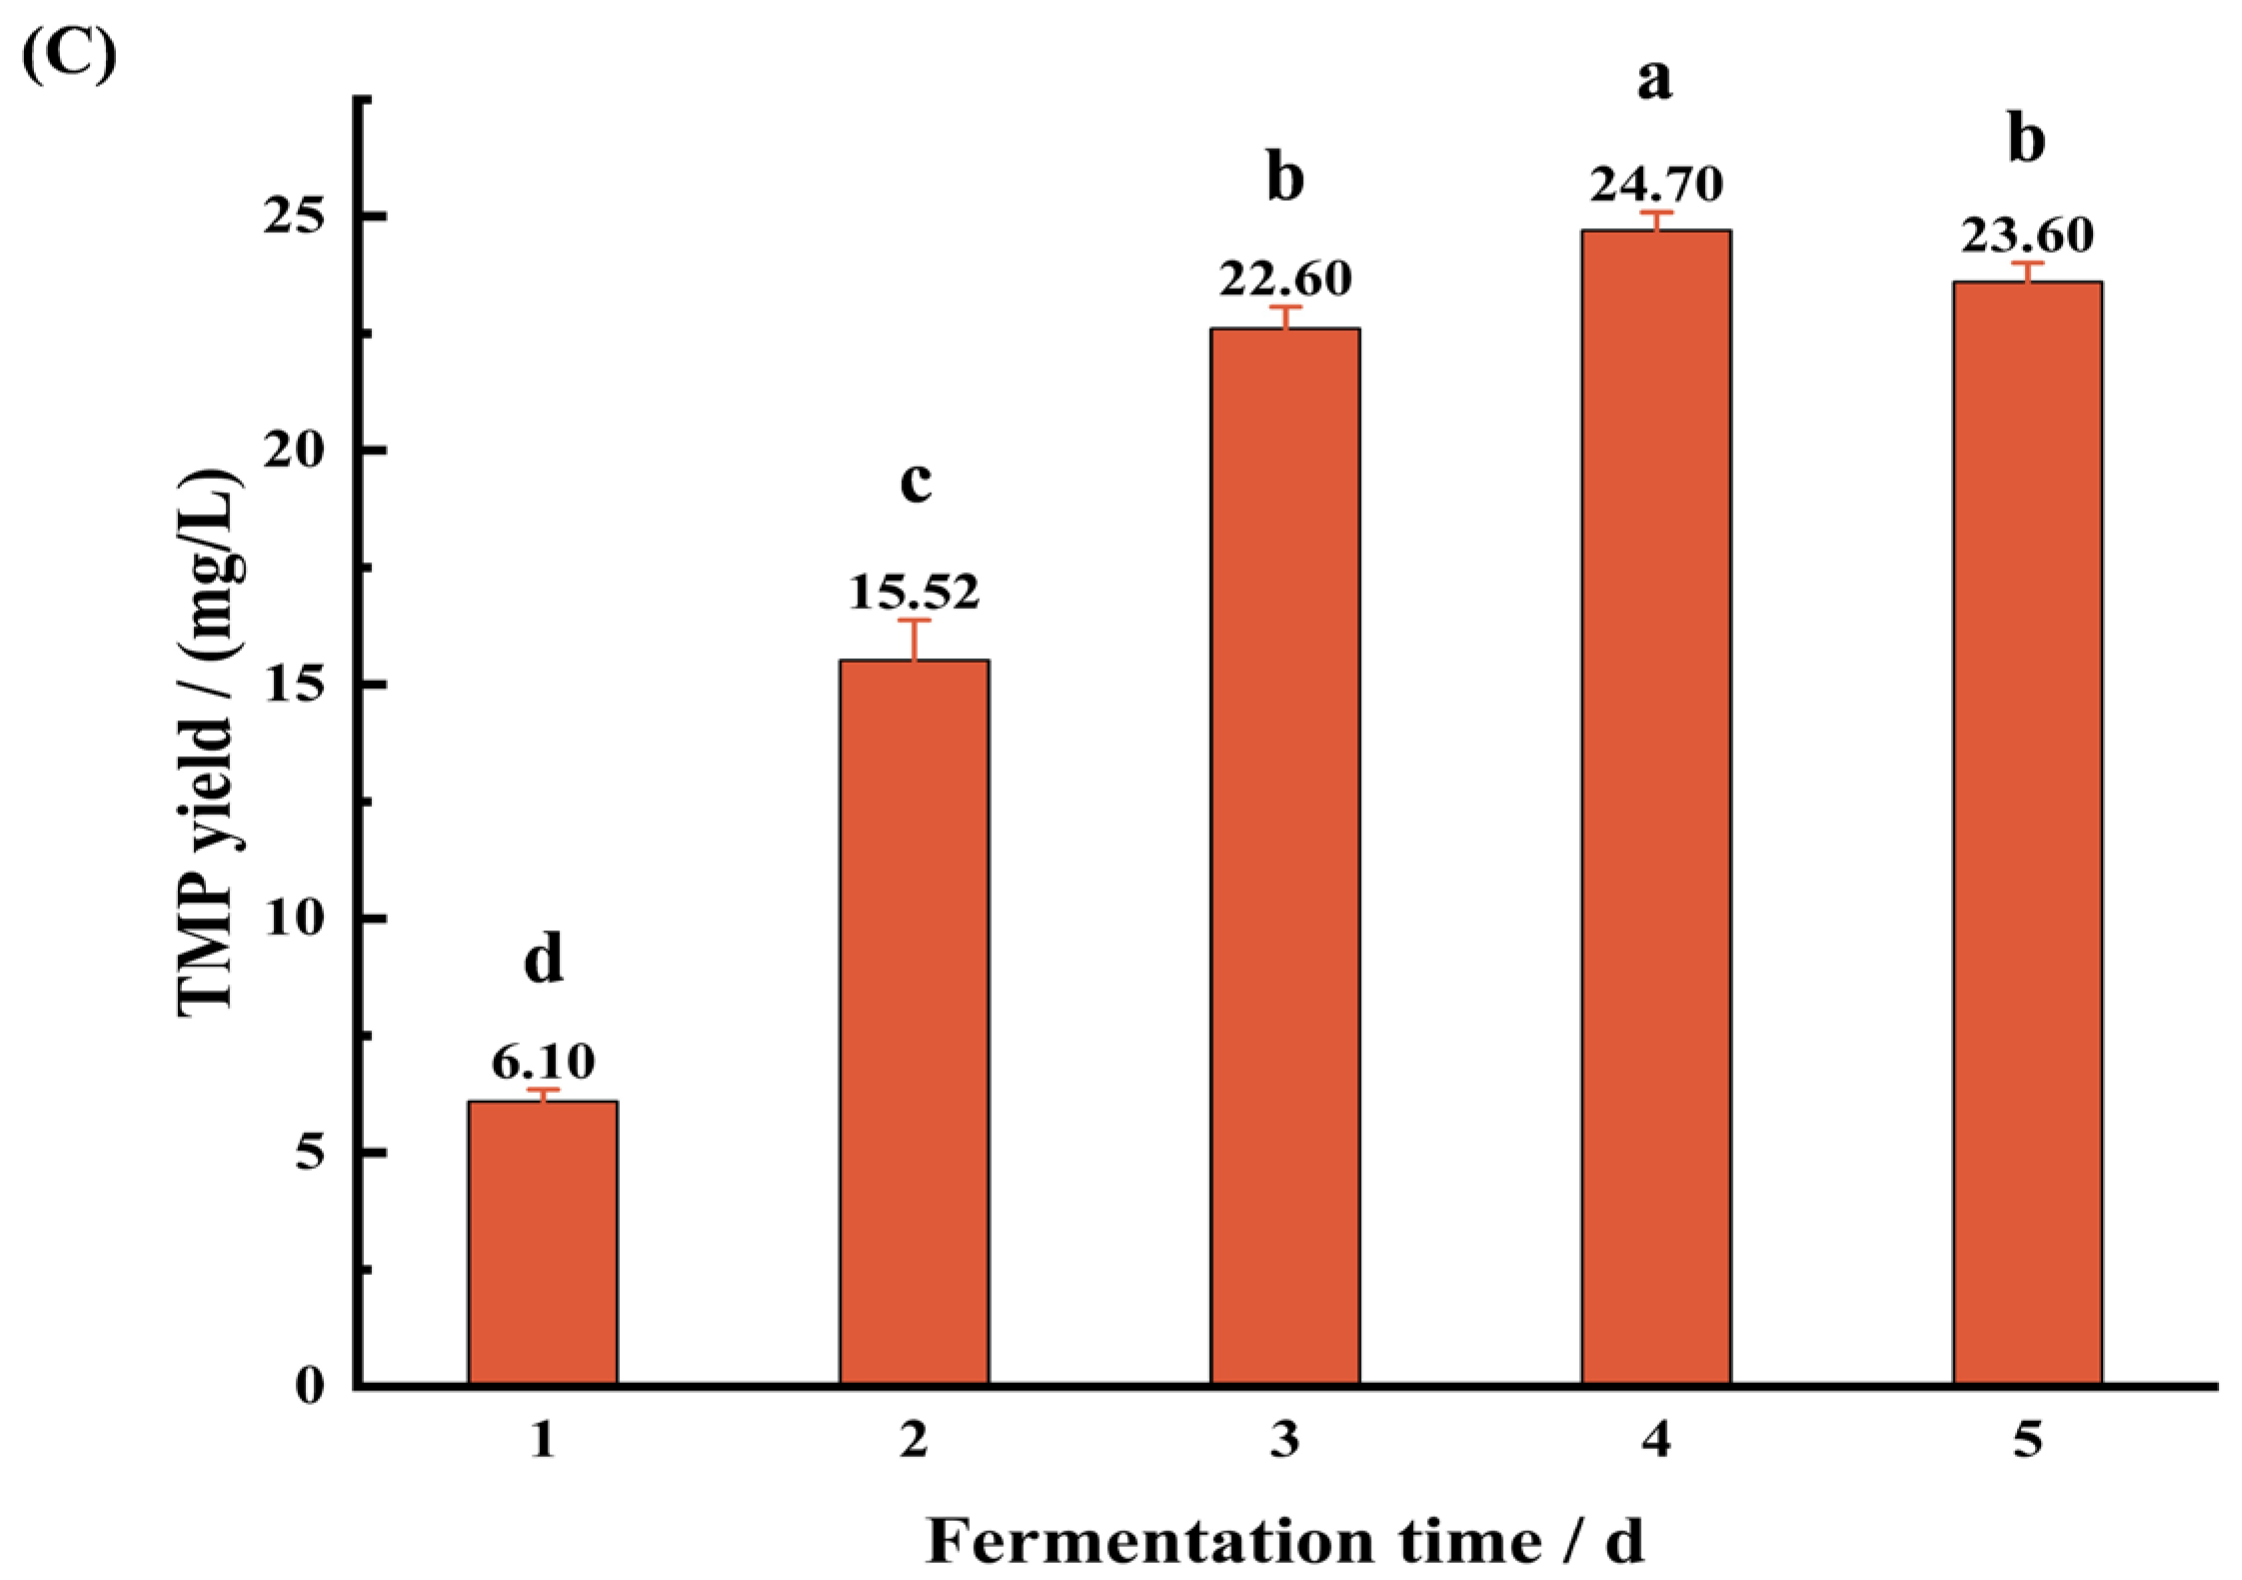
3.3.3. Effect of Fermentation Time on TMP Production
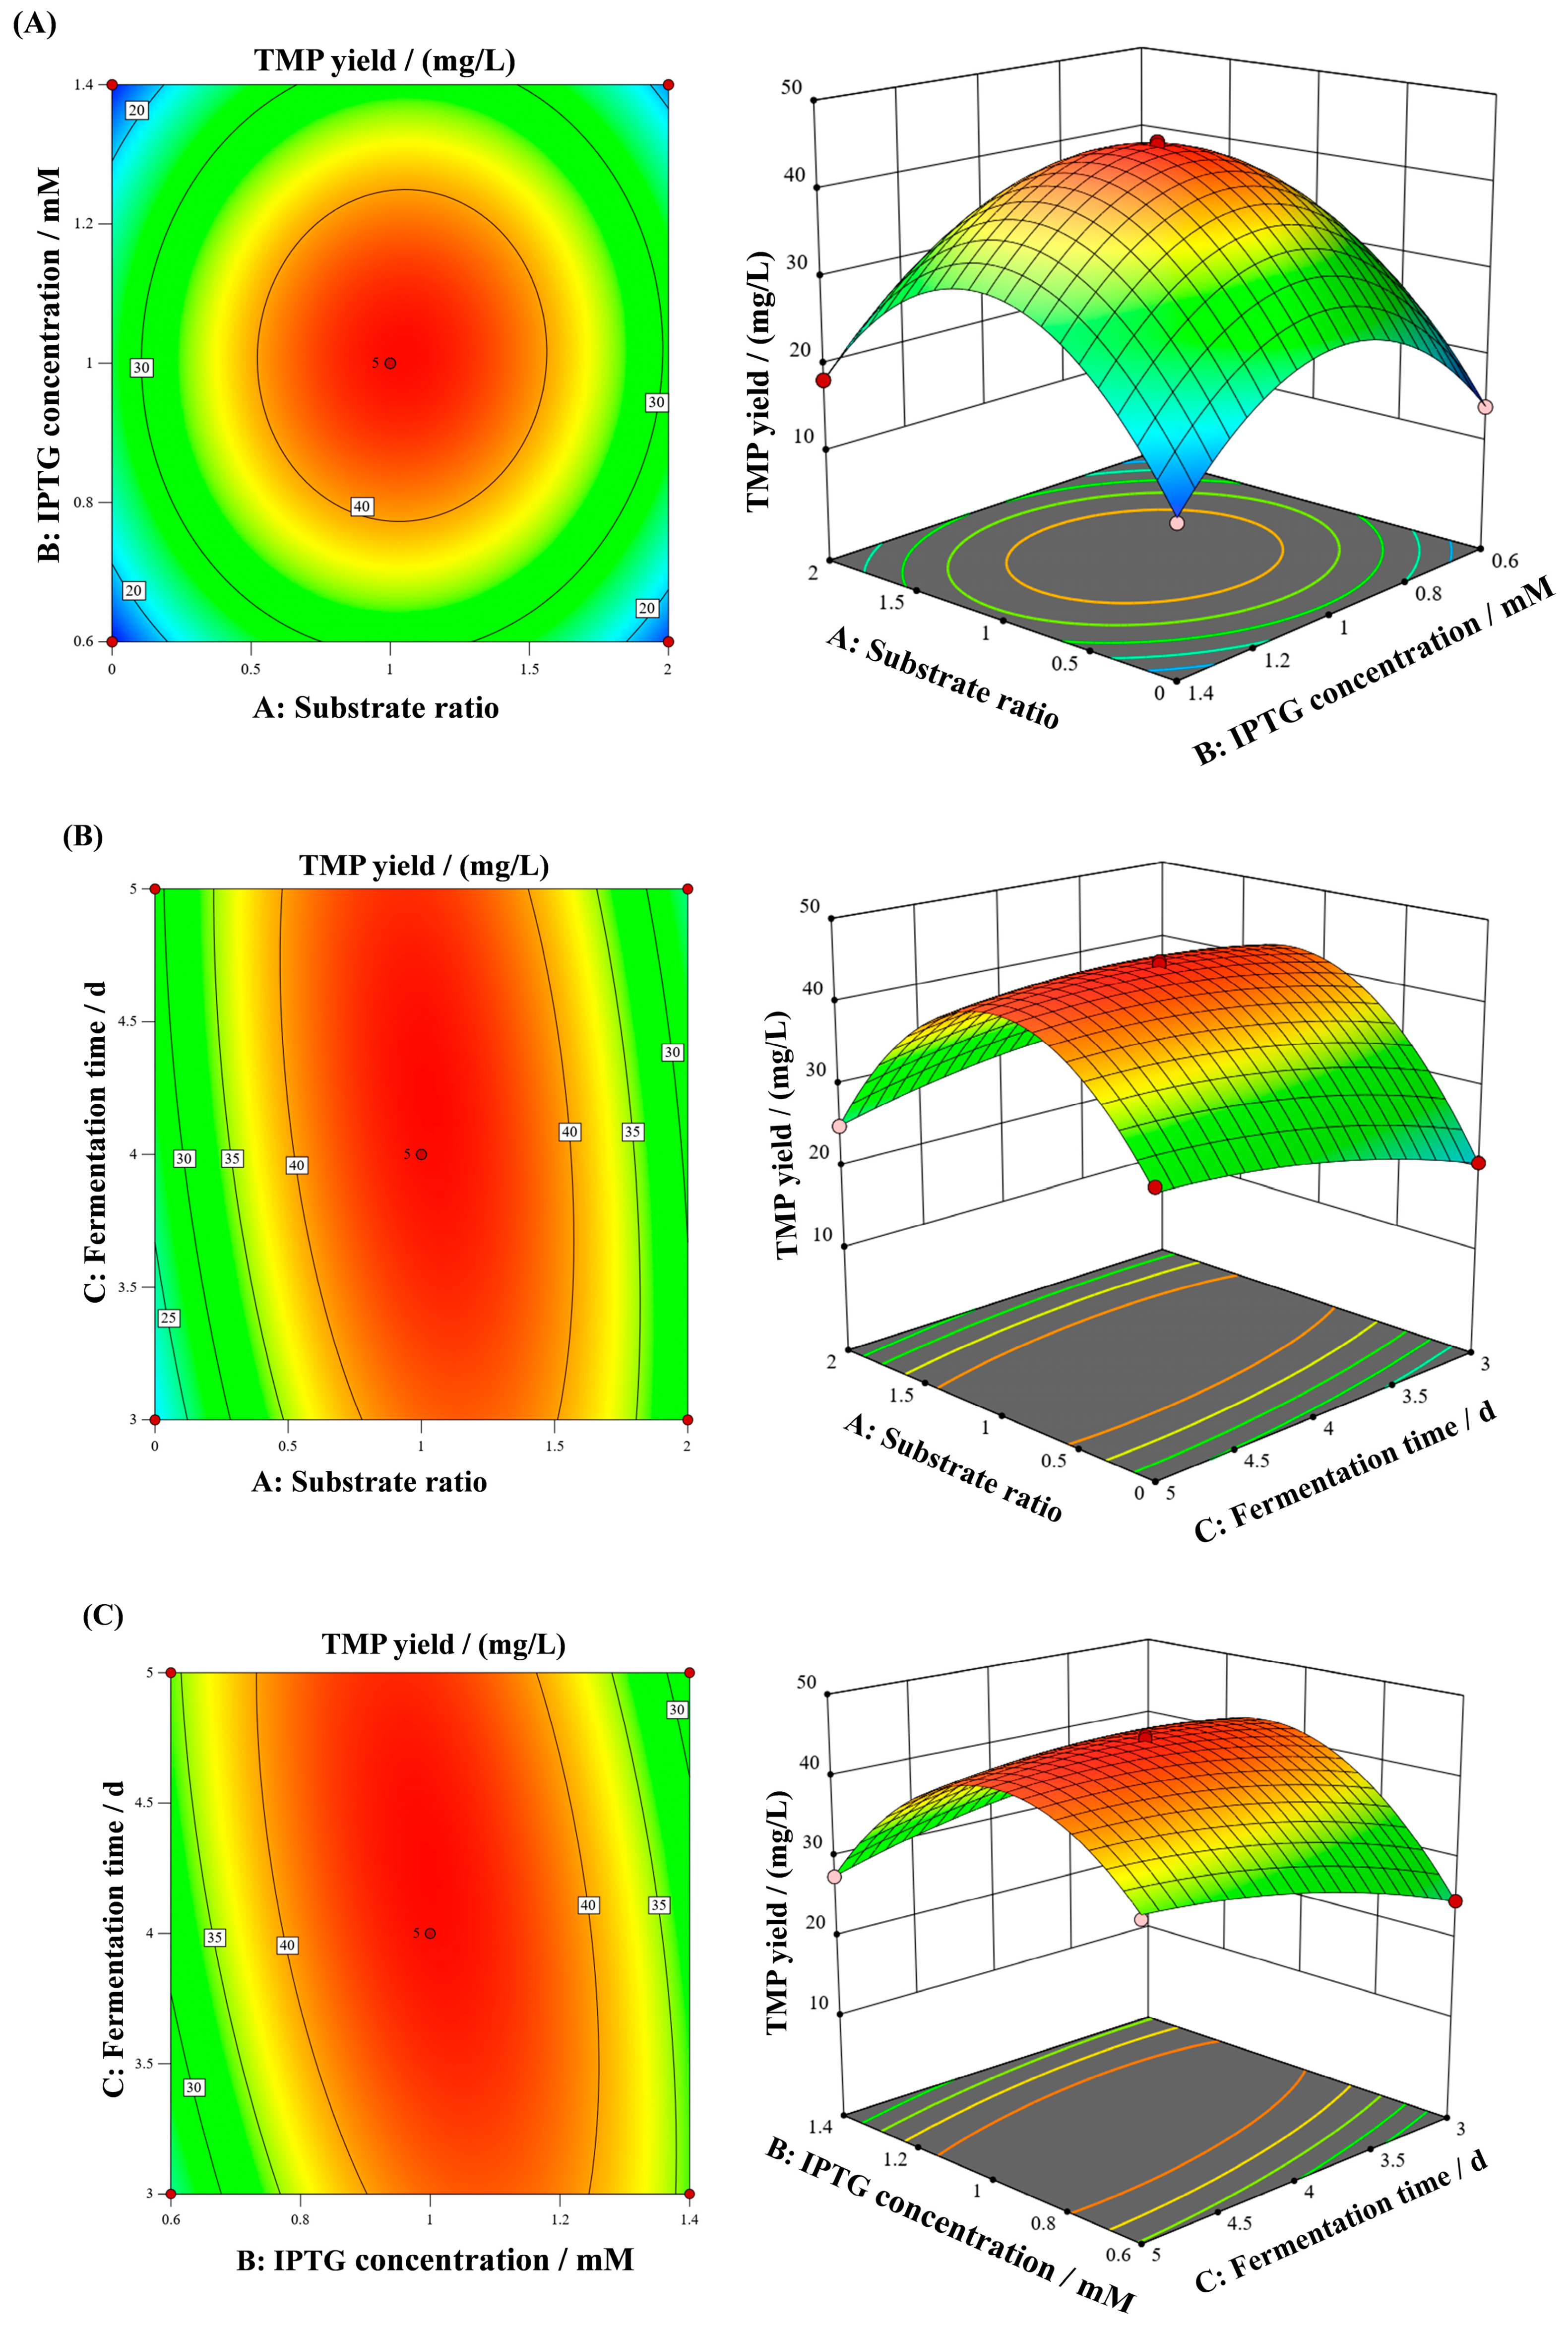
3.4. Response Surface Analysis
3.5. Response Surface Interaction
3.6. Verification Experiments
4. Discussion
5. Conclusions
Author Contributions
Funding
Institutional Review Board Statement
Informed Consent Statement
Data Availability Statement
Conflicts of Interest
References
- Scalone, G.L.L.; Ioannidis, A.G.; Lamichhane, P.; Devlieghere, F.; Kimpe, N.D.; Cadwallader, K.; Meulenaer, B.D. Impact of whey protein hydrolysates on the formation of 2,5-dimethylpyrazine in baked food products. Food Res. Int. 2020, 132, 109089. [Google Scholar] [CrossRef] [PubMed]
- Guido, R.; Gabriele, A.; Giovanna, A.; Vasileios, B.; de Lourdes Bastos, M.; Georges, B.; Sandro, C.P.; Gerhard, F.; Jürgen, G.; Boris, K.; et al. Safety and efficacy of pyrazine derivatives including saturated ones belonging to chemical group 24 when used as flavourings for all animal species. EFSA J. 2017, 15, e04671. [Google Scholar]
- Liu, X.; Quan, W. Progress on the synthesis pathways and pharmacological effects of naturally occurring pyrazines. Molecules 2024, 29, 3597. [Google Scholar] [CrossRef] [PubMed]
- Dela Cruz, E.O.; Muguruma, H.; Jose, W.I.; Pedersen, H. Molecular imprinting of methyl pyrazines. Anal. Lett. 1999, 32, 841–854. [Google Scholar] [CrossRef]
- Liu, H.; Ma, Q.; Xing, J.; Li, P.; Gao, P.; Hamid, N.; Wang, Z.; Wang, P.; Gong, H. Exploring the formation and retention of aroma compounds in ready-to-eat roasted pork from four thermal methods: A lipidomics and heat transfer analysis. Food Chem. 2024, 431, 137100. [Google Scholar] [CrossRef]
- Calva-Estrada, S.; Utrilla-Vázquez, M.; Vallejo-Cardona, A.; Roblero-Pérez, D.; Lugo-Cervantes, E. Thermal properties and volatile compounds profile of commercial dark-chocolates from different genotypes of cocoa beans (Theobroma cacao L.) from Latin America. Food Res. Int. 2020, 136, 109594. [Google Scholar] [CrossRef]
- Asefi, N.; Ebrahimzadegan, S.; Maleki, R.; Seiiedlou-Heris, S.S. Effects of roasting on alkylpyrazin compounds and properties of cocoa powder. J. Food Sci. Technol. 2023, 60, 572–580. [Google Scholar] [CrossRef]
- Eker, T.; Cabaroglu, T.; Darıcı, M.; Selli, S. Impact of kernel size and texture on the in vivo and in vitro aroma compounds of roasted peanut and peanut paste. J. Food Compos. Anal. 2023, 119, 105260. [Google Scholar] [CrossRef]
- Shuang, Z.; Peng, Y.; Xiuli, Z.; Wanning, L.; Lihua, H. Enhanced soy sauce stability and reduced precipitation by improving critical steps in the fermentation process. Food Res. Int. 2023, 174, 113674. [Google Scholar]
- Worben, H.; Timmer, R.; Ter Heide, R.; De Valois, P.J. Nitrogen compounds in rum and whiskey. J. Food Sci. 1971, 36, 464–465. [Google Scholar] [CrossRef]
- Yan, Y.; Chen, S.; Nie, Y.; Xu, Y. Quantitative analysis of pyrazines and their perceptual interactions in soy sauce aroma type baijiu. Foods 2021, 10, 441. [Google Scholar] [CrossRef] [PubMed]
- Gao, Z.; Xie, M.; Gui, S.; He, M.; Lu, Y.; Wang, L.; Chen, J.; Smagghe, G.; Gershenzon, J.; Cheng, D. Differences in rectal amino acid levels determine bacteria-originated sex pheromone specificity in two closely related flies. ISME J. 2023, 17, 1741–1750. [Google Scholar] [CrossRef] [PubMed]
- Mortzfeld, F.B.; Hashem, C.; Vranková, K.; Winkler, M.; Rudroff, F. Pyrazines: Synthesis and industrial application of these valuable flavor and fragrance compounds. Biotechnol. J. 2020, 15, 2000064. [Google Scholar] [CrossRef]
- Grzegorz, K.; Dawid, M.; Katarzyna, P. Pyrazines biosynthesis by Bacillus strains isolated from natto fermented soybean. Biomolecules 2021, 11, 1736. [Google Scholar] [CrossRef]
- Adams, A.; De Kimpe, N. Formation of pyrazines and 2-acetyl-1-pyrroline by Bacillus cereus. Food Chem. 2007, 101, 1230–1238. [Google Scholar] [CrossRef]
- Liu, X.; Yang, W.; Gu, H.; Bughio, A.A.; Liu, J. Optimization of fermentation conditions for 2,3,5-trimethylpyrazine produced by Bacillus amyloliquefaciens from Daqu. Fermentation 2024, 10, 112. [Google Scholar] [CrossRef]
- Tong, W.; Xu, H.; He, P.; Li, Y.; Zhang, Y.; Huang, Z.; Luo, H.; Yang, Y.; Li, D.; Zhao, Z. Multifunctional Lactiplantibacillus plantarum SQ1 from Baijiu Daqu: Application of histamine degradation and probiotic potential in yogurt production. Food Res. Int. 2025, 203, 115911. [Google Scholar] [CrossRef]
- Dickschat, J.S.; Wickel, S.; Bolten, C.J.; Nawrath, T.; Schulz, S.; Wittmann, C. Pyrazine biosynthesis in Corynebacterium glutamicum. Eur. J. Org. Chem. 2010, 2010, 2687–2695. [Google Scholar] [CrossRef]
- Zhang, L.; Cao, Y.; Tong, J.; Xu, Y. An alkylpyrazine synthesis mechanism involving L-threonine-3-dehydrogenase describes the production of 2,5-dimethylpyrazine and 2,3,5-trimethylpyrazine by Bacillus subtilis. Appl. Environ. Microbiol. 2019, 85, e01807–e01819. [Google Scholar] [CrossRef]
- Wang, Q.; Chu, Z.; Wu, H.; Tan, L.; Xu, F.; Gu, F. Optimization of enzymatic process for vanillin extraction using response surface methodology. Molecules 2012, 17, 8753–8761. [Google Scholar] [CrossRef]
- Vagish, D.; Kumar, R.S.; Ranjana, P.; Sanjai, S. Response surface statistical optimization of fermentation parameters for resveratrol production by the endophytic fungus Arcopilus aureus and its tyrosinase inhibitory activity. Biotechnol. Lett. 2020, 43, 627–644. [Google Scholar]
- Liao, P.; Liu, Y.; Zhao, M.; Yang, Y.; Cui, X. The development of a Panax notoginseng medicinal liquor processing technology using the response surface method and a study of its antioxidant activity and its effects on mouse melanoma B16 cells. Food Func. 2017, 8, 4251–4264. [Google Scholar]
- Tao, A.; Feng, X.; Sheng, Y.; Song, Z. Optimization of the Artemisia polysaccharide fermentation process by Aspergillus niger. Front. Nutr. 2022, 9, 842766. [Google Scholar] [CrossRef] [PubMed]
- Wu, M.; Feng, D.; Wang, R.M.; Wang, T.F. Enhanced production of tetramethylpyrazine in Bacillus licheniformis BL1 through aldC over-expression and acetaldehyde supplementation. Sci. Rep. 2020, 10, 3544. [Google Scholar]
- Spizizen, J. Transformation of biochemically deficient strains of Bacillus subtilis by deoxyribonucleate. PNAS 1958, 44, 1072–1078. [Google Scholar] [CrossRef]
- Nie, S.; Liu, K.; Liu, B.; Li, P.; Su, J. Optimization of fermentation conditions for biocatalytic conversion of decanoic acid to trans-2-decenoic acid. Fermentation 2023, 9, 1001. [Google Scholar] [CrossRef]
- Xu, J.; Yu, H.; Chen, X.; Liu, L.; Zhang, W. Accelerated green process of 2,5-dimethylpyrazine production from glucose by genetically modified Escherichia coli. ACS Synth. Biol. 2020, 9, 2576–2587. [Google Scholar] [CrossRef]
- Leite, A.K.F.; Santos, B.N.; Fonteles, T.V.; Rodrigues, S. Cashew apple juice containing gluco-oligosaccharides, dextran, and tagatose promotes probiotic microbial growth. Food Biosci. 2021, 42, 101080. [Google Scholar] [CrossRef]
- Ribeiro, V.T.; Asevedo, E.A.; de Paiva Vasconcelos, L.T.C.; Filho, M.A.O.; de Araújo, J.S.; de Macedo, G.R.; de Sousa Júnior, F.C.; Dos Santos, E.S. Evaluation of induction conditions for plasmid pQE-30 stability and 503 antigen of Leishmania i. chagasi expression in E. coli M15. Appl. Microbiol. Biotechnol. 2019, 103, 6495–6504. [Google Scholar] [CrossRef]
- Gomaa, L.; Loscar, M.E.; Zein, H.S.; Abdel-Ghaffar, N.; Abdelhadi, A.A.; Abdelaal, A.S.; Abdallah, N.A. Boosting isoprene production via heterologous expression of the Kudzu isoprene synthase gene (kIspS) into Bacillus spp. cell factory. AMB Express 2017, 7, 161. [Google Scholar] [CrossRef]
- Li, J.; Zhao, Y.; Qin, Y.; Shi, H. Influence of microbiota and metabolites on the quality of tobacco during fermentation. BMC Microbiol. 2020, 20, 356. [Google Scholar] [CrossRef] [PubMed]
- Van Etten, J.L.; Daly, J.M. Production of host-specific toxins by Helminthosporium victoriae and H. maydis in liquid shake culture. Phytopathology 1980, 70, 727–729. [Google Scholar] [CrossRef]
- Sreekumar, G.; Krishnan, S. Enhanced biomass production study on probiotic Bacillus subtilis SK09 by medium optimization using response surface methodology. Afr. J. Biotechnol. 2010, 9, 8078–8084. [Google Scholar]
- Saxena, R.; Singh, R. Contemporaneous production of amylase and protease through CCD response surface methodology by newly isolated Bacillus megaterium strain B69. Enzym. Res. 2014, 2014, 601046. [Google Scholar] [CrossRef]
- Liu, Y.; Wang, H.; Cai, X. Optimization of the extraction of total flavonoids from Scutellaria baicalensis Georgi using the response surface methodology. J. Food Sci. Technol. 2015, 52, 2336–2343. [Google Scholar] [CrossRef]

| Strain/Plasmid | Feature | Source |
|---|---|---|
| B. licheniformis YC7 | TMP-producing bacteria | Laboratory preservation |
| E. coli DH5α | Plasmid cloned bacteria | Laboratory preservation |
| B. licheniformis YC7/pHT01 | Strain with blank plasmid | This study |
| B. licheniformis YC7/pHT01-BlTDH | Recombinant strain | This study |
| B. licheniformis YC7/pHT01-BlTDH (N157A) | Recombinant strain | This study |
| pHT01 | Expression plasmid | This study |
| pET-28a-BlTDH | Recombinant plasmid | Laboratory preservation |
| pET-28a-BlTDH (N157A) | Recombinant plasmid | Laboratory preservation |
| pHT01-BlTDH | Recombinant plasmid | This study |
| pHT01-BlTDH (N157A) | Recombinant plasmid | This study |
| Factor | Level | ||
|---|---|---|---|
| −1 | 0 | 1 | |
| (A) Substrate ratio | 0:1 | 1:2 | 2:1 |
| (B) IPTG concentration (mM) | 0.6 | 1.0 | 1.4 |
| (C) Fermentation time (d) | 3 | 4 | 5 |
| Test Number | Independent Variables | TMP Yield (mg/L) | ||
|---|---|---|---|---|
| A: Substrate Ratio | B: IPTG Concenteation (mM) | C: Fermentation Time (d) | ||
| 1 | 0:1 | 0.6 | 4 | 13.84 |
| 2 | 2:1 | 0.6 | 4 | 16.05 |
| 3 | 0:1 | 1.4 | 4 | 13.52 |
| 4 | 2:1 | 1.4 | 4 | 18.14 |
| 5 | 0:1 | 1.0 | 3 | 20.68 |
| 6 | 2:1 | 1.0 | 3 | 29.55 |
| 7 | 0:1 | 1.0 | 5 | 29.59 |
| 8 | 2:1 | 1.0 | 5 | 24.96 |
| 9 | 1:2 | 0.6 | 3 | 24.74 |
| 10 | 1:2 | 1.4 | 3 | 34.46 |
| 11 | 1:2 | 0.6 | 5 | 33.63 |
| 12 | 1:2 | 1.4 | 5 | 27.56 |
| 13 | 1:2 | 1.0 | 4 | 44.76 |
| 14 | 1:2 | 1.0 | 4 | 44.57 |
| 15 | 1:2 | 1.0 | 4 | 44.99 |
| 16 | 1:2 | 1.0 | 4 | 44.67 |
| 17 | 1:2 | 1.0 | 4 | 43.11 |
| Source | Sum of Squares | Degrees of Freedom | Mean Square | F-Value | p-Value | Significance |
|---|---|---|---|---|---|---|
| Model | 2084.96 | 9 | 231.66 | 386.06 | <0.0001 | ** |
| A | 15.32 | 1 | 15.32 | 25.53 | 0.0015 | ** |
| B | 3.67 | 1 | 3.67 | 6.12 | 0.0426 | * |
| C | 4.98 | 1 | 4.98 | 8.29 | 0.0237 | * |
| AB | 1.45 | 1 | 1.45 | 2.42 | 0.1638 | |
| AC | 45.56 | 1 | 45.56 | 75.93 | <0.0001 | ** |
| BC | 62.33 | 1 | 62.33 | 103.87 | <0.0001 | ** |
| A2 | 1141.80 | 1 | 1141.80 | 1902.77 | <0.0001 | ** |
| B2 | 664.75 | 1 | 664.75 | 1107.79 | <0.0001 | ** |
| C2 | 13.01 | 1 | 13.01 | 21.67 | 0.0023 | ** |
| Residual | 4.2 | 7 | 0.6001 | |||
| Lack of fit | 1.96 | 3 | 0.6530 | 1.17 | 0.4266 | |
| Pure error | 2.24 | 4 | 0.5604 | |||
| Cor total | 2089.16 | 16 | ||||
| R2 | 0.9980 | |||||
| R2Adj | 0.9954 | |||||
| R2pred | 0.9833 |
Disclaimer/Publisher’s Note: The statements, opinions and data contained in all publications are solely those of the individual author(s) and contributor(s) and not of MDPI and/or the editor(s). MDPI and/or the editor(s) disclaim responsibility for any injury to people or property resulting from any ideas, methods, instructions or products referred to in the content. |
© 2025 by the authors. Licensee MDPI, Basel, Switzerland. This article is an open access article distributed under the terms and conditions of the Creative Commons Attribution (CC BY) license (https://creativecommons.org/licenses/by/4.0/).
Share and Cite
Liu, X.; Gu, H.; Wang, H.; Tang, Z.; Chen, S.; Li, H.; Quan, W. Optimization of Fermentation Conditions for the Production of 2,3,5-Trimethylpyrazine by Recombinant Bacillus licheniformis. Microorganisms 2025, 13, 1477. https://doi.org/10.3390/microorganisms13071477
Liu X, Gu H, Wang H, Tang Z, Chen S, Li H, Quan W. Optimization of Fermentation Conditions for the Production of 2,3,5-Trimethylpyrazine by Recombinant Bacillus licheniformis. Microorganisms. 2025; 13(7):1477. https://doi.org/10.3390/microorganisms13071477
Chicago/Turabian StyleLiu, Xun, Hongyi Gu, Handong Wang, Zhen Tang, Shuanglian Chen, Han Li, and Wenli Quan. 2025. "Optimization of Fermentation Conditions for the Production of 2,3,5-Trimethylpyrazine by Recombinant Bacillus licheniformis" Microorganisms 13, no. 7: 1477. https://doi.org/10.3390/microorganisms13071477
APA StyleLiu, X., Gu, H., Wang, H., Tang, Z., Chen, S., Li, H., & Quan, W. (2025). Optimization of Fermentation Conditions for the Production of 2,3,5-Trimethylpyrazine by Recombinant Bacillus licheniformis. Microorganisms, 13(7), 1477. https://doi.org/10.3390/microorganisms13071477