Article

Impact of c-di-AMP Accumulation, L-cysteine, and Oxygen on Catalase Activity and Oxidative Stress Resistance of Listeria monocytogenes 10403S

by
Mahide Muge Yilmaz Topcam
,
Dimitrios P. Balagiannis
and
Kimon Andreas G. Karatzas
*
Department of Food and Nutritional Sciences, School of Chemistry, Food and Pharmacy, University of Reading, Reading RG6 6AD, UK
*
Author to whom correspondence should be addressed.
Microorganisms 2025, 13(6), 1400; https://doi.org/10.3390/microorganisms13061400
Submission received: 24 May 2025 / Revised: 11 June 2025 / Accepted: 13 June 2025 / Published: 16 June 2025
(This article belongs to the Special Issue Exploring Foodborne Pathogens: From Molecular to Safety Perspectives)

Abstract

:
Listeria monocytogenes is a foodborne pathogen frequently exposed to oxidative stress in diverse environmental conditions. Cyclic di-AMP (c-di-AMP) is a second messenger that plays a key role in stress resistance. This study investigates the role of pdeA (degrades c-di-AMP) and how c-di-AMP accumulation affects catalase activity and oxidative stress response and gene expression. Survival and catalase activity assays were conducted under oxidative stress, and c-di-AMP levels were quantified in L. monocytogenes 10403S under aerobic, anaerobic, and L-cysteine-supplemented conditions. ΔpdeA, which accumulates c-di-AMP, exhibited greater sensitivity to oxidative stress (4.6 log reduction for the wild type (WT) vs 7.34 log reduction for ΔpdeA at 10 h) and lower catalase activity than the WT in the early stationary phase. However, in the late stationary phase, while the catalase activity levels of ΔpdeA remained stable (~6.33 cm foam height), it became resistant to oxidative stress (5.85 log reduction). These findings indicate that pdeA contributes to catalase activity in L. monocytogenes. Transcriptomic analysis revealed differential expression of pathways mainly including pentose phosphate pathway, carbon metabolism, O-antigen nucleotide sugar biosynthesis and ABC transporters in ΔpdeA compared to WT. Our transcriptomic data provided promising insights into the molecular mechanisms underlying c-di-AMP regulation, which may enhance stress resistance. Moreover, oxidative stress led to increased intracellular c-di-AMP levels. Under L-cysteine supplementation, catalase activity levels in WT were similar to ΔpdeA (~1.86 cm foam height for both), but the latter showed enhanced oxidative stress resistance and c-di-AMP levels. Anaerobic conditions also elevated c-di-AMP levels in WT and ΔpdeA but resulted in greater oxidative stress sensitivity. Understanding these regulatory mechanisms provides valuable insights into oxidative stress resistance, with potential implications for food safety and pathogen control.

1. Introduction

Listeria monocytogenes is a Gram-positive, pathogenic bacteria commonly found in the environment and known for its ability to survive under adverse conditions [1]. It is an intracellular pathogen that can enter and multiply within the cells of mammals and causes listeriosis, which mostly affects immunocompromised individuals, the elderly and pregnant women [2]. L. monocytogenes is often found contaminating food, which is a significant concern for the food industry. When ingested, it can cross the intestinal epithelial barrier, invade cells, reproduce inside them by using various virulence factors such as internalins and haemolysis, and subsequently localise itself in different parts of the body [3]. During infection or growth in the host, L. monocytogenes must endure several stressors, such as the acidic conditions of the stomach, bile in the gastrointestinal tract, and low-oxygen or oxygen-free conditions. Its ability to effectively respond to these challenges is crucial for its presence and survival [4].
During extracellular or intracellular growth, L. monocytogenes is exposed to oxidative stress that requires the development of response mechanisms to cope with the harmful effects of reactive oxygen species (ROS) [5]. Host cells combat L. monocytogenes by initiating a respiratory burst, which causes exposure of invaders to ROS, including hydrogen peroxide and superoxide [6]. Superoxide dismutase (SOD) converts anions to hydrogen peroxide, and catalase breaks them down into oxygen and water. Therefore, catalase and SOD collaborate to detoxify ROS [5]. In addition, L. monocytogenes encounters low-oxygen or anaerobic conditions in the environment, including soil, vacuum packaging, and the host intestine. It is known that anaerobic conditions are involved in the virulence of L. monocytogenes [7]. Anaerobic growth increased the resistance of highly virulent L. monocytogenes strains towards bile salt compared to aerobic growth [8]. Moreover, anaerobically cultivated L. monocytogenes cells were found to have a higher invasion potential [9] as these conditions are an important signal for the upregulation of internalins that mediate invasion and initiate the intracellular cycle [10]. During its passage through the gastrointestinal tract, L. monocytogenes faces oxidative stress due to the ROS produced by the host immune system [11].
Cyclic di-adenosine monophosphate (c-di-AMP), which is a critical bacterial signalling nucleotide, regulates bacterial growth and replication, maintains cell wall integrity, modulates responses to various stress conditions, and plays a role in cell physiology, such as in potassium transport, synthesis of fatty acids, and biofilm formation, all of which are important for a successful bacterial infection [12,13,14]. While diadenylate cyclases (DACs) are responsible for the production of c-di-AMP, phosphodiesterases (PDEs) degrade it. Although c-di-AMP plays a crucial role in bacterial growth and metabolism, its excessive production could be harmful to cellular functions. PDE proteins, which are encoded by pdeA and pgpH in L. monocytogenes [15], allow bacteria to detect increased levels of c-di-AMP and initiate its hydrolysis, thereby regulating its concentration within the bacterial cell to maintain an optimal level [12,14].
The intracellular signals play a role in multi-stress resistance mechanisms, including oxidative stress, in various bacteria [16,17]. Essentially, the presence of two distinct PDEs in L. monocytogenes with unique functions suggests a complex regulatory system for c-di-AMP levels [15,18]. Disruption in this system can result in imbalance and potential toxicity from excessive c-di-AMP might hinder the bacterium’s ability to cope with various stresses. This highlights the importance of precise c-di-AMP control for maintaining bacterial resilience [18]. Elevated or decreased concentrations of c-di-AMP due to a mutation in PDEs and DACs result in sensitivity to oxidative stress in some bacteria [19,20,21,22,23,24,25], and a similar effect might also be observed in L. monocytogenes.
Moreover, nitrogen sources, glutamate, and glutamine [26] affect the c-di-AMP levels in many microorganisms, including S. aureus [27] and B. subtilis [28]. Potassium ions, which are crucial for facilitating glutamate transport during acid stress [29,30], have been shown to increase intracellular c-di-AMP levels in L. monocytogenes [31]. In L. monocytogenes, cysteine is another nitrogen-containing metabolite essential for growth and redox balance. It can be synthesized from glutamate and glycine or acquired directly from the host cytosol [32].
Although the role of c-di-AMP in oxidative stress resistance in L. monocytogenes is not yet fully understood, further investigation is needed to clarify its specific impact. Therefore, this study aimed to investigate the role of pdeA, and c-di-AMP accumulation in oxidative stress resistance, particularly through its influence on catalase activity. Since catalase protects cells against reactive oxygen species and its activity significantly affects oxidative stress resistance [33,34], we assessed how pdeA and c-di-AMP affect catalase activity under both aerobic and anaerobic conditions. Moreover, given its metabolic link to glutamate and its role in oxidative stress resistance, L-cysteine was included to evaluate its effect on intracellular c-di-AMP levels.

2. Materials and Methods

2.1. Bacterial Strains and Growth Conditions

L. monocytogenes 10403S WT (wild type) and its isogenic ΔpdeA mutant were used throughout this study (Table 1; University of Reading, KAK Collection). Overnight cultures in 3 mL BHI were mixed with DMSO (Sigma-Aldrich, Dorset, UK) to a final concentration of 7% (v/v) and stored at −80 °C as stock cultures. Prior to the experiments, stock cultures were streaked onto brain heart infusion (BHI) agar (LAB M, Lancashire, UK) and incubated at 37 °C overnight. Three single colonies from this medium were transferred to 3 mL sterile BHI broth (LAB M, Lancashire, UK) and incubated overnight at 37 °C with shaking (120 rpm). Subsequently, 1% (v/v) of these cultures were inoculated to prepare the cultures that were used in the experiments. These cultures were prepared in 250 mL conical flasks for aerobic conditions or 50 mL Falcon tubes for anaerobic conditions (Whitley MG 1000 Anaerobic Workstation, Don Whitley Scientific). Twenty mL of BHI broth or Defined Media (DM; containing 0.82 mM L-cysteine) [35] was used for the inoculum and incubated overnight at 37 °C with shaking (120 rpm). To investigate the effect of L-cysteine, DM was supplemented to achieve a final concentration of 1.57 mM L-cysteine. This was accomplished by volumetrically adding an appropriate volume of a 10 μg/mL L-cysteine stock solution (Sigma-Aldrich, Dorset, UK).
96 well plates were used to determine the growth of WT and ΔpdeA. Plates were incubated at 37 °C for 24 h, and the cell turbidity was measured using a microtiter plate reader (FLUOstar Omega, Ortenberg, Germany) at an optical density of 620 nm (OD620) at every 2 h.

2.2. Survival in the Presence of Hydrogen Peroxide

Cells were grown until the stationary phase for either 10 or 18 h, depending on the conducted experiment. Subsequently, they were challenged with various concentrations of a 30% solution of H2O2 (Sigma-Aldrich, Gillingham, UK) between 1.5% (resulted in the survival of cells) and 5.5% (resulted in a total inhibition of cells). A final concentration of 5.25% H2O2 was used for 10- and 18-h aerobically grown cells. Samples were taken every 20 min for 60 min. Before assessing H2O2 survival, the concentrations of H2O2 were optimized that should be used with each of the strains and conditions to avoid rapid death or complete survival that would not allow comparison between the ΔpdeA mutant and its corresponding WT strains. During the experiments, cultures were kept at 37 °C. Before and after the addition of H2O2, samples were taken, and serial decimal dilutions were prepared in maximum recovery diluent (MRD; Oxoid, Basingstoke, UK) and spread on BHI agar plates that were incubated at 37 °C. Subsequently, CFUs were enumerated to assess the concentration of cells in the cultures at each time point.
The same experiments were also conducted to investigate the effect of L-cysteine and the presence of oxygen. A final concentration of 1.5% and 4.5% of H2O2 was used for cells grown under aerobic in DM and L-cysteine-supplemented DM, respectively. Under anaerobic conditions, while 1% was used in DM, 2% was used for BHI and L-cysteine-supplemented DM.

2.3. Catalase Activity Assay

The catalase activity of L. monocytogenes cultures was assessed using a methodology described previously [34] with minor modifications. Briefly, cells were grown as mentioned in Section 2.1, and 500 μL of culture was transferred to a glass test tube containing 100 μL of 1% (v/v) Triton X-100 (Sigma-Aldrich, Dorset, UK). 100 μL of H2O2 (30% v/v) was then added to each test tube. Samples were taken every 2 h during the 24 h period. Oxygen release, resulting from the enzymatic degradation of H2O2, was observed as foam formation. After 5 min, the height of the foam, indicating oxygen levels and catalase activity, was measured in cm using a ruler and photographic images were taken.

2.4. Measurement of Intracellular c-di-AMP Levels

Intracellular c-di-AMP concentrations were measured with the method published by Oppenheimer-Shaanan (2011) with some minor changes [38]. A volume of 20 mL of cell culture was grown for 10 or 18 h. For aerobic conditions, the cells were grown in 250 mL flasks by shaking at 120 rpm, while under anaerobic conditions, they were grown in 50 mL Falcon tubes placed into a Whitley MG 1000 Anaerobic Workstation (Don Whitley Scientific) at 37 °C. Then, cultures were centrifuged at 9000 rpm for 10 min. The cell pellet was resuspended in 10 mL lysis buffer (10 mM Tris pH 8, 10 mM MgCl2 and 0.5 mg/mL lysozyme) and incubated at 37 °C for 30 min. Extracts were centrifuged at 9000 rpm for 10 min, and the supernatant was transferred to a clean tube. The extraction procedure was repeated twice by resuspending the pellets in 2 mL lysis buffer and collecting the supernatant. The collected supernatant was heated at 100 °C for 3 min and then supplemented with 100% ethanol to a final concentration of 70%. The supernatant was incubated for 20 min on ice and centrifuged at 7000 rpm for 10 min at 4 °C to separate insoluble material. It was then incubated at 80 °C for 1 h, and samples were air-dried at room temperature. Pellets of dried samples were resuspended in 1 mL of 1% formic acid, filtered (0.22 mm) and analysed in LC-MS.
An aliquot of the supernatant was filtered through a 0.2-µm nylon syringe filter (Fisher Scientific, Loughborough, UK) into an autosampler vial. An external calibration curve of c-di-AMP was built from 0.01 to 5 µg/L. Chromatographic separation was performed on an Agilent 1200 high-performance liquid chromatography (HPLC) system coupled to an Agilent 6410 triple quadrupole mass spectrometer equipped with an electrospray ionisation (ESI) source operating in positive mode. Separation was achieved using an Agilent Zorbax SB-C18 analytical column (2.1 × 100 mm, 1.8 µm) coupled to a Zorbax SB-C18 guard column (2.1 × 15 mm, 1.8 µm). The column temperature was maintained at 40 °C. The mobile phases consisted of Eluent A (water with 0.1% formic acid) and Eluent B (acetonitrile with 0.1% formic acid). The gradient elution program was as follows: 0–2 min, 100% A; 2–5 min, linear gradient to 100% B; 5–9 min, 100% B; 9–12 min, linear gradient to 100% A; followed by a 10-min post-run for column re-equilibration. The flow rate was set to 0.2 mL/min, and the injection volume was 5 μL. The ESI source parameters were as follows: gas temperature 350 °C, gas flow 10 L/min, nebuliser pressure 50 psi, and capillary voltage 4000 V.
To investigate the effect of H2O2 stresses on the c-di-AMP production/accumulation, the same protocol was also applied to the samples before the stress, just after the stress application (100 µL of 30% H2O2 sublethal dose), and 1 h after the stress application.

2.5. RNA Sequencing (RNA-seq) Sample Preparation and Analysis of L. monocytogenes Strains

Two separate transcriptomic analyses were conducted. In the first, L. monocytogenes 10403S WT (control) was compared to its isogenic ΔpdeA mutant to identify the impact of the loss of this gene in the overall transcription. In the 2nd transcriptomic analysis, L. monocytogenes 10403S WT in DM (control) was compared to WT in DM supplemented with L-cysteine (1.57 mM final concentration).
Overnight cultures grown in 3 mL BHI were inoculated (1% v/v) in 20 mL BHI in 250 mL conical flasks. Cultures were incubated at 37 °C for 10 h with 120 rpm. After growth, 16.66 mL of culture was mixed with 3.33 mL of phenol/ethanol (5/95%) solution. Cell suspensions were centrifuged at 5000× g for 10 min at 4 °C. The supernatant of the suspensions was discarded, and the cell pellets were frozen at −80 °C until further processing. RNA was isolated with RNeasy Mini Kit (Quiagen, Manchester, UK), and possible contamination with genomic DNA was removed with the use of Turbo DNA-free™ Kit (Quiagen, Manchester, UK). RNA quality and purity were assessed using the NanoPhotometerR spectrophotometer (IMPLEN, Westlake Village, CA, USA). Only samples that passed the quality control were processed further. RNA sequencing (RNA-Seq) and data analysis were performed by Novogene (Hong Kong, China).
A total amount of 3 µg RNA was used for RNA sample preparation. Sequencing libraries were constructed using NEBNext® Ultra™ Directional RNA Library Prep Kit for Illumina® (NEB, Ipswich, MA, USA), with index codes assigned to differentiate sequences for each sample. mRNA was purified from total RNA using poly-T oligo-attached magnetic beads.
rRNA was removed through a specialised kit and fragmented using divalent cations at elevated temperature in NEBNext First Strand Synthesis Reaction Buffer (5X). First-strand cDNA was synthesised by using a random hexamer primer and M-MuLV Reverse Transcriptase (RNaseH). Subsequently, second-strand cDNA synthesis was performed by using DNA Polymerase I and RNase H. During this step, dNTPs with dTTP were substituted with dUTP. The remaining overhangs were converted into blunt ends by exonuclease/polymerase. After adenylation of 3′ ends of DNA fragments, NEBNext Adaptor with hairpin loop structure was ligated to prepare for hybridisation. To select cDNA fragments of preferentially 150~200 bp in length, the library fragments were purified with AMPure XP system (Beckman Coulter, Beverly, MA, USA). Following this, 3 µL USER Enzyme (NEB USA) was added to size-selected and adaptor-ligated cDNA at 37 °C for 15 min, followed by 5 min at 95 °C. Polymerase chain reaction (PCR) was performed with Phusion High-Fidelity DNA polymerase, Universal PCR primers, and Index Primer. Lastly, the amplified library products were purified (AMPure XP system), and library quality was assessed on the Agilent Bioanalyzer 2100 system.

2.6. Statistical Analysis

All experiments were conducted in triplicate, and results were assessed using paired Student’s t-test and Tukey on Minitab Statistical Software, Version 22 (Minitab, LLC., State College, PA, USA, 2021). A p-value lower than 0.05 denotes statistically significant results, which are indicated by an asterisk (*) in figures or by different letters [39].
Differential gene expression analysis, including 3 replicates, was conducted on WT and ΔpdeA cells grown in BHI under anaerobic conditions to assess the impact of c-di-AMP accumulation on the expression of L. monocytogenes genes. The analysis was performed using the DESeq R package (1.18.0), which applies statistical methods for identifying differential expression in digital gene expression data based on a negative binomial distribution model. The resulting p-values were adjusted using the Benjamini and Hochberg method, and these are referred to as padj in this study. Genes with an adjusted p-value of less than 0.05 were classified as differentially expressed.

3. Results

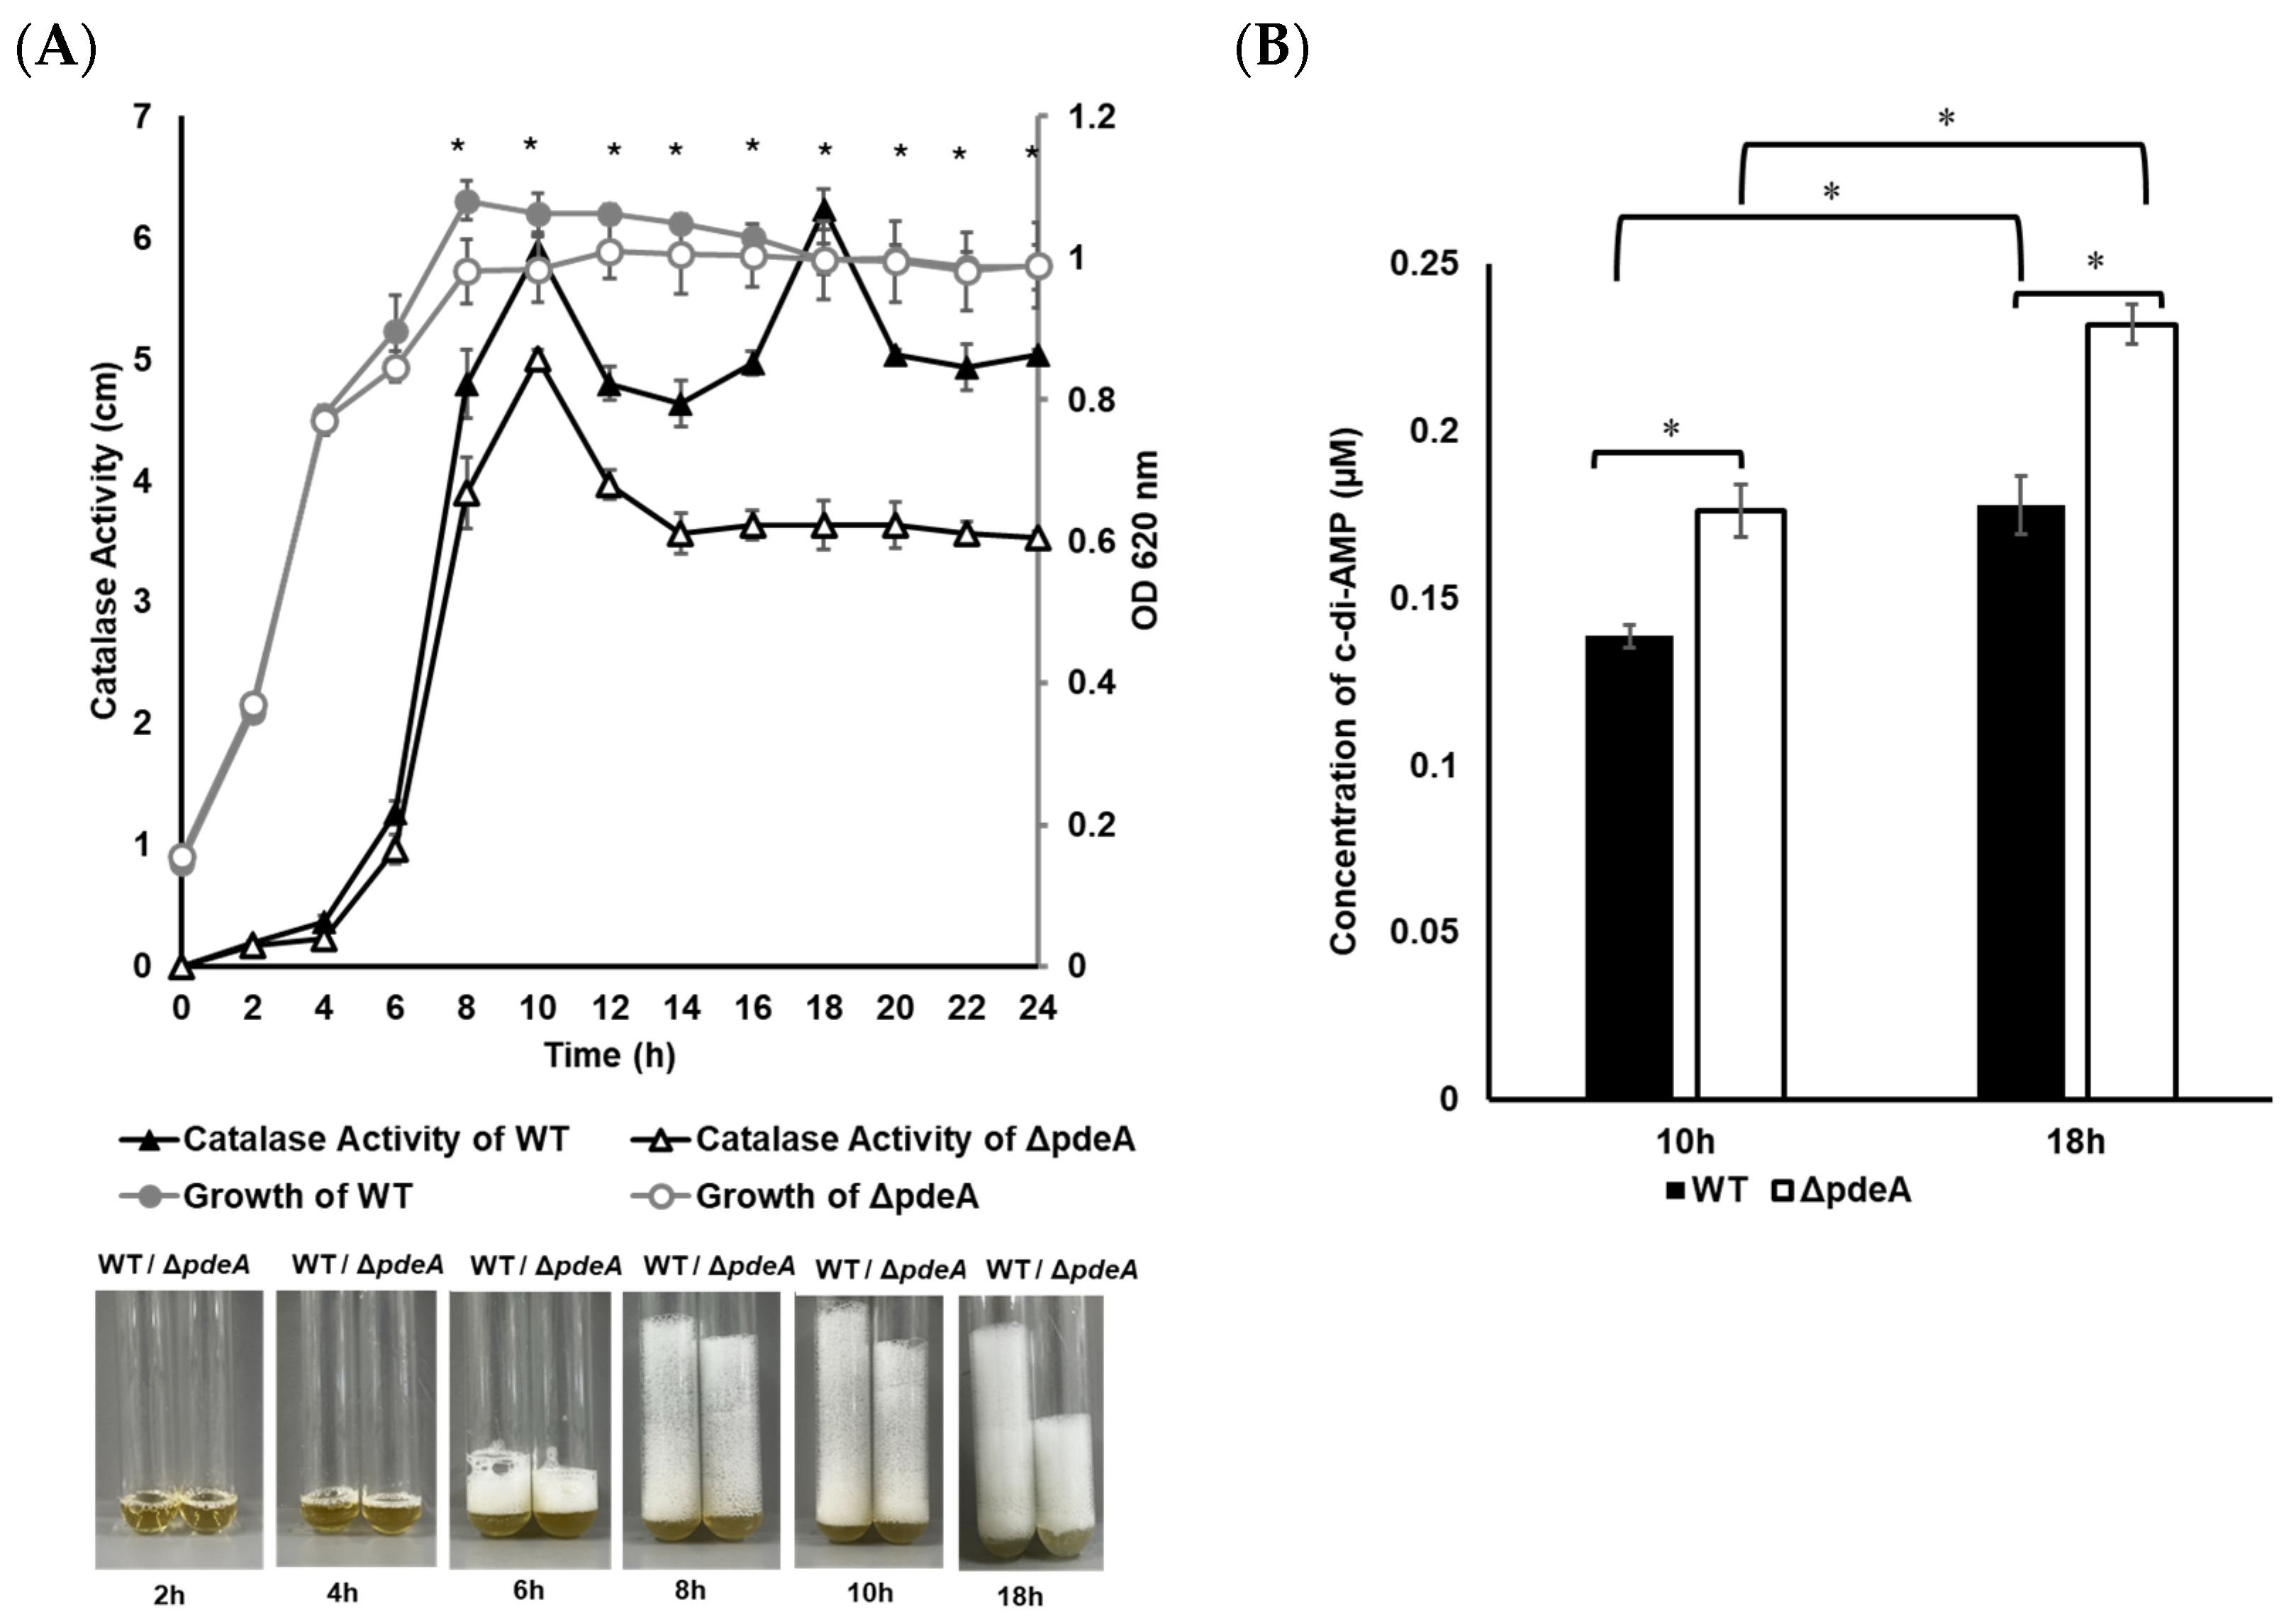
3.1. Catalase Activity Levels During Growth

The bacterial growth of 1043S WT and ΔpdeA was monitored by measuring the optical density at 620 nm (OD620). No significant difference was observed between the OD620 values obtained from WT and ΔpdeA in BHI (p > 0.05; Figure 1A). Catalase activity of WT and ΔpdeA was also monitored throughout the growth period (Figure 1A). In the exponential phase and following 2 and 4 h of growth, the catalase levels of WT and ΔpdeA were similar (p > 0.05). The first difference between the strains was recorded at 8 h of growth (p > 0.05; Figure 1A) when the catalase activity of ΔpdeA (3.9 cm foam height) became significantly lower than that of WT (4.8 cm foam height) (p < 0.05; Figure 1A). At the stationary phase, ΔpdeA showed consistently reduced catalase activity with an average foam level of 3.6 cm compared to WT with an average of 6.2 cm (p < 0.05; Figure 1A).
c-di-AMP levels were measured at 10 and 18 h, where WT and ΔpdeA showed different catalase activity patterns. During the stationary phase (from 10 to 18 h), the intracellular c-di-AMP concentrations rose from 0.138 to 0.177 µM in the WT cells and from 0.176 to 0.232 µM in the ΔpdeA cells (p < 0.05; Figure 1B). Despite this significant increase, the catalase activity of ΔpdeA did not change during the stationary phase (p > 0.05; Figure 1A).

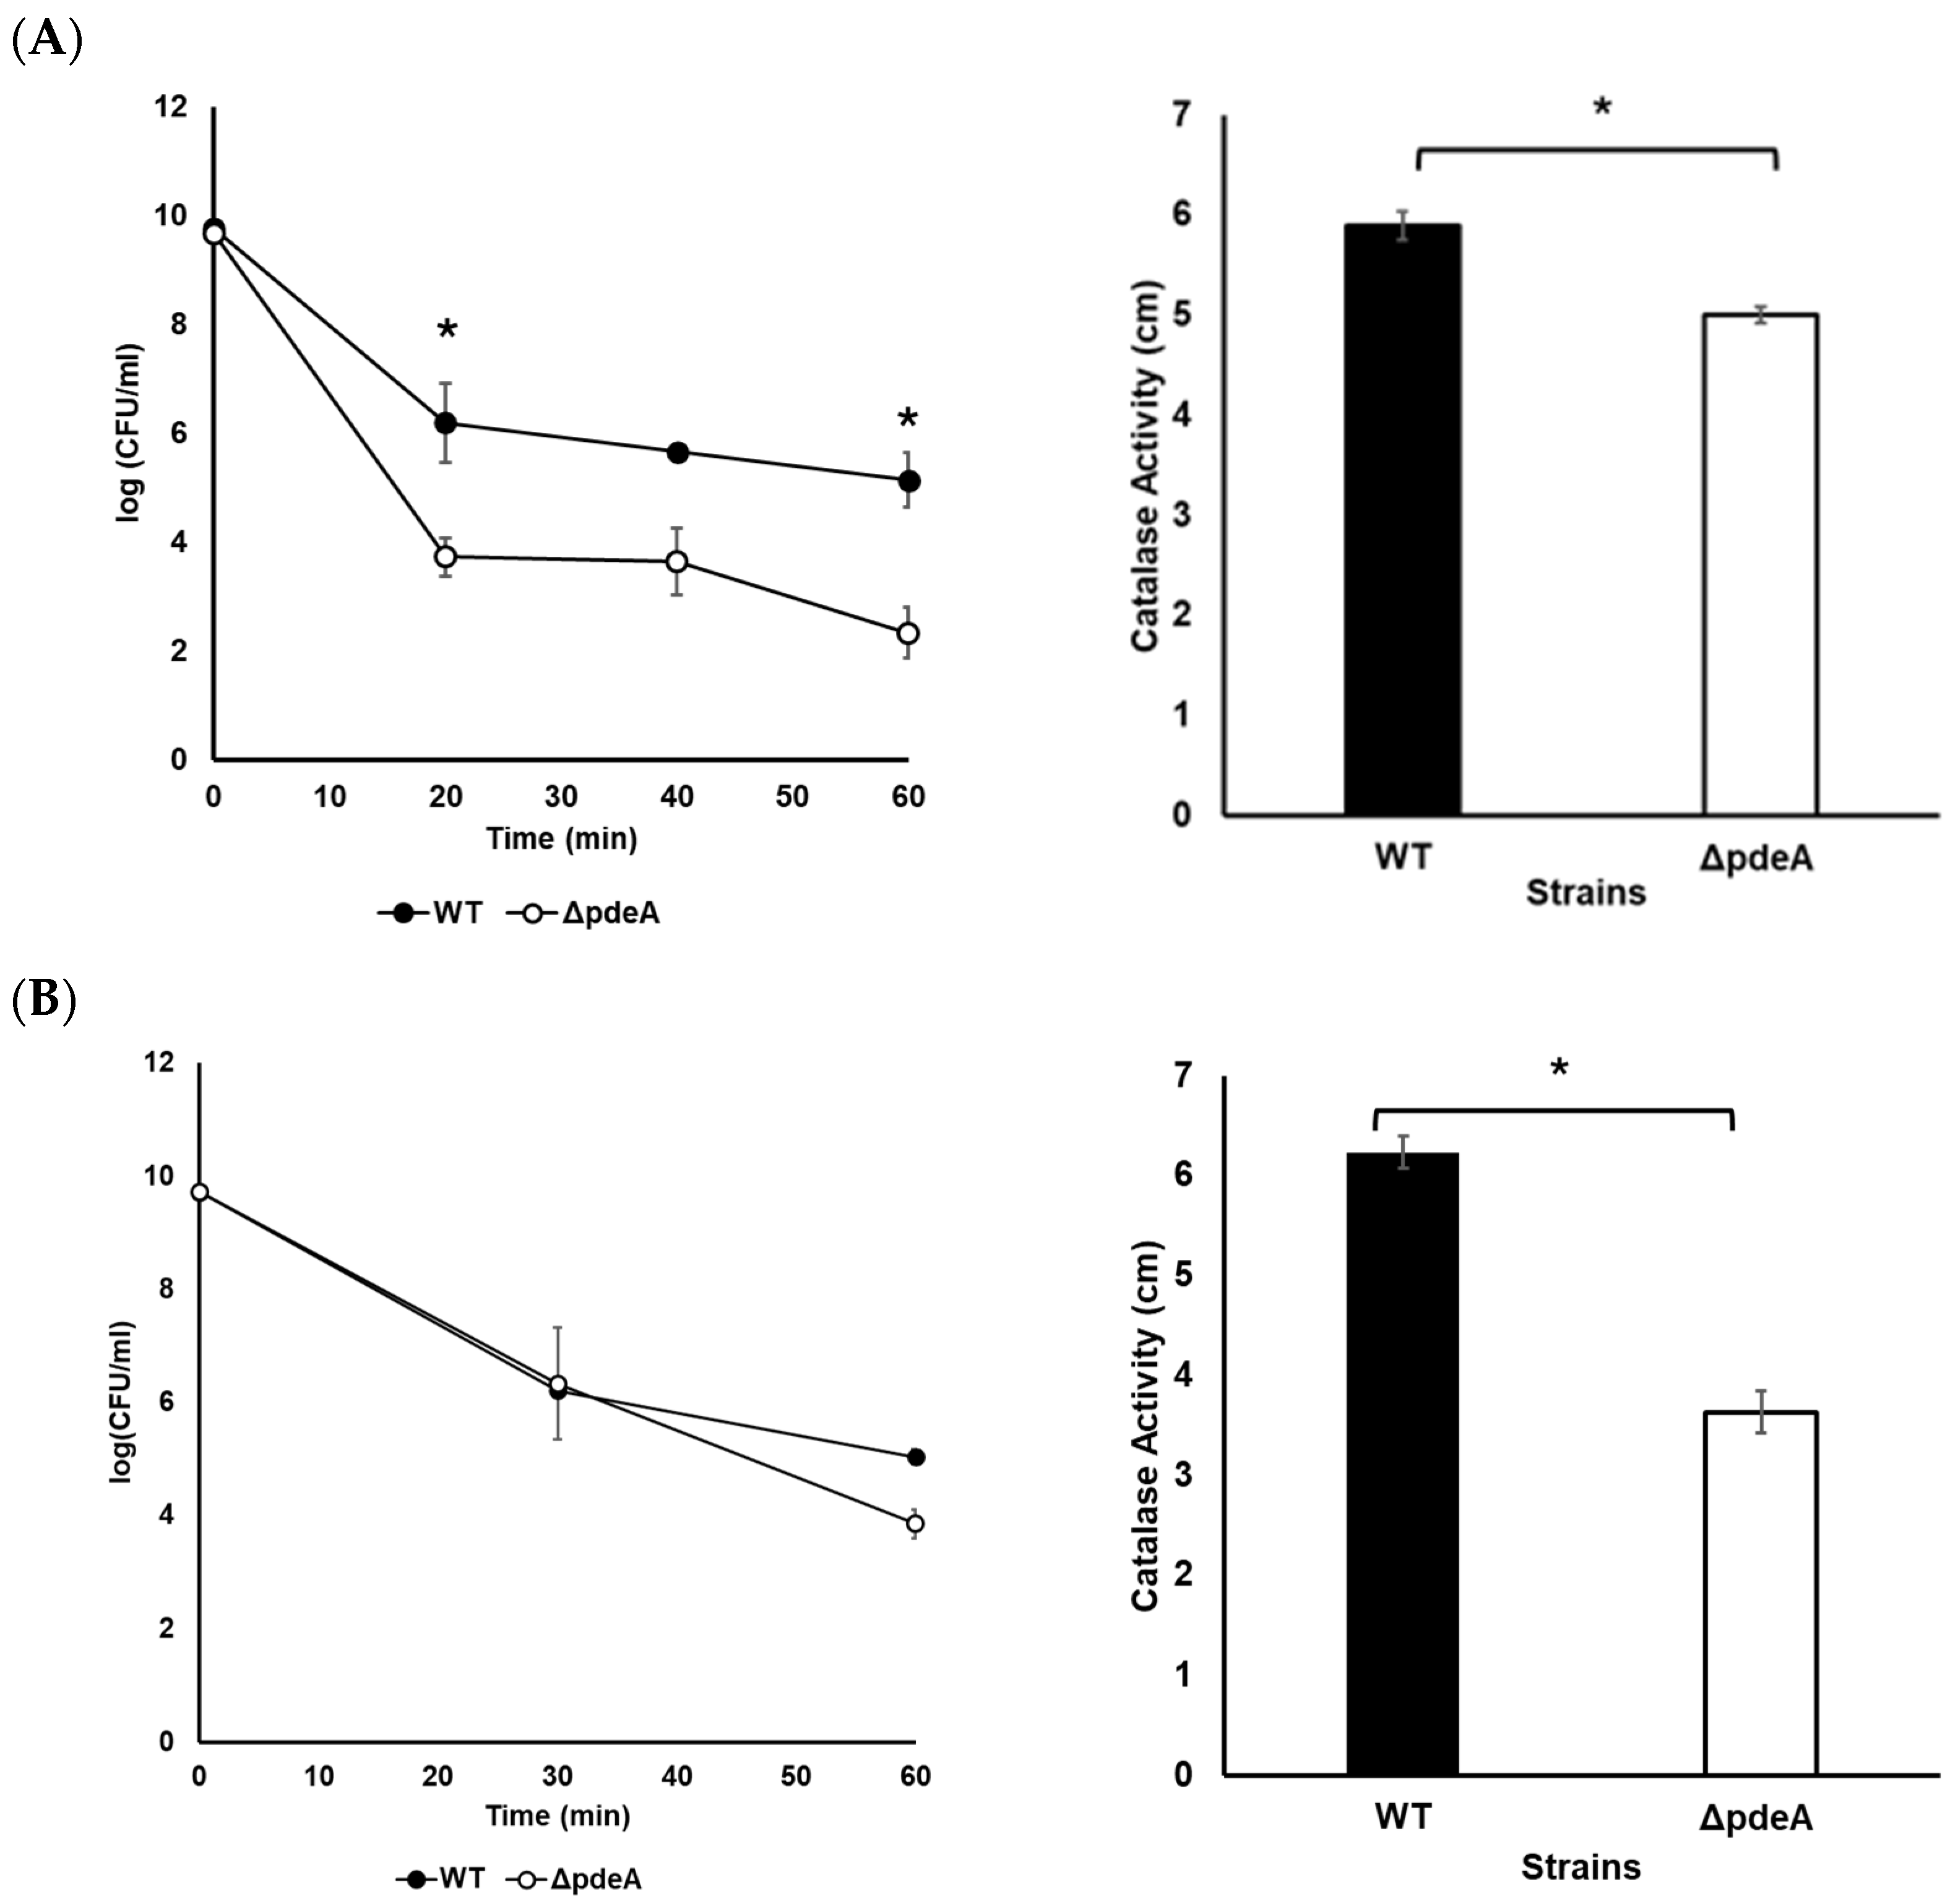
3.2. Survival Against H2O2

A survival experiment was conducted, where a significant difference was seen in catalase activity levels (Figure 2). WT showed a 4.6 log reduction, while ΔpdeA showed a 7.34 log reduction following growth for 10 h, proving WTs were more resistant to oxidative stress than ΔpdeA (p < 0.05; Figure 2A). However, when cells grown for 18 h were challenged with 5.25% H2O2, an average of 4.65 and 5.85 log reduction was observed for WT and ΔpdeA, respectively, which showed a similar inactivation (p > 0.05; Figure 2B). The log reduction of WT at 10 and 18 h was not statistically significant (p > 0.05), whereas the log reduction of ΔpdeA showed a statistically significant difference between these time points (p < 0.05; Figure 2A,B).

3.3. Intracellular c-di-AMP Concentrations During the H2O2 Treatment

The levels of intracellular c-di-AMP were measured during the oxidative stress to assess the survival difference between 10-h-grown WT and ΔpdeA. Samples were taken before the H2O2 treatment, right after the H2O2 treatment, and after 1 h. ΔpdeA cells had higher intracellular c-di-AMP concentrations than WT cells, with an average concentration of 0.138 µM and 0.175 µM, respectively, before the H2O2 treatment (p < 0.05). Right after the H2O2 treatment, these concentrations were increased to 0.154 µM (p > 0.05) and 0.203 µM (p < 0.05). Subsequently, after 60 min H2O2 treatment, levels continued to increase and reached 0.184 µM (p < 0.05) and 0.225 µM (p < 0.05; Figure 3).

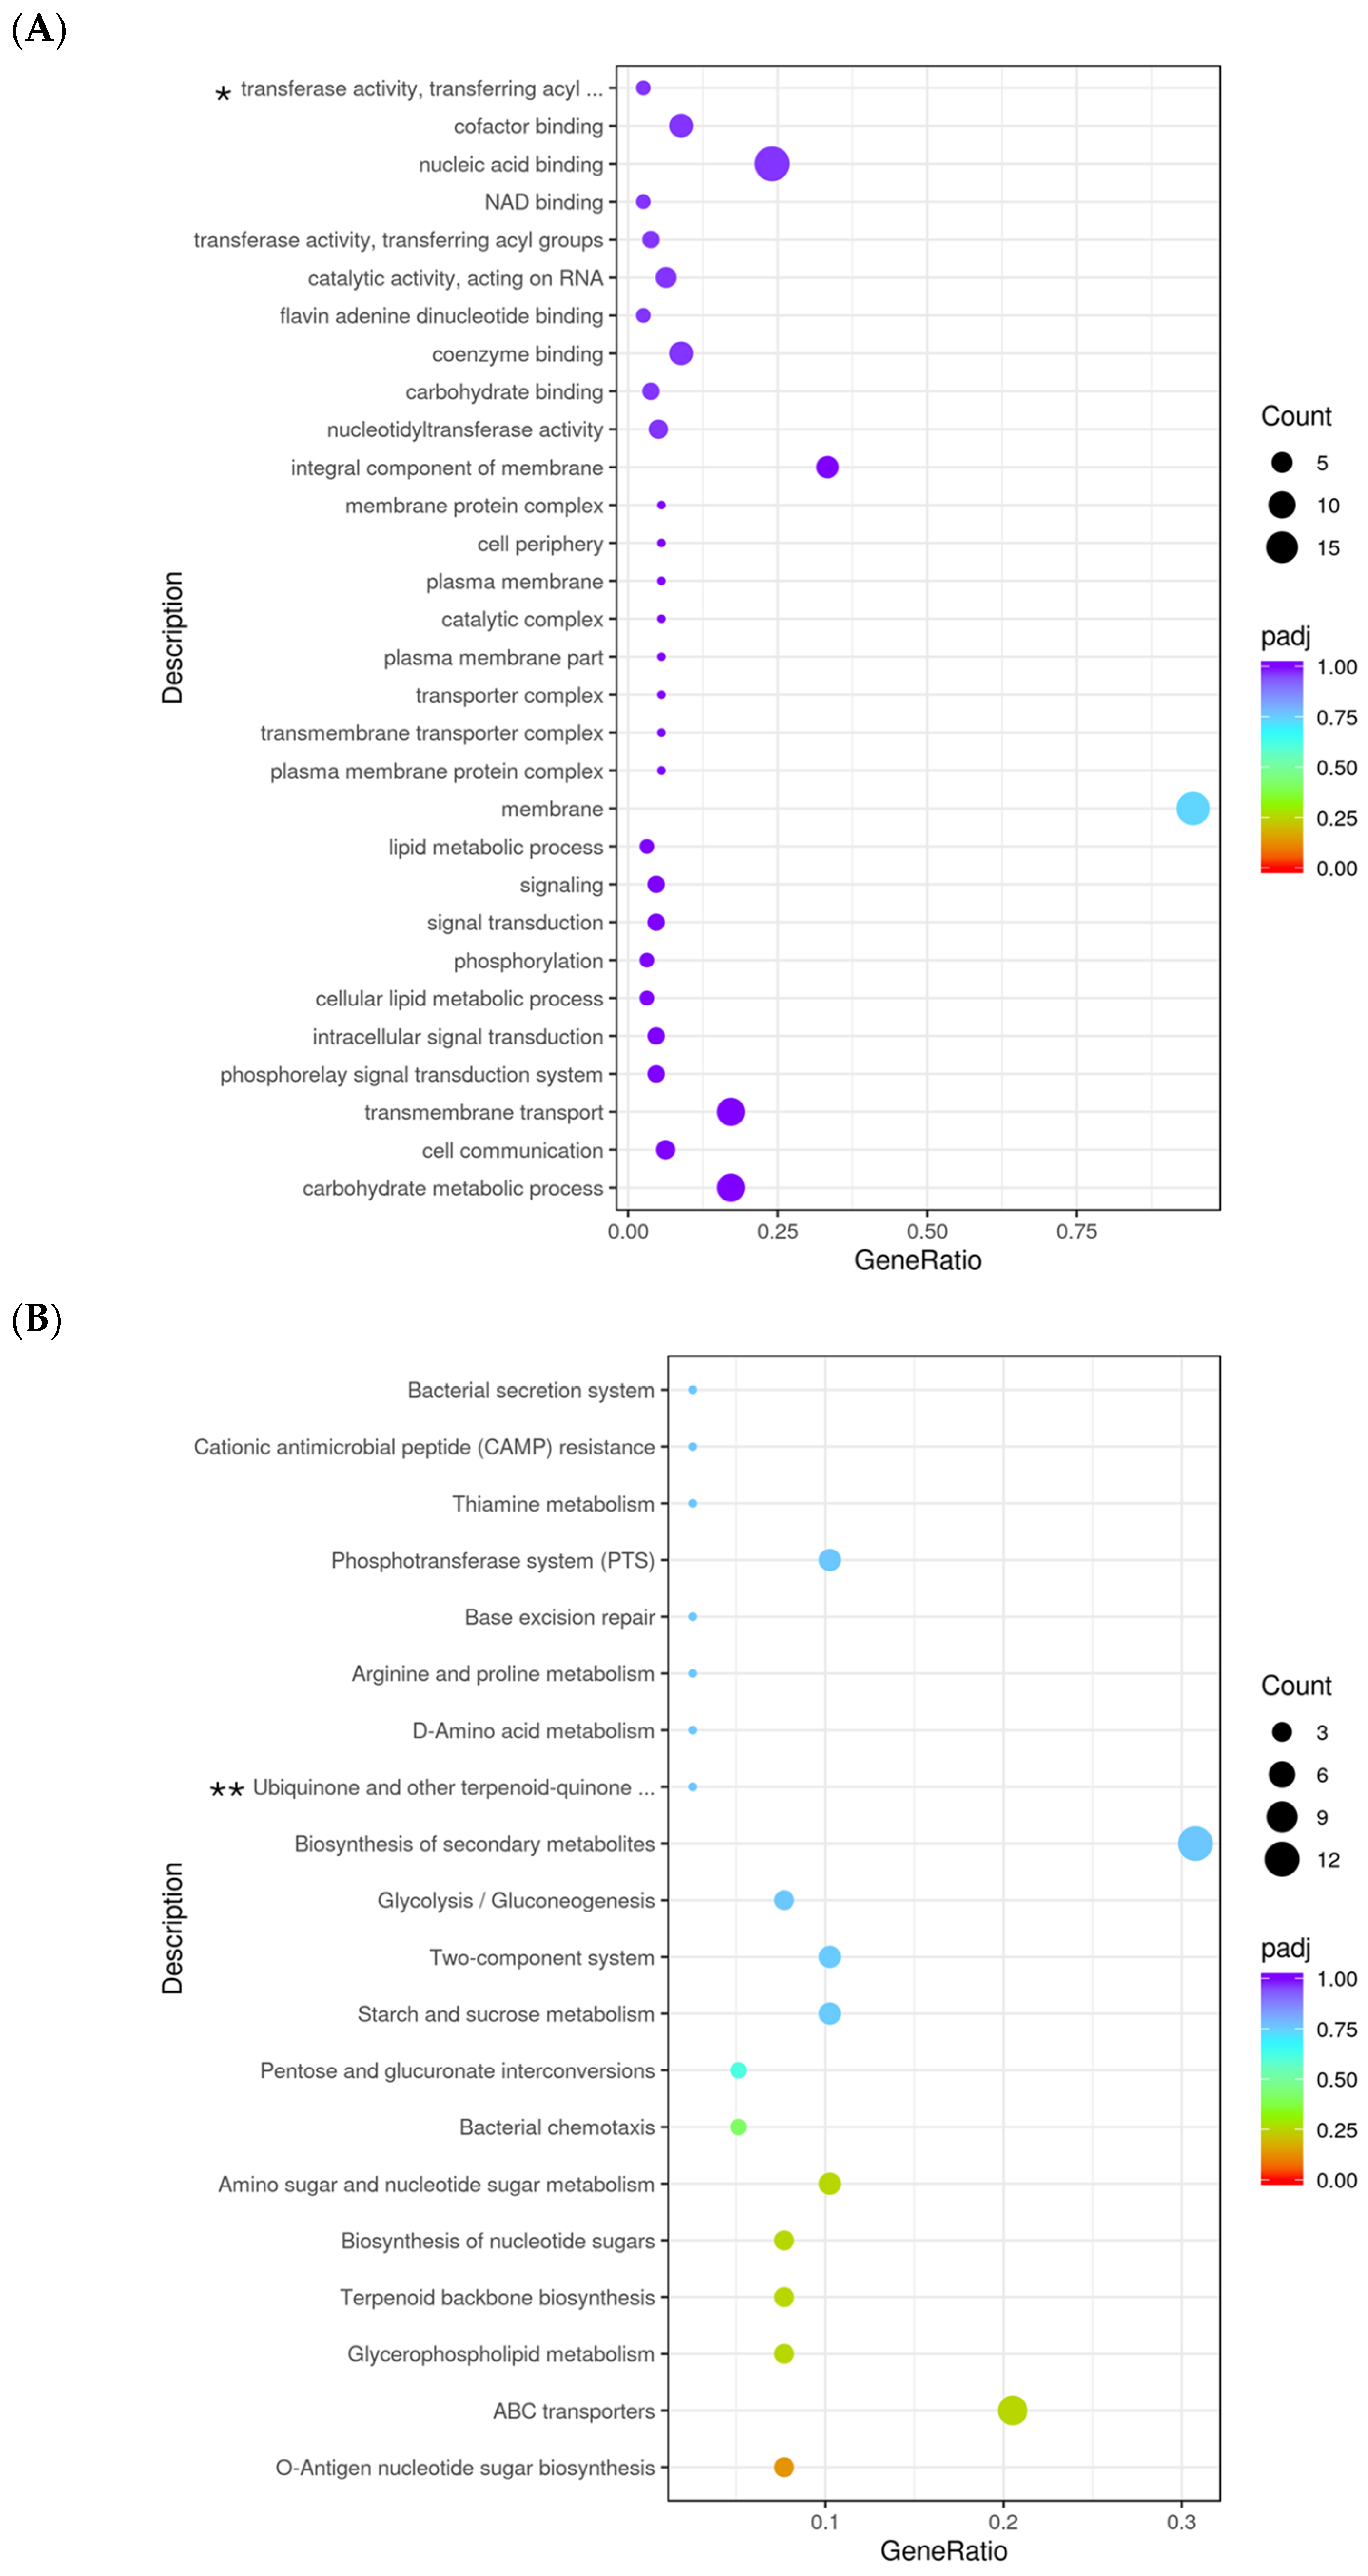
3.4. Transcriptomic Analysis Before the Stress Condition

Due to the difference in the survival of 10 h-grown WT and ΔpdeA cells, a full transcriptomic analysis of L. monocytogenes 10403S WT and ΔpdeA was conducted prior to the application of oxidative stress treatment. This comparison aimed to investigate the effect of different c-di-AMP levels between WT and ΔpdeA (as shown in Figure 1B). The summary of the transcriptome assembly statistics is shown in the supplementary data (Table S1). The error rate of a single base location sequencing was less than 1% in all groups. The Q2 and Q3 were equal to or higher than 97% or 93%, respectively. Transcriptomic data revealed that 127 genes were upregulated and 76 downregulated in the ΔpdeA compared to the WT (Figure 4).
Gene Ontology (GO) enrichment analysis was performed to identify significantly enriched biological processes (BP), cellular components (CC), and molecular functions (MF) among differentially expressed genes in 10 h-grown ΔpdeA vs WT in BHI. The most significantly enriched GO term was “carbohydrate metabolic process”, with a high gene ratio and a low adjusted p-value, followed by “cell communication”, “transmembrane transport” and “signal transduction systems” (Figure 5A). A strong enrichment in membrane-associated functions was observed. Notably, the term “membrane” displayed the highest gene ratio (~0.75; Figure 5A), with a significantly low adjusted p-value (Figure 5A). Additionally, molecular function categories, including “nucleic acid binding” “NAD binding” and “cofactor binding” appeared enriched but were not statistically significant (padj > 0.05; Figure 5A).
Moreover, the genes involved in oxidative stress resistance, such as redox homeostasis [40], glutathione biosynthesis and transport [41] and cold shock proteins [42] were also assessed. There was no statistically significant difference in the transcription of these genes in ΔpdeA compared to the WT (padj > 0.05; Table S2).

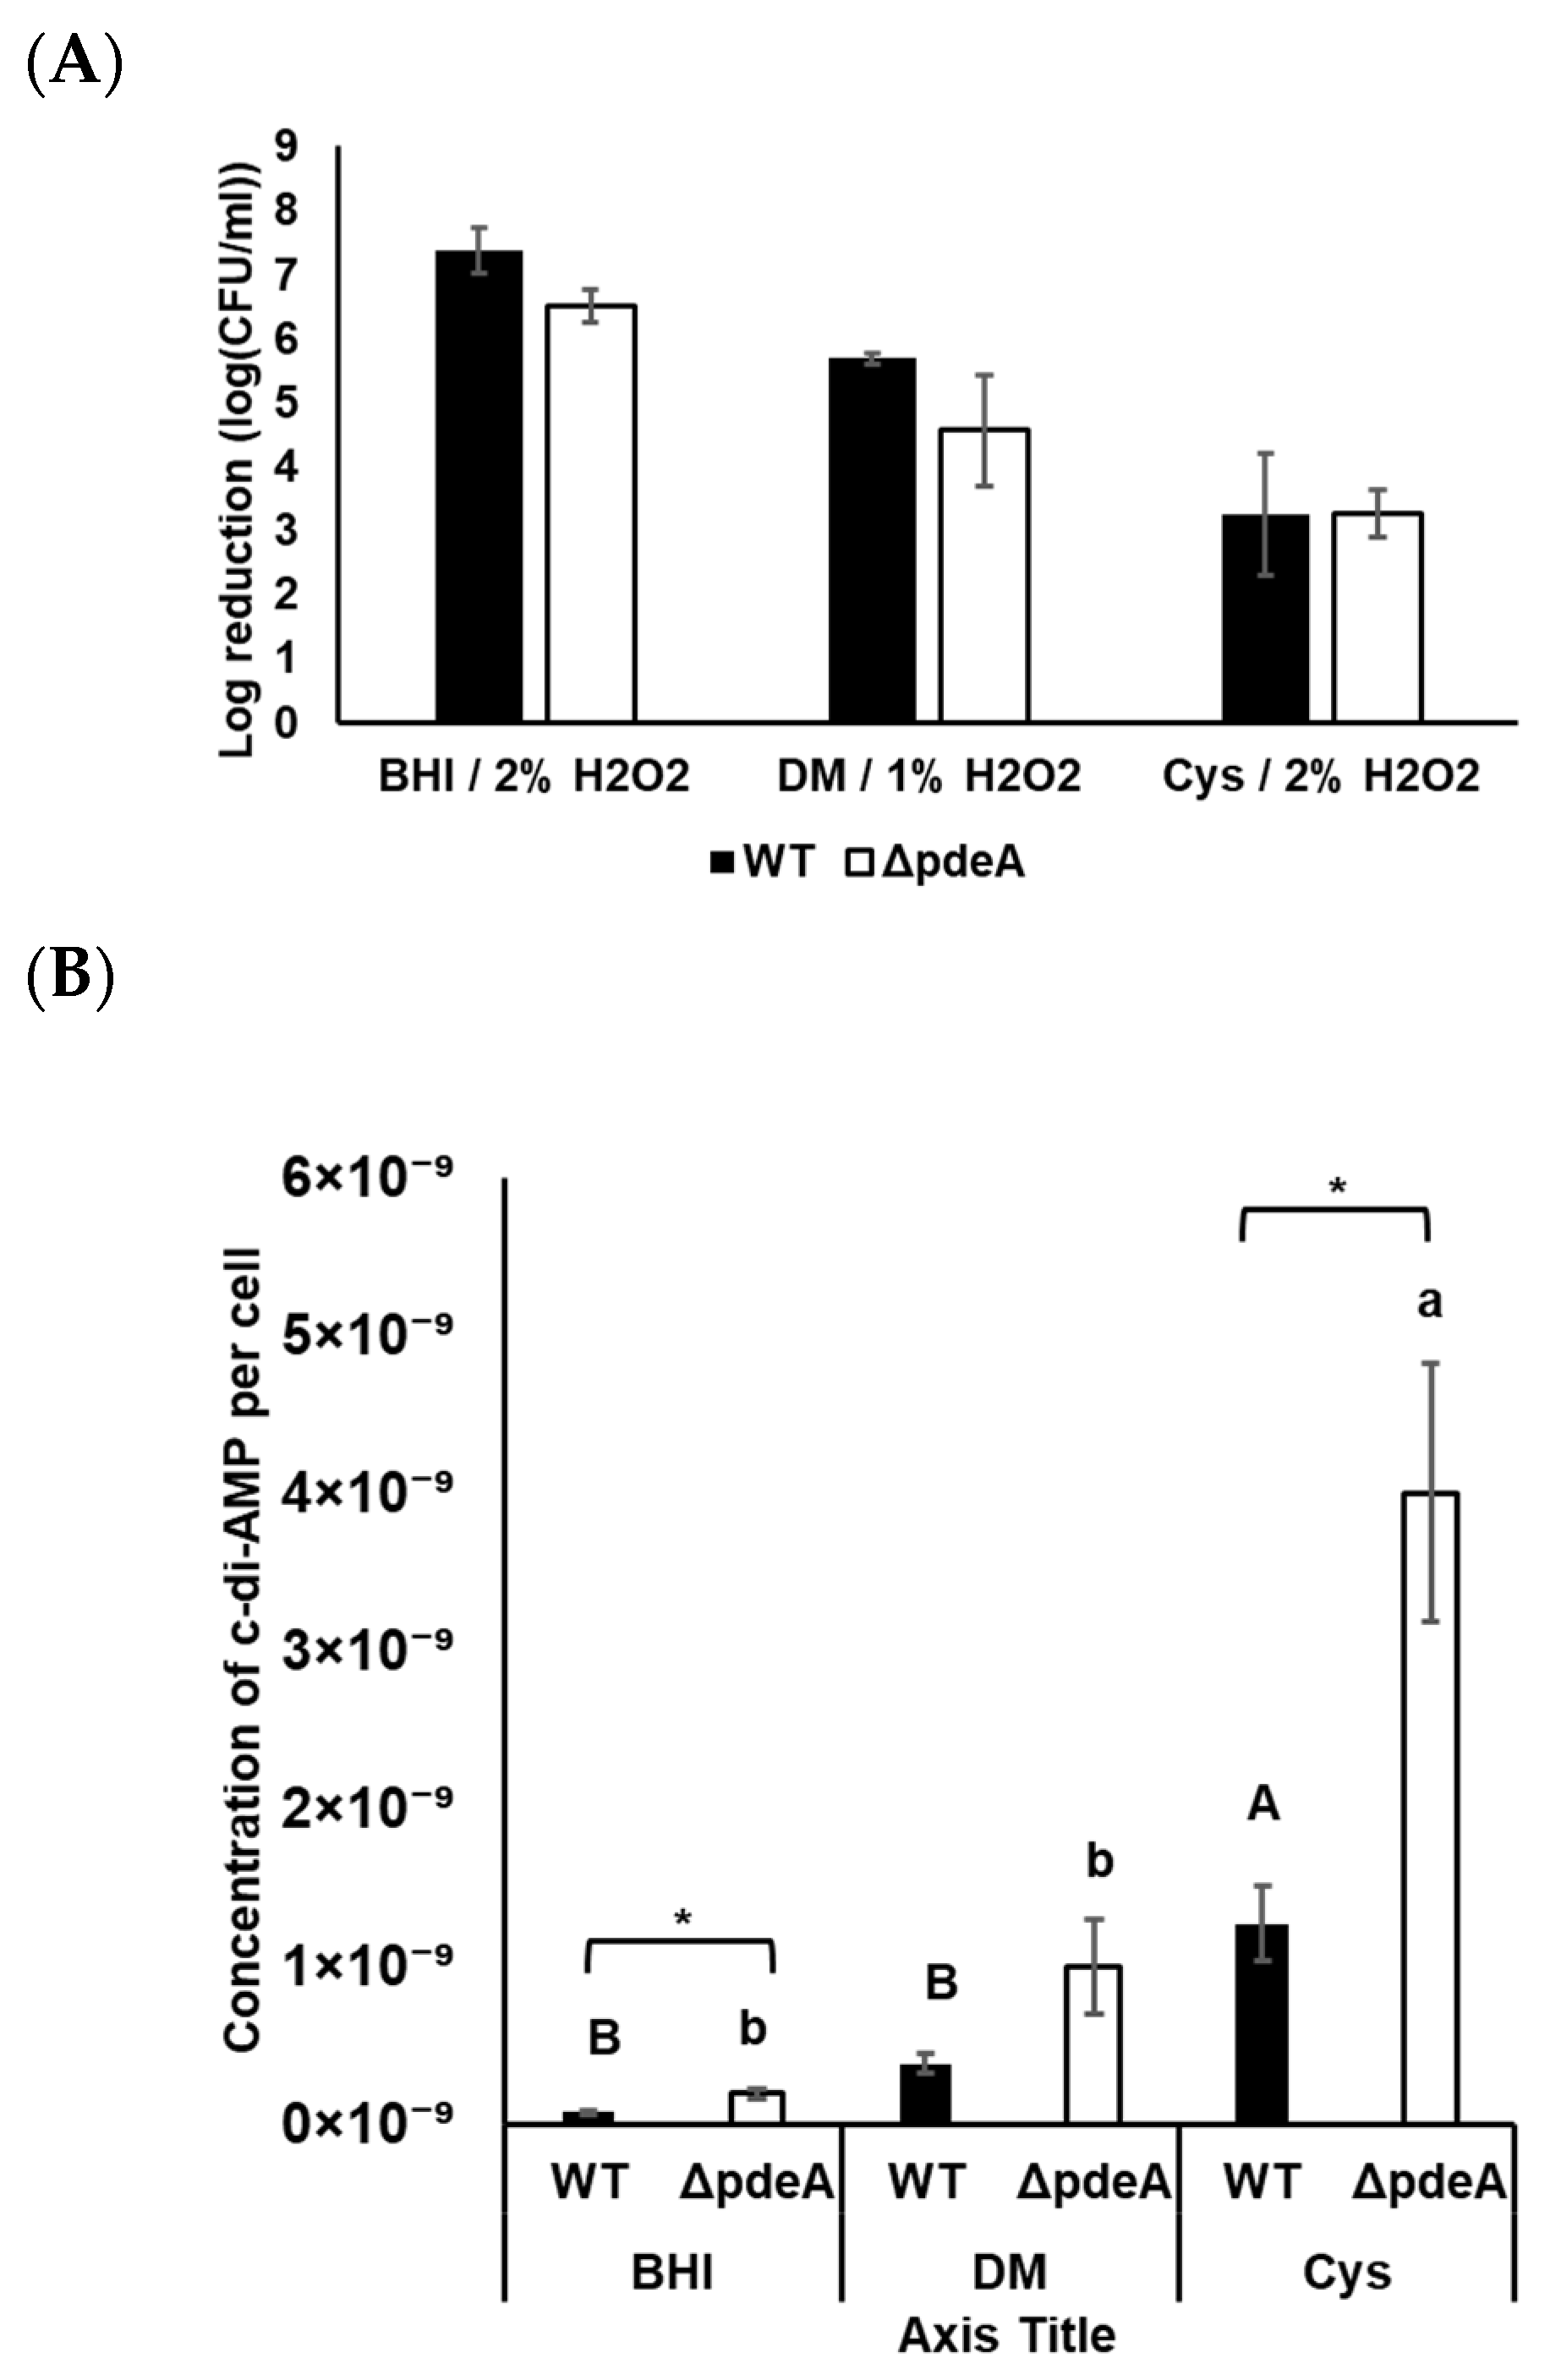
3.5. The Effect of L-cysteine on the Catalase Activity and Survival of WT and ΔpdeA Under Aerobic Conditions

In this part, in contrast to the previous experiment, DM was used for a clearer analysis of L-cysteine’s role without interference from other complex components present in BHI. WT and ΔpdeA cells showed an average of 1.84 and 1.77 log reduction in DM, respectively (p > 0.05; Figure 6A). Moreover, when 1.5% H2O2 was applied, both L-cysteine-supplemented WT and ΔpdeA were able to survive for 60 min. Therefore, 4.5% of H2O2 was applied to the cells grown in these conditions. L-cysteine supplementation led to a significantly greater resistance to oxidative stress in ΔpdeA compared to the WT, with a 7.6 log reduction difference (p < 0.05; Figure 6A). There was no significant difference in catalase activity levels between stationary phase cells of WT and ΔpdeA grown in DM (p > 0.05; Figure 6B). Similarly, L-cysteine supplementation did not affect the difference between the catalase activity levels of WT and ΔpdeA (p > 0.05; Figure 6B).

3.6. Intracellular c-di-AMP Concentrations Under Aerobic Conditions

Intracellular c-di-AMP levels in WT and ΔpdeA grown in BHI, DM, and L-cysteine-supplemented DM were measured under aerobic growth conditions. The concentration of c-di-AMP in ΔpdeA was higher than in WT cells (p < 0.05; Figure 6C). The aerobically-grown cells in BHI had the lowest concentration of c-di-AMP, with an average of 3.96 × 10⁻¹¹ and 5.57 × 10⁻¹¹ µM/CFU for WT and ΔpdeA respectively (p < 0.05; Figure 6C). However, growth in DM resulted in higher c-di-AMP concentrations than BHI (p < 0.05). Additionally, it was observed that L-cysteine supplementation did not change c-di-AMP concentrations compared to DM under aerobic conditions (p > 0.05; Figure 6C). Yet, ΔpdeA had higher c-di-AMP concentrations than the WT with L-cysteine supplementation (p < 0.05; Figure 6C).

3.7. Survival and Catalase Activity of Anaerobically Grown WT and ΔpdeA Cells

Survival experiments were also conducted under anaerobic conditions. It is known that early stationary phase cells under anaerobic conditions can be more susceptible to oxidative stress [43,44]. Therefore, we only tested 18-h-grown cells under anaerobic conditions. Both strains were more sensitive towards oxidative stress compared to aerobic growth conditions (Figure 7A). Although 5.25% of H2O2 was applied to the aerobically grown cells in BHI, a maximum of 2% of H2O2 provided a clear survival curve for the anaerobically grown cells. In BHI, WT and ΔpdeA cells showed an average of 1.78 and 2.72 log reduction, respectively (p > 0.05; Figure 7A). However, there was no significant difference between WT and ΔpdeA, neither in DM nor in DM supplemented with L-cysteine (p > 0.05; Figure 7A). Furthermore, the catalase activity of WT cells was at immeasurable levels in BHI, DM, and L-cysteine-supplemented DM. Even though the sample volume was increased, no measurable levels of catalase activity were obtained from either WT or ΔpdeA.

3.8. Intracellular c-di-AMP Concentrations Under Anaerobic Conditions

c-di-AMP in WT and ΔpdeA grown in BHI, DM, and L-cysteine-supplemented DM were measured under anaerobic conditions. Under anaerobic conditions, c-di-AMP levels in ΔpdeA were significantly higher than in WT (p < 0.05; Figure 7B). Additionally, compared to the aerobic conditions, intracellular c-di-AMP concentrations per cell were higher in both strains grown under anaerobic conditions, regardless of the media used (Figure 6C and Figure 7B).
Similarly to aerobic conditions, c-di-AMP levels in BHI were measured lower compared to those in DM and L-cysteine-supplemented DM (p < 0.05; Figure 7B). In contrast, L-cysteine supplementation resulted in significantly higher c-di-AMP concentrations under anaerobic conditions, with 1.26 × 10⁻⁹ and 3.99 × 10⁻⁹ µM/CFU µM in WT and ΔpdeA respectively (Figure 7B). The difference in the c-di-AMP concentrations between anaerobically grown WT and ΔpdeA in L-cysteine-supplemented DM was higher compared to those grown in BHI and DM (p < 0.05; Figure 7B).

3.9. Transcriptomic Data Showing the Effect of L-cysteine Supplementation on c-di-AMP Homeostasis Genes

We showed that L-cysteine supplementation increases c-di-AMP levels in both WT and ΔpdeA cells under anaerobic conditions (Figure 7B). To better understand the broader effects of L-cysteine, we conducted a complete transcriptomic analysis under anaerobic conditions. While some parts of the transcriptomic data are reported in another study (Yilmaz Topcam & Karatzas, unpublished data) [45], the current analysis focuses on c-di-AMP DACs and PDEs of the transcriptome that were not addressed earlier. The transcriptomic data obtained from overnight cultures of L. monocytogenes 10403S WT cells in DM (control) and DM supplemented with 1.57 mM L-cysteine (treatment) showed that L-cysteine supplementation significantly downregulated the c-di-AMP PDEs (padj < 0.05; Table 2).

4. Discussion

Second messenger c-di-AMP is known to influence a range of physiological processes, including growth, cell wall homeostasis, potassium ion transport, DNA integrity, fatty acid synthesis and biofilm formation, all of which contribute to bacterial infection [12,13,14]. It is also implicated in multi-stress resistance pathways, which include oxidative stress resistance and heat shock responses [16,17]. Although the reaction of different microorganisms towards oxidative stress and the role of c-di-AMP have been investigated previously [19,20,21,22,46], the precise role of c-di-AMP on the oxidative stress resistance of L. monocytogenes remains unclear. Moreover, previous studies have not considered the role of catalase activity, which is required for defence against oxidative stress [34]. Therefore, for the first time, we investigated the role of pdeA and potentially that of c-di-AMP on the catalase activity of L. monocytogenes 10403S.
Catalase activity levels of both exponential-phase WT and ΔpdeA cells were lower than those at the stationary phase (Figure 1A), which is consistent with our previous results [44]. While the catalase activity of both strains reached the peak value at 10 h of growth, another peak was observed at 18 h in WT (Figure 1A). Similar results to our findings for WT were also observed previously for Enterobacter aerogenes, with two separate peak points in the catalase activity in the stationary phase during the growth [47]. This fluctuation in the catalase activity of the WT observed across different growth phases may reflect regulatory mechanisms beyond the transcription of only catalase gene present in L. monocytogenes (kat). Indeed, oxidative stress resistance in L. monocytogenes, particularly during different growth stages, might be affected by some factors such as mRNA stability, translation efficiency, or post-translational modifications of antioxidant enzymes [44]. In contrast to the increased catalase activity of WT, the catalase activity of ΔpdeA remained stable through the stationary phase, indicating the impact of PdeA on catalase activity in WT. Moreover, an increased concentration of c-di-AMP was recorded in both WT and ΔpdeA from 10 to 18 h (Figure 1B), where the cell number of the strains did not show a significant change (Figure 1A and Figure 2; initial counts). This suggests that the maintenance of the c-di-AMP homeostasis is important for the catalase activity of L. monocytogenes 10403S in the stationary phase, however, high concentrations of c-di-AMP as a result of its accumulation do not appear to further enhance catalase activity.
In the present study, we show that the ΔpdeA exhibited an increased oxidative stress resistance at 18h (Figure 2). This increased resistance of ΔpdeA may be associated with the c-di-AMP levels (Figure 1B), which could enhance survival by promoting improved DNA repair [21], despite stable catalase activity during the stationary phase (Figure 1A). In various bacteria, low levels of c-di-AMP (due to the over-expression of PDEs) impair DNA repair, whereas high levels (due to the mutation in PDEs) promote cell survival towards DNA damaging agents (such as H2O2, methyl methane sulfonate, day-night cycle, and UV) [19,20,21,22]. While c-di-AMP has been implicated in the DNA repair process, its specific role in oxidative stress resistance in L. monocytogenes remains unclear and requires more investigation.
Regarding the survival experiments, intracellular c-di-AMP levels were also measured following H2O2 treatment. It is worth mentioning that a sublethal dose of H2O2 which did not affect cell counts was applied to the cells. Oxidative stress treatment resulted in continuously increased intracellular c-di-AMP levels in both WT and ΔpdeA (p < 0.05, Figure 3). Thus, here we show for the first time that oxidative stress induces a continuous increase in c-di-AMP concentrations in response to oxidative stress in L. monocytogenes (Figure 3; WT cells). Contrary to our results, sporulating B. subtilis cells reacted to oxidative stress by decreasing c-di-AMP concentrations [38]. In L. monocytogenes, the levels of (p)ppGpp, another secondary messenger that regulates the stringent response through various interactions, are controlled by the RelA/SpoT homolog and CbpB. CbpB activates RelA, leading to (p)ppGpp synthesis, while c-di-AMP inhibits this activation [48]. The role of (p)ppGpp on starvation, antibiotic resistance, and osmotic stress has been elucidated [49]. Also, it is known that elevated (p)ppGpp levels under these stress conditions inhibit cyclic-di-AMP phosphodiesterase, resulting in increased c-di-AMP levels [50] and therefore prfA activation [51,52]. lmo0779 (uncharacterized function), cbpA (a cyclic di-AMP binding protein [53]) and ygbB (2-C-methyl-D-erythritol2,4-cyclodiphosphate synthase) are important for oxidative stress resistance of L. monocytogenes when PrfA is activated [51]. MEP (methylerythritol phosphate) pathway, which plays a role in oxidative stress [54], uses pyruvate as a substrate and involves the ygbB gene [55]. On the other hand, the regulation of pyruvate entering the TCA cycle by inhibiting pyruvate carboxylase (pycA) is controlled by c-di-AMP signalling [37]. Elevated c-di-AMP levels in ΔpdeA and WT likely inhibited pycA activity and resulted in the interruption of pyruvate entrance to the TCA cycle. Thus, the increased concentration of c-di-AMP under oxidative stress (Figure 5) is likely due to disruption of the TCA cycle, the use of pyruvate by the MEP pathway, and due to an activated ygbB. Since (p)ppGpp has been shown to protect against oxidative stress in other microorganisms [56], our findings suggest a link between (p)ppGpp signalling and c-di-AMP levels in L. monocytogenes against oxidative stress resistance.
Due to the differences in oxidative stress resistance and catalase activity levels between WT and ΔpdeA, a whole transcriptomic analysis was conducted for the 10 h aerobically grown WT and ΔpdeA cells before oxidative stress. The enrichment of GO categories was observed, but the statistical significance was relatively modest (Figure 5A). This suggests that while biological processes related to membrane integrity, metabolism, and signalling were affected by the loss of pdeA, the magnitude of these changes at the global level was subtle. It is possible that the sensitivity of 10 h grown ΔpdeA to oxidative stress arises from cumulative minor disruptions across the multiple metabolic and membrane-associated pathways rather than one major factor alone.
KEGG pathway enrichment analysis of the downregulated genes revealed significant enrichment of key energy-related pathways, including the pentose phosphate pathway (PPP), carbon metabolism, pyruvate metabolism, and citrate cycle (TCA cycle) (Figure 5C). These pathways are the top significant energy pathways playing a role in oxidative stress [57,58,59,60]. Therefore, the downregulation of mainly these pathways might contribute to the sensitivity of 10 h grown ΔpdeA cells against oxidative stress. PPP has two parts, which are the oxidative branch and the non-oxidative branch. The oxidative branch helps break down glucose to produce NADPH [61], a crucial reducing agent that powers antioxidant systems like glutathione and thioredoxin [62]. Meanwhile, the non-oxidative branch generates five-carbon sugars needed for nucleotide synthesis, helping in the repair of DNA damage caused by ROS [61]. Earlier, it has been shown that the oxidative branch becomes especially active during sudden oxidative stress to provide more NADPH [63]. Additionally, in L. monocytogenes, the enzyme in the non-oxidative part of the PPP called ribulose-5-phosphate 3-epimerase (Rpe), converts ribulose-5-phosphate into glyceraldehyde-3-phosphate and fructose-6-phosphate. Both are part of the glycolysis pathway [64,65], which is also downregulated in ΔpdeA compared to WT (Figure 5C).
Oxidative stress affects the TCA cycle in microorganisms in different ways. In some cases, TCA cycle activity increases, with elevated levels of intermediates like fumarate, malate, α-ketoglutarate, and succinate, sometimes involving the GABA shunt for stress resistance [66]. Furthermore, the activity of the TCA cycle leads to ROS production [66,67], which triggers SOS response (bacterial DNA repair mechanism) to protect cells against ROS [57]. In other situations, it leads to the downregulation of the TCA cycle and glycolysis as part of an energy-saving survival strategy [66]. Despite these variations, many microbes commonly shift glucose metabolism towards the PPP to generate NADPH, which helps combat oxidative damage. Recent studies have also proven this by showing that the TCA cycle plays a limited role in L. monocytogenes [63] and Escherichia coli [67] oxidative stress response. It is obvious that elevated c-di-AMP levels in WT (Figure 3) would interrupt the TCA cycle. Overall, these support that downregulation of PPP is a key factor contributing to the sensitivity of 10 h grown ΔpdeA against oxidative stress in L. monocytogenes.
Moreover, Siletti et al. (2024) have found that c-di-AMP accumulation in L. monocytogenes disrupts glutathione metabolism, which might result in sensitivity to oxidative stress [41]. Our transcriptomic data showed that the expression of gshAB, which encodes glutathione biosynthesis, was not affected significantly by the accumulation of c-di-AMP at the end of 10 h (padj > 0.05; Table S2). However, pathways contributing to glutathione levels in the cell, including PPP (padj < 0.05), pyruvate metabolism, glycolysis/gluconeogenesis, and cysteine and methionine metabolism, were also downregulated (padj > 0.05; Figure 5B). Even though we confirmed the disruption in glutathione metabolism due to c-di-AMP accumulation (Yilmaz Topcam & Karatzas, unpublished data) [42], this phenomenon occurs at the late stationary phase. As previously mentioned, at 18 h, the accumulation of c-di-AMP enhanced cellular robustness against oxidative stress, which was unexpected considering the disruption of glutathione metabolism. This supports the idea that the increased resistance may involve additional mechanisms, rather than solely the disruption of glutathione metabolism.
Downregulation of genes mainly in the PPP, carbon metabolism, sulfur relay, pyruvate metabolism, glycolysis/gluconeogenesis, and cysteine and methionine metabolism system might lead to the sensitivity of 10 h grown ΔpdeA under oxidative stress [60,63,68]. Apart from the above pathways, we also investigated genes that are involved in oxidative stress resistance-related. There was no significant difference in the transcription of oxidative stress resistance genes (Table S2). Even though most of these genes, such as ohrR, rex, prfA, kat and recA, were downregulated with the c-di-AMP accumulation, the changes were not statistically significant (padj > 0.05). Superoxide dismutase protein sodA was slightly downregulated with the deletion of pdeA (−0.43 log2fold change, padj > 0.05). Previously, in S. aureus, the superoxide dismutase gene (sodM) was also shown to be downregulated in PDE mutants [20,46]. Similar to our findings at 18 h (comparison survival of ΔpdeA and WT), Corrigan et al. (2015) also did not observe an additional protection effect of c-di-AMP on survival under oxidative stress (H2O2 exposure for 30 min), even though a 5.56-fold downregulation of sodM was recorded [46]. We also showed that at 10 h of growth, disA and cdaA, which are responsible for the production of c-di-AMP and important for repairing DNA damage caused by alkyl groups and H2O2 [21], were insignificantly downregulated (−0.55 and −0.64 log2fold change respectively, padj > 0.05).
These downregulated pathways and gene expressions before the application of H2O2 may make the ΔpdeA cells already sensitive towards oxidative stress. Similar to our findings, the subtle effect of low levels of c-di-AMP has been recently observed by Tu et al. (2024). It has been found that at normal and low c-di-AMP levels, β-lactam antibiotic resistance diminishes, whereas, upon c-di-AMP accumulation, β-lactam antibiotic resistance increases [69]. Longer incubation periods might provide a clearer change in the expression levels of those genes, due to higher c-di-AMP accumulation in ΔpdeA cells. In fact, even if oxidative stress-related genes were significantly downregulated at a later time point, this alone would not explain the resistance of ΔpdeA observed in 18 h, as previously demonstrated by Gándara & Alonso (2015) [21]. Instead, the elevated resistance of ΔpdeA might be related to membrane-associated pathways and improved DNA repair due to high concentrations of c-di-AMP accumulation.
O-antigen nucleotide sugar biosynthesis, ABC transporters, glycerophospholipid metabolism, terpenoid backbone biosynthesis, biosynthesis of nucleotide sugars, amino sugar and nucleotide sugar metabolism, bacterial chemotaxis are the most significantly upregulated pathways, in aerobically 10 h grown ΔpdeA cells (vs. WT) (Figure 5B). O-antigen nucleotide sugar biosynthesis, nucleotide sugar metabolism, and glycerophospholipid metabolism all contribute to cell wall and membrane integrity [70,71,72] which are significant in dealing with oxidative stress resistance [73]. Moreover, MEP is one of the main routes for the terpenoid backbone biosynthesis that confirms the protectant role of this pathway to oxidative stress [74]. Further upregulation of these pathways in the following time points might contribute to enhanced oxidative stress resistance of ΔpdeA. Overall these support the notion that as c-di-AMP accumulates over time, its effect on biological and molecular functions, and cellular components, would become more pronounced.
Cysteine is essential for growth and redox balance. It can be synthesised from glutamate and glycine or acquired directly from the host cytosol [32]. Due to the effect of glutamate and glutamine on c-di-AMP concentrations in S. aureus and B. subtilis [27,28], and the downregulation of cysteine and methionine metabolism in ΔpdeA (Figure 5C), we also tested the impact of L-cysteine in L. monocytogenes in this study. There was no difference in catalase activity or survival under oxidative stress (Figure 6A,B) and intracellular c-di-AMP concentrations (Figure 6C) when the cells were grown in DM. As expected, supplementation with L-cysteine made 10403S WT cells more robust towards H2O2 treatment [54,75], which can be inferred from the applied H2O2 concentration for survival experiments (Figure 6A). On the other hand, catalase activity levels of both strains were not affected significantly compared to DM (p > 0.05) and were similar to each other with L-cysteine supplementation (p > 0.05; Figure 6B). The discrepancy between catalase activity levels and oxidative stress resistance under aerobic conditions raises the question of whether intracellular c-di-AMP concentrations might affect survival rather than catalase activity under these conditions. Therefore, the intracellular c-di-AMP concentrations of WT and ΔpdeA were measured. As expected, ΔpdeA cells accumulated more c-di-AMP than WT in BHI (p < 0.05; Figure 6C). Loss of pdeA did not result in the accumulation of considerable concentrations of c-di-AMP levels in DM (Figure 6C). This is likely because c-di-AMP is particularly required for metabolic adjustments in nutrient-rich environments and within host cells, but not in a minimal media [8]. On the other hand, supplementation of aerobically grown cells with L-cysteine did not affect intracellular c-di-AMP levels of either WT or ΔpdeA, but the difference between strains was found significant (p < 0.05; Figure 6C). The higher c-di-AMP concentrations in ΔpdeA might explain the survival against oxidative stress. However, similar catalase activity levels or c-di-AMP concentrations in DMs are likely because cysteine is oxidised to cystine in the presence of oxygen [76], preventing any observable effect of cysteine as a compound. To see the exact role of cysteine and know the effect of the presence of oxygen on c-di-AMP concentrations [27], the same experiments were also conducted under anaerobic conditions.
Under anaerobic growth, L-cysteine led to a significant increase in c-di-AMP levels of both WT and ΔpdeA (p < 0.05; Figure 7B). This observation suggests that L-cysteine may affect the production and degradation of c-di-AMP in L. monocytogenes. Transcriptomic data investigating the effect of L-cysteine supplementation in the WT (under anaerobic conditions) showed that the expression of dacA (responsible for c-di-AMP production in L. monocytogenes) resulted in a significant downregulation (p-adj < 0.05; Table 2). This downregulation is likely because of nitrogen-sensitive control of c-di-AMP synthesis, which was previously shown in B. subtilis in the presence of glutamine [28]. Moreover, Whiteley et al. (2015) found that dacA is not essential for growth in minimal media. This was associated with the requirement for glutamate, which is necessary for producing several metabolites under nutrient stress [8]. Cysteine is a key precursor for glutathione synthesis [32]. Therefore, it would decrease the requirement for glutamate and glutathione. L-cysteine supplementation may reduce demand for the other metabolic compounds in DM; consequently, it might decrease the need for dacA. Moreover, both PDEs, pdeA and pgpH, were significantly downregulated (p-adj < 0.05; Table 2) in response to L-cysteine supplementation, which might explain the elevated c-di-AMP concentrations of WT in L-cysteine-supplemented DM (Figure 7B).
We found that anaerobically grown L. monocytogenes WT and ΔpdeA cells were more sensitive to oxidative stress than aerobically grown cells (Figure 7A), and catalase activities were under the detectable limits, which are consistent with previous findings in the literature [77,78]. Whole transcriptomic data comparing aerobic and anaerobic growth of L. monocytogenes EGD performed by Müller-Herbst et al. (2014) showed that anaerobic incubation led to the downregulation of the kat gene [7], which can support our lower catalase activity results under anaerobic conditions. Surprisingly, while aerobically stationary phase grown ΔpdeA was more robust than WT against oxidative stress with L-cysteine supplementation, anaerobically grown ΔpdeA and WT had similar survival rates under oxidative stress.
Intracellular c-di-AMP concentrations of anaerobically grown ΔpdeA and WT were also measured. Similarly to aerobic conditions, the difference between ΔpdeA and WT grown in DM was not statistically different. This again supports the requirement of c-di-AMP in nutrient-rich environments for metabolic adjustments [8]. Moreover, the pattern in BHI was the same as under aerobic conditions (Figure 6C and Figure 7B). L. monocytogenes can produce ATP (Adenosine Triphosphate) through substrate-level phosphorylation or oxidative phosphorylation. Oxidative phosphorylation results in a higher ATP yield, which leads to better growth of L. monocytogenes EGD under aerobic conditions [7]. Importantly, since intracellular c-di-AMP levels were normalized per cell, the differences observed between aerobically and anaerobically grown cells reflect true intracellular changes rather than being a consequence of differences in growth. This suggests that oxygen availability directly influences c-di-AMP homeostasis in L. monocytogenes, independent of cell number.
On the other hand, Müller-Herbst et al. (2014) have demonstrated that the expression of the genes controlling pyruvate and acetoin production from glucose is downregulated under anaerobic conditions. In addition, the acetate production pathway only works aerobically, and pyruvate can be converted to acetate through acetyl-CoA. This conversion is carried out by the pyruvate dehydrogenase complex, encoded by pdhABCD. Notably, pdhABCD was downregulated under anaerobic growth conditions [7]. Therefore, the decreased levels of intracellular c-di-AMP under anaerobic conditions might be expected due to the lack of pyruvate. Contrary to this expectation, significantly higher levels of c-di-AMP concentrations were obtained under anaerobic conditions than under aerobic conditions (p < 0.05; Figure 6C and Figure 7B). Anaerobic conditions induce broad physiological changes in L. monocytogenes, including metabolic pathways, enhanced stress resistance, and increased virulence [79], which likely involves c-di-AMP signalling pathways. This also can be supported by our data showing that oxidative stress application led to a significant increase of c-di-AMP in both WT and ΔpdeA (p < 0.05; Figure 5).

5. Conclusions

In conclusion, our findings highlight the role of c-di-AMP in modulating catalase activity and cellular responses to oxidative stress. We showed that pdeA contributes to catalase activity levels of L. monocytogenes, however in this case, catalase activity does not play a significant role compared to c-di-AMP homeostasis in oxidative stress protection. The interruption in c-di-AMP homeostasis makes cells more sensitive towards oxidative stress in the early stationary phase. However, higher c-di-AMP accumulation renders ΔpdeA cells more robust compared to the early stationary phase. Our transcriptomic data explain that the sensitivity of ΔpdeA at 10 h is likely due to the downregulation of oxidative stress-related pathways, mainly PPP. Moreover, the robustness of ΔpdeA at 18 h was explained with a possible role in improved membrane functions or involvement of other pathways with further c-di-AMP accumulation. Although our transcriptomic data provides subtle changes in gene expression, it the c-di-AMP accumulation, might signify an effect of the above pathways. This suggests that c-di-AMP homeostasis might play a key role in various pathways and stress resistance. 1For the first time, we found that oxidative stress, supplementation with cysteine, and growth under anaerobic conditions elevated the c-di-AMP levels in L. monocytogenes. Therefore, our study is significant for understanding the bacterial response of L. monocytogenes and similar microorganisms to oxidative stress.

Supplementary Materials

The following supporting information can be downloaded at https://www.mdpi.com/article/10.3390/microorganisms13061400/s1. Table S1: Summary of RNA-seq alignment. Table S2: Transcription levels of genes playing a role in oxidative stress resistance (10 h grown ΔpdeA vs. WT in BHI under aerobic conditions).

Author Contributions

Conceptualization, M.M.Y.T. and K.A.G.K.; methodology, M.M.Y.T. and K.A.G.K.; software, M.M.Y.T.; validation, M.M.Y.T. and K.A.G.K.; formal analysis, M.M.Y.T. and D.P.B.; investigation, M.M.Y.T.; resources, M.M.Y.T. and K.A.G.K.; data curation, M.M.Y.T.; writing—original draft preparation, M.M.Y.T.; writing—review and editing, K.A.G.K.; visualization, M.M.Y.T.; supervision, K.A.G.K.; project administration, K.A.G.K.; funding acquisition, M.M.Y.T. and K.A.G.K. All authors have read and agreed to the published version of the manuscript.

Funding

This research was funded by the Turkish Embassy of Higher Education Scholarship Programme YLSY.

Institutional Review Board Statement

Not applicable.

Informed Consent Statement

Not applicable.

Data Availability Statement

The data generated and analysed during this study are available from the main author or corresponding author upon reasonable request.

Acknowledgments

This project is sponsored by the Turkish Embassy of the Higher Education Scholarship Programme YLSY, 2016. Listeria monocytogenes 10403S ΔpdeA was gifted by Daniel A. Portnoy, University of California.

Conflicts of Interest

The authors declare no conflicts of interest.

Abbreviations

The following abbreviations are used in this manuscript:
ATPAdenosine Triphosphate
BHIBrain Heart Infusion
BPBiological Processes
c-di-AMPCyclic di-AMP
CCCellular Compound
DACsDiadenylate Cyclases
DMDefined Media
ESIElectrospray Ionisation
GOGene Ontology
HPLCHigh-Performance Liquid Chromatography
KEGGKyoto Encyclopedia of Genes and Genomes
LC-MS Liquid Chromatography–Mass Spectrometry
MFMolecular Function
PDEsPhosphodiesterases
PPPPentose Phosphate Pathway
ROSReactive Oxygen Species
SODSuperoxide Dismutase
TCATricarboxylic Acid Cycle
WTWild Type

References

  1. Lungu, B.; Ricke, S.C.; Johnson, M.G. Growth, survival, proliferation and pathogenesis of Listeria monocytogenes under low oxygen or anaerobic conditions: A review. Anaerobe 2009, 15, 7–17. [Google Scholar] [CrossRef] [PubMed]
  2. Pizarro-Cerdá, J.; Cossart, P. Listeria monocytogenes: Cell biology of invasion and intracellular growth. Microbiol. Spectr. 2018, 6. [Google Scholar] [CrossRef]
  3. Matereke, L.T.; Okoh, A.I. Listeria monocytogenes virulence, antimicrobial resistance and environmental persistence: A review. Pathogens 2020, 9, 528. [Google Scholar] [CrossRef] [PubMed]
  4. White, S.J.; McClung, D.M.; Wilson, J.G.; Roberts, B.N.; Donaldson, J.R. Influence of pH on bile sensitivity amongst various strains of Listeria monocytogenes under aerobic and anaerobic conditions. J. Med. Microbiol. 2015, 64, 1287–1296. [Google Scholar] [CrossRef] [PubMed]
  5. Mongkolsuk, S.; Helmann, J.D. Regulation of inducible peroxide stress responses. Mol. Microbiol. 2002, 45, 9–15. [Google Scholar] [CrossRef]
  6. Winterbourn, C.C.; Kettle, A.J. Redox reactions and microbial killing in the neutrophil phagosome. Antioxid. Redox Signal. 2013, 18, 642–660. [Google Scholar] [CrossRef]
  7. Müller-Herbst, S.; Wüstner, S.; Mühlig, A.; Eder, D.; Fuchs, T.M.; Held, C.; Ehrenreich, A.; Scherer, S. Identification of genes essential for anaerobic growth of Listeria monocytogenes. Microbiology 2014, 160, 752–765. [Google Scholar] [CrossRef]
  8. Whiteley, A.T.; Pollock, A.J.; Portnoy, D.A. The PAMP c-di-AMP is essential for Listeria monocytogenes growth in rich but not minimal media due to a toxic increase in (p)ppGpp. Cell Host Microbe 2015, 17, 788–798. [Google Scholar] [CrossRef]
  9. Bo Andersen, J.; Roldgaard, B.B.; Christensen, B.B.; Licht, T.R. Oxygen restriction increases the infective potential of Listeria monocytogenes in vitro in Caco-2 cells and in vivo in guinea pigs. BMC Microbiol. 2007, 7, 55. [Google Scholar] [CrossRef]
  10. Jydegaard-Axelsen, A.M.; Høiby, P.E.; Holmstrøm, K.; Russell, N.; Knøchel, S. CO2- and anaerobiosis-induced changes in physiology and gene expression of different Listeria monocytogenes strains. Appl. Environ. Microbiol. 2004, 70, 4111–4117. [Google Scholar] [CrossRef]
  11. Flint, A.; Butcher, J.; Stintzi, A. Stress responses, adaptation, and virulence of bacterial pathogens during host gastrointestinal colonization. Microbiol. Spectrum. 2016, 4, VMBF-0007-2015. [Google Scholar] [CrossRef] [PubMed]
  12. Corrigan, R.M.; Gründling, A. Cyclic di-AMP: Another second messenger enters the fray. Nat. Rev. Microbiol. 2013, 11, 513–524. [Google Scholar] [CrossRef]
  13. Fahmi, T.; Port, G.C.; Cho, K.H. c-di-AMP: An essential molecule in the signaling pathways that regulate the viability and virulence of Gram-positive bacteria. Genes 2017, 8, 197. [Google Scholar] [CrossRef] [PubMed]
  14. Xiong, Z.Q.; Fan, Y.Z.; Song, X.; Liu, X.X.; Xia, Y.J.; Ai, L.Z. The second messenger c-di-AMP mediates bacterial exopolysaccharide biosynthesis: A review. Mol. Biol. Rep. 2020, 47, 7811–7817. [Google Scholar] [CrossRef] [PubMed]
  15. Huynh, T.A.N.; Luo, S.; Pensinger, D.; Sauer, J.D.; Tong, L.; Woodward, J.J. An HD-domain phosphodiesterase mediates cooperative hydrolysis of c-di-AMP to affect bacterial growth and virulence. Proc. Natl. Acad. Sci. USA 2015, 112, E747–E756. [Google Scholar] [CrossRef]
  16. Abundiz-Yañez, K.; Leyva-Sánchez, H.C.; Robleto, E.A.; Pedraza-Reyes, M. Stress-associated and growth-dependent mutagenesis are divergently regulated by c-di-AMP levels in Bacillus subtilis. Int. J. Mol. Sci. 2023, 24, 455. [Google Scholar] [CrossRef]
  17. Rallu, F.; Gruss, A.; Ehrlich, S.D.; Maguin, E. Acid- and multistress-resistant mutants of Lactococcus lactis: Identification of intracellular stress signals. Mol. Microbiol. 2000, 35, 517–528. [Google Scholar] [CrossRef]
  18. Zarrella, T.M.; Metzger, D.W.; Bai, G. Stress suppressor screening leads to detection of regulation of cyclic di-AMP homeostasis by a Trk family effector protein in Streptococcus pneumoniae. J. Bacteriol. 2018, 200, e00045-18. [Google Scholar] [CrossRef]
  19. Rørvik, G.H.; Naemi, A.O.; Edvardsen, P.K.T.; Simm, R. The c-di-AMP signaling system influences stress tolerance and biofilm formation of Streptococcus mitis. MicrobiologyOpen 2021, 10, e1203. [Google Scholar] [CrossRef]
  20. Dengler Haunreiter, V.; Tarnutzer, A.; Bär, J.; von Matt, M.; Hertegonne, S.; Andreoni, F.; Vulin, C.; Künzi, L.; Menzi, C.; Kiefer, P.; et al. c-di-AMP levels modulate Staphylococcus aureus cell wall thickness, response to oxidative stress, and antibiotic resistance and tolerance. Microbiol. Spectr. 2023, 11, e02788-23. [Google Scholar] [CrossRef]
  21. Gándara, C.; Alonso, J.C. DisA and c-di-AMP act at the intersection between DNA-damage response and stress homeostasis in exponentially growing Bacillus subtilis cells. DNA Repair 2015, 27, 1–8. [Google Scholar] [CrossRef] [PubMed]
  22. Rubin, B.E.; Huynh, T.N.; Welkie, D.G.; Diamond, S.; Simkovsky, R.; Pierce, E.C.; Taton, A.; Lowe, L.C.; Lee, J.J.; Rifkin, S.A.; et al. High-throughput interaction screens illuminate the role of c-di-AMP in cyanobacterial nighttime survival. PLoS Genet. 2018, 14, e1007301. [Google Scholar] [CrossRef]
  23. Clauditz, A.; Resch, A.; Wieland, K.P.; Peschel, A.; Götz, F. Staphyloxanthin plays a role in the fitness of Staphylococcus aureus and its ability to cope with oxidative stress. Infect. Immun. 2006, 74, 4950–4953. [Google Scholar] [CrossRef]
  24. Cheng, X.; Zheng, X.; Zhou, X.; Zeng, J.; Ren, Z.; Xu, X.; Cheng, L.; Li, M.; Li, J.; Li, Y. Regulation of oxidative response and extracellular polysaccharide synthesis by a diadenylate cyclase in Streptococcus mutans. Environ. Microbiol. 2016, 18, 904–922. [Google Scholar] [CrossRef]
  25. Fahmi, T.; Faozia, S.; Port, G.C.; Cho, K.H. The second messenger c-di-AMP regulates diverse cellular pathways involved in stress response, biofilm formation, cell wall homeostasis, SpeB expression, and virulence in Streptococcus pyogenes. Infect. Immun. 2019, 87, e00571-18. [Google Scholar] [CrossRef] [PubMed]
  26. Walker, M.C.; van der Donk, W.A. The many roles of glutamate in metabolism. J. Ind. Microbiol. Biotechnol. 2016, 43, 419–430. [Google Scholar] [CrossRef] [PubMed]
  27. Zeden, M.S.; Kviatkovski, I.; Schuster, C.F.; Thomas, V.C.; Fey, P.D.; Gründling, A. Identification of the main glutamine and glutamate transporters in Staphylococcus aureus and their impact on c-di-AMP production. Mol. Microbiol. 2020, 113, 1085–1100. [Google Scholar] [CrossRef]
  28. Gundlach, J.; Mehne, F.M.; Herzberg, C.; Kampf, J.; Valerius, O.; Kaever, V.; Stülke, J. An essential poison: Synthesis and degradation of cyclic di-AMP in Bacillus subtilis. J. Bacteriol. 2015, 197, 3265–3274. [Google Scholar] [CrossRef]
  29. Sato, Y.; Noji, S.; Suzuki, R.; Taniguchi, S. Dual mechanism for stimulation of glutamate transport by potassium ions in Streptococcus mutans. J. Bacteriol. 1989, 171, 4963–4966. [Google Scholar] [CrossRef]
  30. Krastel, K.; Senadheera, D.B.; Mair, R.; Downey, J.S.; Goodman, S.D.; Cvitkovitch, D.G. Characterization of a glutamate transporter operon, glnQHMP, in Streptococcus mutans and its role in acid tolerance. J. Bacteriol. 2010, 192, 984–993. [Google Scholar] [CrossRef]
  31. Gibhardt, J.; Hoffmann, G.; Turdiev, A.; Wang, M.; Lee, V.T.; Commichau, F.M. C-di-AMP assists osmoadaptation by regulating the Listeria monocytogenes potassium transporters KimA and KtrCD. J. Biol. Chem. 2019, 294, 16020–16033. [Google Scholar] [CrossRef]
  32. Sauer, J.D.; Herskovits, A.A.; O’Riordan, M.X. Metabolism of the gram-positive bacterial pathogen Listeria monocytogenes. Microbiol. Spectr. 2019, 7, GPP3-0066-2019. [Google Scholar] [CrossRef] [PubMed]
  33. Azizoglu, R.O.; Kathariou, S. Temperature-dependent requirement for catalase in aerobic growth of Listeria monocytogenes F2365. Appl. Environ. Microbiol. 2010, 76, 6998–7003. [Google Scholar] [CrossRef] [PubMed]
  34. Iwase, T.; Tajima, A.; Sugimoto, S.; Okuda, K.I.; Hironaka, I.; Kamata, Y.; Takada, K.; Mizunoe, Y. A simple assay for measuring catalase activity: A visual approach. Sci. Rep. 2013, 3, 3081. [Google Scholar] [CrossRef] [PubMed]
  35. Amezaga, M.R.; Davidson, I.; McLaggan, D.; Verheul, A.; Abee, T.; Booth, I.R. The role of peptide metabolism in the growth of Listeria monocytogenes ATCC 23074 at high osmolarity. Microbiology 1995, 141, 41–49. [Google Scholar] [CrossRef]
  36. Karatzas, K.A.G.; Brennan, O.; Heavin, S.; Morrissey, J.; O’Byrne, C.P. Intracellular accumulation of high levels of γ-aminobutyrate by Listeria monocytogenes 10403S in response to low pH: Uncoupling of γ-aminobutyrate synthesis from efflux in a chemically defined medium. Appl. Environ. Microbiol. 2010, 76, 3529–3537. [Google Scholar] [CrossRef]
  37. Witte, C.E.; Whiteley, A.T.; Burke, T.P.; Sauer, J.D.; Portnoy, D.A.; Woodward, J.J. Cyclic di-AMP is critical for Listeria monocytogenes growth, cell wall homeostasis, and establishment of infection. mBio 2013, 4, e00282-13. [Google Scholar] [CrossRef]
  38. Oppenheimer-Shaanan, Y.; Wexselblatt, E.; Katzhendler, J.; Yavin, E.; Ben-Yehuda, S. C-di-AMP reports DNA integrity during sporulation in Bacillus subtilis. EMBO Rep. 2011, 12, 594–601. [Google Scholar] [CrossRef]
  39. Mathews, P.G. Design of Experiments with MINITAB; Quality Press: Milwaukee, WI, USA, 2004. [Google Scholar]
  40. Ruhland, B.R.; Reniere, M.L. Sense and sensor ability: Redox-responsive regulators in Listeria monocytogenes. Curr. Opin. Microbiol. 2019, 47, 20–25. [Google Scholar] [CrossRef]
  41. Siletti, C.; Freeman, M.; Tu, Z.; Stevenson, D.M.; Amador-Noguez, D.; Sauer, J.D.; Huynh, T.N. C-di-AMP accumulation disrupts glutathione metabolism and inhibits virulence program expression in Listeria monocytogenes. bioRxiv 2024. [Google Scholar] [CrossRef]
  42. Muchaamba, F.; Stephan, R.; Tasara, T. Listeria monocytogenes cold shock proteins: Small proteins with a huge impact. Microorganisms 2021, 9, 1061. [Google Scholar] [CrossRef]
  43. Díaz-Acosta, A.; Sandoval, M.L.; Delgado-Olivares, L.; Membrillo-Hernández, J. Effect of anaerobic and stationary phase growth conditions on the heat shock and oxidative stress responses in Escherichia coli K-12. Arch. Microbiol. 2006, 185, 429–438. [Google Scholar] [CrossRef] [PubMed]
  44. Boura, M.; Keating, C.; Royet, K.; Paudyal, R.; O’Donoghue, B.; O’Byrne, C.P.; Karatzas, K.A. Loss of SigB in Listeria monocytogenes Strains EGD-e and 10403S Confers Hyperresistance to Hydrogen Peroxide in Stationary Phase under Aerobic Conditions. Appl. Environ. Microbiol. 2016, 82, 4584–4591. [Google Scholar] [CrossRef] [PubMed]
  45. Yilmaz Topcam, M.M.; Karatzas, K.A.G. Evaluating the Role of Cysteine Transporter ctaP (lmo0135) and Extracellular Cysteine in Stationary Phase-Grown Listeria monocytogenes 10403S by Transcriptional Analysis; University of Reading: Reading, UK, 2025. [Google Scholar]
  46. Corrigan, R.M.; Bowman, L.; Willis, A.R.; Kaever, V.; Gründling, A. Cross-talk between two nucleotide-signaling pathways in Staphylococcus aureus. J. Biol. Chem. 2015, 290, 5826–5839. [Google Scholar] [CrossRef] [PubMed]
  47. McCarthy, B.J.; Hinshelwood, C.N. Variations in catalase activity during a bacterial growth cycle. Proc. R. Soc. London. Ser. B-Biol. Sci. 1959, 150, 13–23. [Google Scholar]
  48. Peterson, B.N.; Young, J.W.; Smith, S.M.; Sham, L.-T.; Winkler, M.E.; Grayczyk, J.P.; Jones-Carson, J.; Slauch, J.M. (P)ppGpp and c-di-AMP homeostasis is controlled by Cbpb in Listeria monocytogenes. mBio 2020, 11, e01625-20. [Google Scholar] [CrossRef]
  49. Liu, K.; Bittner, A.N.; Wang, J.D. Diversity in (p)ppGpp metabolism and effectors. Curr. Opin. Microbiol. 2015, 24, 72–79. [Google Scholar] [CrossRef]
  50. Rao, F.; See, R.Y.; Zhang, D.; Toh, D.C.; Ji, Q.; Liang, Z.X. YybT is a signaling protein that contains a cyclic dinucleotide phosphodiesterase domain and a GGDEF domain with ATPase activity. J. Biol. Chem. 2010, 285, 473–482. [Google Scholar] [CrossRef]
  51. Mains, D.R.; Eallonardo, S.J.; Freitag, N.E. Identification of Listeria monocytogenes genes contributing to oxidative stress resistance under conditions relevant to host infection. Infect. Immun. 2021, 89, e00112-21. [Google Scholar] [CrossRef]
  52. Portman, J.L.; Dubensky, S.B.; Peterson, B.N.; Whiteley, A.T.; Portnoy, D.A. Activation of the Listeria monocytogenes virulence program by a reducing environment. mBio 2017, 8, e01054-17. [Google Scholar] [CrossRef]
  53. Sureka, K.; Choi, P.H.; Precit, M.; Delince, M.; Pensinger, D.A.; Huynh, T.N.; Jurado, A.R.; Goo, Y.A.; Sadilek, M.; Iavarone, A.T.; et al. The Cyclic Dinucleotide c-di-AMP Is an Allosteric Regulator of Metabolic Enzyme Function. Cell 2014, 158, 1389–1401. [Google Scholar] [CrossRef]
  54. Ostrovsky, D.; Diomina, G.; Lysak, E.; Matveeva, E.; Ogrel, O.; Trutko, S. Effect of Oxidative Stress on the Biosynthesis of 2-C-Methyl-D-Erythritol-2, 4-Cyclopyrophosphate and Isoprenoids by Several Bacterial Strains. Arch. Microbiol. 1998, 171, 69–72. [Google Scholar] [CrossRef] [PubMed]
  55. Frank, A.; Groll, M. The methylerythritol phosphate pathway to isoprenoids. Chem. Rev. 2017, 117, 5675–5703. [Google Scholar] [CrossRef]
  56. Gray, M.J.; Jakob, U. Oxidative stress protection by polyphosphate—New roles for an old player. Mol. Microbiol. 2015, 95, 497–504. [Google Scholar] [CrossRef]
  57. Pan, Y.; Cheng, J.H.; Sun, D.W. Metabolomic analyses on microbial primary and secondary oxidative stress responses. Compr. Rev. Food Sci. Food Saf. 2021, 20, 5675–5697. [Google Scholar] [CrossRef] [PubMed]
  58. Muchaamba, F.; Eshwar, A.K.; Stevens, M.J.A.; von Ah, U.; Tasara, T. Variable carbon source utilization, stress resistance, and virulence profiles among Listeria monocytogenes strains responsible for listeriosis outbreaks in Switzerland. Front. Microbiol. 2019, 10, 957. [Google Scholar] [CrossRef]
  59. Stincone, A.; Prigione, A.; Cramer, T.; Wamelink, M.M.; Campbell, K.; Cheung, E.; Olin-Sandoval, V.; Grüning, N.M.; Krüger, A.; Tauqeer Alam, M.; et al. The return of metabolism: Biochemistry and physiology of the pentose phosphate pathway. Biol. Rev. 2015, 90, 927–963. [Google Scholar] [CrossRef]
  60. He, L.; Deng, Q.L.; Chen, M.T.; Wu, Q.P.; Lu, Y.J. Proteomics analysis of Listeria monocytogenes ATCC 19115 in response to simultaneous triple stresses. Arch. Microbiol. 2015, 197, 833–841. [Google Scholar] [CrossRef] [PubMed]
  61. Abdelhamed, H.; Ramachandran, R.; Narayanan, L.; Islam, S.; Ozan, O.; Freitag, N.; Lawrence, M.L. Role of FruR transcriptional regulator in virulence of Listeria monocytogenes and identification of its regulon. PLoS ONE 2022, 17, e0274005. [Google Scholar] [CrossRef]
  62. Chandel, N.S. NADPH—The forgotten reducing equivalent. Cold Spring Harb. Perspect. Biol. 2021, 13, a040550. [Google Scholar] [CrossRef]
  63. Ogunleye, S.C.; Islam, S.; Chowdhury, Q.M.K.; Ozdemir, O.; Lawrence, M.L.; Abdelhamed, H. Catabolite Control Protein C Contributes to Virulence and Hydrogen Peroxide-Induced Oxidative Stress Responses in Listeria monocytogenes. Front. Microbiol. 2024, 15, 1403694. [Google Scholar] [CrossRef] [PubMed]
  64. Pittman, J.R.; Buntyn, J.O.; Posadas, G.; Nanduri, B.; Pendarvis, K.; Donaldson, J.R. Proteomic analysis of cross protection provided between cold and osmotic stress in Listeria monocytogenes. J. Proteome Res. 2014, 13, 1896–1904. [Google Scholar] [CrossRef]
  65. Bowman, J.P.; Hages, E.; Nilsson, R.E.; Kocharunchitt, C.; Ross, T. Investigation of the Listeria monocytogenes Scott A acid tolerance response and associated physiological and phenotypic features via whole proteome analysis. J. Proteome Res. 2012, 11, 2409–2426. [Google Scholar] [CrossRef]
  66. Rosato, R.R.; Fernandez, R.; Paz, L.I.; Singh, C.R.; Rosato, A.E. TCA cycle-mediated generation of ROS is a key mediator for HeR-MRSA survival under β-lactam antibiotic exposure. PLoS ONE 2014, 9, e99605. [Google Scholar] [CrossRef] [PubMed]
  67. Chueca, B.; Pagán, R.; García-Gonzalo, D. Oxygenated monoterpenes citral and carvacrol cause oxidative damage in Escherichia coli without the involvement of tricarboxylic acid cycle and Fenton reaction. Int. J. Food Microbiol. 2014, 189, 126–131. [Google Scholar] [CrossRef]
  68. Cortes, B.W.; Naditz, A.L.; Anast, J.M.; Schmitz-Esser, S. Transcriptome sequencing of Listeria monocytogenes reveals major gene expression changes in response to lactic acid stress exposure but a less pronounced response to oxidative stress. Front. Microbiol. 2020, 10, 3110. [Google Scholar] [CrossRef] [PubMed]
  69. Tu, Z.; Stevenson, D.M.; McCaslin, D.; Amador-Noguez, D.; Huynh, T.N. The Role of Listeria monocytogenes PstA in β-Lactam Resistance Requires the Cytochrome bd Oxidase Activity. J. Bacteriol. 2024, 206, e00130-24. [Google Scholar] [CrossRef]
  70. Kalynych, S.; Morona, R.; Cygler, M. Progress in understanding the assembly process of bacterial O-antigen. FEMS Microbiol. Rev. 2014, 38, 1048–1065. [Google Scholar] [CrossRef]
  71. Tian, B.; Xu, D.; Li, W.; Wang, J.; Cheng, J.; Liu, Y. Proteomic analysis of hexahydro-β-acids/hydroxypropyl-β-cyclodextrin inhibit Listeria monocytogenes. Appl. Microbiol. Biotechnol. 2022, 106, 755–771. [Google Scholar] [CrossRef]
  72. Bhat, S.V.; Booth, S.C.; Vantomme, E.A.; Afroj, S.; Yost, C.K.; Dahms, T.E. Oxidative stress and metabolic perturbations in Escherichia coli exposed to sublethal levels of 2, 4-dichlorophenoxyacetic acid. Chemosphere 2015, 135, 453–461. [Google Scholar] [CrossRef]
  73. Liao, X.; Liu, D.; Xiang, Q.; Ahn, J.; Chen, S.; Ye, X.; Ding, T. Inactivation Mechanisms of Non-Thermal Plasma on Microbes: A Review. Food Control 2017, 75, 83–91. [Google Scholar] [CrossRef]
  74. Avalos, M.; Garbeva, P.; Vader, L.; van Wezel, G.P.; Dickschat, J.S.; Ulanova, D. Biosynthesis, evolution and ecology of microbial terpenoids. Nat. Prod. Rep. 2022, 39, 249–272. [Google Scholar] [CrossRef] [PubMed]
  75. Guidea, A.; Zăgrean-Tuza, C.; Moț, A.C.; Sârbu, C. Comprehensive evaluation of radical scavenging, reducing power and chelating capacity of free proteinogenic amino acids using spectroscopic assays and multivariate exploratory techniques. Spectrochim. Acta A Mol. Biomol. Spectrosc. 2020, 233, 118158. [Google Scholar] [CrossRef] [PubMed]
  76. Göbbels, L.; Poehlein, A.; Dumnitch, A.; Egelkamp, R.; Kröger, C.; Haerdter, J.; Hackl, T.; Feld, A.; Weller, H.; Daniel, R.; et al. Cysteine: An overlooked energy and carbon source. Sci. Rep. 2021, 11, 2139. [Google Scholar] [CrossRef]
  77. Cesinger, M.R.; Thomason, M.K.; Edrozo, M.B.; Halsey, C.R.; Reniere, M.L. Listeria monocytogenes SpxA1 Is a Global Regulator Required to Activate Genes Encoding Catalase and Heme Biosynthesis Enzymes for Aerobic Growth. Mol. Microbiol. 2020, 114, 230–243. [Google Scholar] [CrossRef]
  78. Saleh, E.; Sharkawy, I.S. The Impact of Growth History on Stress Robustness of Listeria monocytogenes. Clin. Investig. 2022, 12, 276–284. [Google Scholar]
  79. Roberts, B.N.; Chakravarty, D.; Gardner, J.C., III; Ricke, S.C.; Donaldson, J.R. Listeria monocytogenes Response to Anaerobic Environments. Pathogens 2020, 9, 210. [Google Scholar] [CrossRef]
Figure 1. 10403S WT (grey line with grey round markers) and ΔpdeA (grey line with white round markers) growth profiles at 37 °C under aerobic conditions with optical density was measured at 620 nm (OD620) every 2 h (A). Catalase activity of 10403S WT (black line with black triangle markers) and ΔpdeA cells (black line with white triangle markers) was measured every 2 h as cm of foam following catalase reaction, with photos taken (photos represent one of the replicates) (A). At the maximum catalase levels of WT cells (10 and 18 h), intracellular c-di-AMP concentrations of both WT (black bars) and ΔpdeA cells (white bars) were measured in triplicate (B). Error bars represent standard deviation, and asterisks show statistically significant differences in the catalase activity and c-di-AMP levels of WT and ΔpdeA (p < 0.05).
Microorganisms 13 01400 g001
Figure 2. Survival and catalase activity of WT (black round markers and black bars, respectively) and ΔpdeA (white round markers and white bars, respectively) cultures grown for 10 h (A) and 18 h (B) following the addition of H2O2 to a final concentration of 5.25%. All the experiments were performed in three biological replicates. Error bars represent standard deviation, while asterisks denote statistically significant differences between the WT and ΔpdeA (p < 0.05).
Microorganisms 13 01400 g002
Figure 3. Intracellular c-di-AMP concentrations of 10hgrown WT and ΔpdeA cells prior to H2O2 stress (white bars), right after the H2O2 treatment (0 min; black bars) and after 60 min (1h; patterned bars). The average accumulation of the cells during the oxidative shock was measured from triplicate experiments. Error bars represent the standard deviation of three experiments. Lowercase letters indicate the difference between WT cells, while uppercase letters indicate the difference between ΔpdeA cells in BHI. Asterisks show significant differences between the strains (p < 0.05).
Microorganisms 13 01400 g003
Figure 4. Volcano plot showing differential gene expression between ΔpdeA (treatment) and WT (control) strains grown for 10 h under aerobic conditions. In the volcano plot, the x-axis represents the log2-fold change in gene expression, while the y-axis represents the negative logarithm of the p-value (−log(p-value)), highlighting statistical significance. Genes with a log2-fold change greater than 0 and p-value < 0.05 are considered upregulated (coloured in red), while genes with a log2-fold change less than 0 are downregulated (coloured in green). Genes with no significant change are coloured in blue. The plot visually identifies differentially expressed genes between the two conditions.
Microorganisms 13 01400 g004
Figure 5. Gene ontology (GO) analysis with the most significant enrichment (A) and the most abundant pathways (KEGG); upregulated (B) and downregulated (C) of differentially expressed genes (DEGs) in ΔpdeA (treatment) and WT (control) strains grown for 10 h under aerobic conditions. The size of the dots is proportional to the number of genes; the closer the q value is to 0, the greater the extent of enrichment (* GO:0016747; ** KEGGID:lmt00130). KEGG pathway enrichment analysis identified several significantly enriched pathways among the differentially expressed genes (padj > 0.05; (B,C)). The most enriched pathways included “O-antigen nucleotide sugar biosynthesis” and “ABC transporters” with high gene ratios and low adjusted p-values. Other significantly enriched metabolic pathways included “glycerophospholipid metabolism”, “terpenoid backbone biosynthesis” and “biosynthesis of nucleotide sugar metabolism” (B). On the other hand, the downregulated gene set showed enrichment in core metabolic pathways, including “pentose phosphate pathway (PPP)” (padj < 0.05), “carbon metabolism” (padj < 0.05), “microbial metabolism in diverse environments”, “pyruvate metabolism” “sulfur relay system” and “citrate cycle (TCA cycle; Tricarboxylic Acid Cycle)”, with high gene ratios and strong statistical significance (padj < 0.5; (C)).
Microorganisms 13 01400 g005aMicroorganisms 13 01400 g005b
Figure 6. Oxidative stress survival (A), catalase activity levels (B) and intracellular c-di-AMP levels per cell (C) of 18 h aerobically grown WT and ΔpdeA cells. 1.5% and 4.5% H2O2 were applied for survival experiments to the cells grown in DM and L–cysteine–supplemented DM, respectively. Black bars represent WT, while white bars represent ΔpdeA cells. All the experiments were performed in triplicate, and average measurements are presented. Error bars represent standard deviation. Uppercase letters indicate the difference between WT cells, while lowercase letters indicate the difference between ΔpdeA cells in various media. Asterisks demonstrate statistical differences between the strains (p < 0.05).
Microorganisms 13 01400 g006
Figure 7. Survival of WT (black bars) and ΔpdeA (white bars) cultures grown until 18 h in BHI, DM and L-cysteine-supplemented DM under anaerobic conditions (A); and intracellular c-di-AMP levels of WT (black bars) and ΔpdeA (white bars) under the same growth conditions (B). 1% was used in DM, 2% was used for BHI and L-cysteine-supplemented DM. All the experiments were replicated three times, and average values are presented. Error bars represent standard deviation. Uppercase letters indicate the difference between WT cells, while lowercase letters indicate the difference between ΔpdeA cells in various media. Asterisks demonstrate statistical differences between the strains (p < 0.05).
Microorganisms 13 01400 g007
Table 1. Strains used in this study.
StrainRelevant PropertiesReference Source
10403SSerotype ½ a, wild type, isolated from skin lesion[36]
10403S ΔpdeAIn-frame deletion (knockout)[37]
Table 2. The expression of the genes related to c-di-AMP homeostasis in L. monocytogenes 10403S WT cells grown in DM and 1.57 mM L-cysteine-containing DM overnight under anaerobic conditions.
Gene NameLocus TagLog2fold Changep-Valuep-adjGene Description
NovelNI1.121.14 × 10−51.58 × 10⁻⁵cyclic-di-AMP receptor
pdeAlmo0052−0.775.11 × 10−108.54 × 10⁻¹⁰cyclic-di-AMP phosphodiesterase
pgpHlmo1466−2.341.19 × 10−1394.23 × 10−138cyclic-di-AMP phosphodiesterase
dacAlmo2120−3.161.48 × 10−1093.13 × 10−108Diadenylate cyclase
NI: Not identified.
Disclaimer/Publisher’s Note: The statements, opinions and data contained in all publications are solely those of the individual author(s) and contributor(s) and not of MDPI and/or the editor(s). MDPI and/or the editor(s) disclaim responsibility for any injury to people or property resulting from any ideas, methods, instructions or products referred to in the content.

