

One Step Forwards in Knowledge of Blossom Blight Brown Rot Disease: Monilinia spp. SSR Marker Database


Abstract
1. Introduction
2. Materials and Methods
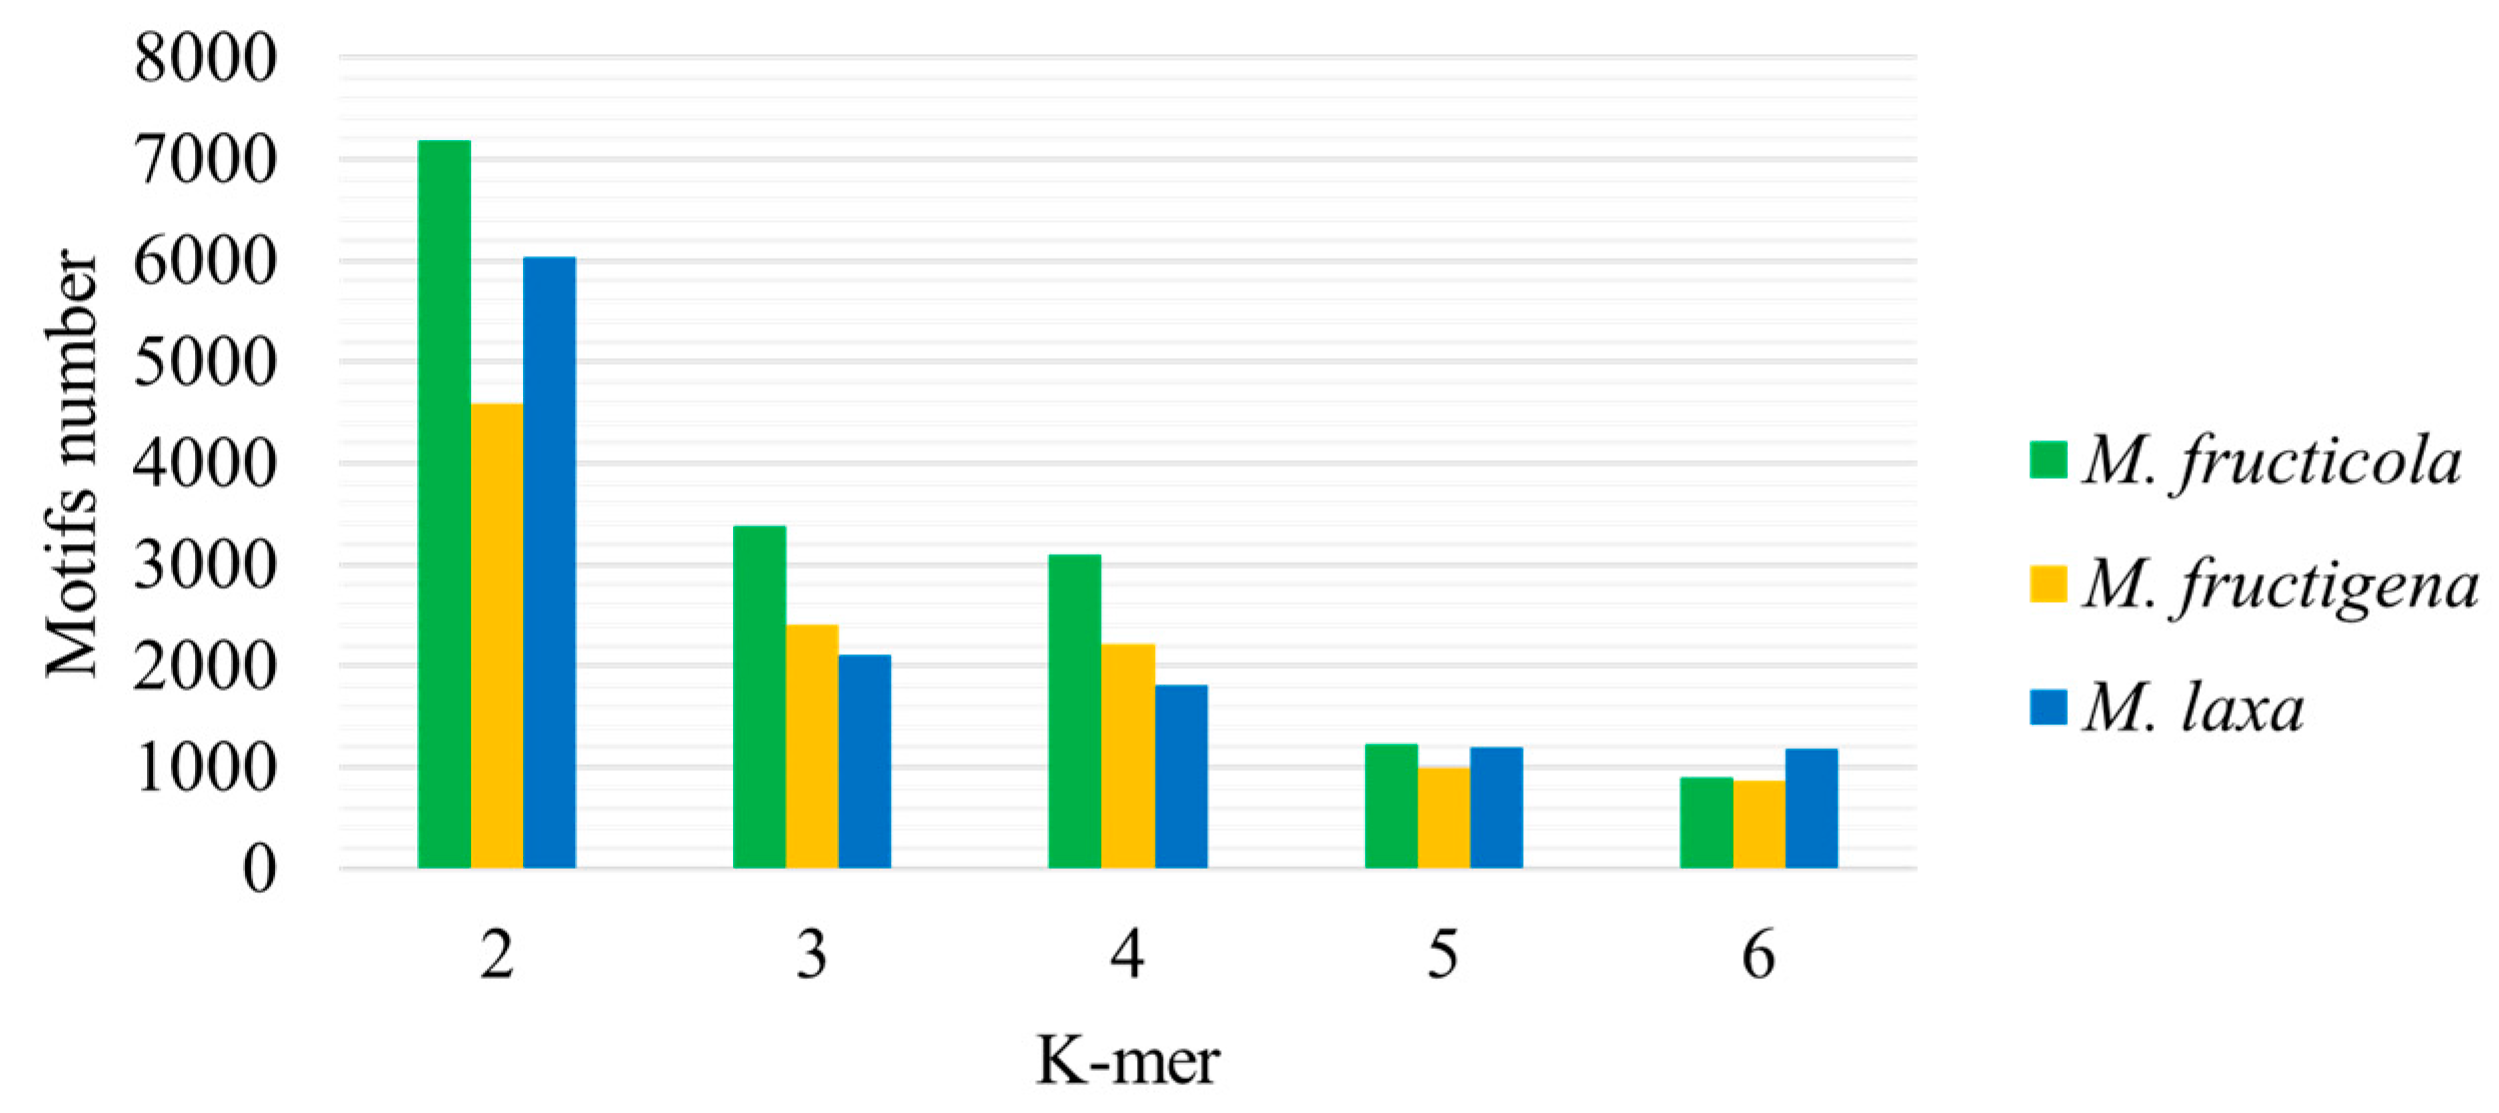
3. Results
4. Discussion
5. Conclusions
Author Contributions
Funding
Data Availability Statement
Acknowledgments
Conflicts of Interest
Appendix A

| No. | Protein Name (Locus Tag) | M. fructigena | M. fructicola | M. laxa | |||
|---|---|---|---|---|---|---|---|
| Total No. of Markers | Species-Specific Markers | Total No. of Markers | Species-Specific Markers | Total No. of Markers | Species-Specific Markers | ||
| 1. | EYC84_002166 | 4 | 4 | 16 | 16 | 16 | 16 |
| 2. | EYC_002169 | 14 | 12 | 67 | 63 | 62 | 57 |
| 3. | EYC_002170 | 11 | 9 | 17 | 16 | 13 | 11 |
| 4. | EYC_002173 | 6 | 6 | 8 | 8 | 8 | 8 |
| 5. | EYC_002175 | 3 | 3 | 6 | 6 | 4 | 4 |
| 6. | EYC84_002893 | 6 | 6 | 5 | 5 | 5 | 3 |
| 7. | EYC84_004244 | 17 | 17 | 15 | 14 | 17 | 17 |
| 8. | EYC84_0042451 | 8 | 8 | 10 | 10 | 8 | 8 |
| 9. | EYC84_004616 | 12 | 7 | 13 | 13 | 11 | 7 |
| 10. | EYC84_008759 | 24 | 24 | 23 | 21 | 23 | 22 |
| 11. | EYC84_011188 | 18 | 17 | 17 | 16 | 19 | 16 |
| In total: | 123 | 113 | 197 | 188 | 186 | 169 | |
References
- Martini, C.; Mari, M. Monilinia fructicola, Monilinia laxa (Monilinia rot, brown rot). In Postharvest Decay; Bautista-Banos, S., Ed.; Academic Press: Cambridge, MA, USA; Elsevier: Amsterdam, The Netherlands, 2014; pp. 233–265. [Google Scholar]
- Vasić, M.; Vico, I.; Jurick, W.M.; Duduk, N. Distribution and Characterization of Monilinia Spp. Causing Apple Fruit Decay in Serbia. Plant Dis. 2018, 102, 359–369. [Google Scholar] [CrossRef]
- Abate, D.; De Miccolis Angelini, R.M.; Rotolo, C.; Pollastro, S.; Faretra, F. Mating System in the Brown Rot Pathogens Monilinia fructicola, M. laxa, and M. fructigena. Phytopathology 2018, 108, 1315–1325. [Google Scholar] [CrossRef]
- Marcet-Houben, M.; Villarino, M.; Vilanova, L.; De Cal, A.; van Kan, J.A.L.; Usall, J.; Gabaldón, T.; Torres, R. Comparative Genomics Used to Predict Virulence Factors and Metabolic Genes among Monilinia Species. J. Fungi 2021, 7, 464. [Google Scholar] [CrossRef]
- Jänsch, M.; Frey, J.E.; Hilber-Bodmer, M.; Broggini, G.A.L.; Weger, J.; Schnabel, G.; Patocchi, A. SSR Marker Analysis of Monilinia fructicola from Swiss Apricots Suggests Introduction of the Pathogen from Neighbouring Countries and the United States. Plant Pathol. 2012, 61, 247–254. [Google Scholar] [CrossRef]
- Côté, M.; Tardif, M.; Meldrum, A. Polystroma on Inoculated and Naturally Infected Fruit Using Multiplex PCR. Plant Dis. 2004, 88, 1219–1225. [Google Scholar] [CrossRef]
- Villarino, M.; Larena, I.; Martinez, F.; Melgarejo, P.; De Cal, A. Analysis of genetic diversity in Monilinia fructicola from the Ebro Valley in Spain using ISSR and RAPD markers. Eur. J. Plant Pathol. 2012, 132, 511–524. [Google Scholar] [CrossRef]
- Gell, I.; Cubero, J.; Melgarejo, P. Two Different PCR Approaches for Universal Diagnosis of Brown Rot and Identification of Monilinia spp. in Stone Fruit Trees. J. Appl. Microbiol. 2007, 103, 2629–2637. [Google Scholar] [CrossRef] [PubMed]
- Gril, T.; Celar, F.; Munda, A.; Javornik, B.; Jakse, J. AFLP Analysis of Intraspecific Variation Between Monilinia laxa Isolates from Different Hosts. Plant Dis. 2008, 92, 1616–1624. [Google Scholar] [CrossRef] [PubMed]
- Zhu, X.Q.; Chen, X.Y.; Guo, L.Y. Population Structure of Brown Rot Fungi on Stone Fruits in China. Plant Dis. 2011, 95, 1284–1291. [Google Scholar] [CrossRef]
- Fulton, C.E.; Van Leeuwen, G.C.M.; Brown, A.E. Genetic Variation among and within Monilinia Species Causing Brown Rot of Stone and Pome Fruits. Eur. J. Plant Pathol. 1999, 105, 495–500. [Google Scholar] [CrossRef]
- Everhart, S.E.; Askew, A.; Seymour, L.; Glenn, T.C.; Scherm, H. Spatial Patterns of Brown Rot Epidemics and Development of Microsatellite Markers for Analyzing Fine-Scale Genetic Structure of Monilinia fructicola Populations Within Peach Tree Canopies. Plant Health Prog. 2012, 13, 28. [Google Scholar] [CrossRef]
- Wang, X.; Wang, L. GMATA: An Integrated Software Package for Genome-Scale SSR Mining, Marker Development and Viewing. Front Plant Sci. 2016, 7, 215951. [Google Scholar] [CrossRef]
- Srivastava, S.; Avvaru, A.K.; Sowpati, D.T.; Mishra, R.K. Patterns of Microsatellite Distribution across Eukaryotic Genomes. BMC Genom. 2019, 20, 153. [Google Scholar] [CrossRef]
- Tóth, G.; Gáspári, Z.; Jurka, J. Microsatellites in different eukaryotic genomes: Survey and analysis. Genome Res. 2000, 10, 967–981. [Google Scholar] [CrossRef]
- Ma, Z.; Luo, Y.; Michailides, T.J. Nested PCR Assays for Detection of Monilinia fructicola in Stone Fruit Orchards and Botryosphaeria dothidea from Pistachios in California. J. Phytopathol. 2003, 151, 312–322. [Google Scholar] [CrossRef]
- Geethanjali, S.; Kadirvel, P.; Pen, R.D.; Wang, J. Development of Tomato SSR Markers from Anchored BAC Clones of Chromosome 12 and Their Application for Genetic Diversity Analysis and Linkage Mapping. Euphytica 2011, 178, 283–295. [Google Scholar] [CrossRef]
- Duhan, N.; Meshram, M.; Loaiza, C.D.; Kaundal, R. CitSATdb: Genome-Wide Simple Sequence Repeat (SSR) Marker Database of Citrus Species for Germplasm Characterization and Crop Improvement. Genes 2020, 11, 1486. [Google Scholar] [CrossRef]
- National Center for Biotechnology Information (NCBI). Available online: https://www.ncbi.nlm.nih.gov/ (accessed on 15 February 2024).
- De Miccolis Angelini, R.M.; Abate, D.; Rotolo, C.; Gerin, D.; Pollastro, S.; Faretra, F. De Novo Assembly and Comparative Transcriptome Analysis of Monilinia Fructicola, Monilinia Laxa and Monilinia Fructigena, the Causal Agents of Brown Rot on Stone Fruits. BMC Genom. 2018, 19, 436. [Google Scholar] [CrossRef] [PubMed]
- Landi, L.; De Miccolis Angelini, R.M.; Pollastro, S.; Abate, D.; Faretra, F.; Romanazzi, G. Genome Sequence of the Brown Rot Fungal Pathogen Monilinia Fructigena. BMC Res. Notes 2018, 11, 758. [Google Scholar] [CrossRef] [PubMed]
- De Miccolis Angelini, R.M.; Romanazzi, G.; Pollastro, S.; Rotolo, C.; Faretra, F.; Landi, L. New High-Quality Draft Genome of the Brown Rot Fungal Pathogen Monilinia Fructicola. Genome Biol. Evol. 2019, 11, 2850–2855. [Google Scholar] [CrossRef] [PubMed]
- Rivera, Y.; Zeller, K.; Srivastava, S.; Sutherland, J.; Galvez, M.; Nakhla, M.; Poniatowska, A.; Schnabel, G.; Sundin, G.; Abad, Z.G. Draft Genome Resources for the Phytopathogenic Fungi Monilinia fructicola, M. fructigena, M. polystroma, and M. laxa, the Causal Agents of Brown Rot. Phytopathology 2018, 108, 1141–1142. [Google Scholar] [CrossRef]
- Amiri, A.; Holb, I.J.; Schnabel, G. A new selective medium for the recovery and enumeration of Monilinia fructicola, M. fructigena, and M. laxa from stone fruits. Phytopathology 2009, 99, 1199–1208. [Google Scholar] [CrossRef]
- Liu, K.; Muse, S.V. PowerMarker: Integrated analysis environment for genetic marker data. Bioinformatics 2005, 21, 2128–2129. [Google Scholar] [CrossRef]
- Botstein, D.; White, R.; Skolnick, M.; Davis, R.W. Construction of a genetic linkage map in man using restriction fragment length polymorphisms. Am. J. Hum. Genet. 1980, 32, 314–331. [Google Scholar]
- R Core Team. R: A Language and Environment for Statistical Computing. 2021. Available online: https://www.r-project.org/ (accessed on 15 February 2024).
- Chang, W.; Cheng, J.; Allaire, J.; Sievert, C.; Schloerke, B.; Xie, Y.; Allen, J.; McPherson, J.; Dipert, A.; Borges, B. Shiny: Web Application Framework for R. R Package Version 1.8.0.9000. 2024. Available online: https://shiny.posit.co/ (accessed on 15 February 2024).
- Chodorow, K.; Dirolf, M. MongoDB: The Definitive Guide, 1st. ed.; O’Reilly: Sebastopol, CA, USA, 2010. [Google Scholar]
- Satam, H.; Joshi, K.; Mangrolia, U.; Waghoo, S.; Zaidi, G.; Rawool, S.; Thakare, R.P.; Banday, S.; Mishra, A.K.; Das, G.; et al. Next-Generation Sequencing Technology: Current Trends and Advancements. Biology 2023, 12, 997. [Google Scholar] [CrossRef]
- Habibi, N.; Al Salameen, F.; Rahman, M.; Kumar, V.; Al Amad, S.; Shajan, A.; Zakir, F.; Abdul Razzack, N.; Tinwala, W.H. Draft Genome Sequence and SSR Mining Data of Acacia Pachyceras Schwartz. Data Brief 2022, 42, 108031. [Google Scholar] [CrossRef]
- Bhattarai, G.; Shi, A.; Kandel, D.R.; Da Silva, J.A.; Avila, C.A. Genome-wide simple sequence repeats (SSR) markers discovered from whole-genome sequence comparisons of multiple spinach accessions. Sci. Rep. 2021, 11, 9999. [Google Scholar] [CrossRef]
- Ma, H.; Huang, T.; Gu, W.; Liu, E.; Wang, G.; Wang, B.; Zhou, J.; Xu, G. Genome-wide identification of simple sequence repeats and development of polymorphic SSR markers in brown trout (Salmo trutta). Conserv. Genet. Resour. 2023, 16, 131–134. [Google Scholar] [CrossRef]
- Wang, X.; Yang, S.; Chen, Y.; Zhang, S.; Zhao, Q.; Li, M.; Gao, Y.; Yang, L.; Bennetzen, J.L. Comparative genome-wide characterization leading to simple sequence repeat marker development for Nicotiana. BMC Genom. 2018, 19, 500. [Google Scholar] [CrossRef] [PubMed]
- Carbone, F.; Salimonti, A.; Regina, T.M.R.; Zelasco, S. Development and evaluation of polymorphic genomic-SSR markers in olive (Olea europaea L.). In Proceedings of the LXIII SIGA Annual Congress Science and Innovation for Sustainable Agriculture Intensification: The Contribution of Plant Genetics and Breeding, Napoli, Italy, 10–13 September 2019. [Google Scholar]
- Prasanth, C.N.; Viswanathan, R.; Malathi, P.; Sundar, A.R. Development and Characterization of Genomic SSR Marker for Virulent Strain-Specific Colletotrichum Falcatum Infecting Sugarcane. 3 Biotech 2021, 11, 20. [Google Scholar] [CrossRef] [PubMed]
- Karaoglu, H.; Lee, C.M.Y.; Meyer, W. Survey of Simple Sequence Repeats in Completed Fungal Genomes. Mol. Biol. Evol. 2005, 22, 639–649. [Google Scholar] [CrossRef] [PubMed]
- Kaur, S.; Sharma, P.C. Microsatellite diversity in four cultivated species of Actinidiaceae and Rutaceae. Bioinformation 2023, 19, 230–234. [Google Scholar] [CrossRef] [PubMed]
- Jasrotia, R.S.; Yadav, P.K.; Iquebal, M.A.; Bhatt, S.B.; Arora, V.; Angadi, U.B.; Tomar, R.S.; Jaiswal, S.; Rai, A.; Kumar, D. VigSatDB: Genome-Wide Microsatellite DNA Marker Database of Three Species of Vigna for Germplasm Characterization and Improvement. Database 2019, 2019, baz055. [Google Scholar]


| Marker Name | Sequence | T (°C) | |
|---|---|---|---|
| MFg2 * | F | ACTCTCGTCTCCACCTTCCA | 60 |
| R | CCTGAAGGATAGCACCCTGA | 60 | |
| MFg27 * | F | CCTTCAAATGGGCAAGATGT | 56 |
| R | TGAATGTTGGTGAGGCGTTA | 56 | |
| MFg39 | F | GGTTTCTGCCAAAAGTCTCC | 58 |
| R | GTAGGTGATGGCGCTGTTTT | 58 | |
| MFg90 | F | ACCGATTCCAGTTGATGGAG | 58 |
| R | ATCGGTCCATGATTGTCGTT | 56 | |
| ML2 * | F | TCGTGAACTTTACTCTCGTCTCC | 63 |
| R | ATGTCGTTCCAGAAGGCACT | 58 | |
| ML86 * | F | CAAGGACGTTTCCAAAGCAT | 56 |
| R | ACATCTTGCCCATTTGAAGG | 56 | |
| ML104 | F | AAGTCTCCTCCTCGCAGCTT | 60 |
| R | TCCGTTGGGCTTGTAGTTTC | 58 | |
| ML159 * | F | ATTCATGCTCAGCGAACCTT | 56 |
| R | GATCTCACGCCTCCAGCTAC | 63 | |
| Species | No. of SSR Motifs | Genome Size (Mbp) | SSR Density (per Mbp) | Developed SSR Markers | Species-Specific SSR Markers |
|---|---|---|---|---|---|
| M. fructicola | 15,788 | 44,048 | 359 | 9754 | 9617 (98.6%) |
| M. fructigena | 11,091 | 39,329 | 284 | 8506 | 8188 (96.3%) |
| M. laxa | 12,337 | 42,815 | 286 | 8106 | 7781 (96.0%) |
| Total | 39,216 | - | - | 26,366 | 25,586 |
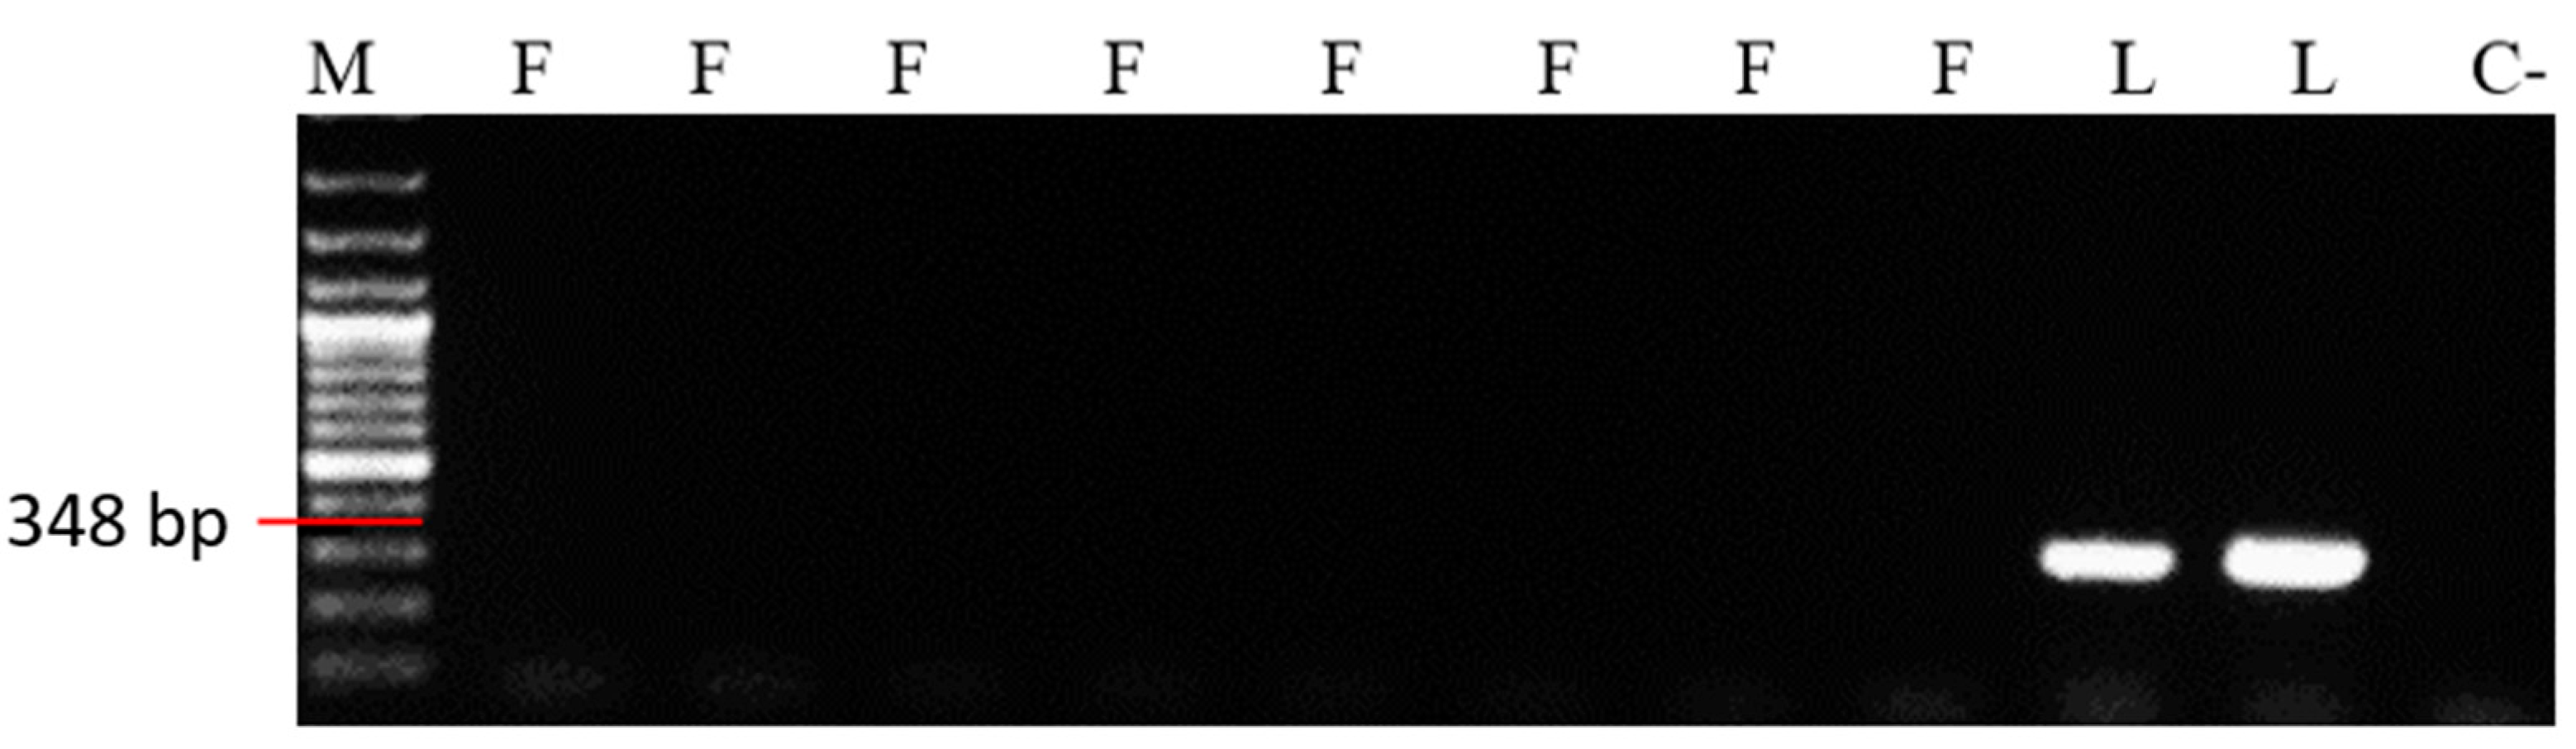
| SSR Primer | Fragment Size (bp) | In Silico Specificity | Specificity under Laboratory Conditions |
|---|---|---|---|
| MFg27 | 239 bp | M. fructigena | M. fructigena |
| MFg39 | 346 bp | M. fructigena | - |
| MFg90 | 292 bp | M. fructigena | - |
| ML2 | 348 bp | M. laxa | M. laxa |
| ML86 | 336 bp | M. laxa | M. laxa |
| ML104 | 358 bp | M. laxa | - |
| ML159 | 313 bp | M. laxa | M. laxa |
| MFg2 | 260 bp | M. fructigena | M. fructigena |
Disclaimer/Publisher’s Note: The statements, opinions and data contained in all publications are solely those of the individual author(s) and contributor(s) and not of MDPI and/or the editor(s). MDPI and/or the editor(s) disclaim responsibility for any injury to people or property resulting from any ideas, methods, instructions or products referred to in the content. |
© 2024 by the authors. Licensee MDPI, Basel, Switzerland. This article is an open access article distributed under the terms and conditions of the Creative Commons Attribution (CC BY) license (https://creativecommons.org/licenses/by/4.0/).
Share and Cite
Antanynienė, R.; Stanys, V.; Frercks, B. One Step Forwards in Knowledge of Blossom Blight Brown Rot Disease: Monilinia spp. SSR Marker Database. Microorganisms 2024, 12, 605. https://doi.org/10.3390/microorganisms12030605
Antanynienė R, Stanys V, Frercks B. One Step Forwards in Knowledge of Blossom Blight Brown Rot Disease: Monilinia spp. SSR Marker Database. Microorganisms. 2024; 12(3):605. https://doi.org/10.3390/microorganisms12030605
Chicago/Turabian StyleAntanynienė, Raminta, Vidmantas Stanys, and Birutė Frercks. 2024. "One Step Forwards in Knowledge of Blossom Blight Brown Rot Disease: Monilinia spp. SSR Marker Database" Microorganisms 12, no. 3: 605. https://doi.org/10.3390/microorganisms12030605
APA StyleAntanynienė, R., Stanys, V., & Frercks, B. (2024). One Step Forwards in Knowledge of Blossom Blight Brown Rot Disease: Monilinia spp. SSR Marker Database. Microorganisms, 12(3), 605. https://doi.org/10.3390/microorganisms12030605