Article

Antimicrobial Resistance and Genomic Characteristics of Escherichia coli Strains Isolated from the Poultry Industry in Henan Province, China

1
National Key Laboratory of Agricultural Microbiology, College of Veterinary Medicine, Huazhong Agricultural University, Wuhan 430070, China
2
Key Laboratory of Preventive Veterinary Medicine in Hubei Province, The Cooperative Innovation Center for Sustainable Pig Production, Wuhan 430070, China
3
Key Laboratory of Development of Veterinary Diagnostic Products, Ministry of Agriculture of the People’s Republic of China, Wuhan 430070, China
4
International Research Center for Animal Disease, Ministry of Science and Technology of the People’s Republic of China, Wuhan 430070, China
*
Author to whom correspondence should be addressed.
Microorganisms 2024, 12(3), 575; https://doi.org/10.3390/microorganisms12030575
Submission received: 20 February 2024 / Revised: 7 March 2024 / Accepted: 11 March 2024 / Published: 13 March 2024
(This article belongs to the Section Antimicrobial Agents and Resistance)

Abstract

:
Escherichia coli (E. coli) is an important foodborne pathogen and a biomarker for monitoring antimicrobial resistance. Investigating the prevalence of E. coli in the poultry industry holds great importance, particularly in Henan province, a major poultry-producing region in China. Here, we investigated the antimicrobial resistance (AMR) phenotypes of E. coli strains obtained from the poultry industry in Henan, China. A total of 344 E. coli strains were isolated from 638 samples collected from seven farms, three slaughterhouses, and ten terminal markets. Approximately 96.4%, 81.7%, and 52.5% of the isolates from the farms, slaughterhouses, and terminal markets exhibited multidrug resistance. Whole-genome sequencing was performed on 169 strains to reveal their genomic characteristics. The sequence type (ST) analysis revealed that ST10 and ST156 were the most frequent types within the poultry supply chain, whereas ST10 and ST162 were commonly found across the farms, slaughterhouses, and terminal markets. Fourteen ST10 E. coli strains belonged to phylogenetic group A, while fifteen ST165 and six ST162 E. coli strains belonged to phylogenetic group B1. In addition, several antimicrobial resistance genes and virulence factor genes were identified. The blaNDM-5 gene mediated carbapenem resistance in two E. coli strains, while mcr-1-mediated colistin resistance was detected in nine E. coli strains. Phylogenetic group A exhibited fewer virulence genes compared to other groups of E. coli. Plasmid replicons, such as IncFIB (AP001918), IncX1, IncFIC (FII), and IncFII (pHN7A8), were frequently observed. These findings provide valuable insights into the current AMR profiles of E. coli strains isolated from the poultry industry in Central China and highlight the need to implement good manufacturing practices and reduce antibiotic usage to mitigate potential risks associated with E. coli.

1. Introduction

Antimicrobials were previously employed in livestock for growth promotion and disease control [1]. However, their widespread use in animals has accelerated the emergence of antibiotic-resistant bacteria, which can cause severe public health problems [2]. Escherichia coli (E. coli) is an important foodborne pathogen, and foodborne diseases caused by this agent result in high mortality and morbidity rates in different regions of the world [3,4,5]. Additionally, E. coli has been recognized as a natural reservoir of antimicrobial resistance genes (ARGs), and it has an important role in the spread of antimicrobial resistance (AMR) [2,6]. Therefore, it is widely used as an essential biomarker for monitoring AMR [7,8]. In recent years, whole genome sequencing (WGS) has played an important role in the rapid discovery of the resistance mechanism and epidemic characteristics of E. coli. For example, it has been utilized in England to investigate food-borne outbreaks of E. coli O157:H7 [9] and in China for the surveillance of E. coli AMR in pig farms [10].
Poultry is an important source of proteins for humans, and the consumption of poultry is increasing annually in China (http://www.stats.gov.cn/, accessed on 1 January 2023). Henan province is an important poultry-producing province in China, with nearly 500 million domestic birds slaughtered as of 2021 (http://www.hnsmeat.cn/index.html, accessed on 16 February 2022). Avian pathogenic E. coli is reportedly the most common bacterial pathogen that infects chickens, costing the poultry industry hundreds of millions of dollars in economic losses [11]. Accordingly, monitoring foodborne pathogen contaminations in different nodes of the poultry supply chain in this region has great significance [12,13,14]. To our knowledge, there seems to be a lack of data on the prevalence of E. coli in the poultry industry in Henan province, China. In this study, we isolated E. coli from broiler farms, slaughterhouses, and terminal markets in three separate poultry supply chains in Henan province, China. To further understand AMR and its prevalence in E. coli, the aim of this study was to provide a profile of AMR phenotypes and genotypes.

2. Materials and Methods

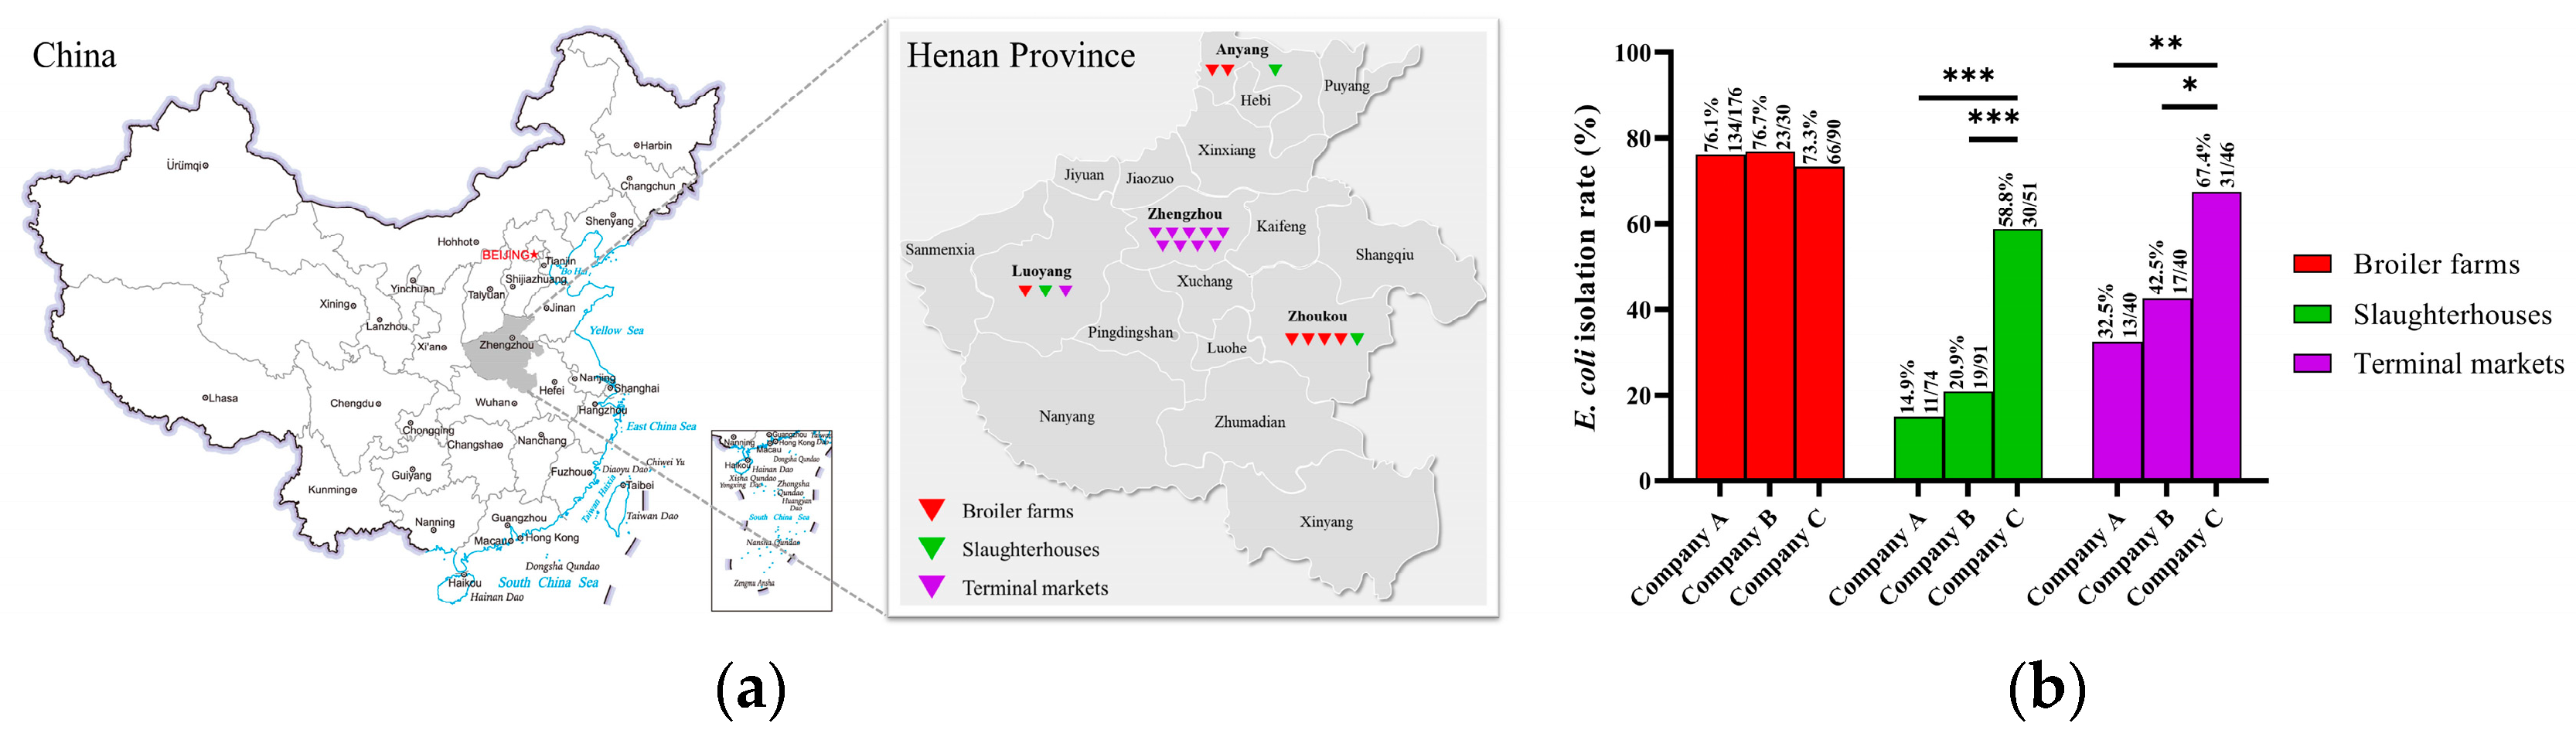
2.1. Sample Collection and Bacterial Isolation

Between April and August 2019, 638 samples were collected from seven broiler farms, three slaughterhouses, eight retail markets, one supermarket, and one wholesale market in four cities in Henan province (Figure 1a). In total, 296 samples were collected from broiler farms (from cotton swabs of the cloaca or cecum contents of dead broilers, the cloaca of healthy broilers, and the feces, floor, cage, feed, and drinking water), 216 samples were collected from slaughterhouses (from trays, conveyor belts, knives, chopping boards, the floor, the shelves, and organs), and 126 samples were collected from markets (meat and organs). Samples, after enrichment culture, were streaked directly onto MacConkey Agar (Hopebiol, Qingdao, China) for the selection of E. coli strains, following the protocol established by Hu et al., which aligns with our National Standards for E. coli strain isolation and identification [15]. The single colony was streaked again onto Eosin-Methylene Blue Agar (Hopebiol, Qingdao, China) for the further purification of the E. coli strains. Morphologically compatible colonies were inoculated in Luria-Bertani (LB; 1% Trytone (Thermo Fisher, Shanghai, China), 0.5% Yeast Extract [Thermo Fisher, Shanghai, China], and 1% NaCl [Sinopharm, Beijing, China]) for enrichment culture. The isolated strains were confirmed through amplification of the partial 16S rDNA gene and seven housekeeping genes (adk, fumC, gyrB, icd, mdh, purA, and recA), according to a previously described protocol [16,17]. The primers used are listed in Table S1.

2.2. Antimicrobial Susceptibility Testing

The minimal inhibitory concentrations (MICs) of antibiotics of different classes, against E. coli strains, were determined using the broth microdilution method, following the protocols recommended by the Clinical and Laboratory Standards Institute (CLSI) [18]. Nine antimicrobial classes (MedChemExpress, Shanghai, China), including those belonging to the penicillins (ampicillin), cephems (ceftazidime), penems (meropenem, imipenem), aminoglycosides (gentamicin), tetracyclines (tetracycline, tigecycline), lipopeptides (colistin), phenicols (florfenicol), quinolones (ofloxacin), and folate pathway antagonists (trimethoprim–sulfamethoxazole) were included in the tests. Escherichia coli ATCC® 25922 was used for quality control. The results were interpreted using CLSI breakpoints [19,20]. If a CLSI breakpoint was not available, the European Committee on Antimicrobial Susceptibility Testing (EUCAST) breakpoints were considered [21,22]. The breakpoints and quality controls for the antimicrobial agents are listed in Table S2.

2.3. DNA Extraction, WGS, and Bioinformatic Analysis

Among these E. coli strains, 169 isolates, consisting of 122 isolates from broiler farms, 23 isolates from slaughterhouses, and 24 isolates from markets, were selected for WGS. Genomic DNA was extracted using a bacterial genomic DNA Kit (Cwbiotech, Beijing, China), according to the manufacturer’s instructions. The quality and concentration of the bacterial genomic DNA were evaluated by electrophoresis on a 1% agarose gel, using a NanoDrop2000 system (Thermo Scientific, Waltham, MA, USA) and a Qubit 2.0 fluorometer (Thermo Scientific, Waltham, USA). Libraries were constructed based on the qualified DNA using the NEBNext UltraTM II DNA Library Prep Kit (New England BioLabs, Ipswich, MA, USA) and sequenced on an Illumina NovaSeq 6000 platform (Novogene, Tianjin, China). High-quality clean reads were selected for the de novo assembled using SPAdesv3.9.0 to generate genome contigs. The complete nucleotide sequences of these E. coli strains were deposited in the NCBI database under the accession number PRJNA767170. The sequence types (STs), O-serogroups, phylogenetic groups, ARGs, virulence factor genes (VFGs), and plasmid types of these confirmed E. coli strains were predicted using tandem contigs of the samples based on MLST 2.0 [23], SerotypeFinder 2.0 [24], ClermonTyping [25], ResFinder 4.1 [26], VirulenceFinder 2.0 [27,28], and PlasmidFinder 2.1 [29]. A phylogenetic tree was constructed based on the MLST data using MEGAX [30], using the neighbor-joining algorithm with 1000 bootstraps.

2.4. Statistical Analysis

The chi-square test was used to test for significant differences in the prevalence of E. coli among the samples collected from the broiler supply chain. A p-value < 0.05 (*) was considered significant, and p < 0.01 (**) or p < 0.001 (***) was considered extremely significant. Statistical analyses were performed using GraphPad Prism 8 (version 8.4.3).

3. Results

3.1. Prevalence of E. coli

In total, 344 E. coli strains were isolated from 638 samples. Of these, 158 E. coli strains were isolated from Company A, including 134 strains from four broiler farms, 11 strains from one slaughterhouse, and 13 strains from eight retail markets; 59 E. coli strains were isolated from Company B, including 23 strains from one broiler farm, 19 strains from slaughterhouses, and 17 strains from one supermarket; and 127 E. coli strains were isolated from Company C, including 66 strains from two broiler farms, 30 strains from one slaughterhouse, and 31 strains from one wholesale market.
There was a significant difference in the E. coli isolation rates among the three nodes, and E. coli was more prevalent in the samples collected from broiler farms (75.3%) than in those collected from slaughterhouses (27.8%, p < 0.001) and terminal markets (48.4%, p < 0.001). Similar results were found for all three companies. There was no significant difference in the rates of E. coli isolation from the broiler farms. The rates of E. coli isolation in both the slaughterhouse and terminal markets of Company C were significantly higher than those of Companies A and B (Figure 1b).

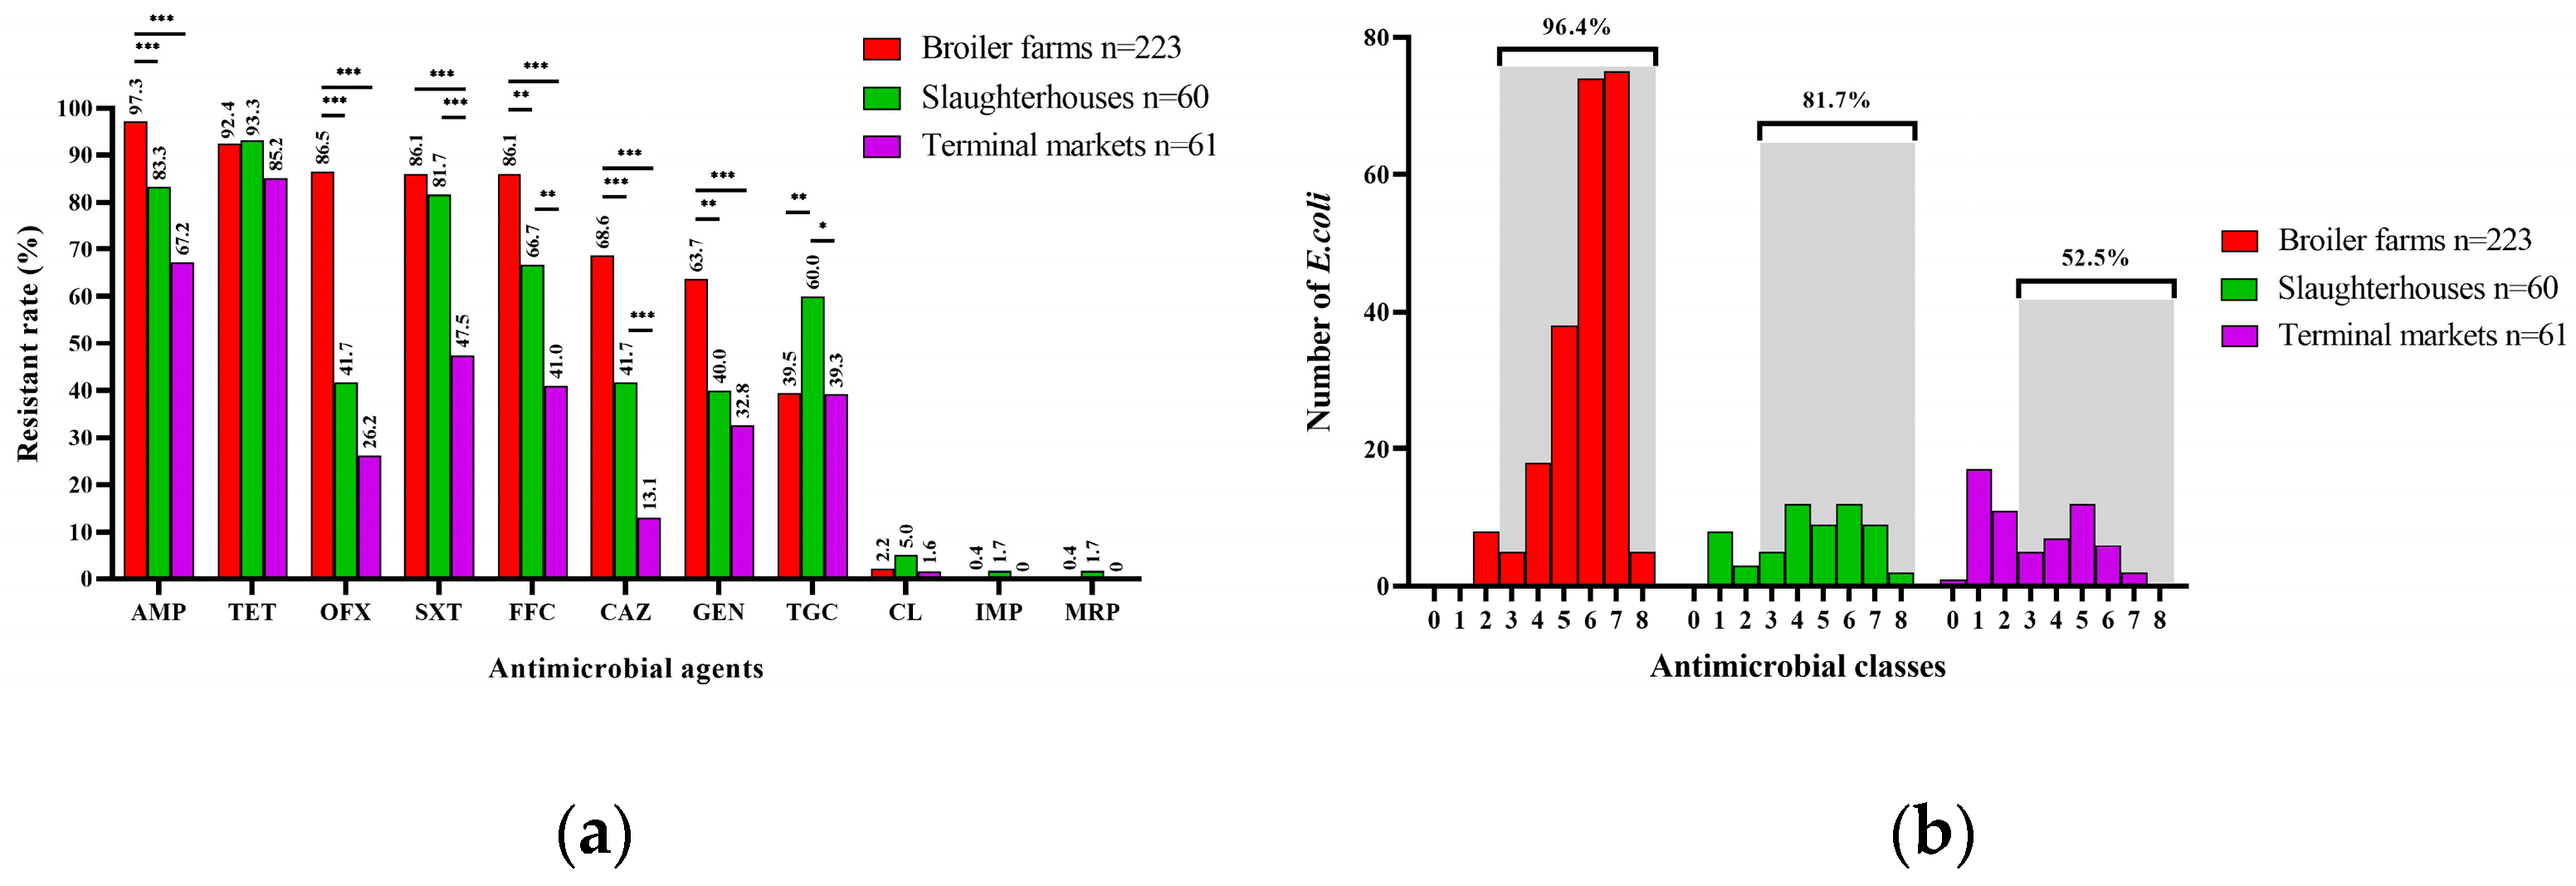
3.2. Antimicrobial Resistance Phenotypes of E. coli

The AST results show that isolates from broiler farms and slaughterhouses had severe resistance profiles (Table S3). Many of these E. coli strains were resistant to tetracycline (broiler farms: 92.4%, 206/223; slaughterhouses: 93.3%, 56/60; terminal markets: 85.2%, 52/61), ampicillin (broiler farms: 97.3%, 217/223; slaughterhouses: 83.3%, 50/60; terminal markets: 67.2%, 41/61), trimethoprim–sulfamethoxazole (broiler farms: 86.1%, 192/223; slaughterhouses: 81.7%, 49/60; terminal markets: 47.5%, 29/61), florfenicol (broiler farms: 86.1%, 192/223; slaughterhouses: 66.7%, 40/60; terminal markets: 41.0%, 25/61), whereas relatively few E. coli strains were resistant to colistin (broiler farms: 2.2%, 5/223; slaughterhouses: 5.0%, 3/60; terminal markets: 1.6%, 1/61), meropenem (broiler farms: 0.4%, 1/223; slaughterhouses: 1.7%, 1/60; terminal markets: 0%), and imipenem (broiler farms: 0.4%, 1/223; slaughterhouses: 1.7%, 1/60; terminal markets: 0%) (Figure 2 and Figure 3a). Approximately 86.0% (296/344) of the E. coli strains isolated from broiler farms (96.4%, 215/223), slaughterhouses (81.7%, 49/60), and terminal markets (52.5%, 32/61) were multidrug-resistant (MDR) strains (Figure 3b). Moreover, broiler farms had significantly higher rates of resistance to several antimicrobial agents than slaughterhouses and terminal markets, except slaughterhouses had significantly higher rates of resistance to tigecycline (Figure 3b).
Of note, many E. coli strains showed resistance to tigecycline (43.0%, 148/344 of all E. coli strains), but a large proportion of them showed MICs ranging from 1 to 2 µg/mL (95.9%, 142/148), a very small proportion of them showed a high level of resistance (MIC ≥ 4 µg/mL; 4.1%, 6/148). In particular, 0.4% (1/191) and 2.2% (5/191) of the broiler farm isolates, and 1.7% (1/60) and 5.0% (3/60) of the slaughterhouse isolates were resistant to carbapenems and colistin, respectively. In addition, 1.6% (1/61) of terminal market isolates were resistant to colistin. Surprisingly, one E. coli strain isolated from a slaughterhouse was resistant to carbapenems and colistin.

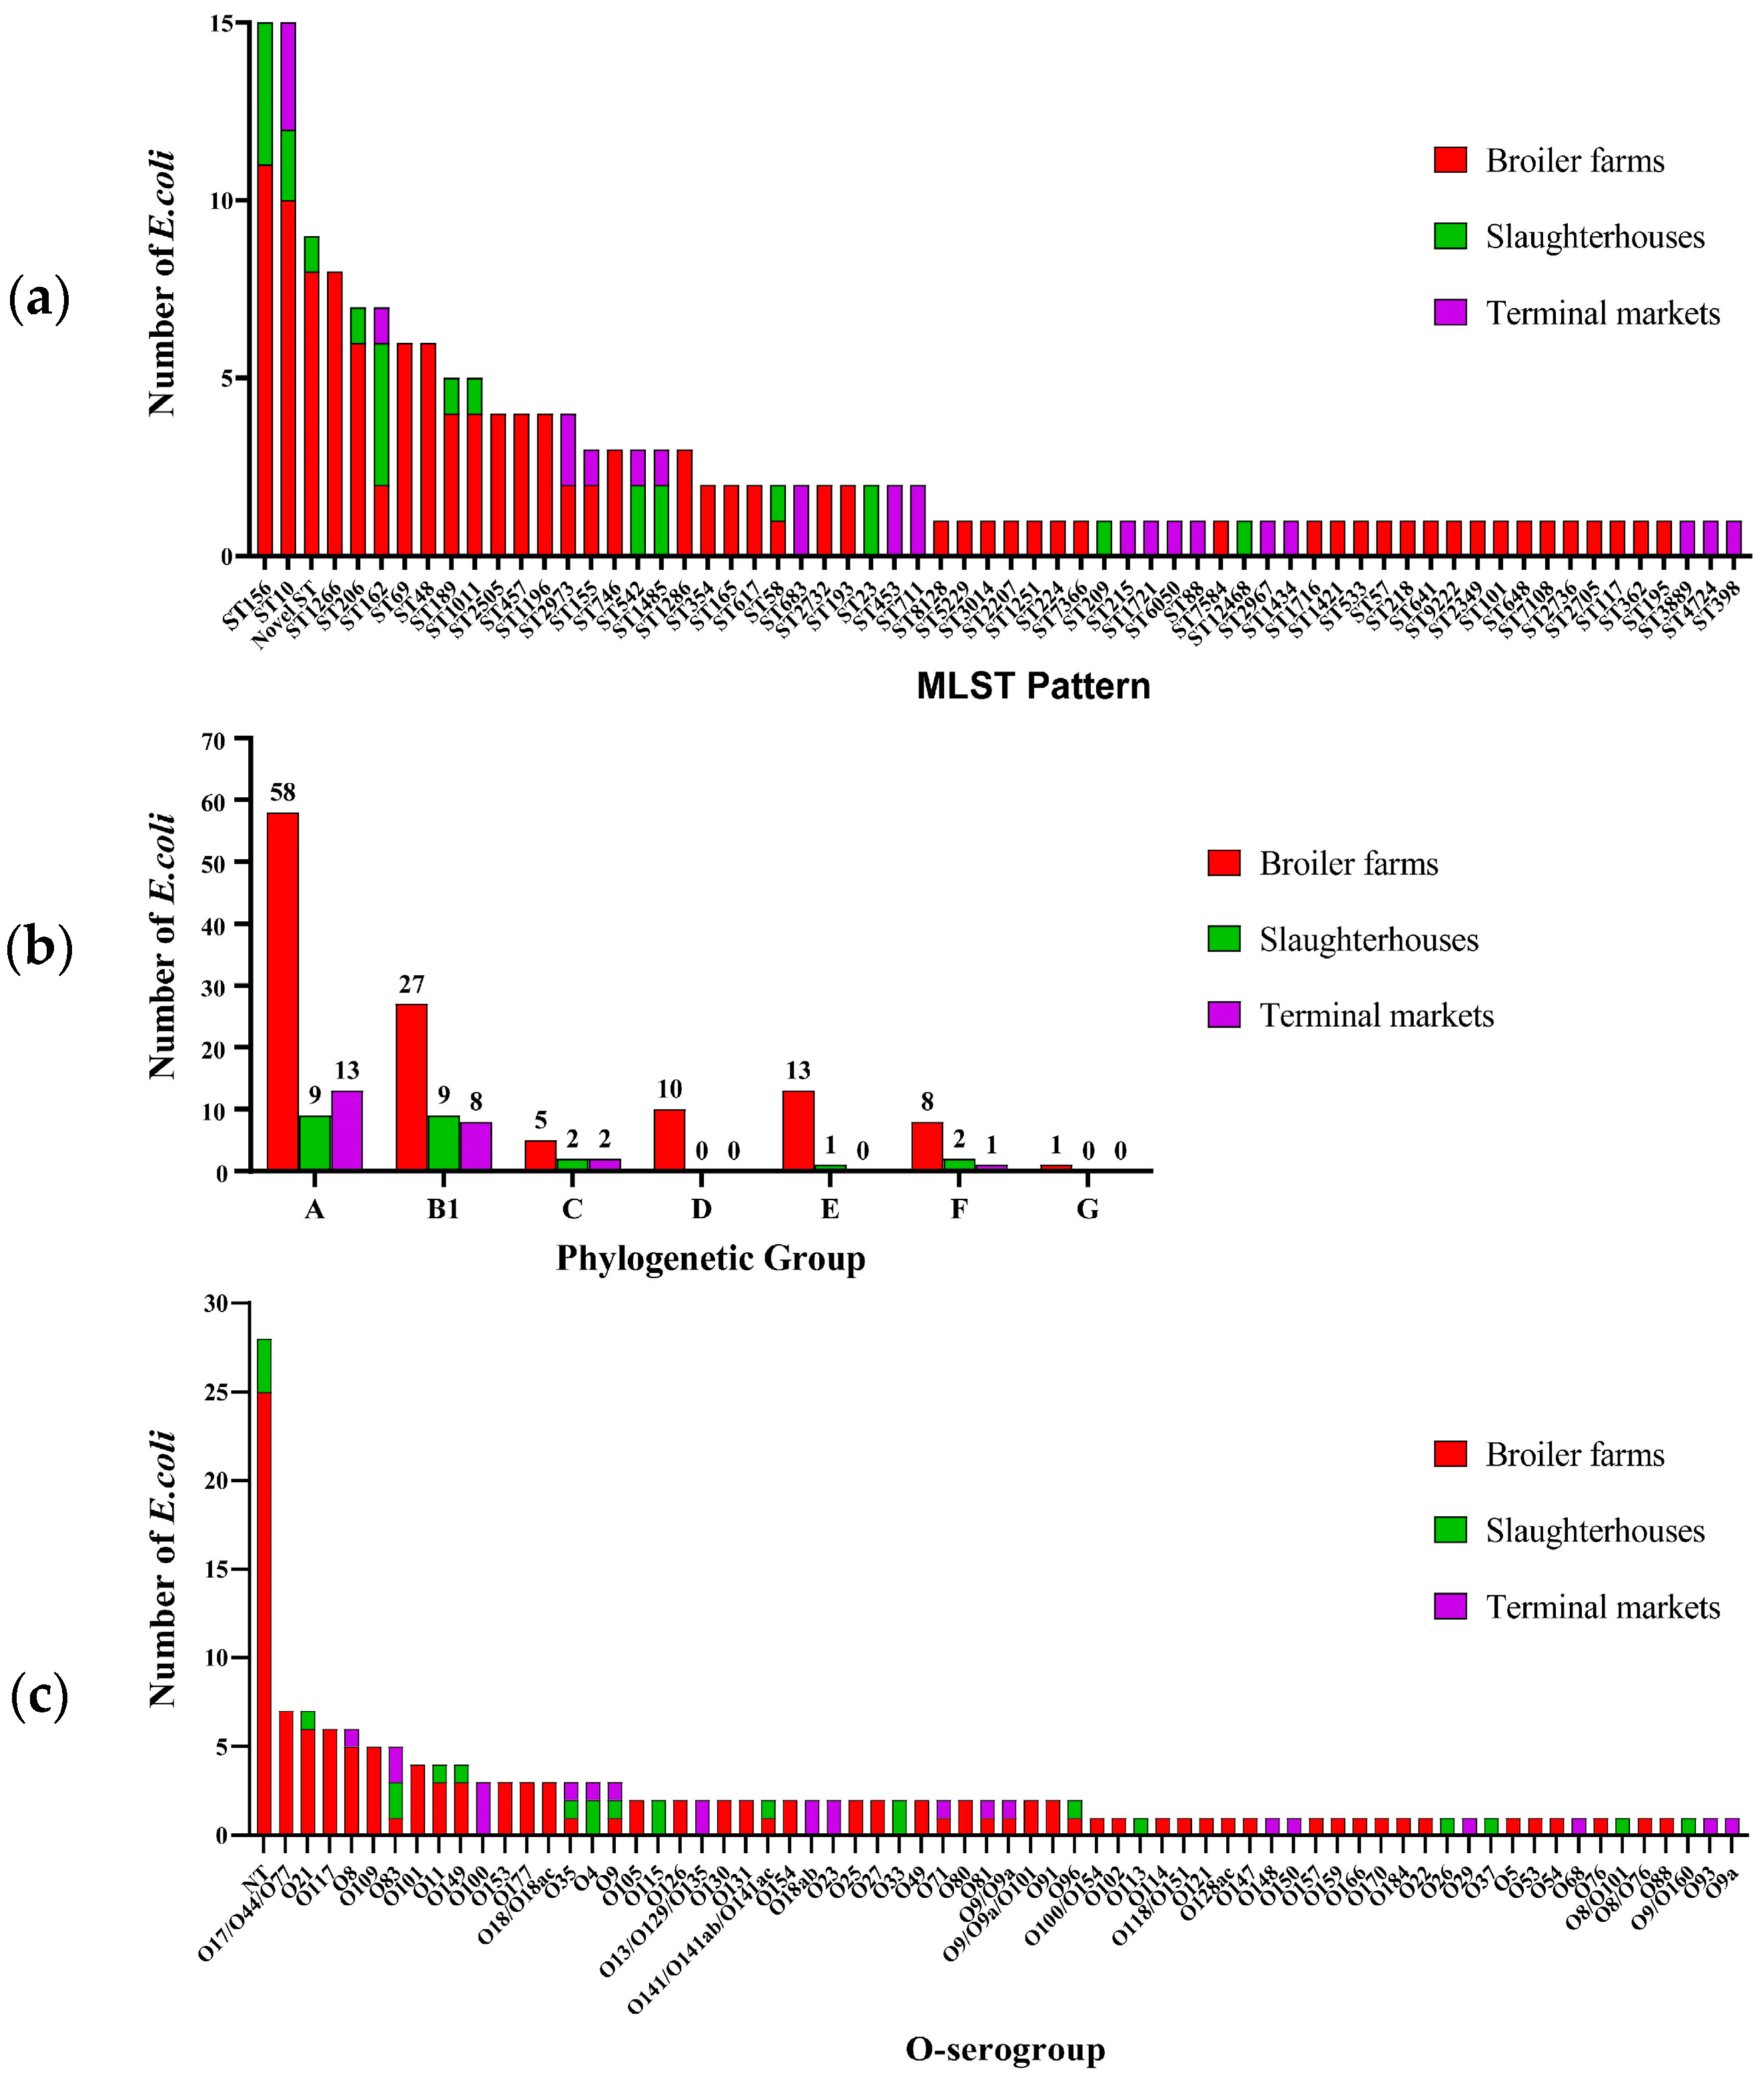
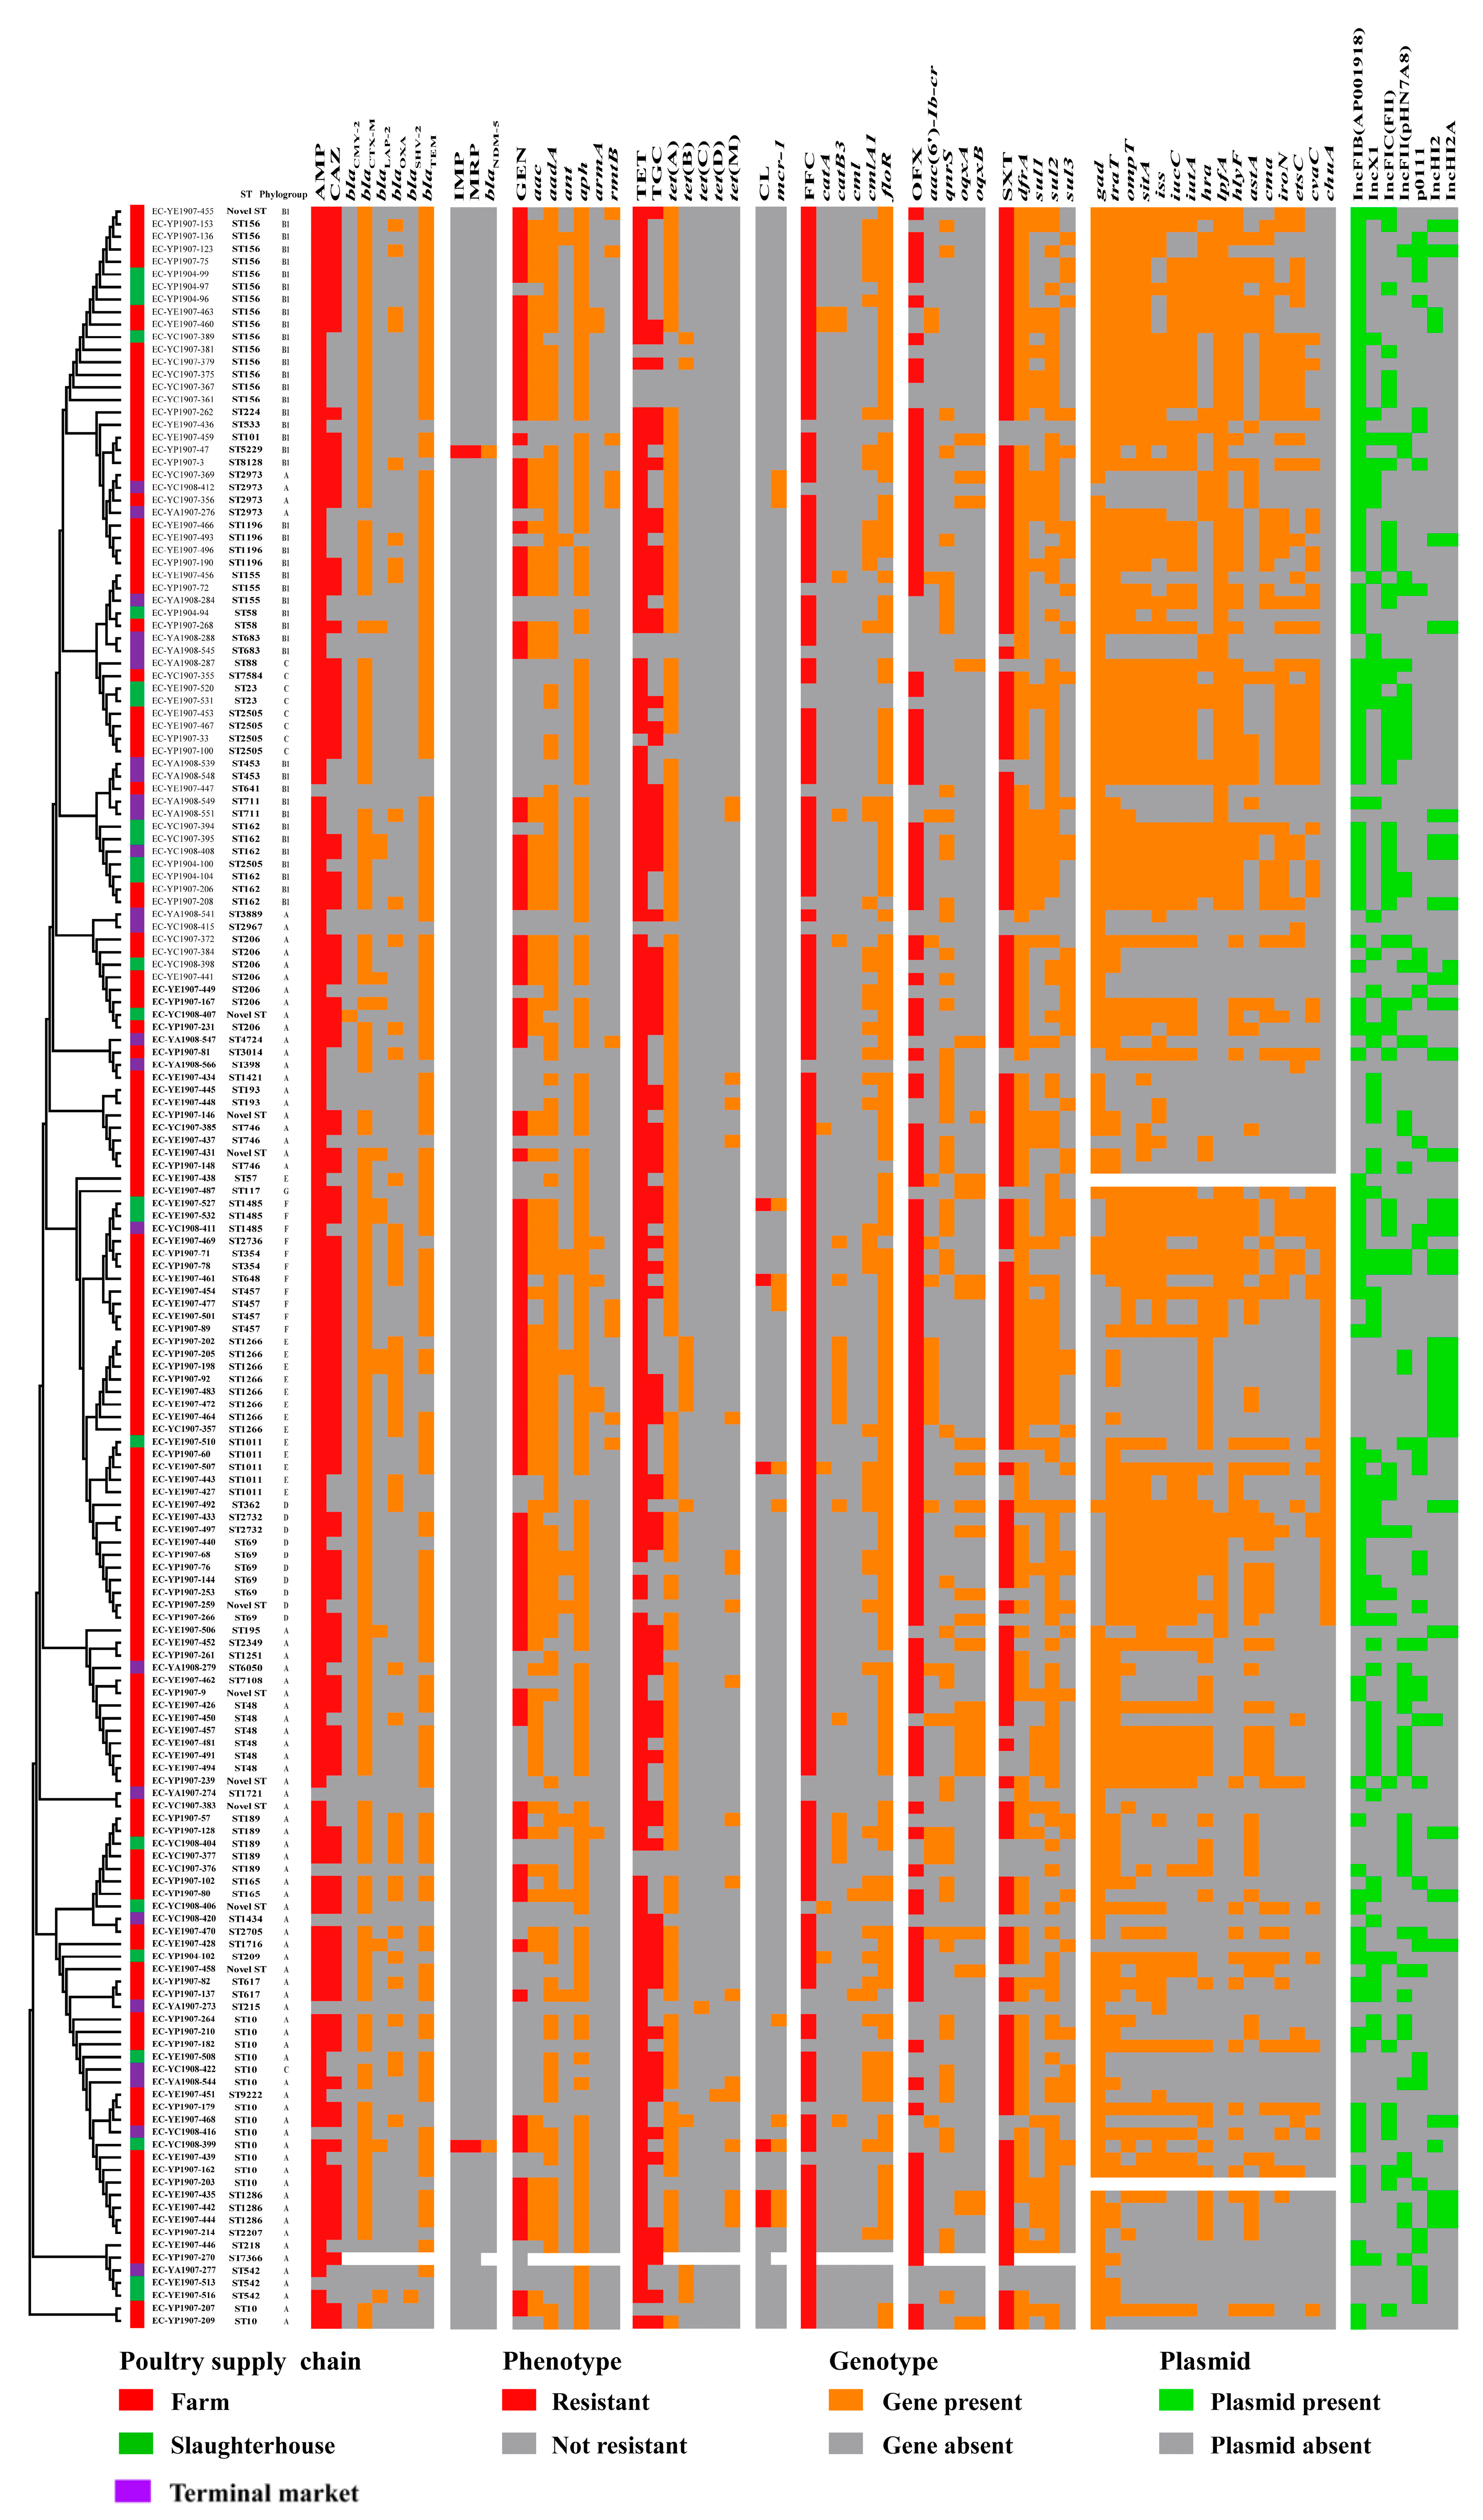
3.3. Sequence Type, Phylogenetic Group and O-Serogroup

In total, 63 catalogs of STs were identified among the 160 E. coli strains, and based on the results, a novel ST might exist for 9 E. coli strains (Figure 4a). ST156 (8.9%, 15/169) and ST10 (8.9%, 15/169) were the most common STs in the poultry industry, followed by ST1266 (4.7%, 8/169). Further, ST10 and ST162 were the most commonly identified STs among the isolates from broiler farms, slaughterhouses, and terminal markets. In total, 46 catalogs of STs were identified in broiler farm isolates, and ST156 (9.0%, 11/122) was the most frequent. Moreover, 12 total catalogs of STs were identified in slaughterhouse isolates, with ST156 (17.4%, 4/23) and ST162 (17.4%, 4/23) being the most frequent. In total, 18 catalogs of STs were identified in terminal market isolates, with ST10 (12.5%, 3/24) being the most frequent. ST156, ST206, ST189, ST1011, and ST58 were the most commonly identified STs among the isolates from broiler farms and slaughterhouses, whereas ST2973, ST155, ST542, and ST1485 were also identified among the isolates from slaughterhouses and terminal markets (Figure 4a).
The phylogenetic analysis showed that 47.3% (80/169), 26.0% (44/169), 5.3% (9/169), 5.9% (10/169), 8.3% (14/169), 6.5% (11/169), and 0.6% (1/169) of poultry industry isolates belonged to phylogenetic groups A, B1, C, D, E, F, and G, respectively (Figure 4b). Moreover, isolates from phylogenetic groups A, B1, C, and F were commonly identified among the isolates from broiler farms, slaughterhouses, and terminal markets. A relatively large proportion of ST10 E. coli strains belonged to group A (93.3%, 14/15), whereas all 15 ST165 and six ST162 E. coli strains belonged to phylogenetic group B1. In addition, they were all MDR E. coli strains.
The diversity of O-serogroups was confirmed in the poultry industry isolates, and 69.8% (118/169) of these E. coli strains were O-antigen typable and classified into 56 O-serogroup catalogs; however, 16.6% (28/169) of these E. coli strains were O-antigen non-typable (Figure 4c, Table S4). Multiple serogroups were predicted in 13.6% (23/169) of the E. coli strains. The dominant O-serogroups among the isolates from the poultry industry were O21 (4.1%, 7/169), O117 (3.6%, 6/169), and O8 (3.6%, 6/169). In addition, the O-serogroups O83, O35, and O9 were commonly identified among isolates from broiler farms, slaughterhouses, and terminal markets.

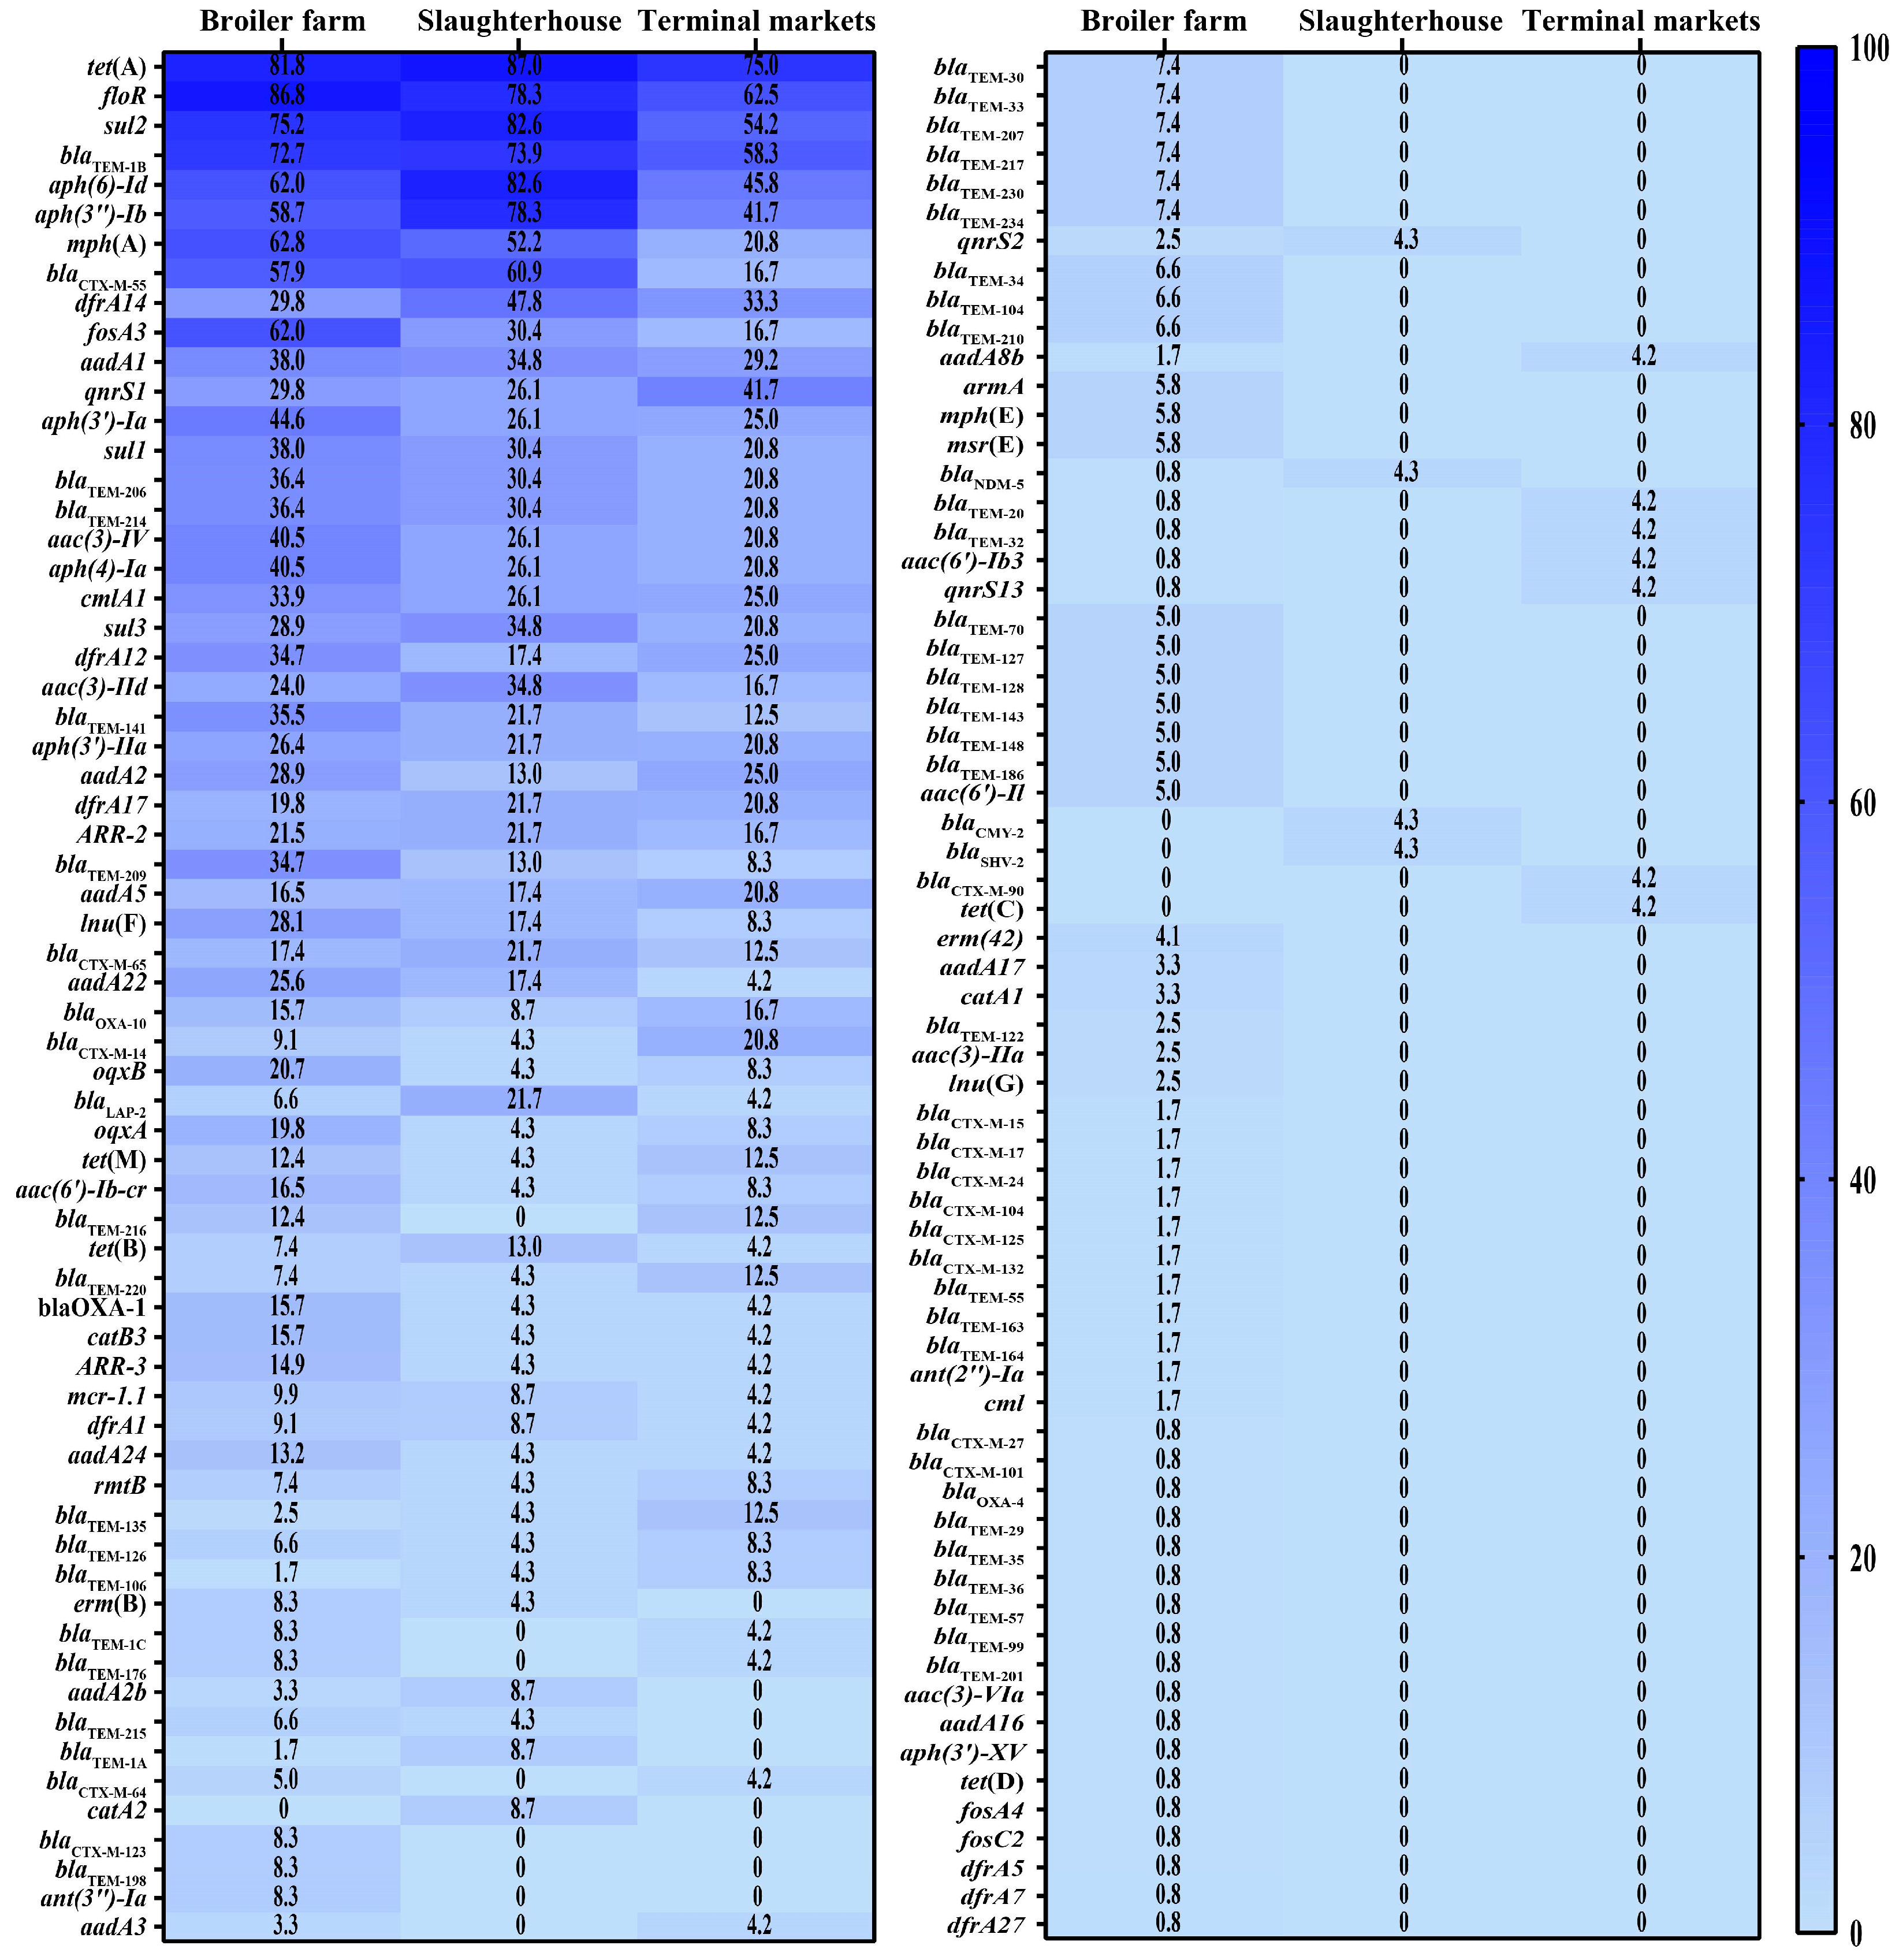
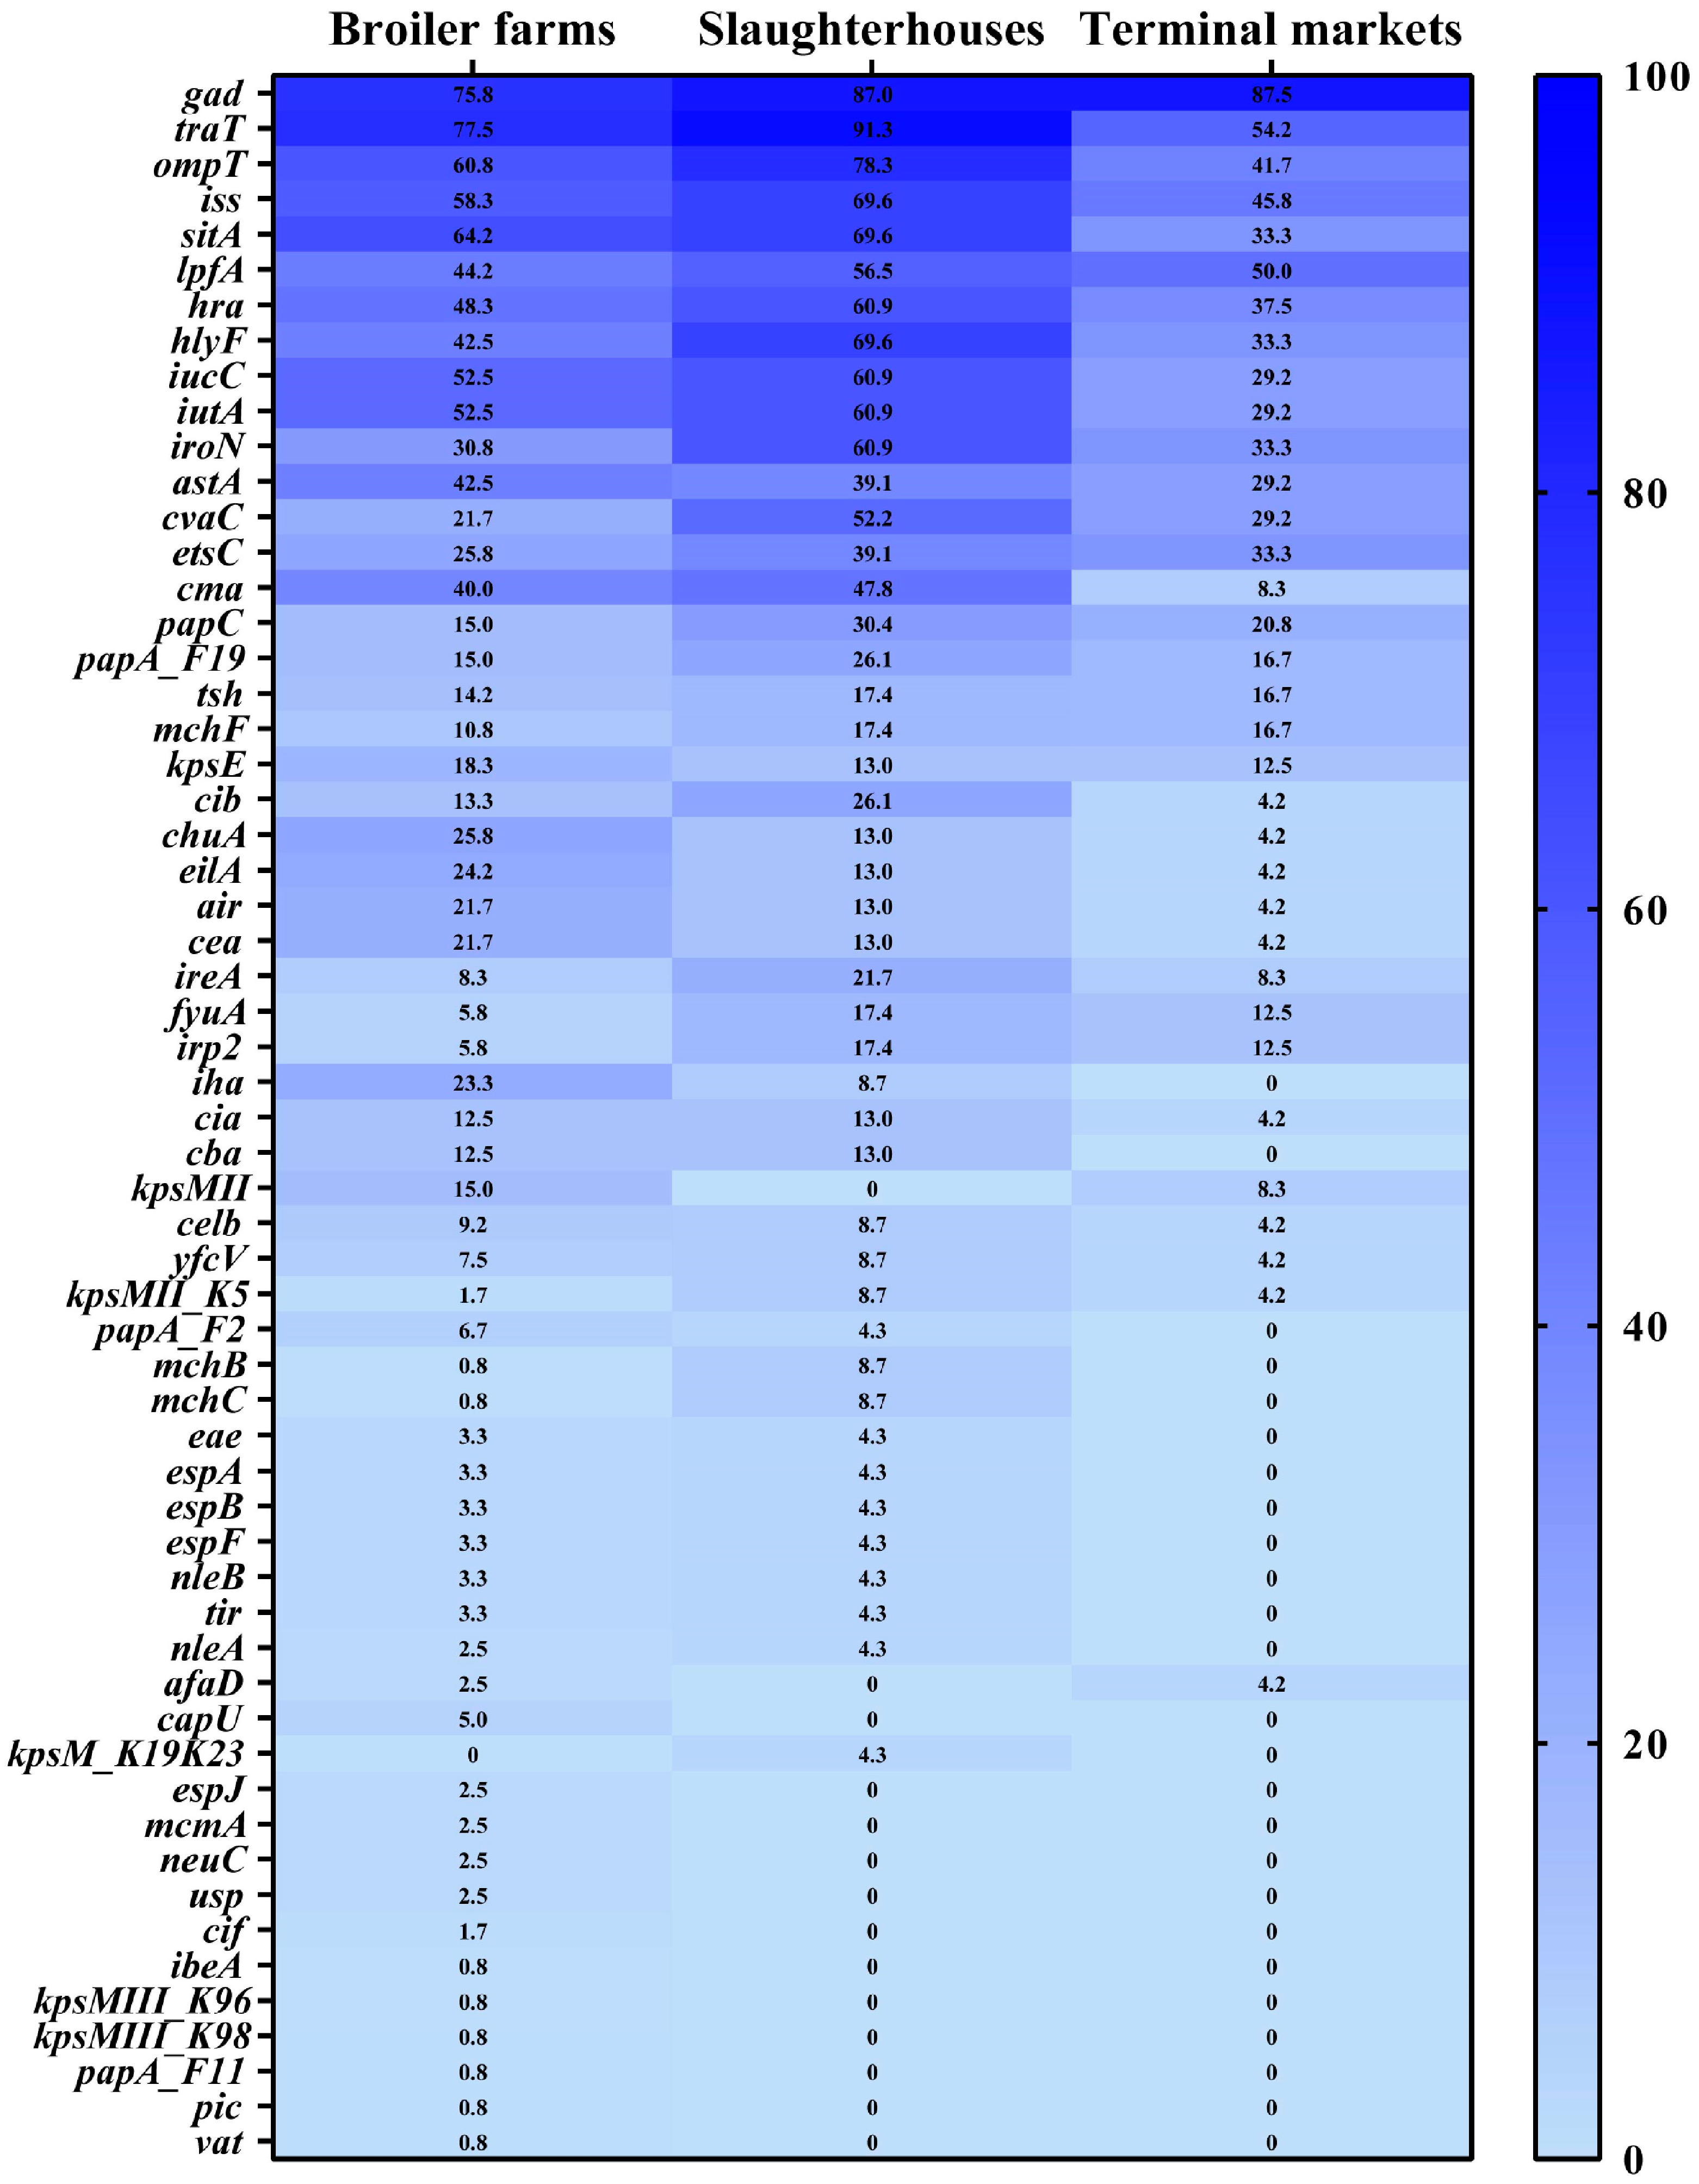
3.4. Prevalence of Antimicrobial Resistance Genes and Virulence Factor Genes

In total, 129 catalogs of ARGs were detected among the 168 E. coli strains, and 1 E. coli isolate was not analyzed (Figure 2). The prevalences of floR, tet(A), sul2, blaTEM-1B, and aph (6)-Id were ≥60%. A total of 124 ARG catalogs were detected in E. coli strains from broiler farms. The prevalences of 89 ARG catalogs, such as floR, mph(A), and fosA3, were higher in the broiler farms than in the slaughterhouses and markets. Sixty ARG catalogs were detected in E. coli strains isolated from slaughterhouses. The prevalences of 21 ARG catalogs, such as tet(A), sul2, and blaTEM-1B, in the slaughterhouses were higher than those in the broiler farms and the markets. Sixty-three ARG catalogs were detected in E. coli strains from the markets. The prevalences of 19 ARG catalogs from the markets were higher than that in broiler farms and slaughterhouses, and these included qnrS1, aadA5, and blaOXA-10 (Figure 5). Carbapenem-resistance in two E. coli strains was mediated by blaNDM-5, and colistin-resistance in nine E. coli strains was mediated by mcr-1 (Figure 2).
In total, 60 catalogs of VFGs were detected among the 167 E. coli strains, and 2 E. coli isolates were not analyzed (Figure 6). The prevalences of gad, traT, ompT, and sitA were greater than 60%. A total of 58 VFG catalogs were detected in E. coli strains from the broiler farms. The prevalences of 22 catalogs of VFGs, such as astA, kpsE, and chuA, from the broiler farms were higher than those in the slaughterhouses and markets. Forty-five VFG catalogs were detected in E. coli strains isolated from the slaughterhouses. The prevalences of 35 VFGs, such as traT, ompT, and iss, from the slaughterhouses were higher than those in the broiler farms and markets. Thirty-four VFG catalogs were detected in E. coli strains from the markets (Figure 6). The prevalences of gad and afaD in the markets were higher than those in the broiler farms and slaughterhouses (Figure 6). Moreover, phylogenetic group A carried fewer VFGs than the other groups of E. coli (Figure 2).

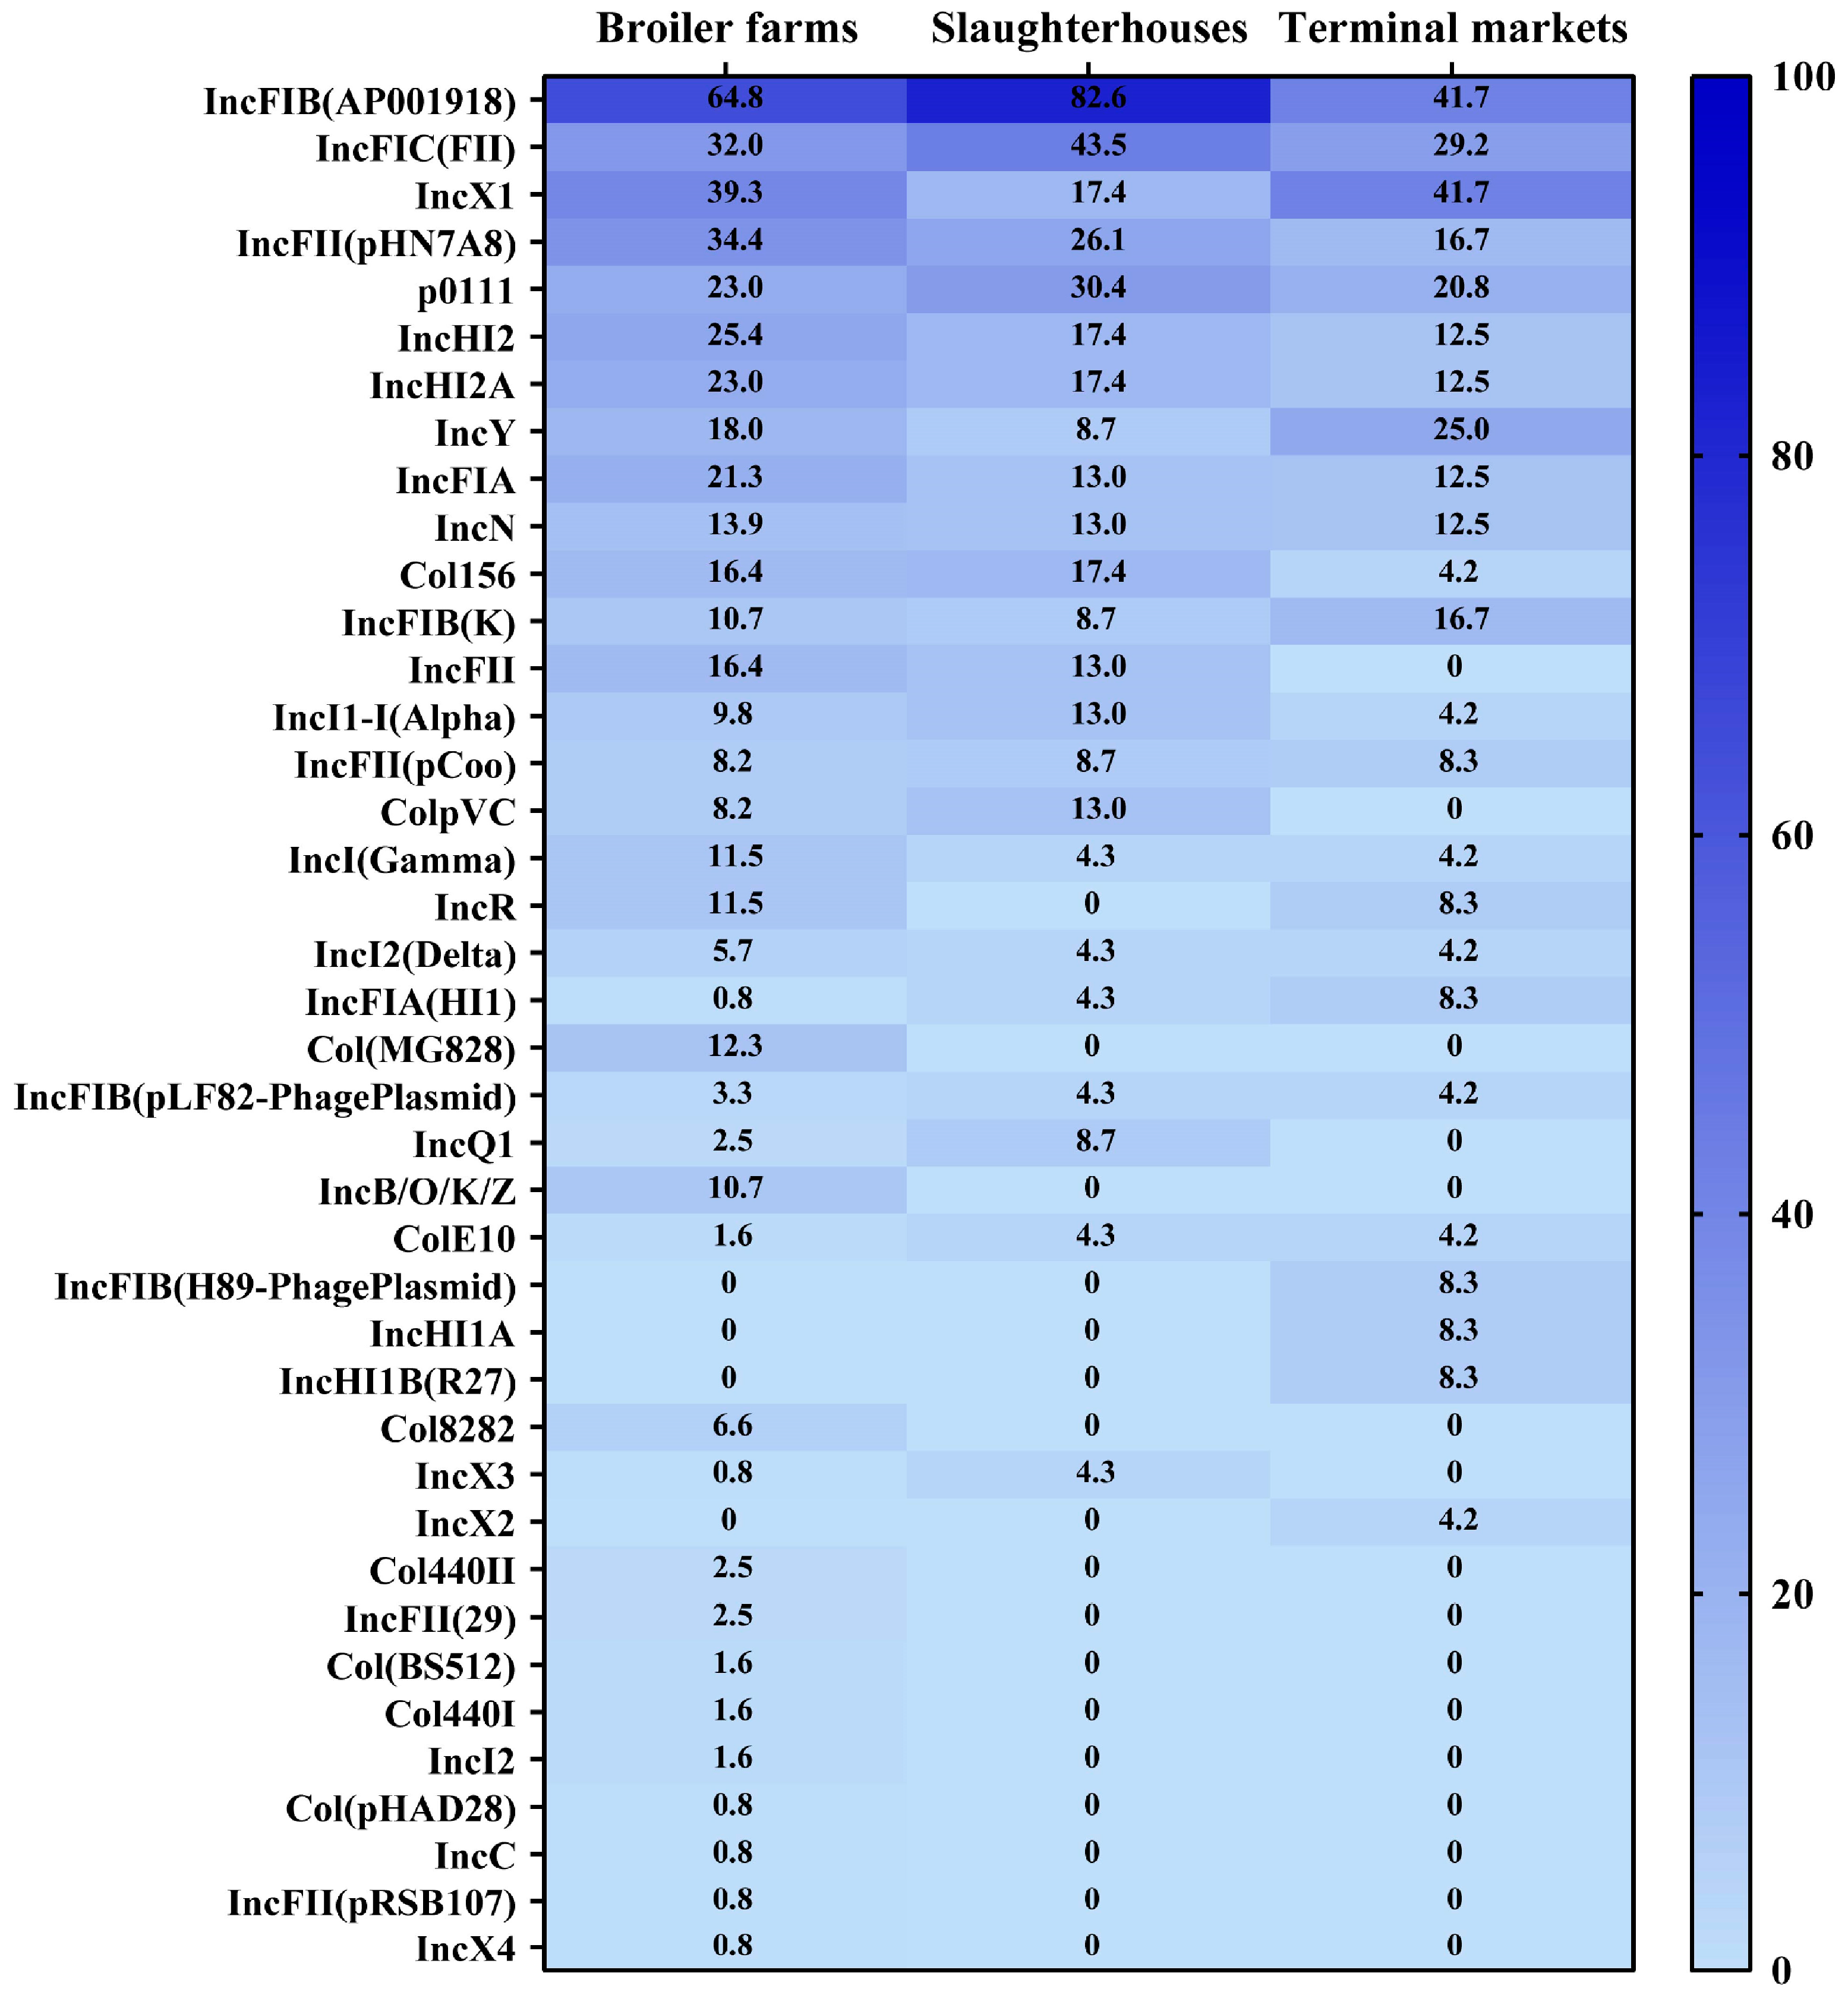
3.5. Prevalence and Distribution of Plasmid Profiles

In total, 40 catalogs of plasmid replicons were detected among the 168 E. coli strains, and 1 E. coli isolate lacked plasmid (Figure 2). The IncFIB (AP001918), IncX1, IncFIC (FII), and IncFII (pHN7A8) plasmids were the most common, with prevalence rates of 63.9%, 36.7%, 33.1%, and 30.8%, respectively. Thirty-six plasmid catalogs were detected in E. coli strains from the broiler farms. The prevalences of 21 plasmid catalogs in the broiler farms were higher than that in the slaughterhouses and markets, and these included IncFII (pHN7A8), IncHI2, and IncHI2A. Twenty-three plasmid catalogs were detected in E. coli strains isolated from the slaughterhouses. The prevalences of 11 plasmid catalogs in the slaughterhouses were higher than those in the broiler farms and markets, and these included IncFIB (AP001918), IncFIC (FII), and p0111. Twenty-four plasmid catalogs were detected in E. coli strains isolated from terminal markets. The prevalences of eight plasmids, such as IncX1, IncY, and IncFIB (K), in the market were higher than those in the broiler farms and slaughterhouses (Figure 7).

4. Discussion

In this study, we compared the AMR phenotypes, STs, phylogenetic groups, O-serotypes, VFGs, ARGs, and plasmid replicons of E. coli isolated from the poultry industry in Henan province, China. The use of disinfectants in the environment, the manufacturing practices, and the nature of the samples might explain the differences in the prevalences of E. coli. MDR isolates are common in slaughterhouses [31,32]. In addition, contact between consumers and products of a similar nature to the samples could also have increased the prevalence. Wu et al. reported that retail chicken in China was commonly contaminated with E. coli that exhibit multiple drug resistance [33]. The finding that retail meat, specifically retail chicken meat, could be a reservoir for E. coli that cause human extraintestinal infections, as well as the substantial prevalence of human-pathogenic extraintestinal pathogenic E. coli (ExPEC)-associated genes and phenotypes among E. coli strains from retail chicken products, impelled us to focus more on food safety [34,35].
Our study of the AMR phenotypes of E. coli strains revealed that the presence of resistance genes was not always consistent with resistance to the corresponding antimicrobials. A similar result was demonstrated for Salmonella strains [36]. The presence of ARGs in chromosomes or their inability to be expressed could explain this. In addition, gene expression increased the MIC, but this was not sufficient to be defined as antibiotic-resistant bacteria. In 2016, the use of colistin to promote livestock growth was not permitted in China (http://www.moa.gov.cn/, accessed on 26 July 2016). It is possible that colistin-resistant strains have existed for a considerable period or may have emerged because of the noncompliant usage in violation of regulations. Compliance with these regulations by farms could potentially lead to a reduction in resistance rates. Peng et al. revealed the co-existence of blaNDM-1 and mcr-1, as well as other genes that are responsible for MDR phenotypes [37]. Lin et al. analyzed the genomic features of an E. coli ST156 strain isolated from a clinical patient harboring the chromosome-located mcr-1 and plasmid-mediated blaNDM-5 gene [38]. An E. coli isolate named EC-YC1908-399 (ST10, O26) was found to carry both blaNDM-5 and mcr-1 in this study, and further studies should be conducted to characterize the accurate structures of these plasmids.
ST131, ST69, and ST10 are the most common ST ExPEC strains [39]. The most widespread STs in poultry farms were determined to be ST48, ST155, and ST10 [40]. These results indicate that the STs are complicated and that E. coli ST10 is widespread. Similar results were observed in this study. ST10 is one of the most widespread STs in poultry supply chains. Importantly, ST10 could be associated with EPEC of various O-serogroups [41]. The discovery of an E. coli ST156 strain harboring a chromosome-located mcr-1 and plasmid-mediated blaNDM-5 gene strengthens the concern regarding ST156 [38]. Several STs can exist at two links in the poultry supply chain, and E. coli strains might spread throughout the broiler supply chain. The emergence of numerous completely different STs suggests that the poultry product was commonly contaminated by E. coli and that this contamination needs to be controlled.
Escherichia coli serogroups O169, O26, O145, O111, O103, O121, and O157 cause severe foodborne diseases [42,43,44,45]. Although numerous serotypes exist, they are not completely consistent. This suggests that E. coli strains have little potential to directly cause diseases. Although the prevalences of O21, O109, and O117 E. coli were too dispersed to reveal the possibility of E. coli infection along the broiler supply chain, this provides the targets for interventions to minimize bacterial spread. Moreover, bacteriophages and bacteriophage-derived endolysins have been proposed as alternative antibiotic strategies for improving food safety and public health [46,47].
These concerns are exacerbated by the high prevalence and abundance of acquired virulence genes, AMR genes, and plasmids. In general, there is a high risk of E. coli strains isolated from broiler farms and slaughterhouses disseminating plasmids harboring ARGs and virulence genes. The dominant acquired virulence genes were gad, traT, ompT, and sitA, of which traT, ompT, and sitA are related to ExPEC [35,48,49]. In this study, the dominant ARGs identified were floR, tet(A), sul2, blaTEM-1B, and aph (6)-Id. In the environment, sul and tet genes are abundant in manure, soil, and water samples [50]. These results could be related, and the transmission of these ARGs needs to be further analyzed. In one study, the prevalence of tet(A) and blaTEM was ≥90% [51]. However, we did not observe a high prevalence in this study. The diversity of E. coli isolated from broiler farms, slaughterhouses, and sales terminals demonstrates that broiler farms and slaughterhouses have higher diversity and an increased risk. In this study, 40 different plasmid replicons were predicted, among which the Inc groups of the plasmids were the most common. Inc groups were reported to be the major plasmid families that emerged in MDR Enterobacteriaceae strains isolated worldwide, among those conferring resistance to clinically relevant antibiotics, and horizontal gene transfer through plasmids plays a major role in the evolution of AMR [52,53]. Removing plasmids from bacteria could be an important measure to fight AMR, and the utilization of plasmid-curing and anti-plasmid could reduce ARG prevalence, and sensitize bacteria to antibiotics [54].
Unfortunately, our study area did not involve too many cities and regions. In addition, our sample collection failed to track the changes in the process of chicken farm-to-table, which caused certain limitations. If there are more countries, provinces, or cities that monitored the prevalence of E. coli, data could be collected in a database, dynamic surveillance could be conducted, and the prevention and control of E. coli would be more targeted.
In summary, we characterized E. coli isolates from the broiler farms, slaughterhouses, and terminal markets of three companies in Henan province, China. Our results reveal that the different modes associated with terminal markets could cause different levels of bacterial contamination, and the environmental contamination of meat cannot be ignored. Therefore, the implementation of good manufacturing practices in the poultry industry is necessary to reduce the potential risk of E. coli.

5. Conclusions

The current study revealed that E. coli isolates from broiler farms, slaughterhouses, and terminal markets exhibited severe AMR profiles. Notably, some isolates were resistant to carbapenems, tigecycline, and colistin. Considering these severe AMR conditions, the use of antibiotics should be reduced particularly in broiler farms. Our results additionally supported that the STs and O-serotypes of these E. coli strains are extremely diverse and that the E. coli isolates from broiler farms and slaughterhouses harbor many ARGs and VFGs. The presence of those mobile plasmids will largely increase the AMR risk. In conclusion, our findings provide up-to-date information on the AMR profiles of E. coli from different sources in the poultry industry, and this information emphasizes the need to standardize antimicrobial use and good manufacturing practices, as well as sanitary conditions in related establishments.

Supplementary Materials

The following supporting information can be downloaded at: https://www.mdpi.com/article/10.3390/microorganisms12030575/s1, Table S1: Primers used in this study; Table S2: Antimicrobial agents used in this study; Table S3: Minimal inhibitory concentrations of different antibiotics on Escherichia coli; Table S4: The isolation sources were the O-serogroups of 169 sequenced Escherichia coli.

Author Contributions

Conceptualization, X.W. and H.C.; methodology, X.W., Z.P., Z.H. and Z.L.; software, Z.P. and Z.L.; formal analysis, Z.L.; investigation, Z.L., Z.H., C.J., Y.J., T.L. and X.Z.; resources, R.Y., X.W. and H.C.; visualization, Z.P. and Z.L.; project administration, X.W. and H.C.; funding acquisition, X.W. and H.C; writing—original draft preparation, Z.L.; writing—review and editing, Z.P., Z.L., X.W. and H.C. All authors have read and agreed to the published version of the manuscript.

Funding

This work was supported by the National Key Research and Development Program of China (grant number: 2021YFD1800800), the National Natural Science Foundation of China (grant number: 32122086), the China Agriculture Research System of MOF and MARA (CARS-35), the Walmart Foundation (project number: 61626817), and the Walmart Food Safety Collaboration Center.

Data Availability Statement

Data are contained within the article and Supplementary Materials.

Acknowledgments

We thank all study participants and field workers. We also appreciate the research platform provided by Huazhong Agricultural University.

Conflicts of Interest

The authors declare no potential conflicts of interest. The funders had no role in the study design, data collection, data analysis, data interpretation, or manuscript writing.

References

  1. Van Boeckel, T.P.; Brower, C.; Gilbert, M.; Grenfell, B.T.; Levin, S.A.; Robinson, T.P.; Teillant, A.; Laxminarayan, R. Global trends in antimicrobial use in food animals. Proc. Natl. Acad. Sci. USA 2015, 112, 5649–5654. [Google Scholar] [CrossRef] [PubMed]
  2. CDC. Antibiotic Resistance Threats in the United States, 2019; Department of Health and Human Services, CDC: Atlanta, GA, USA, 2019. [Google Scholar]
  3. Kaper, J.B.; Nataro, J.P.; Mobley, H.L.T. Pathogenic Escherichia coli. Nat. Rev. Microbiol. 2004, 2, 123–140. [Google Scholar] [CrossRef] [PubMed]
  4. Gomes, T.A.T.; Elias, W.P.; Scaletsky, I.C.A.; Guth, B.E.C.; Rodrigues, J.F.; Piazza, R.M.F.; Ferreira, L.C.S.; Martinez, M.B. Diarrheagenic Escherichia coli. Braz. J. Microbiol. 2016, 47, 3–30. [Google Scholar] [CrossRef] [PubMed]
  5. Biran, D.; Ron, E.Z. Extraintestinal pathogenic Escherichia coli. Curr. Top. Microbiol. Immunol. 2018, 416, 149–161. [Google Scholar] [CrossRef] [PubMed]
  6. Partridge, S.R.; Kwong, S.M.; Firth, N.; Jensen, S.O. Mobile genetic elements associated with antimicrobial resistance. Clin. Microbiol. Rev. 2018, 31, e00088-17. [Google Scholar] [CrossRef] [PubMed]
  7. Brisola, M.C.; Crecencio, R.B.; Bitner, D.S.; Frigo, A.; Rampazzo, L.; Stefani, L.M.; Faria, G.A. Escherichia coli used as a biomarker of antimicrobial resistance in pig farms of Southern Brazil. Sci. Total Environ. 2019, 647, 362–368. [Google Scholar] [CrossRef] [PubMed]
  8. Poirel, L.; Madec, J.Y.; Lupo, A.; Schink, A.K.; Kieffer, N.; Nordmann, P.; Schwarz, S. Antimicrobial resistance in Escherichia coli. Microbiol. Spectr. 2018, 6, 10-1128. [Google Scholar] [CrossRef] [PubMed]
  9. Jenkins, C.; Dallman, T.J.; Grant, K.A. Impact of whole genome sequencing on the investigation of food-borne outbreaks of Shiga toxin-producing Escherichia coli serogroup O157:H7, England, 2013 to 2017. Eurosurveillance 2019, 24, 84–90. [Google Scholar] [CrossRef]
  10. Peng, Z.; Hu, Z.Z.; Li, Z.G.; Zhang, X.X.; Jia, C.Y.; Li, T.Z.; Dai, M.H.; Tan, C.; Xu, Z.F.; Wu, B.; et al. Antimicrobial resistance and population genomics of multidrug-resistant Escherichia coli in pig farms in mainland China. Nat. Commun. 2022, 13, 1116. [Google Scholar] [CrossRef]
  11. Ghunaim, H.; Abu-Madi, M.A.; Kariyawasam, S. Advances in vaccination against avian pathogenic Escherichia coli respiratory disease: Potentials and limitations. Vet. Microbiol. 2014, 172, 13–22. [Google Scholar] [CrossRef]
  12. Liu, Z.; Wang, K.; Zhang, Y.; Xia, L.; Zhao, L.; Guo, C.; Liu, X.; Qin, L.; Hao, Z. High prevalence and diversity characteristics of blaNDM, mcr, and blaESBLs harboring multidrug-resistant Escherichia coli from chicken, pig, and cattle in China. Front. Cell. Infect. Microbiol. 2022, 11, 755545. [Google Scholar] [CrossRef]
  13. Hussain, H.I.; Iqbal, Z.; Iqbal, M.; Kuang, X.H.; Wang, Y.L.; Yang, L.Q.; Ihsan, A.; Aqib, A.I.; Kaleem, Q.M.; Gu, Y.F.; et al. Coexistence of virulence and β-lactamase genes in avian pathogenic Escherichia coli. Microb. Pathog. 2022, 163, 105389. [Google Scholar] [CrossRef]
  14. Rui, Y.P.; Qiu, G. Analysis of gut microbial communities and resistance genes in pigs and chickens in Central China. Animals 2022, 12, 3404. [Google Scholar] [CrossRef]
  15. Hu, Z.Z.; Peng, Z.; Zhang, X.X.; Li, Z.G.; Jia, C.Y.; Li, X.S.; Lv, Y.J.; Tan, C.; Chen, H.C.; Wang, X.R. Prevalence and molecular characterization of antimicrobial-resistant Escherichia coli in pig farms, slaughterhouses, and terminal markets in Henan province of China. Foodborne Pathog. Dis. 2021, 18, 733–743. [Google Scholar] [CrossRef]
  16. Sabat, G.; Rose, P.; Hickey, W.J.; Harkin, J.M. Selective and sensitive method for PCR amplification of Escherichia coli 16S rRNA genes in soil. Appl. Environ. Microbiol. 2000, 66, 844–849. [Google Scholar] [CrossRef]
  17. Wirth, T.; Falush, D.; Lan, R.T.; Colles, F.; Mensa, P.; Wieler, L.H.; Karch, H.; Reeves, P.R.; Maiden, M.C.J.; Ochman, H.; et al. Sex and virulence in Escherichia coli: An evolutionary perspective. Mol. Microbiol. 2006, 60, 1136–1151. [Google Scholar] [CrossRef]
  18. CLSI. Performance Standards for Antimicrobial Susceptibility Testing, 28th ed.; Clinical and Laboratory Standards Institute: Wayne, PA, USA, 2018. [Google Scholar]
  19. CLSI. Performance Standards for Antimicrobial Susceptibility Testing, 30th ed.; Clinical and Laboratory Standards Institute: Wayne, PA, USA, 2020. [Google Scholar]
  20. CLSI. Performance Standards for Antimicrobial Disk and Dilution Susceptibility Tests for Bacteria Isolated from Animals, 5th ed.; Clinical and Laboratory Standards Institute: Wayne, PA, USA, 2020. [Google Scholar]
  21. EUCAST. Breakpoint Tables for Interpretation of MICs and Zone Diameters. Version 10.0. Available online: https://www.eucast.org/clinical_breakpoints (accessed on 1 January 2020).
  22. EUCAST. Routine and Extended Internal Quality Control for MIC Determination and Disk Diffusion as Recommended by EUCAST. Version 10.0. Available online: https://www.eucast.org/ast_of_bacteria/quality_control (accessed on 1 January 2020).
  23. Larsen, M.V.; Cosentino, S.; Rasmussen, S.; Friis, C.; Hasman, H.; Marvig, R.L.; Jelsbak, L.; Sicheritz-Pontén, T.; Ussery, D.W.; Aarestrup, F.M.; et al. Multilocus sequence typing of total-genome-sequenced bacteria. J. Clin. Microbiol. 2012, 50, 1355–1361. [Google Scholar] [CrossRef]
  24. Joensen, K.G.; Tetzschner, A.M.M.; Iguchi, A.; Aarestrup, F.M.; Scheutz, F. Rapid and easy In Silico serotyping of Escherichia coli isolates by use of whole-genome sequencing data. J. Clin. Microbiol. 2015, 53, 2410–2426. [Google Scholar] [CrossRef] [PubMed]
  25. Beghain, J.; Bridier-Nahmias, A.; Le Nagard, H.; Denamur, E.; Clermont, O. ClermonTyping: An easy-to-use and accurate in silico method for Escherichia genus strain phylotyping. Microb. Genom. 2018, 4, e000192. [Google Scholar] [CrossRef] [PubMed]
  26. Bortolaia, V.; Kaas, R.S.; Ruppe, E.; Roberts, M.C.; Schwarz, S.; Cattoir, V.; Philippon, A.; Allesoe, R.L.; Rebelo, A.R.; Florensa, A.F.; et al. ResFinder 4.0 for predictions of phenotypes from genotypes. J. Antimicrob. Chemother. 2020, 75, 3491–3500. [Google Scholar] [CrossRef] [PubMed]
  27. Joensen, K.G.; Scheutz, F.; Lund, O.; Hasman, H.; Kaas, R.S.; Nielsen, E.M.; Aarestrup, F.M. Real-time whole-genome sequencing for routine typing, surveillance, and outbreak detection of verotoxigenic Escherichia coli. J. Clin. Microbiol. 2014, 52, 1501–1510. [Google Scholar] [CrossRef]
  28. Malberg Tetzschner, A.M.; Johnson, J.R.; Johnston, B.D.; Lund, O.; Scheutz, F.; Dekker, J.P. In Silico genotyping of Escherichia coli isolates for extraintestinal virulence genes by use of whole-genome sequencing data. J. Clin. Microbiol. 2020, 58, e01269-20. [Google Scholar] [CrossRef] [PubMed]
  29. Carattoli, A.; Zankari, E.; Garcia-Fernandez, A.; Larsen, M.V.; Lund, O.; Villa, L.; Aarestrup, F.M.; Hasman, H. Detection and typing of plasmids using PlasmidFinder and plasmid multilocus sequence typing. Antimicrob. Agents Chemother. 2014, 58, 3895–3903. [Google Scholar] [CrossRef]
  30. Kumar, S.; Stecher, G.; Li, M.; Knyaz, C.; Tamura, K. MEGA X: Molecular evolutionary genetics analysis across computing platforms. Mol. Biol. Evol. 2018, 35, 1547–1549. [Google Scholar] [CrossRef]
  31. Jiu, Y.G.; Meng, X.R.; Hong, X.; Huang, Q.; Wang, C.F.; Chen, Z.; Zhao, L.J.; Liu, X.Y.; Lu, Y.C.; Li, S.W. Prevalence and characterization of Salmonella in three typical commercial pig abattoirs in Wuhan, China. Foodborne Pathog. Dis. 2020, 17, 620–627. [Google Scholar] [CrossRef] [PubMed]
  32. Agerso, Y.; Aarestrup, F.M.; Pedersen, K.; Seyfarth, A.M.; Struve, T.; Hasman, H. Prevalence of extended-spectrum cephalosporinase (ESC)-producing Escherichia coli in Danish slaughter pigs and retail meat identified by selective enrichment and association with cephalosporin usage. J. Antimicrob. Chemother. 2012, 67, 582–588. [Google Scholar] [CrossRef] [PubMed]
  33. Wu, Q.; Xi, M.L.; Lv, X.Y.; Xu, Y.F.; Feng, Y.Q.; Li, Q.; Yang, Q.N.; Xia, X.D. Presence and antimicrobial susceptibility of Escherichia coli recovered from retail chicken in China. J. Food Prot. 2014, 77, 1773–1777. [Google Scholar] [CrossRef]
  34. Vincent, C.; Boerlin, P.; Daignault, D.; Dozois, C.M.; Dutil, L.; Galanakis, C.; Reid-Smith, R.J.; Tellier, P.P.; Tellis, P.A.; Ziebell, K.; et al. Food reservoir for Escherichia coli causing urinary tract infections. Emerg. Infect. Dis. 2010, 16, 88–95. [Google Scholar] [CrossRef] [PubMed]
  35. Mitchell, N.M.; Johnson, J.R.; Johnston, B.; Curtiss, R.; Mellataa, M. Zoonotic potential of Escherichia coli isolates from retail chicken meat products and eggs. Appl. Environ. Microbiol. 2015, 81, 1177–1187. [Google Scholar] [CrossRef]
  36. Jiu, Y.G.; Zhu, S.; Khan, S.B.; Sun, M.Z.; Zou, G.; Meng, X.R.; Wu, B.; Zhou, R.; Li, S.W. Phenotypic and genotypic resistance of Salmonella isolates from healthy and diseased pigs in China during 2008–2015. Microb. Drug Resist. 2017, 23, 651–659. [Google Scholar] [CrossRef]
  37. Peng, Z.; Li, X.S.; Hu, Z.Z.; Li, Z.G.; Lv, Y.J.; Lei, M.G.; Wu, B.; Chen, H.C.; Wang, X.R. Characteristics of carbapenem-resistant and colistin-resistant Escherichia coli co-producing NDM-1 and MCR-1 from pig farms in China. Microorganisms 2019, 7, 482. [Google Scholar] [CrossRef] [PubMed]
  38. Lin, Y.F.; Yang, L.; Lu, L.F.; Wang, K.Y.; Li, J.H.; Li, P.H.; Liu, Y.Q.; Liu, X.L.; Li, P.; Song, H.B. Genomic features of an Escherichia coli ST156 strain harboring chromosomelocated mcr-1 and plasmid-mediated blaNDM-5. Infect. Genet. Evol. 2020, 85, 104499. [Google Scholar] [CrossRef]
  39. Manges, A.R.; Geum, H.M.; Guo, A.; Edens, T.J.; Fibke, C.D.; Pitout, J.D.D. Global extraintestinal pathogenic Escherichia coli (ExPEC) lineages. Clin. Microbiol. Rev. 2019, 32, e00135-18. [Google Scholar] [CrossRef]
  40. Blaak, H.; van Hoek, A.H.A.M.; Hamidjaja, R.A.; van der Plaats, R.Q.J.; Kerkhof-de Heer, L.; Husman, A.M.D.; Schets, F.M. Distribution, numbers, and diversity of ESBL-producing E. coli in the poultry farm environment. PLoS ONE 2015, 10, e0135402. [Google Scholar] [CrossRef]
  41. Denamur, E.; Clermont, O.; Bonacorsi, S.; Gordon, D. The population genetics of pathogenic Escherichia coli. Nat. Rev. Microbiol. 2020, 19, 37–54. [Google Scholar] [CrossRef]
  42. Ethelberg, S.; Smith, B.; Torpdahl, M.; Lisby, M.; Boel, J.; Jensen, T.; Nielsen, E.M.; Molbak, K. Outbreak of non-O157 Shiga toxin–producing Escherichia coli infection from consumption of beef sausage. Clin. Infect. Dis. 2009, 48, E78–E81. [Google Scholar] [CrossRef] [PubMed]
  43. Beatty, M.E.; Bopp, C.A.; Wells, J.G.; Greene, K.D.; Puhr, N.D.; Mintz, E.D. Enterotoxin-producing Escherichia coli O169:H41, United States. Emerg. Infect. Dis. 2004, 10, 518–521. [Google Scholar] [CrossRef] [PubMed]
  44. Mellmann, A.; Bielaszewska, M.; Köck, R.; Friedrich, A.W.; Fruth, A.; Middendorf, B.; Harmsen, D.; Schmidt, M.A.; Karch, H. Analysis of collection of hemolytic uremic syndrome-associated enterohemorrhagic Escherichia coli Emerg. Infect. Dis. 2008, 14, 1287–1290. [Google Scholar] [CrossRef]
  45. Adams, N.L.; Byrne, L.; Smith, G.A.; Elson, R.; Harris, J.P.; Salmon, R.; Smith, R.; O’Brien, S.J.; Adak, G.K.; Jenkins, C. Shiga toxin–producing Escherichia coli O157, England and Wales, 1983–2012. Emerg. Infect. Dis. 2016, 22, 590–597. [Google Scholar] [CrossRef]
  46. Zbikowska, K.; Michalczuk, M.; Dolka, B. The use of bacteriophages in the poultry Industry. Animals 2020, 10, 872. [Google Scholar] [CrossRef]
  47. Chang, Y. Bacteriophage-derived endolysins applied as potent biocontrol agents to enhance food safety. Microorganisms 2020, 8, 724. [Google Scholar] [CrossRef] [PubMed]
  48. Sarowska, J.; Futoma-Koloch, B.; Jama-Kmiecik, A.; Frej-Madrzak, M.; Ksiazczyk, M.; Bugla-Ploskonska, G.; Choroszy-Krol, I. Virulence factors, prevalence and potential transmission of extraintestinal pathogenic Escherichia coli isolated from different sources: Recent reports. Gut Pathog. 2019, 11, 10. [Google Scholar] [CrossRef] [PubMed]
  49. Desvaux, M.; Dalmasso, G.; Beyrouthy, R.; Barnich, N.; Delmas, J.; Bonnet, R. Pathogenicity factors of genomic islands in intestinal and extraintestinal Escherichia coli. Front. Microbiol. 2020, 11, 2065. [Google Scholar] [CrossRef] [PubMed]
  50. Wang, N.; Guo, X.Y.; Yan, Z.; Wang, W.; Chen, B.; Ge, F.; Ye, B.P. A comprehensive analysis on spread and distribution characteristic of antibiotic resistance genes in livestock farms of southeastern China. PLoS ONE 2016, 11, e0156889. [Google Scholar] [CrossRef]
  51. Azad, M.A.R.A.; Rahman, M.M.; Amin, R.; Begum, M.I.A.; Fries, R.; Husna, A.; Khairalla, A.S.; Badruzzaman, A.T.M.; El Zowalaty, M.E.; Lampang, K.N.; et al. Susceptibility and multidrug resistance patterns of Escherichia coli isolated from cloacal swabs of live broiler chickens in Bangladesh. Pathogens 2019, 8, 118. [Google Scholar] [CrossRef]
  52. Carattoli, A. Resistance plasmid families in Enterobacteriaceae. Antimicrob. Agents Chemother. 2009, 53, 2227–2238. [Google Scholar] [CrossRef]
  53. Rozwandowicz, M.; Brouwer, M.S.M.; Fischer, J.; Wagenaar, J.A.; Gonzalez-Zorn, B.; Guerra, B.; Mevius, D.J.; Hordijk, J. Plasmids carrying antimicrobial resistance genes in Enterobacteriaceae. J. Antimicrob. Chemother. 2018, 73, 1121–1137. [Google Scholar] [CrossRef]
  54. Buckner, M.M.C.; Ciusa, M.L.; Piddock, L.J.V. Strategies to combat antimicrobial resistance: Anti-plasmid and plasmid curing. FEMS Microbiol. Rev. 2018, 42, 781–804. [Google Scholar] [CrossRef]
Figure 1. Sampling sites and isolation of bacteria: (a) map showing the sampling sites for the broiler farms, slaughterhouses, and markets in Henan province. These maps are not drawn to scale. (b) Escherichia coli isolation rate (number of E. coli/samples) from companies A, B, and C. The results were analyzed using the chi-square test, and (*) means significant at a p-value < 0.05, (**) means significant at a p-value < 0.01, and (***) means significant at a p-value < 0.001.
Microorganisms 12 00575 g001
Figure 2. Distribution of the antimicrobial resistance phenotypes, antimicrobial resistance genes, virulence factor genes, and plasmid replicons. The phylogenetic tree was constructed based on multilocus sequence typing (MLST) alleles using MEGAX, as well as the neighbor-joining algorithm with 1000 bootstraps. AMP, ampicillin; CAZ, ceftazidime; IMP, imipenem; MRP, meropenem; GEN, gentamicin; OFX, ofloxacin; SXT, trimethoprim–sulfamethoxazole; TET, tetracycline; TGC, tigecycline; CL, colistin; FFC, florfenicol.
Microorganisms 12 00575 g002
Figure 3. Antimicrobial resistance characteristics of Escherichia coli strains isolated from the poultry industry: (a) percentages of E. coli strains showing antimicrobial resistance to different antimicrobial agents. AMP, ampicillin; CAZ, ceftazidime; IPM, imipenem; MRP, meropenem; GEN, gentamicin; OFX, ofloxacin; SXT, trimethoprim–sulfamethoxazole; TET, tetracycline; TGC, tigecycline; CL, colistin; FFC, florfenicol. (b) Percentages of E. coli strains showing antimicrobial resistance to different antimicrobial classes. The grey area represents the multidrug-resistant E. coli strains. The results were analyzed using a chi-square test, (*) means significant at a p-value < 0.05, (**) means significant at a p-value < 0.01, and (***) means significant at a p-value < 0.001.
Microorganisms 12 00575 g003
Figure 4. Sequence types, phylogenetic groups, and O-serogroups of 169 Escherichia coli isolates from the poultry industry. Distributions of the (a) sequence types, (b) phylogenetic groups, and (c) O-serogroups among 169 E. coli strains are shown. MLST, multilocus sequence typing.
Microorganisms 12 00575 g004
Figure 5. Heatmap of the antimicrobial resistance gene distributions in different Escherichia coli strains. The numbers in the cells correspond to the percentage of isolates that harbor plasmids.
Microorganisms 12 00575 g005
Figure 6. Heatmap of the virulence factor gene distributions in different Escherichia coli strains. The numbers in the cells correspond to the percentage of isolates that harbor plasmids.
Microorganisms 12 00575 g006
Figure 7. Heatmap of the plasmid distributions in different Escherichia coli strains. The numbers in the cells correspond to the percentages of isolates that harbor plasmids.
Microorganisms 12 00575 g007
Disclaimer/Publisher’s Note: The statements, opinions and data contained in all publications are solely those of the individual author(s) and contributor(s) and not of MDPI and/or the editor(s). MDPI and/or the editor(s) disclaim responsibility for any injury to people or property resulting from any ideas, methods, instructions or products referred to in the content.

