Article

Ecological Interaction between Bacteriophages and Bacteria in Sub-Arctic Kongsfjorden Bay, Svalbard, Norway

1
Library of Marine Samples, Korea Institute of Ocean Science & Technology, Geoje 53201, Republic of Korea
2
Department of Ocean Science, University of Science & Technology, Daejeon 34113, Republic of Korea
3
Unit of Next Generation IBRV Building Program, Korea Polar Research Institute, Incheon 21990, Republic of Korea
4
Marine Domain & Security Research Department, Korea Institute of Ocean Science & Technology, Busan 49111, Republic of Korea
5
Risk Assessment Research Center, Korea Institute of Ocean Science & Technology, Geoje 53201, Republic of Korea
6
Division of Polar Ocean Science Research, Korea Polar Research Institute, Incheon 21990, Republic of Korea
*
Authors to whom correspondence should be addressed.
Microorganisms 2024, 12(2), 276; https://doi.org/10.3390/microorganisms12020276
Submission received: 30 December 2023 / Revised: 25 January 2024 / Accepted: 26 January 2024 / Published: 28 January 2024
(This article belongs to the Topic Marine Viruses)

Abstract

:
Marine virus diversity and their relationships with their hosts in the marine environment remain unclear. This study investigated the co-occurrence of marine DNA bacteriophages (phages) and bacteria in the sub-Arctic area of Kongsfjorden Bay in Svalbard (Norway) in April and June 2018 using metagenomics tools. Of the marine viruses identified, 48–81% were bacteriophages of the families Myoviridae, Siphoviridae, and Podoviridae. Puniceispirillum phage HMO-2011 was dominant (7.61%) in April, and Puniceispirillum phage HMO-2011 (3.32%) and Pelagibacter phage HTVC008M (3.28%) were dominant in June. Gammaproteobacteria (58%), including Eionea flava (14.3%) and Pseudomonas sabulinigri (12.2%), were dominant in April, whereas Alphaproteobacteria (87%), including Sulfitobacter profundi (51.5%) and Loktanella acticola (32.4%), were dominant in June. The alpha diversity of the bacteriophages and bacterial communities exhibited opposite patterns. The diversity of the bacterial community was higher in April and lower in June. Changes in water temperature and light can influence the relationship between bacteria and bacteriophages.

1. Introduction

Viruses, the most abundant biological entities, are estimated to exceed 1030 in number, and they inhabit a variety of marine ecosystems [1]. Viruses are essential components of marine microbial cycles, playing a crucial role in ecosystem functioning by supplementing dissolved organic matter [1,2,3]. Viruses are primarily classified as RNA and DNA viruses, with DNA viruses being widespread in marine environments, infecting both prokaryotes and eukaryotes [4]. New classification criteria for bacteriophages were introduced in 2023, specifically for the Caudoviricetes class, which includes Autographiviridae, Straboviridae, Herelleviridae, and Drexlerviridae, which are present in higher abundance than other viruses in the sea [5,6]. Bacteriophages may play a key role in regulating the bacterial community in the ocean [7] and reportedly eliminate 20–40% of the bacterial community on a daily basis [8,9]. Bacteriophages replicate using two major replication strategies, namely lysogenic and lytic replication. In lysogeny, the phage DNA integrates into the host genome, and its genetic material is replicated each time the host genome replicates. This state persists until an environmental signal induces the phage to enter the lytic pathway [10]. During the lytic cycle, host cells are lysed, and the bacteriophage progeny as well as various cellular nutrient sources are released [9].
Heterotrophic bacteria are responsible for processing a significant portion of the organic matter produced by phytoplankton. These bacteria, in turn, are consumed by predators, thereby sustaining nutrient cycling [11,12]. Owing to their ability to withstand various environmental conditions, they are ubiquitously distributed. They can thrive even in extreme conditions related to temperature, radiation, desiccation, salinity, and nutrient availability. For example, some Pseudomonas spp. are dominant in the Arctic and Antarctic, and the prevalence of these heterotrophic and chemoautotrophic bacteria indicates that they play a fundamental role in processes such as nitrogen fixation and nitrogen recycling via utilizing glycogen during the polar night [13,14,15]. To understand nutrient cycling, some studies have assessed the correlation between viral and prokaryotic abundance [16,17]. However, our understanding of the relationships between these elements and the broader field of viral ecology remains limited.
The coastal ecosystem of Kongsfjorden in Svalbard, Norway, is influenced by ocean currents between the Atlantic and Arctic Ocean [18]. The Kongsfjorden Sea exhibits distinctive differences from the Arctic Ocean ecosystem during the polar night when the water temperature drops below 0 °C; however, the water temperature rapidly increases after the beginning of the white nights [19]. In our previous study, we identified an ecological interplay between the eukaryotic plankton community and nucleocytoplasmic large DNA viruses in Kongsfjorden Bay in April and June 2018 [19]; NCLDVs and EPC populations were similar between the surface and bottom layers but differed between samples collected in April and June. In particular, three Phycodnaviridae, two Poxviridae, three Pandoraviridae, and two Mimiviridae viruses accounted predominantly for the NCLDV diversity. Furthermore, Pandoraviridae and Mimiviridae were strongly associated with Dinophyceae and Chlorophyta hosts, respectively. Given the wide range of viral host species, not all marine viral hosts have been defined. The study was part of a series of studies on the ecological interactions of the viral community in the Kongsfjorden marine ecosystem [19]. In this study, we aimed to (1) compare the spatial distribution between DNA phages and the bacterial community during the early white night (April) and mid-summer (June); (2) analyze changes in phage diversity in relation to changes in the bacterial community and environmental changes; and (3) identify DNA phages with a strong association and co-occurrence with specific bacteria.

2. Materials and Methods

2.1. Metaviromic Analysis of DNA Viruses

The metagenomic data of the DNA viral community were used from our previous study [19]. Detailed methods are described in the supplementary information. The bioinformatics analysis was performed in accordance with the modified protocol described by Kim et al. [19,20]. The Fastq file was trimmed with the CLC Genomics Workbench v. 20.0.4 (Qiagen, Hilden, Germany). Assembly and a quality check of viral contigs were performed using metaSPAdes v. 3.13.0 [21] and Check V (v.1.0.1) [22], respectively. Through the Check V quality check, only viral contigs of >1000 bp were retained. These viral contigs were then sorted as nucleotide identity (ANI) ≥95% using VSEARCH [23,24], and read mapping was performed with BBMap v38.51 [25] using 95% minimum alignment identity. The quality checked viral contigs were subjected to a virus taxonomy analysis using a Basic Local Alignment Search Tool (BLASTn) analysis using the Microbial Genomic Module in the CLC Genomics Workbench with the Viral RefSeq database (Release 221) of the National Center for Biotechnology Information (NCBI). Bacteriophages were sorted into dsDNA virus taxa using the modified CUTAXAC program (Customized Taxonomic Profiling Assignment Coding) developed by Kim et al. [20].

2.2. Metabarcoding Analyses of Bacteria

A free-living bacterial metabarcoding analysis was performed according to our previously reported methods [26]. Detailed methods are described in the supplementary information. All samples were analyzed in duplicate. To remove large-sized inorganic and organic particles, each 500 mL seawater sample was pre-filtered using a 3 μm polycarbonate filter (TSTP04700; Millipore Sigma, Bedford, MA, USA). The bacterial communities were harvested from pre-filtered seawater using a 0.2 μm polycarbonate filter (GTTP04700; Millipore Sigma, Bedford, MA, USA). The gDNA was extracted using the DNeasy Powersoil Kit (Qiagen, Hilden, Germany) and diluted to a final concentration of 20 ng μL−1. The first PCR was performed to amplify the V3-V4 hypervariable regions of bacterial 16S rDNA (Table S1), and the amplicons were purified using a QIAquick PCR Purification Kit (Qiagen, Hilden, Germany). The amplicons from the second PCR were purified using a Nextera XT 96 Index Kit V2 (Illumina, San Diego, CA, USA). All amplicons were pooled in equal concentrations and sequenced using the Mi-Seq platform (Illumina, San Diego, CA, USA). To analyze operational taxonomic units (OTUs), the taxonomy of the sequence with the highest similarity was assigned to the sequence read (species and genus levels with >98% and >95% similarity, respectively). CD-HIT-OTU software v.4.6.1 [27] was used for clustering and metagenomic functional information to analyze the OTUs.

2.3. Statistical Analysis
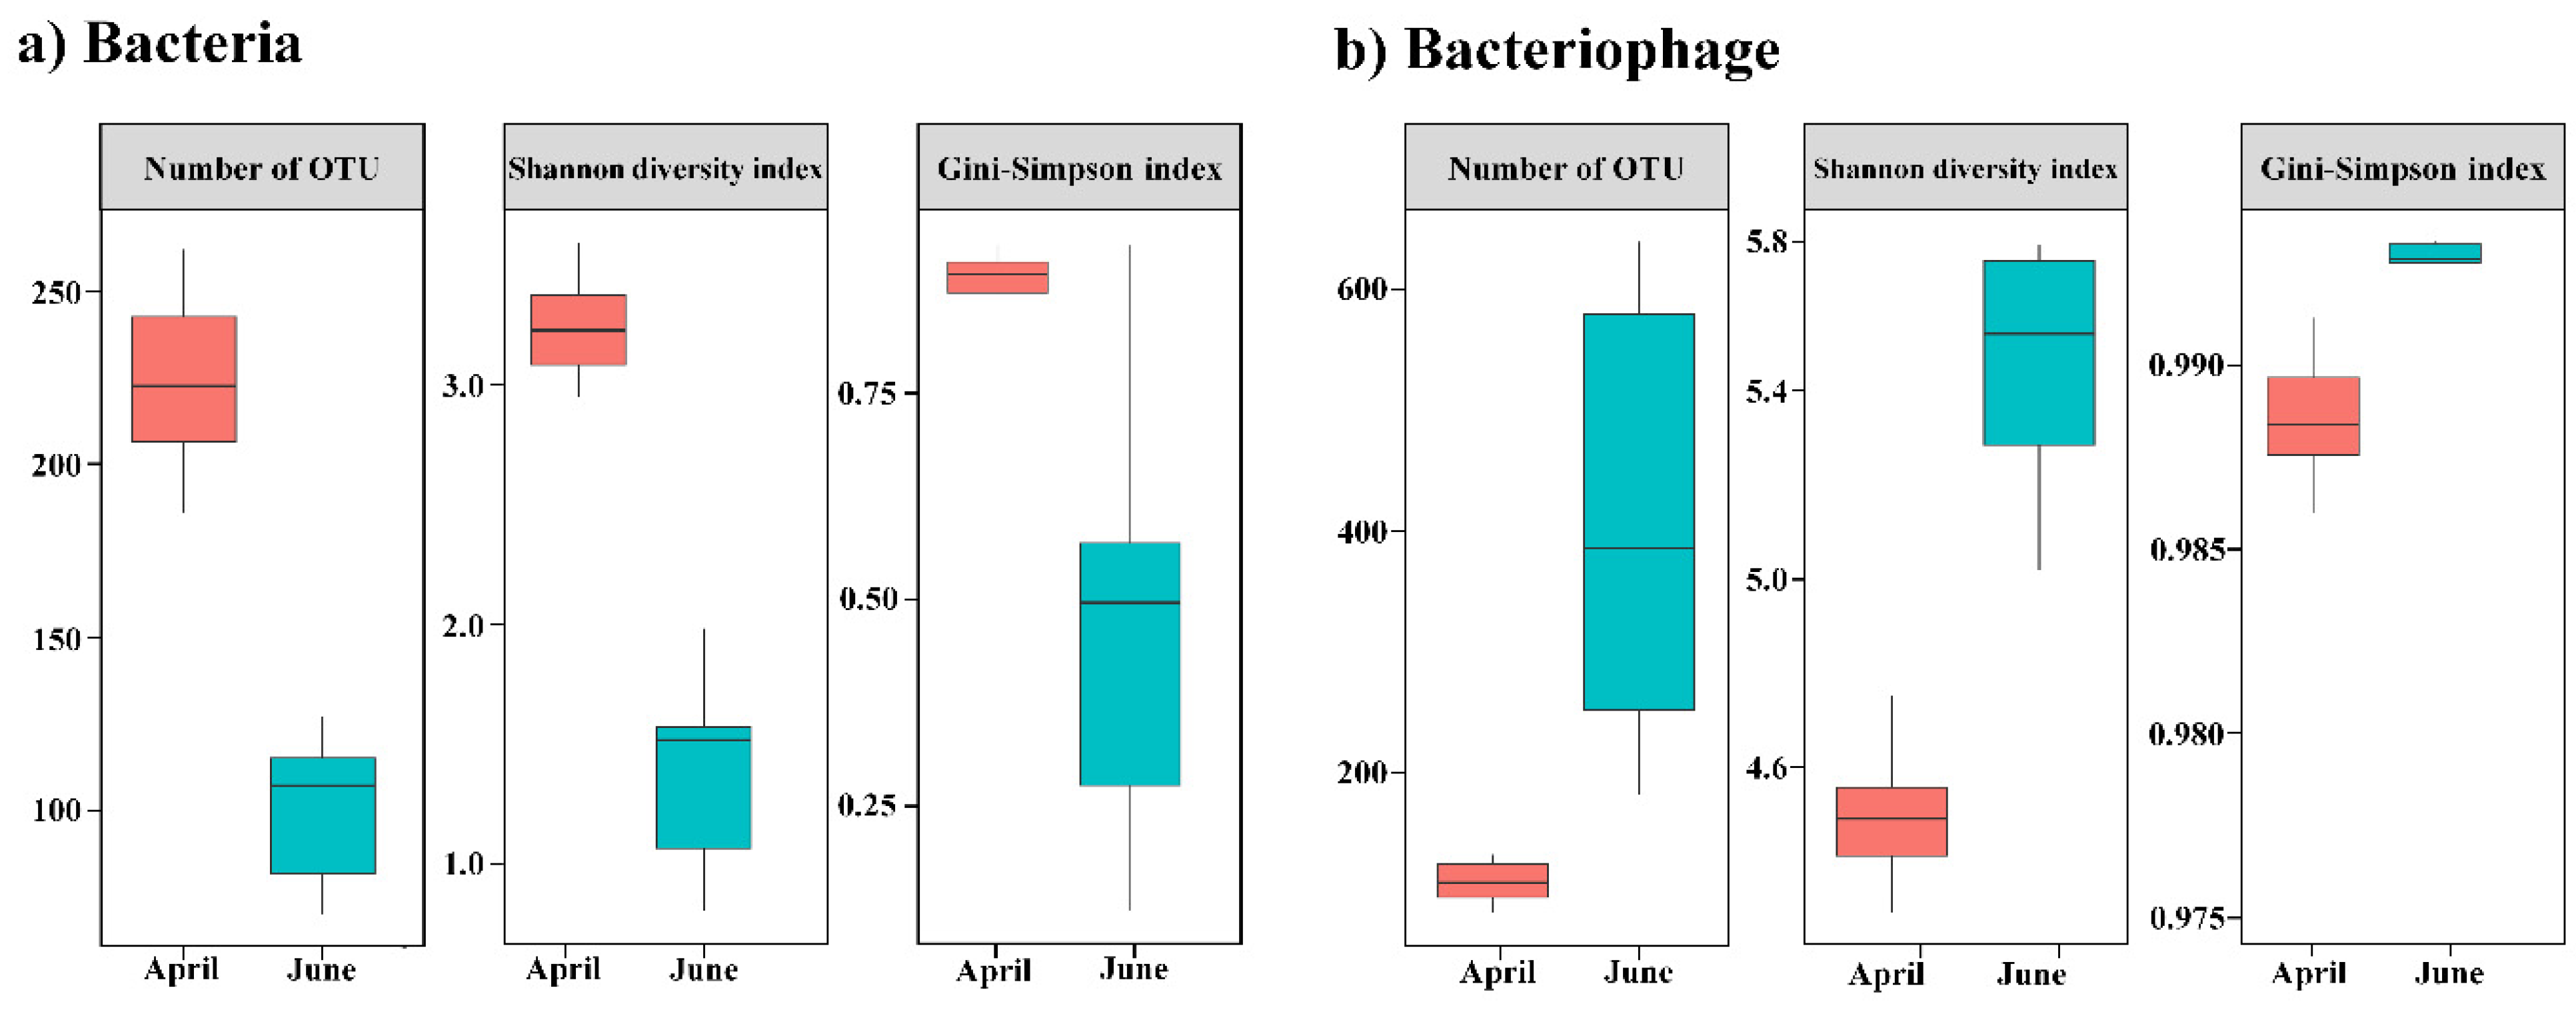
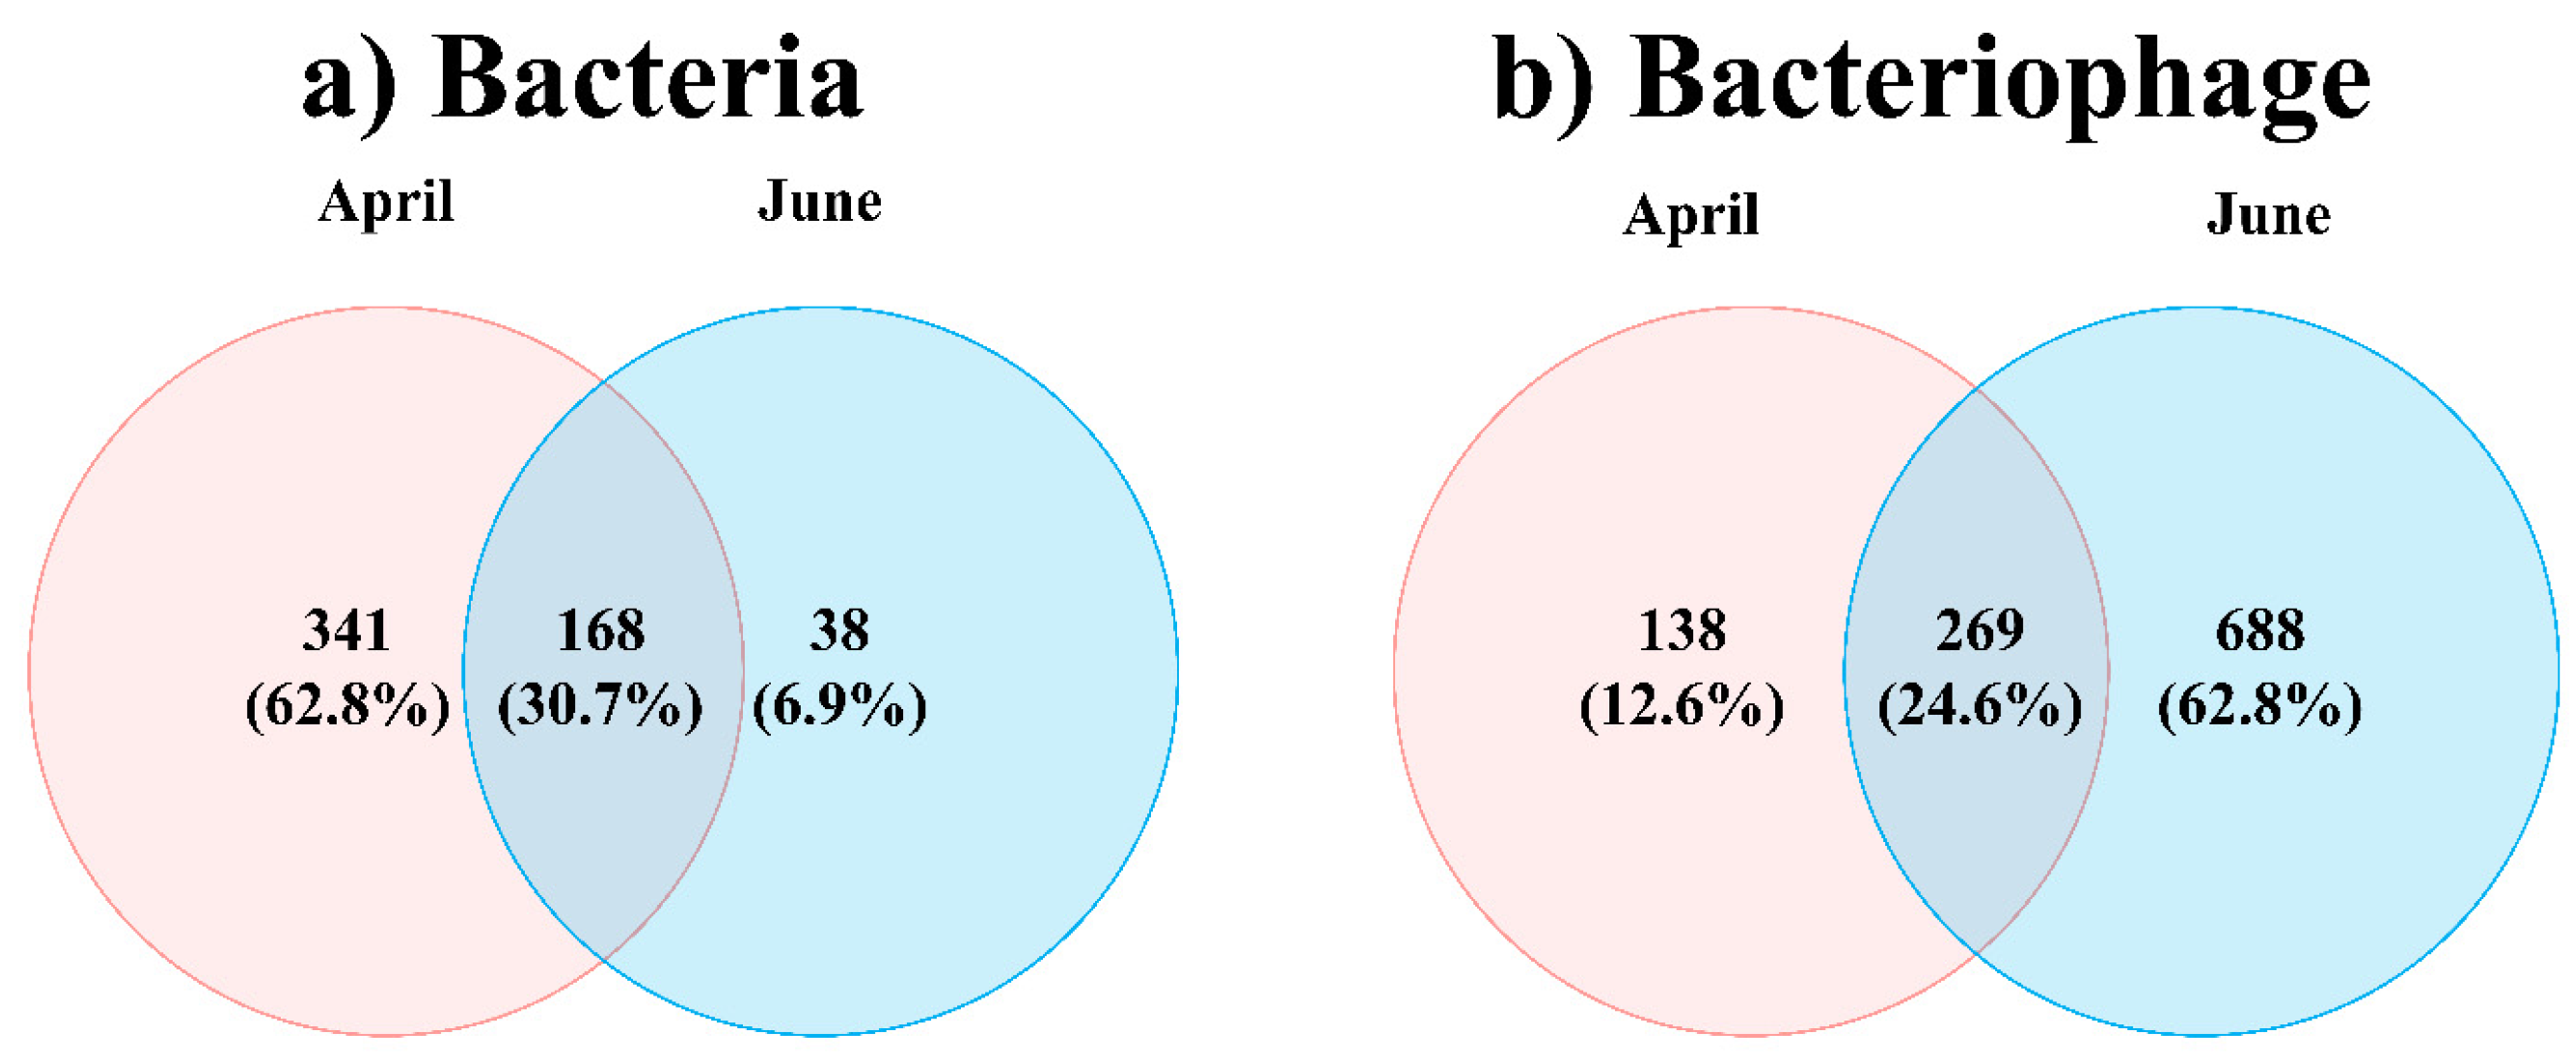
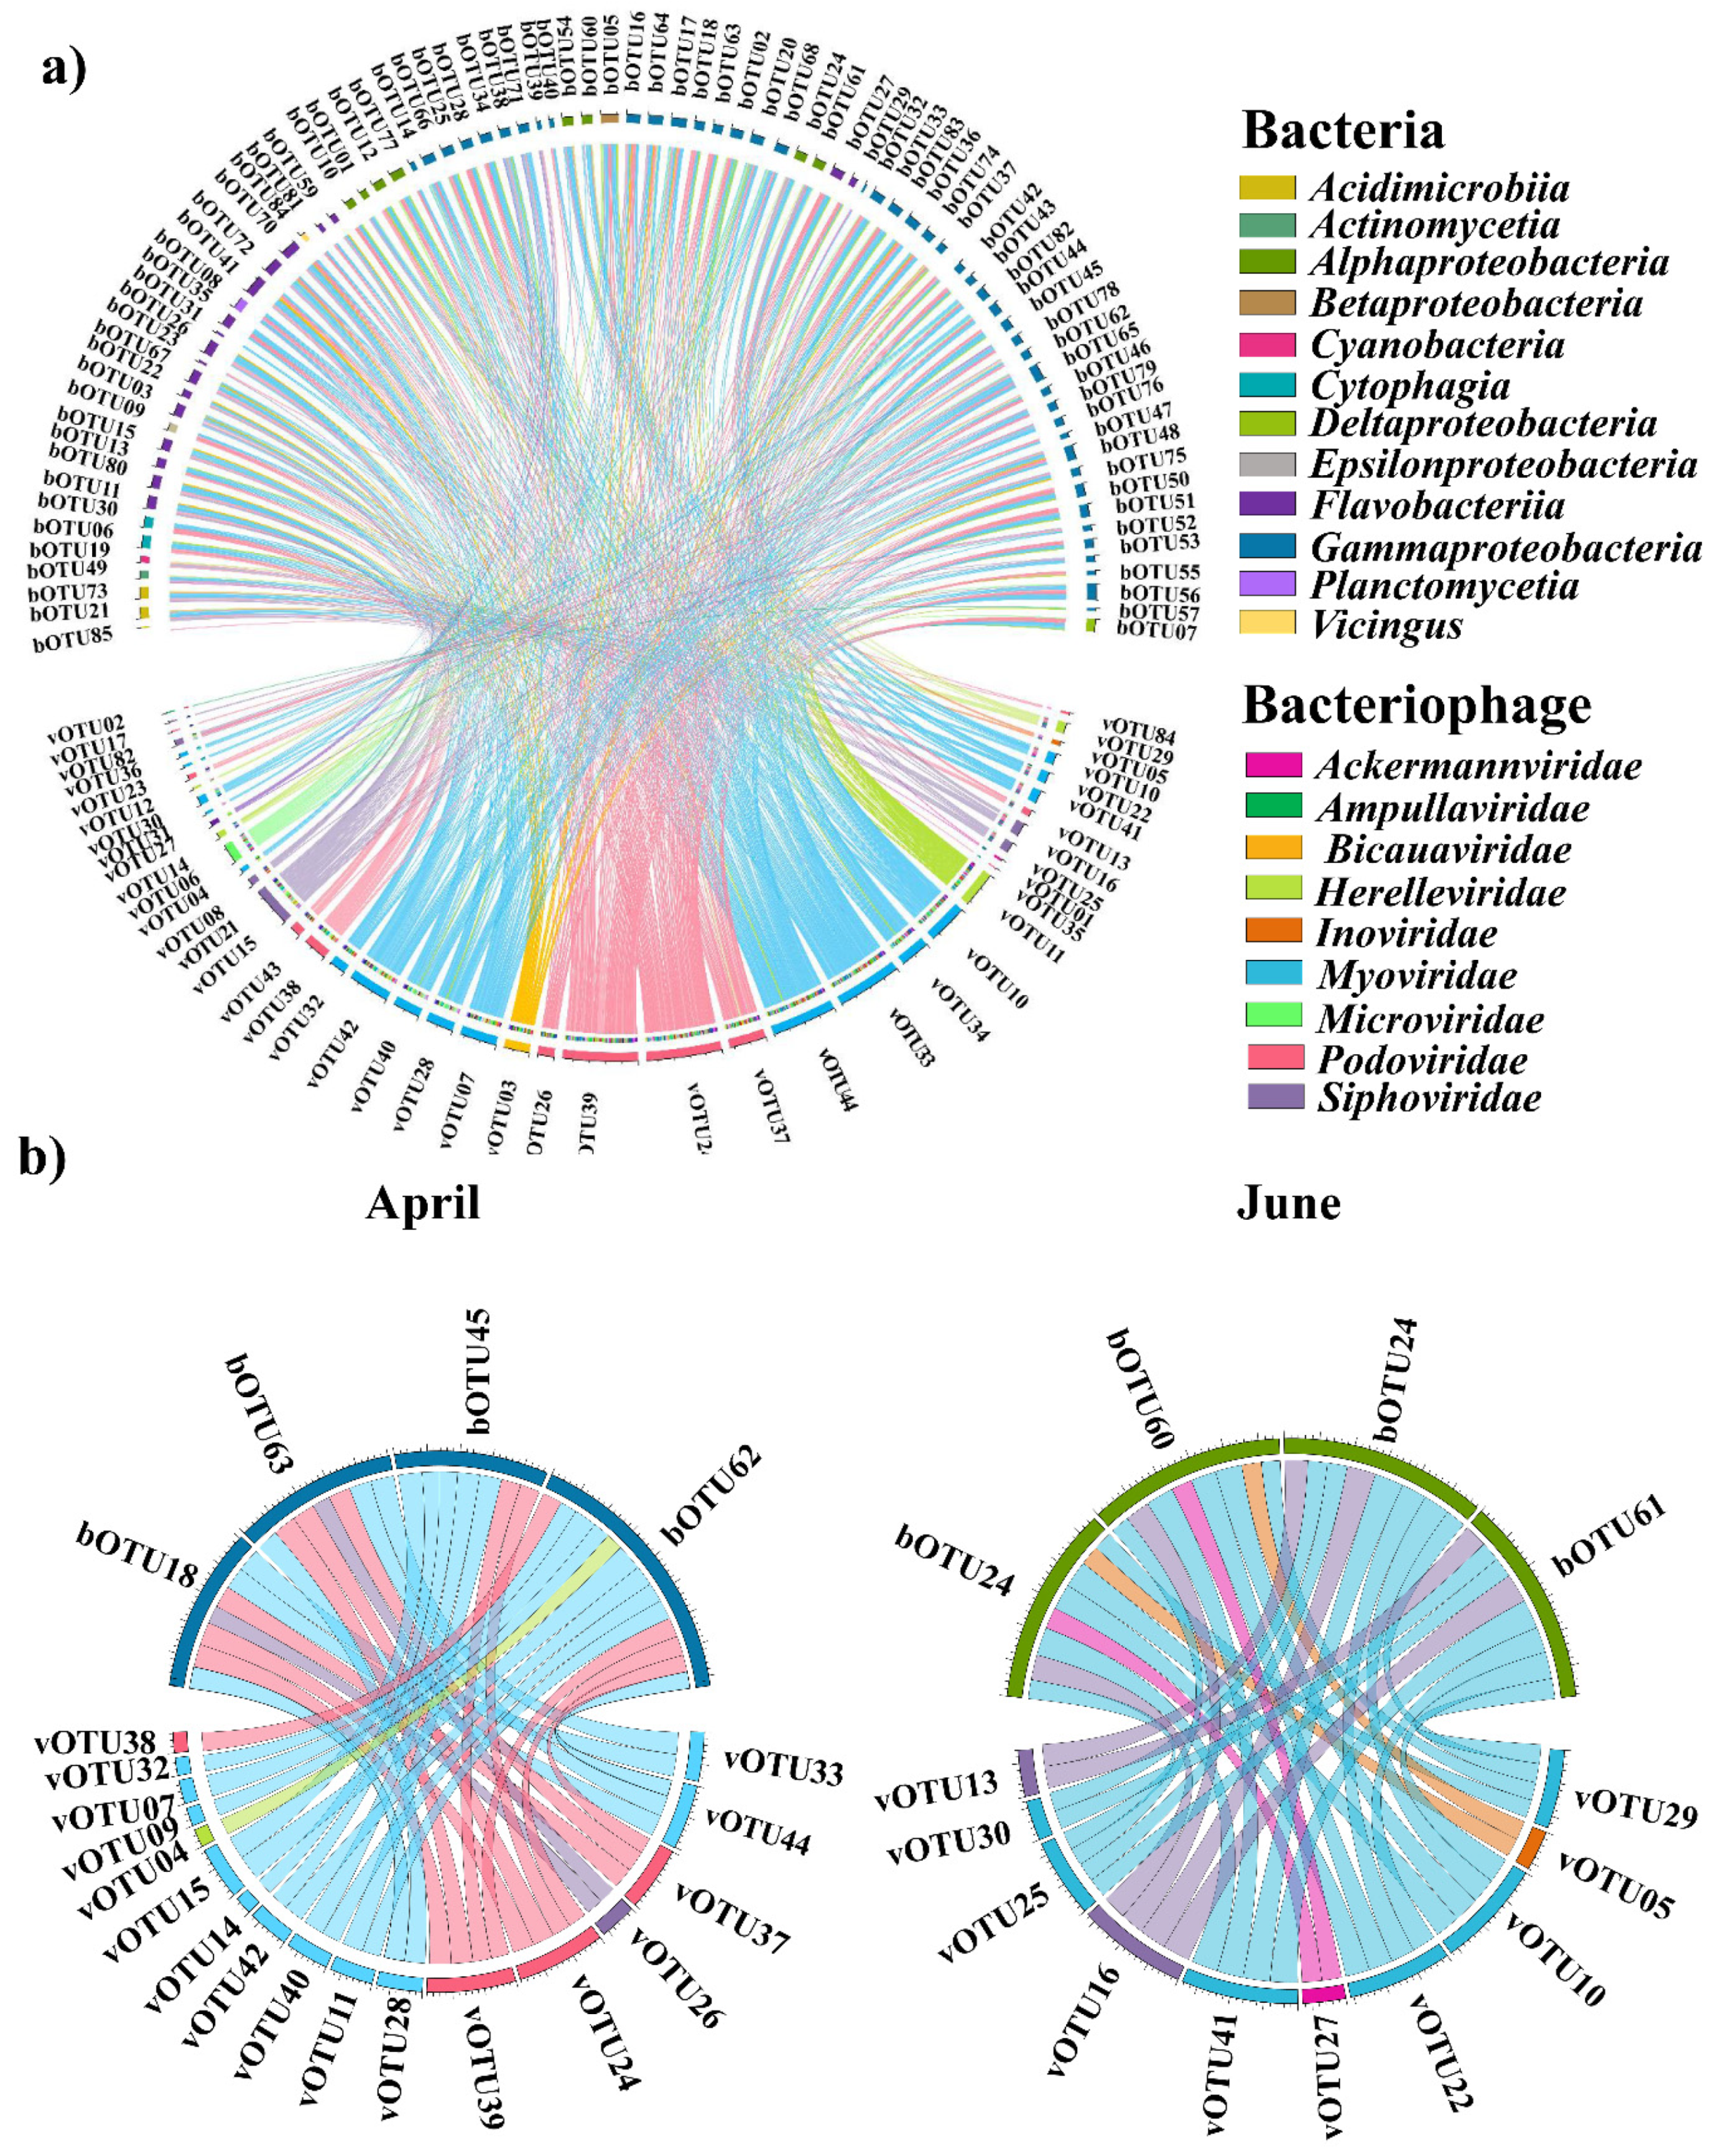
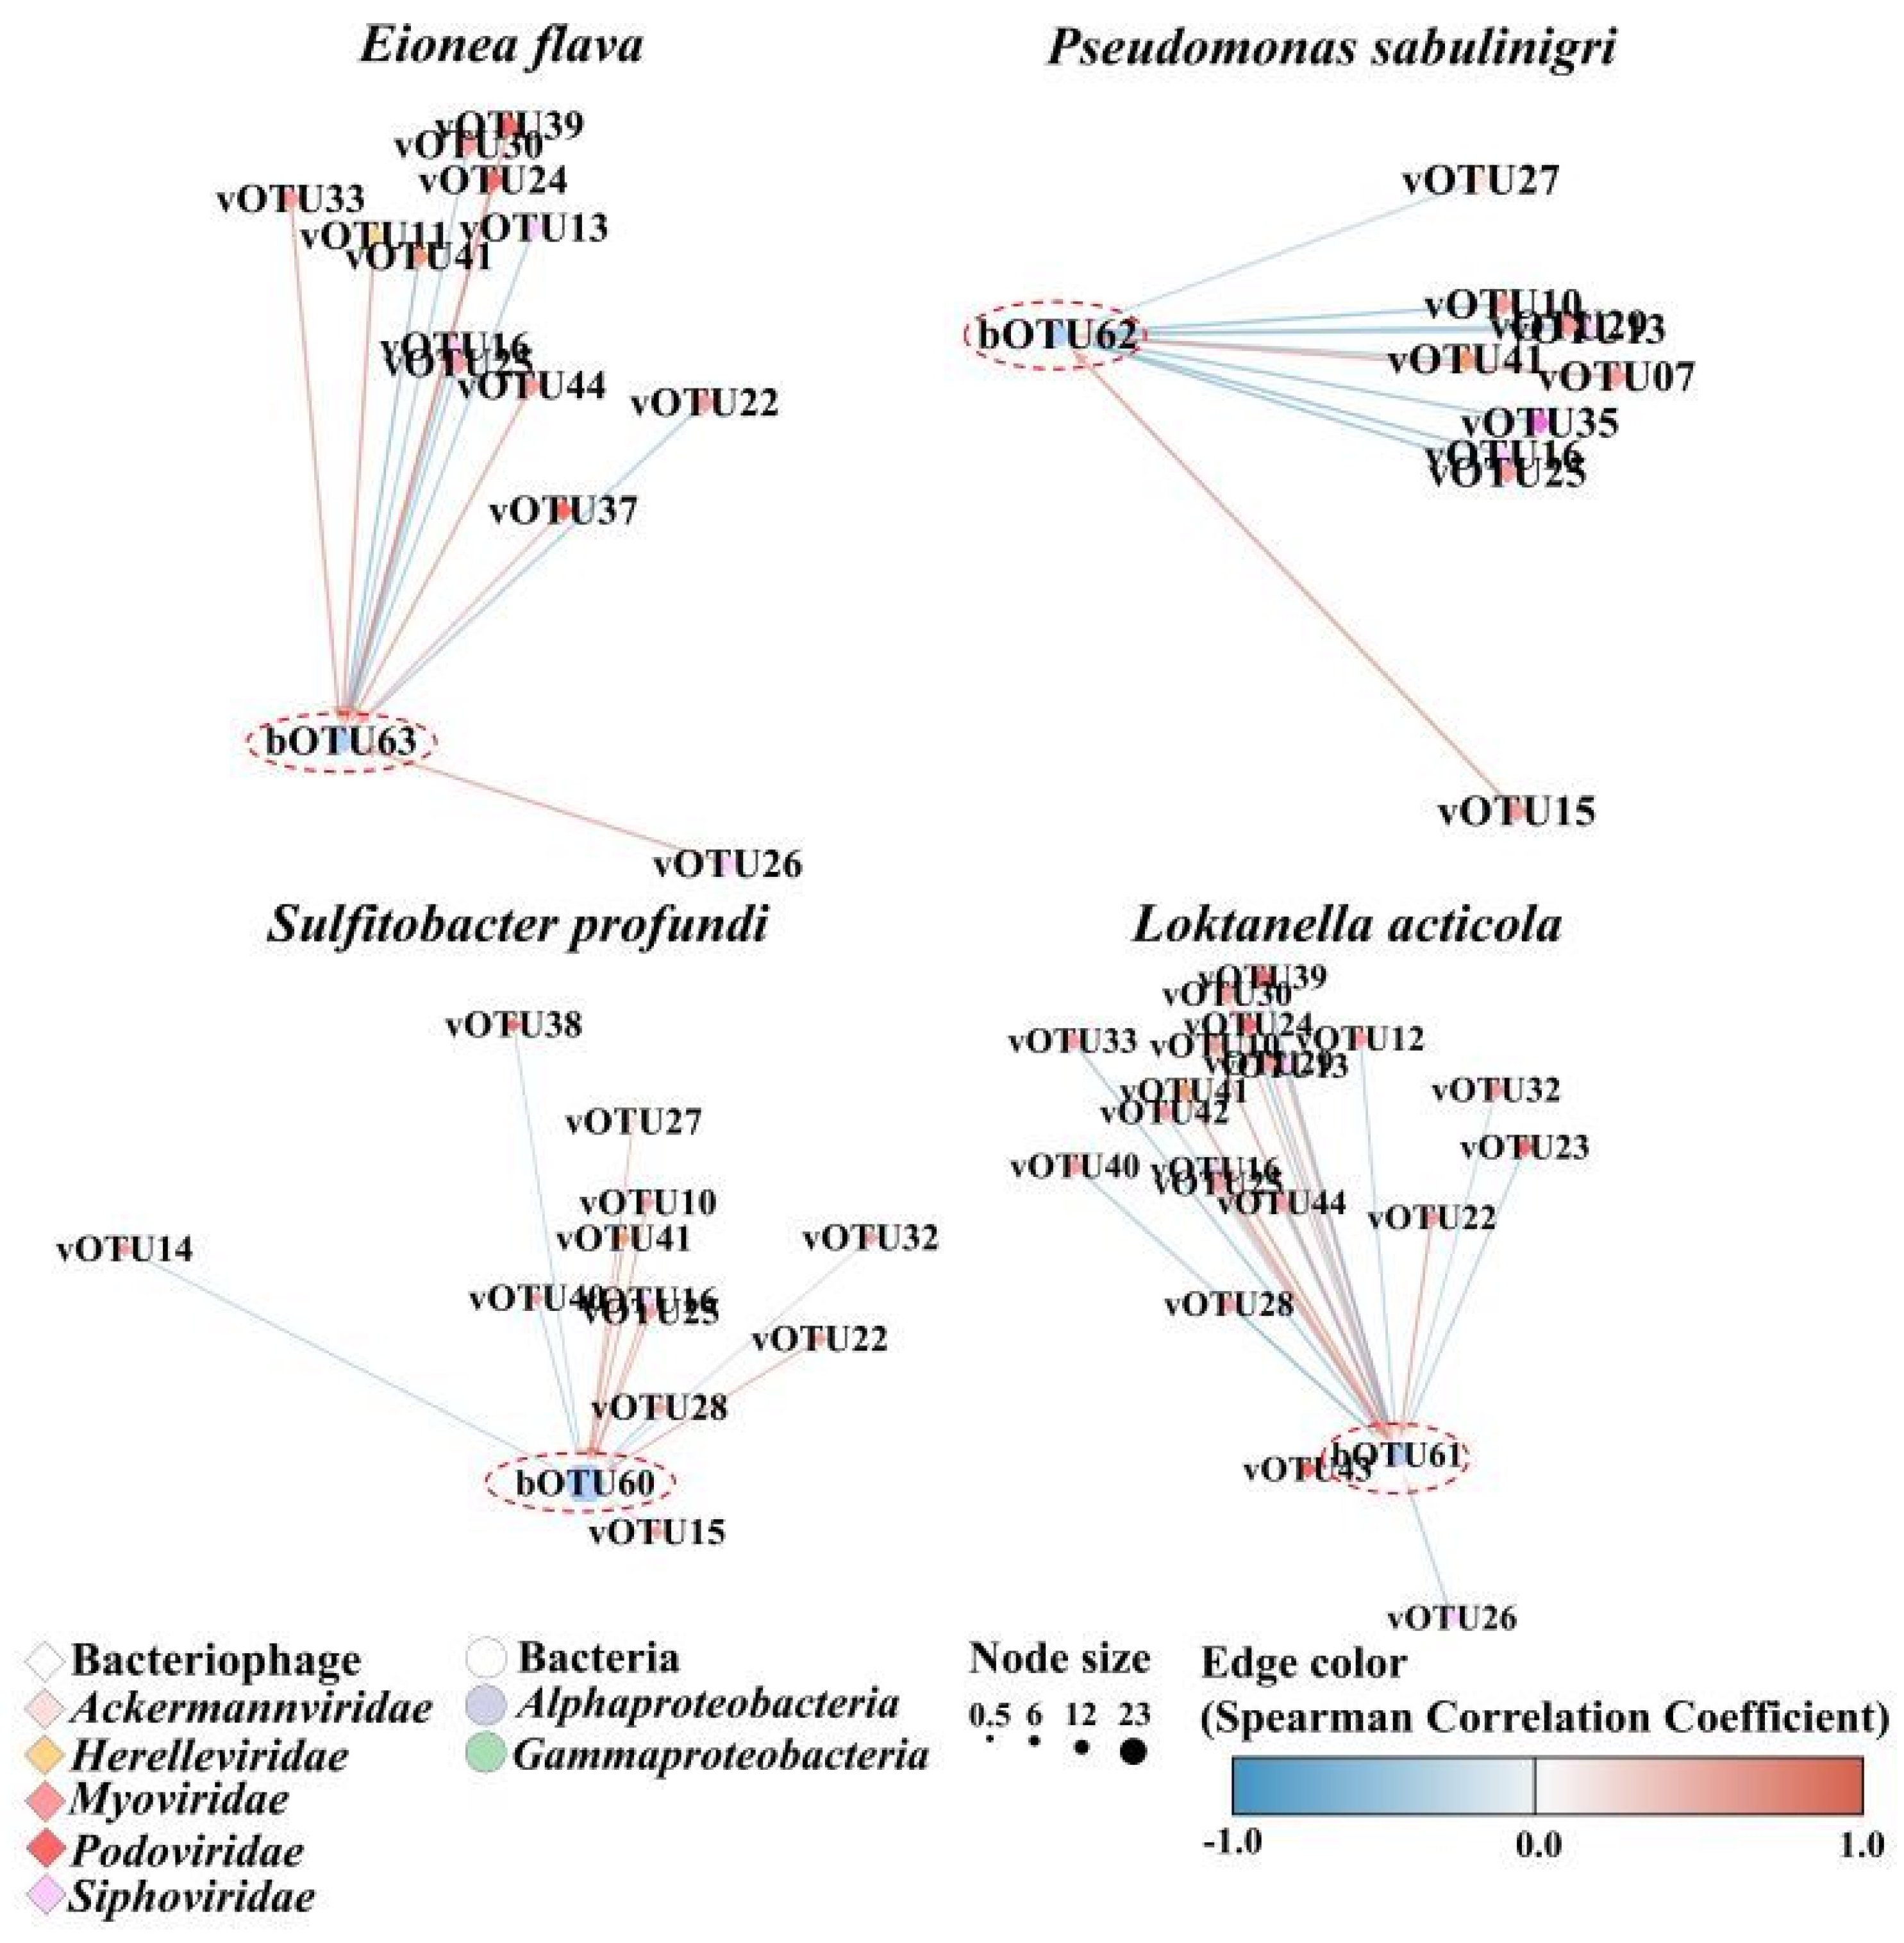
Among samples wherein phages and bacteria displayed a relative abundance of >0.1% in at least one sample, we selected the sample pairs with a significant positive Spearman’s correlation using SPSS v.18 (IBM Corp., Armonk, NY, USA). A circular flow chart was generated after obtaining a significantly positive Spearman correlation coefficient. The heatmap and circular chart were generated using ‘ggplot2’ in R Studio (v. 1.2.5042) [28]. A non-metric multidimensional scaling (NMDS) plots using the ranked similarity matrix were analyzed (PRIMER 6 program, Primer-E Ltd., Plymouth, UK). A clustering analysis (hierarchical agglomerative algorithm) using the group average method was performed on the most abundant OTUs. To analyze whether the sampling time and water depth affected the relationships between bacteriophages and bacteria, we conducted a permutational analysis of variance (PERMANOVA; 999 permutations) using PRIMER software version 7+ [29]. Alpha diversity, including the Simpson and Shannon indices, was analyzed using the vegan package in R Studio [30]. An extended local similarity analysis was performed using common bacteriophage and bacterial taxa [31]. P- and Q-values were calculated using permutation testing to ensure accuracy and estimate the likelihood of false positives. Network visualization was performed, and Spearman correlation coefficients of variables with p- and Q-values < 0.05 were visualized using Cytoscape v3.9.2 [32].

3. Results

The read counts are summarized in Table S2. The bacterial metabarcoding analysis generated 27,368,615 sequences and 61,037 read counts. Among the DNA viruses, 186,216 contigs were assembled, and 5996 contigs of dsDNA viruses (4077 and 1907 associated with bacteriophages and eukaryotic viruses, respectively) were assigned after quality checks using CheckV, read mapping, and taxonomic profiling (Table S3). The alpha diversity of the bacterial community was determined from the read counts based on the total number of OTUs (Figure 1). The observed mean number of OTUs in April and June was 225 and 100, respectively. The diversity indices, including the Shannon and Gini-Simpson indices, were consistent with the changes in the number of OTUs. Compared with the results obtained in April, the alpha diversity was higher in the bacteriophage community and lower in the bacterial community in June. Thus, the diversity of bacteria and bacteriophages exhibited contrasting patterns.
The bacterial community was classified into two groups at 70% similarity using an NMDS analysis (Figure 2). The first group showing a “dominance of Gammaproteobacteria in April”, comprised Gammaproteobacteria (56.5%), Flavobacteriia (19.0%), Alphaproteobacteria (12.8%), and Acidimicrobiia (3.4%) and was evenly distributed at most sampling sites. The other group, showing a “dominance of Alphaproteobacteria in June”, comprised Alphaproteobacteria (86.5%), Flavobacteriia (4.5%), Gammaproteobacteria (3.9%), and Acidimicrobiia (3.1%). Similar to the bacterial groups, the bacteriophage community was classified into two groups, April and June (42% similarity using an NMDS analysis). In April, the predominant families were Myoviridae (42.0%), Siphoviridae (24.0%), and Podoviridae (26.9%), while in June, the predominant families were Myoviridae (42.9%), Siphoviridae (28.0%), and Podoviridae (24.1%).
Consistent with the NMDS results, the PERMANOVA results indicated significant differences by month (p < 0.01) but not by water layer (p > 0.05) (Table 1). Thus, the bacteriophage and bacterial communities were divided based on sampling months but not on the basis of water depths. The Venn diagram in Figure 3 illustrates the overlap between April and June for the total bacteria and bacteriophages. The bacterial OTUs showed a 30.7% overlap (168 taxa) across the two months, whereas 62.8% (341 taxa) and 6.9% (38 taxa) represented unique bacterial OTUs in April and June, respectively. The total bacteriophage OTUs showed a 24.6% overlap (269 taxa) across the two months, whereas 12.6% (138 taxa) and 6.28% (688 taxa) were unique bacteriophage OTUs in April and June, respectively.
In terms of common taxa in the bacterial OTUs (bOTU) with a relative abundance exceeding 0.5% in at least one sample, 75 and 52 taxa in April and June, respectively, were detected as common taxa (Figure 4). In April, 16 common bOTUs accounted for 72.64% of the total abundance; the dominant bOTUs were Eionea flava (bOTU63; 14.3%), Pseudomonas sabulinigri (bOTU62; 12.2%), Lacinutrix algicola (bOTU67; 7.3%), Polaribacter staleyi (bOTU70; 5.3%), and Cognaticolwellia aestuarii (bOTU64; 5.1%). In June, seven common bOTUs, including Sulfitobacter profundi (bOTU60; 51.5%) and Loktanella acticola (bOTU61; 32.4%), accounted for 91.2% of the total abundance. In the bacteriophage community, 58 (April) and 61 (June) virus OTUs (vOTUs) were detected at a relative abundance of over 0.5% in at least one sample (Figure 4). In April, eight bacteriophages, including Puniceispirillum phage HMO-2011 (vOTU39; 7.6%), Nonlabens phage P12024L (vOTU97; 2.5%), and Pelagibacter phage HTVC008M (vOTU63; 2.41%), accounted for 19.1% of the total relative abundance. In June, nine taxa, including Pelagibacter phage HTVC008M (vOTU63; 3.2%), Puniceispirillum phage HMO-2011 (vOTU39; 3.2%), and Nonlabens phage P12024L (vOTU97; 2.7%), accounted for 16.9% of the relative abundance. Thus, Puniceispirillum, Pelagibacter, and Vibrio phages were more abundant in April than in June, whereas Cellulophaga and cyanophages were more abundant in June. In particular, cyanophage, including Synechococcus phage and Prochlorococcus phage, exhibited a rapid increase in their abundance, reaching 22.14% in June, more than twice that observed in April.
Spearman’s correlation analyses were performed to assess the significance of the associations between the common bacteriophages and bacterial OTUs. Based on significant correlation coefficients, 24 bOTUs were correlated with 11 vOTUs (Table S4). The predominant bacterial taxa for each month correlated with certain bacteriophages (Figure 5). Specifically, Eionea flava (bOTU063), the predominant taxon in April, was significantly correlated with two Podoviridae taxa (Puniceispirillum phage HMO-2011, vOTU39, and Pelagibacter phage HTVC019P, vOTU38) and one Myoviridae (Yersinia phage fHe-Yen9-0, vOTU44). Pseudomonas sabulinigri (bOTU062) was significantly correlated with three Myoviridae (Sphingomonas phage PAU, vOTU40; Synechococcus phage S-WAM2, vOTU42; and Yersinia phage fHe-Yen9-04, vOTU44) and two Podoviridae OTUs (Pelagibacter phage HTVC019P, vOTU38, and Puniceispirillum phage HMO-2011, vOTU39). In addition, Sulfitobacter profundi (bOTU060) and Loktanella acticola (bOTU061; the predominant taxa in June) were significantly correlated with Myoviridae (Synechococcus phage S-WAM7, vOTU41).
A network analysis of the common bacterial and bacteriophage taxa revealed specific associated co-occurrences. The network comprised 43 nodes and 80 edges, indicating significant co-occurrence between bacteriophages and bacterial communities (Figure S1, Table S6). The relationship between the predominant bacterial species and bacteriophage species was compared for each month (Figure 6). The common bOTUs correlated with at least one vOTU. Nine phage groups (family levels), Ackermannviridae, Ampullaviridae, Bicaudaviridae, Herelleviridae, Inoviridae, Microviridae, Myoviridae, Siphoviridae, and Podoviridae, co-occurred with eleven bacterial classes, comprising Acidimicrobiia, Actinomycetia, Alphaproteobacteria, Betaproteobacteria, Cyanobacteriota, Cytophagia, Deltaproteobacteria, Epsilonproteobacteria, Flavobacteriia, Gammaproteobacteria, and Planctomycetia. More specifically, the most common bacterial taxa in April, Eionea flava (bOTU63) and Pseudomonas sabulinigri (bOTU62), co-occurred with three Podoviridae OTUs (Pelagibacter phage HTVC010P, vOTU37; Puniceispirillum phage HMO-2011, vOTU39; and Cellulophaga phage phi38:1, vOTU35) and two Myoviridae OTUs (Synechococcus phage S-SSM7, vOTU41, and Yersinia phage fHe-Yen9-04, vOTU44). The most common bacterial taxa in June, Sulfitobacter profundi (bOTU60) and Loktanella acticola (bOTU67), exhibited co-occurrence with four Myoviridae OTUs (Phingomonas phage PAU, vOTU40; Synechococcus phage S-SSM7, vOTU41; Synechococcus phage S-WAM2, vOTU42; and Yersinia phage fHe-Yen9-04, vOTU44) and three Podoviridae (Puniceispirillum phage HMO-2011, vOTU39; Vibrio phage CHOED, vOTU43; and Pelagibacter phage HTVC019P, vOTU38).

4. Discussion

In our previous study [19], we reported environmental changes and co-variance between eukaryotic plankton and nucleocytoplasmic large DNA virus (NCLDV) communities in Kongsfjorden Bay. Specifically, we revealed that NCLDVs affect phytoplankton structure due to rapid environmental changes in early white nights and mid-summer in the sub-Arctic zone [19]. One of the most important results of the present study was the high bacterial diversity in April under extreme environmental conditions, with air and water temperatures being below −15 °C and 0 °C, respectively. Wietz et al. [14] reported an increase in the abundance of diverse bacteria in the Arctic region at the start of April. Consistently, in the present study, bacterial assemblages and diversity increased in June with the rapid increase in light intensity and organic particles such as phytoplankton. This change in bacterial assemblages was also consistent with the results of other previous studies [33,34]. Notably, the diversity of bacteria and bacteriophages exhibited opposing trends. The patterns in bacteriophage communities can be used to ascertain the lysogenic and lytic replication modes; lysogeny favors lower microbial abundance or activity, which is hypothesized as the key mechanism ensuring host survival in oligotrophic habitats and harsh environments with low viral lysis rates [35].
Viral proliferation is suppressed when photosynthesis is not active and the seawater temperature is below 0 °C [19]. When the Arctic marine environment transitions from oligotrophic and lower water temperatures in April to mesotrophic conditions and higher water temperatures in June, viruses change their replication mode from lysogenic to lytic [35,36]. Other than the lysis–lysogeny switch, changes in environmental factors (e.g., temperature and dissolved organic matter) can also directly alter viral and bacterial diversity. This transition results in organic matter release through host cell lysis, leading to increased viral diversity and decreased bacterial diversity in June. Similarly, Yau and Seth-Pasricha [37] reported that viral abundance increases during light intensity owing to changes in the water temperature and salinity of the surface ecosystem of Svalbard. Moreover, the viral shunt pathway [38] diverts microbial biomass from secondary consumers, such as plankton and fish, into the pool of dissolved organic matter that is primarily consumed by heterotrophic bacteria. These findings highlight the unique phenomenon of low viral and high bacterial diversity in extreme environments, such as early white nights and low temperatures, which significantly further our understanding of Arctic ecosystems. Notably, lysogeny was not detected in the Arctic freshwater environment during the summer, suggesting that the lytic and lysogenic pathways are strongly influenced by the environment and season [39]. Furthermore, an annual study on viral life cycles conducted in Antarctica exploring seasonal changes revealed a high incidence of lysogenic viral replication in winter and an opposing pattern in summer. Despite numerous proposed explanations for these observed patterns, a conclusive inference has not been reached [40,41,42,43,44].
In the present study, bacteria belonging to the Alphaproteobacteria, Gammaproteobacteria, and Bacteroidota families comprised a substantial proportion of the Kongsfjorden ecosystem. In a study that was part of the Tara Ocean project, Alphaproteobacteria, Gammaproteobacteria, Bacteroidetes, and Actinobacteria were prevalent in oceans worldwide, including the polar seas [45]. Furthermore, Cao et al. [45] emphasized that the metagenomes obtained from polar seawater were nearly undetectable in temperate seawater, as the environmental conditions of the Arctic and Antarctic are more similar to each other than to the temperate regions.
We noted that Eionea flava (family: Cellvibrionaceae) dominated in April, and to the best of our knowledge, this is the first study to report that Eionea nigra is dominant in the northern polar region. The genus Eionea, first described by Urios et al. [46], produces ice-binding proteins that aid survival in freezing environments by inhibiting ice recrystallization [47]. Thus, Eionea may grow well under the extremely low temperature conditions prevalent in April. In the present study, Sulfitobacter profundi (Alphaproteobacteria) was the predominant bacterial taxon detected in June. Although this bacterium is globally distributed [48] and frequently appears in polar regions [49], Nguyen et al. [50] reported that Sulfitobacter profundi is an opportunistic species and can also occur in oligotrophic environments. Moreover, Sulfitobacter pontiacus (Alphaproteobacteria) and Pseudoalteromonas sp. (Gammaproteobacteria) are frequently observed in the polar regions during phytoplankton blooms [15,51,52]. The abundance of Aureococcus anophagefferens, a nanosized eukaryotic phytoplankton, rapidly increased in June 2018 [19]. Similar to the A. anophagefferens bloom, the abundance of Sulfitobacter significantly increased in June, possibly attributed to phytoplankton bloom-induced nutrient release (either due to phytoplankton death or the production of extracellular polymeric substances released by phytoplankton cells) [53,54].
In the present study, Myoviridae, Podoviridae, Siphoviridae, and Herelleviridae were the most common bacteriophages identified, consistent with their common occurrence in oceans [55]. The presence of Pelagibacter phage HTVC008M and Puniceispirillum phage HMO-2011, including the Pelagibacter phage group, suggests that the SAR11 bacterial group is abundant in the Arctic Ocean [56]. The co-occurrence of various phages with various bacteria indicates that phages may be capable of infecting multiple host bacterial ecotypes in warm- and cold-water environments [57]. In this study, Puniceispirillum phage HMO-2011, Pelagibacter phage HTBC010P, Puniceispirillum phage HMO-2011, Vibrio phage CHOED, and Roseobacter virus SIO1 were strongly associated with Sulfitobacter and Loktanella. Qin et al. [58] reported that Puniceispirillum phage HMO-2011 is a major regulator of bacterial infection within the SAR11 (Pelagibacterales) clade. In addition, Du et al. [59] reported the worldwide distribution of Pelagibacter phage HTBC010P. Closely related Pelagiphages are postulated to have evolved to exhibit great adaptability to a wider range of hosts [60]. In the present study, the relative abundance of cyanobacteria-killing phages, such as cyanophages, Prochlorococcus phage, and Synechococcus phage, increased in June, concomitant with an increase in cyanobacterial abundance. Cyanophages are abundant in ocean ecosystems and play a crucial role in biogeochemical cycles, including growth regulation and the photosynthesis of cyanobacteria [61]. Specifically, Prochlorococcus phage and Synechococcus phage increase markedly in polar regions [56,62,63].

5. Conclusions

The present study highlights the changes in diversity between bacteriophages and bacterial communities during April and June, correlating with environmental changes in the sub-Arctic Kongsfjorden marine ecosystem. Myoviridae, Podoviridae, and Siphoviridae accounted for a considerable proportion of bacteriophages, while Eionea flava, Pseudomonas sabulinigri, Sulfitobacter profundi, and Loktanella acticola dominated the bacterial community. Specifically, our findings revealed differences in the community compositions of bacteria and bacteriophages, which were also correlated, suggesting that bacteriophages control the host community via their replication mode. We also identified the co-occurrence of various bacteriophages with a ubiquitous host and a correlation between single bacteriophages and multiple hosts. In June, the number of cyanophages increased rapidly, coinciding with an increase in the number of cyanobacteria. Moreover, rapid changes in the environment during the polar night and white night were associated with rapid changes in eukaryotic plankton in the Arctic ecosystem, subsequent bacterial changes, and, ultimately, the bacterial control mechanism of bacteriophages. Therefore, our results not only provide new insights into the important ecological relationships between the bacteriophage and bacterial communities, but they are particularly relevant given the expected impact of bacteriophages on the sub-Arctic Kongsfjorden ecosystem and will be useful in better understanding this ecosystem.

Supplementary Materials

The following supporting information can be downloaded at https://www.mdpi.com/article/10.3390/microorganisms12020276/s1, Figure S1. Network analysis showing the co-occurrence between common bacteriophages and bacteria, represented as blue and beige nodes, respectively; Table S1. Experimental information for the amplification of the V3–V4 regions in 16s rDNA; Table S2. Summary of the total bases, reads, GC (%), Q20 (%), and Q30 (%) obtained from metagenomic next-generation sequencing analysis; Table S3. Information on quality check of metavirome contigs using Check V; Table S4. Information on species names of operational taxonomic unit numbers and significant correlation coefficients between bacterial and bacteriophage lineages; Table S5. Classification information on the operational taxonomic units (OTUs) of common bacteria and bacteriophages; and Table S6. The significant results of local similarity correlations (LSA) in the network analysis in Figure 6 [19,20,21,22,23,24,25,26,27,64,65,66,67,68].

Author Contributions

K.E.K. and H.M.J. Conceptualization, S.W.J., T.-K.L. and S.-Y.H.; methodology and software, S.W.J., T.-K.L., D.K. and S.-Y.H.; formal analysis, Y.J.K.; investigation, S.W.J., T.-K.L., K.E.K., H.M.J., D.K. and S.-Y.H.; writing—original draft, S.W.J., K.E.K. and S.-Y.H.; writing—review and editing, S.W.J., K.E.K., H.M.J. and S.-Y.H.; Supervision, S.W.J.; project administration, S.-Y.H.; funding acquisition, S.W.J., T.-K.L. and S.-Y.H. All authors have read and agreed to the published version of the manuscript.

Funding

This research was supported by the Korea Institute of Marine Science and Technology Promotion (KIMST), funded by the Ministry of Oceans and Fisheries, Korea (20210466), and by the National Research Foundation (NRF), funded by the Ministry of Science and ICT (NRF2020R1A2C2005970).

Data Availability Statement

The datasets presented in this study can be found in online repositories. The names of the repository/repositories and accession numbers can be found below. https://www.ncbi.nlm.nih.gov/genbank/, PRJNA848283 and PRJNA999943 (accessed on 12 June 2022 and 29 July 2023, respectively).

Acknowledgments

The genomic DNA samples were stored in the Library of Marine Samples of the Korea Institute of Ocean Science and Technology (KIOST), Republic of Korea.

Conflicts of Interest

The authors declare no conflicts of interest.

References

  1. Suttle, C.A. Marine Viruses—Major Players in the Global Ecosystem. Nat. Rev. Microbiol. 2007, 5, 801–812. [Google Scholar] [CrossRef]
  2. Edwards, R.A.; Rohwer, F. Viral Metagenomics. Nat. Rev. Microbiol. 2005, 3, 504–510. [Google Scholar] [CrossRef]
  3. Wommack, K.E.; Colwell, R.R. Virioplankton: Viruses in Aquatic Ecosystems. Microbiol. Mol. Biol. Rev. 2000, 64, 69–114. [Google Scholar] [CrossRef]
  4. Suttle, C.A. Viruses in the Sea. Nature 2005, 437, 356–361. [Google Scholar] [CrossRef]
  5. Zhu, Y.; Shang, J.; Peng, C.; Sun, Y. Phage Family Classification under Caudoviricetes: A Review of Current Tools Using the Latest ICTV Classification Framework. Front. Microbiol. 2022, 13, 1032186. [Google Scholar] [CrossRef]
  6. Jung, S.W.; Kim, K.E.; Kim, H.J.; Lee, T.K. Metavirome Profiling and Dynamics of the DNA Viral Community in Seawater in Chuuk State, Federated States Of Micronesia. Viruses 2023, 15, 1293. [Google Scholar] [CrossRef]
  7. Endo, H.; Blanc-Mathieu, R.; Li, Y.; Salazar, G.; Henry, N.; Labadie, K.; de Vargas, C.; Sullivan, M.B.; Bowler, C.; Wincker, P.; et al. Biogeography of Marine Giant Viruses Reveals Their Interplay with Eukaryotes and Ecological Functions. Nat. Ecol. Evol. 2020, 4, 1639–1649. [Google Scholar] [CrossRef]
  8. Weinbauer, M.G.; Rassoulzadegan, F. Are Viruses Driving Microbial Diversification and Diversity? Environ. Microbiol. 2004, 6, 1–11. [Google Scholar] [CrossRef]
  9. Weinbauer, M.G. Ecology of Prokaryotic Viruses. FEMS Microbiol. Rev. 2004, 28, 127–181. [Google Scholar] [CrossRef]
  10. Ptashne, M. Lambda’s Switch: Lessons from a Module Swap. Curr. Biol. 2006, 16, R459–R462. [Google Scholar] [CrossRef]
  11. Buchan, A.; LeCleir, G.R.; Gulvik, C.A.; González, J.M. Master Recyclers: Features and Functions of Bacteria Associated with Phytoplankton Blooms. Nat. Rev. Microbiol. 2014, 12, 686–698. [Google Scholar] [CrossRef]
  12. Worden, A.Z.; Follows, M.J.; Giovannoni, S.J.; Wilken, S.; Zimmerman, A.E.; Keeling, P.J. Environmental Science. Rethinking the Marine Carbon Cycle: Factoring in the Multifarious Lifestyles of Microbes. Science 2015, 347, 1257594. [Google Scholar] [CrossRef]
  13. Romaniuk, K.; Styczynski, M.; Decewicz, P.; Buraczewska, O.; Uhrynowski, W.; Fondi, M.; Wolosiewicz, M.; Szuplewska, M.; Dziewit, L. Diversity and Horizontal Transfer of Antarctic Pseudomonas spp. Plasmids. Genes 2019, 10, 850. [Google Scholar] [CrossRef]
  14. Wietz, M.; Bienhold, C.; Metfies, K.; Torres-Valdés, S.; von Appen, W.J.; Salter, I.; Boetius, A. The Polar Night Shift: Seasonal Dynamics and Drivers of Arctic Ocean Microbiomes Revealed by Autonomous Sampling. ISME Commun. 2021, 1, 76. [Google Scholar] [CrossRef]
  15. Liu, Z.; Jiang, W.; Kim, C.; Peng, X.; Fan, C.; Wu, Y.; Xie, Z.; Peng, F. A Pseudomonas Lysogenic Bacteriophage Crossing the Antarctic and Arctic, Representing a New Genus of Autographiviridae. Int. J. Mol. Sci. 2023, 24, 7662. [Google Scholar] [CrossRef]
  16. Venger, M.P.; Kopylov, A.I.; Zabotkina, E.A.; Makarevich, P.R. The Influence of Viruses on Bacterioplankton of the Offshore and Coastal Parts of the Barents Sea. Russ. J. Mar. Biol. 2016, 42, 26–35. [Google Scholar] [CrossRef]
  17. Shirokolobova, T.I.; Zhichkin, A.P.; Venger, M.P.; Vodopyanova, V.V.; Moiseev, D.V. Bacteria and Viruses of the Ice-Free Aquatic Area of the Barents Sea at the Beginning of Polar Night. Dokl. Biol. Sci. 2016, 469, 182–186. [Google Scholar] [CrossRef]
  18. Payne, C.M.; Roesler, C.S. Characterizing the Influence of Atlantic Water Intrusion on Water Mass Formation and Phytoplankton Distribution in Kongsfjorden, Svalbard. Contin. Shelf Res. 2019, 191, 104005. [Google Scholar] [CrossRef]
  19. Kim, K.E.; Joo, H.M.; Lee, T.K.; Kim, H.J.; Kim, Y.J.; Kim, B.K.; Ha, S.Y.; Jung, S.W. Covariance of Marine Nucleocytoplasmic Large DNA Viruses with Eukaryotic Plankton Communities in the sub-Arctic Kongsfjorden Ecosystem: A Metagenomic Analysis of Marine Microbial Ecosystems. Microorganisms 2023, 11, 169. [Google Scholar] [CrossRef]
  20. Kim, K.E.; Jung, S.W.; Park, J.S.; Kim, H.-J.; Lee, C.; Ha, S.-Y.; Lee, T.-K. Optimized Metavirome Analysis of Marine DNA Virus Communities for Taxonomic Profiling. Ocean Sci. J. 2022, 57, 259–268. [Google Scholar] [CrossRef]
  21. Nurk, S.; Meleshko, D.; Korobeynikov, A.; Pevzner, P.A. metaSPAdes: A New Versatile Metagenomic Assembler. Genome Res. 2017, 27, 824–834. [Google Scholar] [CrossRef]
  22. Nayfach, S.; Camargo, A.P.; Schulz, F.; Eloe-Fadrosh, E.; Roux, S.; Kyrpides, N.C. CheckV Assesses the Quality and Completeness of Metagenome-Assembled Viral Genomes. Nat. Biotechnol. 2021, 39, 578–585. [Google Scholar] [CrossRef]
  23. Rognes, T.; Flouri, T.; Nichols, B.; Quince, C.; Mahé, F. VSEARCH: A Versatile Open Source Tool for Metagenomics. PeerJ 2016, 4, e2584. [Google Scholar] [CrossRef]
  24. Roux, S.; Adriaenssens, E.M.; Dutilh, B.E.; Koonin, E.V.; Kropinski, A.M.; Krupovic, M.; Kuhn, J.H.; Lavigne, R.; Brister, J.R.; Varsani, A.; et al. Minimum Information About an Uncultivated Virus Genome (MIUViG). Nat. Biotechnol. 2019, 37, 29–37. [Google Scholar] [CrossRef]
  25. Bushnell, B. BBMap: A Fast, Accurate, Splice-Aware Aligner; No. LBNL-7065E; Ernest Orlando Lawrence Berkeley National Laboratory: Berkeley, CA, USA, 2014; Available online: https://sourceforge.net/projects/bbmap (accessed on 22 October 2023).
  26. Jeong, G.; Kim, H.J.; Kim, K.E.; Kim, Y.J.; Lee, T.K.; Shim, W.J.; Jung, S.W. Selective Attachment of Prokaryotes and Emergence of Potentially Pathogenic Prokaryotes on Four Plastic Surfaces: Adhesion Study in a Natural Marine Environment. Mar. Pollut. Bull. 2023, 193, 115149. [Google Scholar] [CrossRef]
  27. Li, R.W.; Connor, E.E.; Li, C.; Baldwin Vi, R.L.; Sparks, M.E. Characterization of the Rumen Microbiota of Pre-ruminant Calves Using Metagenomic Tools. Environ. Microbiol. 2012, 14, 129–139. [Google Scholar] [CrossRef]
  28. Wickham, H. ggplot2. WIREs Comput. Stats. 2011, 3, 180–185. [Google Scholar] [CrossRef]
  29. Clarke, K.; Gorley, R. Getting Started with PRIMER v7; PRIMER-E; Plymouth Marine Laboratory: Plymouth, UK, 2015; Available online: https://www.primer-e.com/our-software/primer-version-7 (accessed on 22 March 2023).
  30. Oksanen, J.; Blanchet, F.G.; Friendly, M.; Kindt, R.; Legendre, P.; McGlinn, D.; Minchin, P.R.; O’Hara, R.; Simpson, G.L.; Solymos, P. Package ‘Vegan’. Community Ecology Package, Version 2. 2019. Available online: https://cran.r-project.org/package=vegan (accessed on 15 October 2023).
  31. Xia, L.C.; Steele, J.A.; Cram, J.A.; Cardon, Z.G.; Simmons, S.L.; Vallino, J.J.; Fuhrman, J.A.; Sun, F. Extended Local Similarity Analysis (eLSA) of Microbial Community and Other Time Series Data with Replicates. BMC Syst. Biol. 2011, 5 (Suppl. S2), S15. [Google Scholar] [CrossRef]
  32. Shannon, P.; Markiel, A.; Ozier, O.; Baliga, N.S.; Wang, J.T.; Ramage, D.; Amin, N.; Schwikowski, B.; Ideker, T. Cytoscape: A Software Environment for Integrated Models of Biomolecular Interaction Networks. Genome Res. 2003, 13, 2498–2504. [Google Scholar] [CrossRef]
  33. Gilbert, J.A.; Steele, J.A.; Caporaso, J.G.; Steinbrück, L.; Reeder, J.; Temperton, B.; Huse, S.; McHardy, A.C.; Knight, R.; Joint, I.; et al. Defining Seasonal Marine Microbial Community Dynamics. ISME J. 2012, 6, 298–308. [Google Scholar] [CrossRef]
  34. Ghiglione, J.F.; Murray, A.E. Pronounced Summer to Winter Differences and Higher Wintertime Richness in Coastal Antarctic Marine Bacterioplankton. Environ. Microbiol. 2012, 14, 617–629. [Google Scholar] [CrossRef]
  35. Chen, X.; Wei, W.; Wang, J.; Li, H.; Sun, J.; Ma, R.; Jiao, N.; Zhang, R. Tide Driven Microbial Dynamics Through Virus-Host Interactions in the Estuarine Ecosystem. Water Res. 2019, 160, 118–129. [Google Scholar] [CrossRef]
  36. Jiao, N.; Herndl, G.J.; Hansell, D.A.; Benner, R.; Kattner, G.; Wilhelm, S.W.; Kirchman, D.L.; Weinbauer, M.G.; Luo, T.; Chen, F.; et al. Microbial Production of Recalcitrant Dissolved Organic Matter: Long-Term Carbon Storage in the Global Ocean. Nat. Rev. Microbiol. 2010, 8, 593–599. [Google Scholar] [CrossRef]
  37. Yau, S.; Seth-Pasricha, M. Viruses of Polar Aquatic Environments. Viruses 2019, 11, 189. [Google Scholar] [CrossRef]
  38. Azam, F.; Malfatti, F. Microbial structuring of marine ecosystems. Nat. Rev. Microbiol. 2007, 5, 782–791. [Google Scholar] [CrossRef]
  39. Young, R. Phage Lysis: Three Steps, Three Choices, One Outcome. J. Microbiol. 2014, 52, 243–258. [Google Scholar] [CrossRef]
  40. Weitz, J.S.; Beckett, S.J.; Brum, J.R.; Cael, B.B.; Dushoff, J. Lysis, Lysogeny and Virus–Microbe Ratios. Nature 2017, 549, E1–E3. [Google Scholar] [CrossRef]
  41. Howard-Varona, C.; Hargreaves, K.R.; Abedon, S.T.; Sullivan, M.B. Lysogeny in Nature: Mechanisms, Impact and Ecology of Temperate Phages. ISME J. 2017, 11, 1511–1520. [Google Scholar] [CrossRef]
  42. Williamson, S.J.; Houchin, L.A.; McDaniel, L.; Paul, J.H. Seasonal Variation in Lysogeny as Depicted by Prophage Induction in Tampa Bay, Florida. Appl. Environ. Microbiol. 2002, 68, 4307–4314. [Google Scholar] [CrossRef]
  43. Payet, J.P.; Suttle, C.A. To Kill or Not to Kill: The Balance Between Lytic and Lysogenic Viral Infection Is Driven by Trophic Status. Limnol. Oceanogr. 2013, 58, 465–474. [Google Scholar] [CrossRef]
  44. Brum, J.R.; Hurwitz, B.L.; Schofield, O.; Ducklow, H.W.; Sullivan, M.B. Seasonal Time Bombs: Dominant Temperate Viruses Affect Southern Ocean Microbial Dynamics. ISME J. 2016, 10, 437–449. [Google Scholar] [CrossRef]
  45. Cao, S.; Zhang, W.; Ding, W.; Wang, M.; Fan, S.; Yang, B.; McMinn, A.; Wang, M.; Xie, B.B.; Qin, Q.L.; et al. Structure and Function of the Arctic and Antarctic Marine Microbiota as Revealed by Metagenomics. Microbiome 2020, 8, 47. [Google Scholar] [CrossRef]
  46. Urios, L.; Intertaglia, L.; Lesongeur, F.; Lebaron, P. Eionea nigra gen. nov., sp. nov., a Gammaproteobacterium from the Mediterranean Sea. Int. J. Syst. Evol. Microbiol. 2011, 61, 1677–1681. [Google Scholar] [CrossRef]
  47. Winder, J.C.; Boulton, W.; Salamov, A.; Eggers, S.L.; Metfies, K.; Moulton, V.; Mock, T. Genetic and Structural Diversity of Prokaryotic Ice-Binding Proteins from the Central Arctic Ocean. Genes 2023, 14, 363. [Google Scholar] [CrossRef]
  48. Barak-Gavish, N.; Frada, M.J.; Ku, C.; Lee, P.A.; DiTullio, G.R.; Malitsky, S.; Aharoni, A.; Green, S.J.; Rotkopf, R.; Kartvelishvily, E.; et al. Bacterial Virulence Against an Oceanic Bloom-Forming Phytoplankter Is Mediated by Algal DMSP. Sci. Adv. 2018, 4, eaau5716. [Google Scholar] [CrossRef]
  49. Aalto, N.J.; Schweitzer, H.D.; Krsmanovic, S.; Campbell, K.; Bernstein, H.C. Diversity and Selection of Surface Marine Microbiomes in the Atlantic-Influenced Arctic. Front. Microbiol. 2022, 13, 892634. [Google Scholar] [CrossRef]
  50. Nguyen, H.T.; Lee, Y.M.; Hong, J.K.; Hong, S.; Chen, M.; Hur, J. Climate Warming-Driven Changes in the Flux of Dissolved Organic Matter and Its Effects on Bacterial Communities in the Arctic Ocean: A Review. Front. Mar. Sci. 2022, 9, 968583. [Google Scholar] [CrossRef]
  51. Sorokin, D.Y. Sulfitobacter pontiacus gen. nov., sp. nov.—A New Heterotrophic Bacterium from the Black Sea, Specialized on Sulfite Oxidation. Microbiology 1995, 64, 295–305. [Google Scholar]
  52. Kim, J.G.; Park, S.J.; Quan, Z.X.; Jung, M.Y.; Cha, I.T.; Kim, S.J.; Kim, K.H.; Yang, E.J.; Kim, Y.N.; Lee, S.H.; et al. Unveiling Abundance and Distribution of Planktonic Bacteria and Archaea in a Polynya in Amundsen Sea, Antarctica. Environ. Microbiol. 2014, 16, 1566–1578. [Google Scholar] [CrossRef]
  53. West, N.J.; Obernosterer, I.; Zemb, O.; Lebaron, P. Major Differences of Bacterial Diversity and Activity Inside and Outside of a Natural Iron-Fertilized Phytoplankton Bloom in the Southern Ocean. Environ. Microbiol. 2008, 10, 738–756. [Google Scholar] [CrossRef]
  54. Teeling, H.; Fuchs, B.M.; Becher, D.; Klockow, C.; Gardebrecht, A.; Bennke, C.M.; Kassabgy, M.; Huang, S.; Mann, A.J.; Waldmann, J.; et al. Substrate-Controlled Succession of Marine Bacterioplankton Populations Induced by a Phytoplankton Bloom. Science 2012, 336, 608–611. [Google Scholar] [CrossRef] [PubMed]
  55. Mahmoud, H.; Jose, L. Phage and Nucleocytoplasmic Large Viral Sequences Dominate Coral Viromes from the Arabian Gulf. Front. Microbiol. 2017, 8, 2063. [Google Scholar] [CrossRef]
  56. Gao, C.; Xia, J.; Zhou, X.; Liang, Y.; Jiang, Y.; Wang, M.; Shao, H.; Shi, X.; Guo, C.; He, H.; et al. Viral Characteristics of the Warm Atlantic and Cold Arctic Water Masses in the Nordic Seas. Appl. Environ. Microbiol. 2021, 87, e0116021. [Google Scholar] [CrossRef] [PubMed]
  57. Buchholz, H.H.; Bolaños, L.M.; Bell, A.G.; Michelsen, M.L.; Allen, M.J.; Temperton, B. Novel Pelagiphage Isolate Polarivirus Skadi Is a Polar Specialist That Dominates SAR11-Associated Bacteriophage Communities at High Latitudes. ISME J. 2023, 17, 1660–1670. [Google Scholar] [CrossRef]
  58. Qin, F.; Du, S.; Zhang, Z.; Ying, H.; Wu, Y.; Zhao, G.; Yang, M.; Zhao, Y. Newly Identified HMO-2011-type Phages Reveal Genomic Diversity and Biogeographic Distributions of This Marine Viral Group. ISME J. 2022, 16, 1363–1375. [Google Scholar] [CrossRef] [PubMed]
  59. Du, S.; Qin, F.; Zhang, Z.; Tian, Z.; Yang, M.; Liu, X.; Zhao, G.; Xia, Q.; Zhao, Y. Genomic Diversity, Life Strategies and Ecology of Marine HTVC010P-Type Pelagiphages. Microb. Genom. 2021, 7, 000596. [Google Scholar] [CrossRef] [PubMed]
  60. Williams, K.P. Integration Sites for Genetic Elements in Prokaryotic tRNA and tmRNA Genes: Sublocation Preference of Integrase Subfamilies. Nucleic Acids Res. 2002, 30, 866–875. [Google Scholar] [CrossRef] [PubMed]
  61. Jiang, X.; Ha, C.; Lee, S.; Kwon, J.; Cho, H.; Gorham, T.; Lee, J. Characterization of Cyanophages in Lake Erie: Interaction Mechanisms and Structural Damage of Toxic Cyanobacteria. Toxins 2019, 11, 444. [Google Scholar] [CrossRef]
  62. Šabacká, M.; Elster, J. Response of Cyanobacteria and Algae from Antarctic Wetland Habitats to Freezing and Desiccation Stress. Polar Biol. 2006, 30, 31–37. [Google Scholar] [CrossRef]
  63. Gong, Z.; Liang, Y.; Wang, M.; Jiang, Y.; Yang, Q.; Xia, J.; Zhou, X.; You, S.; Gao, C.; Wang, J.; et al. Viral Diversity and Its Relationship with Environmental Factors at the Surface and Deep Sea of Prydz Bay, Antarctica. Front. Microbiol. 2018, 9, 2981. [Google Scholar] [CrossRef]
  64. John, S.G.; Mendez, C.B.; Deng, L.; Poulos, B.; Kauffman, A.K.; Kern, S.; Brum, J.; Polz, M.F.; Boyle, E.A.; Sullivan, M.B. A Simple and Efficient Method for Concentration of Ocean Viruses by Chemical Flocculation. Environ. Microbiol. Rep. 2011, 3, 195–202. [Google Scholar] [CrossRef]
  65. Andrews, S. FastQC: A Quality Control Tool for High Throughput Sequence Data. In Babraham Bioinformatics; Babraham Institute: Cambridge, UK, 2010; Available online: http://www.bioinformatics.babraham.ac.uk/projects/fastqc (accessed on 22 October 2023).
  66. Magoč, T.; Salzberg, S.L. FLASH: Fast Length Adjustment of Short Reads to Improve Genome Assemblies. Bioinformatics 2011, 27, 2957–2963. [Google Scholar] [CrossRef] [PubMed]
  67. Altschul, S.F.; Gish, W.; Miller, W.; Myers, E.W.; Lipman, D.J. Basic Local Alignment Search Tool. J. Mol. Biol. 1990, 215, 403–410. [Google Scholar] [CrossRef] [PubMed]
  68. Schloss, P.D.; Westcott, S.L.; Ryabin, T.; Hall, J.R.; Hartmann, M.; Hollister, E.B.; Lesniewski, R.A.; Oakley, B.B.; Parks, D.H.; Robinson, C.J.; et al. Introducing Mothur: Open-Source, Platform-Independent, Community-Supported Software for Describing and Comparing Microbial Communities. Appl. Environ. Microbiol. 2009, 75, 7537–7541. [Google Scholar] [CrossRef] [PubMed]
Figure 1. Changes in alpha diversity indices for the bacteriophage and bacterial communities in the sub-Arctic Kongsfjorden between April and June 2018. (a) Common bacteria and (b) bacteriophage operational taxonomic units (OTUs). Box plots showing alpha diversity based on the number of OTUs, Shannon diversity, and Gini–Simpson index.
Microorganisms 12 00276 g001
Figure 2. Non-metric multidimensional scaling (NMDS) plots for (a) the bacteria and (b) bacteriophage communities (b). Based on the results of a Bray–Curtis dissimilarity analysis, the NMDS plots were generated. All data were normalized by the square roots. The pie charts indicate the high-ranking taxonomic distribution at the family level for bacteriophage and phylum or class level for the bacterial community.
Microorganisms 12 00276 g002
Figure 3. Changes in total bacterial (a) and bacteriophage (b) operational taxonomic units (OTUs) in the sub-Arctic Kongsfjorden in April and June 2018. Venn diagram showing the shared and unique total bacterial (a) and bacteriophage OTUs (b).
Microorganisms 12 00276 g003
Figure 4. Changes in bacterial (a) and bacteriophage (b) operational taxonomic units (OTUs) in the sub-Arctic Kongsfjorden in April and June 2018. (a) Common bacteria OTUs (at mean relative abundances > 0.5%). (b) Common bacteriophage OTUs (at a mean relative abundance > 0.5%). The heatmap displays the square root normalized data.
Microorganisms 12 00276 g004
Figure 5. Associations between the bacterial and bacteriophage communities in the Sub-Arctic Kongsfjorden. (a) Correlation with total data. (b) Correlation with each month. Significant pairwise comparisons of the Spearman correlation coefficients between bacteria and bacteriophages. Detailed information (species names of operational taxonomic unit (OTU) numbers and correlation coefficients) are listed in Table S5.
Microorganisms 12 00276 g005
Figure 6. Network analysis showing co-occurrence between dominant bacteriophages and bacterial community across April and June 2018 represented as blue and beige nodes, respectively. Lines between nodes indicate positive (red) and negative (blue) Spearman’s coefficient of correlations (SCC) > |0.3| (two-sided pseudo-p-value < 0.05) between the abundances of linked taxa. Detailed information (species names of operational taxonomic unit (OTU) numbers and correlation coefficients) are listed in Table S5.
Microorganisms 12 00276 g006
Table 1. Changes in community composition by season and water layer based on PERMANOVA analysis.
GroupSourceTp (perm)
BacteriaSurface × Bottom0.2250.452
April × June5.2880.002
BacteriophageSurface × Bottom0.8690.605
April × June2.5980.002
Disclaimer/Publisher’s Note: The statements, opinions and data contained in all publications are solely those of the individual author(s) and contributor(s) and not of MDPI and/or the editor(s). MDPI and/or the editor(s) disclaim responsibility for any injury to people or property resulting from any ideas, methods, instructions or products referred to in the content.

