
Alterations in Gut Microbiota Composition Are Associated with Changes in Emotional Distress in Children with Obstructive Sleep Apnea

 , , ,
, , ,  , , , ,
Abstract
1. Introduction
2. Materials and Methods
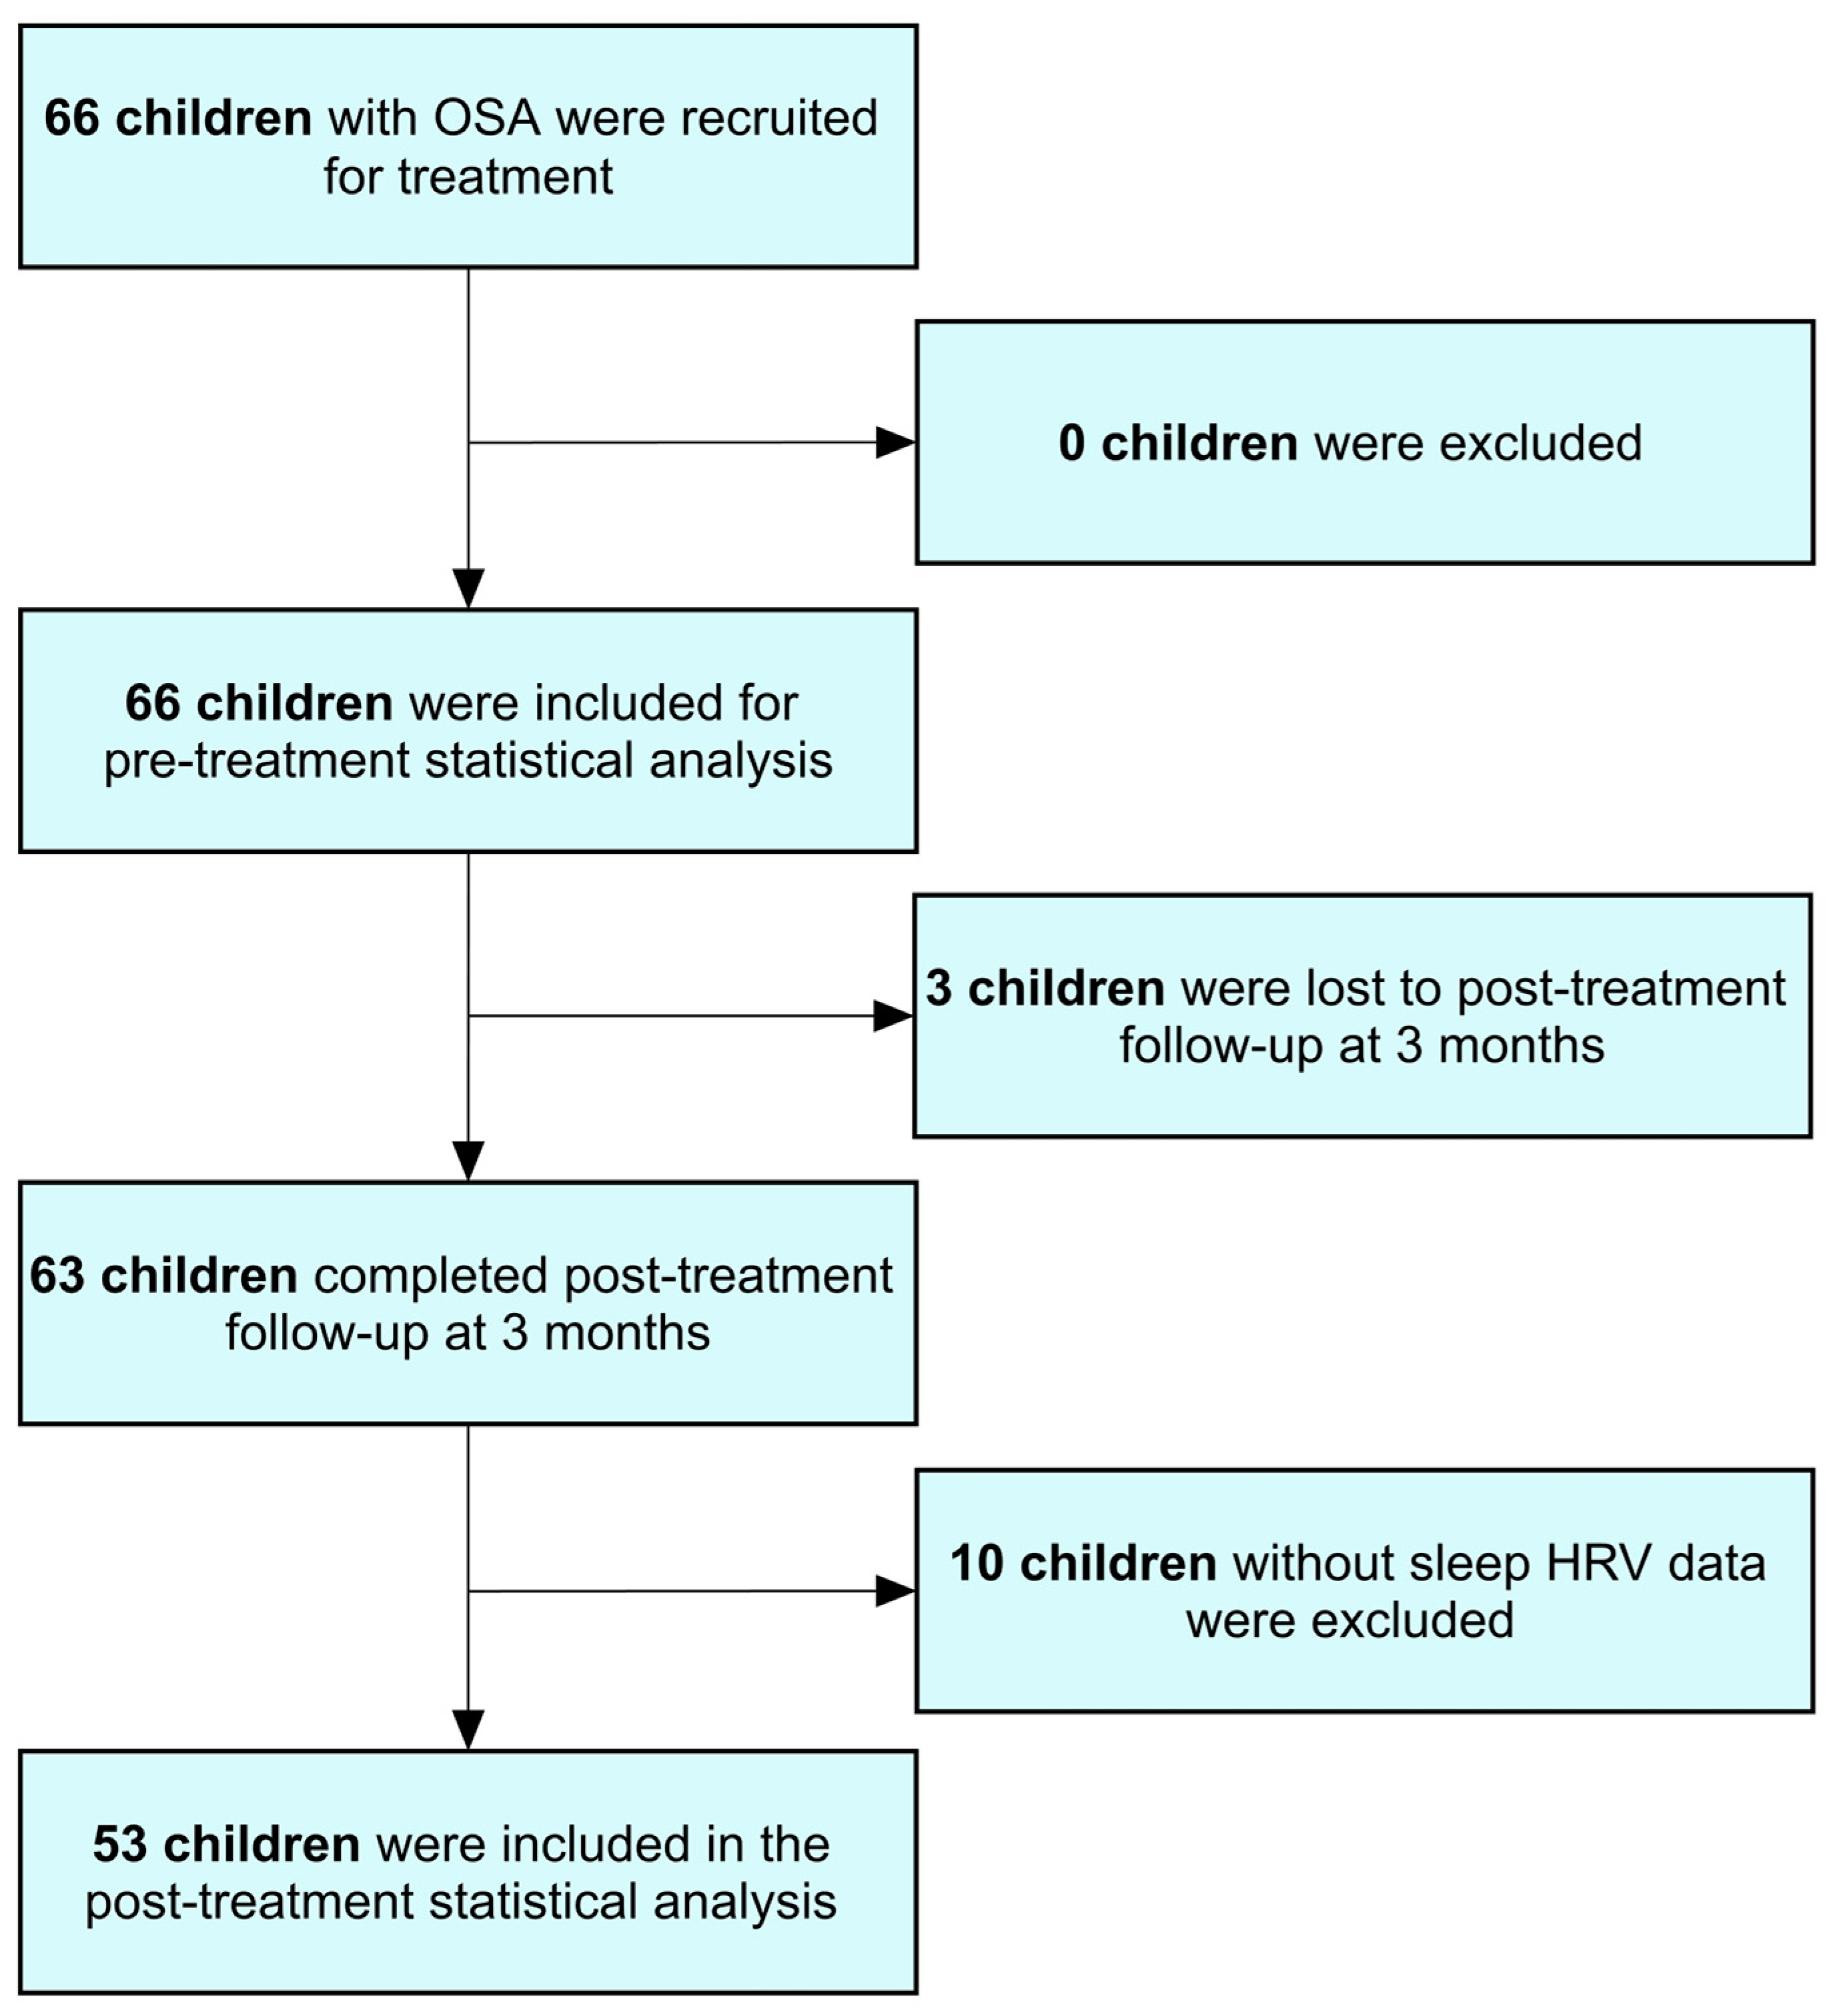
2.1. Study Population
2.2. Endpoint Analysis
2.3. Polysomnography
2.4. OSA-18 Questionnaire
2.5. Gut Microbiome
2.6. Short Food Frequency Questionnaire
2.7. Sleep HRV Measurement
2.8. Sample Size Estimation
2.9. Statistical Analysis
3. Results
3.1. Patient Characteristics
3.2. Differences in Patient Characteristics Between High and Low ED Groups
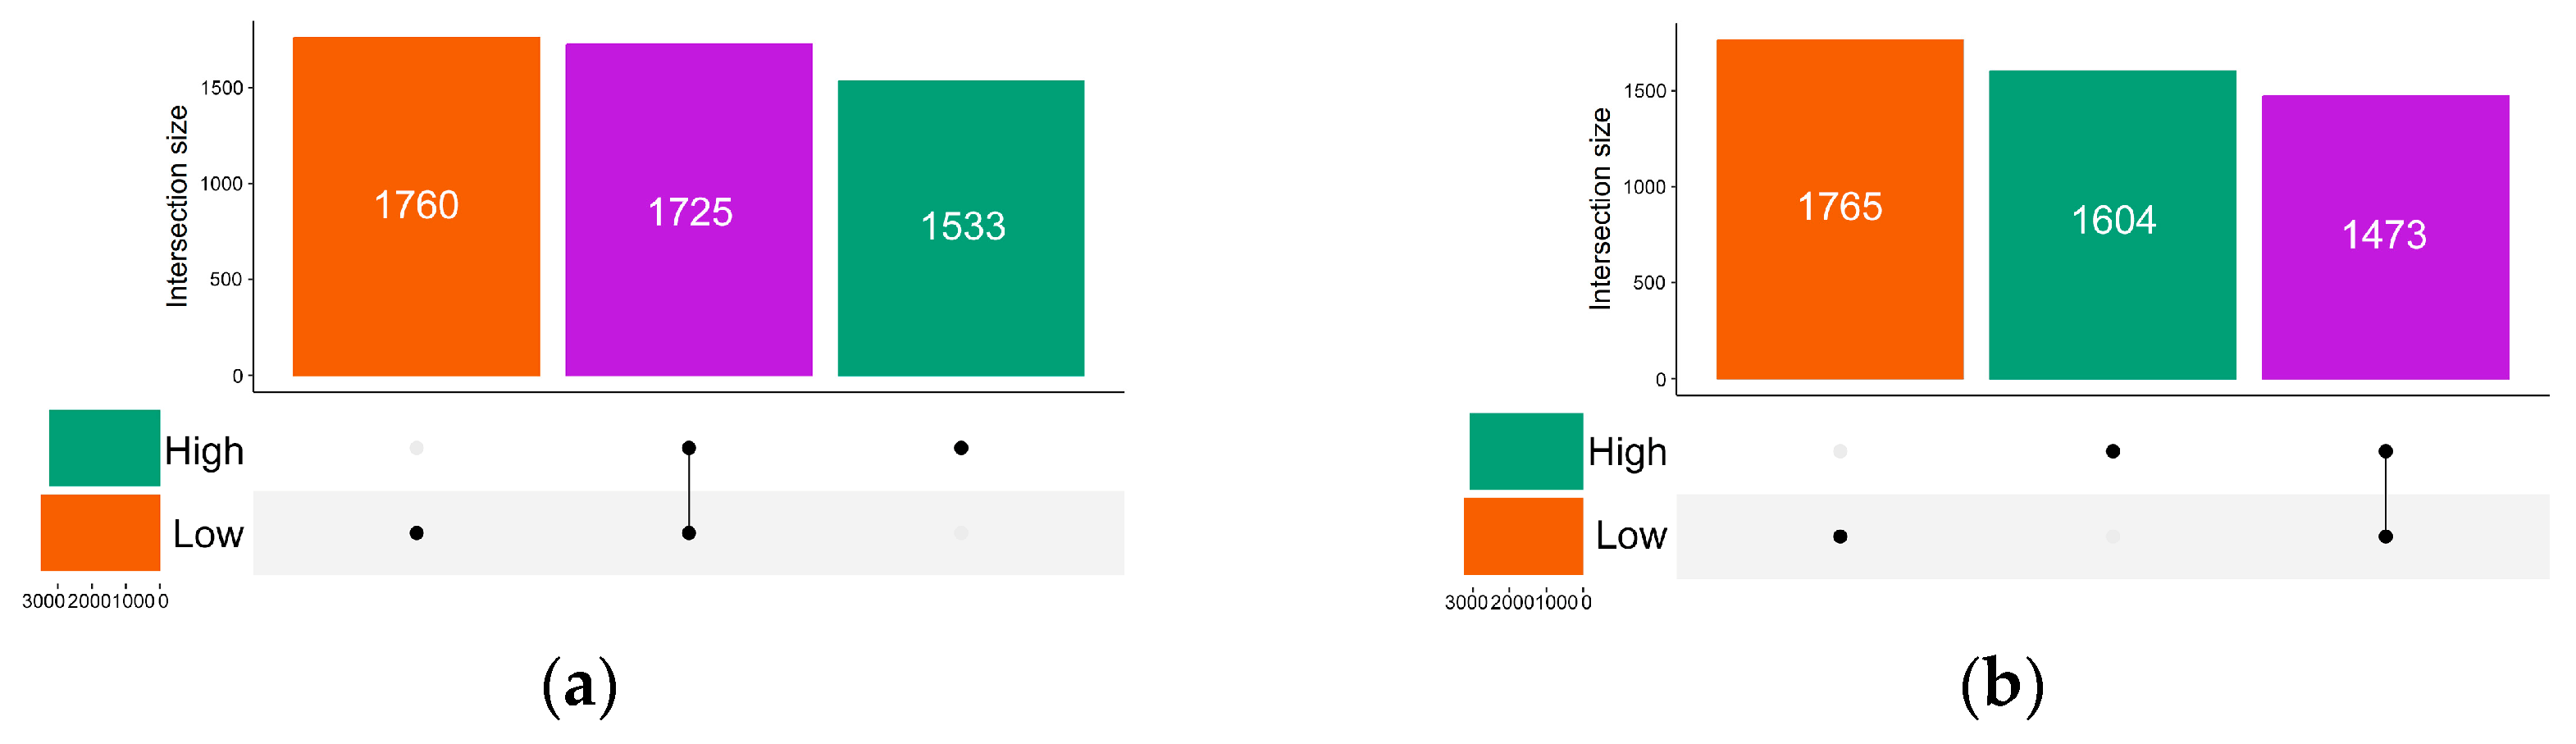
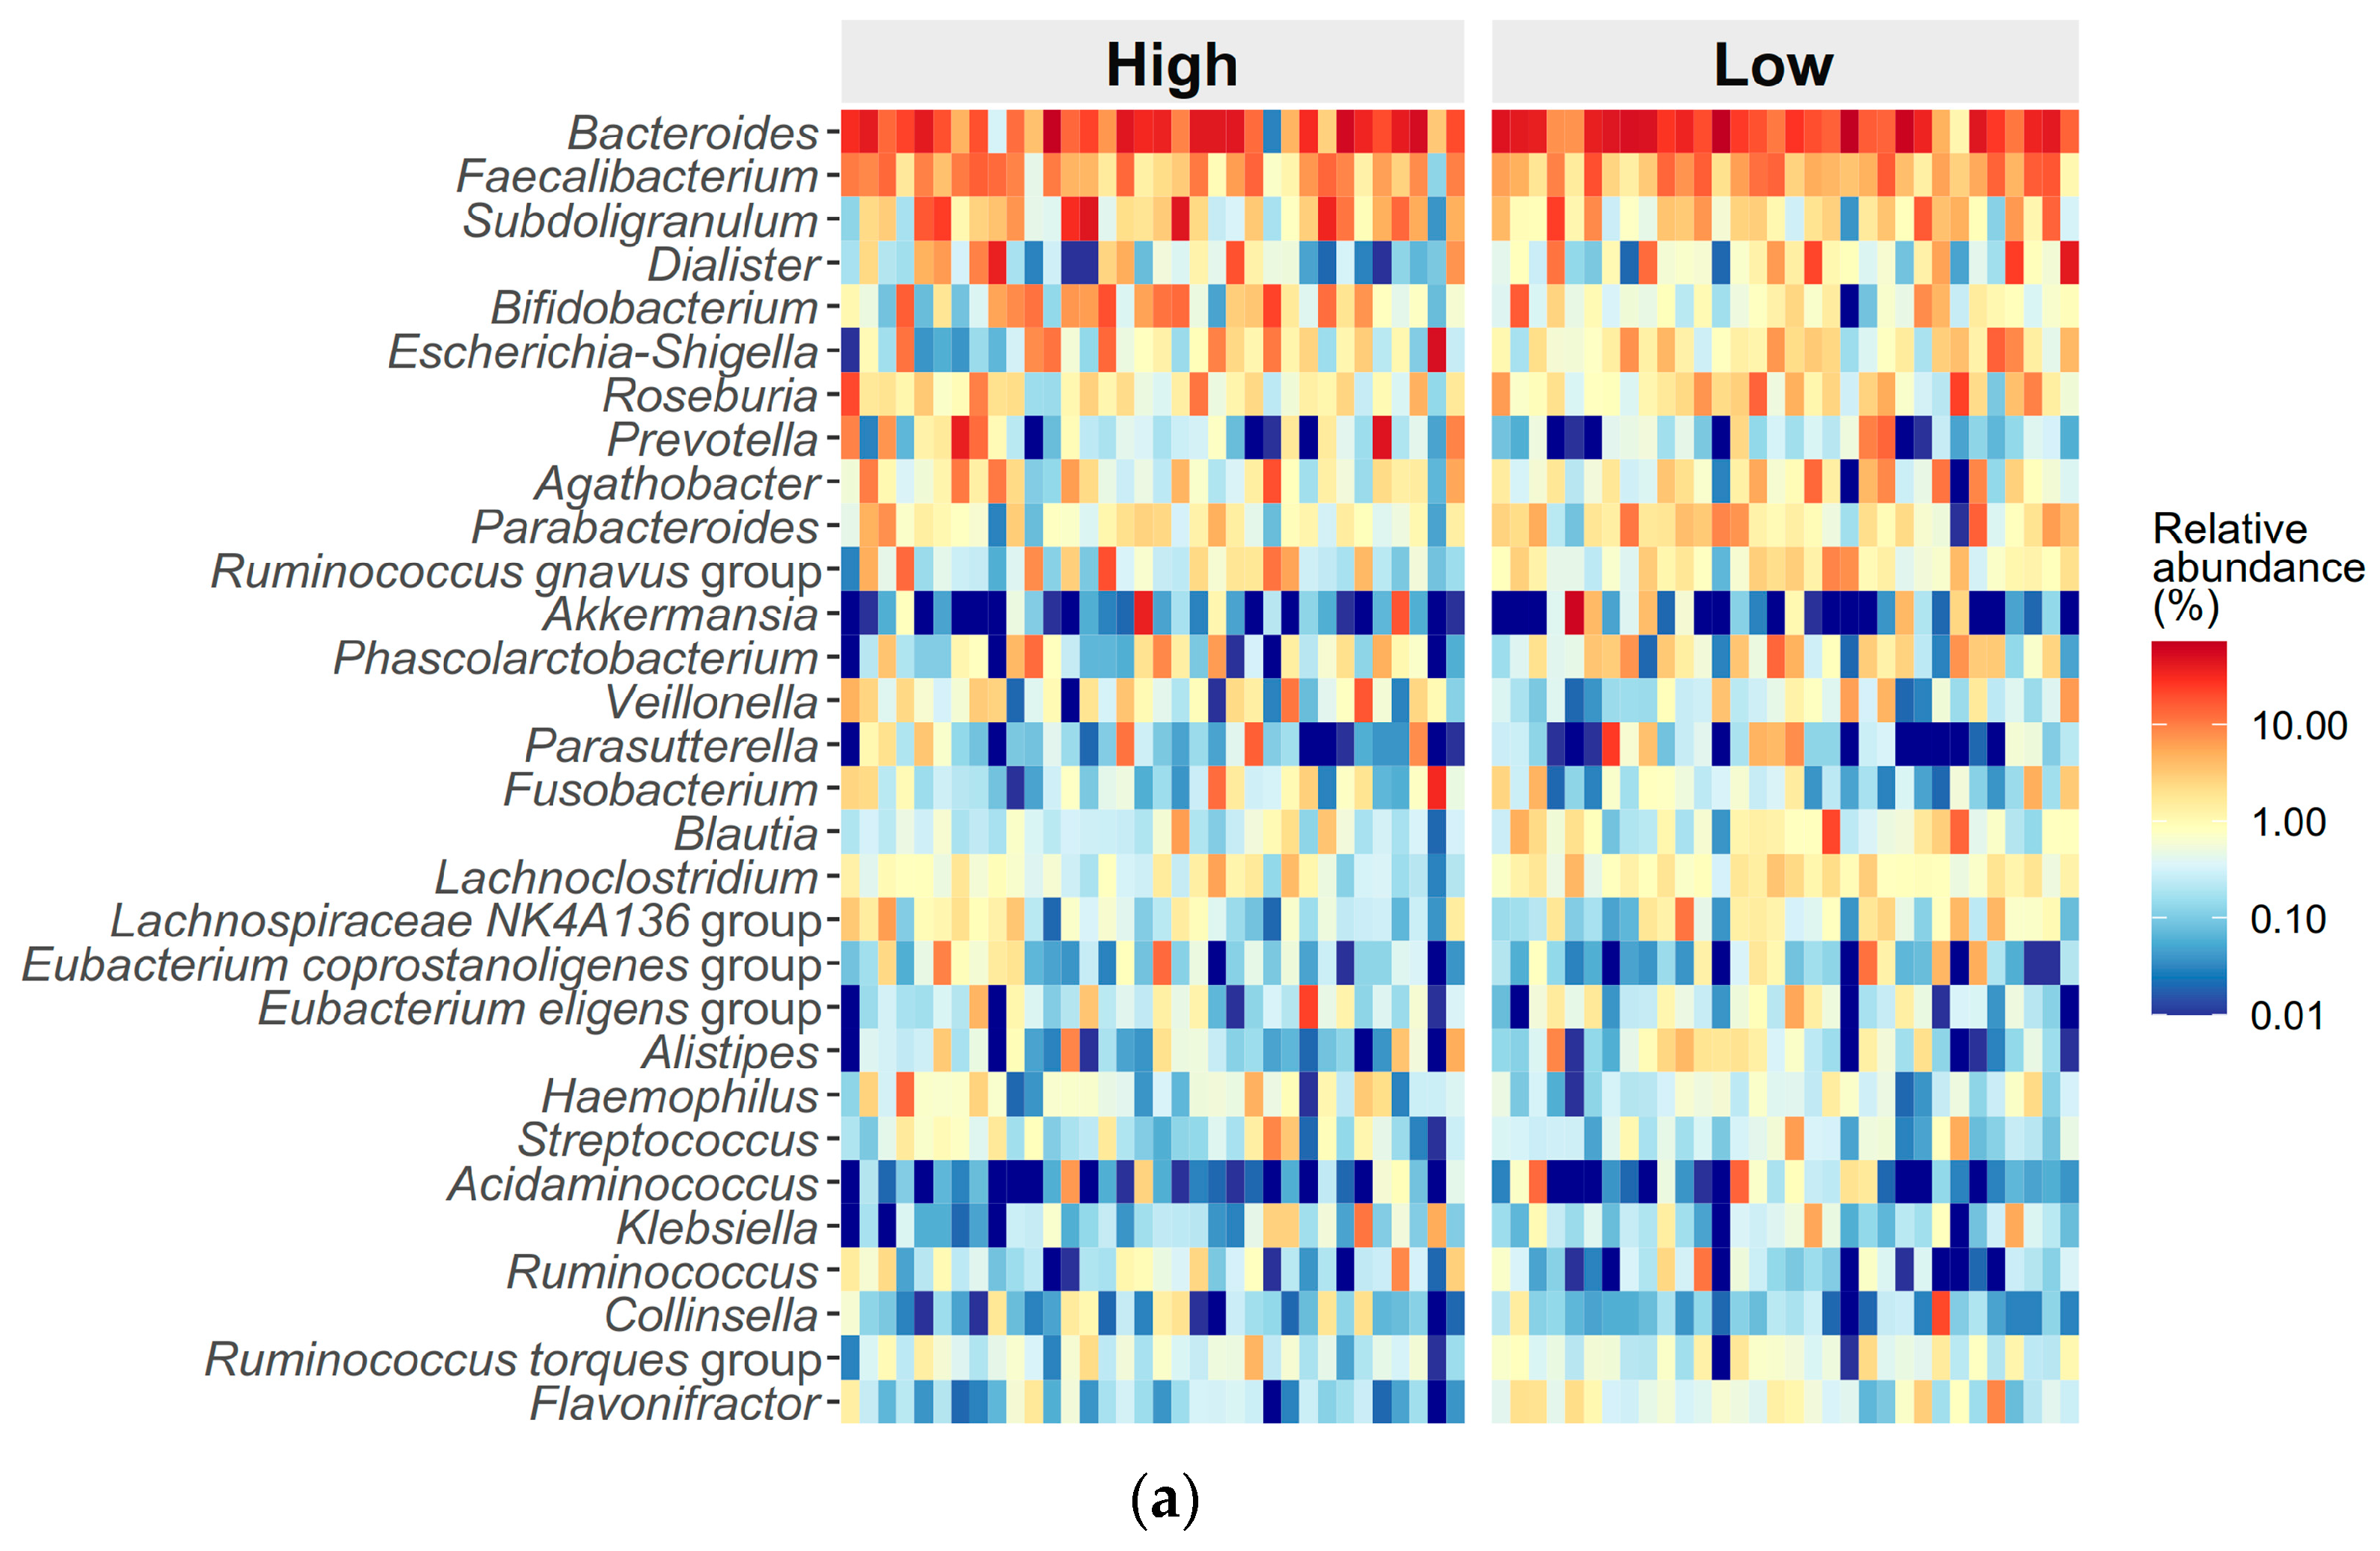
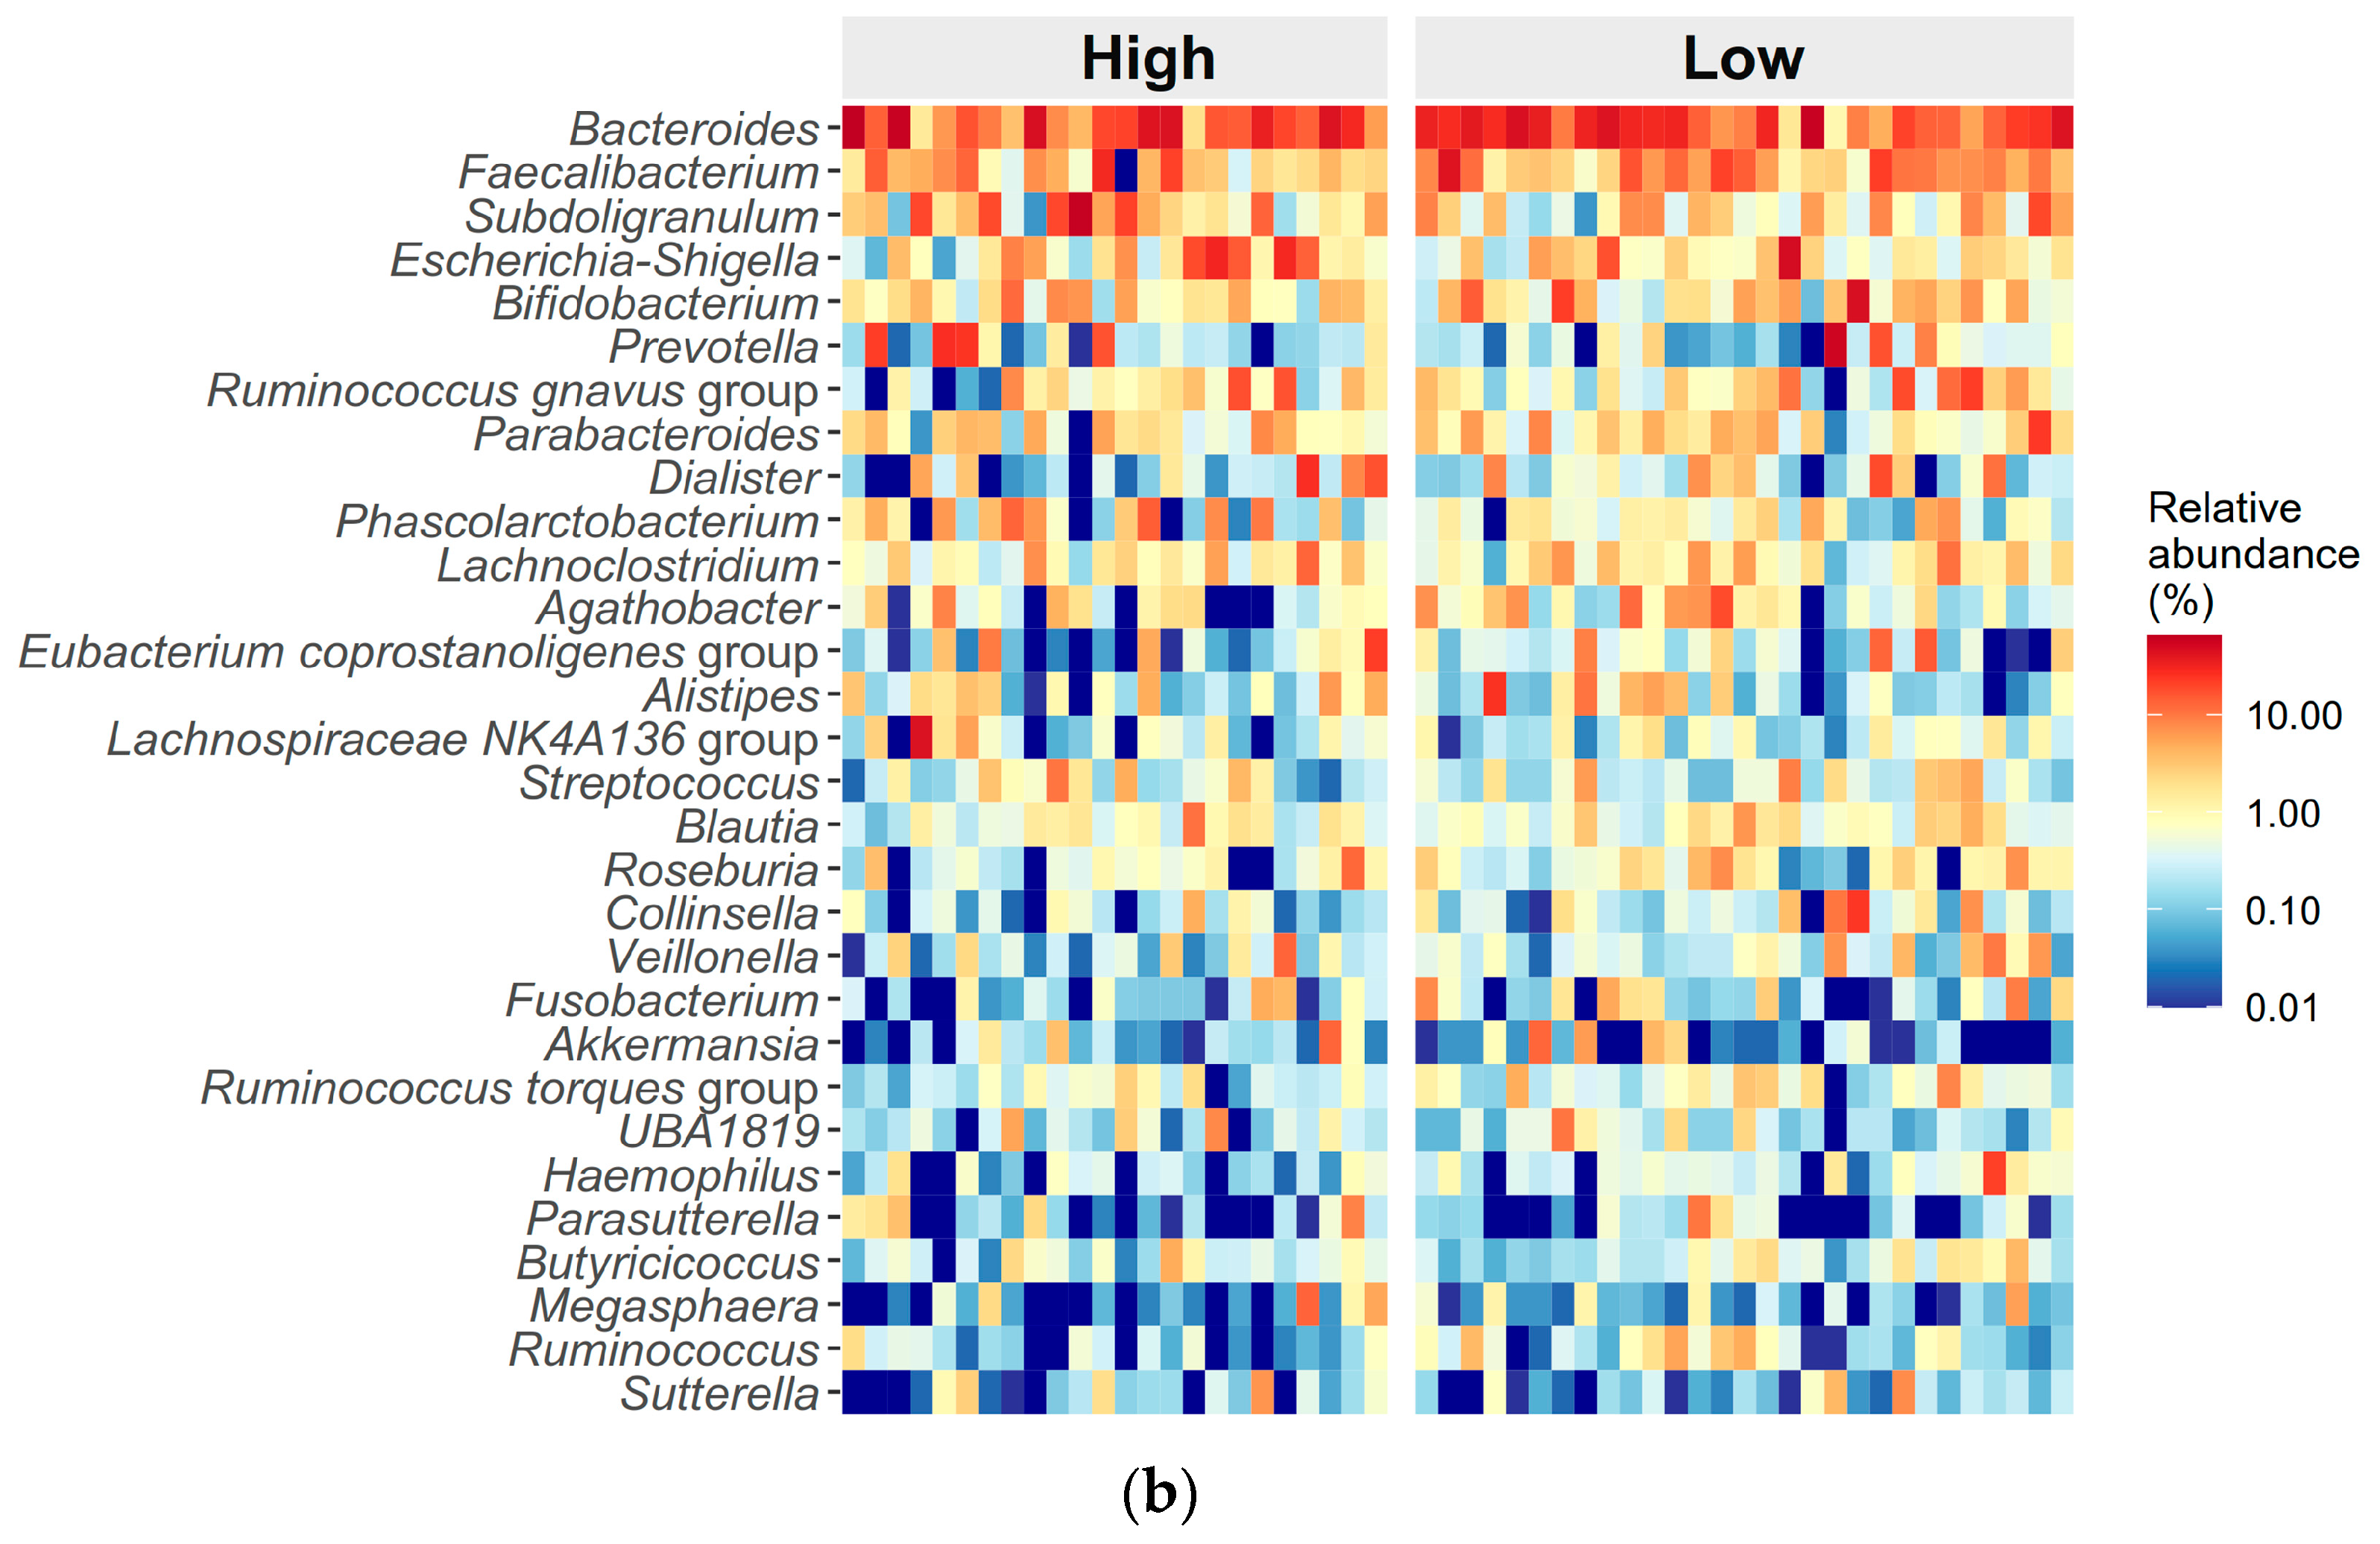
3.3. Differences in Gut Microbiome Composition Between High and Low ED Groups
3.4. Differences in Food Frequency Between High and Low ED Groups
3.5. Differences in Sleep Heart Rate Variability Metrics Between High and Low ED Groups
3.6. Multiple Linear Regression Models for ED Score Estimation
3.7. Changes in Variables of Interest After Treatment
3.8. Comparing Post-Treatment Variables of Interest Between Pre-Treatment ED Groups
3.9. Multiple Linear Regression Models for Change in ED Score
4. Discussion
Strengths and Limitations
5. Conclusions
Author Contributions
Funding
Data Availability Statement
Acknowledgments
Conflicts of Interest
Abbreviations
| ADHD | Attention-deficit/hyperactivity disorder |
| AHI | Apnea–hypopnea index |
| AI | Apnea index |
| ArI | Arousal index |
| ASD | Autism spectrum disorder |
| ASV | Amplicon sequence variant |
| BMI | Body mass index |
| ED | Emotional distress |
| HF | High frequency |
| HRV | Heart rate variability |
| LDA | Linear discriminant analysis |
| LF | Low frequency |
| Maaslin2 | Multivariable association with linear models 2 |
| OSA | Obstructive sleep apnea |
| PERMANOVA | Permutational multivariate analysis of variance |
| SFFQ | Short Food Frequency Questionnaire |
| SpO2 | Peripheral oxygen saturation |
| ULF | Ultra-low frequency |
| VLF | Very low frequency |
References
- Magnusdottir, S.; Hill, E.A. Prevalence of obstructive sleep apnea (OSA) among preschool aged children in the general population: A systematic review. Sleep. Med. Rev. 2024, 73, 101871. [Google Scholar] [CrossRef] [PubMed]
- Lyons, M.M.; Bhatt, N.Y.; Pack, A.I.; Magalang, U.J. Global burden of sleep-disordered breathing and its implications. Respirology 2020, 25, 690–702. [Google Scholar] [CrossRef]
- Lo Bue, A.; Salvaggio, A.; Insalaco, G. Obstructive sleep apnea in developmental age. A narrative review. Eur. J. Pediatr. 2020, 179, 357–365. [Google Scholar] [CrossRef] [PubMed]
- Csabi, E.; Gaal, V.; Hallgato, E.; Schulcz, R.A.; Katona, G.; Benedek, P. Increased behavioral problems in children with sleep-disordered breathing. Ital. J. Pediatr. 2022, 48, 173. [Google Scholar] [CrossRef] [PubMed]
- Liu, H.; Wang, X.; Feng, H.; Zhou, S.; Pan, J.; Ouyang, C.; Hu, X. Obstructive sleep apnea and mental disorders: A bidirectional mendelian randomization study. BMC Psychiatry 2024, 24, 304. [Google Scholar] [CrossRef] [PubMed]
- Gottesman, R.F.; Lutsey, P.L.; Benveniste, H.; Brown, D.L.; Full, K.M.; Lee, J.M.; Osorio, R.S.; Pase, M.P.; Redeker, N.S.; Redline, S.; et al. Impact of Sleep Disorders and Disturbed Sleep on Brain Health: A Scientific Statement From the American Heart Association. Stroke 2024, 55, e61–e76. [Google Scholar] [CrossRef] [PubMed]
- Fulfs, T.; Poulain, T.; Vogel, M.; Nenoff, K.; Kiess, W. Associations between sleep problems and emotional/behavioural difficulties in healthy children and adolescents. BMC Pediatr. 2024, 24, 15. [Google Scholar] [CrossRef] [PubMed]
- Bitners, A.C.; Arens, R. Evaluation and Management of Children with Obstructive Sleep Apnea Syndrome. Lung 2020, 198, 257–270. [Google Scholar] [CrossRef] [PubMed]
- Cai, Y.; Juszczak, H.M.; Cope, E.K.; Goldberg, A.N. The microbiome in obstructive sleep apnea. Sleep 2021, 44, zsab061. [Google Scholar] [CrossRef] [PubMed]
- Fujihara, H.; Matsunaga, M.; Ueda, E.; Kajiwara, T.; Takeda, A.K.; Watanabe, S.; Baba, K.; Hagihara, K.; Myowa, M. Altered Gut Microbiota Composition Is Associated with Difficulty in Explicit Emotion Regulation in Young Children. Microorganisms 2023, 11, 2245. [Google Scholar] [CrossRef]
- Cao, Y.; Li, R.; Bai, L. Vagal sensory pathway for the gut-brain communication. Semin. Cell Dev. Biol. 2024, 156, 228–243. [Google Scholar] [CrossRef] [PubMed]
- Liu, W.; Du, Q.; Zhang, H.; Han, D. The gut microbiome and obstructive sleep apnea syndrome in children. Sleep. Med. 2022, 100, 462–471. [Google Scholar] [CrossRef]
- Sasso, J.M.; Ammar, R.M.; Tenchov, R.; Lemmel, S.; Kelber, O.; Grieswelle, M.; Zhou, Q.A. Gut Microbiome-Brain Alliance: A Landscape View into Mental and Gastrointestinal Health and Disorders. ACS Chem. Neurosci. 2023, 14, 1717–1763. [Google Scholar] [CrossRef] [PubMed]
- Chuang, H.H.; Lee, L.A.; Chuang, L.P.; Li, H.Y.; Huang, Y.S.; Chou, S.H.; Lee, G.S.; Kuo, T.B.J.; Yang, C.C.H.; Huang, C.G. Alterations of Gut Microbiome Composition and Function Pre- and Post-Adenotonsillectomy in Children with Obstructive Sleep Apnea. J. Otolaryngol. Head. Neck Surg. 2024, 53, 19160216241293070. [Google Scholar] [CrossRef]
- Li, H.Y.; Huang, Y.S.; Chen, N.H.; Fang, T.J.; Lee, L.A. Impact of adenotonsillectomy on behavior in children with sleep-disordered breathing. Laryngoscope 2006, 116, 1142–1147. [Google Scholar] [CrossRef] [PubMed]
- Chuang, H.H.; Lin, R.H.; Hsu, J.F.; Chuang, L.P.; Li, H.Y.; Fang, T.J.; Huang, Y.S.; Yang, A.C.; Lee, G.S.; Kuo, T.B.J.; et al. Dietary profile of pediatric obstructive sleep apnea patients, effects of routine educational counseling, and predictors for outcomes. Front. Public Health 2023, 11, 1160647. [Google Scholar] [CrossRef] [PubMed]
- Romano, K.; Shah, A.N.; Schumacher, A.; Zasowski, C.; Zhang, T.; Bradley-Ridout, G.; Merriman, K.; Parkinson, J.; Szatmari, P.; Campisi, S.C.; et al. The gut microbiome in children with mood, anxiety, and neurodevelopmental disorders: An umbrella review. Gut Microbiome 2023, 4, e18. [Google Scholar] [CrossRef]
- Chuang, H.H.; Hsu, J.F.; Chuang, L.P.; Chiu, C.H.; Huang, Y.L.; Li, H.Y.; Chen, N.H.; Huang, Y.S.; Chuang, C.W.; Huang, C.G.; et al. Different associations between tonsil microbiome, chronic tonsillitis, and intermittent hypoxemia among obstructive sleep apnea children of different weight status: A pilot case-control Study. J. Pers. Med. 2021, 11, 486. [Google Scholar] [CrossRef]
- World Medical, A. World Medical Association Declaration of Helsinki: Ethical principles for medical research involving human subjects. JAMA 2013, 310, 2191–2194. [Google Scholar] [CrossRef]
- von Elm, E.; Altman, D.G.; Egger, M.; Pocock, S.J.; Gotzsche, P.C.; Vandenbroucke, J.P.; Initiative, S. The Strengthening the Reporting of Observational Studies in Epidemiology (STROBE) statement: Guidelines for reporting observational studies. PLoS Med. 2007, 4, e296. [Google Scholar] [CrossRef] [PubMed]
- Kaditis, A.; Kheirandish-Gozal, L.; Gozal, D. Algorithm for the diagnosis and treatment of pediatric OSA: A proposal of two pediatric sleep centers. Sleep. Med. 2012, 13, 217–227. [Google Scholar] [CrossRef] [PubMed]
- Chuang, H.H.; Huang, C.G.; Chuang, L.P.; Huang, Y.S.; Chen, N.H.; Li, H.Y.; Fang, T.J.; Hsu, J.F.; Lai, H.C.; Chen, J.Y.; et al. Relationships among and predictive values of obesity, inflammation markers, and disease severity in pediatric patients with obstructive sleep apnea before and after adenotonsillectomy. J. Clin. Med. 2020, 9, 579. [Google Scholar] [CrossRef] [PubMed]
- Health Promotion Administration. Daily Dietary Guidelines of Taiwan, 2nd ed.; Health Promotion Administration: Taipei, Taiwan, 2018. [Google Scholar]
- Chuang, H.H.; Lin, R.H.; Chen, J.Y.; Yeh, W.C.; Lin, H.F.; Ueng, S.W.; Hsu, K.H. Effectiveness of a multi-faceted intervention among elementary school children. Medicine 2019, 98, e15079. [Google Scholar] [CrossRef]
- Lee, L.A.; Li, H.Y.; Lin, Y.S.; Fang, T.J.; Huang, Y.S.; Hsu, J.F.; Wu, C.M.; Huang, C.G. Severity of childhood obstructive sleep apnea and hypertension improved after adenotonsillectomy. Otolaryngol. Head. Neck Surg. 2015, 152, 553–560. [Google Scholar] [CrossRef]
- Schloss, P.D.; Gevers, D.; Westcott, S.L. Reducing the effects of PCR amplification and sequencing artifacts on 16S rRNA-based studies. PLoS ONE 2011, 6, e27310. [Google Scholar] [CrossRef] [PubMed]
- Mumby, P.J. Beta and habitat diversity in marine systems: A new approach to measurement, scaling and interpretation. Oecologia 2001, 128, 274–280. [Google Scholar] [CrossRef] [PubMed]
- Berry, R.B.; Budhiraja, R.; Gottlieb, D.J.; Gozal, D.; Iber, C.; Kapur, V.K.; Marcus, C.L.; Mehra, R.; Parthasarathy, S.; Quan, S.F.; et al. Rules for scoring respiratory events in sleep: Update of the 2007 AASM Manual for the Scoring of Sleep and Associated Events. Deliberations of the Sleep Apnea Definitions Task Force of the American Academy of Sleep Medicine. J. Clin. Sleep Med. JCSM Off. Publ. Am. Acad. Sleep Med. 2012, 8, 597–619. [Google Scholar] [CrossRef] [PubMed]
- Lee, L.A.; Chuang, H.H.; Hsieh, H.S.; Wang, C.Y.; Chuang, L.P.; Li, H.Y.; Fang, T.J.; Huang, Y.S.; Lee, G.S.; Yang, A.C.; et al. Using sleep heart rate variability to investigate the sleep quality in children with obstructive sleep apnea. Front. Public Health 2023, 11, 1103085. [Google Scholar] [CrossRef]
- Huang, C.G.; Hsu, J.F.; Chuang, L.P.; Li, H.Y.; Fang, T.J.; Huang, Y.S.; Yang, A.C.; Lee, G.S.; Kuo, T.B.J.; Yang, C.C.H.; et al. Adenotonsillectomy-related changes in systemic inflammation among children with obstructive sleep apnea. J. Chin. Med. Assoc. 2023, 86, 596–605. [Google Scholar] [CrossRef] [PubMed]
- Huang, Y.-S.; Hwang, F.-M.; Lin, C.-H.; Lee, L.-A.; Huang, P.-Y.; Chiu, S.-T. Clinical manifestations of pediatric obstructive sleep apnea syndrome: Clinical utility of the Chinese-version Obstructive Sleep Apnea Questionaire-18. Psychiatry Clin. Neurosci. 2015, 69, 752–762. [Google Scholar] [CrossRef]
- Franco, R.A., Jr.; Rosenfeld, R.M.; Rao, M. Quality of life for children with obstructive sleep apnea. Otolaryngol. Head. Neck Surg. 2000, 123, 9–16. [Google Scholar] [CrossRef] [PubMed]
- Chuang, H.-H.; Huang, C.-G.; Chou, S.-H.; Li, H.-Y.; Lee, C.-C.; Lee, L.-A. Comparative analysis of gut microbiota in children with obstructive sleep apnea: Assessing the efficacy of 16S rRNA gene sequencing in metabolic function prediction based on weight status. Front. Endocrinol. 2024, 15, 1344152. [Google Scholar] [CrossRef] [PubMed]
- Garcia-Lopez, R.; Cornejo-Granados, F.; Lopez-Zavala, A.A.; Sanchez-Lopez, F.; Cota-Huizar, A.; Sotelo-Mundo, R.R.; Guerrero, A.; Mendoza-Vargas, A.; Gomez-Gil, B.; Ochoa-Leyva, A. Doing More with Less: A Comparison of 16S Hypervariable Regions in Search of Defining the Shrimp Microbiota. Microorganisms 2020, 8, 134. [Google Scholar] [CrossRef] [PubMed]
- Martin, M. Cutadapt removes adapter sequences from high-throughput sequencing reads. EMBnet J. 2011, 17, 10–12. [Google Scholar] [CrossRef]
- Jeske, J.T.; Gallert, C. Microbiome Analysis via OTU and ASV-Based Pipelines-A Comparative Interpretation of Ecological Data in WWTP Systems. Bioengineering 2022, 9, 146. [Google Scholar] [CrossRef] [PubMed]
- Callahan, B.J.; McMurdie, P.J.; Rosen, M.J.; Han, A.W.; Johnson, A.J.; Holmes, S.P. DADA2: High-resolution sample inference from Illumina amplicon data. Nat. Methods 2016, 13, 581–583. [Google Scholar] [CrossRef]
- Bokulich, N.A.; Kaehler, B.D.; Rideout, J.R.; Dillon, M.; Bolyen, E.; Knight, R.; Huttley, G.A.; Gregory Caporaso, J. Optimizing taxonomic classification of marker-gene amplicon sequences with QIIME 2’s q2-feature-classifier plugin. Microbiome 2018, 6, 90. [Google Scholar] [CrossRef]
- Quast, C.; Pruesse, E.; Yilmaz, P.; Gerken, J.; Schweer, T.; Yarza, P.; Peplies, J.; Glockner, F.O. The SILVA ribosomal RNA gene database project: Improved data processing and web-based tools. Nucleic Acids Res. 2013, 41, D590–D596. [Google Scholar] [CrossRef]
- Katoh, K.; Standley, D.M. MAFFT multiple sequence alignment software version 7: Improvements in performance and usability. Mol. Biol. Evol. 2013, 30, 772–780. [Google Scholar] [CrossRef]
- Price, M.N.; Dehal, P.S.; Arkin, A.P. FastTree: Computing large minimum evolution trees with profiles instead of a distance matrix. Mol. Biol. Evol. 2009, 26, 1641–1650. [Google Scholar] [CrossRef] [PubMed]
- Lillegaard, I.T.; Overby, N.C.; Andersen, L.F. Evaluation of a short food frequency questionnaire used among Norwegian children. Food Nutr. Res. 2012, 56, 6399. [Google Scholar] [CrossRef] [PubMed]
- Henriksen, H.B.; Carlsen, M.H.; Paur, I.; Berntsen, S.; Bohn, S.K.; Skjetne, A.J.; Kvaerner, A.S.; Henriksen, C.; Andersen, L.F.; Smeland, S.; et al. Relative validity of a short food frequency questionnaire assessing adherence to the Norwegian dietary guidelines among colorectal cancer patients. Food Nutr. Res. 2018, 62, 1306. [Google Scholar] [CrossRef]
- Saeedi, P.; Skeaff, S.A.; Wong, J.E.; Skidmore, P.M. Reproducibility and relative validity of a Short Food Frequency Questionnaire in 9-10 year-old children. Nutrients 2016, 8, 271. [Google Scholar] [CrossRef] [PubMed]
- Task Force of the European Society of Cardiology and the North American Society of Pacing and Electrophysiology. Heart rate variability: Standards of measurement, physiological interpretation and clinical use. Task Force of the European Society of Cardiology and the North American Society of Pacing and Electrophysiology. Circulation 1996, 93, 1043–1065. [Google Scholar] [CrossRef]
- Prehn-Kristensen, A.; Zimmermann, A.; Tittmann, L.; Lieb, W.; Schreiber, S.; Baving, L.; Fischer, A. Reduced microbiome alpha diversity in young patients with ADHD. PLoS ONE 2018, 13, e0200728. [Google Scholar] [CrossRef] [PubMed]
- Team, R.C. R: A Language and Environment for Statistical Computing; R Foundation for Statistical Computing: Vienna, Austria, 2024. [Google Scholar]
- Liu, C.; Cui, Y.; Li, X.; Yao, M. Microeco: An R package for data mining in microbial community ecology. FEMS Microbiol. Ecol. 2021, 97, fiaa255. [Google Scholar] [CrossRef] [PubMed]
- Anderson, M.J. A new method for non-parametric multivariate analysis of variance. Austral Ecol. 2008, 26, 32–46. [Google Scholar] [CrossRef]
- Xie, Z.; Pi, G.; Xu, Z.; Li, C.; Sun, X.; Chen, Y.; Li, F. Structural characteristics and functional analysis of gut microbiome in patients with osteoarthritis. Res. Sq. 2020, preprint. [Google Scholar] [CrossRef]
- Mallick, H.; Rahnavard, A.; McIver, L.J.; Ma, S.; Zhang, Y.; Nguyen, L.H.; Tickle, T.L.; Weingart, G.; Ren, B.; Schwager, E.H.; et al. Multivariable association discovery in population-scale meta-omics studies. PLoS Comput. Biol. 2021, 17, e1009442. [Google Scholar] [CrossRef]
- Steckler, R.; Magzal, F.; Kokot, M.; Walkowiak, J.; Tamir, S. Disrupted gut harmony in attention-deficit/hyperactivity disorder: Dysbiosis and decreased short-chain fatty acids. Brain Behav. Immun. Health 2024, 40, 100829. [Google Scholar] [CrossRef]
- Wang, N.; Wang, H.; Bai, Y.; Zhao, Y.; Zheng, X.; Gao, X.; Zhang, Z.; Yang, L. Metagenomic Analysis Reveals Difference of Gut Microbiota in ADHD. J. Atten. Disord. 2024, 28, 872–879. [Google Scholar] [CrossRef] [PubMed]
- Distler, W.; Kroncke, A. The lactate metabolism of the oral bacterium Veillonella from human saliva. Arch. Oral. Biol. 1981, 26, 657–661. [Google Scholar] [CrossRef]
- Tana, C.; Umesaki, Y.; Imaoka, A.; Handa, T.; Kanazawa, M.; Fukudo, S. Altered profiles of intestinal microbiota and organic acids may be the origin of symptoms in irritable bowel syndrome. Neurogastroenterol. Motil. 2010, 22, 512-e115. [Google Scholar] [CrossRef]
- Carlson, A.L.; Xia, K.; Azcarate-Peril, M.A.; Rosin, S.P.; Fine, J.P.; Mu, W.; Zopp, J.B.; Kimmel, M.C.; Styner, M.A.; Thompson, A.L.; et al. Infant gut microbiome composition is associated with non-social fear behavior in a pilot study. Nat. Commun. 2021, 12, 3294. [Google Scholar] [CrossRef] [PubMed]
- Huang, L.; Duan, C.; Xia, X.; Wang, H.; Wang, Y.; Zhong, Z.; Wang, B.; Ding, W.; Yang, Y. Commensal microbe-derived propionic acid mediates juvenile social isolation-induced social deficits and anxiety-like behaviors. Brain Res. Bull. 2021, 166, 161–171. [Google Scholar] [CrossRef]
- Yang, L.L.; Stiernborg, M.; Skott, E.; Xu, J.; Wu, Y.; Landberg, R.; Arefin, S.; Kublickiene, K.; Millischer, V.; Nilsson, I.A.K.; et al. Effects of a Synbiotic on Plasma Immune Activity Markers and Short-Chain Fatty Acids in Children and Adults with ADHD-A Randomized Controlled Trial. Nutrients 2023, 15, 1293. [Google Scholar] [CrossRef]
- Alessandri, G.; van Sinderen, D.; Ventura, M. The genus bifidobacterium: From genomics to functionality of an important component of the mammalian gut microbiota running title: Bifidobacterial adaptation to and interaction with the host. Comput. Struct. Biotechnol. J. 2021, 19, 1472–1487. [Google Scholar] [CrossRef] [PubMed]
- Soltysova, M.; Tomova, A.; Ostatnikova, D. Gut Microbiota Profiles in Children and Adolescents with Psychiatric Disorders. Microorganisms 2022, 10, 2009. [Google Scholar] [CrossRef] [PubMed]
- Aarts, E.; Ederveen, T.H.A.; Naaijen, J.; Zwiers, M.P.; Boekhorst, J.; Timmerman, H.M.; Smeekens, S.P.; Netea, M.G.; Buitelaar, J.K.; Franke, B.; et al. Gut microbiome in ADHD and its relation to neural reward anticipation. PLoS ONE 2017, 12, e0183509. [Google Scholar] [CrossRef] [PubMed]
- Wang, L.J.; Tsai, C.S.; Chou, W.J.; Kuo, H.C.; Huang, Y.H.; Lee, S.Y.; Dai, H.Y.; Yang, C.Y.; Li, C.J.; Yeh, Y.T. Add-On Bifidobacterium Bifidum Supplement in Children with Attention-Deficit/Hyperactivity Disorder: A 12-Week Randomized Double-Blind Placebo-Controlled Clinical Trial. Nutrients 2024, 16, 2260. [Google Scholar] [CrossRef] [PubMed]
- Wang, Y.; Li, N.; Yang, J.J.; Zhao, D.M.; Chen, B.; Zhang, G.Q.; Chen, S.; Cao, R.F.; Yu, H.; Zhao, C.Y.; et al. Probiotics and fructo-oligosaccharide intervention modulate the microbiota-gut brain axis to improve autism spectrum reducing also the hyper-serotonergic state and the dopamine metabolism disorder. Pharmacol. Res. 2020, 157, 104784. [Google Scholar] [CrossRef] [PubMed]
- Rodriguez-Castano, G.P.; Rey, F.E.; Caro-Quintero, A.; Acosta-Gonzalez, A. Gut-derived Flavonifractor species variants are differentially enriched during in vitro incubation with quercetin. PLoS ONE 2020, 15, e0227724. [Google Scholar] [CrossRef]
- Mulder, D.; Jakobi, B.; Shi, Y.; Mulders, P.; Kist, J.D.; Collard, R.M.; Vrijsen, J.N.; van Eijndhoven, P.; Tendolkar, I.; Bloemendaal, M.; et al. Gut microbiota composition links to variation in functional domains across psychiatric disorders. Brain Behav. Immun. 2024, 120, 275–287. [Google Scholar] [CrossRef]
- Wang, H.; Liu, S.; Xie, L.; Wang, J. Gut microbiota signature in children with autism spectrum disorder who suffered from chronic gastrointestinal symptoms. BMC Pediatr. 2023, 23, 476. [Google Scholar] [CrossRef] [PubMed]
- Fang, D.; Shi, D.; Lv, L.; Gu, S.; Wu, W.; Chen, Y.; Guo, J.; Li, A.; Hu, X.; Guo, F.; et al. Bifidobacterium pseudocatenulatum LI09 and Bifidobacterium catenulatum LI10 attenuate D-galactosamine-induced liver injury by modifying the gut microbiota. Sci. Rep. 2017, 7, 8770. [Google Scholar] [CrossRef] [PubMed]
- Abdugheni, R.; Wang, W.Z.; Wang, Y.J.; Du, M.X.; Liu, F.L.; Zhou, N.; Jiang, C.Y.; Wang, C.Y.; Wu, L.; Ma, J.; et al. Metabolite profiling of human-originated Lachnospiraceae at the strain level. Imeta 2022, 1, e58. [Google Scholar] [CrossRef] [PubMed]
- Lee, M.J.; Lai, H.C.; Kuo, Y.L.; Chen, V.C. Association between Gut Microbiota and Emotional-Behavioral Symptoms in Children with Attention-Deficit/Hyperactivity Disorder. J. Pers. Med. 2022, 12, 1634. [Google Scholar] [CrossRef]
- Lee, S.M.; Dong, T.S.; Krause-Sorio, B.; Siddarth, P.; Milillo, M.M.; Lagishetty, V.; Datta, T.; Aguilar-Faustino, Y.; Jacobs, J.P.; Lavretsky, H. The intestinal microbiota as a predictor for antidepressant treatment outcome in geriatric depression: A prospective pilot study. Int. Psychogeriatr. 2022, 34, 33–45. [Google Scholar] [CrossRef] [PubMed]
- Okuma, K.; Hatayama, K.; Tokuno, H.; Ebara, A.; Odachi, A.; Masuyama, H.; Hoshiko, N.; Tanaka, N. A risk estimation method for depression based on the dysbiosis of intestinal microbiota in Japanese patients. Front. Psychiatry 2024, 15, 1382175. [Google Scholar] [CrossRef]
- Mullish, B.H.; Michael, D.R.; Dabcheva, M.; Webberley, T.S.; Coates, N.; John, D.A.; Wang, D.; Luo, Y.; Plummer, S.F.; Marchesi, J.R. A double-blind, randomized, placebo-controlled study assessing the impact of probiotic supplementation on the symptoms of irritable bowel syndrome in females. Neurogastroenterol. Motil. 2024, 36, e14751. [Google Scholar] [CrossRef] [PubMed]
- Liu, L.; Wang, H.; Chen, X.; Zhang, Y.; Zhang, H.; Xie, P. Gut microbiota and its metabolites in depression: From pathogenesis to treatment. EBioMedicine 2023, 90, 104527. [Google Scholar] [CrossRef] [PubMed]
- Caspani, G.; Kennedy, S.; Foster, J.A.; Swann, J. Gut microbial metabolites in depression: Understanding the biochemical mechanisms. Microb. Cell 2019, 6, 454–481. [Google Scholar] [CrossRef] [PubMed]
- Sun, N.; Zhang, J.; Wang, J.; Liu, Z.; Wang, X.; Kang, P.; Yang, C.; Liu, P.; Zhang, K. Abnormal gut microbiota and bile acids in patients with first-episode major depressive disorder and correlation analysis. Psychiatry Clin. Neurosci. 2022, 76, 321–328. [Google Scholar] [CrossRef] [PubMed]
- Takabatake, N.; Nakamura, H.; Minamihaba, O.; Inage, M.; Inoue, S.; Kagaya, S.; Yamaki, M.; Tomoike, H. A novel pathophysiologic phenomenon in cachexic patients with chronic obstructive pulmonary disease: The relationship between the circadian rhythm of circulating leptin and the very low-frequency component of heart rate variability. Am. J. Respir. Crit. Care Med. 2001, 163, 1314–1319. [Google Scholar] [CrossRef]
- Pham, T.; Lau, Z.J.; Chen, S.H.A.; Makowski, D. Heart Rate Variability in Psychology: A Review of HRV Indices and an Analysis Tutorial. Sensors 2021, 21, 3998. [Google Scholar] [CrossRef]
- Bigger, J.T., Jr.; Fleiss, J.L.; Steinman, R.C.; Rolnitzky, L.M.; Kleiger, R.E.; Rottman, J.N. Frequency domain measures of heart period variability and mortality after myocardial infarction. Circulation 1992, 85, 164–171. [Google Scholar] [CrossRef] [PubMed]
- Stampfer, H.; Dimmitt, S.B. Variations in circadian heart rate in psychiatric disorders: Theoretical and practical implications. ChronoPhysiol. Ther. 2013, 3, 41–50. [Google Scholar] [CrossRef]
- Shaffer, F.; McCraty, R.; Zerr, C.L. A healthy heart is not a metronome: An integrative review of the heart’s anatomy and heart rate variability. Front. Psychol. 2014, 5, 1040. [Google Scholar] [CrossRef]
- Umetani, K.; Singer, D.H.; McCraty, R.; Atkinson, M. Twenty-Four Hour Time Domain Heart Rate Variability and Heart Rate: Relations to Age and Gender Over Nine Decades. J. Am. Coll. Cardiol. 1998, 31, 593–601. [Google Scholar] [CrossRef]
- Shaffer, F.; Ginsberg, J.P. An Overview of Heart Rate Variability Metrics and Norms. Front. Public Health 2017, 5, 258. [Google Scholar] [CrossRef]
- Morris, S.S.J.; Musser, E.D.; Tenenbaum, R.B.; Ward, A.R.; Martinez, J.; Raiker, J.S.; Coles, E.K.; Riopelle, C. Emotion Regulation via the Autonomic Nervous System in Children with Attention-Deficit/Hyperactivity Disorder (ADHD): Replication and Extension. J. Abnorm. Child. Psychol. 2020, 48, 361–373. [Google Scholar] [CrossRef]
- Berntson, G.G.; Cacioppo, J.T.; Grossman, P. Whither vagal tone. Biol. Psychol. 2007, 74, 295–300. [Google Scholar] [CrossRef]
- Goldstein, D.S.; Bentho, O.; Park, M.Y.; Sharabi, Y. Low-frequency power of heart rate variability is not a measure of cardiac sympathetic tone but may be a measure of modulation of cardiac autonomic outflows by baroreflexes. Exp. Physiol. 2011, 96, 1255–1261. [Google Scholar] [CrossRef] [PubMed]
- Epel, E.S.; Crosswell, A.D.; Mayer, S.E.; Prather, A.A.; Slavich, G.M.; Puterman, E.; Mendes, W.B. More than a feeling: A unified view of stress measurement for population science. Front. Neuroendocrinol. 2018, 49, 146–169. [Google Scholar] [CrossRef] [PubMed]
- Kim, H.G.; Cheon, E.J.; Bai, D.S.; Lee, Y.H.; Koo, B.H. Stress and Heart Rate Variability: A Meta-Analysis and Review of the Literature. Psychiatry Investig. 2018, 15, 235–245. [Google Scholar] [CrossRef]
- Cabrera, Y.; Koymans, K.J.; Poe, G.R.; Kessels, H.W.; Van Someren, E.J.W.; Wassing, R. Overnight neuronal plasticity and adaptation to emotional distress. Nat. Rev. Neurosci. 2024, 25, 253–271. [Google Scholar] [CrossRef] [PubMed]
- Usui, K.; Bradley, T.D.; Spaak, J.; Ryan, C.M.; Kubo, T.; Kaneko, Y.; Floras, J.S. Inhibition of awake sympathetic nerve activity of heart failure patients with obstructive sleep apnea by nocturnal continuous positive airway pressure. J. Am. Coll. Cardiol. 2005, 45, 2008–2011. [Google Scholar] [CrossRef] [PubMed]
- Ashique, S.; Mohanto, S.; Ahmed, M.G.; Mishra, N.; Garg, A.; Chellappan, D.K.; Omara, T.; Iqbal, S.; Kahwa, I. Gut-brain axis: A cutting-edge approach to target neurological disorders and potential synbiotic application. Heliyon 2024, 10, e34092. [Google Scholar] [CrossRef]
- Zheng, S.; Mansolf, M.; McGrath, M.; Churchill, M.L.; Bekelman, T.A.; Brennan, P.A.; Margolis, A.E.; Nozadi, S.S.; Bastain, T.M.; Elliott, A.J.; et al. Measurement bias in caregiver-report of early childhood behavior problems across demographic factors in an ECHO-wide diverse sample. JCPP Adv. 2024, 4, e12198. [Google Scholar] [CrossRef]
- Teh, W.L.; Abdin, E.; P. V., A.; Siva Kumar, F.D.; Roystonn, K.; Wang, P.; Shafie, S.; Chang, S.; Jeyagurunathan, A.; Vaingankar, J.A.; et al. Measuring social desirability bias in a multi-ethnic cohort sample: Its relationship with self-reported physical activity, dietary habits, and factor structure. BMC Public Health 2023, 23, 415. [Google Scholar] [CrossRef]
- Katiraei, S.; Anvar, Y.; Hoving, L.; Berbee, J.F.P.; van Harmelen, V.; Willems van Dijk, K. Evaluation of Full-Length Versus V4-Region 16S rRNA Sequencing for Phylogenetic Analysis of Mouse Intestinal Microbiota After a Dietary Intervention. Curr. Microbiol. 2022, 79, 276. [Google Scholar] [CrossRef] [PubMed]
- Bombard, Y.; Baker, G.R.; Orlando, E.; Fancott, C.; Bhatia, P.; Casalino, S.; Onate, K.; Denis, J.L.; Pomey, M.P. Engaging patients to improve quality of care: A systematic review. Implement. Sci. 2018, 13, 98. [Google Scholar] [CrossRef]
- Aguiar-Pulido, V.; Huang, W.; Suarez-Ulloa, V.; Cickovski, T.; Mathee, K.; Narasimhan, G. Metagenomics, Metatranscriptomics, and Metabolomics Approaches for Microbiome Analysis. Evol. Bioinform. Online 2016, 12, 5–16. [Google Scholar] [CrossRef] [PubMed]
- Lee, L.A.; Chuang, H.H.; Chuang, L.P.; Li, H.Y.; Huang, Y.S.; Chou, S.H.; Lee, G.S.; Kuo, T.B.J.; Yang, C.C.H.; Huang, C.G. 16S rRNA-based gut microbiome data of children with obstructive sleep apnea from Taiwan. 2023. Available online: https://figshare.com/articles/dataset/16S_rRNA-based_gut_microbiome_data_of_children_with_obstructive_sleep_apnea_from_Taiwan/22775159 (accessed on 8 December 2024).

| Variable | Pre-Treatment Status (n = 66) | Emotional Distress | Post-Treatment Status (n = 53) | Emotional Distress | p-Value 1 | p-Value 2 | p-Value 3 | ||
|---|---|---|---|---|---|---|---|---|---|
| Low (n = 32) | High (n = 34) | Low (n = 29) | High (n = 24) | ||||||
| Demographic characteristics | |||||||||
| Age at enrollment, years, mean (median) | 7.3 ± 2.2 (7) | 7.3 ± 2.3 (7) | 7.3 ± 2.1 (6) | 7.5 ± 2.3 (7) | 7.5 ± 2.4 (7) | 7.6 ± 2.2 (7) | 0.88 | 0.78 | |
| Gender (boy), % (n) | 76 (50) | 84 (27) | 23 (68) | 77 (41) | 83 (24) | 71 (17) | 0.15 | 0.34 | |
| BMI, kg/m2, mean (median) | 19.01 ± 5.46 (17.4) | 20.36 ± 5.91 (19.0) | 17.74 ± 4.73 (15.7) | 20.33 ± 6.12 (18.7) | 21.90 ± 6.49 (19.3) | 19.28 ± 5.61 (16.8) | 0.049 | 0.26 | <0.001 |
| Polysomnographic parameters | |||||||||
| AHI, events/hour, mean (median) | 14.70 ± 16.59 (8.5) | 18.20 ± 19.54 (9.6) | 11.41 ± 12.67 (5.8) | 3.38 ± 3.33 (2.4) | 3.52 ± 3.44 (2.5) | 3.21 ± 3.27 (2.3) | 0.17 | 0.74 | <0.001 * |
| AI, events/hour, mean (median) | 4.63 ± 8.37 (2.0) | 5.58 ± 10.41 (1.9) | 3.74 ± 5.86 (2.2) | 1.27 ± 1.53 (0.8) | 1.33 ± 1.38 (0.9) | 1.20 ± 1.71 (0.8) | 0.30 | 0.77 | 0.002 * |
| RDI, events/hour, mean (median) | 15.72 ± 17.05 (9.6) | 18.93 ± 20.03 (10.6) | 12.84 ± 13.54 (9.5) | 3.93 ± 3.36 (3.2) | 4.30 ± 3.51 (3.9) | 3.49 ± 3.19 (2.4) | 0.18 | 0.39 | <0.001 * |
| ArI, events/hour, mean (median) | 14.75 ± 11.77 (10.4) | 17.55 ± 14.33 (14.1) | 12.13 ± 8.13 (9.0) | 8.35 ± 3.80 (7.5) | 8.77 ± 3.14 (8.2) | 7.85 ± 4.48 (6.6) | 0.06 | 0.38 | <0.00 * |
| Mean SpO2, %, mean (median) | 97.2 ± 1.4 (97) | 96.9 ± 1.7 (97) | 97.5 ± 0.9 (98) | 97.7 ± 0.8 (98) | 97.7 ± 0.7 (98) | 97.7 ± 1.0 (98) | 0.28 | 0.75 | 0.0 * |
| Minimum SpO2, %, mean (median) | 87.8 ± 7.2 (90) | 86.5 ± 8.4 (89) | 89.1 ± 5.7 (90) | 91.2 ± 3.7 (92) | 90.3 ± 4.3 (91) | 92.2 ± 2.5 (93) | 0.16 | 0.06 | <0.001 * |
| OSA-18 questionnaire scores | |||||||||
| ED, score, mean (median) | 10.7 ± 4.0 (11) | 7.3 ± 2.0 (7) | 13.9 ± 2.5 (14) | 8.4 ± 3.9 (8) | 6.8 ± 3.3 (6) | 10.3 ± 3.7 (10) | <0.001 * | <0.001 * | <0.001 * |
| Total, score, mean (median) | 75.7 ± 15.8 (77) | 68.7 ± 13.8 (67) | 82.4 ± 14.8 (85) | 45.2 ± 1.6 (46) | 41.2 ± 10.6 (42) | 49.9 ± 13.3 (51) | <0.001 * | 0.01 * | <0.001 * |
| Variable | Pre-Treatment Status (n = 66) | Emotional Distress | Post-Treatment Status (n = 53) | Emotional Distress | p-Value 1 | p-Value 2 | p-Value 3 | ||
|---|---|---|---|---|---|---|---|---|---|
| Low (n = 32) | High (n = 34) | Low (n = 29) | High (n = 24) | ||||||
| Alpha diversity metrics | |||||||||
| Observed species, mean (median) | 321.8 ± 117.5 (319) | 347.2 ± 116.6 (384) | 297.8 ± 115.0 (274) | 278.8 ± 75.9 (268) | 293.1 ± 65.6 (292) | 261.5 ± 84.8 (246) | 0.09 | 0.04 | 0.01 |
| ACE index, mean (median) | 375.7 ± 146.6 (362) | 402.1 ± 141.4 (439) | 350.8 ± 179.0 (306) | 306.8 ± 104.1 (280) | 321.3 ± 79.5 (313) | 289.2 ± 127.8 (263) | 0.16 | 0.03 | 0.003 |
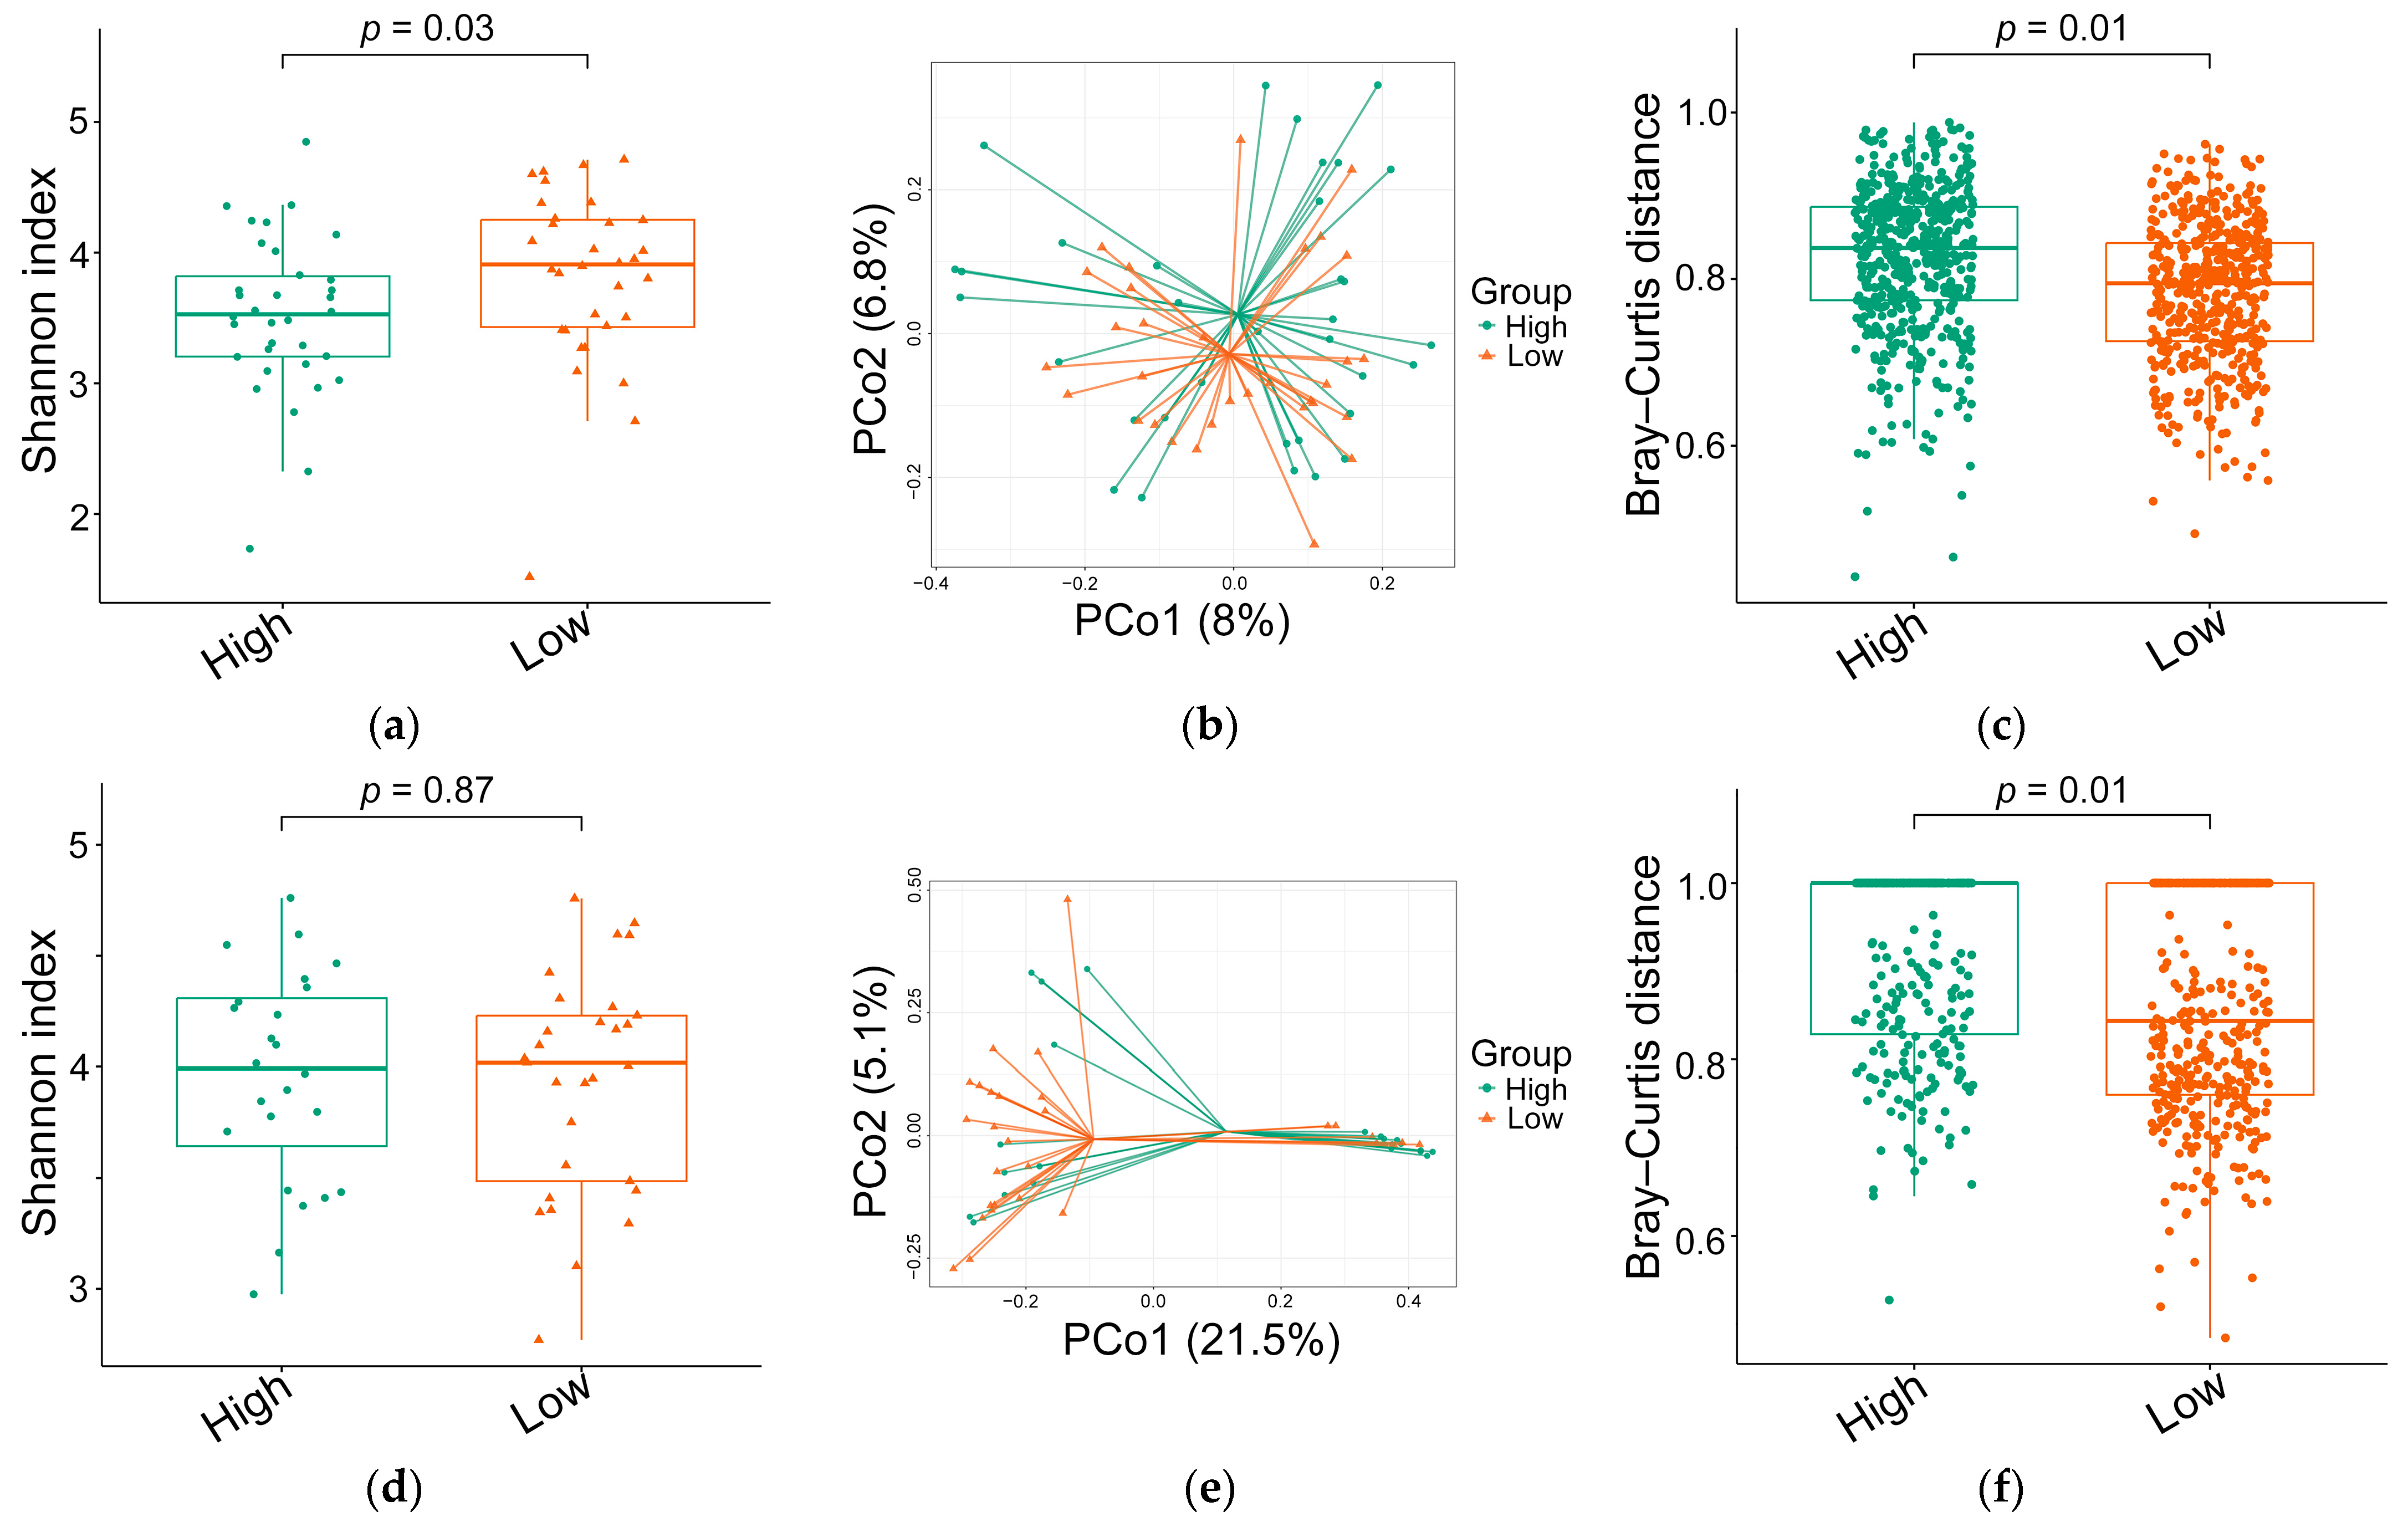
| Shannon index, mean (median) | 3.66 ± 0.65 (3.7) | 3.82 ± 0.67 (3.9) | 3.52 ± 0.61 (3.5) | 3.94 ± 0.48 (4.0) | 3.93 ± 0.50 (4.0) | 3.96 ± 0.48 (4.0) | 0.03 | 0.87 | 0.035 |
| Simpson index, mean (median) | 0.91 ± 0.08 (0.9) | 0.92 ± 0.10 (0.9) | 0.91 ± 0.06 (0.9) | 0.94 ± 0.04 (0.96) | 0.94 ± 0.04 (0.95) | 0.94 ± 0.04 (0.95) | 0.06 | 0.92 | 0.023 |
| Coverage, %, mean (median) | 99.3 ± 0.4 (99) | 99.3 ± 0.3 (99) | 99.3 ± 0.4 (99) | 99.6 ± 0.3 (99.6) | 99.6 ± 0.2 (99.5) | 99.6 ± 0.4 (99.8) | 0.19 | 0.54 | <0.001 |
| Beta diversity | |||||||||
| Bray–Curtis distance, mean (median) | 0.731 ± 0.116 (0.74) | 0.783 ± 0.084 (0.79) | 0.825 ± 0.086 (0.84) | 0.891 ± 0.119 (0.91) | 0.860 ± 0.125 (0.84) | 0.913 ± 0.104 (0.99) | 0.01 | 0.01 | 0.001 |
| Relative abundances of top 30 genera | |||||||||
| Bacteroides, mean (median) | 0.279 ± 0.188 (0.26) | 0.307 ± 0.190 (0.27) | 0.253 ± 0.184 (0.22) | 0.230 ± 0.166 (0.20) | 0.234 ± 0.149 (0.25) | 0.226 ± 0.187 (0.16) | 0.22 | 0.71 | 0.01 |
| Faecalibacterium, mean (median) | 0.070 ± 0.052 (0.06) | 0.073 ± 0.057 (0.05) | 0.068 ± 0.048 (0.07) | 0.072 ± 0.082 (0.04) | 0.086 ± 0.088 (0.06) | 0.056 ± 0.072 (0.03) | 0.65 | 0.06 | 0.98 |
| Subdoligranulum, mean (median) | 0.061 ± 0.101 (0.03) | 0.038 ± 0.054 (0.02) | 0.082 ± 0.128 (0.03) | 0.054 ± 0.096 (0.02) | 0.034 ± 0.043 (0.01) | 0.080 ± 0.133 (0.03) | 0.45 | 0.22 | 0.94 |
| Dialister, mean (median) | 0.037 ± 0.083 (0.01) | 0.044 ± 0.093 (0.01) | 0.030 ± 0.073 (0.003) | 0.024 ± 0.052 (0.003) | 0.021 ± 0.042 (0.003) | 0.027 ± 0.064 (0.002) | 0.09 | 0.31 | 0.24 |
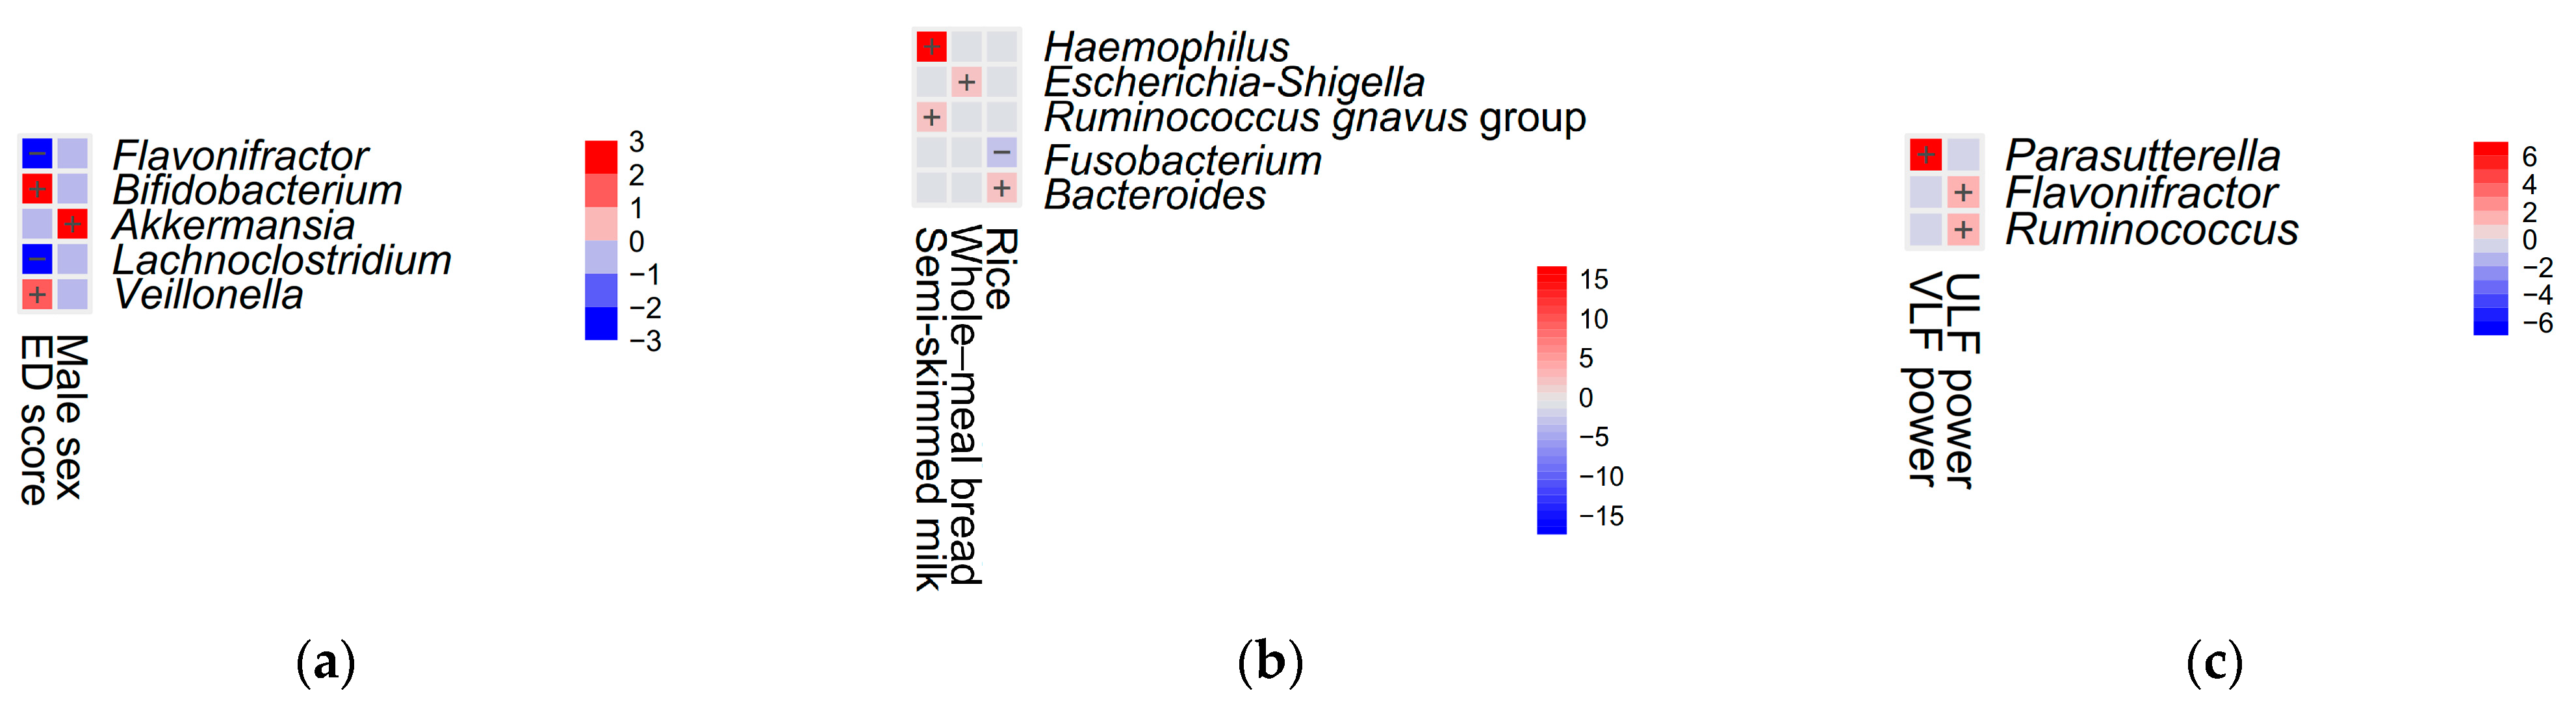
| Bifidobacterium, mean (median) | 0.033 ± 0.052 (0.01) | 0.016 ± 0.031 (0.01) | 0.049 ± 0.062 (0.02) | 0.040 ± 0.071 (0.02) | 0.050 ± 0.092 (0.02) | 0.028 ± 0.030 (0.02) | 0.09 | 0.71 | 0.21 |
| Escherichia shigella, mean (median) | 0.033 ± 0.071 (0.01) | 0.025 ± 0.032 (0.01) | 0.040 ± 0.094 (0.01) | 0.048 ± 0.091 (0.01) | 0.038 ± 0.093 (0.01) | 0.060 ± 0.090 (0.01) | 0.07 | 0.56 | 0.39 |
| Roseburia, mean (median) | 0.029 ± 0.055 (0.01) | 0.033 ± 0.049 (0.02) | 0.025 ± 0.041 (0.01) | 0.013 ± 0.022 (0.01) | 0.014 ± 0.019 (0.01) | 0.010 ± 0.025 (0.005) | 0.42 | 0.12 | 0.01 |
| Prevotella, mean (median) | 0.026 ± 0.078 (0.003) | 0.010 ± 0.029 (0.002) | 0.040 ± 0.104 (0.003) | 0.035 ± 0.095 (0.002) | 0.031 ± 0.103 (0.003) | 0.040 ± 0.086 (0.002) | 0.10 | 0.83 | 0.09 |
| Agathobacter, mean (median) | 0.025 ± 0.039 (0.01) | 0.024 ± 0.035 (0.01) | 0.027 ± 0.043 (0.01) | 0.020 ± 0.035 (0.01) | 0.026 ± 0.043 (0.01) | 0.012 ± 0.019 (0.01) | 0.95 | 0.28 | 0.41 |
| Parabacteroides, mean (median) | 0.021 ± 0.029 (0.01) | 0.029 ± 0.035 (0.02) | 0.014 ± 0.016 (0.01) | 0.026 ± 0.036 (0.01) | 0.030 ± 0.045 (0.01) | 0.021 ± 0.021 (0.01) | 0.04 | 0.68 | 0.44 |
| Ruminococcus gnavus group, mean (median) | 0.021 ± 0.035 (0.01) | 0.017 ± 0.021 (0.01) | 0.024 ± 0.05 (0.004) | 0.031 ± 0.052 (0.01) | 0.034 ± 0.056 (0.01) | 0.027 ± 0.049 (0.01) | 0.03 | 0.55 | 0.12 |
| Akkermansia, mean (median) | 0.021 ± 0.088 (0.001) | 0.024 ± 0.105 (0.001) | 0.017 ± 0.070 (0.001) | 0.009 ± 0.026 (0.001) | 0.010 ± 0.026 (0.004) | 0.009 ± 0.027 (0.001) | 0.96 | 0.19 | 0.28 |
| Phascolarctobacterium, mean (median) | 0.019 ± 0.029 (0.01) | 0.022 ± 0.029 (0.01) | 0.016 ± 0.028 (0.003) | 0.022 ± 0.033 (0.01) | 0.013 ± 0.017 (0.01) | 0.032 ± 0.044 (0.01) | 0.10 | 0.69 | 0.72 |
| Veillonella, mean (median) | 0.015 ± 0.028 (0.004) | 0.010 ± 0.018 (0.003) | 0.019 ± 0.034 (0.01) | 0.013 ± 0.026 (0.003) | 0.014 ± 0.025 (0.004) | 0.011 ± 0.027 (0.003) | 0.06 | 0.20 | 0.51 |
| Parasutterella, mean (median) | 0.015 ± 0.041 (0.001) | 0.016 ± 0.047 (0.002) | 0.013 ± 0.035 (0.001) | 0.007 ± 0.019 (0.001) | 0.006 ± 0.019 (0.001) | 0.008 ± 0.019 (0.001) | 0.82 | 0.73 | 0.21 |
| Fusobacterium, mean (median) | 0.013 ± 0.042 (0.003) | 0.008 ± 0.013 (0.003) | 0.019 ± 0.057 (0.003) | 0.009 ± 0.019 (0.001) | 0.012 ± 0.023 (0.002) | 0.006 ± 0.012 (0.001) | 0.43 | 0.33 | 0.56 |
| Blautia, mean (median) | 0.013 ± 0.032 (0.004) | 0.020 ± 0.044 (0.01) | 0.007 ± 0.012 (0.003) | 0.013 ± 0.018 (0.01) | 0.013 ± 0.015 (0.01) | 0.012 ± 0.021 (0.01) | 0.01 | 0.35 | 0.87 |
| Lachnoclostridium, mean (median) | 0.011 ± 0.011 (0.01) | 0.014 ± 0.009 (0.01) | 0.009 ± 0.012 (0.01) | 0.021 ± 0.027 (0.01) | 0.021 ± 0.025 (0.01) | 0.021 ± 0.029 (0.009) | 0.001 * | 0.62 | 0.01 |
| Lachnospiraceae NK4A136 group, mean (median) | 0.011 ± 0.018 (0.005) | 0.013 ± 0.021 (0.01) | 0.009 ± 0.013 (0.004) | 0.015 ± 0.060 (0.003) | 0.006 ± 0.006 (0.003) | 0.025 ± 0.089 (0.003) | 0.63 | 0.83 | 0.72 |
| Eubacterium coprostanoligenes group, mean (median) | 0.010 ± 0.025 (0.001) | 0.009 ± 0.023 (0.001) | 0.104 ± 0.027 (0.002) | 0.018 ± 0.043 (0.003) | 0.017 ± 0.038 (0.004) | 0.019 ± 0.049 (0.001) | 0.33 | 0.23 | 0.016 |
| Eubacterium eligens group, mean (median) | 0.009 ± 0.030 (0.003) | 0.006 ± 0.010 (0.003) | 0.013 ± 0.040 (0.003) | 0.004 ± 0.010 (0.001) | 0.004 ± 0.011 (0.001) | 0.005 ± 0.009 (0.001) | 0.76 | 0.83 | 0.16 |
| Alistipes, mean (median) | 0.009 ± 0.018 (0.002) | 0.010 ± 0.017 (0.003) | 0.008 ± 0.019 (0.002) | 0.018 ± 0.040 (0.003) | 0.020 ± 0.051 (0.002) | 0.014 ± 0.019 (0.01) | 0.26 | 0.44 | 0.10 |
| Haemophilus, mean (median) | 0.008 ± 0.018 (0.004) | 0.004 ± 0.004 (0.003) | 0.012 ± 0.024 (0.005) | 0.008 ± 0.030 (0.003) | 0.012 ± 0.040 (0.004) | 0.003 ± 0.004 (0.002) | 0.06 | 0.03 | 0.85 |
| Streptococcus, mean (median) | 0.008 ± 0.015 (0.003) | 0.007 ± 0.014 (0.003) | 0.008 ± 0.016 (0.003) | 0.013 ± 0.022 (0.003) | 0.013 ± 0.022 (0.003) | 0.013 ± 0.023 (0.004) | 0.71 | 0.81 | 0.06 |
| Acidaminococcus, mean (median) | 0.007 ± 0.025 (0.001) | 0.011 ± 0.033 (0.001) | 0.004 ± 0.012 (0.001) | 0.005 ± 0.011 (0.001) | 0.006 ± 0.012 (0.001) | 0.005 ± 0.010 (0.001) | 0.31 | 0.20 | 0.42 |
| Klebsiella, mean (median) | 0.007 ± 0.018 (0.002) | 0.006 ± 0.013 (0.002) | 0.008 ± 0.021 (0.002) | 0.003 ± 0.007 (0.001) | 0.002 ± 0.003 (0.001) | 0.005 ± 0.010 (0.001) | 0.26 | 0.82 | 0.09 |
| Ruminococcus, mean (median) | 0.007 ± 0.018 (0.002) | 0.006 ± 0.020 (0.002) | 0.008 ± 0.016 (0.002) | 0.006 ± 0.012 (0.002) | 0.009 ± 0.015 (0.003) | 0.003 ± 0.004 (0.001) | 0.09 | 0.04 | 0.56 |
| Collinsella, mean (median) | 0.006 ± 0.026 (0.001) | 0.008 ± 0.037 (0.001) | 0.004 ± 0.007 (0.001) | 0.013 ± 0.037 (0.003) | 0.019 ± 0.048 (0.003) | 0.005 ± 0.010 (0.002) | 0.97 | 0.14 | 0.35 |
| Ruminococcus torques group, mean (median) | 0.006 ± 0.007 (0.005) | 0.006 ± 0.005 (0.005) | 0.006 ± 0.008 (0.004) | 0.009 ± 0.014 (0.004) | 0.011 ± 0.018 (0.005) | 0.005 ±0.006 (0.003) | 0.21 | 0.13 | 0.24 |
| Flavonifractor, mean (median) | 0.006 ± 0.012 (0.003) | 0.010 ± 0.016 (0.004) | 0.003 ± 0.004 (0.002) | 0.005 ± 0.005 (0.003) | 0.005 ± 0.004 (0.003) | 0.006 ± 0.006 (0.003) | <0.001 * | 0.80 | 0.46 |
| Variable | Pre-Treatment Status (n = 66) | Emotional Distress | Post-Treatment Status (n = 53) | Emotional Distress | p-Value 1 | p-Value 2 | p-Value 3 | ||
|---|---|---|---|---|---|---|---|---|---|
| Low (n = 32) | High (n = 34) | Low (n = 29) | High (n = 24) | ||||||
| Full-fat milk, scale, mean (median) | 2.1 ± 1.2 (2) | 2.0 ± 1.2 (2) | 2.2 ± 1.2 (2) | 2.6 ± 1.3 (3) | 2.4 ± 1.3 (3) | 2.8 ± 1.3 (3) | 0.57 | 0.30 | 0.02 |
| Low-fat milk, scale, mean (median) | 0.2 ± 0.6 (0) | 0.3 ± 0.7 (0) | 0.2 ± 0.5 (0) | 0.4 ± 0.9 (0) | 0.5 ± 0.9 (0) | 0.3 ± 1.0 (0) | 0.62 | 0.67 | 0.23 |
| Semi-skimmed milk, scale, mean (median) | 0.02 ± 0.1 (0) | 0.0 ± 0.0 (0) | 0.03 ± 0.03 (0) | 0.1 ± 0.3 (0) | 0.1 ± 0.3 (0) | 0.1 ± 0.4 (0) | 0.34 | 0.88 | 0.08 |
| Skimmed milk, scale, mean (median) | 0.1 ± 0.5 (0) | 0.0 ± 0.0 (0) | 0.2 ± 0.7 (0) | 0.1 ± 0.3 (0) | 0.1 ± 0.3 (0) | 0.1 ± 0.4 (0) | 0.24 | 0.88 | 0.82 |
| Orange juice, scale, mean (median) | 0.7 ± 0.6 (1) | 0.5 ± 0.6 (0) | 0.8 ± 0.7 (1) | 0.4 ± 0.6 (0) | 0.3 ± 0.5 (0) | 0.5 ± 0.8 (0) | 0.02 | 0.19 | 0.13 |
| Fruit drink with sugar, scale, mean (median) | 1.2 ± 0.9 (1) | 1.3 ± 1.0 (1) | 1.2 ± 0.8 (1) | 1.3 ± 0.9 (1) | 1.2 ± 0.8 (1) | 1.4 ± 1.0 (1) | 0.45 | 0.41 | 0.82 |
| Fruit drink without sugar, scale, mean (median) | 0.5 ± 1.0 (0) | 0.5 ± 0.9 (0) | 0.5 ± 1.2 (0) | 0.3 ± 0.7 (0) | 0.2 ± 0.5 (0) | 0.5 ± 0.8 (0) | 0.81 | 0.18 | 0.18 |
| Soft drinks with sugar, scale, mean (median) | 0.7 ± 1.0 (0) | 0.8 ± 1.0 (0) | 0.8 ± 0.9 (0) | 0.7 ± 1.1 (0) | 0.9 ± 1.2 (0) | 0.4 ± 0.8 (0) | 0.76 | 0.08 | 0.70 |
| Soft drinks without sugar, scale, mean (median) | 0.3 ± 0.8 (0) | 0.3 ± 0.7 (0) | 0.2 ± 0.8 (0) | 0.2 ± 0.5 (0) | 0.2 ± 0.6 (0) | 0.04 ± 0.2 (0) | 0.57 | 0.11 | 0.32 |
| Boiled potatoes, scale, mean (median) | 0.3 ± 0.5 (0) | 0.2 ± 0.4 (0) | 0.4 ± 0.6 (0) | 0.3 ± 0.5 (0) | 0.2 ± 0.4 (0) | 0.3 ± 0.6 (0) | 0.045 | 0.51 | >0.99 |
| Potato chips, scale, mean (median) | 0.9 ± 0.6 (1) | 0.8 ± 0.7 (1) | 1.0 ± 0.5 (1) | 1.1 ± 0.8 (1) | 1.0 ± 0.6 (1) | 1.3 ± 1.0 (1) | 0.22 | 0.09 | 0.02 |
| Vegetables, scale, mean (median) | 4.5 ± 1.2 (5) | 4.5 ± 1.1 (5) | 4.4 ± 1.3 (5) | 4.5 ± 1.3 (5) | 4.8 ± 1.1 (5) | 4.1 ± 1.5 (5) | 0.62 | 0.06 | 0.92 |
| Fruit/berries, scale, mean (median) | 3.1 ± 1.3 (3) | 2.9 ± 1.5 (3) | 3.3 ± 1.3 (4) | 3.1 ± 1.5 (3) | 3.0 ± 1.4 (3) | 3.3 ± 1.6 (4) | 0.31 | 0.56 | 0.85 |
| Whole-meal bread, scale, mean (median) | 0.9 ± 1.1 (1) | 0.8 ± 1.1 (1) | 0.9 ± 1.1 (1) | 0.6 ± 0.9 (0) | 0.8 ± 0.8 (1) | 0.6 ± 1.0 (0) | 0.63 | 0.48 | 0.28 |
| Fish for dinner, scale, mean (median) | 2.1 ± 1.6 (2) | 2.2 ± 1.5 (2) | 1.9 ± 1.7 (2) | 2.2 ± 1.5 (2) | 2.7 ± 1.5 (2) | 1.7 ± 1.3 (1) | 0.59 | 0.02 | 0.45 |
| Pizza, scale, mean (median) | 0.6 ± 0.6 (1) | 0.4 ± 0.5 (0) | 0.7 ± 0.6 (1) | 0.7 ± 0.5 (1) | 0.6 ± 0.5 (1) | 0.8 ± 0.6 (1) | 0.03 | 0.54 | 0.07 |
| Hamburgers/hot dogs/kebabs, scale, mean (median) | 0.9 ± 0.8 (1) | 0.9 ± 0.7 (1) | 0.9 ± 0.8 (1) | 0.8 ± 0.6 (1) | 0.9 ± 0.7 (1) | 0.7 ± 0.6 (1) | 0.97 | 0.28 | 0.73 |
| Sweets, scale, mean (median) | 1.7 ± 1.0 (2) | 1.6 ± 1.1 (1) | 1.9 ± 0.9 (2) | 1.8 ± 1.1 (2) | 1.8 ± 1.1 (2) | 1.8 ± 1.1 (2) | 0.20 | 0.81 | 0.64 |
| Chocolate, scale, mean (median) | 1.3 ± 0.8 (1) | 1.2 ± 0.8 (1) | 1.3 ± 0.9 (1) | 1.2 ± 0.8 (1) | 1.3 ± 0.8 (1) | 1.1 ± 0.9 (1) | 0.72 | 0.51 | >0.99 |
| Savory snacks, scale, mean (median) | 1.8 ± 1.2 (2) | 1.5 ± 1.2 (1) | 2.2 ± 1.2 (2) | 1.7 ± 1.3 (1) | 1.5 ± 1.1 (1) | 2.0 ± 1.4 (2) | 0.03 | 0.15 | 0.92 |
| Peanuts, scale, mean (median) | 0.6 ± 0.8 (1) | 0.7 ± 0.7 (1) | 0.6 ± 0.8 (0) | 0.5 ± 0.6 (0) | 0.5 ± 0.6 (0) | 0.5 ± 0.5 (0) | 0.84 | 0.72 | 0.37 |
| Cod liver oil/vitamin supplements, scale, mean (median) | 0.7 ± 1.2 (0) | 0.6 ± 1.1 (0) | 0.8 ± 1.4 (0) | 0.8 ± 1.5 (0) | 0.6 ± 1.3 (0) | 1.1 ± 1.7 (0) | 0.46 | 0.27 | 0.12 |
| Butter/margarine on bread (yes), % (n) | 44 (29) | 34 (11) | 53 (18) | 40 (21) | 35 (10) | 46 (11) | 0.15 | 0.57 | >0.99 |
| Rice, scale, mean (median) | 4.8 ± 1.0 (5) | 5.0 ± 0.6 (5) | 4.6 ± 1.2 (5) | 4.7 ± 0.9 (5) | 4.9 ± 0.9 (5) | 4.5 ± 1.0 (5) | 0.09 | 0.22 | 0.24 |
| Noodles, scale, mean (median) | 3.1 ± 1.3 (3) | 2.9 ± 1.2 (3) | 3.2 ± 1.4 (3) | 3.0 ± 1.2 (3) | 2.8 ± 1.1 (3) | 3.3 ± 1.2 (4) | 0.28 | 0.19 | 0.73 |
| Variable | Pre-Treatment Status (n = 66) | Emotional Distress | Post-Treatment Status (n = 53) | Emotional Distress | p-Value 1 | p-Value 2 | p-Value 3 | ||
|---|---|---|---|---|---|---|---|---|---|
| Low (n = 32) | High (n = 34) | Low (n = 29) | High (n = 24) | ||||||
| Total power, ms2, mean (median) | 10,455.3 ± 7605.8 (8116) | 12,569.1 ± 7804.7 (10,317) | 8552.8 ± 7013.6 (5696) | 7730.9 ± 5979.0 (5968) | 9238.2 ± 6917.1 (6963) | 5812.6 ± 3874.6 (5042) | 0.045 | 0.04 | 0.002 * |
| ULF power, ms2, mean (median) | 3279.2 ± 2601.3 (2316) | 4006.9 ± 2864.7 (2896) | 2624.3 ± 2184.7 (1794) | 2462.8 ± 1751.3 (2077) | 2763.1 ± 1881.3 (2149) | 2080.4 ± 1527.3 (1705) | 0.03 | 0.17 | 0.049 |
| VLF power, ms2, mean (median) | 1995.7 ± 2544.5 (1409) | 2530.8 ± 3494.7 (1716) | 1514.1 ± 1023.1 (1164) | 1620.6 ± 1042.9 (1391) | 1928.3 ± 1171.4 (1606) | 1228.9 ± 697.6 (1354) | 0.13 | 0.02 | 0.21 |
| LF power, ms2, mean (median) | 1792.6 ± 1590.8 (1217) | 2216.6 ± 1725.0 (1801) | 1411.1 ± 1378.7 (922) | 1311.1 ± 1292.2 (940) | 1602.7 ± 1535.8 (1101) | 940.1 ± 778.5 (722) | 0.06 | 0.07 | 0.003 * |
| HF power, ms2, mean (median) | 3134.2 ± 3078.0 (1841) | 3530.9 ± 2938.0 (3064) | 2777.3 ± 3205.9 (1460) | 2320.3 ± 3003.5 (1169) | 2988.4 ± 3689.4 (1367) | 1470.1 ± 1481.9 (945) | 0.36 | 0.08 | 0.02 * |
| LF/HF ratio, mean (median) | 0.811 ± 0.643 (0.56) | 0.817 ± 0.580 (0.63) | 0.805 ± 0.705 (0.53) | 0.966 ± 0.642 (0.75) | 0.924 ± 0.629 (0.75) | 1.019 ± 0.668 (0.71) | 0.95 | 0.61 | 0.15 |
| Variable | Predictive Model of Emotional Distress | ||||
|---|---|---|---|---|---|
| Regression Coefficient (95% CI) | p-Value | VIF | Adjusted R2 | ||
| Predictive model of emotional distress score | |||||
| Model 1 | Shannon index | −1.6 (−2.9 to −0.2) | 0.02 | 1.05 | 0.28 |
| Veillonella | 31.5 (0.02 to 63.0) | 0.049 | 1.06 | ||
| Bifidobacterium | 23.1 (6.7 to 39.6) | 0.01 | 1.05 | ||
| Flavonifractor | −100.3 (−171.4 to −29.3) | 0.01 | 1.02 | ||
| Model 2 | Bifidobacterium | 41.8 (14.7 to 68.9) | 0.003 | 1.10 | 0.29 |
| Flavonifractor | −256.4 (−445.3 to −67.5) | 0.01 | 1.17 | ||
| ULF power | −0.0004 (−0.001 to −0.00001) | 0.049 | 1.08 | ||
| Predictive model of change in emotional distress score | |||||
| Model 3 | Change in Veillonella | 41.3 (3.3 to 79.2) | 0.03 | 1.02 | 0.14 |
| Change in Agathobacter | 24.9 (2.2 to 47.6) | 0.03 | 1.02 | ||
| Model 4 | Change in Veillonella | 47.8 (10.9–84.8) | 0.01 | 1.02 | 0.20 |
| Change in LF power | −0.001 (−0.002–−0.0001) | 0.01 | 1.02 | ||
Disclaimer/Publisher’s Note: The statements, opinions and data contained in all publications are solely those of the individual author(s) and contributor(s) and not of MDPI and/or the editor(s). MDPI and/or the editor(s) disclaim responsibility for any injury to people or property resulting from any ideas, methods, instructions or products referred to in the content. |
© 2024 by the authors. Licensee MDPI, Basel, Switzerland. This article is an open access article distributed under the terms and conditions of the Creative Commons Attribution (CC BY) license (https://creativecommons.org/licenses/by/4.0/).
Share and Cite
Huang, C.-G.; Lin, W.-N.; Hsin, L.-J.; Huang, Y.-S.; Chuang, L.-P.; Fang, T.-J.; Li, H.-Y.; Kuo, T.B.J.; Yang, C.C.H.; Lee, C.-C.; et al. Alterations in Gut Microbiota Composition Are Associated with Changes in Emotional Distress in Children with Obstructive Sleep Apnea. Microorganisms 2024, 12, 2626. https://doi.org/10.3390/microorganisms12122626
Huang C-G, Lin W-N, Hsin L-J, Huang Y-S, Chuang L-P, Fang T-J, Li H-Y, Kuo TBJ, Yang CCH, Lee C-C, et al. Alterations in Gut Microbiota Composition Are Associated with Changes in Emotional Distress in Children with Obstructive Sleep Apnea. Microorganisms. 2024; 12(12):2626. https://doi.org/10.3390/microorganisms12122626
Chicago/Turabian StyleHuang, Chung-Guei, Wan-Ni Lin, Li-Jen Hsin, Yu-Shu Huang, Li-Pang Chuang, Tuan-Jen Fang, Hsueh-Yu Li, Terry B. J. Kuo, Cheryl C. H. Yang, Chin-Chia Lee, and et al. 2024. "Alterations in Gut Microbiota Composition Are Associated with Changes in Emotional Distress in Children with Obstructive Sleep Apnea" Microorganisms 12, no. 12: 2626. https://doi.org/10.3390/microorganisms12122626
APA StyleHuang, C.-G., Lin, W.-N., Hsin, L.-J., Huang, Y.-S., Chuang, L.-P., Fang, T.-J., Li, H.-Y., Kuo, T. B. J., Yang, C. C. H., Lee, C.-C., & Lee, L.-A. (2024). Alterations in Gut Microbiota Composition Are Associated with Changes in Emotional Distress in Children with Obstructive Sleep Apnea. Microorganisms, 12(12), 2626. https://doi.org/10.3390/microorganisms12122626