
Dual Roles of Heterotrophic Ammonia-Oxidizing Bacteria in Enhancing Compensatory Growth upon Post-Drought in Maize


Abstract
1. Introduction
2. Materials and Methods
2.1. Experimental Design
2.1.1. Experiment 1
2.1.2. Experiment 2
2.1.3. Soil Moisture Regulation
2.2. Measurements
2.2.1. Biomass, Water Use Efficiency, and Soil Nitrification Rate
2.2.2. Zeatin Riboside
2.2.3. Data Analysis
3. Results
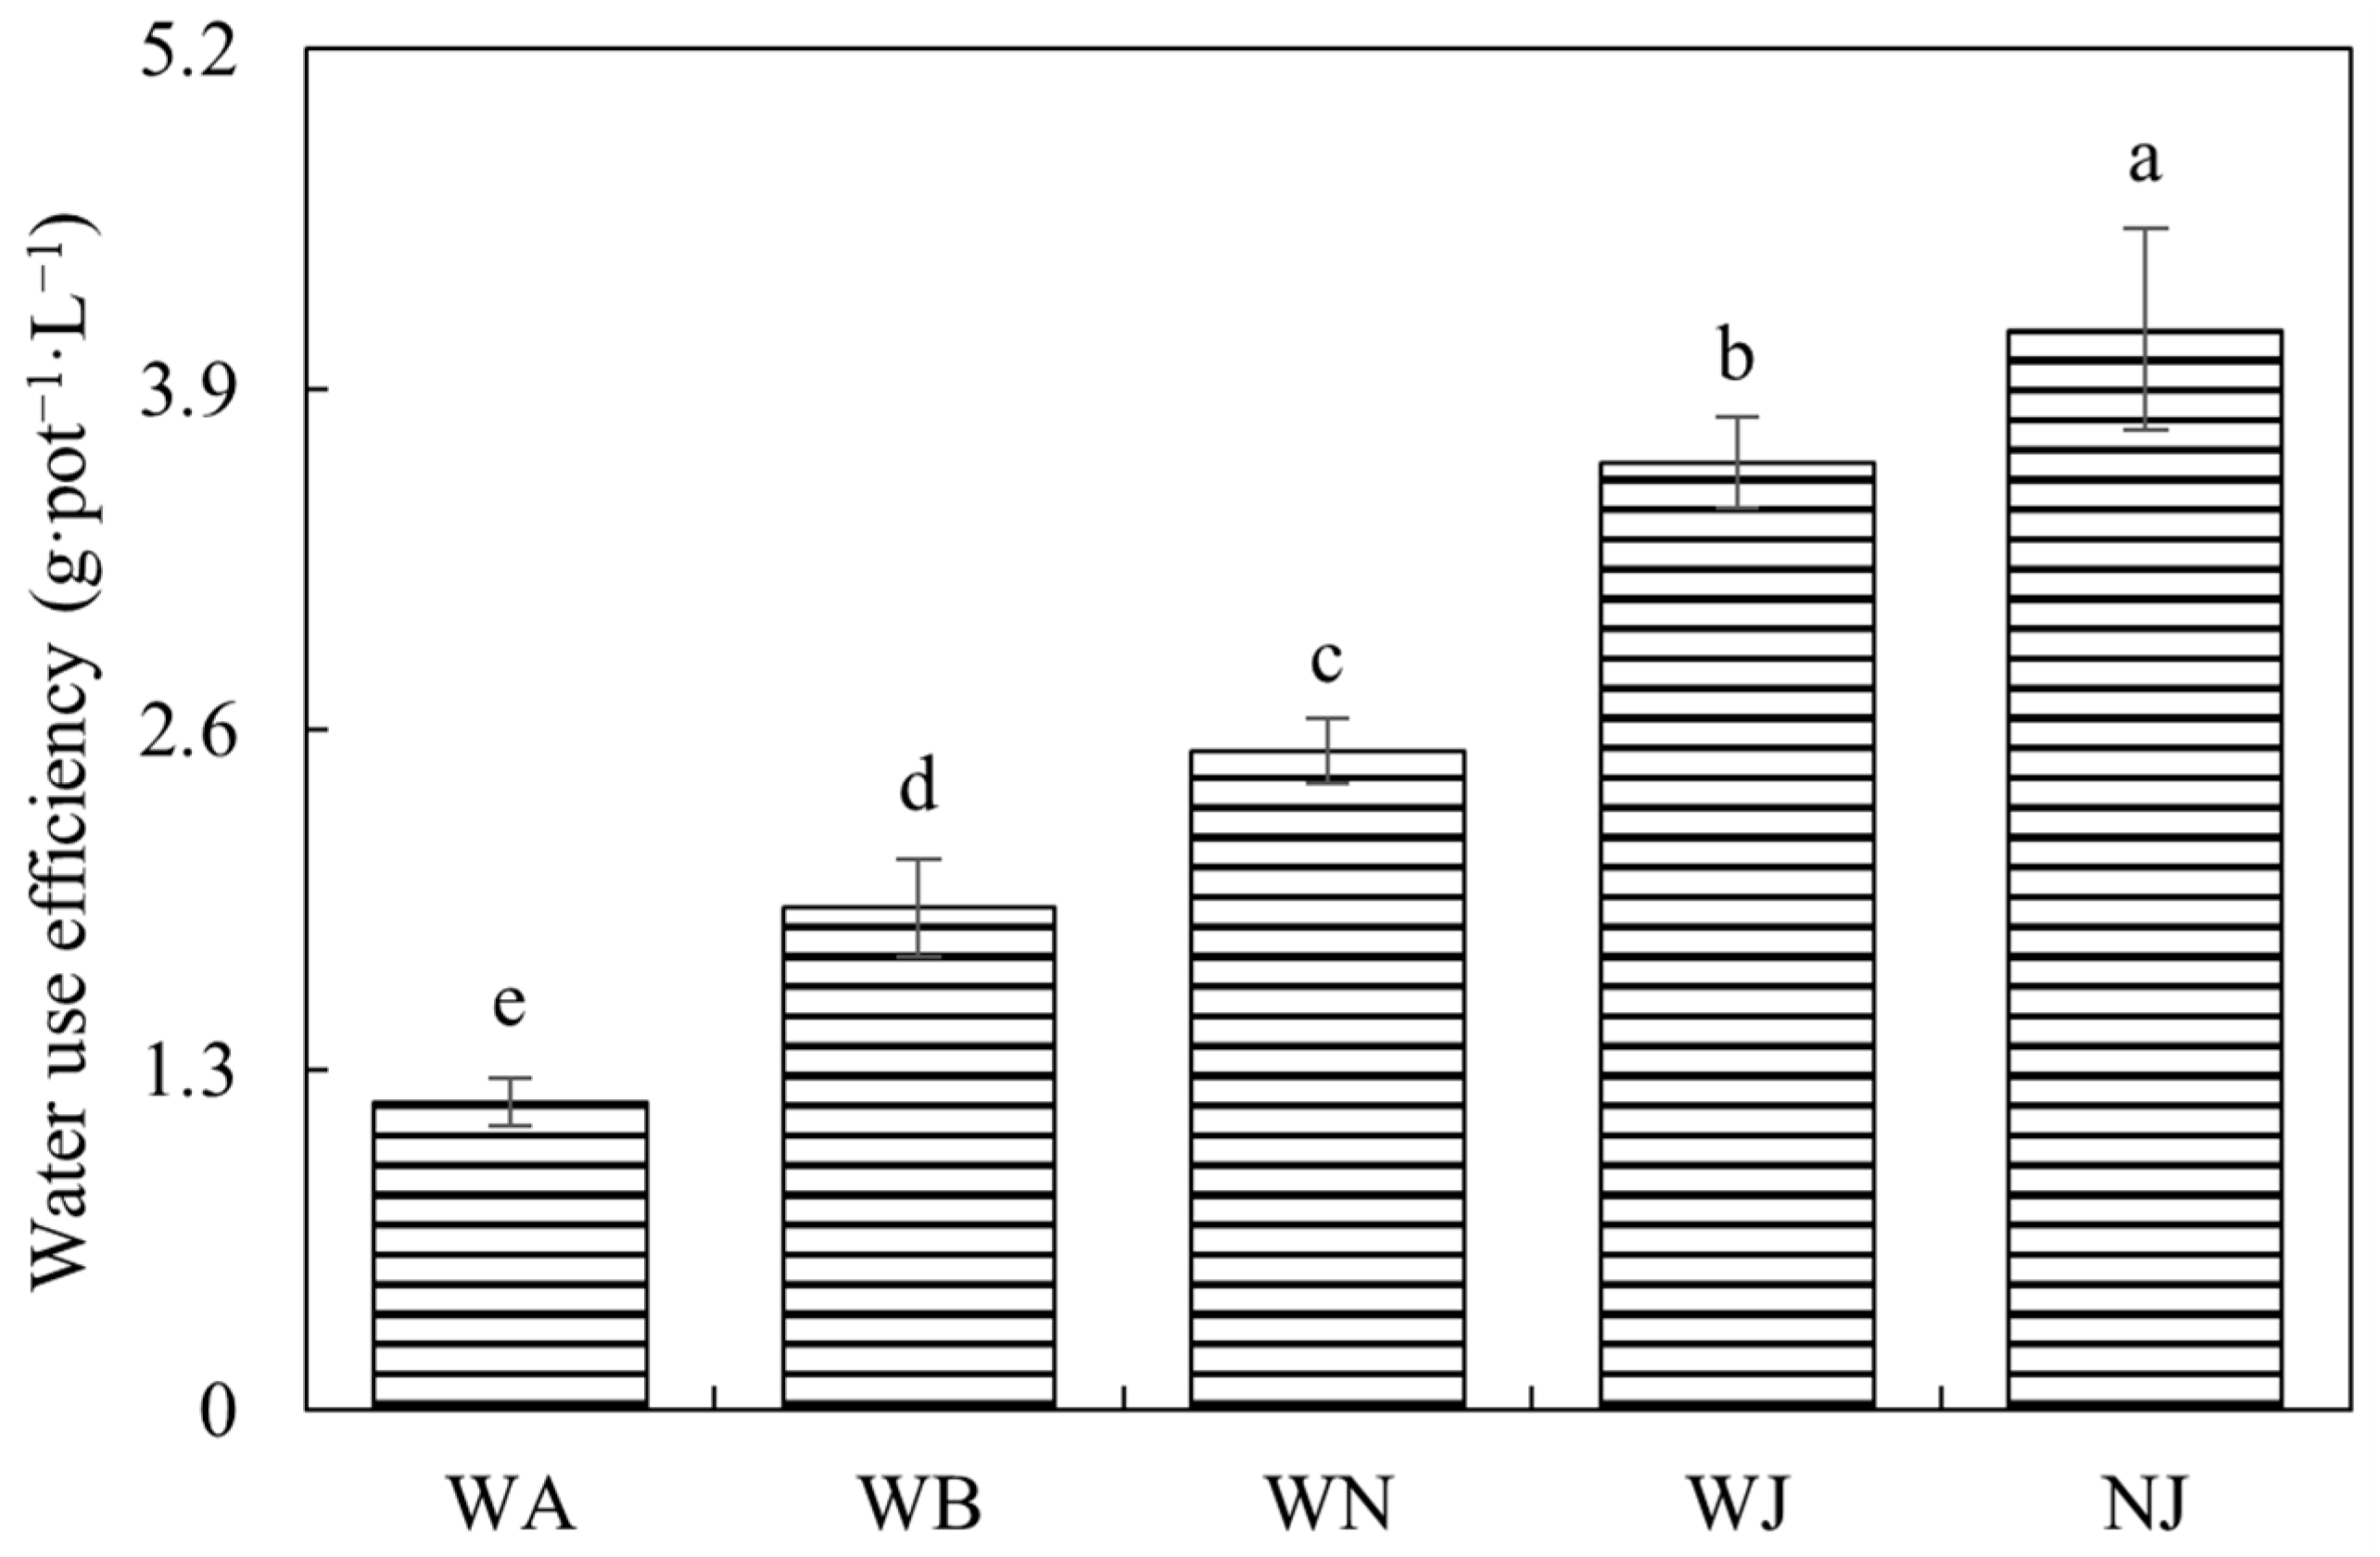
3.1. Exp-1
3.2. Exp-2
3.2.1. Biomass
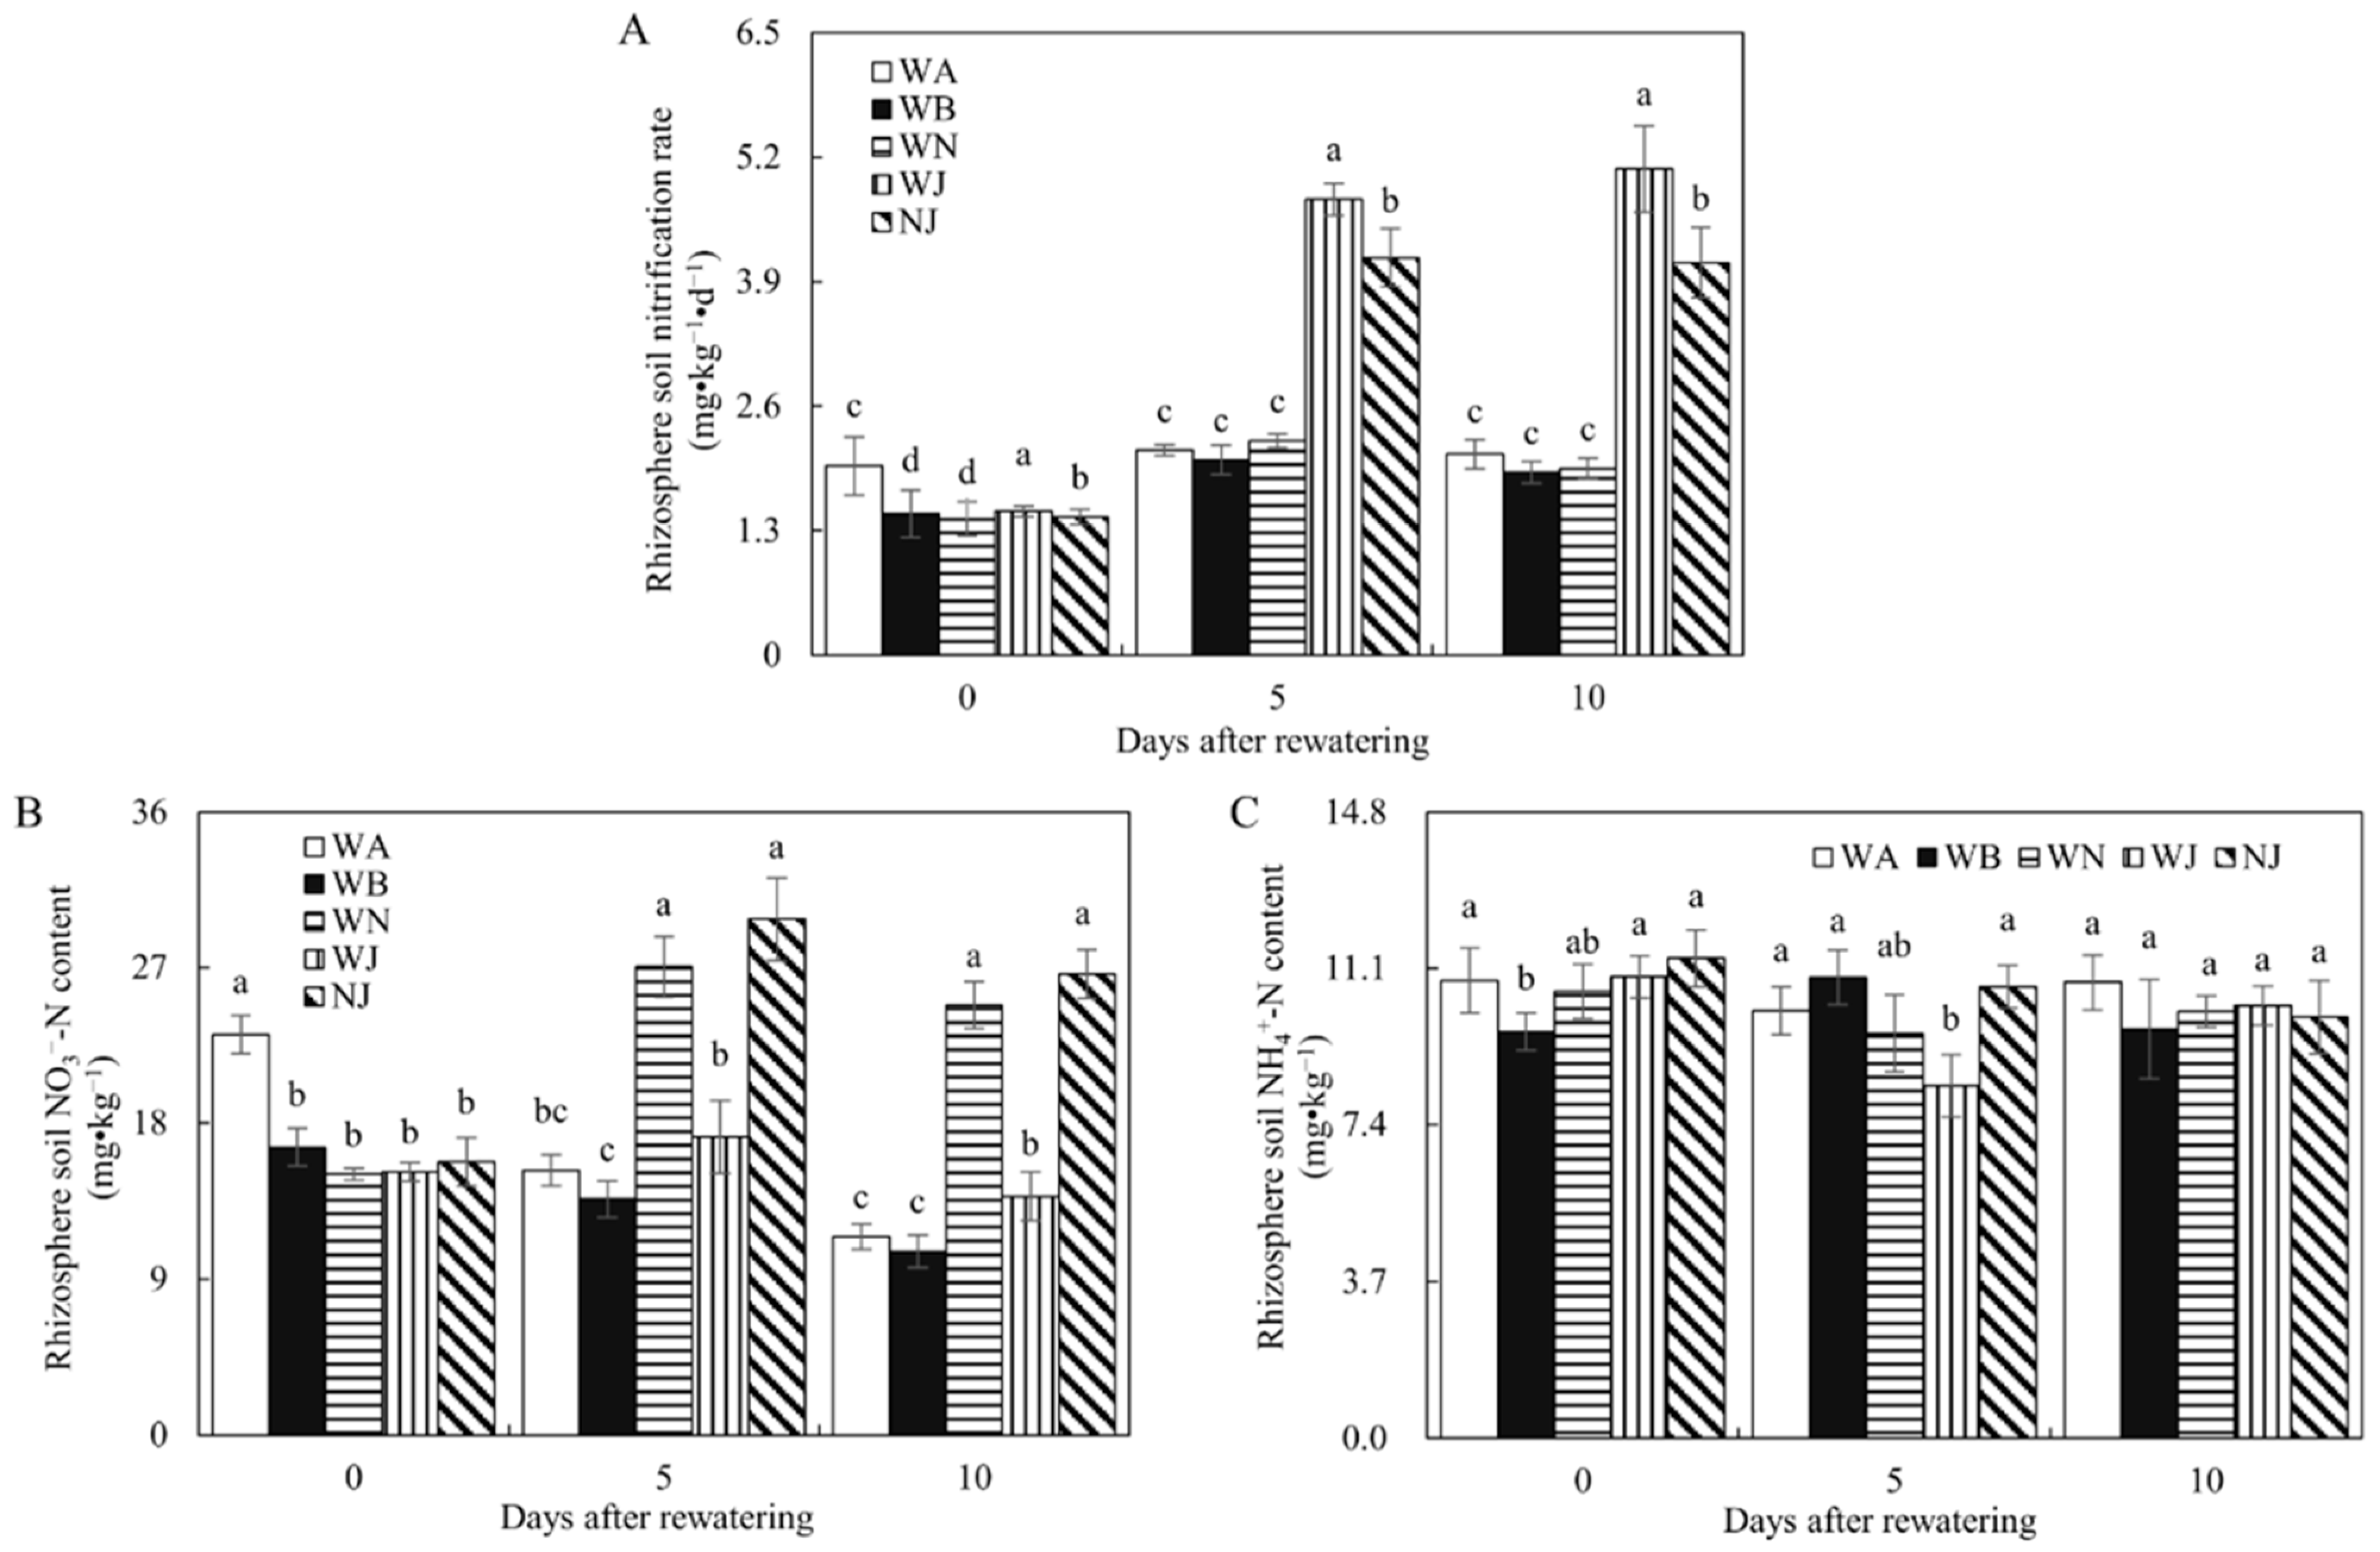
3.2.2. Rhizosphere Soil Nitrification
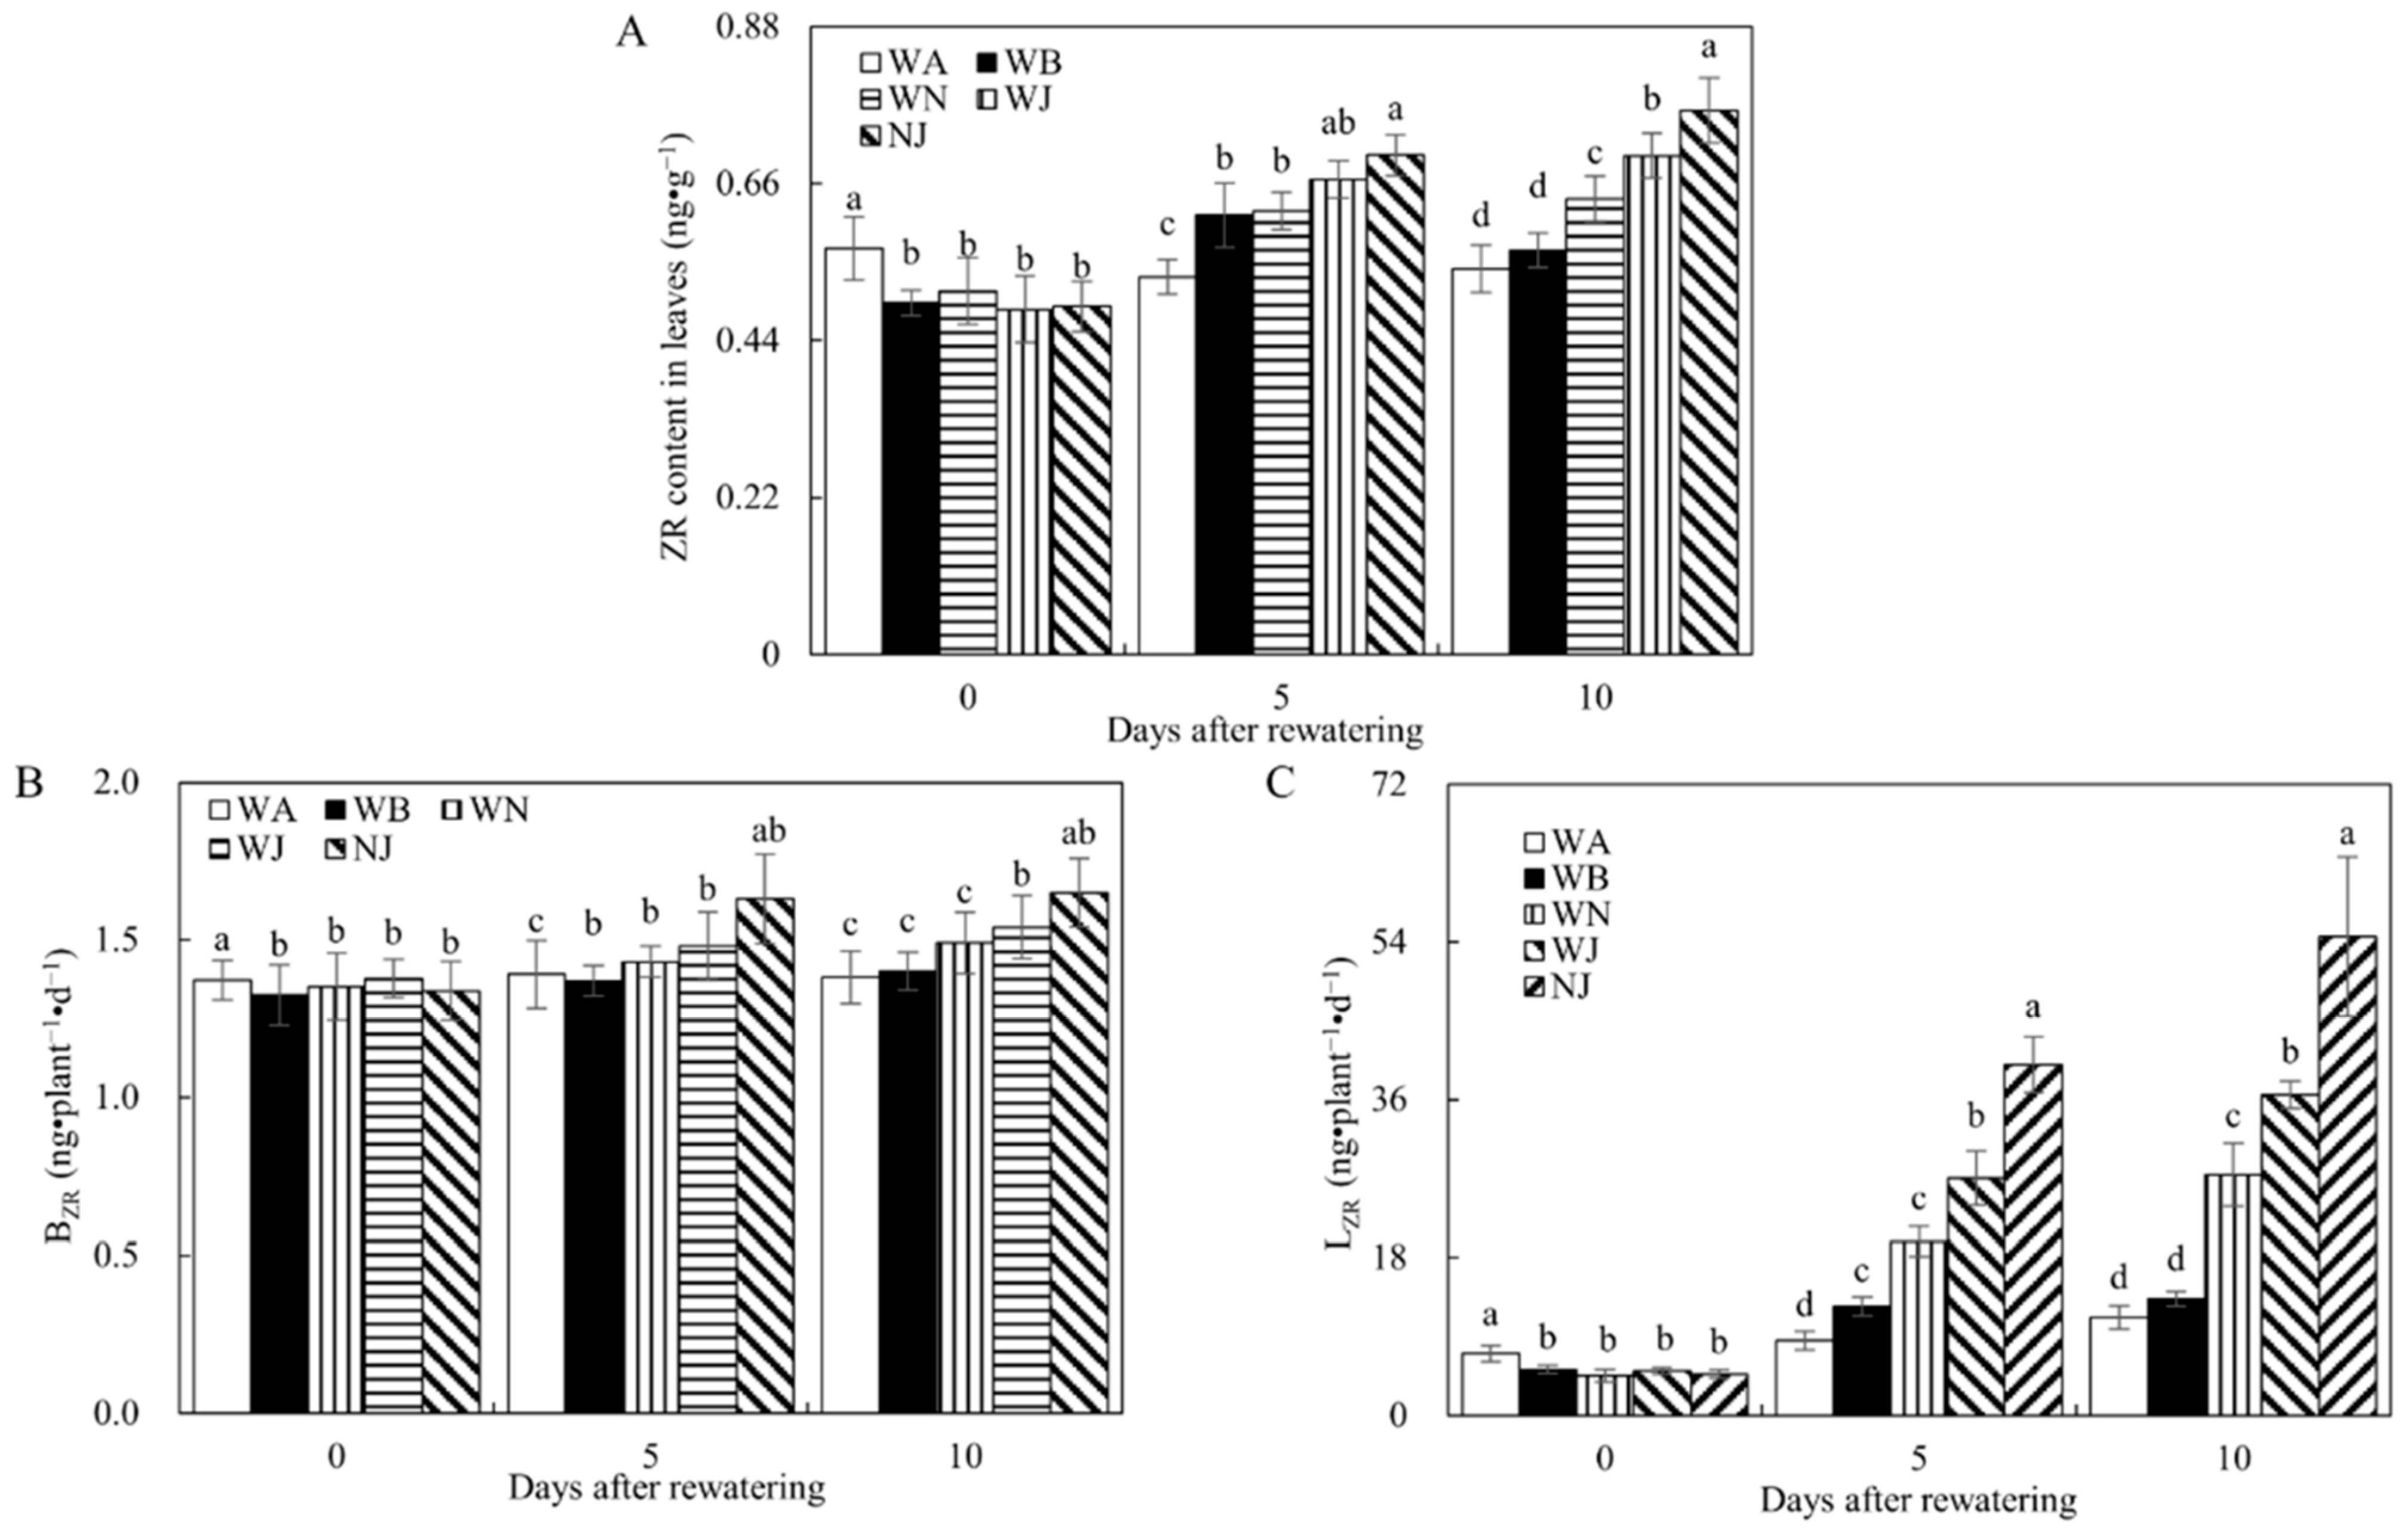
3.2.3. Zeatin Riboside
4. Discussion
4.1. Ideal Nitrate for Growth Enhancement
4.2. Dual Functions for Enhancing Growth
4.3. Implications for the Role of the HAOB Dual Pathway
5. Conclusions
Author Contributions
Funding
Data Availability Statement
Acknowledgments
Conflicts of Interest
References
- Rosa, L.; Chiarelli, D.D.; Rulli, M.C.; Dell’angelo, J.; D’odorico, P. Global agricultural economic water scarcity. Sci. Adv. 2020, 6, eaaz6031. [Google Scholar] [CrossRef] [PubMed]
- Weindl, I.; Bodirsky, B.L.; Rolinski, S.; Biewald, A.; Lotze-Campen, H.; Müller, C.; Dietrich, J.P.; Humpenöder, F.; Stevanović, M.; Schaphoff, S.; et al. Livestock production and the water challenge of future food supply: Implications of agricultural management and dietary choices. Glob. Environ. Chang. 2017, 47, 121–132. [Google Scholar] [CrossRef]
- Farooq, M.; Wahid, A.; Kobayashi, N.; Fujita, D.; Basra, S.M.A. Plant drought stress: Effects, mechanisms and management. Sustain. Agric. 2009, 29, 185–212. [Google Scholar] [CrossRef]
- Yang, X.; Lu, M.; Wang, Y.; Wang, Y.; Liu, Z.; Chen, S. Response Mechanism of Plants to Drought Stress. Horticulturae 2021, 7, 50. [Google Scholar] [CrossRef]
- Anjum, S.A.; Ashraf, U.; Zohaib, A.; Tanveer, M.; Naeem, M.; Ali, I.; Tabassum, T.; Nazir, U. Growth and developmental responses of crop plants under drought stress: A review. Zemdirbyste 2017, 104, 267–276. [Google Scholar] [CrossRef]
- Cai, K.-Z.; Wu, X.-Z.; Luo, S.-M. Compensatory Effects of Re-watering after Soil Drying on Rice Growth and Development. J. Irrig. Drain. 2008, 27, 34–36. [Google Scholar]
- Husen, A.; Iqbal, M.; Aref, I.M. Growth, water status and leaf characteristics of Brassica carinata under drought and rewatering conditions. Braz. J. Bot. 2014, 37, 217–227. [Google Scholar] [CrossRef]
- Subramanian, V.B.; Maheswari, M. Compensatory Growth Responses During Reproductive Phase of Cowpea after Relief of Water Stress. J. Agron. Crop Sci. 2010, 168, 85–90. [Google Scholar] [CrossRef]
- Zhao, L.; Deng, X.; Shan, L. A review on types and mechanisms of compensation effect of crops under water deficit. Chin. J. Appl. Ecol. 2004, 15, 523. [Google Scholar]
- Zhang, P.; Wei, T.; Li, Y.; Zhang, Y.; Cai, T.; Ren, X.; Han, Q.; Jia, Z. Effects of deficit irrigation combined with rainwater harvesting planting system on the water use efficiency and maize (Zea mays L.) yield in a semiarid area. Irri. Sci. 2019, 37, 611–625. [Google Scholar] [CrossRef]
- Olalla, F.M.; Domínguez-Padilla, A.; López, R. Production and quality of the onion crop (Allium cepa L.) cultivated under controlled deficit irrigation conditions in a semi-arid climate. Agric. Water Manag. 2004, 68, 77–89. [Google Scholar] [CrossRef]
- Zhou, H.; Hou, L.; Lv, X.; Yang, G.; Wang, Y.; Wang, X. Compensatory growth as a response to post-drought in grassland. Front. Plant Sci. 2022, 13, 1004553. [Google Scholar] [CrossRef] [PubMed]
- Dien, D.; Yamakawa, T.; Mochizuki, T.; Htwe, A. Dry Weight Accumulation, Root Plasticity, and Stomatal Conductance in Rice (Oryza sativa L.) Varieties under Drought Stress and Re-Watering Conditions. Am. J. Plant Sci. 2017, 8, 3189–3206. [Google Scholar] [CrossRef]
- Wang, X.-L.; Wang, J.-J.; Sun, R.H.; Hou, X.-G.; Zhao, W.; Shi, J.; Zhang, Y.-F.; Qi, L.; Li, X.-L.; Dong, P.-H.; et al. Correlation of the corn compensatory growth mechanism after post-drought rewatering with cytokinin induced by root nitrate absorption. Agric. Water Manag. 2016, 166, 77–85. [Google Scholar] [CrossRef]
- Cui, K.; Xu, L.; Tao, T.; Huang, L.; Li, J.; Hong, J.; Li, H.; Chi, Y. The compensation effects of physiology and yield in cotton after drought stress. J. Plant Physiol. 2018, 224, 30–48. [Google Scholar] [CrossRef]
- Wang, X.-L.; Duan, P.-L.; Yang, S.-J.; Liu, Y.-H.; Qi, L.; Shi, J.; Li, X.-L.; Song, P.; Zhang, L.-X. Corn compensatory growth upon post-drought rewatering based on the effects of rhizosphere soil nitrification on cytokinin. Agric. Water Manag. 2020, 241, 106436. [Google Scholar] [CrossRef]
- Cortleven, A.; Leuendorf, J.E.; Frank, M.; Pezzetta, D.; Bolt, S.; Schmülling, T. Cytokinin action in response to abiotic and biotic stresses in plants. Plant Cell Environ. 2019, 42, 998–1018. [Google Scholar] [CrossRef]
- Oldroyd, G.E.; Leyser, O. A plant’s diet, surviving in a variable nutrient environment. Science 2020, 368, eaba0196. [Google Scholar] [CrossRef]
- Naseby, D.C.; Pascual, J.A.; Lynch, J.M. Effect of biocontrol strains of Trichoderma on plant growth, Pythium ultimum polulations, soil microbial communities and soil enzyme activities. J. Appl. Microbiol. 2000, 88, eaba0196. [Google Scholar] [CrossRef]
- Banning, N.C.; Maccarone, L.D.; Fisk, L.M.; Murphy, D.V. Ammonia-oxidizing bacteria not archaea dominate nitrification activity in semi-arid agricultural soil. Sci. Rep. 2015, 5, 11146. [Google Scholar] [CrossRef]
- Wang, X.L.; Sun, R.H.; Wu, D.; Qi, L.; Liu, Y.H.; Shi, J.; Li, X.L.; Song, P.; Zhang, L.X. Increasing corn compensatory growth upon post-drought rewatering using ammonia-oxidizing bacterial strain inoculation. Agric. Water Manag. 2021, 256. [Google Scholar] [CrossRef]
- Wang, X.L.; Ma, K.; Qi, L.; Liu, Y.H.; Shi, J.; Li, X.L.; Zhang, L.X.; Liu, W.; Song, P. Effect of ammonia-oxidizing bacterial strain that survives drought stress on corn compensatory growth upon post-drought rewatering. Front. Plant Sci. 2022, 13, 947476. [Google Scholar] [CrossRef] [PubMed]
- Maheshwari, D.K.; Dheeman, S.; Agarwal, M. Phytohormone-Producing PGPR for Sustainable Agriculture; Springer: Cham, Switzerland, 2015; Volume 12. [Google Scholar] [CrossRef]
- Randy, O.-C.; Eduardo, V.-C.; José, L.-B. Plant growth promotion by Bacillus megaterium involves cytokinin signaling. Plant Signal. Behav. 2008, 3, 263–265. [Google Scholar] [CrossRef]
- Wu, D.; Ma, K.; Wang, X.L.; Qi, L.; Liu, Y.H.; Song, P.; Liu, W.; Zhang, M.M.; Zhao, W.; Song, C.W. Increasing Italian ryegrass (Lolium multiflorum Lam.) regrowth via inoculation with an ammonia-oxidizing bacterial strain. Grassl. Sci. 2022, 69, 51–64. [Google Scholar] [CrossRef]
- Wu, D.; Wang, X.L.; Zhu, X.H.; Wang, H.H.; Liu, W.; Qi, L.; Song, P.; Zhang, M.M.; Zhao, W. Effect of Ammonia-Oxidizing Bacterial Strains That Coexist in Rhizosphere Soil on Italian Ryegrass Regrowth. Microorganisms 2022, 10, 2122. [Google Scholar] [CrossRef]
- Wang, X.L.; Qin, R.R.; Sun, R.H.; Wang, J.J.; Hou, X.G.; Qi, L.; Qin, D.H. No post-drought compensatory growth of corns with root cutting based on cytokinin induced by roots. Agric. Water Manag. 2018, 205, 9–20. [Google Scholar] [CrossRef]
- Meeks, M.; Murray, S.C.; Hague, S.; Hays, D. Measuring Maize Seedling Drought Response in Search of Tolerant Germplasm. Agronomy 2013, 3, 135–147. [Google Scholar] [CrossRef]
- Lu, R.K. Analysis Method of the Soil Agricultural Chemistry; China Agricultural Science and Technology Press: Beijing, China, 1999. [Google Scholar]
- Qin, R.R.; Wang, X.L. Effects of crown height on the compensatory growth of Italian ryegrass based on combined effects of stored organic matter and cytokinin. Grassl. Sci. 2020, 66, 29–39. [Google Scholar] [CrossRef]
- Wang, X.-L.; Si, Z.-Q.; Yu, H.; Qi, L.; Liu, W.; Shi, J.; Song, P. Unveiling the dual role of heterotrophic ammonia-oxidizing bacteria: Enhancing plant regrowth through modulating cytokinin delivery. Front. Microbiol. 2023, 14, 1268442. [Google Scholar] [CrossRef]
- Tian, Q.; Chen, F.; Zhang, F.; Mi, G. Possible Involvement of Cytokinin in Nitrate-mediated Root Growth in Maize. Plant Soil 2005, 277, 185–196. [Google Scholar] [CrossRef]
- Rahayu, Y.S.; Walch-Liu, P.; Neumann, G.; Römheld, V.; von Wirén, N.; Bangerth, F. Root-derived cytokinins as long-distance signals for NO3−-induced stimulation of leaf growth. J. Exp. Bot. 2005, 56, 1143–1152. [Google Scholar] [CrossRef] [PubMed]
- Sakakibara, H. Nitrate-specific and cytokinin-mediated nitrogen signaling pathways in plants. J. Plant Res. 2003, 116, 253–257. [Google Scholar] [CrossRef] [PubMed]
- Nguyen, H.N.; Nguyen, T.Q.; Kisiala, A.B.; Emery, R.J.N. Beyond transport: Cytokinin ribosides are translocated and active in regulating the development and environmental responses of plants. Planta 2021, 254, 45. [Google Scholar] [CrossRef] [PubMed]
- Kieber, J.J.; Schaller, G.E. Cytokinin signaling in plant development. Development 2018, 145, dev149344. [Google Scholar] [CrossRef]
- Gu, J.; Li, Z.; Mao, Y.; Struik, P.C.; Zhang, H.; Liu, L.; Wang, Z.; Yang, J. Roles of nitrogen and cytokinin signals in root and shoot communications in maximizing of plant productivity and their agronomic applications. Plant Sci. 2018, 274, 320–331. [Google Scholar] [CrossRef]
- Poitout, A.; Crabos, A.; Petřík, I.; Novák, O.; Krouk, G.; Lacombe, B.; Ruffel, S. Responses to Systemic Nitrogen Signaling in Arabidopsis Roots Involve trans-Zeatin in Shoots. Plant Cell 2018, 30, 1243–1257. [Google Scholar] [CrossRef]
- Liu, F.; Xing, S.; Ma, H.; Du, Z.; Ma, B. Cytokinin-producing, plant growth-promoting rhizobacteria that confer resistance to drought stress in Platycladus orientalis container seedlings. Appl. Microbiol. Biot. 2013, 97, 9155–9164. [Google Scholar] [CrossRef]
- Kudoyarova, G.; Arkhipova, T.; Korshunova, T.; Bakaeva, M.; Loginov, O.; Dodd, I.C. Phytohormone Mediation of Interactions Between Plants and Non-Symbiotic Growth Promoting Bacteria Under Edaphic Stresses. Front. Plant Sci. 2019, 10, 1368. [Google Scholar] [CrossRef]
- Delgado, J.A.; D’adamo, R.E.; Villacis, A.H.; Halvorson, A.D.; Stewart, C.E.; Floyd, B.A.; Del Grosso, S.J.; Manter, D.K.; Alwang, J. Long-Term Effects of Nitrogen and Tillage on Yields and Nitrogen Use Efficiency in Irrigated Corn. Agronomy 2024, 14, 2304. [Google Scholar] [CrossRef]
- Zhang, F.; Chen, M.; Zheng, Y.; Xie, Y.; Xing, Y. Optimizing Irrigation and Fertilization to Simultaneously Improve Potato Tuber Yield, Water and Fertilizer Use Efficiency and Net Income in Northwest China. Agronomy 2024, 14, 1124. [Google Scholar] [CrossRef]
- Li, G.-S.; Wu, D.-H.; Su, Y.-C.; Kuo, B.-J.; Yang, M.-D.; Lai, M.-H.; Lu, H.-Y.; Yang, C.-Y. Prediction of Plant Nutrition State of Rice under Water-Saving Cultivation and Panicle Fertilization Application Decision Making. Agronomy 2021, 11, 1626. [Google Scholar] [CrossRef]
- Bett, K.E.; Vandenberg, A.; Banniza, S.; Lu, Q.; Barlow, B.; Ife, S. Effects of tillage practices and rate of nitrogen fertilization on crop yield and soil carbon and nitrogen. Plant Soil Environ. 2014, 60, 100–104. [Google Scholar] [CrossRef]
- Swamy, G.V.; Shankar, T.; Maitra, S.; Adhikary, R.; Praharaj, S.; Sairam, M. Influence of nitrogen management on productivity, nutrient uptake and efficiency of summer maize (Zea mays). Res. Crops 2022, 23, 313–320. [Google Scholar] [CrossRef]


Disclaimer/Publisher’s Note: The statements, opinions and data contained in all publications are solely those of the individual author(s) and contributor(s) and not of MDPI and/or the editor(s). MDPI and/or the editor(s) disclaim responsibility for any injury to people or property resulting from any ideas, methods, instructions or products referred to in the content. |
© 2024 by the authors. Licensee MDPI, Basel, Switzerland. This article is an open access article distributed under the terms and conditions of the Creative Commons Attribution (CC BY) license (https://creativecommons.org/licenses/by/4.0/).
Share and Cite
Yu, H.; Wang, X.-L.; Sun, R.-H.; Qi, L.; Song, P.; Wang, T.-C. Dual Roles of Heterotrophic Ammonia-Oxidizing Bacteria in Enhancing Compensatory Growth upon Post-Drought in Maize. Microorganisms 2024, 12, 2383. https://doi.org/10.3390/microorganisms12122383
Yu H, Wang X-L, Sun R-H, Qi L, Song P, Wang T-C. Dual Roles of Heterotrophic Ammonia-Oxidizing Bacteria in Enhancing Compensatory Growth upon Post-Drought in Maize. Microorganisms. 2024; 12(12):2383. https://doi.org/10.3390/microorganisms12122383
Chicago/Turabian StyleYu, Hao, Xiao-Ling Wang, Run-Hong Sun, Lin Qi, Peng Song, and Tong-Chao Wang. 2024. "Dual Roles of Heterotrophic Ammonia-Oxidizing Bacteria in Enhancing Compensatory Growth upon Post-Drought in Maize" Microorganisms 12, no. 12: 2383. https://doi.org/10.3390/microorganisms12122383
APA StyleYu, H., Wang, X.-L., Sun, R.-H., Qi, L., Song, P., & Wang, T.-C. (2024). Dual Roles of Heterotrophic Ammonia-Oxidizing Bacteria in Enhancing Compensatory Growth upon Post-Drought in Maize. Microorganisms, 12(12), 2383. https://doi.org/10.3390/microorganisms12122383