
Evaluating Sequence Alignment Tools for Antimicrobial Resistance Gene Detection in Assembly Graphs

Abstract
1. Introduction
2. Background
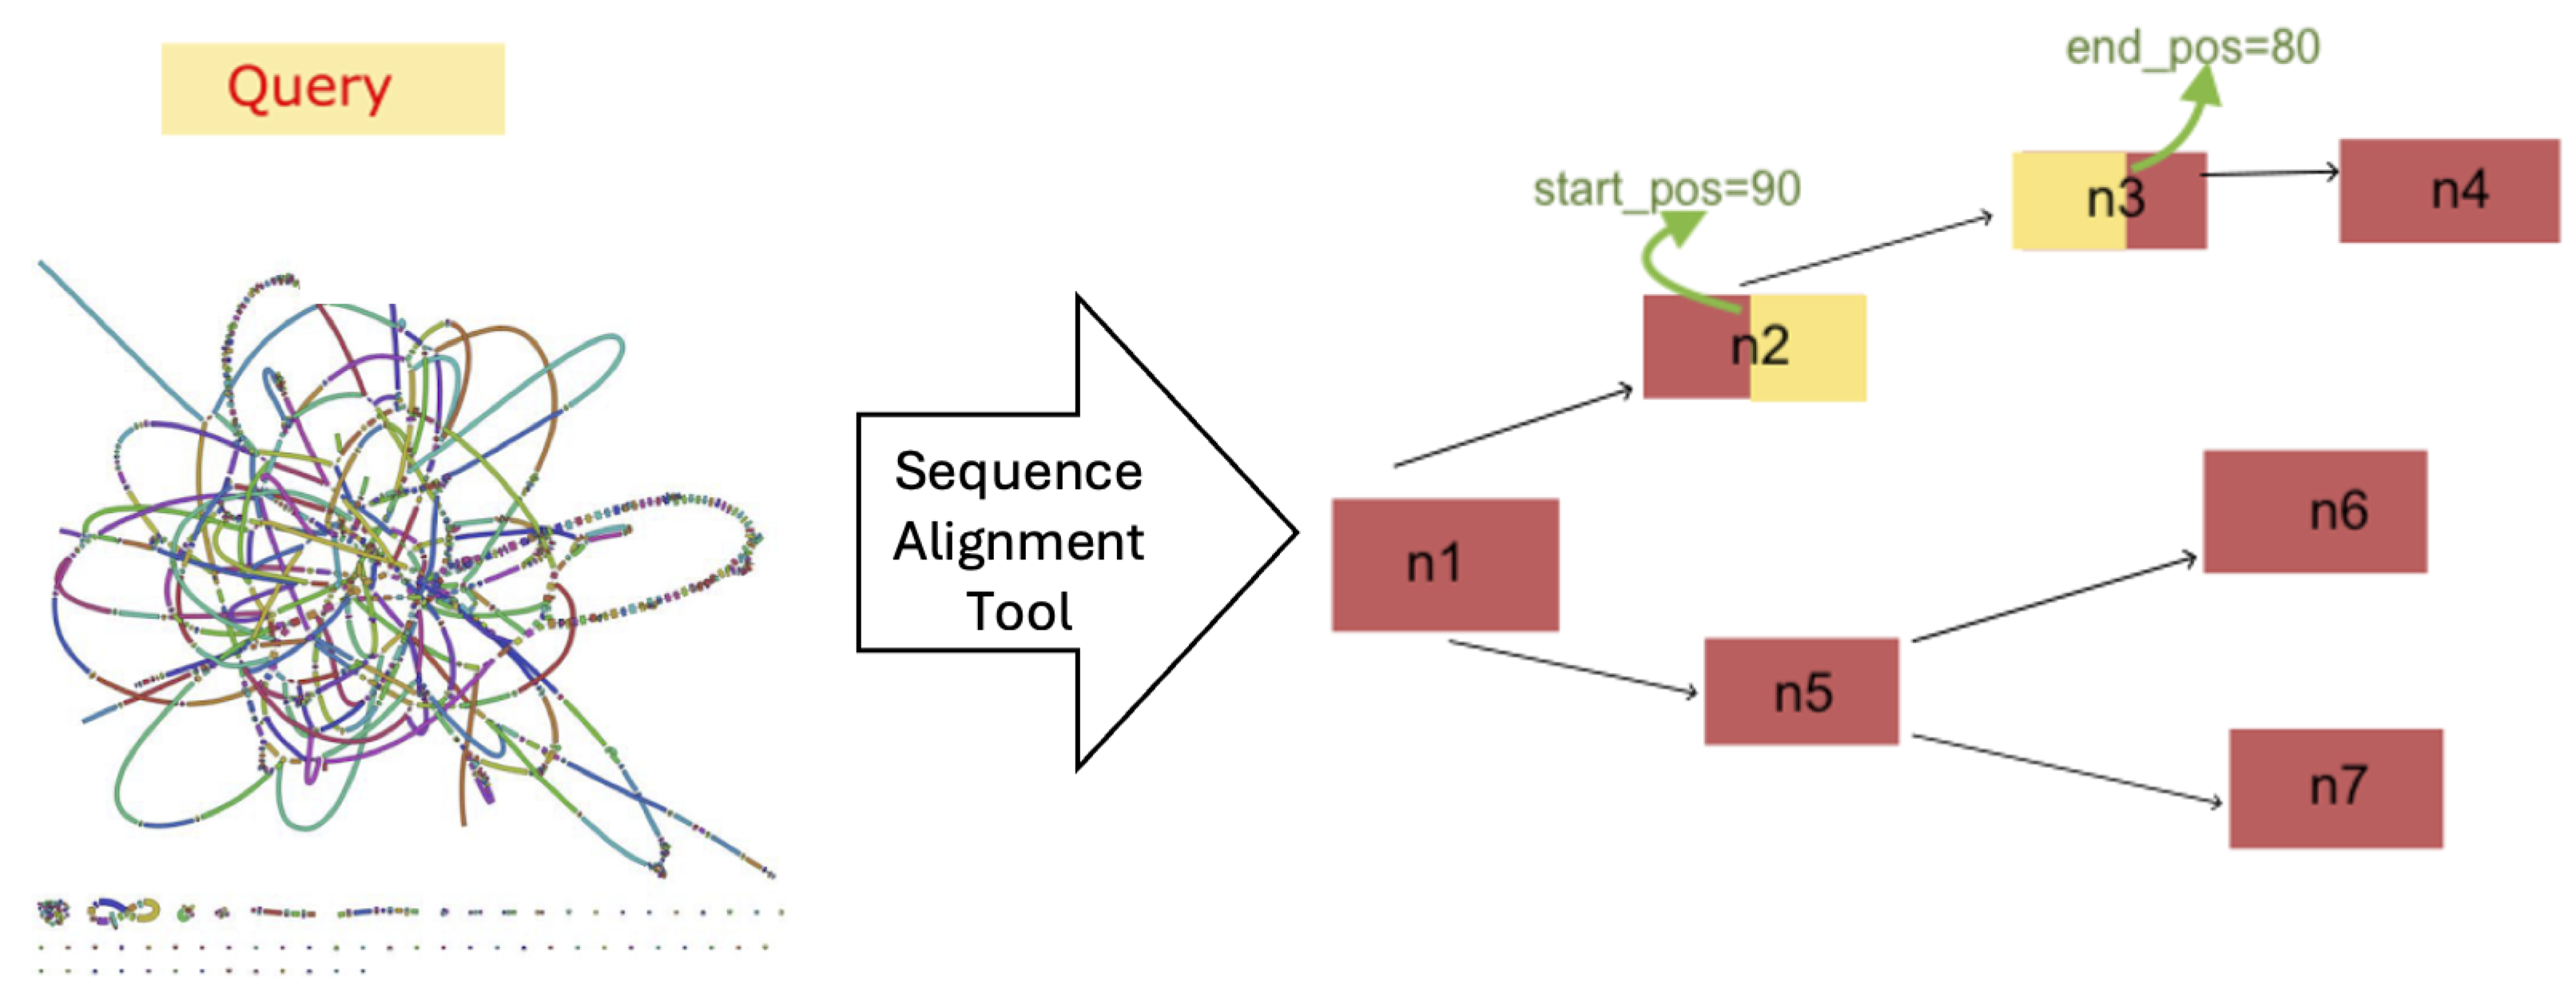
3. Materials and Methods
- The length of the query sequence;
- The starting and ending positions of the aligned sequence in the graph;
- The specific nodes involved in the path through the graph;
- The identified output sequence.
3.1. Dataset
- 1_1_1: A simulated metagenomic dataset generated using one strain each from Escherichia coli, Staphylococcus aureus, and Klebsiella pneumoniae, retrieved from RefSeq. The reads were simulated using ART V2.5.8 [17] on the HiSeq 2500 platform with a read length of 150 bp, an insert size of 500 bp, and fold coverage of 20.
- CAMI_M_2 and CAMI_H_1: These datasets are part of the Critical Assessment of Metagenome Interpretation (CAMI) [18] study and represent medium and large-sized assembly graphs, offering real-world challenges for metagenome analysis.
- ERR1713331: A metagenomic dataset derived from urban sewage from Albania, published and sequenced using the Illumina HiSeq platform [19].
3.2. Experiment

| Name | Description | Number of AMR Genes | Graph Size |
|---|---|---|---|
| 1_1_1 | Simulated from E. coli SMS-3-5 (NC_010498, NC_010488, NC_010485, NC_010486, NC_010487), K. pneumoniae MGH 78578 (NC_009648, NC_009649, NC_009650, NC_009651, NC_009652, NC_009653), S. aureus Mu50 (NC_002758, NC_002774) (accessed on 8 October 2024) | 378 | 2529 nodes and 2406 edges |
| CAMI_M_2 | CAMI Challenge with 132 genomes | 54 | 396,319 nodes and 101,235 edges |
| CAMI_H_1 | CAMI Challenge with 596 genomes | 698 | 939,234 nodes and 127,706 edges |
| ERR1713331 | Albania (ERR1713331) (accessed on 8 October 2024) | 355 | 3,852,226 nodes and 1,256,367 edges |
- Time: The total time taken for each tool to align the query sequences.
- Memory Usage: The memory footprint of each tool during the alignment process.
- Accuracy: The accuracy of the alignment was assessed by comparing the edit distance between the query sequence and the sequences returned by each tool.
4. Results
- Path Comparison: We compare the paths returned by the three tools, focusing on the start and end positions as well as the nodes involved in each path for all datasets.
- Time and Memory Consumption: We compare the time and memory usage of each tool across the different datasets.
- Accuracy Evaluation: We assess the accuracy of the sequences returned by each tool by comparing them to the query sequences.
4.1. Path Comparison
- Full: The start position, end position, and node list are identical in the paths returned by both tools.
- Partial: The paths returned by the tools show some meaningful similarities but differ in either the start or end position (or both), while still covering similar regions of the graph.
- Different: The paths differ entirely in terms of start position, end position, and the nodes involved.
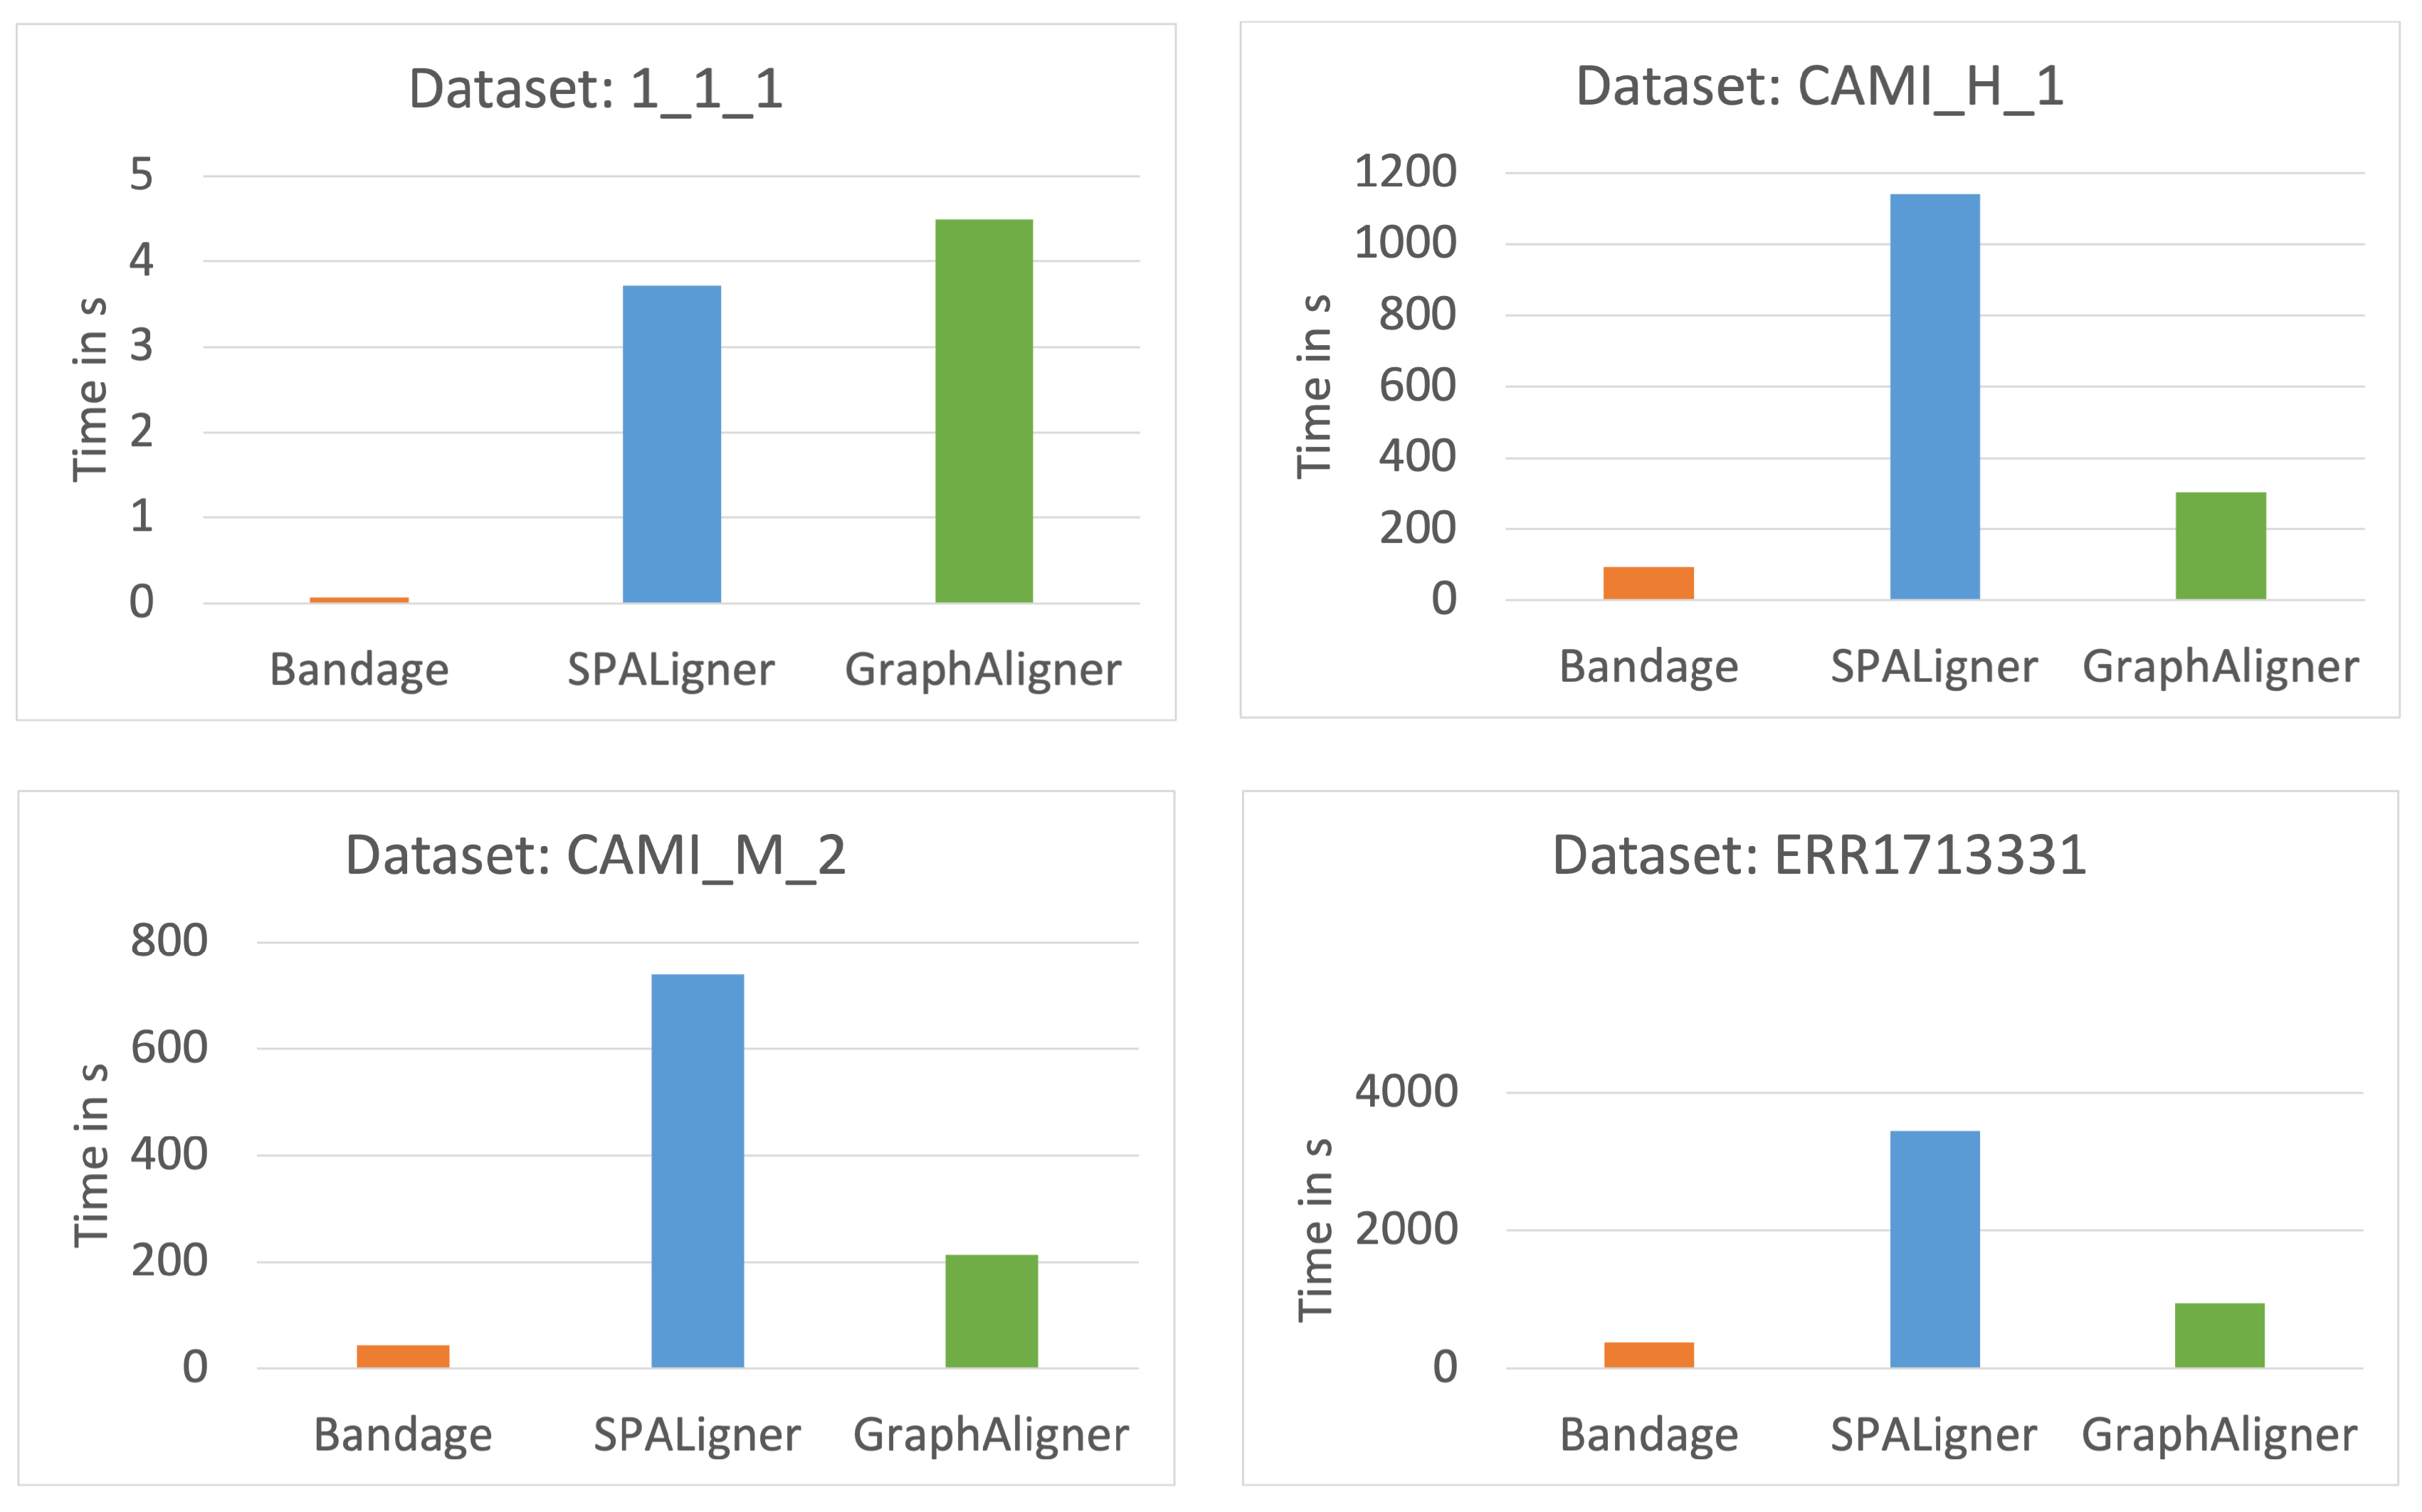
4.2. Time Comparison
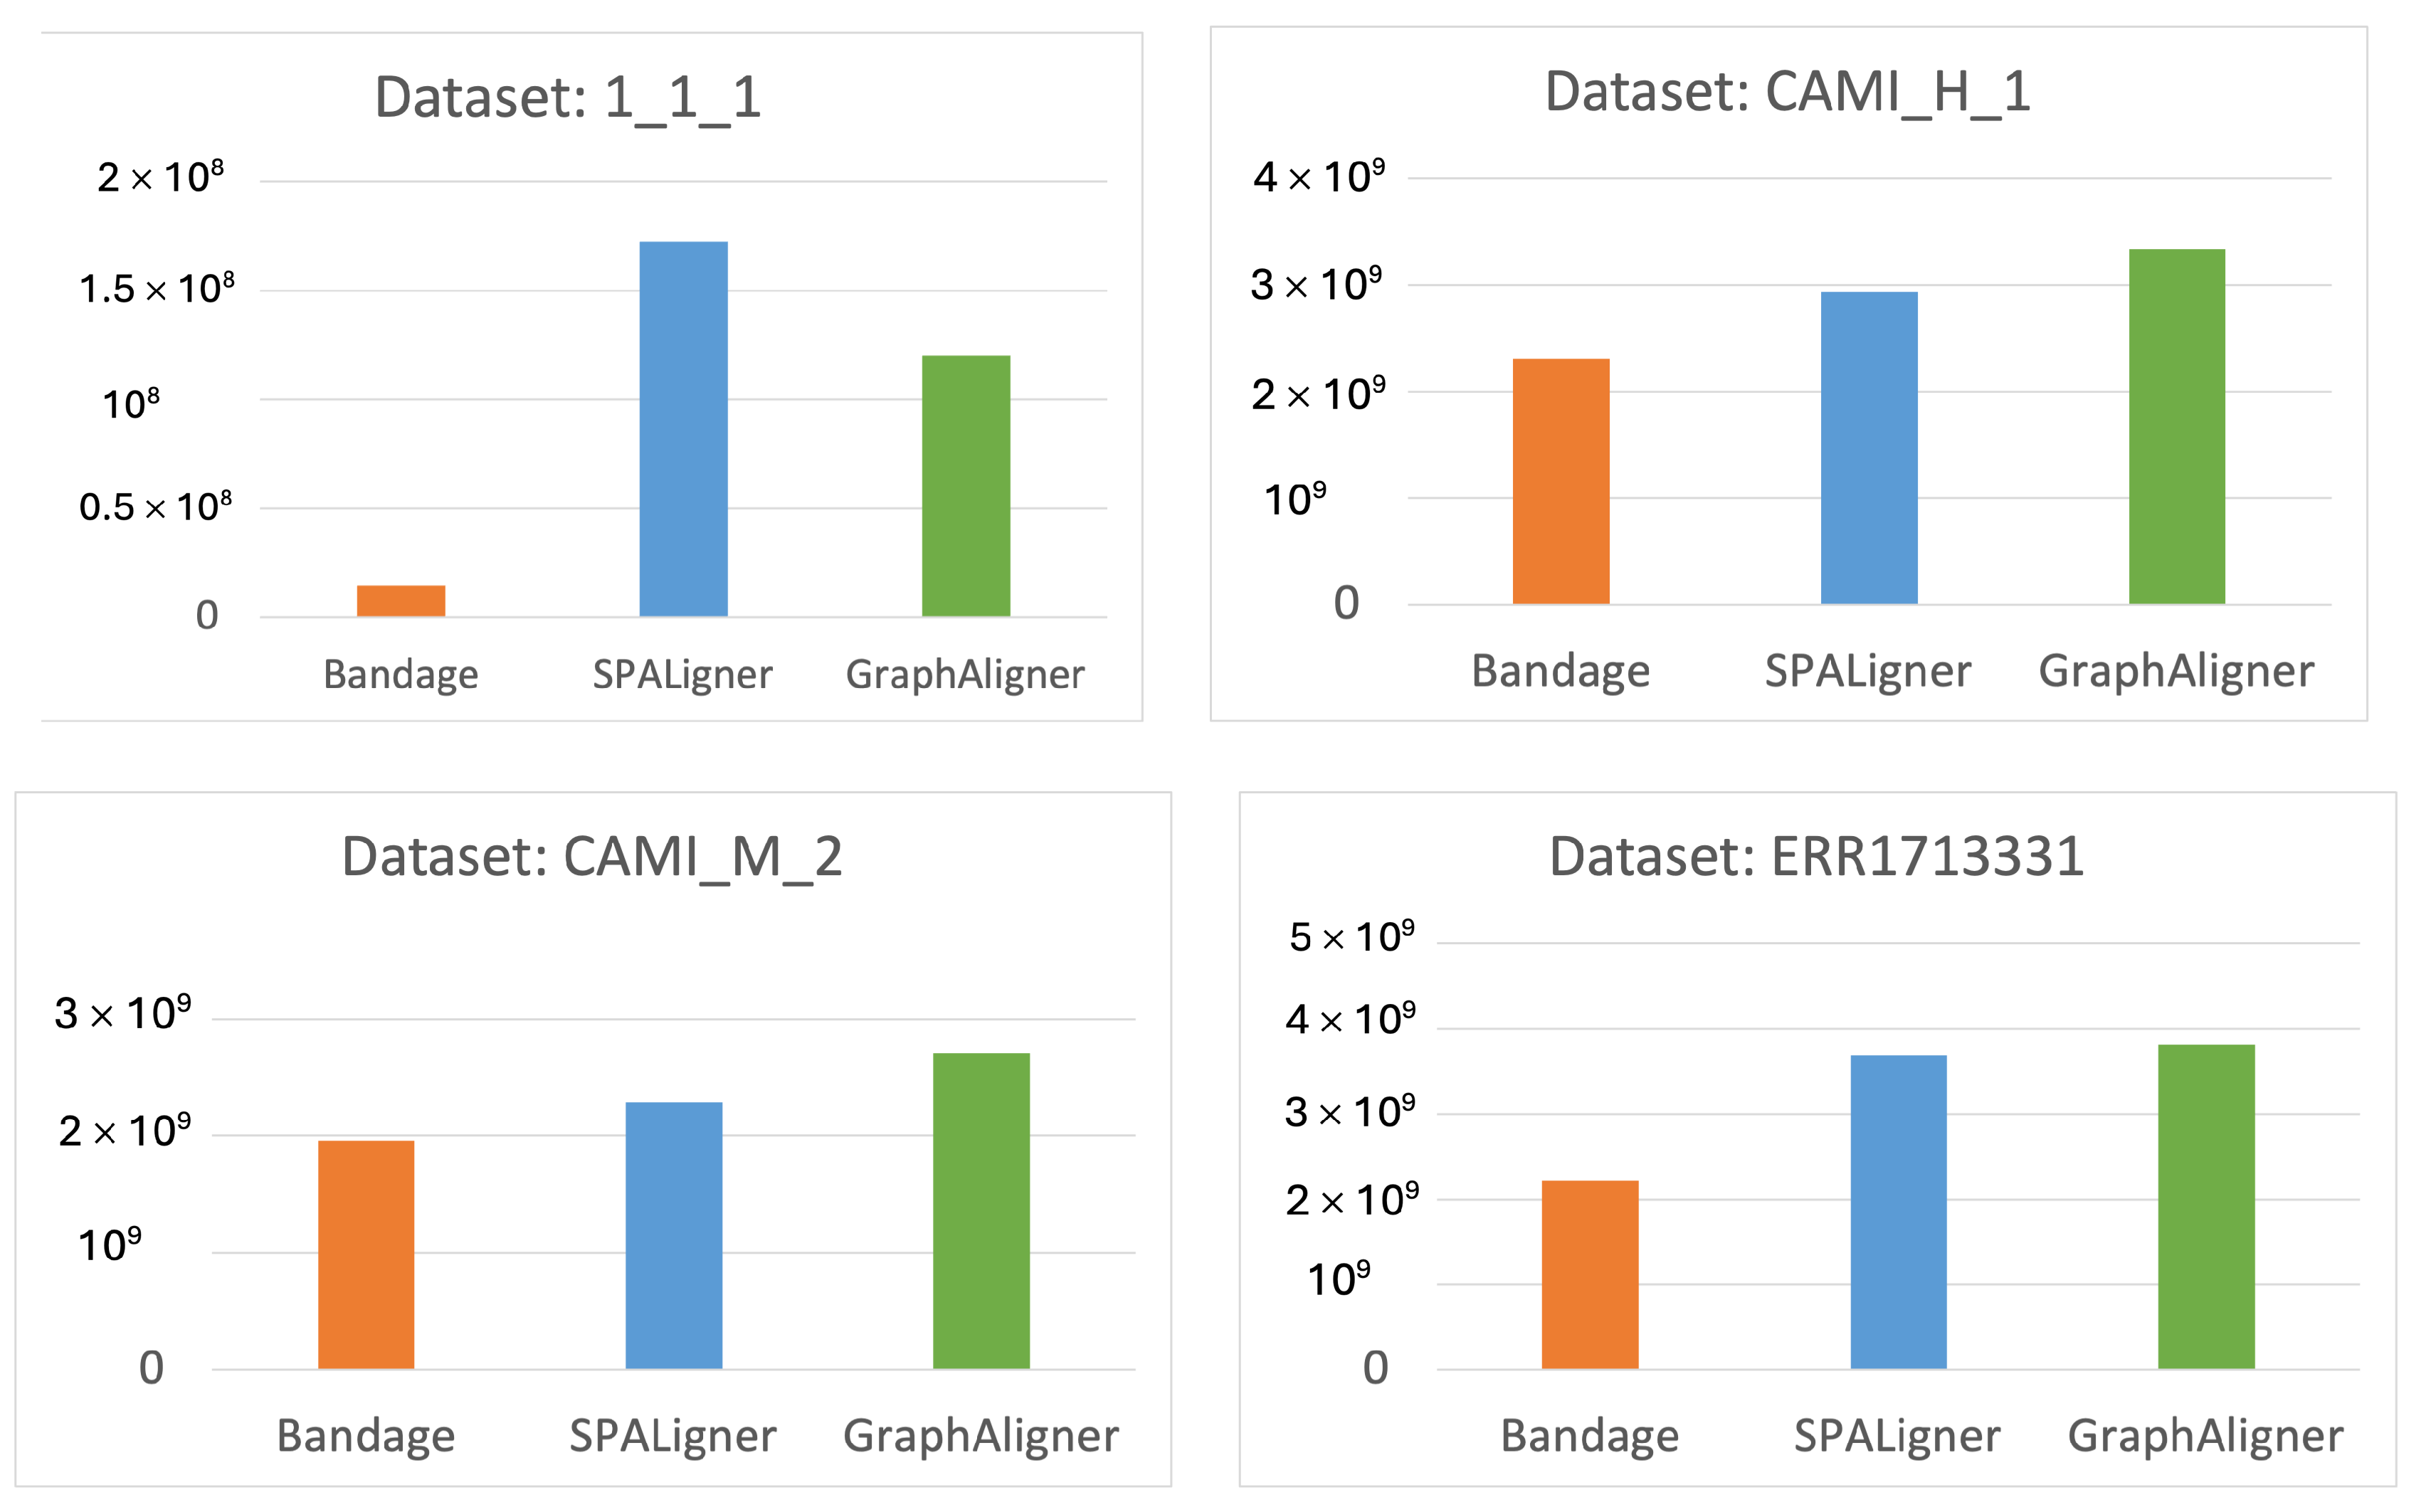
4.3. Memory Consumption
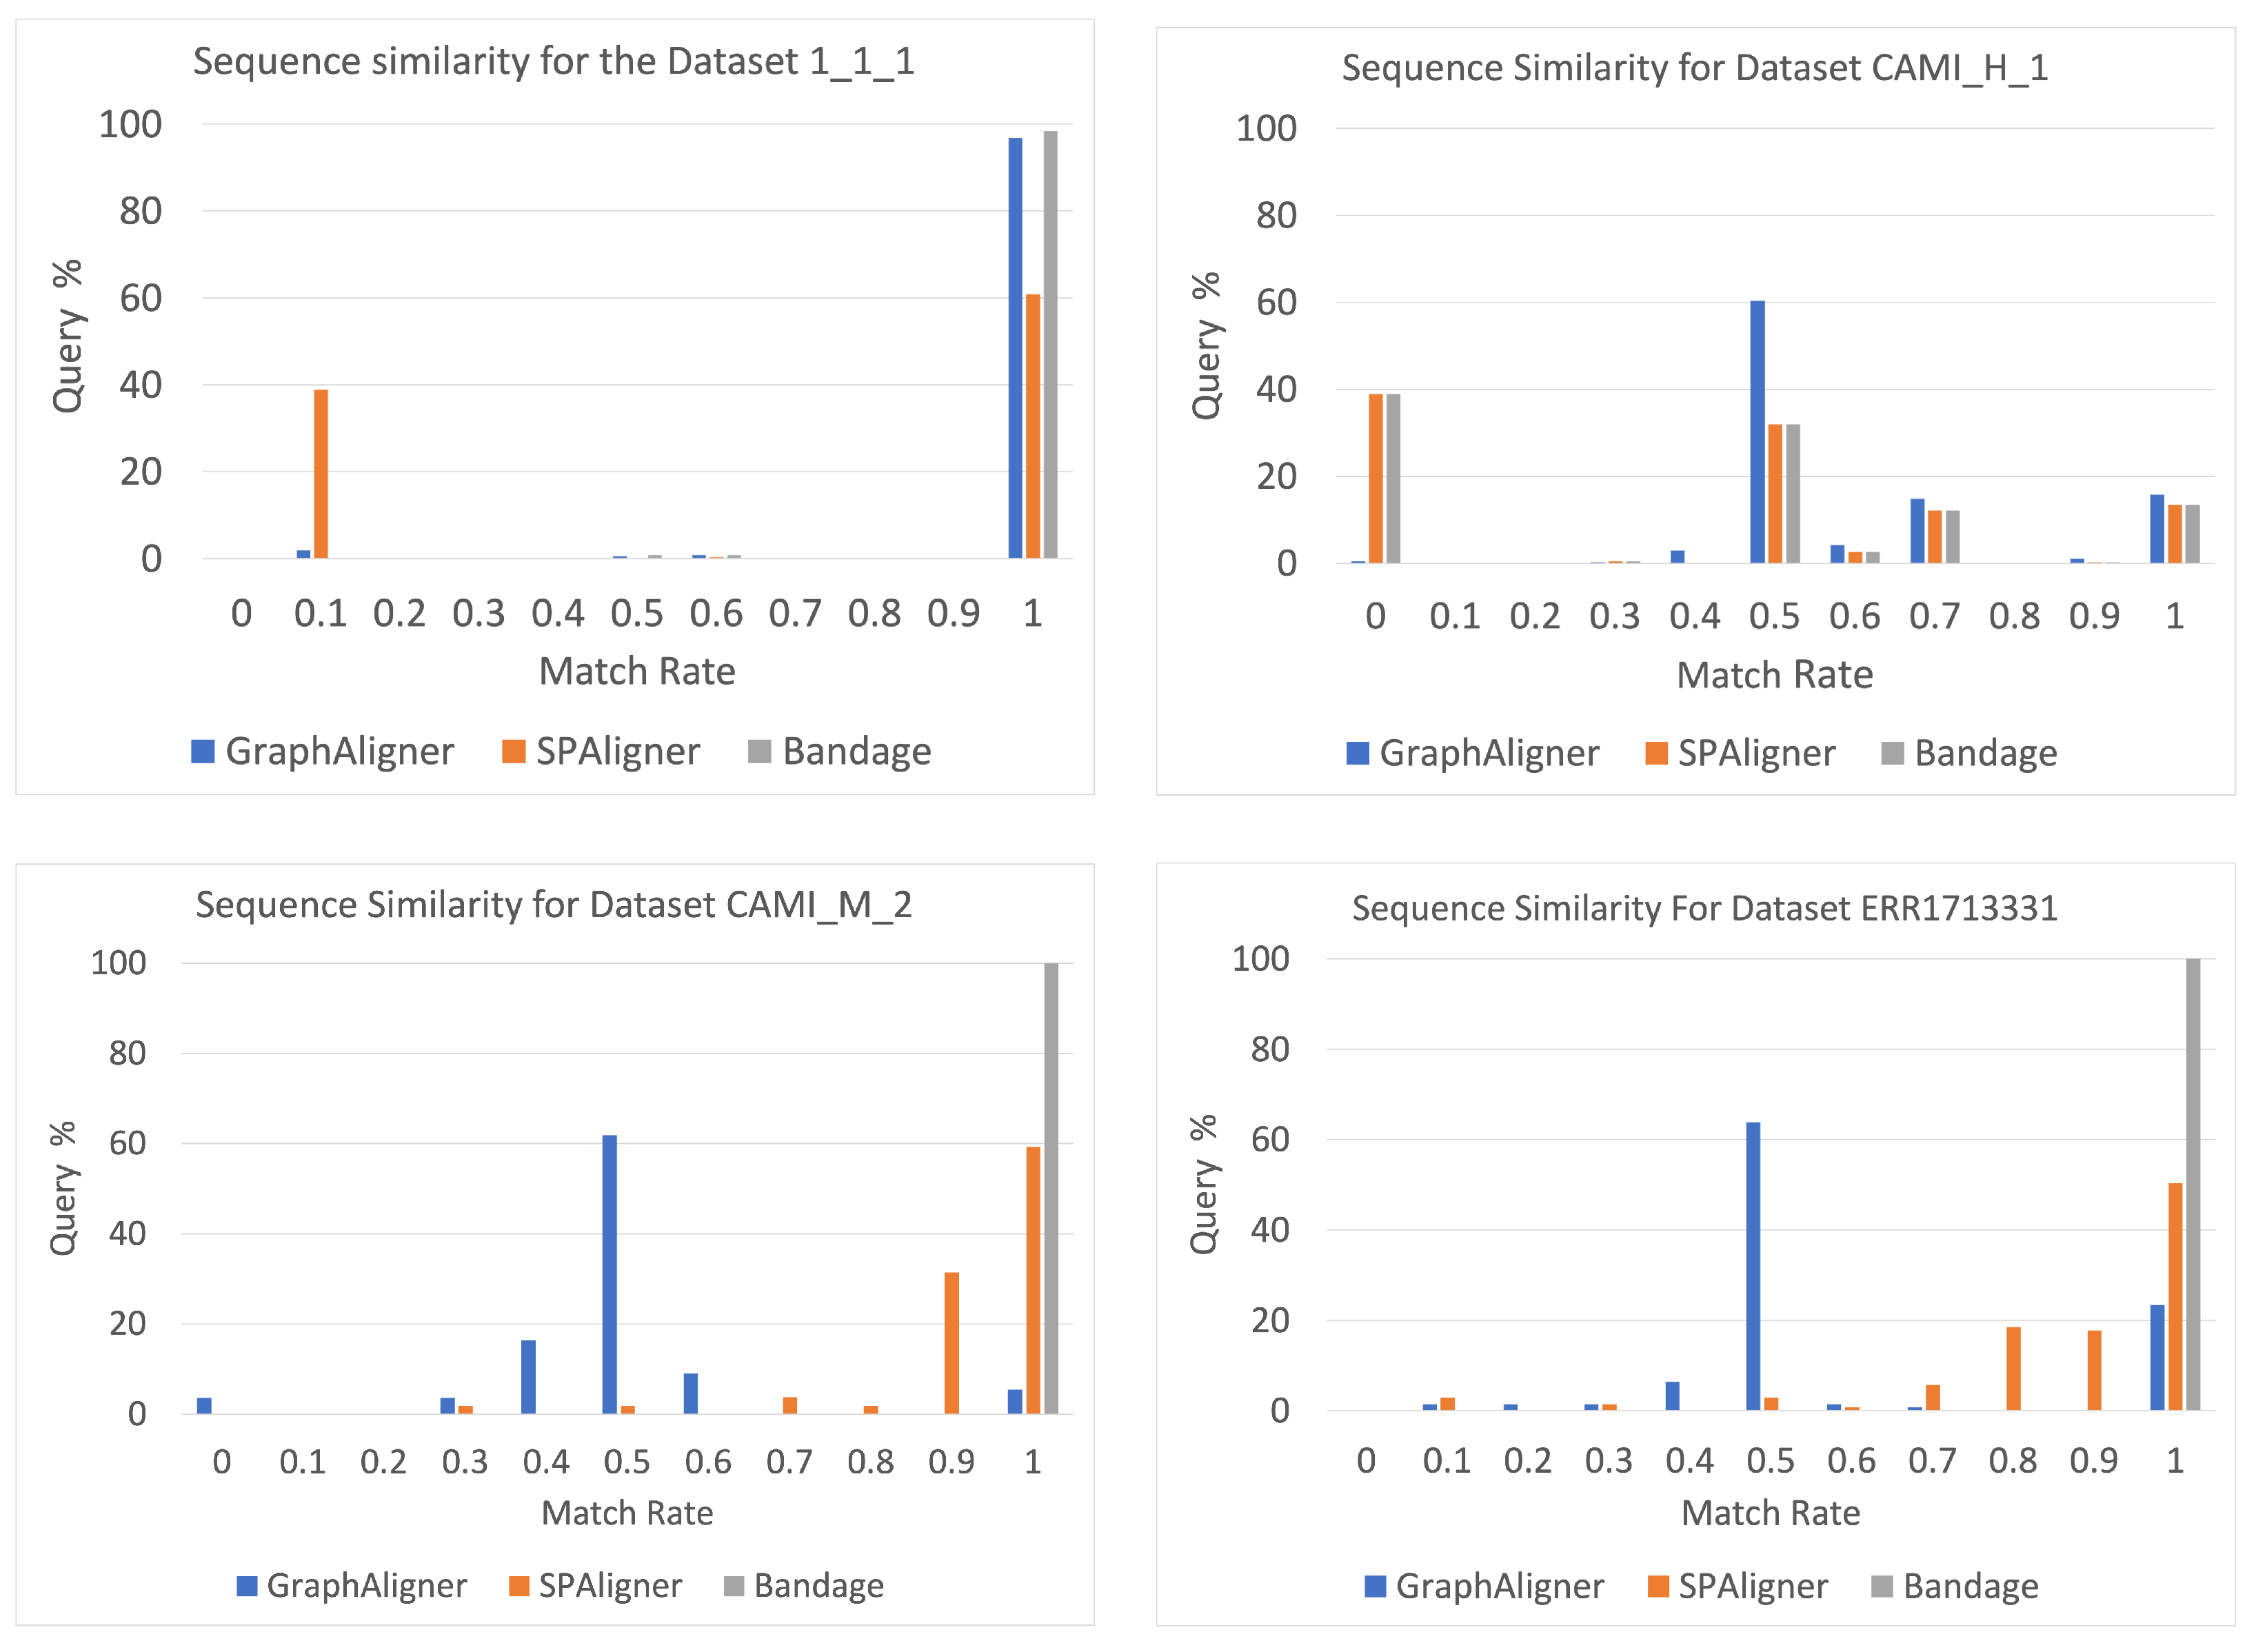
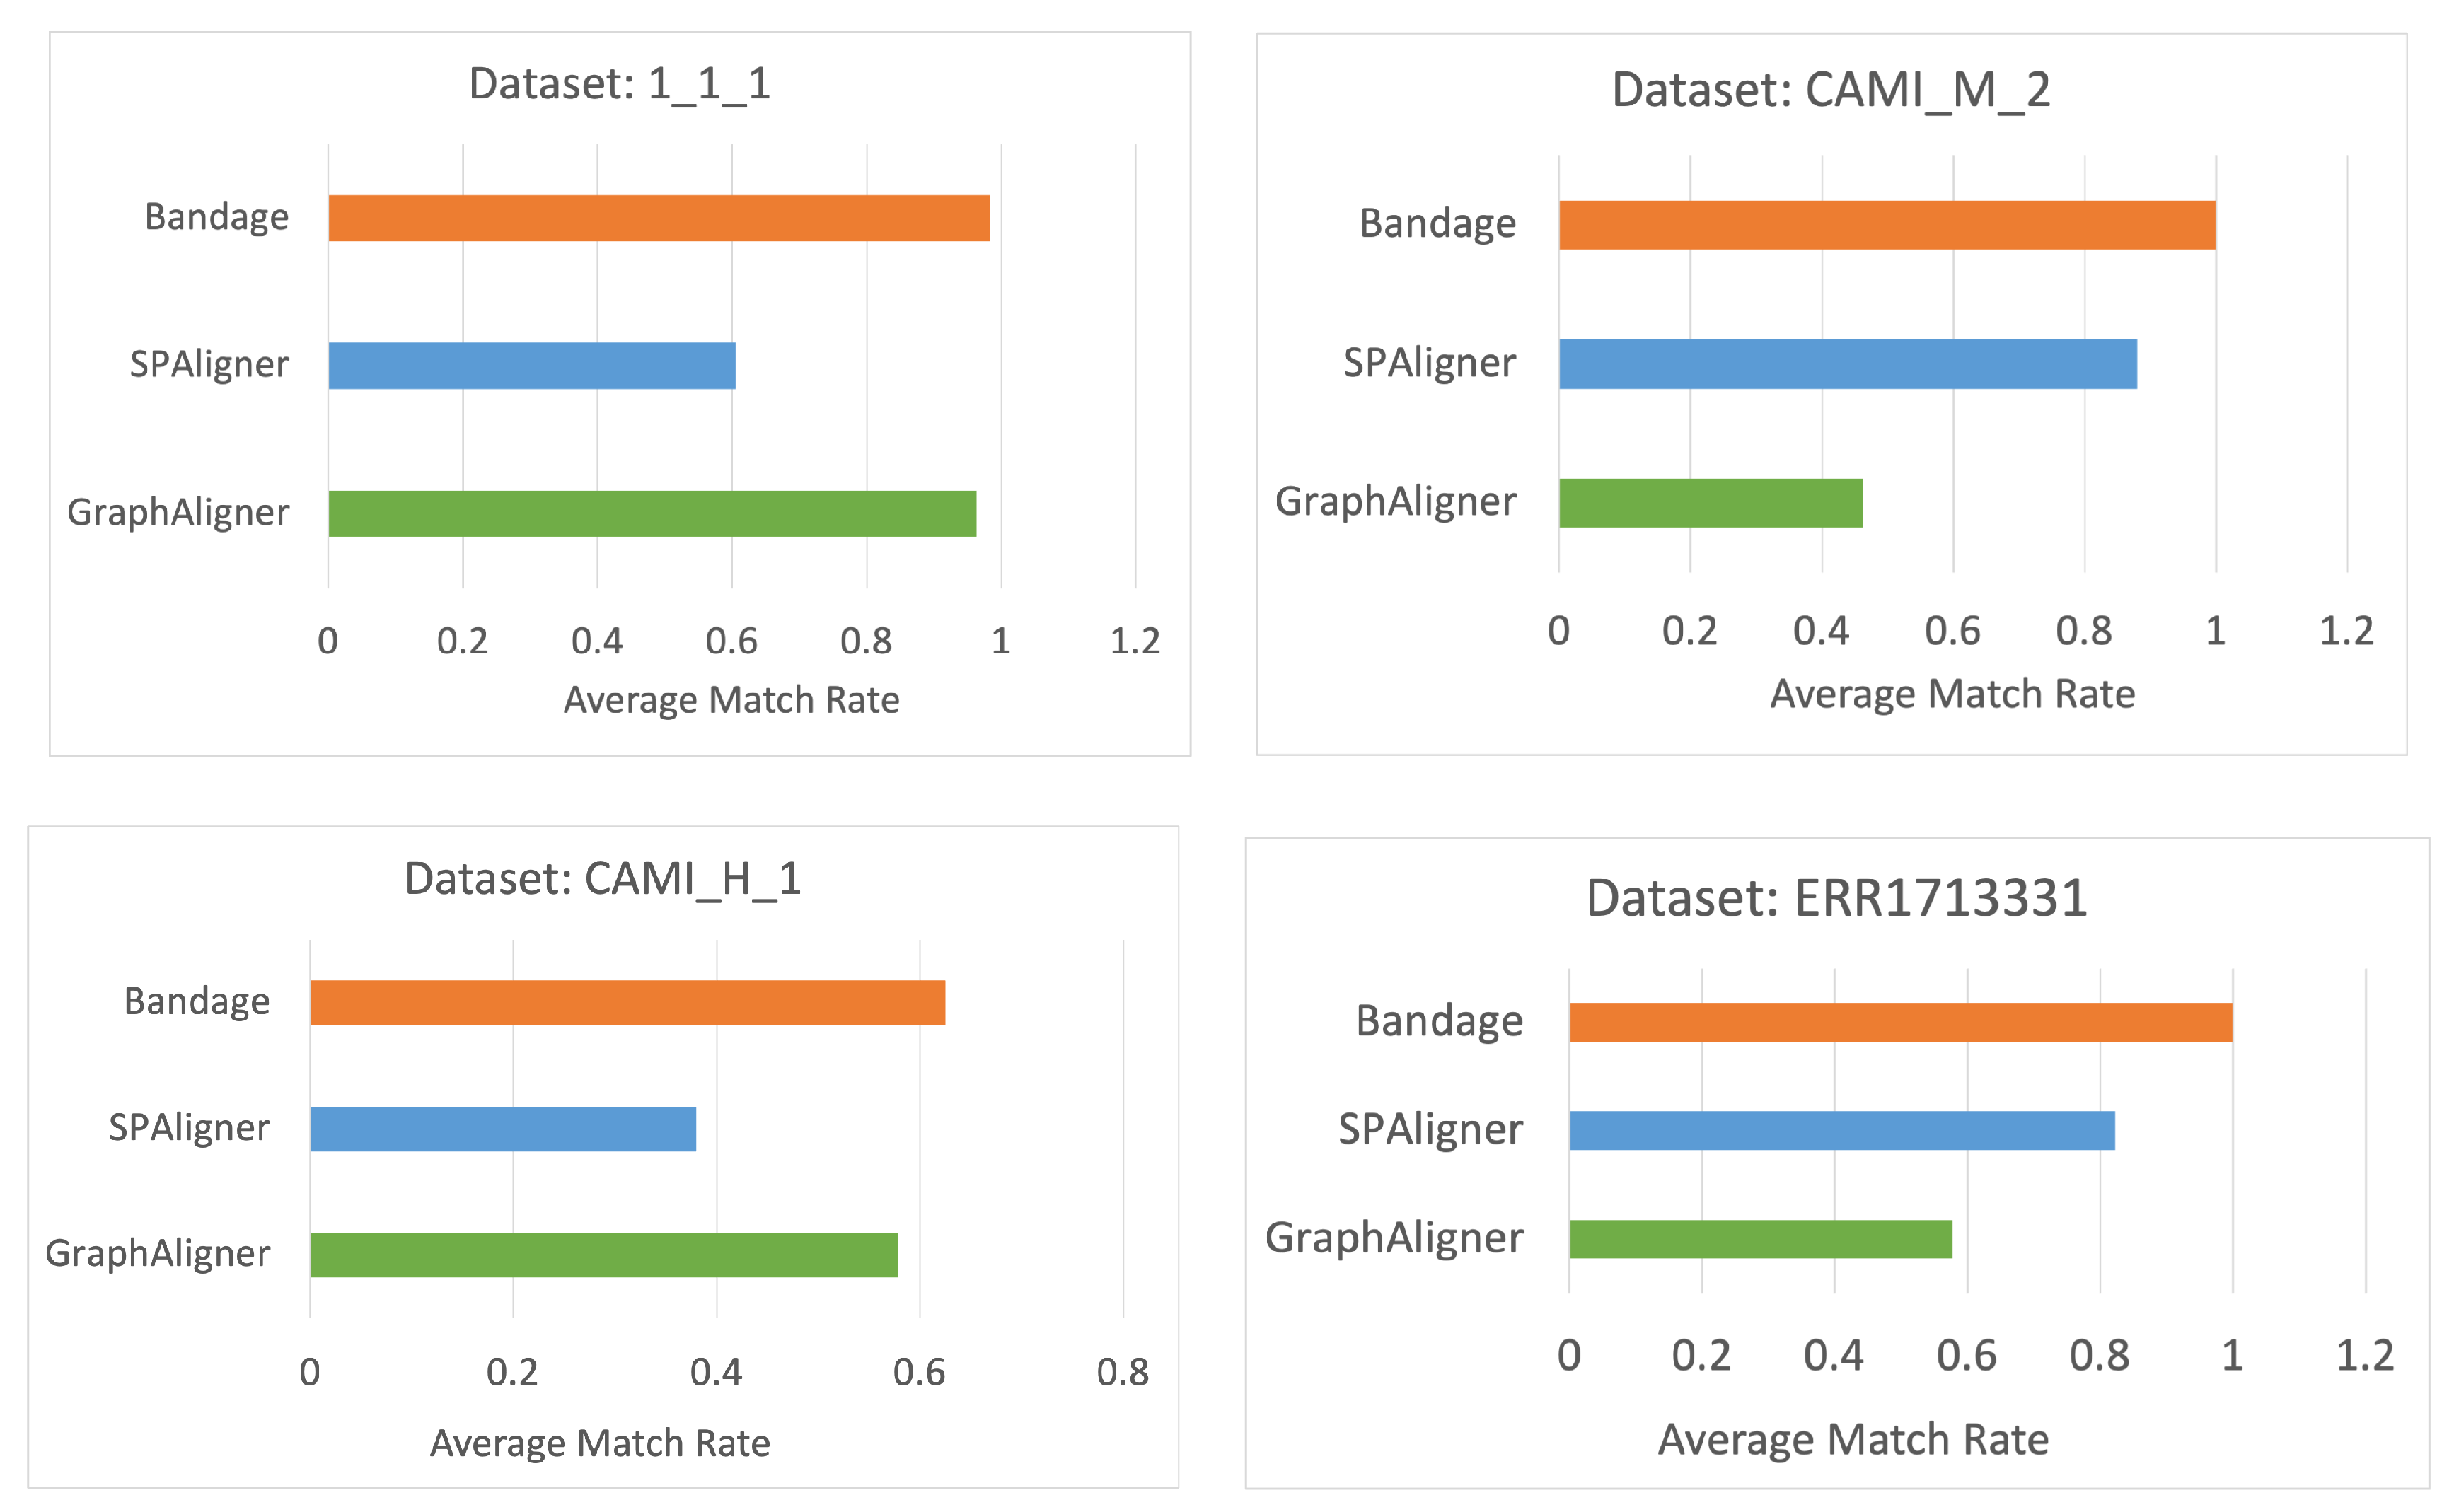
4.4. Measuring Match Rate
5. Conclusions and Future Work
Author Contributions
Funding
Data Availability Statement
Conflicts of Interest
References
- Ayling, M.; Clark, M.D.; Leggett, R.M. New approaches for metagenome assembly with short reads. Briefings Bioinform. 2019, 21, 584–594. [Google Scholar] [CrossRef] [PubMed]
- Antimicrobial Resistance. Available online: https://www.who.int/news-room/fact-sheets/detail/antimicrobial-resistance (accessed on 5 October 2024).
- Collaborators, A.R. Global Burden of Bacterial Antimicrobial Resistance in 2019: A Systematic Analysis. Lancet 2022, 399, 629–655. [Google Scholar]
- Woodford, N.; Turton, J.F.; Livermore, D.M. Multiresistant Gram-negative Bacteria: The Role of High-risk Clones in the Dissemination of Antibiotic Resistance. FEMS Microbiol. Rev. 2011, 35, 736–755. [Google Scholar] [CrossRef] [PubMed]
- Aravind, L. Guilt by association: Contextual information in genome analysis. Genome Res. 2000, 10, 1074–1077. [Google Scholar] [CrossRef] [PubMed]
- Juhas, M.; Van Der Meer, J.R.; Gaillard, M.; Harding, R.M.; Hood, D.W.; Crook, D.W. Genomic islands: Tools of bacterial horizontal gene transfer and evolution. FEMS Microbiol. Rev. 2009, 33, 376–393. [Google Scholar] [CrossRef] [PubMed]
- Marcet-Houben, M.; Gabaldón, T. Evolutionary and functional patterns of shared gene neighbourhood in fungi. Nat. Microbiol. 2019, 4, 2383–2392. [Google Scholar] [CrossRef] [PubMed]
- Wick, R.R.; Schultz, M.B.; Zobel, J.; Holt, K.E. Bandage: Interactive Visualization of de novo Genome Assemblies. Bioinformatics 2015, 31, 3350–3352. [Google Scholar] [CrossRef] [PubMed]
- Dvorkina, T.; Antipov, D.; Korobeynikov, A.; Nurk, S. SPAligner: Alignment of long diverged molecular sequences to assembly graphs. BMC Bioinform. 2020, 21, 306. [Google Scholar] [CrossRef] [PubMed]
- Rautiainen, M.; Marschall, T. GraphAligner: Rapid and versatile sequence-to-graph alignment. Genome Biol. 2020, 21, 253. [Google Scholar] [CrossRef] [PubMed]
- Compeau, P.E.C.; Pevzner, P.A.; Tesler, G. How to apply de Bruijn graphs to genome assembly. Nat. Biotechnol. 2011, 29, 987–991. [Google Scholar] [CrossRef] [PubMed]
- McGinnis, S.; Madden, T.L. BLAST: At the core of a powerful and diverse set of sequence analysis tools. Nucleic Acids Res. 2004, 32, W20–W25. [Google Scholar] [CrossRef] [PubMed]
- Graphical Fragment Assembly (GFA) Format Specification. Available online: https://github.com/GFA-spec/GFA-spec (accessed on 5 October 2024).
- Nurk, S.; Meleshko, D.; Korobeynikov, A.; Pevzner, P.A. MetaSPAdes: A New Versatile Metagenomic Assembler. Genome Res. 2017, 27, 824–834. [Google Scholar] [CrossRef] [PubMed]
- Chikhi, R.; Limasset, A.; Medvedev, P. Compacting de Bruijn Graphs from Sequencing Data Quickly and in Low Memory. Bioinformatics 2016, 32, 201–208. [Google Scholar] [CrossRef] [PubMed]
- Li, D.; Liu, C.M.; Luo, R.; Sadakane, K.; Lam, T.W. MEGAHIT: An ultra-fast single-node solution for large and complex metagenomics assembly via succinct de Bruijn graph. Bioinformatics 2015, 31, 1674–1676. [Google Scholar] [CrossRef] [PubMed]
- Huang, W.; Li, L.; Myers, J.R.; Marth, G.T. ART: A Next-generation Sequencing Read Simulator. Bioinformatics 2012, 28, 593–594. [Google Scholar] [CrossRef] [PubMed]
- Sczyrba, A.; Hofman, P.; Belmann, P.; Koslicki, D.; Janssen, S.; Dröge, J.; Gregor, I.; Majda, S.; Fiedler, J.; Dahms, E.; et al. Benchmark data sets, software results and reference data for the first CAMI challenge. GigaScience Database 2017. [Google Scholar] [CrossRef]
- Hendriksen, R.S.; Munk, P.; Njage, P.; van Bunnik, B.; McNally, L.; Lukjancenko, O.; Röder, T.; Nieuwenhuijse, D.; Pedersen, S.K.; Kjeldgaard, J.; et al. Global monitoring of antimicrobial resistance based on metagenomics analyses of urban sewage. Nat. Commun. 2019, 10, 1124. [Google Scholar] [CrossRef] [PubMed]
- Hicham, G. Introduction of the weight edition errors in the Levenshtein distance. arXiv 2012, arXiv:1208.4503. [Google Scholar] [CrossRef]

| Tool | Main Usage | Alignment Algorithm |
|---|---|---|
| Bandage | Primarily to visualize and interact with assembly graphs | Uses BLAST to find paths within the assembly graph based on the query sequence. |
| SPAligner | Align diverged molecular sequences against assembly graphs | Uses Burrows–Wheeler aligner (BWA) to detect longer anchor alignments. It also uses the Edlib library to calculate the optimal alignment. |
| GraphAligner | Align long reads to sequence graphs | Uses BWA to detect longer anchor. It also uses the bit vector alignment extension algorithm. |
| Tool Pair | Full | Partial | Different |
|---|---|---|---|
| Bandage VS SPAligner | 57.9 | 7.2 | 34.9 |
| Bandage VS GraphAligner | 93.9 | 2.1 | 4.0 |
| SPAligner VS GraphAligner | 57.7 | 4.8 | 37.6 |
| Tool Pair | Full | Partial | Different |
|---|---|---|---|
| Bandage VS SPAligner | 83.3 | 0 | 16.7 |
| Bandage VS GraphAligner | 63 | 20.3 | 16.7 |
| SPAligner VS GraphAligner | 0 | 85.2 | 14.8 |
| Tool Pair | Full | Partial | Different |
|---|---|---|---|
| Bandage VS SPAligner | 0 | 94.5 | 5.5 |
| Bandage VS GraphAligner | 71.0 | 24.0 | 5.0 |
| SPAligner VS GraphAligner | 0 | 95.3 | 4.7 |
| Tool Pair | Full | Partial | Different |
|---|---|---|---|
| Bandage VS SPAligner | 0 | 63.8 | 36.2 |
| Bandage VS GraphAligner | 22.1 | 23.5 | 54.4 |
| SPAligner VS GraphAligner | 0 | 63.1 | 36.9 |
Disclaimer/Publisher’s Note: The statements, opinions and data contained in all publications are solely those of the individual author(s) and contributor(s) and not of MDPI and/or the editor(s). MDPI and/or the editor(s) disclaim responsibility for any injury to people or property resulting from any ideas, methods, instructions or products referred to in the content. |
© 2024 by the authors. Licensee MDPI, Basel, Switzerland. This article is an open access article distributed under the terms and conditions of the Creative Commons Attribution (CC BY) license (https://creativecommons.org/licenses/by/4.0/).
Share and Cite
Shah, Y.; Kafaie, S. Evaluating Sequence Alignment Tools for Antimicrobial Resistance Gene Detection in Assembly Graphs. Microorganisms 2024, 12, 2168. https://doi.org/10.3390/microorganisms12112168
Shah Y, Kafaie S. Evaluating Sequence Alignment Tools for Antimicrobial Resistance Gene Detection in Assembly Graphs. Microorganisms. 2024; 12(11):2168. https://doi.org/10.3390/microorganisms12112168
Chicago/Turabian StyleShah, Yusreen, and Somayeh Kafaie. 2024. "Evaluating Sequence Alignment Tools for Antimicrobial Resistance Gene Detection in Assembly Graphs" Microorganisms 12, no. 11: 2168. https://doi.org/10.3390/microorganisms12112168
APA StyleShah, Y., & Kafaie, S. (2024). Evaluating Sequence Alignment Tools for Antimicrobial Resistance Gene Detection in Assembly Graphs. Microorganisms, 12(11), 2168. https://doi.org/10.3390/microorganisms12112168