Article

Transcriptomic Analysis of the Response of the Toxic Dinoflagellate Prorocentrum lima to Phosphorous Limitation

State Key Laboratory of NBC Protection for Civilian, Beijing 102205, China
*
Author to whom correspondence should be addressed.
Microorganisms 2023, 11(9), 2216; https://doi.org/10.3390/microorganisms11092216
Submission received: 2 August 2023 / Revised: 26 August 2023 / Accepted: 28 August 2023 / Published: 31 August 2023
(This article belongs to the Section Environmental Microbiology)

Abstract

:
Some dinoflagellates cause harmful algal blooms, releasing toxic secondary metabolites, to the detriment of marine ecosystems and human health. Phosphorus (P) is a limiting macronutrient for dinoflagellate growth in the ocean. Previous studies have been focused on the physiological response of dinoflagellates to ambient P changes. However, the whole-genome’s molecular mechanisms are poorly understood. In this study, RNA-Seq was utilized to compare the global gene expression patterns of a marine diarrheic shellfish poisoning (DSP) toxin-producing dinoflagellate, Prorocentrum lima, grown in inorganic P-replete and P-deficient conditions. A total of 148 unigenes were significantly up-regulated, and 30 unigenes were down-regulated under 1/4 P-limited conditions, while 2708 unigenes were significantly up-regulated, and 284 unigenes were down-regulated under 1/16 P-limited conditions. KEGG enrichment analysis of the differentially expressed genes shows that genes related to ribosomal proteins, glycolysis, fatty acid biosynthesis, phagosome formation, and ubiquitin-mediated proteolysis are found to be up-regulated, while most of the genes related to photosynthesis are down-regulated. Further analysis shows that genes encoding P transporters, organic P utilization, and endocytosis are significantly up-regulated in the P-limited cells, indicating a strong ability of P. lima to utilize dissolved inorganic P as well as intracellular organic P. These transcriptomic data are further corroborated by biochemical and physiological analyses, which reveals that under P deficiency, cellular contents of starch, lipid, and toxin increase, while photosynthetic efficiency declines. Our results indicate that has P. lima evolved diverse strategies to acclimatize to low P environments. The accumulation of carbon sources and DSP toxins could provide protection for P. lima to cope with adverse environmental conditions.

1. Introduction

Harmful algal blooms (HABs) occur frequently on a global scale with the deterioration of the marine environment, and have severe impacts on marine ecosystems, aquaculture, and human health [1,2]. Dinoflagellate is the main factor causing HABs, and estimated to be responsible for 80% of HABs in the global ocean [3,4]. Prorocentrum lima is a widely distributed marine benthic dinoflagellate usually found attached to large algae, seagrasses, and substrates, and it mainly inhabits temperate, subtropical, and tropical seas [5,6,7]. As a known producer of diarrheic shellfish poisoning (DSP) toxins, such as okadaic acid (OA), dinophysistoxin-1 (DTX1), and dinophysistoxin-2 (DTX2) [5,6,7], P. lima is associated with DSP incidents in the world, such as UK [6], Japan [8], China [9], Canada [10], and Argentina [11]. Also, large biomass blooms of the species have been reported along the coast of India [7], Italy [12], and Turkey [13]. DSP outbreaks in coastal waters are hazardous events as they can cause seafood toxicity and affect toxins transfer through the food chain, including humans [14]. Consequently, the formation mechanisms of dinoflagellate blooms and the regulation of physiological processes have become research hotspots in the field of HABs.
Previous studies have indicated that changes in environmental factors could affect the proliferation of dinoflagellates and metabolite synthesis, as well as bloom formation [15,16,17]. Nutrients are essential components for the growth and metabolism of dinoflagellates, therefore, optimizing the supply of nutrients is crucial [17,18,19,20]. Low concentrations of nutrients in dinoflagellate cultures have been shown to increase the production of toxins [17,21,22]. Among various nutrient supplements, the macronutrient phosphorus (P) is considered as a vital component as it is involved in various biochemical processes, such as nucleic acid biosynthesis, photosynthesis, energy conservation, lipid membrane formation, the regulation of many enzymes, and signal transduction [23,24,25,26]. However, low concentrations of dissolved inorganic phosphorus (DIP) in many waters fail to meet dinoflagellate demands. To adapt to P-deficient environments, phytoplankton species have evolved diverse strategies [24,25,27,28]. For example, some species such as Thalassiosira pseudonana, Skeletonema costatum, and Trichodesmium spp. can absorb and store large amounts of P as polyphosphates in their vacuoles, which is used when ambient P is deficient [29,30,31], while other species, such as Karenia mikimotoi, Prorocentrum donghaiense, and Alexandrium catenella can improve their phosphate uptake rate, induce the expression of phosphate transporters, or utilize dissolved organic P (DOP) [28,32,33]. In addition, some species such as Thalassiosira pseudonana, Chaetoceros affinis, and Alexandrium catenella can lower the cellular demand of DIP by using non-phosphorus lipids in the membrane in response to phosphorus scarcity [34,35,36]. For plants, they also evolved a wide range of morphological, physiological, molecular, and symbiotic strategies to improve P uptake and homeostasis, such as modifying root architecture and morphology, the induction of acid phosphatases and recycling enzymes, increasing expression of P transporters, developing symbioses with arbuscular mycorrhizal fungi, and regulating complex P regulatory networks in plant cells [37,38,39]. Therefore, different species of phytoplankton and plants have developed various strategies to cope with phosphate stress. However, the adaptive and response mechanisms of P. lima to ambient P limitation remain poorly understood.
Despite tremendous progress in research on the morphological, phylogenetic, and toxic component analysis of P. lima [6,40,41,42], comprehensive understanding of the molecular mechanisms involved in P acclimation remains under-investigated. This study was to gain insight into the global regulation of metabolic pathways in response to P-limitation and characterize DSP toxin biosynthesis in P. lima. The transcriptomes of P. lima under P-replete and P-deficient conditions were compared and the differentially expressed genes were characterized. In addition, changes in lipid, starch, and DSP toxin contents, as well as photosynthetic parameters in P. lima under P-limited conditions, were examined. Results of this study contribute to explore the adaptive strategy and metabolic mechanisms of P. lima to ambient P deficiency.

2. Materials and Methods

2.1. Algal Culture

Prorocentrum lima (strain CCMA071) was kindly provided by the Center for Collections of Marine Bacteria and Phytoplankton of Xiamen University, China. Cells were cultured in filtered (0.22 μm, Millipore, Burlington, MA, USA) and sterilized seawater with a salinity of 30/1000, and enriched with f/2 media. All cultures were grown at 22 °C in an artificial illumination incubator under a day and night cycle condition (12/12 h). Cell concentration was estimated using a cell counting plate under an inverted optical microscope (CKX53, Olympus, Tokyo, Japan).
To explore metabolic mechanisms expressed under different P culture conditions, P. lima in an initial cell concentration of 6000 cell mL−1 was grown under phosphate nutrient-sufficient conditions (1P, 36 μM NaH2PO4) and P-limited conditions (1/4 P, 9 μM NaH2PO4, and 1/16 P, 2.25 μM NaH2PO4). Three replicates were grown with each treatment. Samples of each culture were collected every three days and centrifuged at 3000× g for 5 min at 22 °C, for cell enumeration and analysis of physiological parameters. In addition, cells from each treatment were harvested on day 30 for RNA extraction, transcriptomic sequencing, qPCR, physiological observation, toxin analysis, etc.

2.2. Toxin Analysis

Cells were harvested from 50 mL of cultures on day 30 and resuspended in 2 mL methanol, and crushed using an ultrasonic liquid processor (Scientz-950ED, Ningbo, China) under ice-bath conditions for 30 min. After centrifugation at 10,000× g (4 °C for 15 min), pellets were subject to ultrasonic crushing twice and the supernatants were combined for toxin analysis. Quantitative analysis was performed using high-performance liquid chromatography coupled to a triple quadrupole mass spectrometer (HPLC–MS/MS, Agilent 6400 QQQ MS, Santa Clara, CA, USA) as described in [2]. Dinophysistoxin-1 (DTX1), dinophysistoxin-2 (DTX2), and okadaic acid (OA) standards were purchased from the Institute for Marine Biosciences, National Research Council Canada (Ottawa, ON, Canada).

2.3. Analysis of Physiological Parameters

Samples of cultures were collected every three days. Cells were counted using a plankton counting chamber with counting area 20 × 20 mm under a light microscope. A total of 50 μL of culture was added to the counting chamber after thoroughly mixing, and the counting was repeated three times for each sample. Cell growth rate was estimated using an equation for (cell µ): µ = (Ln Nf − Ln N0)/(Tf − T0). µ (d − 1) is the specific growth rate; N0 and Nf are the initial and final concentrations of cells mL−1, and Tf − T0 is the time interval from day 0 to day f.
The photochemical efficiency of photosystem II (Fv/Fm) and instantaneous chlorophyll fluorescence (Ft) were measured using AquaPen AP110 (Photon Systems Instruments, Drásov, Czech Republic). Aliquots of 20 mL were centrifuged at 3000× g for 5 min at 22 °C, the supernatants used to determine the extracellular phosphorus concentration according to the phosphomolybdenum blue spectrophotometric method [4] and pellets resuspended in 0.017 M magnesium sulfate (MgSO4) and crushed using ultrasonication in ice-bath for 20 min. After centrifugation at 10,000× g (4 °C for 15 min), the supernatants were used to measure the cellular phosphorus content as well as the bulk alkaline phosphatase activity (APA). APA was evaluated using an assay kit (Beijing Solarbio Science & Technology Co., Ltd., Beijing, China) according to the manufacturer’s instructions. The absorbance at 492 nm was measured on a microplate reader (Multiskan FC, Thermo Scientific, Waltham, MA, USA).

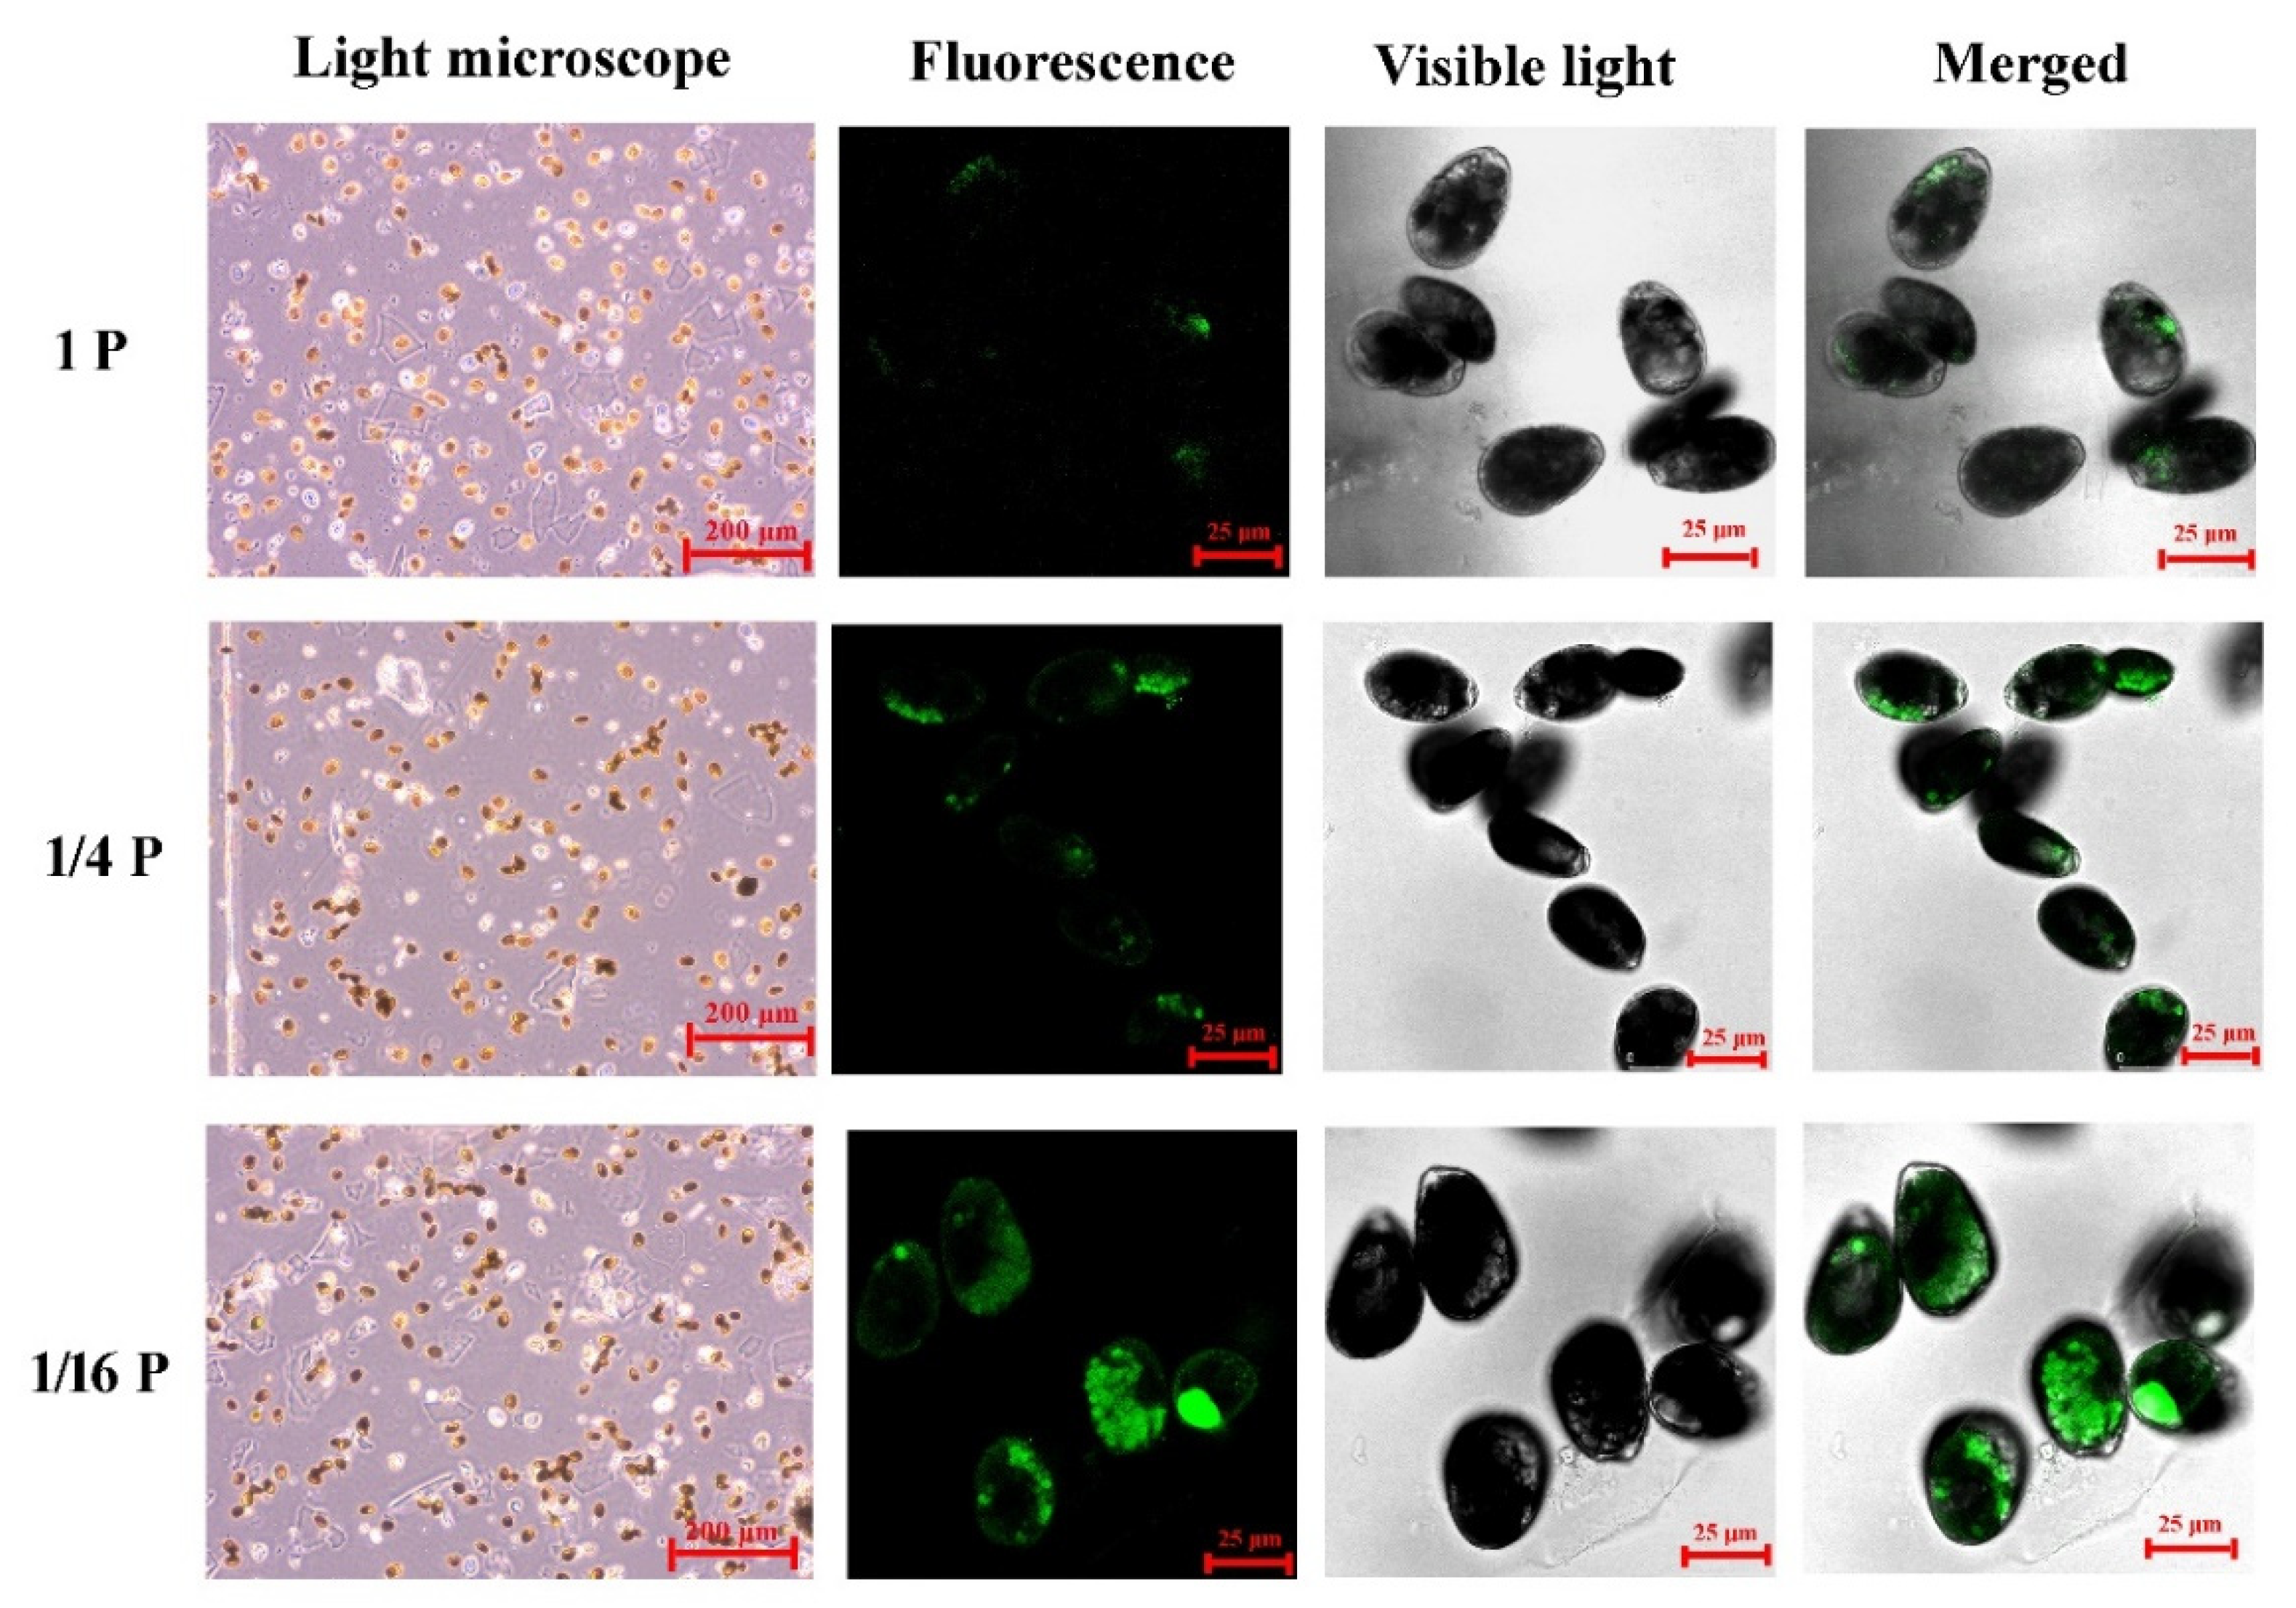
2.4. Confocal Laser Scanning Microscope (CLSM) Analysis

Morphology of lipid droplets in P. lima cells was observed under a laser-scanning confocal microscope (Leica SP8 DIVE/Falcon, Wetzlar, Germany) using the Nile red staining method as described in [19]. Briefly, cells from 50 mL of algal culture under different treatments were collected by centrifugation (3000× g for 5 min at 22 °C) at day 30, the obtained pellets resuspended in 3 mL f/2 media (20% DMSO) for 20 min at room temperature, and 30 μL of Nile red (0.1 mg/mL in acetone) added. The morphology of the Nile-red-stained cells was observed using a laser-scanning confocal microscope with an excitation wavelength of 488 nm and emission of 528 nm. Pictures from at least 10 cells for each sample were randomly captured.

2.5. Lipid Analysis

Lipid content in the Nile-red-stained P. lima cells was analyzed as described by Hou et al. [19] and their relative fluorescence intensity was measured to compare lipids content among different treatments. Briefly, algal cells from three aliquots of 50 mL of P. lima cultures were collected by centrifugation (3000× g for 5 min at 22 °C) on day 30, the obtained pellets resuspended in 3 mL of f/2 media (20% DMSO) for 20 min at room temperature, and 30 μL of Nile red (0.1 mg/mL in acetone) added. The stained samples were vigorously shaken and incubated under darkness for 20 min at room temperature, and transferred to a 96-well plate to determine fluorescence intensity (excitation at 485 nm, emission at 538 nm) using a microplate reader (Fluoroskan™ FL, Thermo Scientific).

2.6. Starch Content Measurements

A total of 50 mL of P. lima cells from three replicates of the P-limited and control cultures was collected via centrifugation (3000× g for 5 min at 22 °C). Starch was extracted and detected using a starch content assay kit (Boxbio, Beijing, China) according to the manufacturer’s instructions.

2.7. RNA Extraction, Sequencing, and Transcriptome Analysis

Three replicates of P. lima cultures were collected on day 30 and washed with 1× PBS to remove possible bacterial contaminants. A TransZolTM Plant kit (TransGen Biotech, Beijing, China) was used for total RNA extraction. RNA purity was assessed with a Nanodrop Spectrophotometer (Thermo Scientific, USA), RNA quantity was assessed using a Qubit 2.0 Fluorometer (Thermo Scientific, USA), and RNA integrity was assessed by a Fragment Analyzer 5400 (Agilent, USA). Sequencing libraries were generated using NEBNext® UltraTM RNA Library Prep Kit for Illumina (NEB, Ipswich, MA, USA) as described in [2]. Then, the library preparations were sequenced on an Illumina Novaseq 6000 platform and 150 bp paired-end reads were generated.
Fastp software (version 0.19.7) was used to perform basic statistics on the quality of the raw reads. After quality filtering, the raw reads were transformed into the processed reads, and the Trinity software (version 2.13.2) used to assemble the processed reads, which were used as the reference sequences for hierarchical clustering. The longest cluster sequences obtained after corset hierarchical clustering were used as unigenes for subsequent analysis.
To improve the annotations of the dinoflagellate transcriptomes, searches for all the assembled unigenes were performed in multiple databases, including non-redundant (NR) database, Gene Ontology (GO), Kyoto Encyclopedia of Gene and Genomes (KEGG) analyses, Protein family (Pfam), Clusters of Orthologous Groups of Proteins/euKaryotic Ortholog Groups (COG/KOG), Swiss-Prot, and TrEMBL databases. The gene expression levels were estimated using fragments per kb per million reads (FPKM) for each sample. Differential expression analysis (fold changes) of each group was performed using DESeq2 (version 1.22.2), and the genes with log2 (fold change) ≥ 1 and p-value < 0.05 were assigned as differentially expressed.

2.8. RT-qPCR

Total RNA was extracted using a TransZolTM Plant kit according to the protocol (TransGen Biotech, China). First strand cDNA was synthesized from 1 μg of total RNA using a Prime Script™ RT reagent kit (TaKaRa, Beijing, China). To confirm the RNA-Seq assay results, RT-qPCR was performed to validate the differential expression of some genes (DEGs) between the P-replete and P-limited cells. Specific primers (Table S2) were designed using online design software Primer3Plus (version 3.3.0) (https://www.primer3plus.com/, URL (accessed on 2 March 2023)) based on the obtained transcriptome unigenes of P. lima. β-tubulin was used as an internal gene to normalize the expression of target genes.
PCR was performed in a CFX96 fluorescence quantitative PCR System (Bio-Rad, Hercules, CA, USA) using iTaq Universal SYBR® Green Supermix (Bio-Rad, USA) with the following PCR reaction protocol: 95 °C for 30 s, 40 cycles at 95 °C for 5 s, 60 °C for 30 s, followed by a final melting curve from 65 °C to 95 °C for 5 s with an increment of 0.5 °C. The relative expression levels were calculated based on the 2−ΔΔCt relative response method.

2.9. Statistical Analysis

Statistical analyses were performed using the software GraphPad Prism 5 (version 5.01). All data were expressed as mean ± standard deviation. Student’s t-test was used to compare parameters among the different treatments after testing for the variance homogeneity. A difference with a p value < 0.05 was considered statistically significant.

3. Results

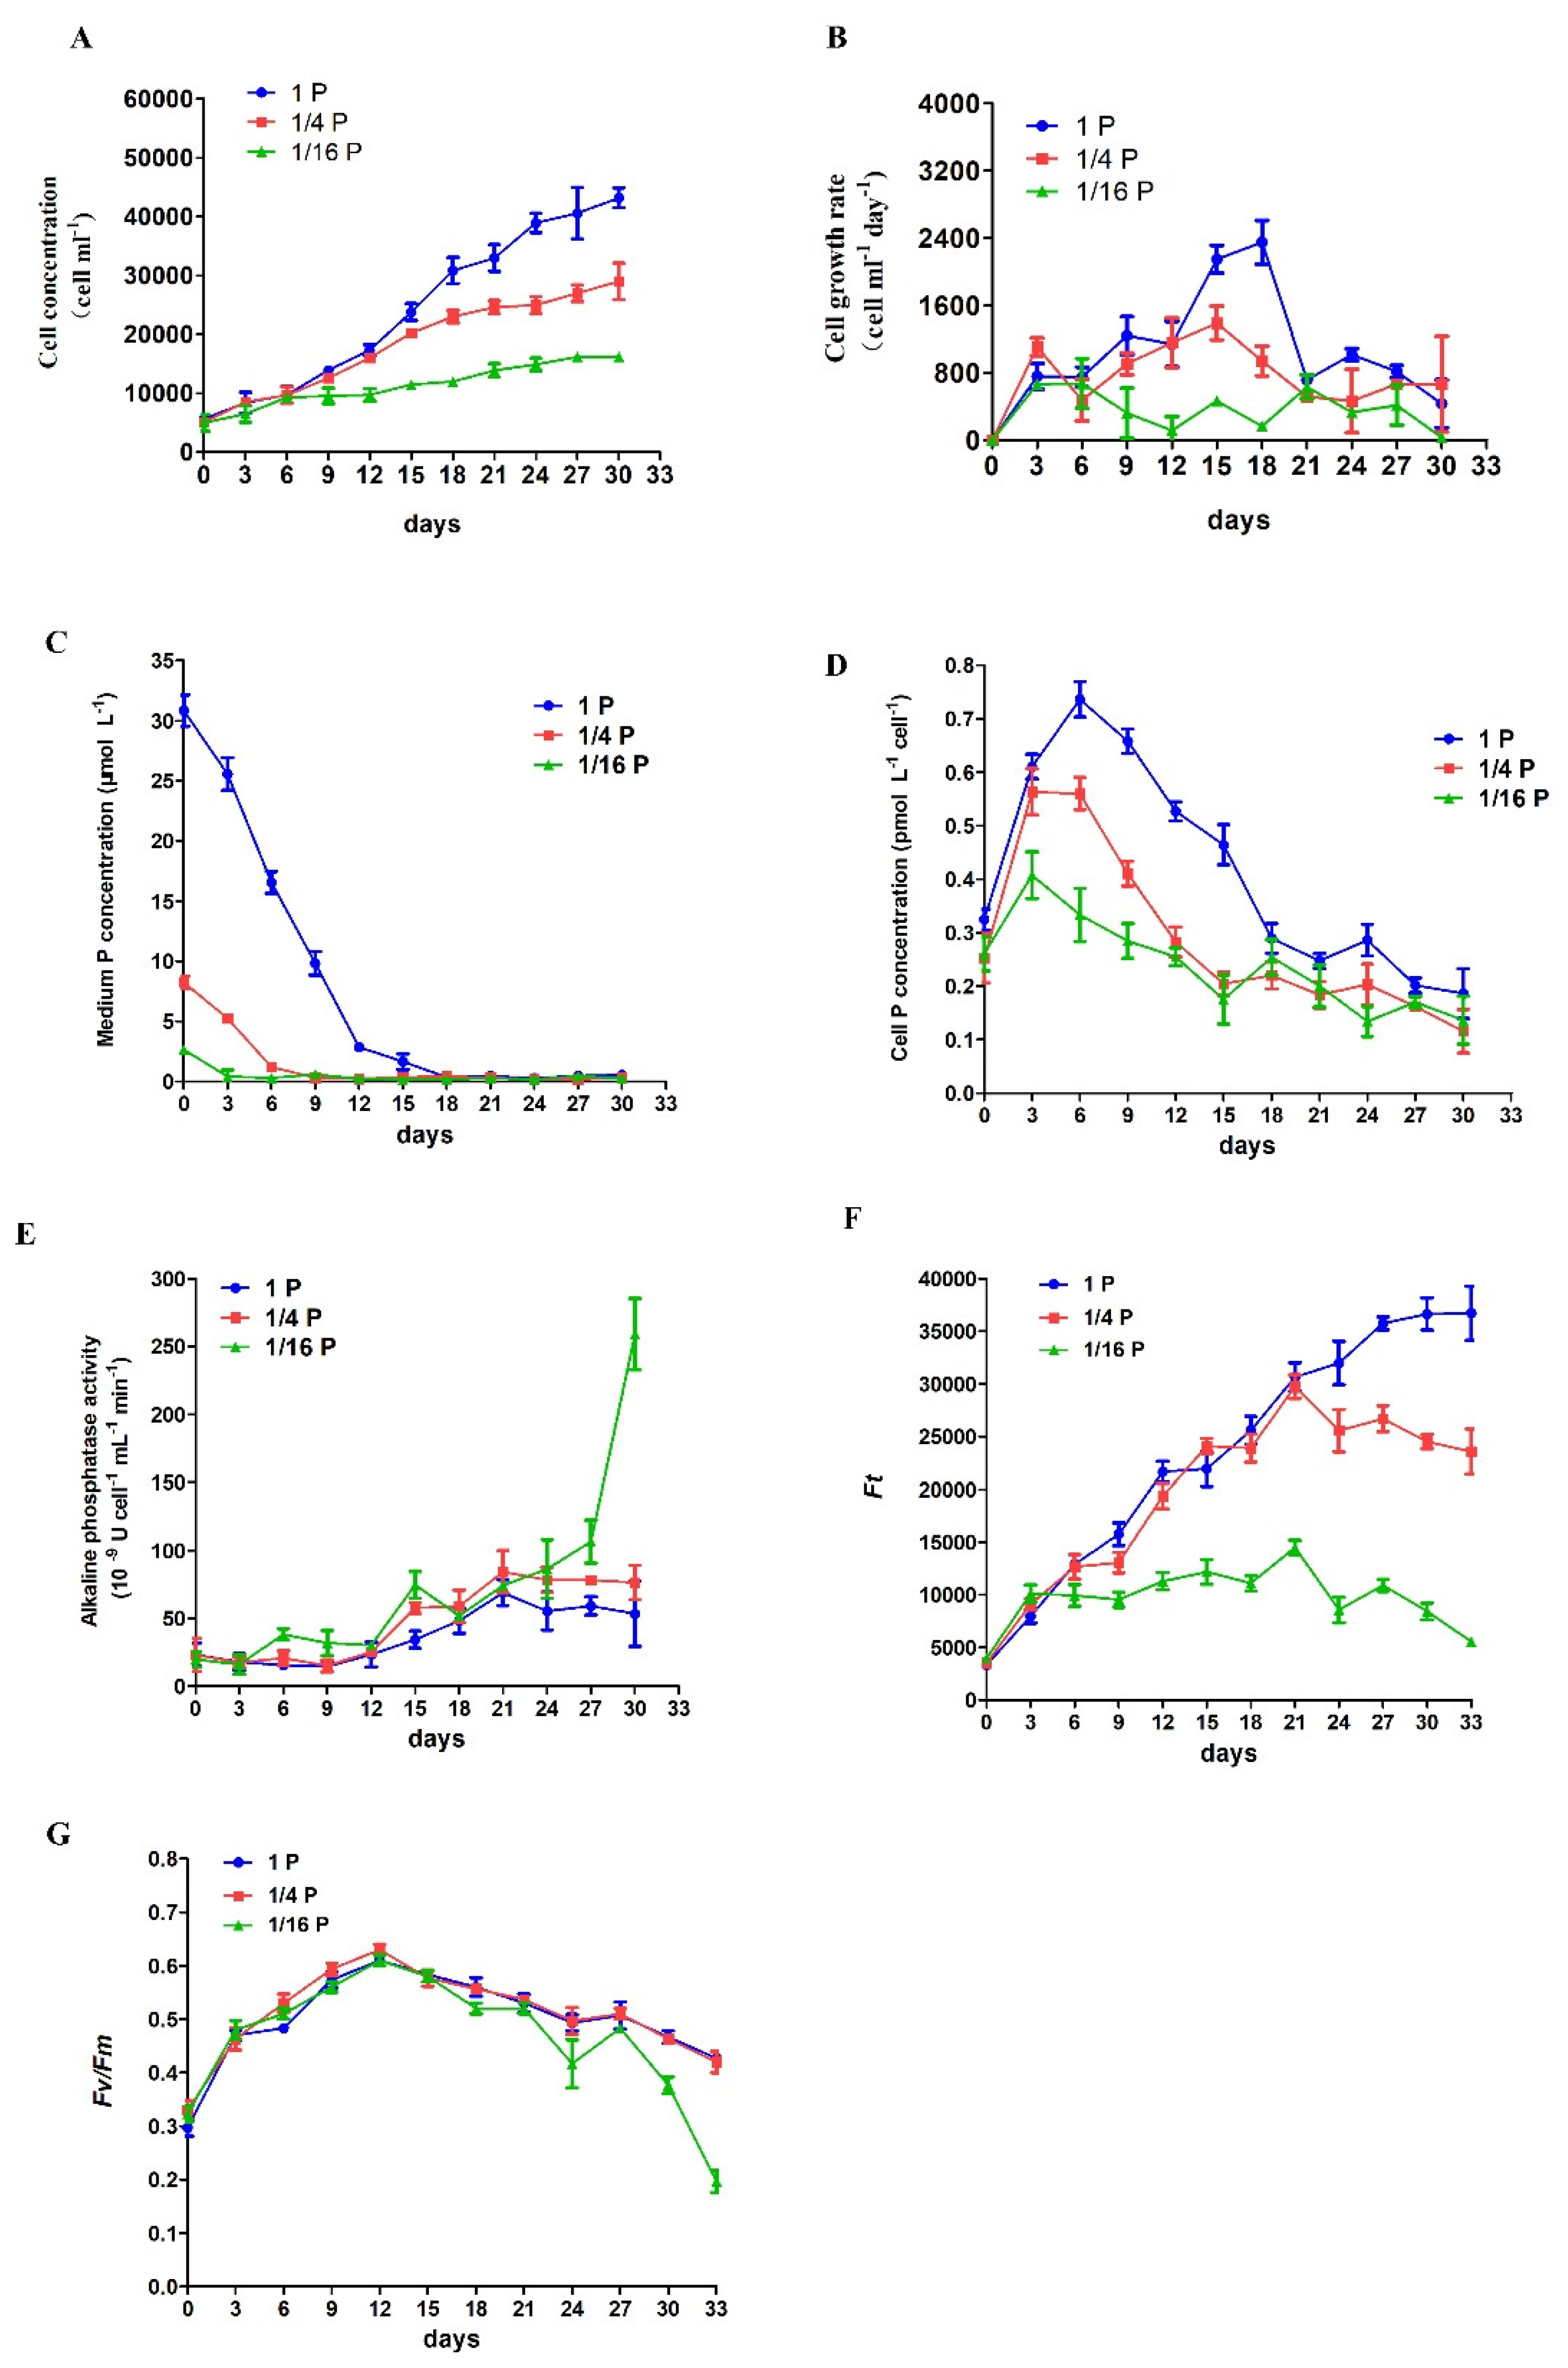
3.1. Physiological Responses of P. lima under Phosphate Limitation

P. lima cultures with an initial concentration of 6000 cells mL−1 were grown with two P-limited (1/4 P and 1/16 P) and one P-replete (1P) treatment, and showed similar growth curves until day 9 when their growth curves started to diverge (Figure 1A). Cells under the P-replete treatment reached a final cell concentration of 43,200 ± 1697 cells mL−1 after 30 days (Figure 1A). In contrast, the maximum cell concentration for 1/4P-limited and 1/16P-limited cultures after 30 days was 29,000 ± 3111 and 16,200 ± 282 cells mL−1, respectively (Figure 1A). The maximum cell growth rate in P-replete and 1/4P-limited groups occurred on day 15–18, with 2350 ± 259, and 1392 ± 200 cells mL−1 day−1, respectively (Figure 1B). The average cell growth rate in P-replete, 1/4P-limited, and 1/16P-limited cultures during the 30 days cycle was 1240, 766, and 340 cells mL−1 day−1, respectively (Figure 1B).
The extracellular P concentration decreased in both P-replete and -deficient cultures in parallel with increasing cell concentration, and P concentration in P-replete cultures was undetectable on day 18 (Figure 1C). The cellular P contents increased in all the treatments as the P in the solution was absorbed rapidly by day 3, but decreased gradually after day 6 as the P concentration in the solution declined (Figure 1D). In the P-replete and 1/4P-limited treatments, the bulk APA was very low from day 1 to 12, slightly increased from day 12 to 21, and then remained at a relatively stable level (Figure 1E). Conversely, the bulk APA in the 1/16P-limited cultures began to increase from day 3, and was greatly enhanced by day 27 (Figure 1E). Overall, the bulk APA in the 1/16P-limited cells was higher than that in P-replete and 1/4P-limited cells.
Changes in Ft values were similar in P-replete and 1/4P-limited cells until day 21 when their curves started to diverge (Figure 1F). Ft values in P-replete cells reached a stationary phase on day 30–33 and a peak value around 36,711 ± 2575, while Ft maximum in 1/4P-limited cells (around 29,727 ± 1103) was reached on day 21 and then decreased gradually until around 23,555 ± 2143 on day 33. In the 1/16P-limited cultures, Ft values were significantly lower than in the other two groups, a peak (around 14,489 ± 690) was reached on day 21, and then decreased gradually until around 5526 ± 215 on day 33 (Figure 1F).
Fv/Fm increased from day 0 to 12 in both P-replete and P-limited cells (Figure 1G). For the P-replete and 1/4P-limited cells, there were similar variation trends for Fv/Fm values, which reached a maximum value (around 0.60) on day 12 and then decreased gradually until about 0.40 on day 33 (Figure 1G). In comparison, in the 1/16P-limited cultures, the similar trend in Fv/Fm changes was found from day 0 to 21 as in the P-replete and 1/4P-limited cells, but the values significantly decreased from day 24 to the end of the experiment, at around 0.20 (Figure 1G).

3.2. Transcriptomic Analysis

Qualified cDNA libraries of P. lima samples were sequenced using the Illumina Novaseq 6000 platform, resulting in an average of 112,111,739 raw reads (Table 1). After raw data filtering, 85,019,647 clean reads were acquired, and each data set of clean reads exhibited Q20 > 97% with an average GC content of 58.76%. All clean reads were submitted to the NCBI Sequence Read Archive database (BioProject ID: PRJNA966759). The clean reads were then used for assembly by Trinity, resulting in 98,860 unigenes with an N50 of 1581 nt and an average sequence length of 1119 nt.
To obtain comprehensive gene function annotations, BLASTx searches were performed in the KEGG, NR, Swiss-Prot, TrEMBL, KOG, GO, and Pfam databases (Table 1). The results identified that 17.54% of the unigenes had significant similarity in the KEGG database, 24.22% of the unigenes had BLASTx hits in the NR database, 13.74% of the unigenes had an annotated match in the Swiss-Prot database, 47.14% of the unigenes had an annotated match in the TrEMBL database, 16.95% of the unigenes had BLASTx hits in the KOG database, 36.88% of the unigenes had an annotated match in the GO database, and 44.72% of the unigenes had BLASTx hits in the Pfam database. Overall, 61.34% of the unigenes were annotated in at least one database.

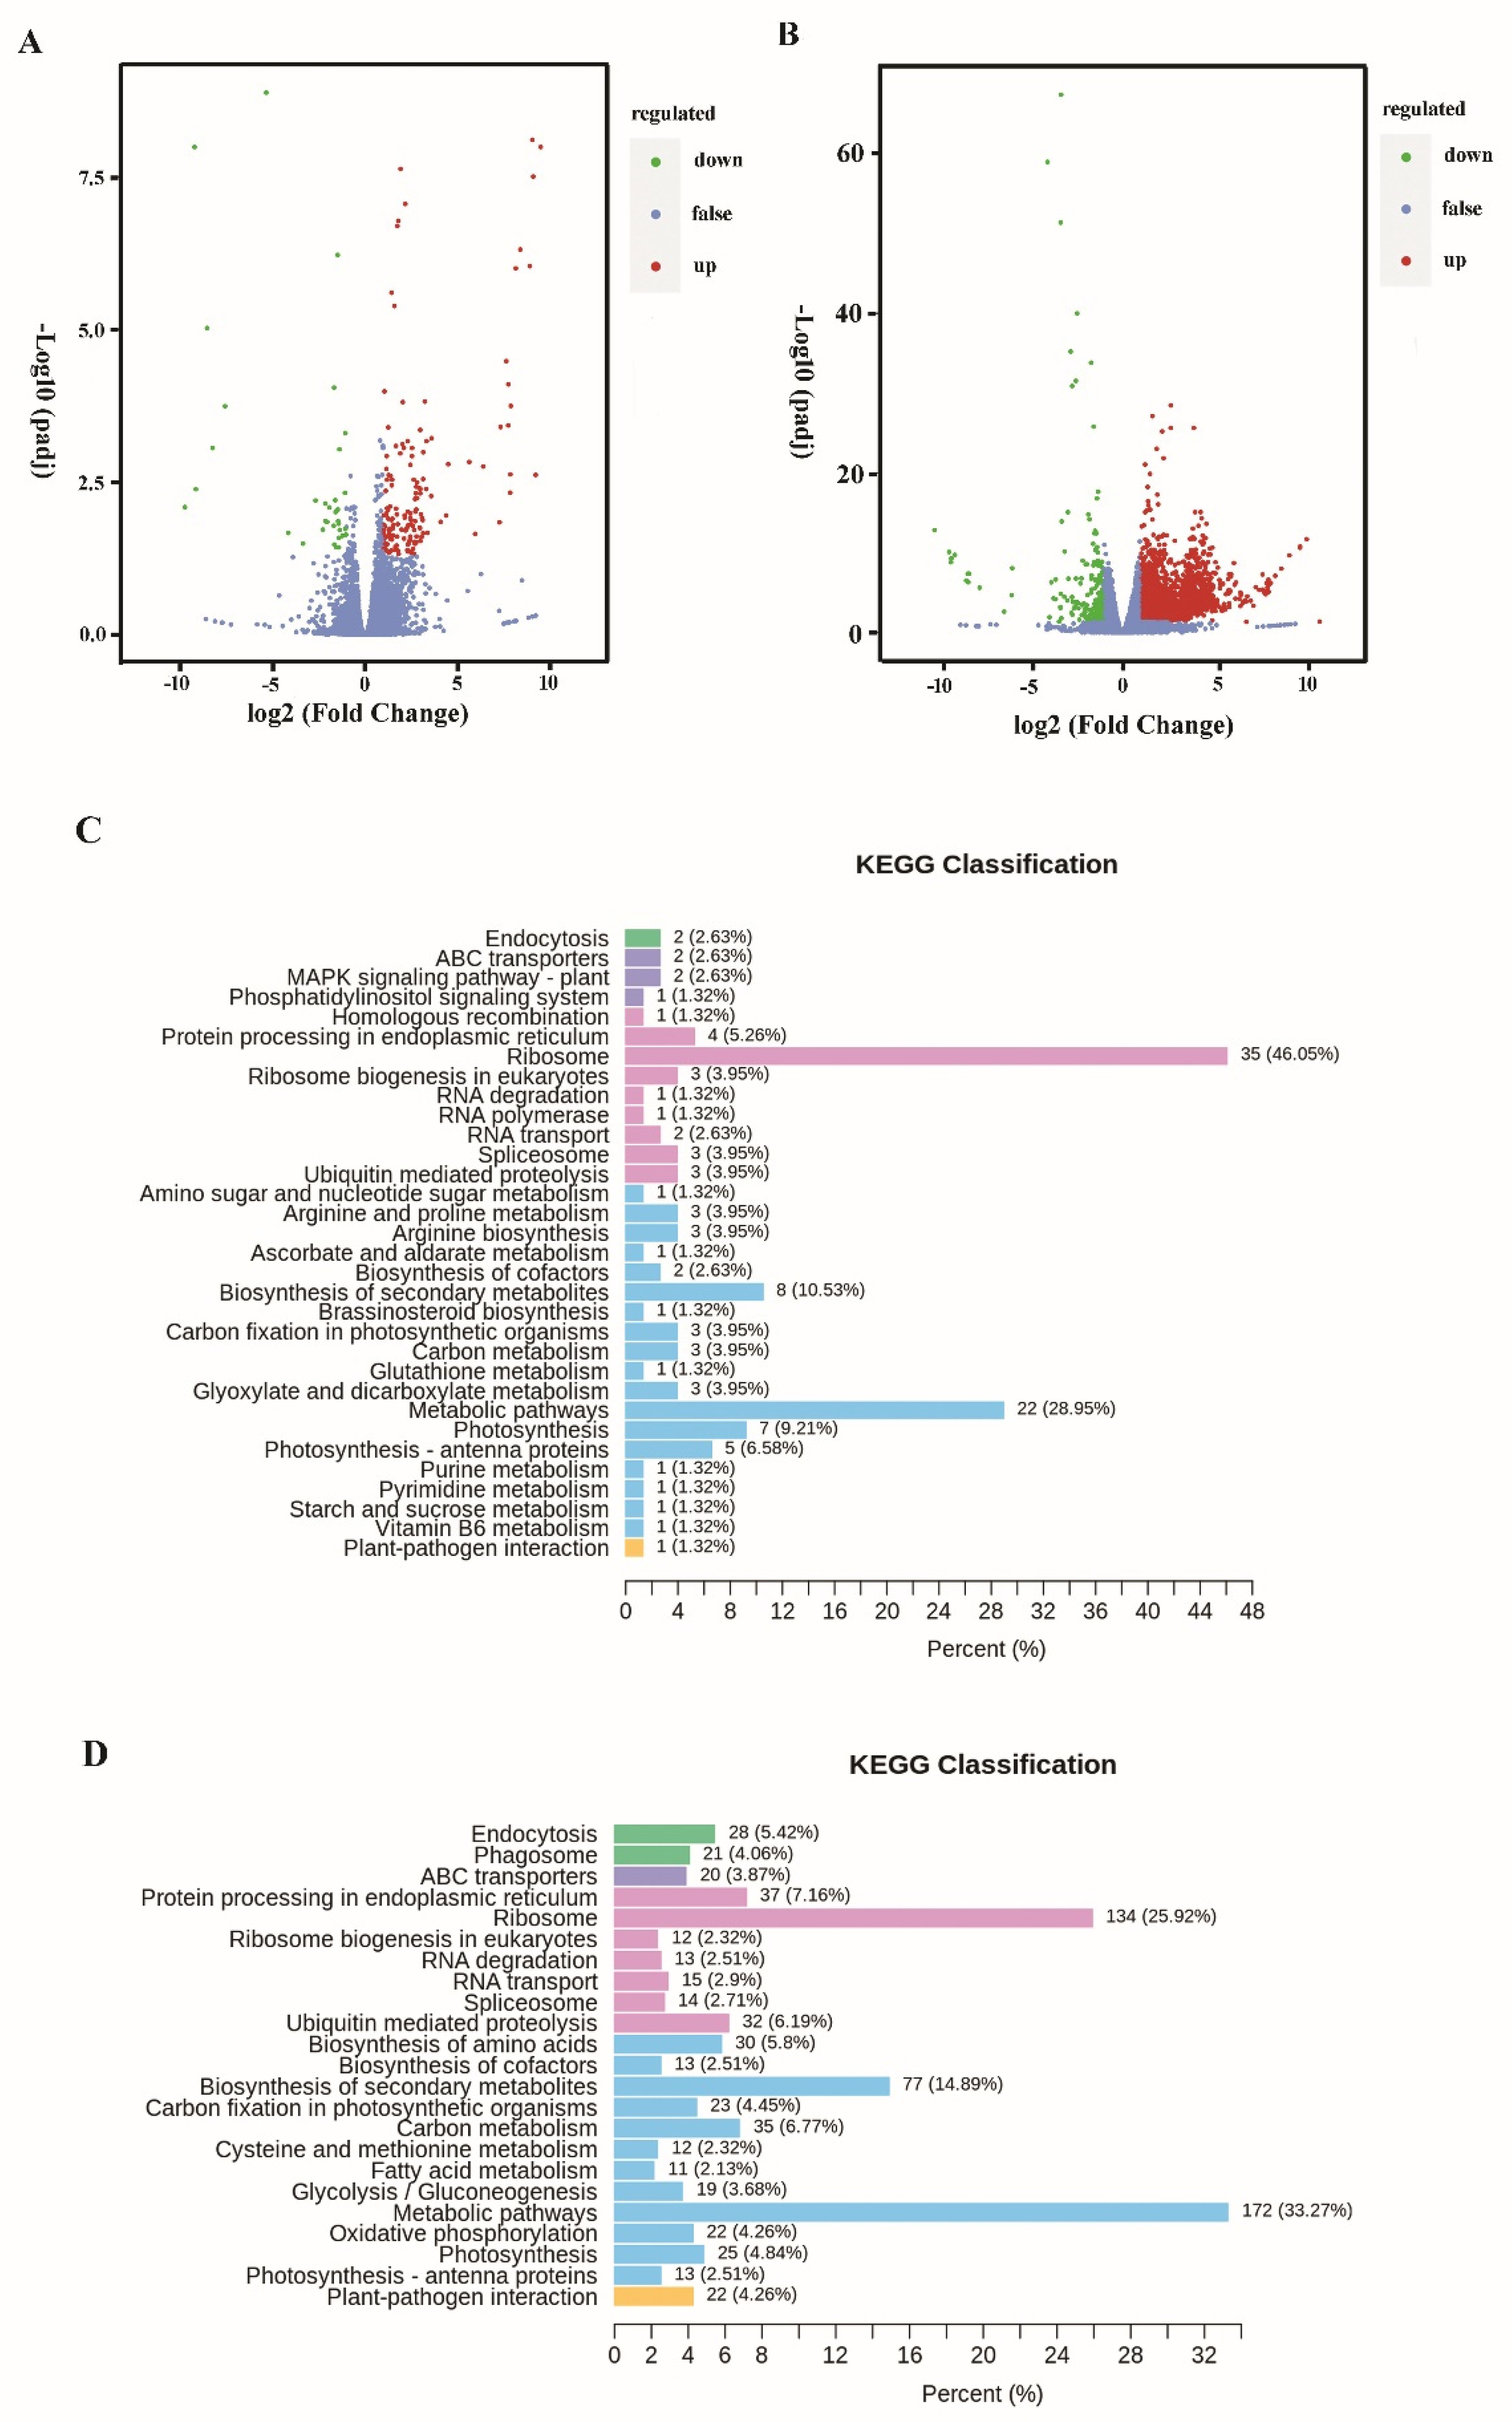
3.3. Transcriptomic Analysis of Differential Gene Expression

Among these transcripts, 148 unigenes were significantly up-regulated, and 30 unigenes were down-regulated under 1/4 P-limited conditions (1/4 P vs. 1P, |log2 (fold change)| ≥ 1; p-value < 0.05). In addition, 2708 unigenes were significantly up-regulated, and 284 unigenes were down-regulated under 1/16 P-limited conditions (1/16 P vs. 1P, |log2 (fold change)| ≥ 1; p-value < 0.05) (Figure 2A,B). KEGG enrichment analysis of the differentially expressed genes shows that the top pathways are ribosome, metabolic pathways, biosynthesis of secondary metabolites, photosynthesis, and ubiquitin-mediated proteolysis (Figure 2C,D). The differentially expressed genes were also detected using Gene Ontology (GO) clustering (Figure S1). GO analysis includes three parts: biological process, cellular component, and molecular function. The top biological processes were metabolic processes, cellular processes, and response to stimulus. The top cellular components were cell parts, membrane parts, and organelles. The top molecular functions were binding, catalytic activity, and transporter activity. All the differentially expressed genes under P-limited conditions were listed and annotated, as shown in Table S1. The representative differentially expressed genes between 1/16 P-limited conditions and P-replete conditions are shown in Table 2.
As many as 76 ribosomal subunit proteins were found to be up-regulated under the 1/16 P-limited conditions, such as the small subunit ribosomal proteins S20e, S11e, S5e, S4e, and S23e, and the large subunit ribosomal proteins L34e, L10e, L13e, and L14e. The stress–shock proteins, such as Hsp 70, Hsp 90, Hsp 83, and HSPA1s, were significantly up-regulated. Genes related to glycolysis, gluconeogenesis, and oxidative phosphorylation such as pyruvate decarboxylase (cluster-1527.74515), phosphoglycerate kinase (cluster-1527.83027), and cytochrome c oxidase subunit 5b (cluster-1527.419), were found to be up-regulated, presumably to meet energy demands under response to environment stress.
Most of the photosynthesis-related genes in the chloroplasts were down-regulated (Table 2). For instance, the gene encoding photosystem II P680 reaction center D1 protein (PsbA, cluster-1527.39156), a component of the photosynthetic reaction center in PSII, decreased by 2.94 (log2)-fold under 1/16 P-limited conditions compared with the control, while the cytochrome b6 gene (PetB, Cluster-1527.15944), which is involved in electron transfer of photosynthetic phosphorylation, decreased by 3.60 (log2)-fold. In addition, several genes involved in fatty acid biosynthesis and amino acid metabolism, such as acetyl-CoA carboxylase (luster-1527.38700), malonyl-CoA acyl carrier protein transacylase (FabD, luster-1527.31766), and S-adenosylmethionine synthetase (luster-1527.83262) were up-regulated.
It is worth noting that some members of the ATP-binding cassette (ABC) transports superfamily, including ABCA3 (cluster-1527.71271), ABCB1 (cluster-1527.63439), and ABCC1 (cluster-1527.10718), were observed to be up-regulated under the P-limited conditions. Additionally, some genes involved in cell endocytosis, phagosome formation, and ubiquitin-mediated proteolysis, such as calreticulin (cluster-5481.0), stromal membrane-associated protein (cluster-1527.1659), ras-related proteins (cluster-1527.16544, cluster-1527.86789, cluster-1527.76712, cluster-6525.0), and ubiquitin family proteins (Ccuster-1527.11208), were also up-regulated under the P-limited conditions.

3.4. RT-qPCR Validation of Differentially Expressed Genes

To validate the RNA-Seq data in gene expression related to photosynthesis, lipid metabolism, endocytosis, and ABC transporters, RT-qPCR was performed. Five DEGs—photosystem II P680 reaction center D1 protein (PsbA), photosystem II CP43 chlorophyll apoprotein (PsbC), cytochrome b6-f complex subunit 4 (PetD), malonyl coenzyme A-acyl carrier protein transacylase (MCAT), and ATP-binding cassette subfamily B1 (ABCB1) were selected for RT-qPCR analysis. The expression levels of these genes were normalized with the reference gene β-tubulin. As shown in Table S2, the expression levels of these DEGs between P-replete and 1/16 P-limited treatments as determined by RT-qPCR were basically consistent with those determined by RNA-seq. These results indicate that, overall, the RNA Seq method provides a correct reference for expression profiling analysis.

3.5. Lipid and Starch Accumulation under P-Limited Conditions

In the P-replete cells, lipid bodies appear relatively bright and show fewer oil bodies with green fluorescence. In P. lima cells from 1/16 P-limited and 1/4 P-limited cultures, lipid bodies appear much darker and show more oil bodies with green fluorescence (Figure 3).
In parallel with CLSM observations, lipid contents in P. lima cells were estimated by measuring their fluorescence intensity with a microplate reader. Lipid content in P. lima cells grown under 1/16 P-limited and 1/4 P-limited conditions was about 5.35-fold and 1.82-fold higher, respectively, than those in the controls (Figure 4A). In addition, starch contents detected with a starch content assay kit in 1/16 P-limited and 1/4 P-limited cells (62.76 ± 3.58 pg cell−1 and 52.93 ± 5.43 pg cell−1, respectively) were significantly higher than those in the P-replete control (20.21 ± 3.07 pg cell−1) (Figure 4B).

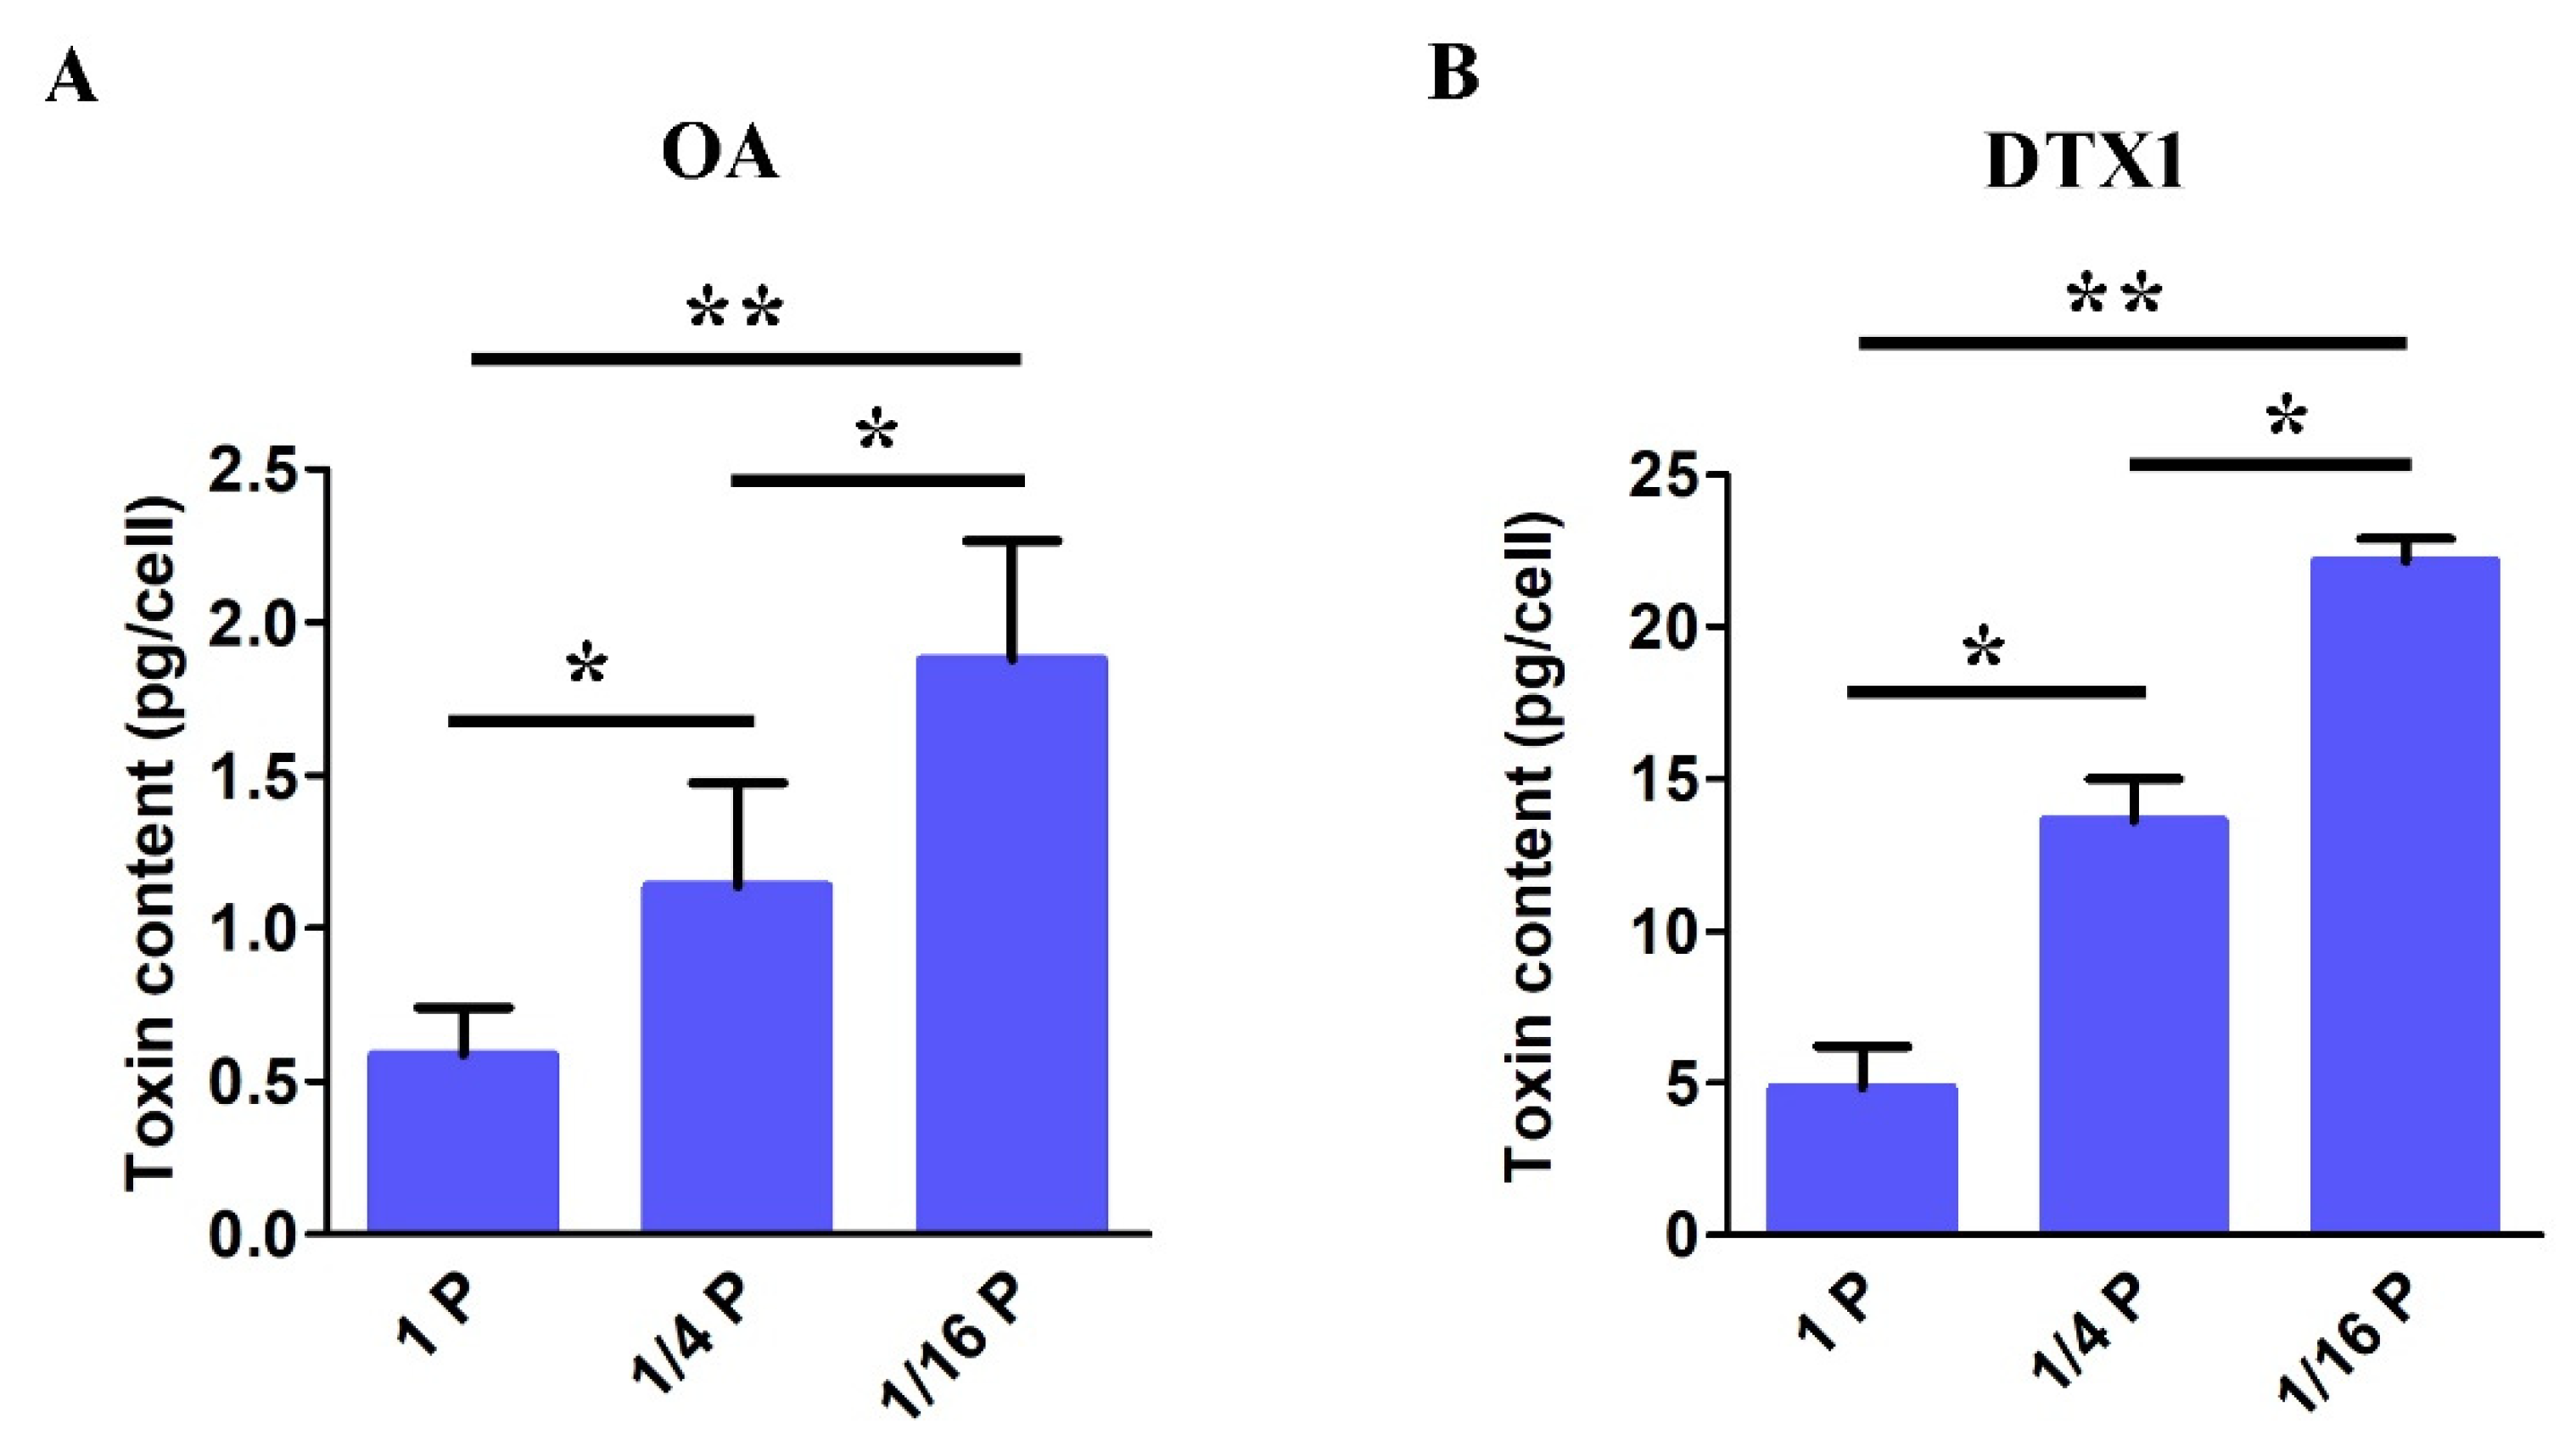
3.6. DSP Toxin Content in P. lima under P-Limited Conditions

Through toxin analysis using HPLC–MS/MS, only OA and DTX1 were detected in the P. lima cell extract. DSP toxin content in P. lima cells shows significant differences between cultures under P-limited and P-replete conditions (Figure 5). The highest OA concentration of 1.87 ± 0.38 pg cell−1, found in 1/16 P-limited cultures, was significantly higher than observed in the 1/4 P-limited cultures (1.13 ± 0.33 pg cell−1) and 1P-replete groups (0.58 ± 0.15 pg cell−1) (Figure 5A). Meanwhile, the highest DTX1 concentration of 22.14 ± 0.73 pg cell−1, found in 1/16 P-limited cultures, was significantly higher than observed in the 1/4 P-limited cultures (13.60 ± 1.39 pg cell−1) and 1P-replete groups (4.84 ±1.33 pg cell−1) (Figure 5B). In addition, the content of DTX is significantly higher than that of OA in our study, indicating this strain of P. lima mainly produces DTX.

4. Discussion

4.1. Carbon Metabolism and Photosynthesis under P-Limited Conditions

Almost all organisms can synthesize pyruvate from glucose or other polysaccharides through glycolysis pathway, providing ATP, reducing power, and key metabolites [4]. In the glycolysis pathway, the up-regulation of pyruvate kinase, phosphoglycerate kinase, pyruvate dehydrogenase, and succinate dehydrogenase (Table 2) was found in the P-limited cells, which would supply the key intermediate pyruvate and could be used as the precursor for acetyl-CoA formation for the TCA cycle, or lipid or amino acid synthesis. The up-regulation of glycolytic activity suggests that P. lima requires additional energy to activate various defense mechanisms to cope with P deficiency. These results are consistent with recent studies in respect of Prorocentrum spp. [4,19]. Hou et al. reported that the glycolytic activity of P. lima was enhanced and several enzymes involved in glycolysis were up-regulated under nitrogen limitation [19]. Zhang et al. found that the expression levels of 6-phosphofructokinase and pyruvate dehydrogenase in P. donghaiense were significantly up-regulated under P limitation and down-regulated 28 h after P refeeding [4].
Previous studies have shown that P deficiency could lead to a decrease in photosynthesis and the growth of microalgae as well as plants [2,26,36,37]. Fv/Fm is the maximum photochemical quantum yield of the photosystem II (PS II) reaction center. As an important chlorophyll fluorescence parameter, Fv/Fm represents the light energy conversion efficiency of the photosynthetic process [19], as well as being a potential valuable indicator of the photoinhibition and nutrient limitation of phytoplankton [43]. Ft is the instantaneous chlorophyll fluorescence yield and represents the emission from the excited chlorophylls in the PSII antenna, which is related to the concentration of chlorophyll [44]. In our study, both Ft and Fv/Fm in P. lima decline under P deficiency (Figure 1F,G), a fact which is consistent with similar observations in other planktonic microalgae [4,36]. Moreover, some genes involved in photosynthesis, such as photosystem II P680 reaction center D1 protein (PsbA), photosystem II CP43 chlorophyll apoprotein (PsbC), photosystem II CP47 chlorophyll apoprotein (PsbB), photosystem I P700 chlorophyll a apoprotein A1 (PsaA), photosystem I P700 chlorophyll a apoprotein A2 (PsaB), cytochrome b6 (PetB), cytochrome b6-f complex subunit 4 (PetD), and ferredoxin (PetF), were also down-regulated under the P-limited conditions (Table 2), indicating that P limitation had a severe influence on the photosystems in P. lima (Figure 6).
The mechanism of carbon fixation in P. lima remains unclear. Based on other studies, P. lima may possess a typical C3 or an intermediate C3–C4 photosynthetic pathway [19,45]. In our study, the genes involved in carbon fixation pathways, such as ribulose bisphosphate carboxylase (RbcL, cluster-1527.41437), phosphoglycerate kinase (PGK, cluster-1527.83027), glyceraldehyde-3-phosphate dehydrogenase (GAPA, cluster-1527.43164), and triosephosphate isomerase (TPI, cluster-1527.53219), were found to be increased under the P-limited conditions (Table 2). The up-regulation of these genes suggests that the gluconeogenesis process and starch synthesis are activated. Moreover, the up-regulation of pyruvate orthophosphate dikinase (PpdK, cluster-1527.73147) were also identified. PpdK is a critical enzyme involved in C4 photosynthesis, indicating the possibility of C4 biosynthesis pathway in P. lima (Figure 6).

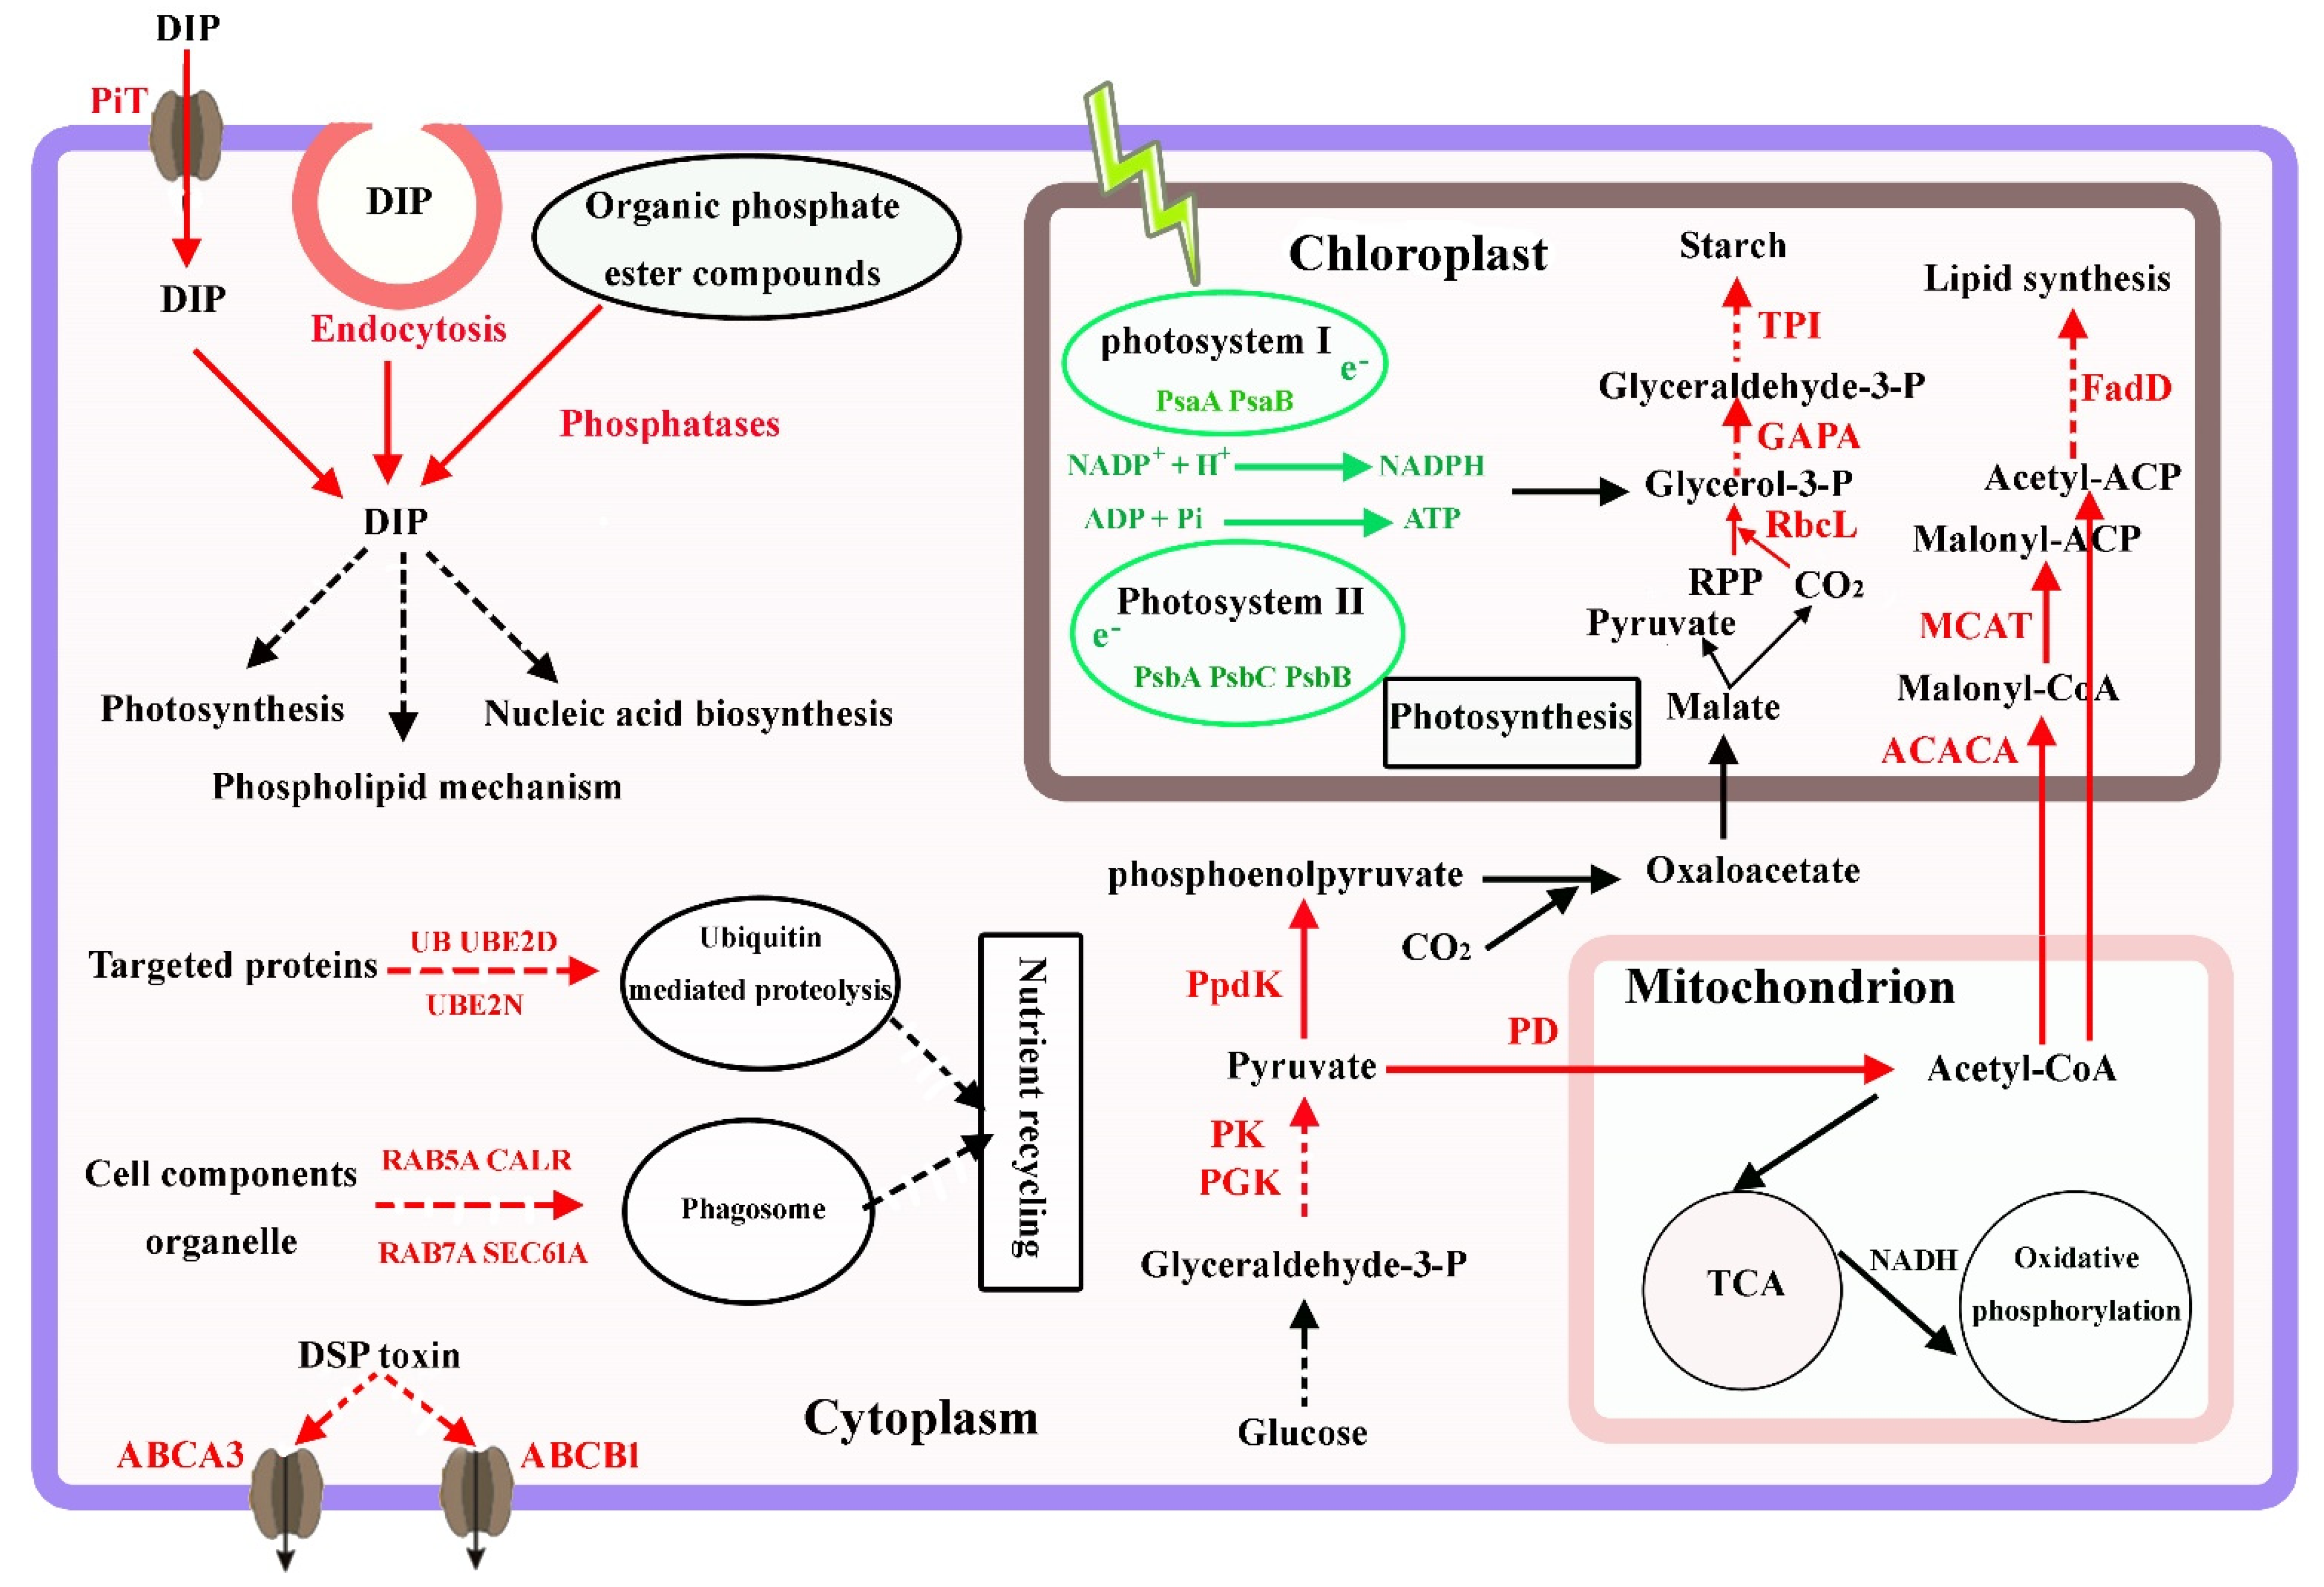
4.2. Phosphate Transport, Utilization, and Homeostasis

Dissolved inorganic phosphorus is the preferred P source for phytoplankton [24,25]. Under P-limited conditions, many microalgae can increase phosphate uptake by enhancing the expression of phosphate transporters, such as the green algae Chlamydomonas reinhardtii [46], the diatoms Thalassiosira pseudonana [29], and the dinoflagellates Karenia mikimotoi [28] and Prorocentrum donghaiense [32]. In addition, transcripts of several phosphate transporters have been shown to significantly increase by low P treatment in many plant cells [38,39,47]. In this study, numerous transcripts of phosphate transporters, including inorganic phosphate transporters, mitochondrial phosphate transporters sodium-dependent inorganic phosphate transporters, triose-phosphate transporters, sphingosine-1-phosphate transporter, and glycerol-3-phosphate transporter, were identified in P. lima. Of these, the expression of some phosphate transporters was significantly up-regulated in the 1/16 P-deficient cells (Table 2), indicating that P. lima possesses phosphate uptake systems to achieve adaptation to ambient P deficiency (Figure 6).
When DIP is depleted, DOP can serve as the major alternative P source for microalgae [4,27,29]. Alkaline phosphatase is commonly present in algae and usually enhanced under P limitation conditions. It can hydrolyze phosphate from phosphomonoesters for assimilation by the cell [24]. In the present study, APA in the 1/16 P-limited cells was markedly evaluated compared to that in the P-replete cells (Figure 1E). In addition, transcripts of several other phosphatases, such as acid phosphatase, phospholipase A1, phospholipase A2, and phosphodiesterase were significantly up-regulated in P-deficient cells. Acid phosphatase plays important roles in metabolism such as hydrolysis of phospholipid materials, participation in autophagy processes, and endomembrane recycling [48]. The up-regulation of acid phosphatase could also be observed in many plant transcriptome studies under conditions of phosphorus deficiency, such as peanut [39], quinoa [49], rice [50], and soybean [51]. Phospholipase plays central roles in the maintenance and remodeling of the cell membrane by hydrolyzing membrane phospholipids [52]. Phosphodiesterase can hydrolyze assorted structural phospholipids, producing phosphatidic acid and various head groups [53]. Furthermore, phosphodiesterase plays various roles in membrane transport, cell migration, hormone signaling, and the environmental stress response [54,55]. Accordingly, under P deficiency, the utilization of intracellular phosphor esters was enhanced in P. lima, and organic P became the major P source (Figure 6).
Endocytosis plays vital roles in signal transduction, plasma membrane homeostasis, transport of extracellular substances into cells, and the cellular response to environmental stimuli [4,56,57]. In eukaryotic cells, clathrin-mediated endocytosis is the major transport mechanism through which extracellular molecules are packaged into clathrin-coated vesicles and taken up into the cells [4,57]. In our study, some genes such as ADP-ribosylation factor 1/2 (ARF1/2), stromal membrane-associated protein (SMAP), and charged multivesicular body proteins (CHMPs) were enriched in the endocytosis metabolic pathway and the transcript expression levels were significantly up-regulated in the P-limited cells (Table 2). ARF1/2 factor plays pivotal roles in vesicle formation [58]. SMAP is a subfamily of the ARF GTPase-activating proteins and is involved in ARF-mediated vesicular transport [59]. CHMPs are required for the formation of the multivesicular body, a late endosomal structure that fuses with the lysosome to degrade endocytosed proteins [60]. Therefore, endocytosis might be an important strategy for P. lima to utilize extracellular nutrients, including DIP and DOP, and to maintain intracellular P homeostasis under P-limited conditions (Figure 6).

4.3. Lipid and Starch Accumulation under P-Limited Conditions

It is well-known that the storage of carbohydrate and lipid in many algae play important roles in response to ambient changes such as nutrition concentration [19,61,62,63]. For microalgae, carbon sources usually include polysaccharides and lipids [64,65]. The excess carbon generated by photosynthesis can be used to synthesize storage molecules such as triglycerides or starch. Previous studies have shown that nitrogen and phosphorus deficiency could trigger lipid and starch accumulation in algal cells [19,61,66], but lipid and starch accumulation have not yet been studied for P. lima in response to P limitation. Feng et al. reported that the lipid content of Chlorella zofingiensis grown in phosphate-deficient media (44.7%) was higher than that grown in full media (33.5%) [67]. Khozin-Goldberg et al. observed that the cellular total lipid content of Monodus subterraneus cells increased from 1.6 to 4.4 fg cell−1 with decreasing phosphate availability from 175 to 0 μM, which was mainly due to the dramatic increase in triacylglycerol levels [68]. Yao et al. studied cell growth and starch accumulation in Tetraselmis subcordiformis under phosphorus deprivation and the maximum starch content of 44.1% was achieved with initial cell concentration of 1.5 × 10⁶ cells mL−1 [69].
From our observations, total lipid and starch contents in P. lima cells under the 1/16 P-limited conditions were significantly higher than those of P-replete counterparts, at about 5.35-fold and 3.10-fold of the controls, respectively (Figure 3 and Figure 4). Accordingly, several enzymes related to fatty acid synthesis, such as acetyl-CoA carboxylase (cluster-1527.38700), malonyl coenzyme A-acyl carrier protein transacylase (cluster-1527.31766), and long-chain acyl-CoA synthetase (cluster-4976.0) were up-regulated by 2.00 (log2)-, 1.16 (log2)-, and 3.70 (log2)-fold, respectively (Table 2). Some genes involved in starch synthesis, such as soluble starch synthase 1 (cluster-1527.40721) and glucose–starch glucosyltransferase (cluster-1527.11343), were also up-regulated by 0.94 (log2)-fold and by 0.57 (log2)-fold, respectively. Consequently, these genes may be involved in lipid and starch biosynthesis, and the regulation of intracellular carbon metabolism of P. lima during P stress (Figure 6).
Studies have shown that autophagy plays an important role in lipid production and photosynthetic metabolism in microalgae [70]. The plastid membranes and cellular components generated by autophagy might be in favor of recycling nutrients and the accumulation of carbon source. A previous study showed that in P. lima cells under nitrogen-limited conditions, the chloroplasts appeared smaller and were less abundant, which suggested the presence of autophagy in P. lima and remodeling of the chloroplast membrane to accumulate lipid and starch [19]. Moreover, P. lima contains acid phosphatases in lysosomes, which have a catabolic function, contributing to food digestion and autophagy process [19]. These enhance the possibility of autophagy in response to P-deficiency in P. lima (Figure 6). This effect of P-limitation on autophagy was also supported by our study, where some genes involved in the ubiquitin pathway and autophagy process were markedly up-regulated (Table 2). As is well-known, the ubiquitin pathway is necessary for the extensive degradation of cellular proteins and the targeted hydrolysis of specific regulatory proteins in eukaryotic cells. It appears that ubiquitin can promote the degradation of a large amount of protein used for energy recovery under phosphorus-deficient conditions, which may contribute to the accumulation of carbon sources (Figure 6). Starch and lipid contents were found to be increased in the P-limited cells, which provided further evidence that P-limitation could induce the accumulation of lipid and starch in P. lima through recycling plastid membranes or cellular components via autophagy and the ubiquitin pathway.

4.4. DSP Toxins Production in P. lima

Previous studies showed that the culture conditions, such as nutrients, salinity, and temperature, could induce significant changes in DSP toxin levels of P. lima [71,72,73,74,75]. Of these, starvation of phosphorus could increase the production of toxins [17,21,22]. Vanucci et al. reported that OA content in P. lima significantly increased 2.3-fold compared to the control under P-limitation conditions [21]. Hou et al. found that the OA contents per cell under P-limitation conditions increased 2.01-fold with respect to control [22]. In line with these studies, the content of OA and DTX1 in our study were found to increase under 1/16 P-limited conditions, significantly higher than control counterparts by 3.2-fold and 4.6-fold, respectively (Figure 5). The production of toxins may be a compensatory competitive strategy for dinoflagellate under low nutrient conditions. It is worth noting that cell growth and photosynthetic efficiency were down-regulated under P-limitation, but toxin cellular contents were up-regulated, which showed the strong negative correlations between toxin production and cell growth (or photosynthesis).
A previous study suggested that ATP-binding cassette (ABC) transporters might be responsible for the transport or efflux of DSP toxin in P. lima [19]. ABC transporters are composed of a large and diverse superfamily of transmembrane proteins that participate in the active transport of various substrates in prokaryotes and eukaryotes. To date, a large number of ABC transporters have been identified in various species, such as multidrug resistance (MDR or ABCB), multidrug-resistance-associated protein (MRP or ABCC), and pleiotropic drug resistance (PDR or ABCG), which are involved in the membrane transport of endogenous secondary metabolites, playing an important role in the avoidance of self-toxicity [76]. DSP toxin content and MRP activity were found to be increased conformably over time under P-limited conditions compared with control counterparts [22]. In our study, the OA and DTX1 contents per cell under P-limitation conditions increased significantly with respect to the control (Figure 5). Accordingly, the expression of ABCA3 (cluster-1527.71271), ABCB1 (cluster-1527.63439), and ABCC1 (cluster-1527.10718) was found to be increased by 1.35 (log2)-fold, 1.81 (log2)-fold, and 1.64 (log2)-fold, respectively (Table 2). This consistency further indicates that ABC transporters might be related to the transport or efflux of DSP toxins in P. lima (Figure 6).

5. Conclusions

This study investigated the molecular mechanisms expressed by P. lima to respond to ambient P deficiency through RNA sequencing and physiological analysis. A total of 148 unigenes were significantly up-regulated, and 30 unigenes were down-regulated under 1/4 P-limited conditions, while 2708 unigenes were significantly up-regulated, and 284 unigenes were down-regulated under 1/16 P-limited conditions. The expression levels of genes encoding P transporters and organic P utilization in P. lima were significantly up-regulated, indicating the strong ability of P. lima to utilize DIP as well as DOP. Cell membrane phospholipids or other phosphate ester compounds could serve as a major P source for P-deficient cells, while the enhancement of endocytosis and autophagy would allow the cells to capture more DOP and regulate P homeostasis. The biochemical and physiological analyses reveal that starch, lipid, and toxin contents increase, while photosynthetic efficiency decreases under P deficiency. The accumulation of lipid and starch in P-deficient cells could provide an energy source for P. lima to cope with adverse environmental conditions, such as a sudden exposure to P stress. Meanwhile, the up-regulation of DSP toxins may be a compensatory competitive strategy of P. lima subject to P stress, which can be used as a deterrent to predators feeding on planktonic algae. Over all, our results indicate that P. lima has evolved diverse adaptive strategies to acclimatize to low P environments and storage of carbon sources. Our study provides a novel insight into the unique transcriptomic response of P. lima under P deprivation. We believe that our study would make a significant contribution for the researchers who study the mechanism of harmful algal bloom formation and regulation of toxin biosynthesis, as well as environmental monitoring.

Supplementary Materials

The following supporting information can be downloaded at: https://www.mdpi.com/article/10.3390/microorganisms11092216/s1, Figure S1: Differential expression analysis using Gene Ontology (GO) clustering in P. lima under different P conditions; Table S1: Descriptions of the differentially expressed genes in P. lima under different P conditions with function annotations from KEGG, NR, Swiss-Prot, Tremble, KOG, GO, and Pfam database. Table S2: RT-qPCR validations of differentially expressed genes in in P. lima under 1/16 P-limited conditions.

Author Contributions

Conceptualization, X.W. and H.J.; methodology, X.W. and G.Y.; software, G.Y. and K.W.; validation, Y.L. and F.W.; formal analysis, K.W. and Y.L.; investigation, X.W. and F.W.; data curation, X.W. and G.Y.; writing—original draft preparation, X.W.; writing—review and editing, H.J.; visualization, K.W.; supervision, H.J.; project administration, H.J. All authors have read and agreed to the published version of the manuscript.

Funding

This research received no external funding.

Data Availability Statement

All the raw sequencing reads were deposited in the Sequence Read Archive under Bio Projects PRJNA966759.

Conflicts of Interest

The authors declare no conflict of interest.

References

  1. Morse, D.; Tse, S.P.K.; Lo, S.C.L. Exploring dinoflagellate biology with high-throughput proteomics. Harmful Algae 2018, 75, 16–26. [Google Scholar] [CrossRef]
  2. Wan, X.; Yao, G.; Wang, K.; Bao, S.; Han, P.; Wang, F.; Song, T.; Jiang, H. Transcriptomic analysis of polyketide synthesis in dinoflagellate, Prorocentrum lima. Harmful Algae 2023, 123, 102391. [Google Scholar] [CrossRef]
  3. Gong, W.; Browne, J.; Hall, N.; Schruth, D.; Paerl, H.; Marchetti, A. Molecular insights into a dinoflagellate bloom. ISME J. 2017, 11, 439–452. [Google Scholar] [CrossRef]
  4. Zhang, S.F.; Yuan, C.J.; Chen, Y.; Lin, L.; Wang, D.Z. Transcriptomic response to changing ambient phosphorus in the marine dinoflagellate Prorocentrum donghaiense. Sci. Total Environ. 2019, 692, 1037–1047. [Google Scholar] [CrossRef]
  5. Bravo, I.; Fern’andez, M.L.; Ramilo, I.; Martınez, A. Toxin composition of the toxic dinoflagellate Prorocentrum lima isolated from different locations along the Galician coast (NW Spain). Toxicon 2001, 39, 1537–1545. [Google Scholar] [CrossRef]
  6. Nascimento, S.M.; Purdie, D.A.; Morris, S. Morphology, toxin composition and pigment content of Prorocentrum lima strains isolated from a coastal lagoon in southern UK. Toxicon 2005, 45, 633–649. [Google Scholar] [CrossRef]
  7. Oyeku, O.G.; Mandal, S.K. Taxonomy and okadaic acid production of a strain of Prorocentrum lima (Dinophyceae) isolated from the Bay of Bengal, North Indian Ocean. Toxicon 2021, 196, 32–43. [Google Scholar] [CrossRef]
  8. Koike, K.; Sato, S.; Yamaji, M.; Nagahama, Y.; Kotaki, Y.; Ogata, T.; Kodama, M. Occurrence of okadaic acid-producing Prorocentrum lima on the Sanriku coast, northern Japan. Toxicon 1998, 36, 2039–2042. [Google Scholar] [CrossRef]
  9. Zhang, H.; Li, Y.; Cen, J.; Wang, H.; Cui, L.; Dong, Y.; Lu, S. Morphotypes of Prorocentrum lima (Dinophyceae) from Hainan Island, South China Sea: Morphological and molecular characterization. Phycologia 2015, 54, 503–516. [Google Scholar] [CrossRef]
  10. Lawrence, J.E.; Cembella, A.D.; Ross, N.W.; Wright, J.L. Cross-reactivity of an anti-okadaic acid antibody to dinophysistoxin-4 (DTX-4), dinophysistoxin-5 (DTX-5), and an okadaic acid diol ester. Toxicon 1998, 36, 1193–1196. [Google Scholar] [CrossRef]
  11. Gayoso, A.N.; Dover, S.; Morton, S.; Busman, M.; Moeller, P.; Fulco, V.K.; Maranda, L. Diarrhetic shellfish poisoning associated with Prorocentrum lima (dinophyceae) in Patagonian Gulfs (Argentina). J. Shellfish Res. 2002, 21, 461–463. [Google Scholar]
  12. Ingarao, C.; Lanciani, G.; Verri, C.; Pagliani, T. First record of Prorocentrum lima (Dinophyceae) inside harbor areas and along the Abruzzo region coast, W Adriatic. Mar. Pollut. Bull. 2009, 58, 596–600. [Google Scholar] [CrossRef] [PubMed]
  13. Turkoglu, M. First harmful algal bloom record of tycoplanktonic dinoflagellate Prorocentrum lima (Ehrenberg) F. Stein, 1878 in the Dardanelles (Turkish Straits System, Turkey). J. Coast. Life Med. 2016, 4, 765–774. [Google Scholar]
  14. D’Agostino, V.C.; Krock, B.; Degrati, M.; Sastre, V.; Santinelli, N.; Krohn, T.; Hoffmeyer, M.S. Occurrence of toxigenic microalgal species and phycotoxin accumulation in mesozooplankton in Northern Patagonian Gulfs, Argentina. Environ. Toxicol. Chem. 2019, 38, 2209–2223. [Google Scholar] [CrossRef]
  15. Gobler, C.J.; Doherty, O.M.; Hattenrath-Lehmann, T.K.; Griffith, A.W.; Kang, Y.; Litaker, R.W. Ocean warming since 1982 has expanded the niche of toxic algal blooms in the North Atlantic and North Pacific oceans. Proc. Natl. Acad. Sci. USA 2017, 114, 4975–4980. [Google Scholar] [CrossRef] [PubMed]
  16. Xiao, W.; Liu, X.; Irwin, A.J.; Laws, E.A.; Wang, L.; Chen, B.; Zeng, Y.; Huang, B. Warming and eutrophication combine to restructure diatoms and dinoflagellates. Water Res. 2018, 128, 206–216. [Google Scholar] [CrossRef]
  17. Varkitzi, I.; Pagou, K.; Graneli, E.; Hatzianestis, I.; Pyrgaki, C.; Pavlidou, A.; Montesanto, B.; Economou-Amilli, A. Unbalanced N: P ratios and nutrient stress controlling growth and toxin production of the harmful dinoflagellate Prorocentrum lima (Ehrenberg) Dodge. Harmful Algae 2010, 9, 304–311. [Google Scholar] [CrossRef]
  18. Lai, J.; Yu, Z.; Song, X.; Cao, X.; Han, X. Responses of the growth and biochemical composition of Prorocentrum donghaiense to different nitrogen and phosphorus concentrations. J. Exp. Mar. Biol. Ecol. 2011, 405, 6–17. [Google Scholar] [CrossRef]
  19. Hou, D.Y.; Mao, X.T.; Gu, S.; Li, H.Y.; Liu, J.S.; Yang, W.D. Systems-level analysis of metabolic mechanism following nitrogen limitation in benthic dinoflagellate Prorocentrum lima. Algal Res. 2018, 33, 389–398. [Google Scholar] [CrossRef]
  20. Cui, G.; Liew, Y.J.; Konciute, M.K.; Zhan, Y.; Hung, S.H.; Thistle, J.; Gastoldi, L.; Schmidt-Roach, S.; Dekker, J.; Aranda, M. Nutritional control regulates symbiont proliferation and life history in coral-dinoflagellate symbiosis. BMC Biol. 2022, 20, 103. [Google Scholar] [CrossRef]
  21. Vanucci, S.; Guerrini, F.; Milandri, A.; Pistocchi, R. Effects of different levels of N and P-deficiency on cell yield, okadaic acid, DTX-1, protein and carbohydrate dynamics in the benthic dinoflagellate Prorocentrum lima. Harmful Algae 2010, 9, 590–599. [Google Scholar] [CrossRef]
  22. Hou, D.Y.; Liang, J.J.; Zou, C.; Li, H.Y.; Liu, J.S.; Yang, W.D. MRP functional activity and character in the dinoflagellate Prorocentrum lima. J. Appl. Phycol. 2016, 28, 1667–1676. [Google Scholar] [CrossRef]
  23. Wang, D.Z.; Zhang, H.; Zhang, Y.; Zhang, S.F. Marine dinoflagellate proteomics: Current status and future perspectives. J. Proteom. 2014, 105, 121–132. [Google Scholar] [CrossRef] [PubMed]
  24. Dyhrman, S.T. Nutrients and their acquisition: Phosphorus physiology in microalgae. Physiol. Microalgae 2016, 22, 155–183. [Google Scholar]
  25. Lin, S.; Litaker, R.W.; Sunda, W.G. Phosphorus physiological ecology and molecular mechanisms in marine phytoplankton. J Phycol. 2016, 52, 10–36. [Google Scholar] [CrossRef] [PubMed]
  26. Zhang, C.; Chen, G.; Wang, Y.; Guo, C.; Zhou, J. Physiological and molecular responses of Prorocentrum donghaiense to dissolved inorganic phosphorus limitation. Mar. Pollut. Bull. 2018, 129, 562–572. [Google Scholar] [CrossRef]
  27. Zhang, S.F.; Yuan, C.J.; Chen, Y.; Chen, X.H.; Li, D.X.; Liu, J.L.; Lin, L.; Wang, D.Z. Comparative transcriptomic analysis reveals novel insights into the adaptive response of Skeletonema costatum to changing ambient phosphorus. Front. Microbiol. 2016, 7, 1476. [Google Scholar] [CrossRef]
  28. Luo, H.; Lin, X.; Li, L.; Zhang, C.; Lin, S. Transcriptomic and physiological analyses of the dinoflagellate Karenia mikimotoi reveal non-alkaline phosphatase-based molecular machinery of ATP utilisation. Environ. Microbiol. 2017, 19, 4506–4518. [Google Scholar] [CrossRef]
  29. Dyhrman, S.T.; Jenkins, B.D.; Rynearson, T.A.; Saito, M.A.; Mercier, M.L.; Alexander, H.; Whitney, L.P.; Drzewianowski, A.; Bulygin, V.V.; Bertrand, E.M.; et al. The transcriptome and proteome of the diatom Thalassiosira pseudonana reveal a diverse phosphorus stress response. PLoS ONE 2012, 7, e33768. [Google Scholar] [CrossRef]
  30. Orchard, E.D.; Benitez-Nelson, C.R.; Pellechia, P.J.; Lomas, M.W.; Dyhrman, S.T. Polyphosphate in Trichodesmium from the low-phosphorus Sargasso Sea. Limnol. Oceanogr. 2010, 55, 2161–2169. [Google Scholar] [CrossRef]
  31. Diaz, J.; Ingall, E.; Benitez-Nelson, C.; Paterson, D.; de Jonge, M.D.; McNulty, I.; Brandes, J.A. Marine polyphosphate: A key player in geologic phosphorus sequestration. Science 2008, 320, 652–655. [Google Scholar] [CrossRef] [PubMed]
  32. Shi, X.; Lin, X.; Li, L.; Li, M.; Palenik, B.; Lin, S. Transcriptomic and microRNAomic profiling reveals multi-faceted mechanisms to cope with phosphate stress in a dinoflagellate. ISME J. 2017, 11, 2209–2218. [Google Scholar] [PubMed]
  33. Jauzein, C.; Labry, C.; Youenou, A.; Quéré, J.; Delmas, D.; Collos, Y. Growth and phosphorus uptake by the toxic dinoflagellate Alexandrium catenella (dinophyceae) in response to phosphate limitation. J. Phycol. 2010, 46, 926–936. [Google Scholar] [CrossRef]
  34. Martin, P.; Van Mooy, B.A.S.; Heithoff, A.; Dyhrman, S.T. Phosphorus supply drives rapid turnover of membrane phospholipids in the diatom Thalassiosira pseudonana. ISME J. 2011, 5, 1057–1060. [Google Scholar] [CrossRef]
  35. Van Mooy, B.A.; Fredricks, H.F.; Pedler, B.E.; Dyhrman, S.T.; Karl, D.M.; Koblízek, M.; Lomas, M.W.; Mincer, T.J.; Moore, L.R.; Moutin, T.; et al. Phytoplankton in the ocean use non-phosphorus lipids in response to phosphorus scarcity. Nature 2009, 458, 69–72. [Google Scholar] [CrossRef] [PubMed]
  36. Zhang, S.F.; Chen, Y.; Xie, Z.X.; Zhang, H.; Lin, L.; Wang, D.Z. Unraveling the molecular mechanism of the response to changing ambient phosphorus in the dinoflagellate Alexandrium catenella with quantitative proteomics. J. Proteom. 2019, 196, 141–149. [Google Scholar] [CrossRef] [PubMed]
  37. Ding, N.; Huertas, R.; Torres-Jerez, I.; Liu, W.; Watson, B.; Scheible, W.R.; Udvardi, M. Transcriptional, metabolic, physiological and developmental responses of switchgrass to phosphorus limitation. Plant Cell Environ. 2021, 44, 186–202. [Google Scholar] [CrossRef]
  38. Chen, Z.; Song, J.; Li, X.; Arango, J.; Cardoso, J.A.; Rao, I.; Schultze-Kraft, R.; Peters, M.; Mo, X.; Liu, G. Physiological responses and transcriptomic changes reveal the mechanisms underlying adaptation of Stylosanthes guianensis to phosphorus deficiency. BMC Plant Biol. 2021, 21, 466. [Google Scholar] [CrossRef]
  39. Wu, Q.; Yang, L.; Liang, H.; Yin, L.; Chen, D.; Shen, P. Integrated analyses reveal the response of peanut to phosphorus deficiency on phenotype, transcriptome and metabolome. BMC Plant Biol. 2022, 22, 524. [Google Scholar] [CrossRef]
  40. Nagahama, Y.; Murray, S.; Tomaru, A.; Fukuyo, Y. Species boundaries in the toxic dinoflagellate Prorocentrum lima (Dinophyceae, Prorocentrales), based on morphological and phylogenetic characters. J. Phycol. 2011, 47, 178–189. [Google Scholar] [CrossRef]
  41. Ben-Gharbia, H.; Yahia, O.K.; Amzil, Z.; Chom’erat, N.; Abadie, E.; Masseret, E.; Sibat, M.; Zmerli Triki, H.; Nouri, H.; Laabir, M. Toxicity and growth assessments of three thermophilic benthic dinoflagellates (Ostreopsis cf. ovata, Prorocentrum lima and Coolia monotis) developing in the southern mediterranean basin. Toxins 2016, 8, 297. [Google Scholar] [CrossRef]
  42. Cembella, A.D.; Dur’an-Riveroll, L.M.; Tarazona-Janampa, U.I.; Okolodkov, Y.B.; García-Sandoval, R.; Krock, B.; Hörstmann, C.; John, U. Phylogeography and diversity among populations of the toxigenic benthic dinoflagellate Prorocentrum from coastal reef systems in Mexico. Front. Mar. Sci. 2021, 8, 716669. [Google Scholar] [CrossRef]
  43. From, N.; Richardson, K.; Mousing, E.A.; Jensen, P.E. Removing the light history signal from normalized variable fluorescence (Fv/Fm) measurements on marine phytoplankton. Limnol. Oceanogr. Meth. 2014, 12, 776–783. [Google Scholar] [CrossRef]
  44. Gajic, G.; Mitrovic, M.; Pavlovic, P.; Stevanovic, B.; Djurdjevic, L.; Kostic, O. An assessment of the tolerance of Ligustrum ovalifolium Hassk. to traffic-generated Pb using physiological and biochemical markers. Ecotox. Environ. Saf. 2009, 72, 1090–1101. [Google Scholar] [CrossRef]
  45. Roberts, K.; Granum, E.; Leegood, R.C.; Raven, J.A. Carbon acquisition by diatoms. Photosynth. Res. 2007, 93, 79–88. [Google Scholar]
  46. Moseley, J.L.; Chang, C.W.; Grossman, A.R. Genome-based approaches to understanding phosphorus deprivation responses and PSR1 control in Chlamydomonas reinhardtii. Eukaryot. Cell 2006, 5, 26–44. [Google Scholar] [CrossRef] [PubMed]
  47. Mo, X.; Liu, G.; Zhang, Z.; Lu, X.; Liang, C.; Tian, J. Mechanisms Underlying Soybean Response to Phosphorus Deficiency through Integration of Omics Analysis. Int. J. Mol. Sci. 2022, 23, 4592. [Google Scholar] [CrossRef]
  48. Jonsson, C.M.; Paraiba, L.C.; Aoyama, H. Metals and linear alkylbenzene sulphonate as inhibitors of the algae Pseudokirchneriella subcapitata acid phosphatase activity. Ecotoxicology 2009, 18, 610–619. [Google Scholar] [CrossRef]
  49. Zhang, S.; Liu, J.; Shi, L.; Wang, Q.; Zhang, P.; Wang, H.; Liu, J.; Li, H.; Li, L.; Li, X.; et al. Identification of core genes associated with different phosphorus levels in quinoa seedlings by weighted gene co-expression network analysis. BMC Genom. 2023, 24, 399. [Google Scholar] [CrossRef]
  50. Deng, S.; Li, J.; Du, Z.; Wu, Z.; Yang, J.; Cai, H.; Wu, G.; Xu, F.; Huang, Y.; Wang, S.; et al. Rice ACID PHOSPHATASE 1 regulates Pi stress adaptation by maintaining intracellular Pi homeostasis. Plant Cell Environ. 2022, 45, 191–205. [Google Scholar] [CrossRef]
  51. Zhang, D.; Zhang, H.; Chu, S.; Li, H.; Chi, Y.; Triebwasser-Freese, D.; Lv, H.; Yu, D. Integrating QTL mapping and transcriptomics identifies candidate genes underlying QTLs associated with soybean tolerance to low-phosphorus stress. Plant Mol. Biol. 2017, 93, 137–150. [Google Scholar] [CrossRef] [PubMed]
  52. Richmond, G.S.; Smith, T.K. Phospholipases A1. Int. J. Mol. Sci. 2011, 12, 588–612. [Google Scholar] [CrossRef] [PubMed]
  53. Zhao, J. Phospholipase D and phosphatidic acid in plant defence response: From protein-protein and lipid-protein interactions to hormone signalling. J. Exp. Bot. 2015, 66, 1721–1736. [Google Scholar] [CrossRef] [PubMed]
  54. Pleskot, R.; Li, J.; Žárský, V.; Potocký, M.; Staiger, C.J. Regulation of cytoskeletal dynamics by phospholipase D and phosphatidic acid. Trends Plant Sci. 2013, 18, 496–504. [Google Scholar] [CrossRef]
  55. Frohman, M.A. The phospholipase D super family as therapeutic targets. Trends Pharmacol. Sci. 2015, 36, 137–144. [Google Scholar] [CrossRef] [PubMed]
  56. Collinet, C.; Stöter, M.; Bradshaw, C.R.; Samusik, N.; Rink, J.C.; Kenski, D.; Habermann, B.; Buchholz, F.; Henschel, R.; Mueller, M.S.; et al. Systems survey of endocytosis by multiparametric image analysis. Nature 2010, 464, 243–249. [Google Scholar] [CrossRef] [PubMed]
  57. Fan, L.; Li, R.; Pan, J.; Ding, Z.; Lin, J. Endocytosis and its regulation in plants. Trends Plant Sci. 2015, 20, 388–397. [Google Scholar] [CrossRef] [PubMed]
  58. Naramoto, S.; Kleine-Vehn, J.; Robert, S.; Fujimoto, M.; Dainobu, T.; Paciorek, T.; Ueda, T.; Nakano, A.; Van Montagu, M.C.; Fukuda, H.; et al. ADP-ribosylation factor machinery mediates endocytosis in plant cells. Proc. Natl. Acad. Sci. USA 2010, 107, 21890–21895. [Google Scholar] [CrossRef] [PubMed]
  59. Yue, J.X.; Kozmikova, I.; Ono, H.; Nossa, C.W.; Kozmik, Z.; Putnam, N.H.; Yu, J.K.; Holland, L.Z. Conserved noncoding elements in the most distant genera of cephalochordates: The goldilocks principle. Genome Biol. Evol. 2016, 8, 2387–2405. [Google Scholar] [CrossRef]
  60. Urwin, H.; Ghazi-Noori, S.; Collinge, J.; Isaacs, A. The role of CHMP2B in frontotemporal dementia. Biochem. Soc. Trans. 2009, 37, 208–212. [Google Scholar] [CrossRef]
  61. Hu, Q.; Sommerfeld, M.; Jarvis, E.; Ghirardi, M.; Posewitz, M.; Seibert, M.; Darzins, A. Microalgal triacylglycerols as feedstocks for biofuel production: Perspectives and advances. Plant J. 2008, 54, 621–639. [Google Scholar] [CrossRef]
  62. Xin, L.; Hu, H.Y.; Ke, G.; Sun, Y.X. Effects of different nitrogen and phosphorus concentrations on the growth, nutrient uptake, and lipid accumulation of a freshwater microalga Scenedesmus sp. Bioresour. Technol. 2010, 101, 5494–5500. [Google Scholar] [CrossRef] [PubMed]
  63. Zhang, Y.M.; Chen, H.; He, C.L.; Wang, Q. Nitrogen starvation induced oxidative stress in an oil-producing green alga Chlorella sorokiniana C3. PLoS ONE 2013, 8, e69225. [Google Scholar] [CrossRef] [PubMed]
  64. Reitan, K.I.; Rainuzzo, J.R.; Olsen, Y. Effect of nutrient limitation on fatty acid and lipid content of marine microalgae. J. Phycol. 1994, 30, 972–979. [Google Scholar] [CrossRef]
  65. Lacour, T.; Sciandra, A.; Talec, A.; Mayzaud, P.; Bernard, O. Neutral lipid and carbohydrate productivities as a response to nitrogen status in Isochrysis sp. (T-ISO.; Haptophyceae): Starvation versus limitation. J. Phycol. 2012, 48, 647–656. [Google Scholar] [CrossRef]
  66. Li, Y.; Horsman, M.; Wang, B.; Wu, N.; Lan, C.Q. Effects of nitrogen sources on cell growth and lipid accumulation of green alga Neochloris oleoabundans. Appl. Microbiol. Biot. 2008, 81, 629–636. [Google Scholar] [CrossRef] [PubMed]
  67. Feng, P.; Deng, Z.; Fan, L.; Hu, Z. Lipid accumulation and growth characteristics of Chlorella zofingiensis under different nitrate and phosphate concentrations. J. Biosci. Bioeng. 2012, 114, 405–410. [Google Scholar] [CrossRef]
  68. Khozin-Goldberg, I.; Cohen, Z. The effect of phosphate starvation on the lipid and fatty acid composition of the fresh water eustigmatophyte Monodus subterraneus. Phytochemistry 2006, 67, 696–701. [Google Scholar] [CrossRef]
  69. Yao, C.H.; Ai, J.N.; Cao, X.P.; Xue, S. Characterization of cell growth and starch production in the marine green microalga Tetraselmis subcordiformis under extracellular phosphorus-deprived and sequentially phosphorus-replete conditions. Appl. Microbiol. Biot. 2013, 97, 6099–6110. [Google Scholar] [CrossRef]
  70. Jiang, Q.; Zhao, L.; Dai, J.; Wu, Q. Analysis of autophagy genes in microalgae: Chlorella as a potential model to study mechanism of autophagy. PLoS ONE 2012, 7, e41826. [Google Scholar] [CrossRef]
  71. McLachlan, J.L.; Marr, J.C.; Conlon-Keily, A.; Adamson, A. Effects of nitrogen concentration and cold temperature on DSP-toxin concentrations in the dinoflagellate Prorocentrum lima (Prorocentrales, Dinophyceae). Nat. Toxins 1994, 2, 263–270. [Google Scholar] [CrossRef]
  72. Wang, S.; Chen, J.; Li, Z.; Wang, Y.; Fu, B.; Han, X.; Zheng, L. Cultivation of the benthic microalga Prorocentrum lima for the production of diarrhetic shellfish poisoning toxins in a vertical flat photobioreactor. Bioresour. Technol. 2015, 179, 243–248. [Google Scholar] [CrossRef]
  73. Lee, T.C.; Fong, F.L.; Ho, K.C.; Lee, F.W. The mechanism of diarrhetic shellfish poisoning toxin production in Prorocentrum spp.: Physiological and molecular perspectives. Toxins 2016, 8, 272. [Google Scholar] [CrossRef]
  74. Aquino-Cruz, A.; Purdie, D.A.; Morris, S. Effect of increasing sea water temperature on the growth and toxin production of the benthic dinoflagellate Prorocentrum lima. Hydrobiologia 2018, 813, 103–122. [Google Scholar] [CrossRef]
  75. Hashimoto, K.; Uchida, H.; Nishimura, T.; Oikawa, H.; Funaki, H.; Honma, C.; Yamaguchi, H.; Suzuki, T.; Adachi, M. Determination of optimal culture conditions for toxin production by a Prorocentrum lima complex strain with high diarrhetic shellfish toxins yield. Harmful Algae 2021, 103, 102025. [Google Scholar] [CrossRef] [PubMed]
  76. Stukkens, Y.; Bultreys, A.; Grec, S.; Trombik, T.; Vanham, D.; Boutry, M. NpPDR1, a pleiotropic drug resistance-type ATP-binding cassette transporter from Nicotiana plumbaginifolia, plays a major role in plant pathogen defense. Plant Physiol. 2005, 139, 341–352. [Google Scholar] [CrossRef] [PubMed]
Figure 1. Physiological responses of Prorocentrum lima to P limitation. (A) Cell concentration; (B) cell growth rate; (C) extracellular P concentration; (D) cellular P concentration; (E) alkaline phosphatase activity (APA); (F) instantaneous chlorophyll fluorescence (Ft); (G) photochemical efficiency of photosystem II (Fv/Fm). Cells were cultured in three replicates for each treatment and samples collected every three days for enumeration.
Microorganisms 11 02216 g001
Figure 2. Differential expression analysis in P. lima under different levels of P-limitation and a P-replete control. (A) Differential gene volcano map between 1/4 P-limited and P-replete conditions. (B) Differential gene volcano map between 1/16 P-limited and P-replete conditions. The horizontal axis represents the multiple changes in gene expression, while the vertical axis represents the significance level of differential genes (log2 fold change). The red dots represent up-regulated genes, the green dots represent down-regulated genes, and the blue dots represent insignificantly altered genes. (C) KEGG classification between 1/4 P-limited and P-replete conditions. (D) KEGG classification between 1/16 P-limited and P-replete conditions. The horizontal axis represents the proportion of the number of differentially expressed genes annotated to this pathway to the number of differentially expressed genes annotated, while the vertical axis represents the name of the KEGG pathway.
Microorganisms 11 02216 g002
Figure 3. Light microscopy (LM) and confocal microscopy (CLSM) images of P. lima cells in P-limited conditions and a control. Representative confocal microscope images of P. lima cells showing oil bodies with green fluorescence are displayed.
Microorganisms 11 02216 g003
Figure 4. Lipid (A) and starch (B) content in P. lima cells under two P-limitation treatments and a control. (mean ± SD, n = 3). Differences between the treatment groups are indicated by *** (p < 0.001) or ns (non-significant difference).
Microorganisms 11 02216 g004
Figure 5. DSP toxin content of OA (A) and DTX1 (B) in P. lima cells under P-replete and P-limited conditions. (Mean ± SD, n = 3). Significant difference between the treatment groups is indicated by * (p < 0.05), ** (p < 0.01).
Microorganisms 11 02216 g005
Figure 6. Phosphorus utilization strategies and proposed general transcriptional changes in P. lima under P deficiency conditions. Changes in the transcript of abundance of associated genes are indicated with different colors where red means up-regulation and green means down-regulation. DIP: dissolved inorganic phosphorus; PiT: inorganic phosphate transporter; RPP: ribulose-1.5-bisphosphate; TCA: tricarboxylic acid cycle. The other genes with abbreviations can be seen in the Table 2).
Microorganisms 11 02216 g006
Table 1. Transcriptome assembly statistics and annotations of P. lima gene catalogue.
SampleRaw
Reads
Clean ReadsGC
Content (%)
Q20
Percentage (%)
Number of UnigenesBLASTx Analysis Percentage (%)
KEGGNRSwiss-ProtTrEMBLKOGGOPfam
1P110,831,08981,618,51658.8697.4888,18615.6322.4611.7345.9115.0235.4243.44
1/4P110,497,38083,366,47958.8797.5790,70617.9724.6114.1947.4217.3837.2145.00
1/16P115,006,74990,073,94658.5497.7191,89019.0325.5815.3048.0918.4538.0245.72
Average
Data
112,111,73985,019,64758.7697.5990,26117.5424.2213.7447.1416.9536.8844.72
Table 2. Representative differentially expressed genes in P. lima under P-limited conditions.
Functional
Classification
Gene DescriptionUnigene IDlog2 (Fold Change)
(1/16P vs. 1P)
RibosomeRP-S20eSmall subunit ribosomal protein S20eCluster-1527.835473.92
RP-S11eSmall subunit ribosomal protein S11eCluster-1527.12983.56
RP-L34eLarge subunit ribosomal protein L34eCluster-1527.84763.77
RP-S5eSmall subunit ribosomal protein S5eCluster-1527.761353.65
RP-L10eLarge subunit ribosomal protein L10eCluster-5599.07.70
Stress–shock proteinsHsp 70Heat shock 70 kDa protein, mitochondrial-like Cluster-1527.82504.34
Hsp 90Heat shock protein 90Cluster-1527.772925.04
Hsp 83Heat shock protein 83 Cluster-1527.97574.57
HSPA1sHeat shock 70 kDa protein 1/2/6/8Cluster-1527.867464.97
Photosynthesis systemPsbAPhotosystem II P680 reaction center D1 proteinCluster-1527.39156−2.94
PsbCPhotosystem II CP43 chlorophyll apoproteinCluster-1527.45732−3.30
PsbBPhotosystem II CP47 chlorophyll apoproteinCluster-1527.50539−2.51
PsaAPhotosystem I P700 chlorophyll a apoprotein A1Cluster-1527.41047−2.44
PsaBPhotosystem I P700 chlorophyll a apoprotein A2Cluster-1527.52290−2.79
PetBCytochrome b6Cluster-1527.15944−3.60
PetDCytochrome b6-f complex subunit 4Cluster-1527.82828−3.59
PetFFerredoxinCluster-1527.21762−8.44
Carbon fixation PpdKPyruvate orthophosphate dikinaseCluster-1527.731471.25
RbcLRibulose bisphosphate carboxylaseCluster-1527.414371.95
GAPAGlyceraldehyde-3-phosphate dehydrogenaseCluster-1527.431642.54
TPITriosephosphate isomeraseCluster-1527.532191.05
PhagosomeRAB5ARas-related protein Rab-5ACluster-1527.165445.36
CALRCalreticulinCluster-5481.04.07
RAB7ARas-related protein Rab-7ACluster-1527.867894.29
SEC61AProtein transport protein SEC61 subunit alphaCluster-5772.03.57
RAC1Ras-related C3 botulinum toxin substrate 1Cluster-1527.767123.78
EndocytosisARF1/2ADP-ribosylation factor 1/2Cluster-1527.81574.11
SMAPStromal membrane-associated proteinCluster-1527.16594.74
HSPA1sHeat shock 70 kDa protein 1/2/6/8Cluster-1527.867464.97
RAB11ARas-related protein Rab-11ACluster-6525.04.52
CHMP4A/BCharged multivesicular body protein 4A/BCluster-9796.04.04
CHMP3Charged multivesicular body protein 3Cluster-6541.04.52
Glycolysis,
oxidative
phosphorylation
PKPyruvate kinaseCluster-1527.605800.91
PDPyruvate dehydrogenaseCluster-1527.621641.46
PGKPhosphoglycerate kinaseCluster-1527.83027 4.04
COX5BCytochrome c oxidase subunit 5bCluster-1527.4194.42
SDHASuccinate dehydrogenase (ubiquinone) Flavoprotein subunitCluster-1527.790114.92
ATP5BF-type H+-transporting ATPase subunit betaCluster-1527.109454.34
ABC
transporters
ABCA3ATP-binding cassette, subfamily A (ABC1), member 3Cluster-1527.712711.35
ABCB1ATP-binding cassette, subfamily B (MDR/TAP), member 1 Cluster-1527.634391.81
ABCC1ATP-binding cassette, subfamily C (CFTR/MRP), member 1Cluster-1527.107181.64
phosphate
transporters
MPTMitochondrial phosphate transporterCluster-1527.809533.72
TPTTriose-phosphate transporter familyCluster-1527.550831.41
Fatty acid
biosynthesis
ACACAAcetyl-CoA carboxylase/biotin carboxylase 1Cluster-1527.387002.00
MCATMalonyl coenzyme A-acyl carrier protein
transacylase
Cluster-1527.317661.16
FadDLong-chain acyl-CoA synthetaseCluster-4976.03.70
Ubiquitin-mediated
proteolysis
UBUbiquitin family proteinCluster-1527.112084.41
UBE2DUbiquitin-conjugating enzyme E2 DCluster-1527.860494.35
UBE2NUbiquitin-conjugating enzyme E2 NCluster-1527.93104.67
Disclaimer/Publisher’s Note: The statements, opinions and data contained in all publications are solely those of the individual author(s) and contributor(s) and not of MDPI and/or the editor(s). MDPI and/or the editor(s) disclaim responsibility for any injury to people or property resulting from any ideas, methods, instructions or products referred to in the content.

