
Paediatric Asthma and the Microbiome: A Systematic Review

 , , ,
, , ,
Abstract
1. Introduction
2. Materials and Methods
2.1. Eligibility Criteria
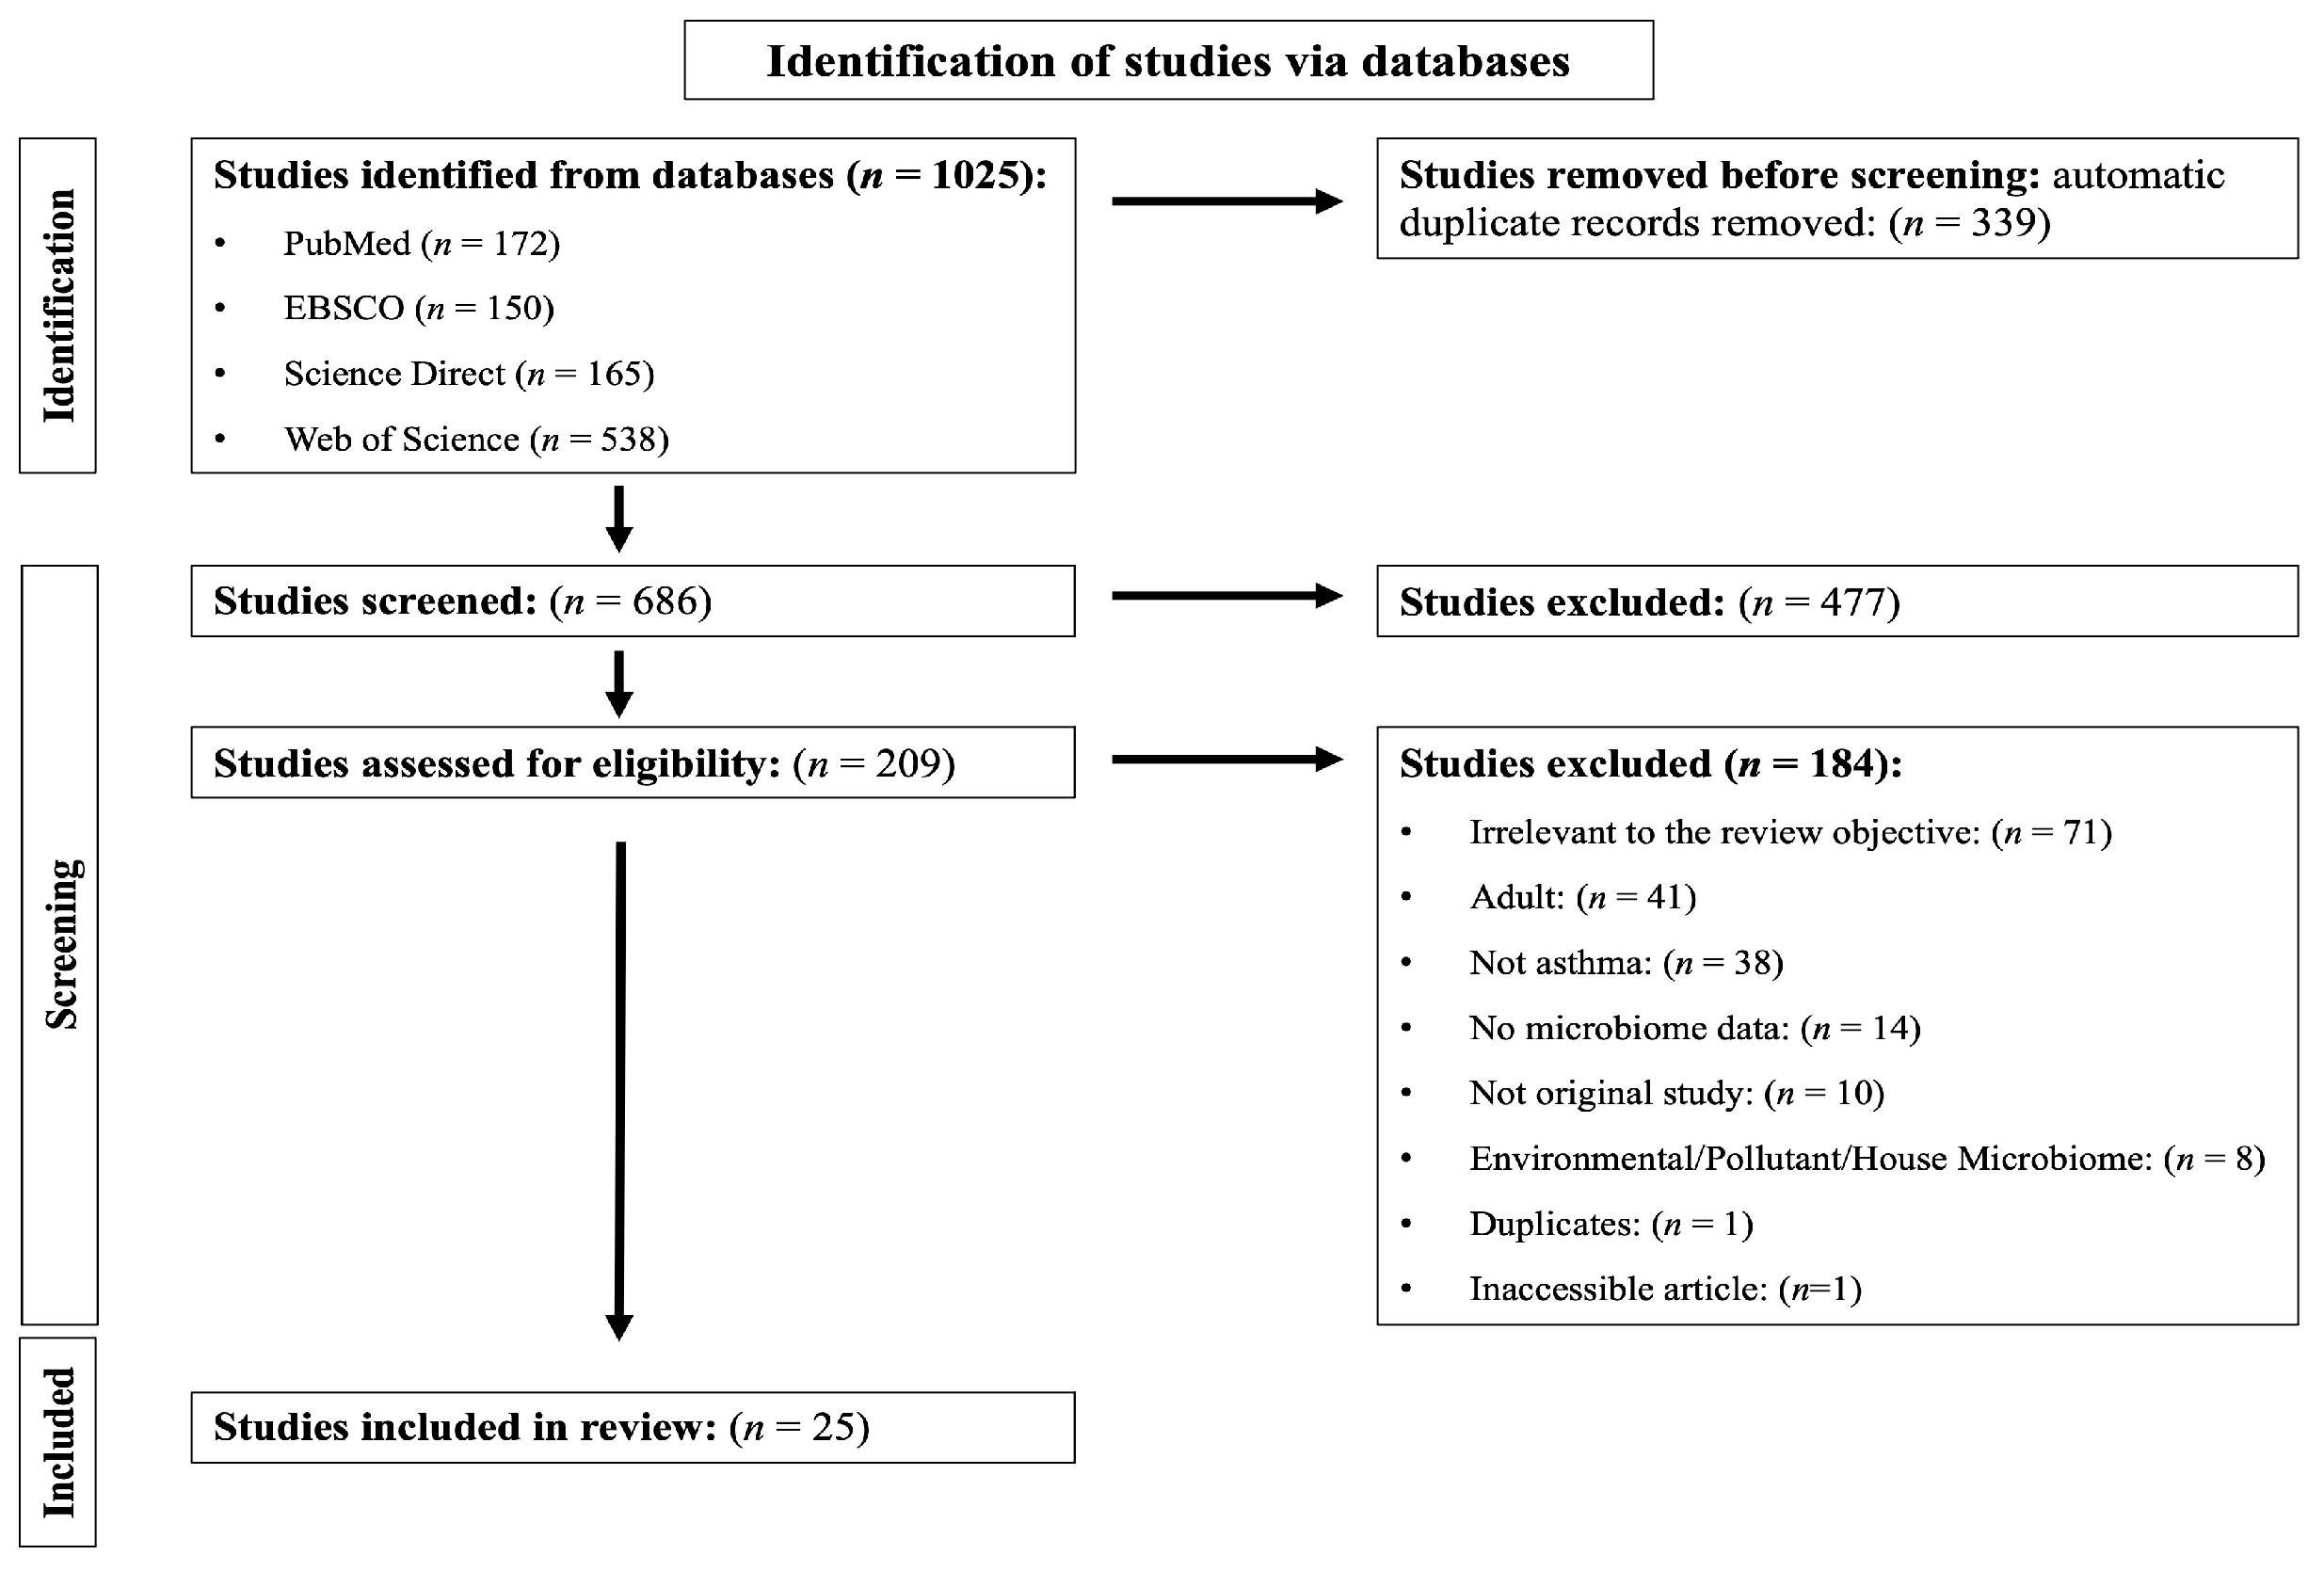
2.2. Information Sources and Search Strategy
2.3. Selection and Data-Collection Process
2.4. Data Items
2.5. Risk of Bias Assessment
2.6. Synthesis Methods
3. Results
3.1. Quality of the Included Studies
3.2. Characteristics of the Included Studies
3.2.1. Clinical Studies
3.2.2. Animal Intervention Studies

| Citation and Title of the Article | Country | Study Design | Sample Size | Age | Sample Collected | Time of Sample Collection | Microbiome Detection Method | Genomic DNA Extraction Method | Sequencing Platform | Microbiome Diversity Assessment | Bioinformatics Pipeline Used | Findings |
|---|---|---|---|---|---|---|---|---|---|---|---|---|
| Upper airway microbiome | ||||||||||||
| [29] ‘Longitudinal Changes in Early Nasal Microbiota and the Risk of Childhood Asthma’ | Finland | Cohort | 2-month visit: n = 704 13-month visit: n = 665 24-month visit: n = 570 | 2-month visit: 2.5 (2.4–2.7) 13-month visit: 13.5 (13.1–13.9) 24-month visit: 25.0 (24.6–25.5) | Nasal swabs | 3 time points: 2, 13 and 24 months | 16S rRNA gene sequencing (V4 region) | Automated MagNA Pure 96 System | Illumina MiSeq | α-diversity: Shannon index and β-diversity: Bray–Curtis | UPARSE OUT clustering | Insignificant difference in α-diversity as well as β-diversity between children who developed asthma by age 7 years and those who did not. ↑ Relative abundance of Haemophilus over age 2 to 13 months was associated significantly with higher risk of asthma. ↑ Relative abundance of Lactobacillus at age 2 months was associated significantly with lower risk of asthma. |
| [30] ‘Infant airway microbiota and topical immune perturbations in the origins of childhood asthma’ | Denmark | Cohort | 700 | The cohort was followed up from the age of 1 week until 6 years of life | Hypopharyngeal aspirates | Different time-points: Hypopharyngeal aspirates were obtained at ages 1 week, 1 month and 3 months | 16S rRNA gene sequencing (V4 region) | PowerMag Soil DNA Isolation Kit | Illumina MiSeq | α-diversity: Shannon index and β-diversity: Bray–Curtis and UniFrac, weighted | Mothur | At age 1 month: ↑ α-diversity and a difference in β-diversity in children who developed asthma in the first 6 years of life compared to those who did not. ↑ Relative abundance of Veillonella and Prevotella at age 1 month were associated significantly with asthma development by age 6 years. At ages 1 week and 3 months: Insignificant association between α- or β-diversity or any taxa and the development of asthma. |
| [33] ‘Pediatric asthma comprises different phenotypic clusters with unique nasal microbiotas’ | USA | Cross-section | 163 children and adolescents | Age for all participants years (SE): 11.0 (0.3) | Nasal washes | 205 nasal washes. 1 time point: 163 sample 2 time points: 42 samples (patients came back for an additional visit (5.5 to 6.5 months apart), and one additional sample was taken) | 16S rRNA gene sequencing (V4 region) | QIAGEN QIAamp DNA Kit | Illumina MiSeq | α-diversity: Shannon index, ACE indices, and Faith’s phylogenetic diversity index and β-diversity: UniFrac (unweighted and weighted), Bray-Curtis, and Jaccard distances | Mothur | Operational taxonomic units of pathogenic Moraxella, Staphylococcus, Streptococcus and Haemophilus were present in 95% of nasal microbiotas in asthmatics. |
| [31] ‘Nasopharyngeal Microbiome Diversity Changes over Time in Children with Asthma’ | USA | Cohort | 40 children and adolescents | 6–18 years; mean = 11 years | Nasopharyngeal washes | Two samples (5.5 to 6.5 months apart) | 16S rRNA gene sequencing (V4 region) | QIAGEN QIAamp DNA Kit | Illumina MiSeq | α-diversity: Good’s coverage, Chao1, Shannon indices, and Faith’s phylogenetic diversity index and β-diversity: UniFrac (unweighted and weighted) | Mothur | The nasopharyngeal core microbiome of asthmatics at the 95% level: Moraxella, Staphylococcus, Streptococcus, Haemophilus, Fusobacterium. 86% of the total reads in asthmatics were: Moraxella, Staphylococcus, Dolosigranulum, Corynebacterium, Prevotella, Streptococcus, Haemophilus, Fusobacterium and a Neisseriaceae. |
| [34] ‘Different functional genes of upper airway microbiome associated with natural course of childhood asthma’ | Korea | Cross-section | Healthy children (controls), n = 31 Children with asthma, n = 30 Children with asthma in remission, n = 30 | Years Healthy children (controls): 7.1 ± 1.1 Children with asthma: 8 ± 0.9 Children with asthma in remission: 7.6 ± 1.4 | Nasopharyngeal swabs | 1 time point | 16S rRNA gene sequencing (V1-V3 region) | PowerMag Microbiome RNA/DNA isolation kit (MP Biomedicals, Santa Ana, CA, USA) | Illumina TruSeq DNA | α-diversity: Shannon index and β-diversity: UniFrac (unweighted and weighted) | No mention | Control group: ↑ Relative abundance of Haemophilus and Moraxella. Asthma and remission groups: ↑ Relative abundance of Streptococcus, Dolosigranulum, and Corynebacterium. Asthma group: ↑ Relative abundance of Staphylococcus. |
| [26] ‘Bacterial salivary microbiome associates with asthma among African American children and young adults’ | USA | Case control | Asthma cases, n = 57 Healthy controls, n = 57 | Asthma case: 15.6 ± 3.3 Healthy controls: 15 ± 3.9 | Saliva | 1 time point | 16S rRNA gene sequencing (V4 region) | Oragene DNA Discover OGR-500 self-collection kits | Illumina MiSeq | α-diversity: Shannon index | QIIME | Significant difference in α-diversity between asthma cases and healthy controls. Asthma cases: ↓ Relative abundance of Streptococcus. ↑ Relative abundance of Veillonella. Healthy controls: ↑ Relative abundance of Streptococcus. ↓ Relative abundance of Veillonella. |
| [35] ‘Bacterial microbiota of the upper respiratory tract and childhood asthma’ | Europe | Cross-section | Throat swabs: Children with asthma, n = 125 Controls, n = 202 Nasal swabs: Children with asthma, n = 39 Controls, n = 29 | 6 to 12 years | Nasal and throat swabs | 1 time point | 16S rRNA gene sequencing (V3-V5 region) | QIAmp DNA Mini Kit | Pyrosequencing, Roche 454-GS FLX Titanium | α-diversity: Shannon index and β-diversity: Unweighted UniFrac distances | QIIME | Asthma was associated with alterations in nasal (not throat) microbiome. Asthmatic children versus controls: ↓ α- and β-diversity and lower abundance of Moraxella of nasal microbiome. |
| [36] ‘Integration of metagenomics-metabolomics reveals specific signatures and functions of airway microbiota in mite-sensitized childhood asthma’ | China | Cross-section | Control: n = 28 Asthma: n = 27 | Years Control: 4.54 ± 0.3 Asthma: 4.32 ± 0.85 | Throat swabs | 1 time point. Asthma case: swabs were collected before inhaled or nasal administration of corticosteroids for regular daily treatment. Control: no mention. | Shotgun metagenome sequencing | FastDNA SPIN Kit for Soil (MP Biomedical) | Illumina HiSeq | α-diversity: Shannon index and β-diversity: Bray–Curtis index | Metagenome assembly by MEGAHIT and contig binning by MetaBAT | No difference in α-diversity between asthma and control groups, but β-diversity difference was detected between the two groups. Asthma group: Predominance of Neisseria elongate. Control group: Significant enrichment of Eubacterium sulci, Leptotrichia wadei and Prevotella spp. |
| [37] ‘Integrated metabolic and microbial analysis reveals host-microbial interactions in IgE-mediated childhood asthma’ | Taiwan | Cross-section | Asthma (non-atopic, lowly sensitize): n = 15 Asthma (non-atopic, highly sensitize): n = 13 Healthy controls: n = 25 | Years Asthma (non-atopic, lowly sensitized): 3.7 ± 0.6 Asthma (non-atopic, highly sensitized): 3.5 ± 0.7 Healthy controls: 3.6 ± 0.7 | Throat swabs | 1 time point, no time specified | 16S rRNA gene sequencing (V3-V4 region) | FastDNA Spin Kit for Soil (MP Biomedical, Solon, OH, USA) | Illumina HiSeq 2500 | α-diversity: Shannon index and Chao1 index | QIIME | No statistically significant difference in airway taxa composition between asthma and healthy controls. Highly sensitized asthma children: ↓ Relative abundance of Dialister, Streptococcus, Prevotella, Tannerella, Atopobium and Ralstonia. |
| [38] ‘Comparison of Oropharyngeal Microbiota from Children with Asthma and Cystic Fibrosis’ | Germany | Cross-sectional | Control children: n = 62 Children with asthma: n = 27 Children with cystic fibrosis (CF): n = 57 | Years (min–max) Control: 10.1 (8–12) Asthma: 10 (8–12) CF: 10.61 (6–12) | Throat swabs | 1 time point | 16S rRNA gene sequencing (V4 region) | QIAamp Mini Kit | Illumina MiSeq system | α-diversity: Shannon index and Chao1 index and β-diversity: Morisita–Horn similarity index | Mothur | High level of similarity was detected between control, asthma and CF groups. Core microbiome in healthy controls, children with asthma and CF: Prevotella, Streptococcus, Neisseria, Veillonella and Haemophilus. |
| Lower airway microbiome | ||||||||||||
| [13] ‘Disordered microbial communities in asthmatic airways’ | Ireland | Cross-sectional | Difficult asthma, n = 13 Non-asthmatic controls, n = 7 | Asthmatic children: 11.8 ± 2.8 years Controls: 11.3 ± 5.7 years | Bronchoalveolar lavage (BAL) | 1 time point, time not specified | 16S rRNA gene sequencing (V3 region) and cloning | DNeasyn (Qiagen) | No mention | α-diversity: Chao1 index | DOTUR program | Asthmatic children: Significant increase in Proteobacteria Children with difficult asthma: ↑ Staphylococcus spp. Controls: ↑ Bacteroidetes (Prevotella spp.). |
| [46] ‘Altered respiratory microbiota composition and functionality associated with asthma early in life’ | United Arab Emirates | Case control | Paediatric asthmatic: n = 11 Paediatric healthy: n = 9 | Years, mean (SD, range) Paediatric asthmatic: 6.7 (4.1, 12) Paediatric healthy: 8 (3.1, 8) | Sputum | 1 time point: Spontaneous coughed up sputum (expectorated phlegm/mucous) was the first preference of sample collection whenever possible in all subjects. | 16S rRNA gene sequencing for bacteria (V4 region) ITS2-gene based microbial profiling for fungi | MoBio PowerMag Soil DNA Isolation | Illumina MiSeq | α-diversity: Shannon index and β-diversity: Bray-Curtis index | Mothur | Asthmatic versus non-asthmatic controls: Significant difference of bacteria and fungi between the two groups. Significant difference in Bacteroidetes, Firmicutes, Fusobacteria and Proteobacteria. Paediatric asthma: ↑ Relative abundance in Streptococcus spp. and Moraxella spp. Difference in Ascomycota, Basidiomycota phyla and other unclassified fungi. ↓ Penicillium aethiopicum and Alternaria spp. |
| [39] ‘Gram-negative microbiota is related to acute exacerbation in children with asthma’ | Korea | Cross-section | Total children, n = 95 Children with asthma exacerbation: n = 22 Children with stable asthma: n = 67 Controls: n = 6 | Years Asthma exacerbation: 9.0 (6.4/10.9) Stable asthma: 8.0 (6.6/9.7) Controls: 13.2 (10.7/14.9) | Sputum | 1 time point | 16S rRNA gene sequencing (V3-V4 region) | FastDNA SPIN Kit for Soil (MP Biomedicals, USA) | Illumina MiSeq | α-diversity: ACE, Chao1, Jackknife, NPShannon, Shannon and Simpson and β-diversity: Jensen–Shannon, Bray–Curtis, Generalised UniFrac, and UniFrac indices | No mention | No difference in α-diversity detected between asthma exacerbation and stable asthma children. Significant difference in β-diversity detected between asthma exacerbation and stable asthma children. Asthma exacerbation: Phylum level: ↑ Abundance of Proteobacteria. ↓ Abundance of Saccharibacteria and Actinobacteria. Genus level: ↑ Abundance of Veillonella, Neisseria, Haemophilus, Fusobacterium, Oribacterium, Campylobacter and Capnocytophaga ↓ Saccharimonas, Rothia, Porphyromonas, Gemella and Actinomyces. |
| Upper and lower airway microbiome | ||||||||||||
| [27] ‘Integrative study of the upper and lower airway microbiome and transcriptome in asthma’ | USA | Case control | Children with severe persistent asthma: n = 27 Healthy controls: n = 27 | Years Children with severe persistent asthma: 11, IQR 8 Healthy controls: 13, IQR 6 | Nasal swabs BAL | 1 time point | 16S rRNA gene sequencing (V3-V4 region) | Qiagen DNeasy Mini Kit | Illumina MiSeq | α-diversity: Shannon index and β-diversity: UniFrac distance index | QIIME | α-diversity was higher in bronchial (BAL) versus nasal. Significant difference in β-diversity detected between bronchial (BAL) and nasal. Asthmatic children Nasal microbiome: Moraxella and Alloiococcus are hub genera. Bronchial microbiome: no hubs. Nasal Streptococcus was enriched in children with persistent asthma versus healthy controls. |
| Upper airway and gut microbiome | ||||||||||||
| [42] ‘Altered IgA Response to Gut Bacteria Is Associated with Childhood Asthma in Peru’ | Peru | Case control | Asthma: n = 40 Control children: n = 40 | Years Asthma: 14.6 ± 1.5 Controls: 13.3 ± 2.3 | Nasal swabs and faecal specimens | 1 time point: Biospecimens samples (nasal swabs and faecal) were collected the same day of the home visit or during the same week | 16S rRNA gene sequencing (V4 region) | Faecal specimens ethanol-based method Nasal swabs: no information was provided | Illumina MiSeq | α-diversity: Shannon index and Renyi entropy and β-diversity: Bray–Curtis and UniFrac distances | DADA 2 | α-and β-diversity of faecal as well as nasal swabs showed no difference between asthma and controls. |
| Gut microbiome | ||||||||||||
| [32] ‘Reduced diversity of the intestinal microbiota during infancy is associated with increased risk of allergic disease at school age’ | Denmark | Cohort | 411 infants | Full-term infants born at >36 week and were followed until 6 years | Faecal specimens | 2 time points: At 1 month old and 12 months old | 16S rRNA gene and denaturing gradient gel electrophoresis (V3 region) | QIAamp DNA stool Mini Kit (Qiagen, Hilden, Germany) | None | Band richness and principal component analysis | BioNumerics software 4.50 | No association between bacterial diversity of the infant’s gut microbiota and asthma in the first 6 years of life. |
| [28] ‘Shifts in Lachnospira and Clostridium sp. in the 3-month stool microbiome are associated with preschool age asthma’ | Canada | Case control | Total 76. Asthmatic: n = 39 Healthy control: n = 37 | Follow up from birth till 4 years. | Faecal specimens | 2 time points: 3 months and 1 year of age | 16S rRNA gene sequencing (V3 region) | Mo Bio dry bead tubes (Mo Bio Laboratories) | Illumina Hi-Seq. 2000 | α-diversity: Shannon index and β-diversity | Mothur | At 3 months asthmatic children: ↓ Abundance of Lachnospira. ↑ Abundance of Clostridium neonatale. Negative association between the ratio of Lachnospira and Clostridium neonatale and asthma risk by 4 years of age. |
| [43] ‘Early infancy microbial and metabolic alterations affect risk of childhood asthma’ | Canada | Longitudinal nested case control | Control: n = 74 Atopy and wheeze: n = 22 Atopy only: n = 87 Wheeze only: n = 136 | Baseline: 1 year of age Follow-up: 3 years of age | Faecal specimens | 2 time points: at 3 months and 1 year | 16S rRNA gene sequencing (V3 region) | Qiagen DNA Stool Mini Kit | Illumina HiSeq 2000 | α-diversity: Shannon index | Mothur | No significant difference in α-diversity among four groups. Children at risk of asthma: ↓ Relative abundance of Lachnospira, Veillonella, Faecalibacterium and Rothia. |
| [44] ‘Gut microbial-derived butyrate is inversely associated with IgE responses to allergens in childhood asthma’ | Taiwan | Case control | Children with rhinitis: n = 27 Children with asthma: n = 34 Healthy controls, n = 24 | Years Controls: 5.7 ± 0.8 Rhinitis: 6.0 ± 0.9 Asthma: 5.6 ± 0.9 | Faecal specimens | 1 time point. Time not specified. | 16S rRNA gene sequencing (V3-V4 region) | FastDNA Spin Kit for Faeces (MP Biomedical) | Illumina HiSeq 2500 | α-diversity: species richness | QIIME | Children with rhinitis and asthma versus healthy controls: ↓ Relative abundance of Firmicutes. ↓ Relative abundance of Faecalibacterium, Roseburia, SMB53 and Dialister. ↑ Relative abundance of Escherichia, Enterococcus and Clostridium. |
| [40] ‘Gut microbial dysbiosis is associated with allergen-specific IgE responses in young children with airway allergies’ | Taiwan | Cross-section | Controls: n = 26 Asthma: n = 35 Rhinitis: n = 28 | Controls: 5.6 ± 0.8 Asthma: 5.5 ± 0.9 Rhinitis 5.9 ± 0.9 | Faecal specimens | 1 time point | 16S rRNA gene sequencing (V3-V4 region) | FastDNA Spin Kit for Faeces (MP Biomedical, Solon, OH, USA) | Illumina HiSeq 2500 | α-diversity: Shannon index and Chao 1 index and β-diversity: Bray–Curtis and Weighted UniFrac distance | QIIME | Relatively lower α-diversity in allergic disease than control (insignificant). No significant difference in β-diversity in allergic airway disease. Children with asthma and allergic rhinitis versus healthy controls: ↓ Relative abundance of Firmicutes. ↓ Relative abundance of Dorea spp. ↑ Relative abundance of Clostridium spp. |
| [45] ‘Neonatal gut microbiota associates with childhood multisensitized atopy and T cell differentiation’ | USA | Cohort | 1 month: n = 130 infants 6 months: n = 168 infants | 1 month and 6 month infants | Faecal specimens | 2 time points: 1 month and 6 months. | 16S rRNA gene sequencing (V4 region) (ITS)2 rRNA sequencing for fungi | In-house kit: Modified cetyltrimethylammonium bromide buffer-based protocol | Illumina MiSeq | α-diversity: Shannon index and β-diversity: Unweighted UniFrac distance and Bray–Curtis | QIIME | The highest risk group: ↓ Relative abundance of Bifidobacterium, Akkermansia and Faecalibacterium. ↑ Relative abundance of Candida and Rhodotorula. |
| [41] ‘Correlations of Inflammatory Factors with Intestinal Flora and Gastrointestinal Incommensurate Symptoms in Children with Asthma’ | China | Cross-section | Asthmatic group: n = 70 Control group: n = 25 | Years Asthmatic group: 9.03 ± 2.01 Control group: 8.12 ± 2.13 | Faecal specimens | 1 time point (exact time was not mentioned) | SYBR GREEN I fluorescence quantitative polymerase chain reaction | No mention | Not applicable | Total load of bacteria between observation group and control group | Not applicable | The total load of bacteria: asthmatic group > control group Asthmatic group: ↓ Load of Bifidobacterium and Lactobacillus. ↑ Load of Escherichia coli, Helicobacter pylori, Streptococcus and Staphylococcus. Control group: ↑ Load of Bifidobacterium and Lactobacillus. ↓ Load of Escherichia coli, Helicobacter pylori, Streptococcus and Staphylococcus. |
3.3. Microbiome Quantification
3.4. Diversity Assessments
3.5. Microbiome Outcome
3.5.1. Human Studies
3.5.2. Animal Intervention Studies
4. Discussion
5. Conclusions
Supplementary Materials
Author Contributions
Funding
Institutional Review Board Statement
Informed Consent Statement
Data Availability Statement
Conflicts of Interest
References
- Asher, M.I.; Rutter, C.E.; Bissell, K.; Chiang, C.-Y.; El Sony, A.; Ellwood, E.; Ellwood, P.; García-Marcos, L.; Marks, G.B.; Morales, E.; et al. Worldwide trends in the burden of asthma symptoms in school-aged children: Global Asthma Network Phase I cross-sectional study. Lancet 2021, 398, 1569–1580. [Google Scholar] [CrossRef] [PubMed]
- Mims, J.W. Asthma: Definitions and pathophysiology. Int. Forum Allergy Rhinol. 2015, 5, S2–S6. [Google Scholar] [CrossRef] [PubMed]
- Pijnenburg, M.W.; Fleming, L. Advances in understanding and reducing the burden of severe asthma in children. Lancet Respir. Med. 2020, 8, 1032–1044. [Google Scholar] [CrossRef] [PubMed]
- Barcik, W.; Boutin, R.C.T.; Sokolowska, M.; Finlay, B.B. The Role of Lung and Gut Microbiota in the Pathology of Asthma. Immunity 2020, 52, 241–255. [Google Scholar] [CrossRef]
- Manfredo Vieira, S.; Hiltensperger, M.; Kumar, V.; Zegarra-Ruiz, D.; Dehner, C.; Khan, N.; Costa, F.R.C.; Tiniakou, E.; Greiling, T.; Ruff, W.; et al. Translocation of a gut pathobiont drives autoimmunity in mice and humans. Science 2018, 359, 1156–1161. [Google Scholar] [CrossRef]
- Abrahamsson, T.; Jakobsson, H.E.; Andersson, A.; Björkstén, B.; Engstrand, L.; Jenmalm, M.C. Low gut microbiota diversity in early infancy precedes asthma at school age. Clin. Exp. Allergy 2014, 44, 842–850. [Google Scholar] [CrossRef]
- Van Nimwegen, F.A.; Penders, J.; Stobberingh, E.E.; Postma, D.S.; Koppelman, G.H.; Kerkhof, M.; Reijmerink, N.E.; Dompeling, E.; Brandt, P.A.V.D.; Ferreira, I.; et al. Mode and place of delivery, gastrointestinal microbiota, and their influence on asthma and atopy. J. Allergy Clin. Immunol. 2011, 128, 948–955.e3. [Google Scholar] [CrossRef]
- Doré, E.; Joly-Beauparlant, C.; Morozumi, S.; Mathieu, A.; Lévesque, T.; Allaeys, I.; Duchez, A.-C.; Cloutier, N.; Leclercq, M.; Bodein, A.; et al. The interaction of secreted phospholipase A2-IIA with the microbiota alters its lipidome and promotes inflammation. JCI Insight 2022, 7, e152638. [Google Scholar] [CrossRef]
- Hasan, N.; Yang, H. Factors affecting the composition of the gut microbiota, and its modulation. PeerJ 2019, 7, e7502. [Google Scholar] [CrossRef]
- Rinninella, E.; Raoul, P.; Cintoni, M.; Franceschi, F.; Miggiano, G.A.D.; Gasbarrini, A.; Mele, M.C. What Is the Healthy Gut Microbiota Composition? A Changing Ecosystem across Age, Environment, Diet, and Diseases. Microorganisms 2019, 7, 14. [Google Scholar] [CrossRef]
- Arumugam, M.; Raes, J.; Pelletier, E.; Le Paslier, D.; Yamada, T.; Mende, D.R.; Fernandes, G.R.; Tap, J.; Bruls, T.; Batto, J.M.; et al. Enterotypes of the human gut microbiome. Nature 2011, 473, 174–180. [Google Scholar] [CrossRef] [PubMed]
- Nash, A.K.; Auchtung, T.A.; Wong, M.C.; Smith, D.P.; Gesell, J.R.; Ross, M.C.; Stewart, C.J.; Metcalf, G.A.; Muzny, D.M.; Gibbs, R.A.; et al. The gut mycobiome of the Human Microbiome Project healthy cohort. Microbiome 2017, 5, 153. [Google Scholar] [CrossRef] [PubMed]
- Hilty, M.; Burke, C.; Pedro, H.; Cardenas, P.; Bush, A.; Bossley, C.; Davies, J.; Ervine, A.; Poulter, L.; Pachter, L.; et al. Disordered microbial communities in asthmatic airways. PLoS ONE 2010, 5, e8578. [Google Scholar] [CrossRef] [PubMed]
- Nguyen, L.D.N.; Viscogliosi, E.; Delhaes, L. The lung mycobiome: An emerging field of the human respiratory microbiome. Front. Microbiol. 2015, 6, 89. [Google Scholar] [CrossRef]
- Weaver, D.; Gago, S.; Bromley, M.; Bowyer, P. The Human Lung Mycobiome in Chronic Respiratory Disease: Limitations of Methods and Our Current Understanding. Curr. Fungal Infect. Rep. 2019, 13, 109–119. [Google Scholar] [CrossRef]
- Budden, K.F.; Gellatly, S.L.; Wood, D.L.A.; Cooper, M.A.; Morrison, M.; Hugenholtz, P.; Hansbro, P.M. Emerging pathogenic links between microbiota and the gut–lung axis. Nat. Rev. Microbiol. 2016, 15, 55–63. [Google Scholar] [CrossRef]
- Dang, A.T.; Marsland, B.J. Microbes, metabolites, and the gut–lung axis. Mucosal Immunol. 2019, 12, 843–850. [Google Scholar] [CrossRef]
- Bingula, R.; Filaire, M.; Radosevic-Robin, N.; Bey, M.; Berthon, J.-Y.; Bernalier-Donadille, A.; Vasson, M.-P.; Filaire, E. Desired Turbulence? Gut-Lung Axis, Immunity, and Lung Cancer. J. Oncol. 2017, 2017, 5035371. [Google Scholar] [CrossRef]
- Stokholm, J.; Blaser, M.J.; Thorsen, J.; Rasmussen, M.A.; Waage, J.; Vinding, R.K.; Schoos, A.-M.M.; Kunøe, A.; Fink, N.R.; Chawes, B.L.; et al. Maturation of the gut microbiome and risk of asthma in childhood. Nat. Commun. 2018, 9, 141. [Google Scholar] [CrossRef]
- Zimmermann, P.; Messina, N.; Mohn, W.W.; Finlay, B.B.; Curtis, N. Association between the intestinal microbiota and allergic sensitization, eczema, and asthma: A systematic review. J. Allergy Clin. Immunol. 2018, 143, 467–485. [Google Scholar] [CrossRef]
- Melli, L.; Carmo-Rodrigues, M.D.; Araújo-Filho, H.; Solé, D.; de Morais, M.B. Intestinal microbiota and allergic diseases: A systematic review. Allergol. Immunopathol. 2015, 44, 177–188. [Google Scholar] [CrossRef]
- Alcazar, C.G.-M.; Paes, V.M.; Shao, Y.; Oesser, C.; Miltz, A.; Lawley, T.D.; Brocklehurst, P.; Rodger, A.; Field, N. The association between early-life gut microbiota and childhood respiratory diseases: A systematic review. Lancet Microbe 2022, 3, e867–e880. [Google Scholar] [CrossRef] [PubMed]
- Liberati, A.; Altman, D.G.; Tetzlaff, J.; Mulrow, C.; Gøtzsche, P.C.; Ioannidis, J.P.A.; Clarke, M.; Devereaux, P.J.; Kleijnen, J.; Moher, D. The PRISMA statement for reporting systematic reviews and meta-analyses of studies that evaluate health care interventions: Explanation and elaboration. J. Clin. Epidemiol. 2009, 62, e1–e34. [Google Scholar] [CrossRef] [PubMed]
- Moskalewicz, A.; Oremus, M. No clear choice between Newcastle–Ottawa Scale and Appraisal Tool for Cross-Sectional Studies to assess methodological quality in cross-sectional studies of health-related quality of life and breast cancer. J. Clin. Epidemiol. 2020, 120, 94–103. [Google Scholar] [CrossRef] [PubMed]
- Hooijmans, C.R.; Rovers, M.M.; de Vries, R.B.M.; Leenaars, M.; Ritskes-Hoitinga, M.; Langendam, M.W. SYRCLE’s risk of bias tool for animal studies. BMC Med. Res. Methodol. 2014, 14, 43. [Google Scholar] [CrossRef]
- Espuela-Ortiz, A.; Lorenzo-Diaz, F.; Baez-Ortega, A.; Eng, C.; Hernandez-Pacheco, N.; Oh, S.S.; Lenoir, M.; Burchard, E.G.; Flores, C.; Pino-Yanes, M. Bacterial salivary microbiome associates with asthma among african american children and young adults. Pediatr. Pulmonol. 2019, 54, 1948–1956. [Google Scholar] [CrossRef] [PubMed]
- Chun, Y.; Do, A.; Grishina, G.; Grishin, A.; Fang, G.; Rose, S.; Spencer, C.; Vicencio, A.; Schadt, E.; Bunyavanich, S. Integrative study of the upper and lower airway microbiome and transcriptome in asthma. JCI Insight 2020, 5, e133707. [Google Scholar] [CrossRef]
- Stiemsma, L.T.; Arrieta, M.-C.; Dimitriu, P.A.; Cheng, J.; Thorson, L.; Lefebvre, D.L.; Azad, M.B.; Subbarao, P.; Mandhane, P.; Becker, A.; et al. Shifts in Lachnospira and Clostridium sp. in the 3-month stool microbiome are associated with preschool age asthma. Clin. Sci. 2016, 130, 2199–2207. [Google Scholar] [CrossRef]
- Toivonen, L.; Karppinen, S.; Schuez-Havupalo, L.; Waris, M.; He, Q.; Hoffman, K.L.; Petrosino, J.F.; Dumas, O.; Camargo, C.A.; Hasegawa, K.; et al. Longitudinal Changes in Early Nasal Microbiota and the Risk of Childhood Asthma. Pediatrics 2020, 146, 20200421. [Google Scholar] [CrossRef]
- Thorsen, J.; Rasmussen, M.A.; Waage, J.; Mortensen, M.; Brejnrod, A.; Bønnelykke, K.; Chawes, B.L.; Brix, S.; Sørensen, S.J.; Stokholm, J.; et al. Infant airway microbiota and topical immune perturbations in the origins of childhood asthma. Nat. Commun. 2019, 10, 5001. [Google Scholar] [CrossRef]
- Pérez-Losada, M.; Alamri, L.; Crandall, K.A.; Freishtat, R.J. Nasopharyngeal Microbiome Diversity Changes over Time in Children with Asthma. PLoS ONE 2017, 12, e0170543. [Google Scholar] [CrossRef] [PubMed]
- Bisgaard, H.; Li, N.; Bonnelykke, K.; Chawes, B.L.K.; Skov, T.; Paludan-Müller, G.; Stokholm, J.; Smith, B.; Krogfelt, K.A. Reduced diversity of the intestinal microbiota during infancy is associated with increased risk of allergic disease at school age. J. Allergy Clin. Immunol. 2011, 128, 646–652.e5. [Google Scholar] [CrossRef] [PubMed]
- Pérez-Losada, M.; Authelet, K.J.; Hoptay, C.E.; Kwak, C.; Crandall, K.A.; Freishtat, R.J. Pediatric asthma comprises different phenotypic clusters with unique nasal microbiotas. Microbiome 2018, 6, 179. [Google Scholar] [CrossRef] [PubMed]
- Kim, B.-S.; Lee, E.; Lee, M.-J.; Kang, M.-J.; Yoon, J.; Cho, H.-J.; Park, J.; Won, S.; Lee, S.Y.; Hong, S.J. Different functional genes of upper airway microbiome associated with natural course of childhood asthma. Allergy 2018, 73, 644–652. [Google Scholar] [CrossRef]
- Depner, M.; Ege, M.J.; Cox, M.J.; Dwyer, S.; Walker, A.W.; Birzele, L.T.; Genuneit, J.; Horak, E.; Braun-Fahrländer, C.; Danielewicz, H.; et al. Bacterial microbiota of the upper respiratory tract and childhood asthma. J. Allergy Clin. Immunol. 2017, 139, 826–834.e13. [Google Scholar] [CrossRef]
- Chiu, C.; Chou, H.; Chang, L.; Fan, W.; Dinh, M.C.V.; Kuo, Y.; Chung, W.; Lai, H.; Hsieh, W.; Su, S. Integration of metagenomics-metabolomics reveals specific signatures and functions of airway microbiota in mite-sensitized childhood asthma. Allergy 2020, 75, 2846–2857. [Google Scholar] [CrossRef]
- Chiu, C.-Y.; Cheng, M.-L.; Chiang, M.-H.; Wang, C.-J.; Tsai, M.-H.; Lin, G. Integrated metabolic and microbial analysis reveals host–microbial interactions in IgE-mediated childhood asthma. Sci. Rep. 2021, 11, 23407. [Google Scholar] [CrossRef]
- Boutin, S.; Depner, M.; Stahl, M.; Graeber, S.Y.; Dittrich, S.A.; Legatzki, A.; von Mutius, E.; Mall, M.; Dalpke, A.H. Comparison of Oropharyngeal Microbiota from Children with Asthma and Cystic Fibrosis. Mediat. Inflamm. 2017, 2017, 5047403. [Google Scholar] [CrossRef]
- Kim, Y.H.; Jang, H.; Kim, S.Y.; Jung, J.H.; Kim, G.E.; Park, M.R.; Hong, J.Y.; Na Kim, M.; Kim, E.G.; Kim, M.J.; et al. Gram-negative microbiota is related to acute exacerbation in children with asthma. Clin. Transl. Allergy 2021, 11, e12069. [Google Scholar] [CrossRef]
- Chiu, C.-Y.; Chan, Y.-L.; Tsai, M.-H.; Wang, C.-J.; Chiang, M.-H.; Chiu, C.-C. Gut microbial dysbiosis is associated with allergen-specific IgE responses in young children with airway allergies. World Allergy Organ. J. 2019, 12, 100021. [Google Scholar] [CrossRef]
- Zhang, Y.; Li, T.; Yuan, H.; Pan, W.; Dai, Q. Correlations of Inflammatory Factors with Intestinal Flora and Gastrointestinal Incommensurate Symptoms in Children with Asthma. Med. Sci. Monit. 2018, 24, 7975–7979. [Google Scholar] [CrossRef] [PubMed]
- Hsieh, C.-S.; Rengarajan, S.; Kau, A.; Tarazona-Meza, C.; Nicholson, A.; Checkley, W.; Romero, K.; Hansel, N.N. Altered IgA Response to Gut Bacteria Is Associated with Childhood Asthma in Peru. J. Immunol. 2021, 207, 398–407. [Google Scholar] [CrossRef]
- Arrieta, M.-C.; Stiemsma, L.T.; Dimitriu, P.A.; Thorson, L.; Russell, S.; Yurist-Doutsch, S.; Kuzeljevic, B.; Gold, M.J.; Britton, H.M.; Lefebvre, D.L.; et al. Early infancy microbial and metabolic alterations affect risk of childhood asthma. Sci. Transl. Med. 2015, 7, 307ra152. [Google Scholar] [CrossRef] [PubMed]
- Chiu, C.; Cheng, M.; Chiang, M.; Kuo, Y.; Tsai, M.; Chiu, C.; Lin, G. Gut microbial-derived butyrate is inversely associated with IgE responses to allergens in childhood asthma. Pediatr. Allergy Immunol. 2019, 30, 689–697. [Google Scholar] [CrossRef]
- Fujimura, K.E.; Sitarik, A.R.; Havstad, S.; Lin, D.L.; LeVan, S.; Fadrosh, D.; Panzer, A.R.; LaMere, B.; Rackaityte, E.; Lukacs, N.W.; et al. Neonatal gut microbiota associates with childhood multisensitized atopy and T cell differentiation. Nat. Med. 2016, 22, 1187–1191. [Google Scholar] [CrossRef] [PubMed]
- Al Bataineh, M.T.; Hamoudi, R.A.; Dash, N.R.; Dash, N.R.; Ramakrishnan, R.K.; Almasalmeh, M.A.; Sharif, H.A.; Al-Hajjaj, M.S.; Hamid, Q. Altered respiratory microbiota composition and functionality associated with asthma early in life. BMC Infect. Dis. 2020, 20, 697. [Google Scholar] [CrossRef]
- Zheng, J.; Wu, Q.; Zou, Y.; Wang, M.; He, L.; Guo, S. Respiratory Microbiota Profiles Associated with the Progression From Airway Inflammation to Remodeling in Mice With OVA-Induced Asthma. Front. Microbiol. 2021, 12, 2372. [Google Scholar] [CrossRef]
- Xiong, Y.; Hu, S.; Zhou, H.; Zeng, H.; He, X.; Huang, D.; Li, X. High-throughput 16S rDNA sequencing of the pulmonary microbiome of rats with allergic asthma. Genes Dis. 2020, 7, 272–282. [Google Scholar] [CrossRef]
- Sohn, K.-H.; Baek, M.-G.; Choi, S.-M.; Bae, B.; Kim, R.Y.; Kim, Y.-C.; Kim, H.-Y.; Yi, H.; Kang, H.-R. Alteration of Lung and Gut Microbiota in IL-13-Transgenic Mice Simulating Chronic Asthma. J. Microbiol. Biotechnol. 2020, 30, 1819–1826. [Google Scholar] [CrossRef]
- Losol, P.; Park, H.-S.; Song, W.-J.; Hwang, Y.-K.; Kim, S.-H.; Holloway, J.W.; Chang, Y.-S. Association of upper airway bacterial microbiota and asthma: Systematic review. Asia Pac. Allergy 2022, 12, e32. [Google Scholar] [CrossRef]
- Sbihi, H.; Boutin, R.; Cutler, C.; Suen, M.; Finlay, B.B.; Turvey, S.E. Thinking bigger: How early-life environmental exposures shape the gut microbiome and influence the development of asthma and allergic disease. Allergy Eur. J. Allergy Clin. Immunol. 2019, 74, 2103–2115. [Google Scholar] [CrossRef] [PubMed]
- Pulvirenti, G.; Parisi, G.F.; Giallongo, A.; Papale, M.; Manti, S.; Savasta, S.; Licari, A.; Marseglia, G.L.; Leonardi, S. Lower Airway Microbiota. Front. Pediatr. 2019, 7, 393. [Google Scholar] [CrossRef]
- Tille, P. Bailey & Scott’s Diagnostic Microbiology; Elsevier Health Sciences: Amsterdam, The Netherlands, 2015. [Google Scholar]
- Green, B.J.; Wiriyachaiporn, S.; Grainge, C.; Rogers, G.; Kehagia, V.; Lau, L.; Carroll, M.P.; Bruce, K.D.; Howarth, P.H. Potentially Pathogenic Airway Bacteria and Neutrophilic Inflammation in Treatment Resistant Severe Asthma. PLoS ONE 2014, 9, e100645. [Google Scholar] [CrossRef] [PubMed]
- Rivas, M.N.; Crother, T.R.; Arditi, M. The microbiome in asthma. Curr. Opin. Pediatr. 2016, 28, 764–771. [Google Scholar] [CrossRef] [PubMed]
- Kalliomäki, M.; Kirjavainen, P.; Eerola, E.; Kero, P.; Salminen, S.; Isolauri, E. Distinct patterns of neonatal gut microflora in infants in whom atopy was and was not developing. J. Allergy Clin. Immunol. 2001, 107, 129–134. [Google Scholar] [CrossRef]
- Penders, J.; Thijs, C.; van den Brandt, P.A.; Kummeling, I.; Snijders, B.; Stelma, F.; Adams, H.; van Ree, R.; Stobberingh, E.E. Gut microbiota composition and development of atopic manifestations in infancy: The KOALA Birth Cohort Study. Gut 2007, 56, 661–667. [Google Scholar] [CrossRef]
- Mirzayi, C.; Renson, A.; Furlanello, C.; Sansone, S.-A.; Zohra, F.; Elsafoury, S.; Geistlinger, L.; Kasselman, L.J.; Eckenrode, K.; van de Wijgert, J.; et al. Reporting guidelines for human microbiome research: The STORMS checklist. Nat. Med. 2021, 27, 1885–1892. [Google Scholar] [CrossRef]
- Gaulke, C.A.; Sharpton, T.J. The influence of ethnicity and geography on human gut microbiome composition. Nat. Med. 2018, 24, 1495–1496. [Google Scholar] [CrossRef]
- Kers, J.G.; Saccenti, E. The Power of Microbiome Studies: Some Considerations on Which Alpha and Beta Metrics to Use and How to Report Results. Front. Microbiol. 2022, 12, 4366. [Google Scholar] [CrossRef]
- Allali, I.; Arnold, J.W.; Roach, J.; Cadenas, M.B.; Butz, N.; Hassan, H.M.; Koci, M.; Ballou, A.; Mendoza, M.; Ali, R.; et al. A comparison of sequencing platforms and bioinformatics pipelines for compositional analysis of the gut microbiome. BMC Microbiol. 2017, 17, 194. [Google Scholar] [CrossRef]

| Citation | Selection | Comparability | Exposure | Total | Rate | |||||
|---|---|---|---|---|---|---|---|---|---|---|
| Is the Case (Asthma) Definition Adequate? | Representativeness of the Cases | Selection of Controls | Definition of Controls | Comparability of Cases and Controls on the Basis of the Design or Analysis | Ascertainment of Exposure | Same Method of Ascertainment for Cases and Controls | Non-Response Rate | |||
| [26] | 1 | 1 | 1 | 1 | 1 | 1 | 1 | 1 | 8 | Good |
| [46] | 1 | 0 | 0 | 0 | 1 | 1 | 0 | 0 | 3 | Poor |
| [27] | 1 | 1 | 1 | 1 | 1 | 1 | 1 | 1 | 8 | Good |
| [42] | 1 | 1 | 0 | 1 | 1 | 1 | 1 | 0 | 6 | Fair |
| [28] | 1 | 1 | 1 | 1 | 2 | 1 | 1 | 0 | 8 | Good |
| [43] | 1 | 1 | 0 | 0 | 2 | 1 | 1 | 0 | 6 | Fair |
| [44] | 1 | 0 | 0 | 1 | 1 | 1 | 1 | 1 | 6 | Fair |
| Citation | Selection | Comparability | Outcome | Total | Rate | |||||
|---|---|---|---|---|---|---|---|---|---|---|
| Representativeness of the Exposed Cohort | Selection of the Non-Exposed Cohort | Ascertainment of Exposure to Implants | Demonstration That Outcome of Interest (Asthma) Was Not Present at Start of Study | Comparability of Cohorts on the Basis of the Design or Analysis | Assessment of Outcome | Was Follow Up Long Enough for Outcome to Occur | Adequacy of Follow-Up of Cohorts | |||
| [29] | 1 | 0 | 1 | 1 | 2 | 1 | 1 | 1 | 8 | Good |
| [30] | 1 | 1 | 1 | 1 | 2 | 1 | 1 | 1 | 9 | Good |
| [31] | 1 | 1 | 1 | 1 | 1 | 1 | 1 | 1 | 8 | Good |
| [32] | 1 | 1 | 1 | 1 | 1 | 1 | 1 | 1 | 8 | Good |
| [45] | 1 | 1 | 0 | 1 | 1 | 0 | 1 | 1 | 6 | Fair |
| Citation | Selection | Comparability | Outcome | Total | Rate | ||||
|---|---|---|---|---|---|---|---|---|---|
| Representativeness of the Sample | Sample Size | Non-Respondents | Ascertainment of the Exposure | The Subjects in Different Outcome Groups Are Comparable, Based on the Study Design or Analysis. Confounding Factors Are Controlled | Assessment of Outcome | Statistical Test | |||
| [33] | 1 | 1 | 0 | 1 | 2 | 2 | 1 | 8 | Good |
| [34] | 1 | 1 | 0 | 1 | 2 | 2 | 1 | 8 | Good |
| [35] | 1 | 0 | 1 | 2 | 2 | 1 | 1 | 8 | Good |
| [36] | 1 | 0 | 1 | 2 | 1 | 1 | 1 | 7 | Good |
| [37] | 1 | 0 | 1 | 2 | 2 | 2 | 1 | 9 | Good |
| [38] | 1 | 1 | 0 | 1 | 2 | 2 | 1 | 8 | Good |
| [13] | 0 | 0 | 0 | 0 | 0 | 0 | 1 | 1 | Poor |
| [39] | 1 | 1 | 0 | 1 | 2 | 2 | 1 | 8 | Good |
| [40] | 1 | 0 | 1 | 2 | 1 | 1 | 1 | 7 | Good |
| [41] | 1 | 0 | 1 | 2 | 0 | 2 | 1 | 7 | Good |
| Citation | Selection Bias | Performance Bias | Detection Bias | Attrition Bias | Reporting Bias | Other | ||||
|---|---|---|---|---|---|---|---|---|---|---|
| Sequence Generation | Baseline Characteristics | Allocation Concealment | Random Housing | Blinding | Random Outcome Assessment | Blinding | Incomplete Outcome Data | Selective Outcome Reporting | Was the Study Apparently Free of Other Problems That Could Result in High Risk of Bias? | |
| [47] | Yes | Yes | Unclear | Yes | Unclear | Unclear | Unclear | No | No | No |
| [48] | Yes | Yes | Yes | Yes | Unclear | Yes | Unclear | No | No | No |
| [49] | Unclear | Yes | Unclear | Unclear | Unclear | Unclear | Unclear | No | No | Unclear |
| Citation and Title of the Article | Country | Sample Size | Age | Type of Sample Collected | Time of Sample Collection | Microbiome Detection Method | Genomic DNA Extraction Kit | Sequencing Platform | Microbiome Diversity Assessment | Bioinformatics Pipeline Used | Study Findings |
|---|---|---|---|---|---|---|---|---|---|---|---|
| Upper and lower airway microbiome | |||||||||||
| [47] ‘Respiratory Microbiota Profiles Associated with the Progression from Airway Inflammation to Remodelling in Mice With OVA-Induced Asthma’. | China | Female BALB/c mice: n = 30 Control group: n = 6 Ovalbumin group: n = 24 | 4–6 weeks | Nasal lavage fluid and BAL | Control group was sacrificed at the end of the experiment: n = 6 mice Experimental groups were sacrificed at different time points for sample collection as follows: 1 week: n = 6 mice 2 weeks: n = 6 mice 4 weeks: n = 6 mice 6 weeks: n = 6 mice | 16S rRNA gene sequencing (V3-V4 region) | OMEGA soil DNA extraction kit | Illumina MiSeq | α-diversity: Shannon index and β-diversity: Weighted UniFrac distance | QIIME 2 | Upper airway microbiome of the OVA induced mice had significantly higher α-diversity than control mice. Insignificant α-diversity difference in the lower airway microbiome of the OVA induced mice and control mice. Significant difference detected in β-diversity between the OVA-induced mice and control mice. The dominant respiratory microbiome in the acute inflammatory and airway remodelling stages were different. Acute inflammatory stage: ↑ Relative abundance of Pseudomonas spp. Airway remodelling stage: ↑ Relative abundance of Staphylococcus spp. and Cupriavidus spp. |
| Lower airway microbiome | |||||||||||
| [48] ‘High-throughput 16S rDNA sequencing of the pulmonary microbiome of rats with allergic asthma’ | China | Normal control group: n = 4 Saline control group: n = 4 Allergic asthma group: n = 4 | 4–6 weeks | Lung tissues | 1 time point Normal control group: lung tissues on day 0 Saline control and allergic asthma groups: lung tissues on day 29 | 16S rRNA gene sequencing (V4−V5 region) | No mention | Illumina high-throughput technology (Illumina PE250) | α-diversity: Chao index, coverage index, Shannon index, and Simpson index and β-diversity: Bray–Curtis | Mothur | The α-diversity of the lower airway microbiome in the allergic asthma group increased. Significant difference between normal control group and allergic asthma group was detected. Normal control group: ↑ Proteobacteria. Allergic asthma group: ↑ Firmicutes. |
| Lower airway and gut microbiome | |||||||||||
| [49] ‘Alteration of Lung and Gut Microbiota in IL-13-Transgenic Mice Simulating Chronic Asthma’. | Korea | IL-13 overexpressing transgenic (TG) mice: n = 30 C57BL/6 wild-type (WT) mice: n = 30 | 10-week-old mice for both groups | BAL, lung tissue and faecal | 1 time point | 16S rRNA gene sequencing (no mention of region) | FastDNA SPIN Kit | Illumina MiSeq | α-diversity: Shannon index, Chao1 index, and the Inverse Simpson’s diversity index and β-diversity: Weighted UniFrac distances | QIIME | No significant difference in α-diversity was observed. Altered β-diversity in lung and gut microbiota in the IL-13 TG mice compared to the WT mice. IL-13 TG mice (lungs): ↑ Proportion of Proteobacteria and Cyanobacteria. ↓ Amount of Bacteroidetes IL-13 TG mice (gut): ↓ Firmicutes and Proteobacteria. |
Disclaimer/Publisher’s Note: The statements, opinions and data contained in all publications are solely those of the individual author(s) and contributor(s) and not of MDPI and/or the editor(s). MDPI and/or the editor(s) disclaim responsibility for any injury to people or property resulting from any ideas, methods, instructions or products referred to in the content. |
© 2023 by the authors. Licensee MDPI, Basel, Switzerland. This article is an open access article distributed under the terms and conditions of the Creative Commons Attribution (CC BY) license (https://creativecommons.org/licenses/by/4.0/).
Share and Cite
Aldriwesh, M.G.; Al-Mutairi, A.M.; Alharbi, A.S.; Aljohani, H.Y.; Alzahrani, N.A.; Ajina, R.; Alanazi, A.M. Paediatric Asthma and the Microbiome: A Systematic Review. Microorganisms 2023, 11, 939. https://doi.org/10.3390/microorganisms11040939
Aldriwesh MG, Al-Mutairi AM, Alharbi AS, Aljohani HY, Alzahrani NA, Ajina R, Alanazi AM. Paediatric Asthma and the Microbiome: A Systematic Review. Microorganisms. 2023; 11(4):939. https://doi.org/10.3390/microorganisms11040939
Chicago/Turabian StyleAldriwesh, Marwh G., Abrar M. Al-Mutairi, Azzah S. Alharbi, Hassan Y. Aljohani, Nabeel A. Alzahrani, Reham Ajina, and Abdullah M. Alanazi. 2023. "Paediatric Asthma and the Microbiome: A Systematic Review" Microorganisms 11, no. 4: 939. https://doi.org/10.3390/microorganisms11040939
APA StyleAldriwesh, M. G., Al-Mutairi, A. M., Alharbi, A. S., Aljohani, H. Y., Alzahrani, N. A., Ajina, R., & Alanazi, A. M. (2023). Paediatric Asthma and the Microbiome: A Systematic Review. Microorganisms, 11(4), 939. https://doi.org/10.3390/microorganisms11040939