Article

Chemical Constituents, Antioxidant Potential, and Antimicrobial Efficacy of Pimpinella anisum Extracts against Multidrug-Resistant Bacteria

1
Biology Department, University College of Haqel, University of Tabuk, Tabuk 71491, Saudi Arabia
2
Department of Clinical Trial Research Unit and Drug Discovery, Egyptian Liver Research Institute and Hospital (ELRIAH), Mansoura 35818, Egypt
3
Botany and Microbiology Department, Faculty of Science, Benha University, Benha 33516, Egypt
4
Nutrition and Food Science Department, University of Tabuk, Tabuk 71491, Saudi Arabia
*
Authors to whom correspondence should be addressed.
Microorganisms 2023, 11(4), 1024; https://doi.org/10.3390/microorganisms11041024
Submission received: 10 March 2023 / Revised: 5 April 2023 / Accepted: 10 April 2023 / Published: 14 April 2023
(This article belongs to the Section Plant Microbe Interactions)

Abstract

:
Aniseeds (Pimpinella anisum) have gained increasing attention for their nutritional and health benefits. Aniseed extracts are known to contain a range of compounds, including flavonoids, terpenes, and essential oils. These compounds have antimicrobial properties, meaning they can help inhibit the growth of nasty bacteria and other microbes. The purpose of this study was to determine if aniseed extracts have potential antioxidant, phytochemical, and antimicrobial properties against multidrug-resistant (MDR) bacteria. A disc diffusion test was conducted in vitro to test the aniseed methanolic extract’s antibacterial activity. The MIC, MBC, and inhibition zone diameters measure the minimum inhibitory concentration, minimum bactericidal concentration, and size of the zone developed when the extract is placed on a bacterial culture, respectively. HPLC and GC/MS are analytical techniques used for identifying the phenolics and chemical constituents in the extract. DPPH, ABTS, and iron-reducing power assays were performed to evaluate the total antioxidant capacity of the extract. Using HPLC, oxygenated monoterpenes represented the majority of the aniseed content, mainly estragole, cis-anethole, and trans-anethole at 4422.39, 3150.11, and 2312.11 (g/g), respectively. All of the examined bacteria are very sensitive to aniseed’s antibacterial effects. It is thought that aniseed’s antibacterial activity could be attributed to the presence of phenolic compounds which include catechins, methyl gallates, caffeic acid, and syringic acids. According to the GC analysis, several flavonoids were detected, including catechin, isochiapin, and trans-ferulic acid, as well as quercitin rhamnose, kaempferol-O-rutinoside, gibberellic acid, and hexadecadienoic acid. Upon quantification of the most abundant estragole, we found that estragole recovery was sufficient for proving its antimicrobial activity against MDR bacteria. Utilizing three methods, the extract demonstrated strong antioxidant activity. Aniseed extract clearly inhibited MDR bacterial isolates, indicating its potential use as an anti-virulence strategy. It is assumed that polyphenolic acids and flavonoids are responsible for this activity. Trans-anethole and estragole were aniseed chemotypes. Aniseed extracts showed higher antioxidant activity than vitamin C. Future investigations into the compatibility and synergism of aniseed phenolic compounds with commercial antibacterial treatments may also show them to be promising options.

1. Introduction

In recent years, multidrug resistance has emerged as a major challenge not only in chemotherapy, but also in antibiotic therapy due to the emergence and spread of bacterial pathogens [1]. Nevertheless, in addition to intrinsic antibacterial agents [2], certain medicinal plants also generate inhibitors of multidrug resistance [3], which are capable of enhancing the activity of antibiotics against multidrug-resistant bacteria [4]. As a result of this finding, crude extracts were examined for potential synergistic interactions with common antibiotics against resistant bacteria, opening the door for the discovery of plant-based multidrug resistance inhibitors [5].
Medicinal plants remain a reliable source of compounds with medicinal properties despite these problems [6]. In addition to being widely studied, these plants have a considerable economic interest because they are widely used in agriculture, pharmaceuticals, and cosmetics, as they contain a wide variety of antimicrobial and antioxidant compounds [7]. Infectious diseases and microbial pathogenicity have been treated with natural products for thousands of years worldwide, prior to the introduction of antibiotics and other modern medications [8]. Specifically, aniseed (Pimpinella anisum) is used to treat osteoarthritis, gastritis, skin irritation, and dental aches [9]. Aside from being anti-flu and anti-HIV, it has also been reported to possess antibacterial, antiseptic, insecticidal, and chemopreventive properties [10]. Catechin, isochiapin, trans-anethole, estragole, and trans-ferulic acid, as well as quercitin rhamnoside, are commonly occurring chemicals that have been previously discovered in aniseed extract [11].
Secondary metabolites of plants are believed to play a role in the plant’s defense system against pathogens, as they are capable of inhibiting the growth of microorganisms and reducing the risk of infection. Some active compounds in medicinal plants, such as alkaloids, terpenoids, and flavonoids, have been found to have anti-inflammatory, anti-tumor, antimicrobial, and analgesic properties [12,13]. Furthermore, the compounds in plants are natural and have fewer side effects than synthetic drugs, making them a safer and more sustainable way to treat diseases [14,15]. Plants have been used therapeutically in Egyptian culture for thousands of years. The active compounds in medicinal plants have been studied to understand their pharmacological effects, and they have been found to have antibacterial, antifungal, and antiviral properties [16,17]. This makes them a safe and effective way to treat infections. Additionally, they are generally more affordable than synthetic medications, making them more accessible to people who may not otherwise have access to treatment [18,19].
Thus, this in vitro study was conducted to determine the effectiveness of aniseed methanolic extract against multidrug-resistant bacteria as well as to determine the antioxidant potential of the extract and its phytochemical composition by using comprehensive GC–MS and HPLC methods to identify the extract’s bioactive constituents and phenolic compounds.

2. Materials and Methods

2.1. Preparation of Plant Materials Extracts

The aniseed plants were collected from the Horticulture Research Institute, Agriculture Research Center, Giza, Egypt. Plant parts were gently washed with distilled water and air-dried for three days at room temperature before being carefully ground in a blender. An amount of 10 g of ground, air-dried plant material was soaked in 50 mL of methanol in conical flasks, and then incubated at room temperature for 72 h with shaking at 120 rpm. Centrifugation of the crude extracts was carried out at 3354× g for 10 min at 25 °C then evaporated at 80 °C in a rotary evaporator. Then, the extracts were stored at 4 °C for further experiments [20].

2.2. Antibiotic Susceptibility and Bacterial Strains

A number of 37 bacterial samples were taken from patients presenting at the Benha University Hospital in Benha, Egypt. These 37 bacteria from gram-positive and gram-negative groups were taken from a variety of clinical specimens, including urine, prostatic secretion, and wound discharge. We maintained all bacterial isolates on nutrient agar slants except Enterococcus faecalis, which was cultured on trypticase soya agar (TSA). Isolates were regularly subcultured and stored in 10% glycerol suspension at 4 °C and at −80 °C to ensure recovery when needed.
Then, adopting several antibiotics that perceive cell walls, protein synthesis, and DNA, all clinical isolates were tested for antibiotic resistance using the Kirby–Bauer disc diffusion method [21]. Penicillin, amoxicillin/clavulanate, vancomycin, ampicillin/sulbactam, nitrofurantoin, aztreonam, cefoperazone, chloramphenicol, clindamycin, gentamicin, tetracycline, erythromycin, ofloxacin, norfloxacin, and trimethoprim/sulfamethoxazole were the antibiotics used to test the sensitivity of the isolated strains. At least one resistant strain from each of the examined organisms that was resistant to the aforementioned antibiotics was chosen for further evaluation and biochemically identified. Inhibition zones (mm) were categorized as sensitive, intermediate, or resistant.

2.3. Identification of Bacterial Isolates by VITEK2 System

Suspensions were prepared by emulsifying bacterial isolates in 0.45% saline to the equivalent of a 0.5 McFarland turbidity standard. VITEK®2 Systems 7.01 software (BIOMÉRIEUX) was used to confirm the conventional biochemical identification of the selected bacterial isolates [22]. Substrates presented in the identification card specific for gram-negative identification used in the VITEK®2 system were as follows: APPA, ala-phe-pro-arylamidase; ADO, adonitol; PyrA, l-pyrrolydonyl-arilamidase; IARL, l-arabitol; dCEL, d-cellobiose; BGAL, beta-galactosidase; H2S, H2S production; BNAG, beta-n-acetyl-glucosaminidase; AGLTp, glutamylarylamidase PNA; dGLU, d-glucose; GGT, gamma-glutamyl-transferase; OFF, fermentation glucose; BGLU, beta-glucosidase; dMAL, d-maltose; dMAN, d-mannitol; dMNE, d-mannose; BXYL, beta-xylosidase; BaLAP, beta-alaninearylamidase pna; ProA, l-proline arylamidase; LIP, lipase; PLE, palatinose; TyrA, tyrosine arylamidase; URE, urease; dSOR, d-sorbitol; SAC, saccharose/sucralose; dTAG, d-tagatose; DTRE, d-trehalose; CIT, citrate (sodium); MNT, malonate; 5 KG, 5-keto-d-gluconate; ILATk, L-lactate alkalinization; AGLU, alpha-glucosidase; SUCT, succinate alkalinization; NAGA, beta-n-acetyl-galactosaminidase; AGAL, alpha-galactosidase; PHOS, phosphatase; GlyA, glycine arylamidase; ODC, ornithine decarboxylase; LDC, lysine decarboxylase; ODEC, DECARBOXYLASE base; IHISa, L-histidine assimilation; CMT, coumarate; BGUR, beta-glucoronidase; O129R, o/129 resistance; GGAA, glu-gly-arg-arylamidase; IMLTa, L-MALATE assimilation; ELLM, ellman; and ILATa, L-lactate assimilation.

2.4. Evaluation of Antimicrobial Susceptibility Testing, Minimum Inhibitory Concentrations (MIC), and Minimum Bactericidal Concentrations (MBC)

In order to determine whether or not the plant extracts have antibacterial properties, the disc diffusion procedure for assessing antimicrobial susceptibility was used. This testing was carried out in accordance with the standard method as described previously [23]. Plant extracts were tested for their ability to inhibit the growth of the bacteria with the greatest level of resistance to several drugs [23]. MIC values were determined for plant extracts with antibacterial activity according to the microplate method of Eloff (1998) [24]. In this study, a 25 mg/mL concentration of the plant extract was prepared and dissolved in a 10% solution of dimethyl sulfoxide (DMSO). A 96-well polystyrene flat-bottomed multi-well microplate (Sigma Aldrich, St. Louis, MO, USA) was designed to test each extract at 1000 µg/mL and serially dilute twice to 15.6 µg/mL. Each well was then filled with 10 µL (1 × 10⁶ CFU/mL) of bacteria. An ELISA reader was used to read pre-incubation absorbance values. In each experiment, the antibiotic amikacin was utilized as a reference antibiotic, while an extract-free solution served as the negative control. After incubation at 37 °C for 24 h, the microplates were read for absorbance and MIC values and the experiment was repeated twice. By streaking on the surface of solid nutrient agar, bacterial cells were transferred from the MIC plate and subcultured. After a 24 h period of overnight incubation at 37 °C, MBC was calculated [25].

2.5. Time-Kill Kinetics

Following the method described in the previous work by Akinjogunla et al. [26], a start-up inoculum containing between 105 and 106 CFU/mL was obtained by subculturing and diluting the selected bacteria to 0.5 McFarland standard turbidity. For 90 min, the tubes were shaken continuously at 150 rpm at 37 °C to ensure that microbial growth was in the logarithmic phase (exponential). To initiate growth in test tubes, concentrations equal to the MICs of aniseed extract were prepared and transferred into sterile broth. This was followed by an inoculum (density ∼105–106 CFU/mL), and then incubation at 37 °C. CFU/mL was calculated by taking aliquots after (0, 0.5, 1, 1.5, 2, 3, 4, and 6 h).

2.6. HPLC Analysis of Phenolic Contents

As part of the investigation, standard solutions were formulated for investigating phenolic compounds: estragole, anethole, trans-anethole, catechin, methyl gallate, caffeic acid, syringic acid, kaempferol-O-rutinoside, rosmarinic acid, quercetin, O-coumaric acid, naringenin, ferulic, syringic, vanillic, caffeic, ellagic, and gallic acids (Sigma-Aldrich, Merck, Darmstadt, Germany). Using the HPLC grade methanol (Ultragradient grade; Sigma-Aldrich, Merck, Darmstadt, Germany) as a solvent for dissolving the standards, stock solutions of 100 mg/L were prepared, which were then used to produce 50, 40, 30, 20, and 10 mg/L working solutions. To determine the HPLC wavelength for each phenolic compound sample, we assessed their absorbance via a UV–Vis spectrophotometer (UV-2600; Shimadzu, Tokyo, Japan).
HPLC analysis was performed with the Agilent 1260 series armed with a UV–Vis. An Eclipse C18 reverse-phase chromatography column with a size of (5 µm, 250 × 4.6 mm) was used for separation. Mobile phases included water (A) and acetonitrile (B), which contained 0.05% trifluoroacetic acid. The mobile phase flow rate was 1 mL/min with a linear gradient as follows: starting with 95% A and 5% B; 5–8 min 65% A and 35% B; 8–12 min 65% A and 35% B; 12–15 min 50% A and 50% B; 15–16 min 30% A and 70% B; 16–20 min 95% A and 5% B. The multi-wavelength detector was monitored at 280 nm. The injection volume was 5 µL per sample solution and the column temperature was 40 °C [27].

2.7. Chemical Constituents Gas Chromatography–Mass Spectroscopy (GC–MS) Analysis

GC–MS was used to analyze the extract. In our protocol, trimethylsilylation was carried out by adding 100 µL of derivatization reagent (80 µL BFSTA + 20 µL TMCS) and incubating at 65 °C for 1 h. An HP-5 MS capillary column (30 m × 0.25 mm i.d., 0.25 µm film thickness) and a flame ionization detector were used for the GC analysis. As a carrier gas, helium flows at a rate of 1 mL/min. A temperature of 250 °C was used for the injector and a temperature of 280 °C for the detector. Initially, the column temperature was kept at 40 °C for 5 min. It was gradually raised to 250 °C at 2 °C/min for 5 min, then increased to 275 °C at 5 °C/min for 5 min. Finally, sample was injected into the system in split mode with a ratio of 10:1. According to [28], extract components were identified by the Wiley NIST 2011 mass spectral library of the GC–MS data system.

2.8. Quantitative Analysis

Having performed qualitative analysis with GC–MS, the most abundant chemical constituent was then quantified using LC–MS/MS (6545, Agilent Technologies Inc., Santa Clara, CA, USA) equipped with an Agilent Eclipse plus C18 column (50 × 3.0 mm2, 1.8 µm) to ensure that the compound had the greatest effect on MDR bacteria.

2.8.1. Preparation of Stock Solutions, Calibration Standards, and Quality Control Samples

In an amber-colored glass bottle at 4 °C, estragole (4-allyl anisole) was diluted in n-hexane to 50 mg/mL. An amber-colored glass bottle was used for storage of the internal standard (IS) stock solution of p-anisaldehyde at 1.0 mg/mL in n-hexane. Suitable dilutions of stock solution have been used to prepare calibration standards (0.20–20.00 ng/mL). n-hexane was used to prepare quality control samples (QC) of stock solutions at concentrations of 6, 100, and 280 ng/mL.

2.8.2. Method Validation

ICH guidance was followed for the validation of the proposed analytical methodology for estragole quantitative analysis. An x-axis plot with estragole concentration and its peak area ratio on a y-axis was used to estimate estragole’s linearity range. A six-replication study was conducted to determine estragole linearity in the range of 0.20–20.00 ng/mL. According to the standard addition method, the accuracy of the estragole method was estimated as percent of recovery (% recovery). Each estragole concentration was estimated based on the % recovery. The method precision, accuracy, selectivity, and other parameters of validation were also assessed.

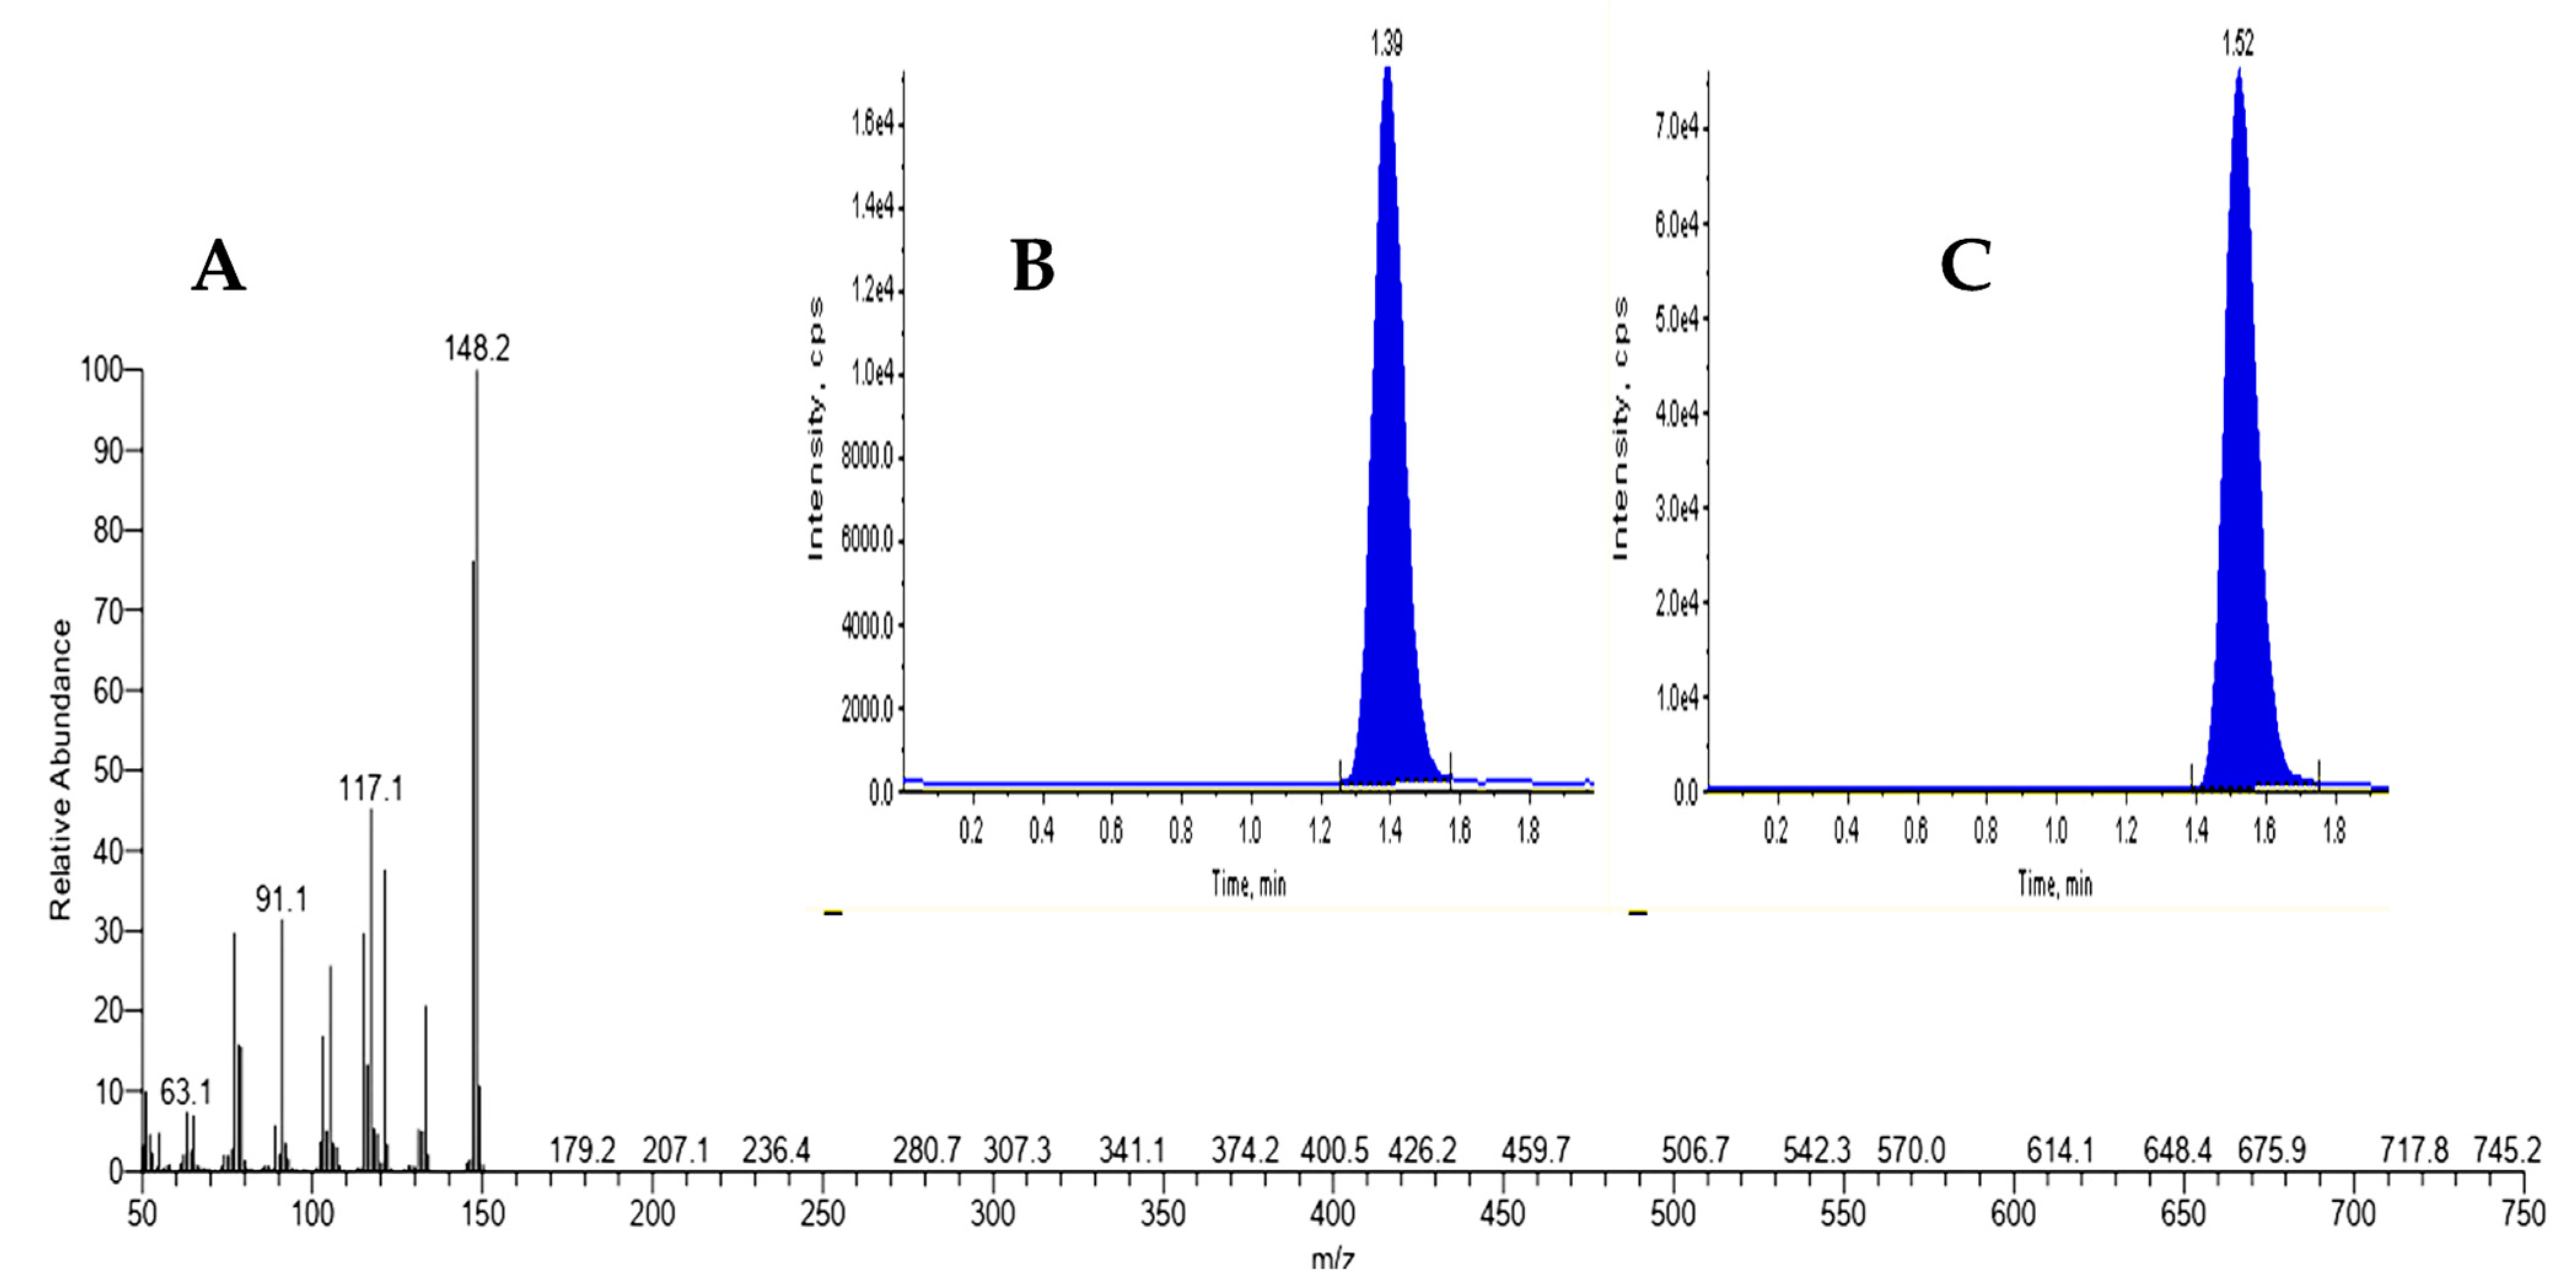
2.8.3. Quantitative Analysis of Estragole Using LC–MS/MS Method

We used ammonium formate in 5 mM concentration (A) and a mixture of methanol and water (B) at a flow rate of 0.3 mL/min as the solvent composition. Starting at 95% A, a gradual decrease to 35% A took 13 min, then a gradual decrease to 0% A took 3 min, held for 4 min, then increased to a gradual return to 95% A after 2 min. At 40 °C of column temperature, 5 µL of aliquot were injected into the UPLC system. Desolvation gas flow rate—10 L/min, nebulizer gas pressure—40 psi, capillary voltage—4300 V, desolvation gas temperature—360 °C—were used in the MS detection condition. The MS analysis was performed using both electrospray ionization modes to obtain full scan mass spectra (m/z 50–750). The UPLC system was set to 40 °C in order to achieve optimal resolution and peak shape of the compounds being analyzed. The MS detection settings were carefully optimized in order to maximize sensitivity and selectivity of the MS analysis.

2.9. Assessment of Antioxidant Activity

2.9.1. DPPH Scavenging Activity

A solution of 0.25 mL of DPPH methanol was mixed with 1 mL of aniseed seed extracts and allowed to stand for 30 min in the dark after shaking vigorously for 1 min. Each sample was incubated at 37 °C for 30 min. A UV spectrophotometer was used to measure absorbance at 517 nm [29]. The following equation was used to compute the percentage of DPPH radical scavenging activity:
% DPPH radical scavenging activity = [(A0 − A1)/A0] × 100
where A0 represents the absorbance of the control and A1 represents the absorbance of the extract or standard.

2.9.2. ABTS Radical Cation Scavenging Activity

ABTS radical cation scavenging activity was measured at different concentrations, and the results were compared with that of standard materials; ascorbic acid was measured at similar concentrations as discussed in the previous study by [30]. Based on the absorbance at 734 nm of ABTS radical cation scavenging activity, the following equation was calculated:
% ABTS radical cation scavenging activity = [1 − (Asample/Acontrol)] × 100

2.9.3. Reducing Power Scavenging Assay

2.5 mL of sodium phosphate buffer (0.32 M, pH 6.6) and 2.5 mL of potassium ferricyanide were added to 1 mL of various concentrations of diluted plant extracts in methanol. After 20 min at 50 °C, the liquid was centrifuged for 10 min before 2.5 mL of 10% trichloroacetic acid was added. Using a mixture of 2.5 mL deionized water and 0.5 mL ferric chloride (0.1%), we measured the solution’s absorbance at 700 nm in comparison to a blank [31].

2.10. Statistical Analyses

In all experiments, the results were expressed as mean ± (SD). To compare means, a one-way analysis of variance (ANOVA) was conducted followed by a post hoc Tukey test at a significance level of 5%.

3. Results

3.1. Antibiotic Susceptibility and Bacterial Strains

Based on the test results of 32 gram-positive and gram-negative bacteria against 16 antibiotics, (Table 1) shows that isolates exhibited antibiotic resistance and there was a high and alarming level of antibiotic resistance among the tested isolates in this study. The most common antibiotics showing resistance were penicillin, norfloxacin, clindamycin, and trimethoprim/sulfamethoxazole. This suggests that due to the improper and overuse of antibiotics, bacteria are developing resistance to these antibiotics, making them less effective at treating infections. This could be a major public health concern as it could lead to more serious illnesses and even death.

3.2. Identification of Bacterial Isolates by VITEK2 System

Further identifications were carried out by the VITEK2 system, the biochemical identification is summarized in (Table S1); the results of susceptibility testing (Table 2, Table 3, Table 4, Table 5 and Table 6) for bacterial isolates by the VITEK 2 method were compared with those of the manual method using pure cultures according to CLSI. The data revealed that there was a high similarity between the manual susceptibility method agreement and the VITEK 2 system for the antibiotics used.

3.3. Antimicrobial Susceptibility Testing for the Methanolic Extract of Aniseed

Methanolic extracts of aniseed were tested using the agar disc diffusion method against five isolates that were highly drug-resistant (Table 7). Compared to amikacin as the gold standard test, methanolic extracts of aniseed significantly inhibited all of the test bacteria. Statistical differences in inhibition zones were found for all bacterial tests at experimental concentrations of extracts (Table 7). The inhibitory zone of Pseudomonas aeruginosa was the largest (22.86 mm), indicating that phenolic compounds may have a greater impact on its antibacterial activity. However, Acinetobacter baumannii (17.56 mm) was considered to be the least sensitive. As for the MICs and MBCs, the MIC values varied with the bacterial species. However, in general, the values ranged from 0.095 to 0.170 mg/mL, indicating that the extracts had high potency. There was a trend of inhibition against all bacteria in aniseed extracts (0095–0.130 mg/mL). MBC assays confirmed the results of disc diffusion assays as well as MIC determinations. Aniseed extracts were found to have bactericidal activity as indicated by their MBC values of 0.190–0.260 mg/mL as revealed in (Table 8). The selected isolates (Gram-negative: Salmonella typhi, Pseudomonas aeruginosa, and Acinetobacter baumannii) and (Gram-positive: Enterococcus faecalis and Staphylococcus aureus) were sensitive to aniseed extract based on the MIC and MBC assays.

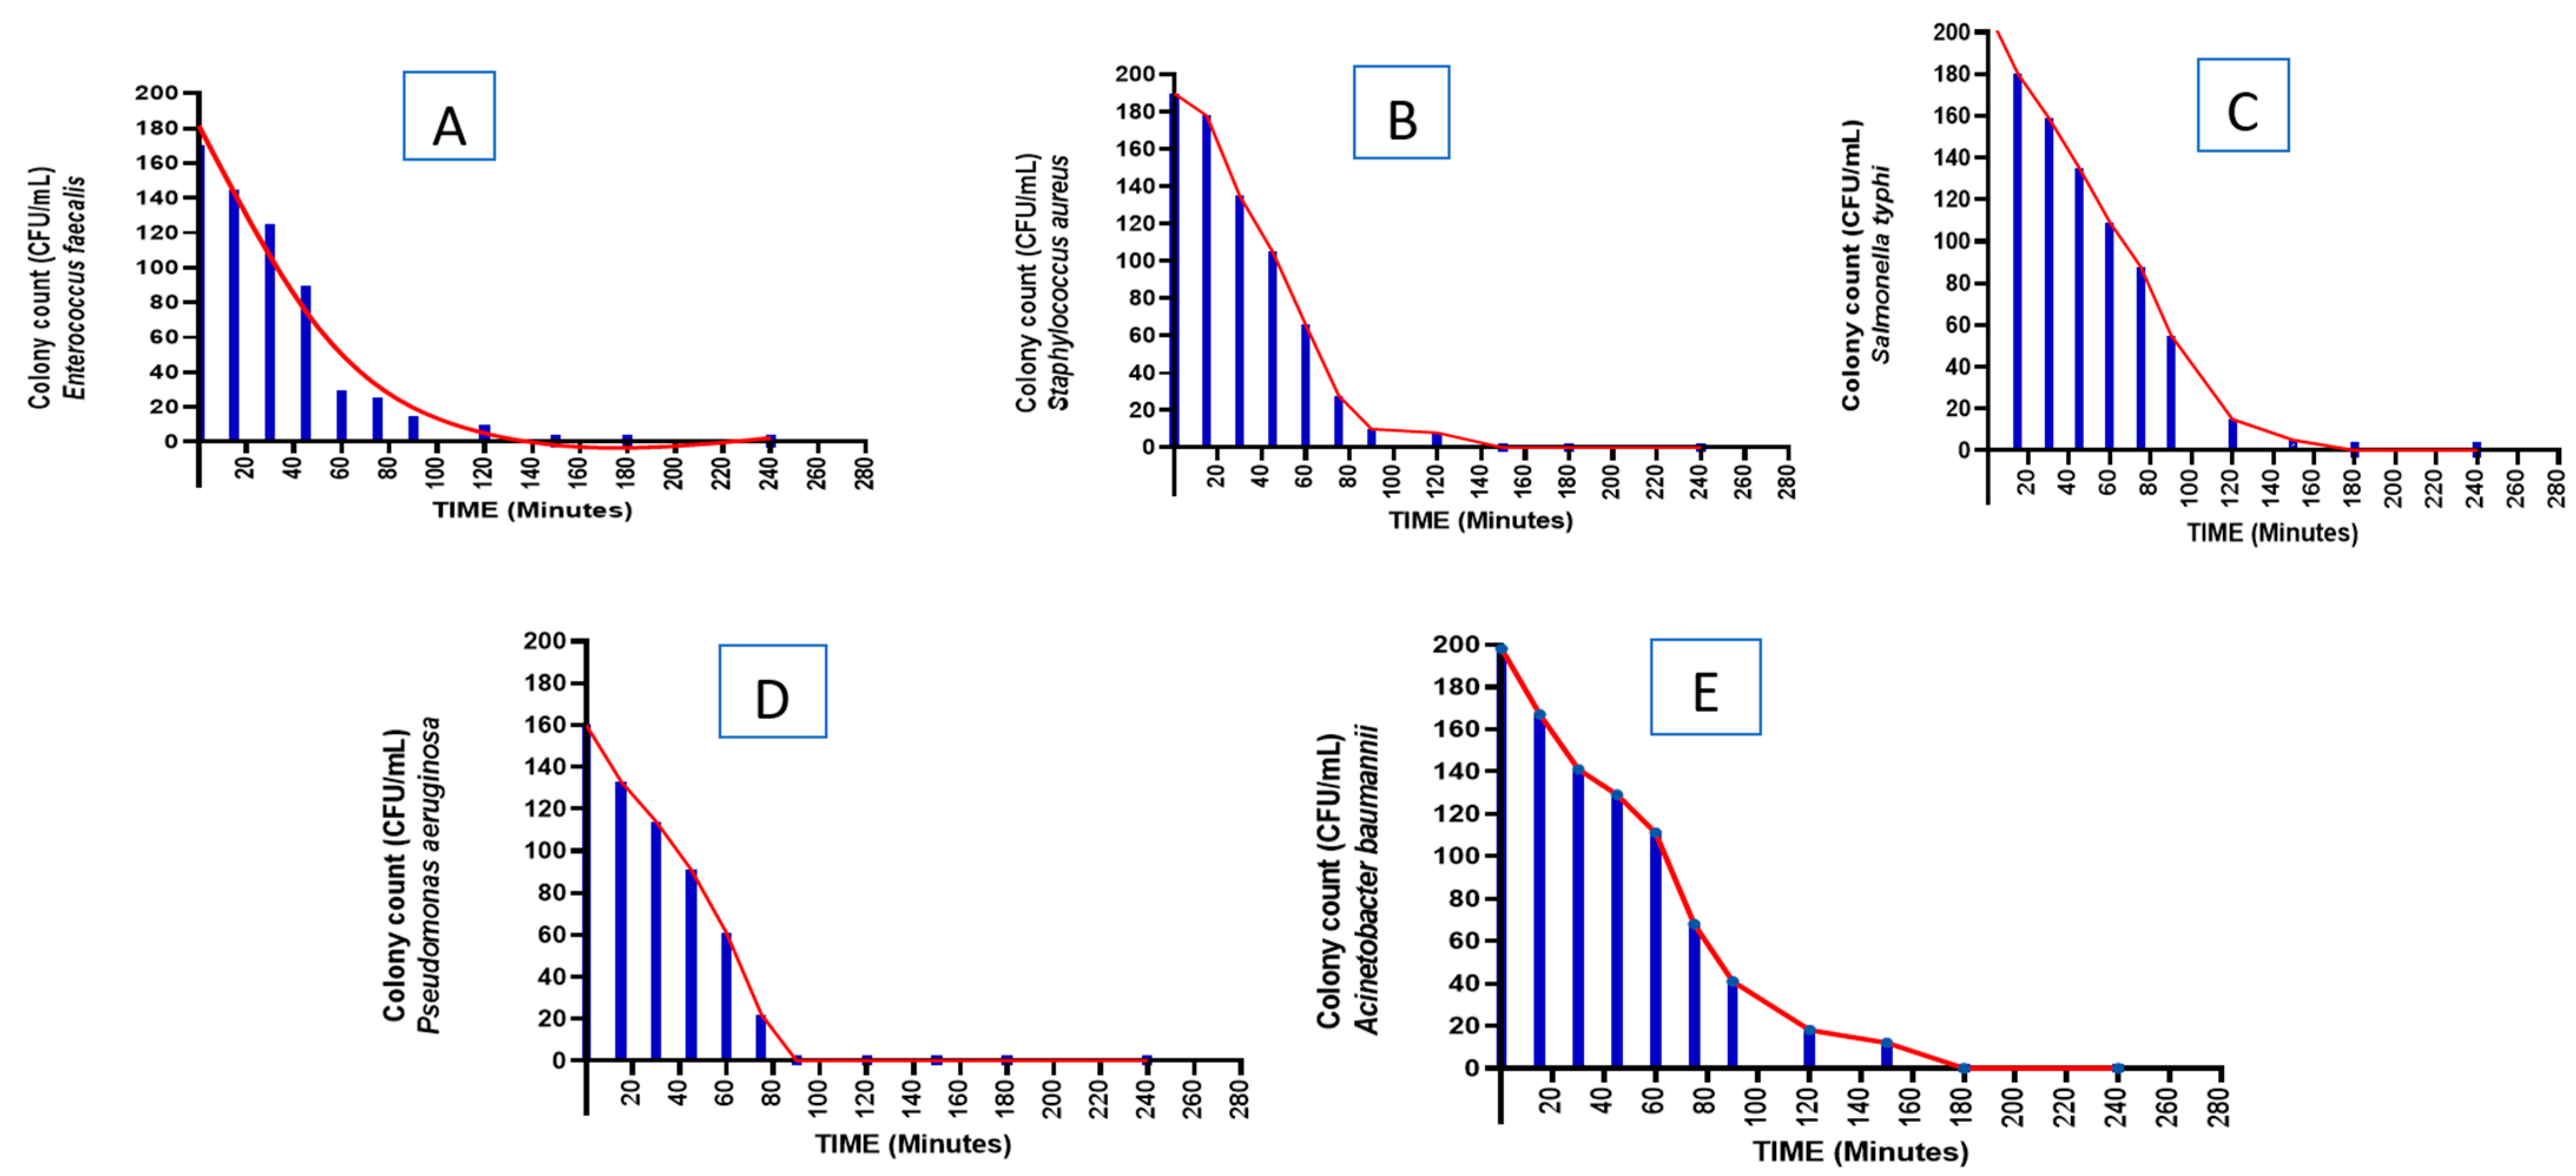
3.4. Time-Kill Kinetics

Aniseed methanolic extracts were tested for killing time against each bacterial isolate, and results can be found in Figure 1A–E. It was found that aniseed extracts had a greater effect on Enterococcus faecalis, Staphylococcus aureus, Salmonella typhi, Pseudomonas aeruginosa, and Acinetobacter baumannii, all of which were killed within 3 h. Pseudomonas aeruginosa, however, was killed approximately one hour after the aniseed extract was added.

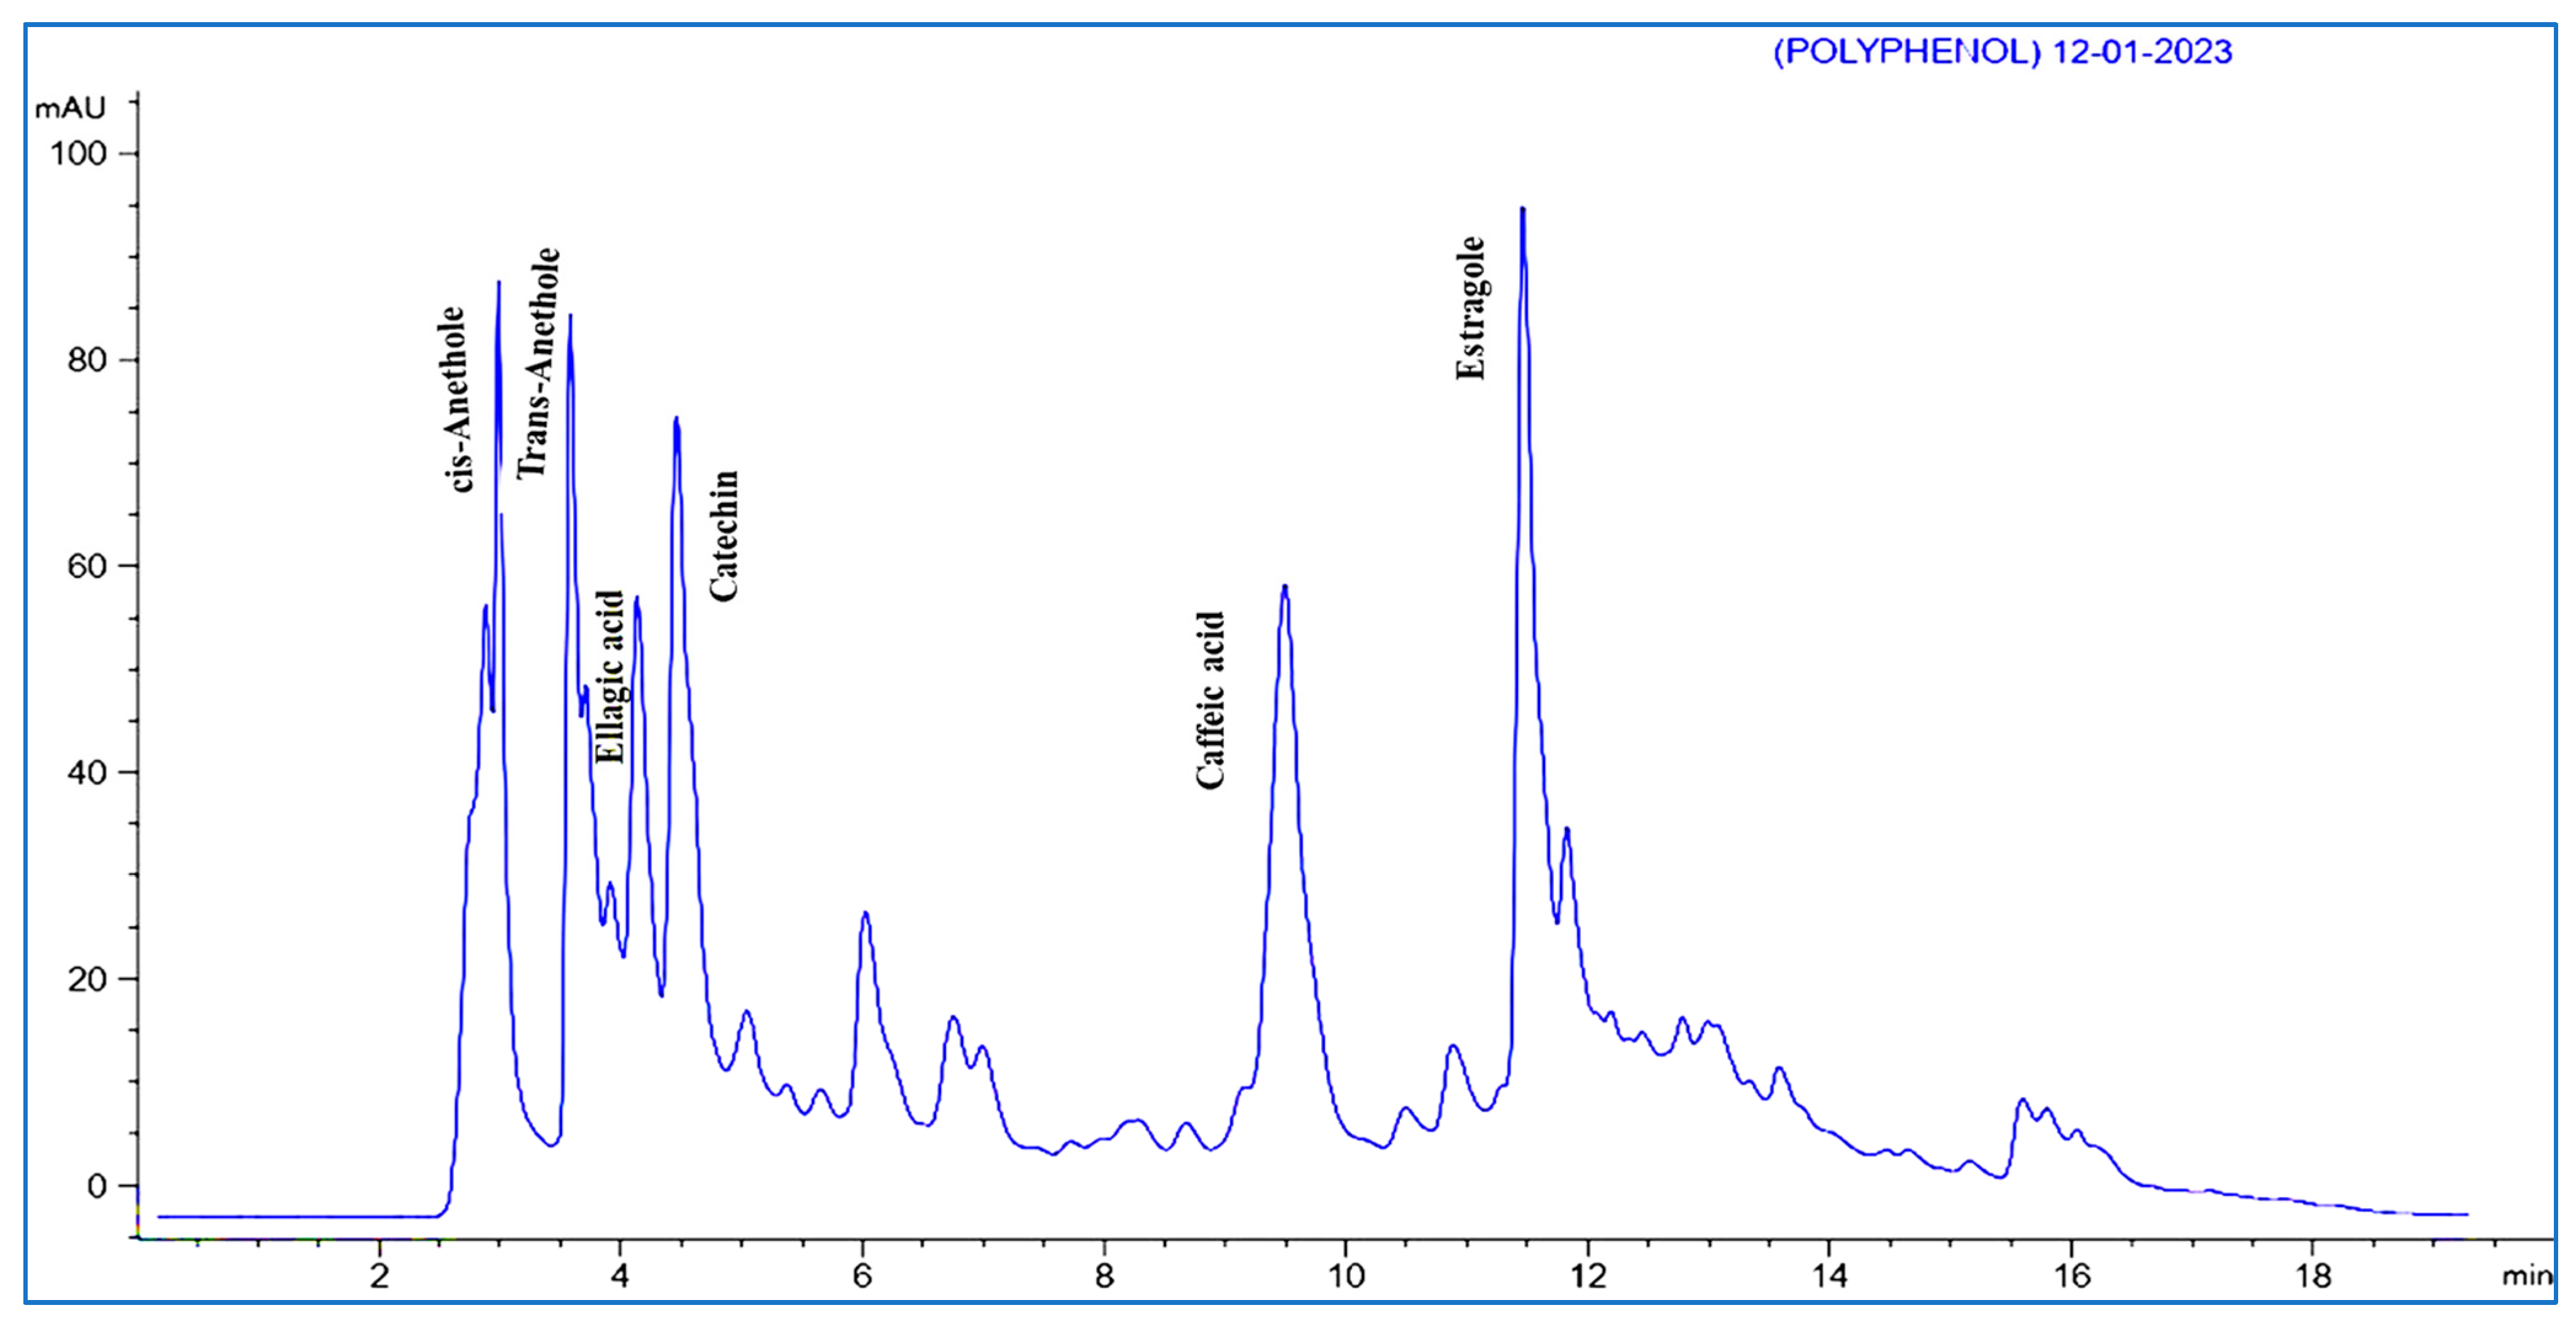
3.5. HPLC Analysis of Phenolic Contents
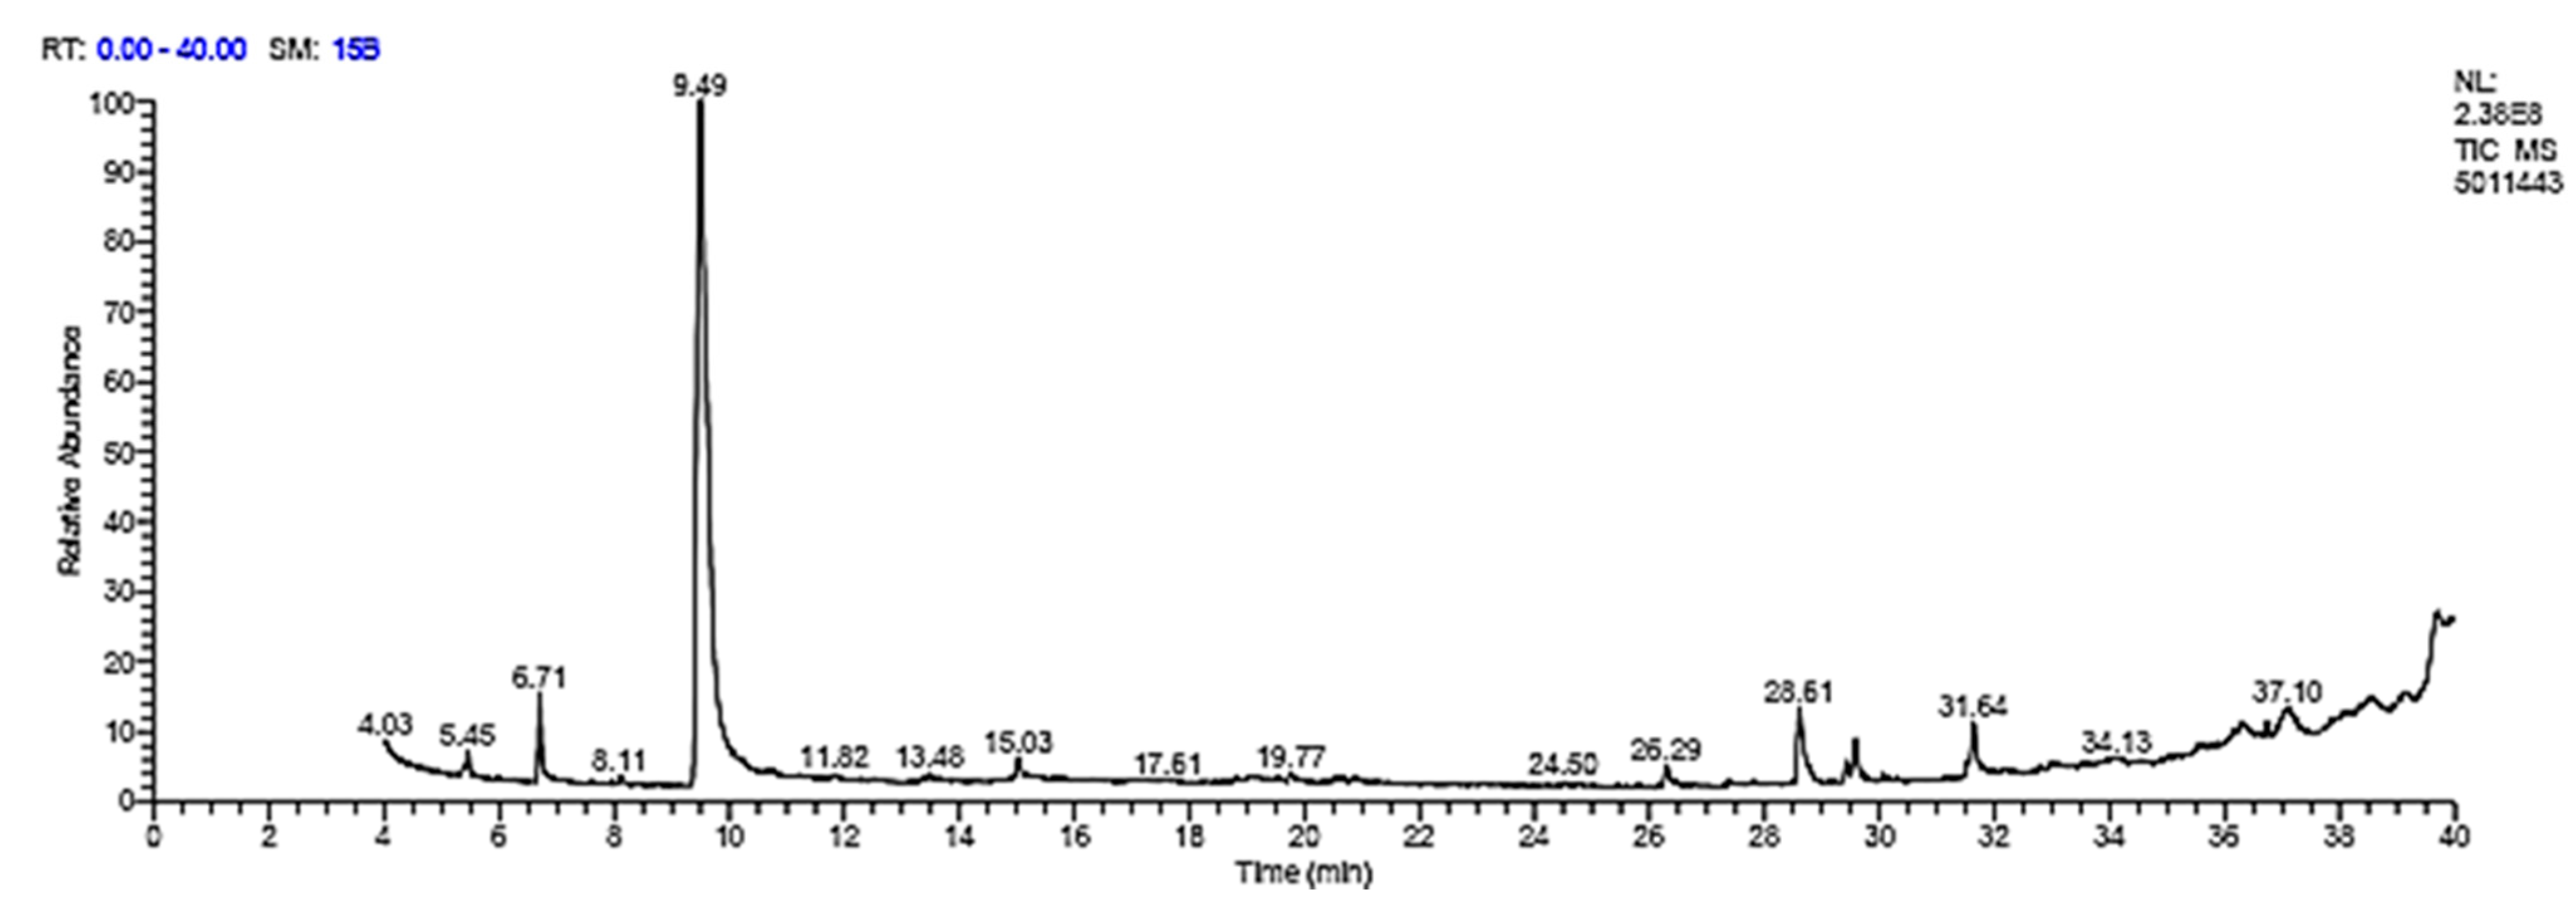
In the study, polyphenols extracted from aniseeds were characterized qualitatively and quantitatively by HPLC. Polyphenols were identified by comparing the retention times of peaks with those of standard compounds. By comparing the peak areas of the identified compounds with standards, the quantification of the compounds was performed. A number of 25 phenolic compounds have been determined by HPLC from aniseed extracts. In fact, oxygenated monoterpenes represent the vast majority of the aniseed content, mainly estragole, cis-anethole, and trans-anethole with concentrations of 4422.39, 3150.11, 2312.11 (µg/g), respectively, as revealed in (Table 9) and (Figure 2).

3.6. GC Analysis

In this study, gas chromatography was used to analyze aniseed’s chemical composition. GC–MS analysis of aniseed revealed more than 27 isolated components. The retention times and peak area (%) of the main isolated components in (Table 10) are shown for the main isolated component estragole, which represents more than 65% of the isolated components (Figure 3).

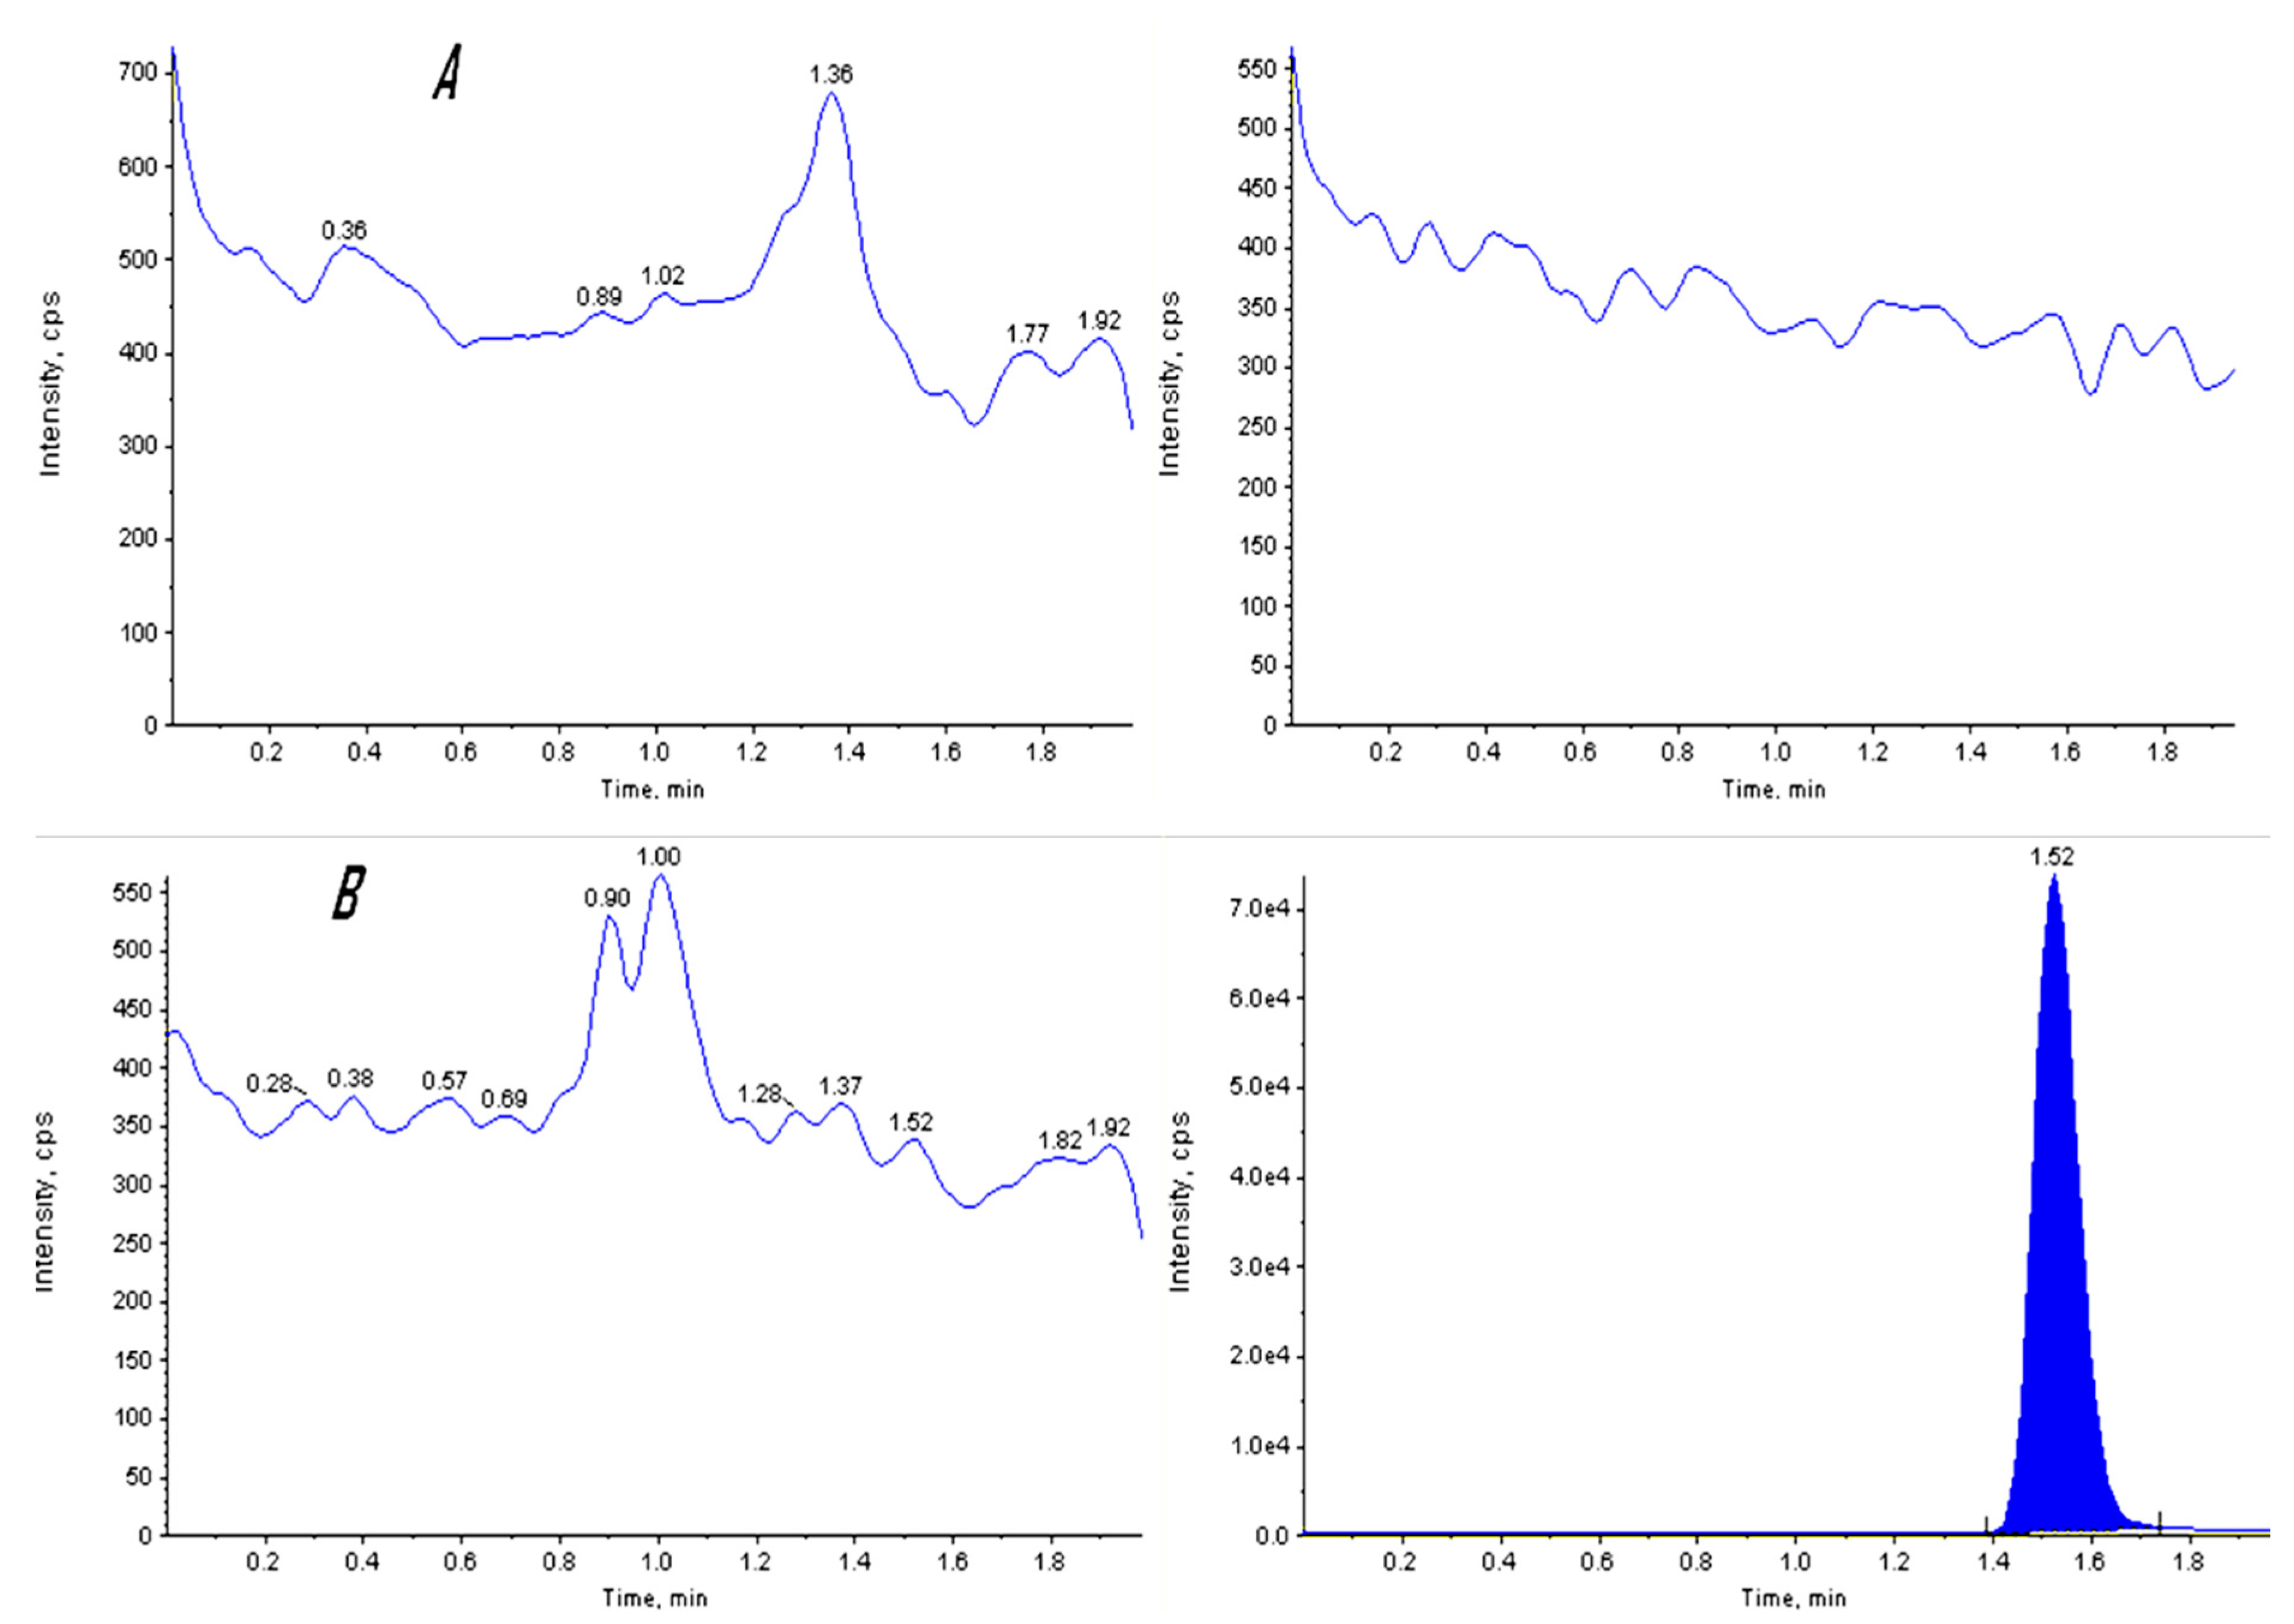
3.7. Method Validation Outcomes

In accordance with ICH recommendations, a number of validation parameters were examined for estragole quantitative analysis. In Table 11, we present the results of the linear regression analysis of estragole. The results showed an excellent linear fit, with an R-squared value of 0.9992 for the range of 0.20–20.00 ng/mL, indicating that estragole levels can be accurately determined with the developed method.
Table 11. Characteristics outcome of the validated method carried.
TechniqueLC–MS/MS
SelectivityNo interferences from endogenous plasma samples (Figure 4).
Lower Quantification Limit0.2 ng/mL.
Linearity and Calibration RangeR = 0.9992 for range 0.20–20.00 ng/mL.
Stability%:
a.
Short-Term (6 h)
Between 93.66% and 97.10%.
b.
Stock Solution
Mean 91.03% and 109.86% for internal standard and analyte, respectively, left for 5 h at RT. Mean 98.29% and 101.73% for internal standard and analyte, respectively, left for 27 days and in the refrigerator.
c.
Auto-Sampler (9.5 h)
Between 94.87% and 98.77% for analyte and 105.38% for internal standard.
d.
Dry Extract
Between 100.53% and 101.09% for analyte and 98.96% for internal standard (IS) left dry 1.00 h at RT. Between 97.81% and 99.31% for analyte and 101.43% for IS for 50.0 h in the refrigerator.
Recovery
a.
Absolute Recovery
Between 61.78% and 72.36% and 83.88%.
b.
Relative Recovery
Between 101.78% and 104.66%.
Intra-Batch Precision (% CV)Between 2.39% and 4.79% and 3.92% for LLOQ.
Intra-Batch Accuracy%Between 96.22% and 103.10% and 89.33% for LLOQ.
Inter-Batch Precision (% CV)Between 4.14% and 5.54% and 13.19% for LLOQ.
Inter-Batch Accuracy%Between 100.00% and 104.75% and 92.33% for LLOQ.
Dilution IntegrityAccuracy between 92.60% and 101.17%.

3.8. Quantitative Analysis of Estragole

Estragole was quantified by LC–MS/MS based on the standard concentration. The standard concentration was used to create a calibration curve, which was then used to determine the concentration of estragole in the sample (Figure 5). Table 12 shows the results of this analysis.
Table 12 shows the concentration and confirmation of estragole in the aniseed sample as determined by LC–MS/MS. Based on the mass spectra obtained, the molecular ion at m/z 150 matched those of a standard estragole. This illustrates how estragole was identified using LC–MS/MS by mass spectra (Figure 6A), retention time of estragole, and spiked IS extracts (Figure 6B,C).

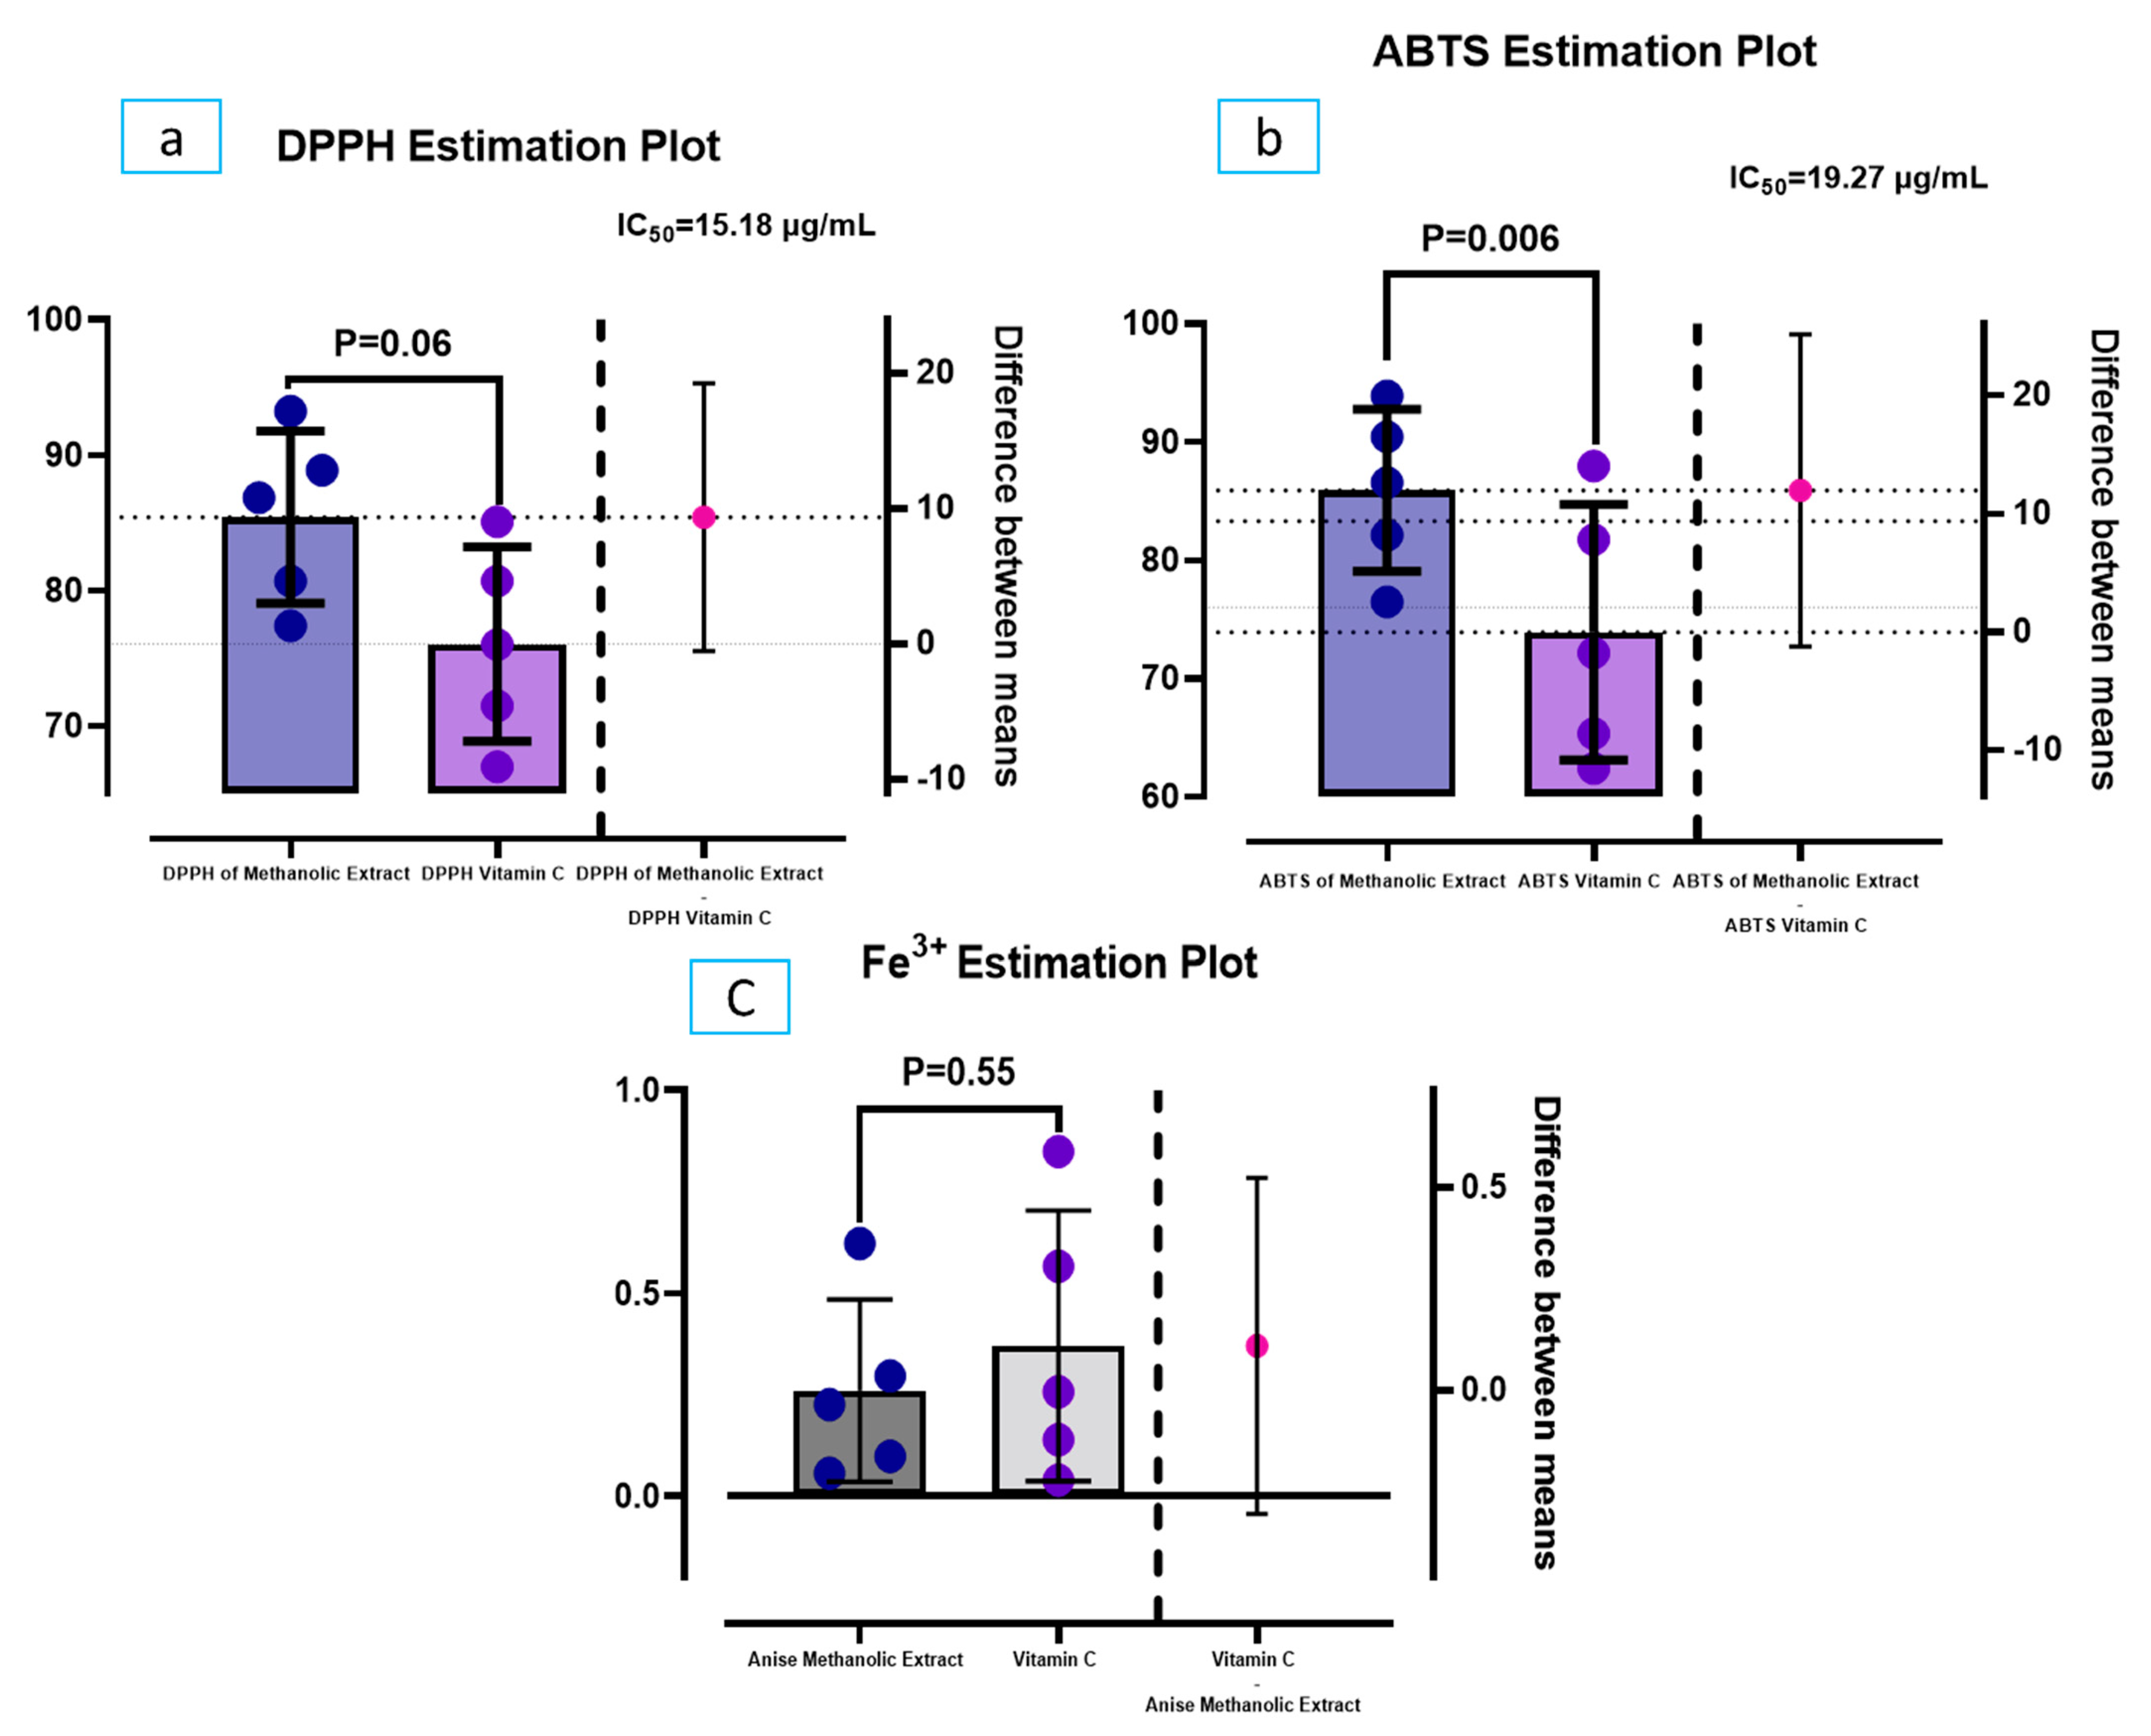
3.9. Total Antioxidant Activities

Based on the DPPH test, aniseed was compared to ascorbic acid for its ability to scavenge free radicals. There were statistically significant differences between aniseed methanolic extract and vitamin C, as revealed in (Figure 7a). Surprisingly, the presented results showed that aniseed methanolic extract appeared promising at scavenging DPPH radicals. When aniseed extraction concentration was increased from 100 to 1000 g/mL, the scavenging ability was significantly improved. A further study showed 15.18 µg/mL of extract had an IC50 in DPPH. Furthermore, (Figure 7b) shows the ABTS radicals at different concentrations. Aniseed extract showed activity at the lowest concentration, then gradually increased in activity with increasing concentration, with statistical differences compared with vitamin C. Aniseed extract had an IC50 of 19.27 µg/mL in the ABTS. Additionally, aniseed extract was tested for Fe3+ reductive ability using the Fe3+-Fe2+ transformation and compared to ascorbic acid as a reference material (Figure 7c). As the concentration of aniseed extracts increased, the reducing power increased. However, all of the extract concentrations showed lower activities than the control, and these differences were not statistically significant.

4. Discussion

In this study, antibiotic resistance was found to be high and alarming in tested isolates. Among them, five isolates showed the highest resistance to multiple antibiotics. Further identifications were undertaken by the VITEK2 system; the results of susceptibility testing for bacterial isolates by the VITEK 2 [32] method were compared with those of the manual method using pure cultures according to CLSI [33]. There was a high similarity between the manual susceptibility method agreement and the VITEK 2 system for the antibiotics used.
Although all of the bacteria exhibited some level of resistance to antibiotics, it was believed that penicillin, aztreonam, clindamycin, and erythromycin were the drugs to which the majority of the isolates were resistant. It is possible that antibiotic-resistant bacteria are simply normal bacteria that have undergone mutation as a result of widespread usage of broad-spectrum antibiotics [34]. It is typical practice for medical facilities such as hospitals and general clinics to administer antibiotics prior to obtaining results of culture and sensitivity tests [35]. It is also essential to keep in mind that genetic testing requires the allocation of large amounts of both technical and financial resources, which many clinical labs often lack [36].
Since the organisms that cause the disease and the rate of antibiotic resistance change over time and place, recent data may help physicians decide on best treatments [37]. This may help patients to receive the proper antibiotics, while the overuse of antibiotics, which leads to fast development of resistance, will be kept to a minimum [38,39].
In the current study, five isolates of the most drug-resistant bacteria were tested for antibacterial activity using aniseed extracts. The results of the experiment indicated that aniseed extract had a powerful effect on the bacteria tested. For instance, it inhibited the growth of Pseudomonas aeruginosa, the most sensitive species investigated, by producing a statistically significant inhibition zone. This assumed that phenolic compounds have a role in the antimicrobial activity of the aniseed extract.
However, our data revealed that Acinetobacter baumannii (17.56 mm) exhibited lesser sensitivity to the aniseed extract. Similarly, a study conducted by Kovač et al. [40] revealed that Staphylococcus aureus was more resistant to the antibacterial effects of both phenolic extracts of Alpinia katsumadai seeds and post-distillation extracts against Campylobacter jejuni [40]. Therefore, further research is necessary to examine how phenolic extracts affect bacteria and how they contribute to antimicrobial activity based on these findings.
It has been claimed that aniseed extract has antifungal qualities because of its anethole concentration [41,42]. Additionally, aniseed fractions in diethyl ether showed substantial antibiotic activity against MRSA, Pseudomonas aeruginosa, and Acinetobacter baumannii [43,44]. Additionally, anethole had far greater activity than other key components including anisyl alcohol, anisyl aldehyde, and anisyl acetone [45]. The non-polar components of essential oils have received the most attention in research on aniseed (low molecular weight volatile phenolic compounds) [46]. Moreover, it has been shown that aniseed’s non-polar components produce antimicrobial metabolites. Terpenoids and isoprenoids, which make up the bulk of plant essential oils and are the most varied class of biogenic volatile organic chemicals in plants [47], are greatly influenced by environmental and biotic variables, including light, temperature, soil water, and fertility [44].
Our data revealed the intriguing result that methanolic extract of aniseed inhibited the five selected isolates, especially Enterococcus faecalis and Pseudomonas aeruginosa. The MIC values for the extract against Enterococcus faecalis and Pseudomonas aeruginosa were determined to be approx. 95 and 125 mg/L, respectively, whereas the MBC was 190 and 250 mg/L, respectively. The results demonstrated substantial inhibition with promising antibacterial characteristics. The outcomes showed that the extract has a bactericidal action against the isolates that were tested. Moreover, measurements of killing time by the aniseed methanolic extract were shown in our study. At approximately 120 min, a methanolic extract of aniseed killed all isolates; however, the high activity of aniseed extract was revealed in the isolate of Pseudomonas aeruginosa. These results could be explained by the fact that the accelerated bacterial efflux pumps may be inhibited by the extract and shorten the time needed for the aniseed extract to diffuse inside the bacteria, contributing to bacterial inhibition [48,49].
The level of phenolic compounds found in plant tissues and the antibacterial activity of plant extracts are directly correlated with the pathogen’s level of resistance [50]. According to our findings, the principal components of the aniseed extract were estragole (4422.39 µg/g), cis-anethole (3150.11 µg/g), trans-anethole (2312.11 µg/g), and caffeic acid (652.32 µg/g), as determined by HPLC. The aniseed extract by HPLC is higher in phenolic compound content, which may explain its comparatively higher antibacterial activity. This study provided evidence that aniseed extract contains active inhibitors, including phenolic compounds, which could explain why these extracts are antibacterial. A similar pattern of findings was revealed for various plant materials as reported by [51], who demonstrated that furfural and phenolic components (mostly benzenetriol) are correlated to the antibacterial activity of pomegranate peels, jackfruit peels, and custard apple peels.
In our study, the high activity of aniseed extracts against these isolates may be due to their phenolic structure, as the hydroxyl groups in their structures make it possible for them to pass into the cell and permeabilize the cytoplasmic membrane [52], leading to distressed cellular metabolism [53]. The quantification of estragole in our study showed that the concentrations of this compound were high enough to prove that it was capable of inhibiting the growth of multidrug-resistant (MDR) bacteria. This indicates that estragole may be an effective antimicrobial agent against these types of bacteria. These results prove that other studies revealed that the majority of trans-anethole, fenchone, estragole, and limonene was also observed in the composition of aniseed essential oils [54]. These findings showed that trans-anethole and estragole for aniseed extract were two separate chemotypes of aniseed essential oils in the current study. Trans-anethol and estragole are typically the two primary ingredients in aniseed [55]. The amount of these chemicals accumulated varied greatly according to the seed’s area and vegetative stage [56].
Our extract also contains the caffeic acid ester of 3-(3,4-dihydroxyphenyl)-lactic acid, which has shown possible antibacterial activity, especially with gram-positive bacteria such as MRSA [57]. The combination of rosmarinic acid and vancomycin may also be effective against MRSA [57]. Numerous epidemiological studies have demonstrated that flavonoids and their glycosides have versatile health benefits [58,59]. It is not surprising that flavonoids have broad-spectrum antibacterial activity both in vitro and in vivo because they are synthesised in response to microbial attacks in plants [60,61]. Instead of having a single unique site of action, there are numerous cellular targets; several flavonoids detected in our analysis, including catechin, apegenin-7-O-glucoside, rutin, quercitin rhamnoside, kaempferol-O-rutinoside, trans-ferulic acid, eucalyptol, gibberellic acid, isochiapin, hexadecadienoic acid, and luteolin, possess potent antibacterial activity. In addition to exerting antibacterial effects, eugenol rutinoside is a volatile phenolic compound in the phenylpropene class found in many plant species [62,63].
A previous study demonstrated that eugenol has antibacterial properties against bacteria resistant to antibiotics, such as A. baumannii and Staphylococcus spp. It has been shown that glycosylation of eugenol enhances its antibacterial properties, particularly against Staphylococcus spp. and E. coli [64].
In antioxidant studies, aniseed methanol extracts scavenged DPPH radicals better than vitamin C, with an IC50 of 17.92 g/mL. Similarly, [65] discovered that fennel extracts had potent antiradical properties. Bulgarian fennel seed extract had low antiradical activity (IC50 = 113.19 mL/L), according to [66]. Previous research has shown that essential oils and extracts of aniseed have antioxidant properties [46,67]. Our knowledge of these compounds from aniseed is limited. A metabolic process in the body creates an oxidative stress state that creates free radicals that can lead to body damage if they are at risky levels [68]. Due to its high phenolic and flavonoid content, aniseed extract showed promising activity as an antioxidant agent [69,70]. According to Danilenko et al. [71], aniseed polar fractions may be useful as antibiotics and antioxidants in biopharmaceuticals. As alternatives to the plant extracts, the natural metabolites of some lactobacilli possess antimicrobial, antifungal, antioxidant, and anti-inflammatory effects and can be used as a metabiotic in medicine.
In conclusion, the selected MDR bacterial isolates were significantly inhibited by aniseed extract; this suggests that it could be a promising natural compound for treating drug-resistant bacteria infections, providing it as a viable anti-virulence option. The mechanism of its antimicrobial action could be attributed to the presence of phenolic compounds in the extract. Further, this study revealed significant variation in the biochemical composition of Egyptian aniseed. Among the oxygenated monoterpenes of aniseeds analyzed by HPLC, estragole, cis-anethole, and trans-anethole constituted the majority of the aniseed extract. The quantification results of LC–MS/MS showed that estragole was present in higher concentrations. Furthermore, its presence in higher concentrations suggests that it could be the active compound responsible for the observed antibacterial effect. The antioxidant capacity of aniseed extracts was observed to be stronger than that of vitamin C, which suggests that it is a powerful antioxidant with potential health benefits. Additionally, the compounds in aniseed may be synergistic with existing antibacterial treatments, which could lead to more effective treatments for bacterial infections.

Supplementary Materials

The following supporting information can be downloaded at https://www.mdpi.com/article/10.3390/microorganisms11041024/s1: Results of the VITEK 2 biochemical testing for high resistant isolate.

Author Contributions

Conceptualization, A.E., A.N.A., D.M.B., H.A.A. and M.G.H.; formal analysis, A.E., E.S.A., M.G.H. and D.M.B.; investigation, M.G.H., A.E. and A.N.A.; project administration, M.G.H., A.E. and H.A.A.; software, A.E.; validation A.E. and A.N.A.; visualization, M.G.H., A.E. and A.N.A.; writing—original draft, A.E.; writing—review and editing, A.E. All authors have read and agreed to the published version of the manuscript.

Funding

This research received no external funding.

Data Availability Statement

All data generated or analyzed during this study are included in this published article (and its Supplementary Information files).

Conflicts of Interest

The authors affirm that no financial or commercial relationships that may be viewed as having a conflict of interest existed throughout the study’s execution.

References

  1. Nwobodo, D.C.; Ugwu, M.C.; Anie, C.O.; Al-Ouqaili, M.T.S.; Ikem, J.C.; Chigozie, U.V.; Saki, M. Antibiotic resistance: The challenges and some emerging strategies for tackling a global menace. J. Clin. Lab. Anal. 2022, 36, e24655. [Google Scholar] [CrossRef] [PubMed]
  2. Lamut, A.; Peterlin Mašič, L.; Kikelj, D.; Tomašič, T. Efflux pump inhibitors of clinically relevant multidrug resistant bacteria. Med. Res. Rev. 2019, 39, 2460–2504. [Google Scholar] [CrossRef]
  3. Sameiyan, E.; Hayes, A.W.; Karimi, G. The effect of medicinal plants on multiple drug resistance through autophagy: A review of in vitro studies. Eur. J. Pharmacol. 2019, 852, 244–253. [Google Scholar] [CrossRef] [PubMed]
  4. Moghtaderi, M.; Mirzaie, A.; Zabet, N.; Moammeri, A.; Mansoori-Kermani, A.; Akbarzadeh, I.; Yeganeh, F.E.; Chitgarzadeh, A.; Kashtali, A.B.; Ren, Q. Enhanced antibacterial activity of Echinacea angustifolia extract against multidrug-resistant Klebsiella pneumoniae through niosome encapsulation. Nanomaterials 2021, 11, 1573. [Google Scholar] [CrossRef] [PubMed]
  5. Abass, S.; Parveen, R.; Irfan, M.; Jan, B.; Husain, S.A.; Ahmad, S. Synergy Based Extracts of Medicinal Plants: Future Antimicrobials to Com-bat Multidrug Resistance. Curr. Pharm. Biotechnol. 2022, 23, 1527–1540. [Google Scholar] [PubMed]
  6. Süntar, I. Importance of ethnopharmacological studies in drug discovery: Role of medicinal plants. Phytochem. Rev. 2020, 19, 1199–1209. [Google Scholar] [CrossRef]
  7. Akhtar, N.; Mirza, B. Phytochemical analysis and comprehensive evaluation of antimicrobial and antioxidant properties of 61 medicinal plant species. Arab. J. Chem. 2018, 11, 1223–1235. [Google Scholar] [CrossRef] [Green Version]
  8. Mohr, K.I. History of antibiotics research. How Overcome Antibiot Cris. 2016, 237–272. [Google Scholar]
  9. Mukunda, A.; Pynadath, M.K.; Kadar, N.; Mohan, A. Cytotoxic effect of anise seed (Pimpinella anisum) extract on KB cell line-a comparative study with CISPLATIN. Oral Maxillofac. Pathol. J. 2020, 11, 6–10. [Google Scholar]
  10. Sarheed, N.M.; Jaffat, H.S. Protective effect of anise extract loaded by chitosan nanoparticles in mice treated with cisplatin. AIP Conf. Proc. 2022, 2450, 20026. [Google Scholar]
  11. Sakr, A.A.E.; Taha, K.M.; Abozid, M.M.; El-saed, H.E.Z. Comparative study between anise seeds and mint leaves (chemical composition, phenolic compounds and flavonoids). Menoufia J. Agric. Biotechnol. 2019, 4, 53–60. [Google Scholar] [CrossRef]
  12. Othman, L.; Sleiman, A.; Abdel-Massih, R.M. Antimicrobial activity of polyphenols and alkaloids in middle eastern plants. Front. Microbiol. 2019, 10, 911. [Google Scholar] [CrossRef] [PubMed]
  13. Giannenas, I.; Sidiropoulou, E.; Bonos, E.; Christaki, E.; Florou-Paneri, P. The history of herbs, medicinal and aromatic plants, and their extracts: Past, current situation and future perspectives. In Feed Additives; Elsevier: Amsterdam, The Netherlands, 2020; pp. 1–18. [Google Scholar]
  14. Sengul, M.; Yildiz, H.; Gungor, N.; Cetin, B.; Eser, Z.; Ercisli, S. Total phenolic content, antioxidant and antimicrobial activities of some medicinal plants. Pak. J. Pharm. Sci. 2009, 22, 102–106. [Google Scholar]
  15. Bandaranayake, W.M. Quality control, screening, toxicity, and regulation of herbal drugs. Mod. Phytomedicine Turn. Med. Plants Drugs 2006, 25–57. [Google Scholar]
  16. Elshafie, H.S.; Gruľová, D.; Baranová, B.; Caputo, L.; De Martino, L.; Sedlák, V.; Camele, I.; De Feo, V. Antimicrobial activity and chemical composition of essential oil extracted from Solidago canadensis L. growing wild in Slovakia. Molecules 2019, 24, 1206. [Google Scholar] [CrossRef] [Green Version]
  17. Sen, A.; Batra, A. Evaluation of antimicrobial activity of different solvent extracts of medicinal plant: Melia azedarach L. Int. J. Curr. Pharm. Res. 2012, 4, 67–73. [Google Scholar]
  18. Hosseinzadeh, S.; Jafarikukhdan, A.; Hosseini, A.; Armand, R. The application of medicinal plants in traditional and modern medicine: A review of Thymus vulgaris. Int. J. Clin. Med. 2015, 6, 635. [Google Scholar] [CrossRef] [Green Version]
  19. Saad, B.; Azaizeh, H.; Said, O. Tradition and perspectives of Arab herbal medicine: A review. Evid.-Based Complement. Altern. Med. 2005, 2, 475–479. [Google Scholar] [CrossRef] [Green Version]
  20. Odey, M.O.; Iwara, I.A.; Udiba, U.U.; Johnson, J.T.; Inekwe, U.V.; Asenye, M.E.; Victor, O. Preparation of plant extracts from indigenous medicinal plants. Int. J. Sci. Technol. 2012, 1, 688–692. [Google Scholar]
  21. Hudzicki, J. Kirby-Bauer disk diffusion susceptibility test protocol. Am. Soc. Microbiol. 2009, 15, 55–63. [Google Scholar]
  22. Guo, L.; Ye, L.; Zhao, Q.; Ma, Y.; Yang, J.; Luo, Y. Comparative study of MALDI-TOF MS and VITEK 2 in bacteria identification. J. Thorac. Dis. 2014, 6, 534. [Google Scholar] [PubMed]
  23. Zaidan, M.R.; Noor Rain, A.; Badrul, A.R.; Adlin, A.; Norazah, A.; Zakiah, I. In vitro screening of five local medicinal plants for antibacterial activity using disc diffusion method. Trop. Biomed. 2005, 22, 165–170. [Google Scholar] [PubMed]
  24. Eloff, J.N. A sensitive and quick microplate method to determine the minimal inhibitory concentration of plant extracts for bacteria. Planta Med. 1998, 64, 711–713. [Google Scholar] [CrossRef] [PubMed] [Green Version]
  25. Wiegand, I.; Hilpert, K.; Hancock, R.E.W. Agar and broth dilution methods to determine the minimal inhibitory concentration (MIC) of antimicrobial substances. Nat. Protoc. 2008, 3, 163. [Google Scholar] [CrossRef]
  26. Akinjogunla, O.J.; Umo, A.N.; Alozie, M.F.; Oshosanya, G.O.; Saturday, G.I. Antibacterial activity and time kill kinetics of Amlodipine, Thioridazine and Promethazine against pathogenic clinical bacterial isolates. Afr. J. Clin. Exp. Microbiol. 2021, 22, 397–406. [Google Scholar] [CrossRef]
  27. Michailidis, D.; Angelis, A.; Nikolaou, P.E.; Mitakou, S.; Skaltsounis, A.L. Exploitation of vitis vinifera, Foeniculum vulgare, cannabis sativa and punica granatum by-product seeds as dermo-cosmetic agents. Molecules 2021, 26, 731. [Google Scholar] [CrossRef]
  28. Safaei-Ghomi, J.; Ebrahimabadi, A.H.; Djafari-Bidgoli, Z.; Batooli, H. GC/MS analysis and in vitro antioxidant activity of essential oil and methanol extracts of Thymus caramanicus Jalas and its main constituent carvacrol. Food Chem. 2009, 115, 1524–1528. [Google Scholar] [CrossRef]
  29. Marinova, G.; Batchvarov, V. Evaluation of the methods for determination of the free radical scavenging activity by DPPH. Bulg. J. Agric. Sci. 2011, 17, 11–24. [Google Scholar]
  30. Re, R.; Pellegrini, N.; Proteggente, A.; Pannala, A.; Yang, M.; Rice-Evans, C. Antioxidant activity applying an improved ABTS radical cation decolorization assay. Free Radic. Biol. Med. 1999, 26, 1231–1237. [Google Scholar] [CrossRef]
  31. Ferreira, I.C.F.R.; Baptista, P.; Vilas-Boas, M.; Barros, L. Free-radical scavenging capacity and reducing power of wild edible mushrooms from northeast Portugal: Individual cap and stipe activity. Food Chem. 2007, 100, 1511–1516. [Google Scholar] [CrossRef]
  32. Class, R.; Class, I.I.; BioMerieux, Inc. Jolyn Tenllado Regulatory Affairs Expert 595 Anglum Road Hazelwood, Missouri 63042. 2020. Available online: https://www.accessdata.fda.gov/cdrh_docs/pdf19/K193572.pdf (accessed on 13 March 2020).
  33. Said, A.; El-Gamal, M.S.; Abu-Elghait, M.; Salem, S.S. Isolation, Identification and Antibiotic Susceptibility Pattern of Urinary Tract Infection Bacterial Isolates. Lett. Appl. NanoBioSci. 2021, 10, 2820–2830. [Google Scholar]
  34. Davies, J. Microbes have the last word: A drastic re-evaluation of antimicrobial treatment is needed to overcome the threat of antibiotic-resistant bacteria. EMBO Rep. 2007, 8, 616–621. [Google Scholar] [CrossRef] [PubMed]
  35. Leekha, S.; Terrell, C.L.; Edson, R.S. General principles of antimicrobial therapy. In Mayo Clinic Proceedings; Elsevier: Amsterdam, The Netherlands, 2011; pp. 156–167. [Google Scholar]
  36. Mattocks, C.J.; Morris, M.A.; Matthijs, G.; Swinnen, E.; Corveleyn, A.; Dequeker, E.; Müller, C.R.; Pratt, V.; Wallace, A. A standardized framework for the validation and verification of clinical molecular genetic tests. Eur. J. Hum. Genet. 2010, 18, 1276–1288. [Google Scholar] [CrossRef] [PubMed] [Green Version]
  37. Shlaes, D.M.; Gerding, D.N.; John, J.F.; Craig, W.A.; Bornstein, D.L.; Duncan, R.A.; Eckman, M.R.; Farrer, W.E.; Greene, W.H.; Lorian, V.; et al. Society for Healthcare Epidemiology of America and Infectious Diseases Society of America Joint Committee on the Prevention of Antimicrobial Resistance guidelines for the prevention of antimicrobial resistance in hospitals. Infect. Control. Hosp. Epidemiol. 1997, 18, 275–291. [Google Scholar] [CrossRef] [PubMed]
  38. Machowska, A.; Stålsby Lundborg, C. Drivers of irrational use of antibiotics in Europe. Int. J. Environ. Res. Public Health 2019, 16, 27. [Google Scholar] [CrossRef] [Green Version]
  39. Laxminarayan, R.; Duse, A.; Wattal, C.; Zaidi, A.K.M.; Wertheim, H.F.L.; Sumpradit, N.; Vlieghe, E.; Hara, G.L.; Gould, I.M.; Goossens, H.; et al. Antibiotic resistance—The need for global solutions. Lancet Infect. Dis. 2013, 13, 1057–1098. [Google Scholar] [CrossRef] [Green Version]
  40. Kovač, J.; Gavarić, N.; Bucar, F.; Smole Možina, S. Antimicrobial and resistance modulatory activity of Alpinia katsumadai seed phenolic extract, essential oil and post-distillation extract. Food Technol. Biotechnol. 2014, 52, 248–254. [Google Scholar]
  41. Sharafan, M.; Jafernik, K.; Ekiert, H.; Kubica, P.; Kocjan, R.; Blicharska, E.; Szopa, A. Illicium verum (Star Anise) and Trans-Anethole as valuable raw materials for medicinal and cosmetic applications. Molecules 2022, 27, 650. [Google Scholar] [CrossRef]
  42. Huang, Y.; Zhao, J.; Zhou, L.; Wang, J.; Gong, Y.; Chen, X.; Guo, Z.; Wang, Q.; Jiang, W. Antifungal activity of the essential oil of Illicium verum fruit and its main component trans-anethole. Molecules 2010, 15, 7558–7569. [Google Scholar] [CrossRef]
  43. Salem, M.A.; El-Shiekh, R.A.; Hashem, R.A.; Hassan, M. In vivo antibacterial activity of star anise (Illicium verum Hook.) Extract Using Murine MRSA skin infection model in relation to its metabolite profile. Infect. Drug. Resist. 2021, 14, 33. [Google Scholar] [CrossRef]
  44. Bin Muhsinah, A.; Maqbul, M.S.; Mahnashi, M.H.; Jalal, M.M.; Altayar, M.A.; Saeedi, N.H.; Alshehri, O.M.; Shaikh, I.A.; Khan, A.A.L.; Iqubal, S.S.; et al. Antibacterial activity of Illicium verum essential oil against MRSA clinical isolates and determination of its phyto-chemical components. J. King Saud Univ. 2022, 34, 101800. [Google Scholar] [CrossRef]
  45. Yang, J.-F.; Yang, C.-H.; Chang, H.-W.; Wang, S.-M.; Hsieh, M.-C.; Chuang, L.-Y. Chemical composition and antibacterial activities of Illicium verum against antibiotic-resistant pathogens. J. Med. Food. 2010, 13, 1254–1262. [Google Scholar] [CrossRef] [PubMed]
  46. Yu, C.; Zhang, J.; Wang, T. Star anise essential oil: Chemical compounds, antifungal and antioxidant activities: A review. J. Essent. Oil Res. 2021, 33, 1–22. [Google Scholar] [CrossRef]
  47. Bohlmann, J.; Keeling, C.I. Terpenoid biomaterials. Plant. J. 2008, 54, 656–669. [Google Scholar] [CrossRef]
  48. Soto, S.M. Role of efflux pumps in the antibiotic resistance of bacteria embedded in a biofilm. Virulence 2013, 4, 223–229. [Google Scholar] [CrossRef] [PubMed] [Green Version]
  49. Uddin, T.M.; Chakraborty, A.J.; Khusro, A.; Zidan, B.M.R.M.; Mitra, S.; Emran, T.B.; Dhama, K.; Ripon, K.H.; Gajdács, M.; Sahibzada, M.U.K.; et al. Antibiotic resistance in microbes: History, mechanisms, therapeutic strategies and future prospects. J. Infect. Public Health 2021, 14, 1750–1766. [Google Scholar] [CrossRef] [PubMed]
  50. Silva-Beltrán, N.P.; Ruiz-Cruz, S.; Cira-Chávez, L.A.; Estrada-Alvarado, M.I.; Ornelas-Paz, J.D.J.; López-Mata, M.A.; Del-Toro-Sánchez, D.L.; Ayala-Zavala, J.F.; Márquez-Ríos, E. Total phenolic, flavonoid, tomatine, and tomatidine contents and antioxidant and antimicrobial activities of extracts of tomato plant. Int. J. Anal. Chem. 2015, 2015, 284071. [Google Scholar] [CrossRef] [Green Version]
  51. Roy, S.; Lingampeta, P. Solid wastes of fruits peels as source of low cost broad spectrum natural antimicrobial compounds-furanone, furfural and benezenetriol. Int. J. Res. Eng. Technol. 2014, 3, 273–279. [Google Scholar]
  52. Welscher, Y.M.T.; van Leeuwen, M.R.; de Kruijff, B.; Dijksterhuis, J.; Breukink, E. Polyene antibiotic that inhibits membrane transport proteins. Proc. Natl. Acad. Sci. USA 2012, 109, 11156–11159. [Google Scholar] [CrossRef] [Green Version]
  53. Grandinetti, G.; Smith, A.E.; Reineke, T.M. Membrane and nuclear permeabilization by polymeric pDNA vehicles: Efficient method for gene delivery or mechanism of cytotoxicity? Mol. Pharm. 2012, 9, 523–538. [Google Scholar] [CrossRef]
  54. Díaz-Maroto, M.C.; Díaz-Maroto Hidalgo, I.J.; Sánchez-Palomo, E.; Pérez-Coello, M.S. Volatile components and key odorants of Fennel (Foeniculum vulgare Mill.) and Thyme (Thymus vulgaris L.) oil extracts obtained by simultaneous distillation− extraction and supercritical fluid extraction. J. Agric. Food Chem. 2005, 53, 5385–5389. [Google Scholar] [CrossRef]
  55. Anwar, F.; Ali, M.; Hussain, A.I.; Shahid, M. Antioxidant and antimicrobial activities of essential oil and extracts of fennel (Foeniculum vulgare Mill.) seeds from Pakistan. Flavour. Fragr. J. 2009, 24, 170–176. [Google Scholar] [CrossRef]
  56. Thuesombat, P.; Hannongbua, S.; Akasit, S.; Chadchawan, S. Effect of silver nanoparticles on rice (Oryza sativa L. cv. KDML 105) seed germination and seedling growth. Ecotoxicol. Environ. Saf. 2014, 104, 302–309. [Google Scholar] [CrossRef] [PubMed]
  57. Ekambaram, S.P.; Perumal, S.S.; Balakrishnan, A.; Marappan, N.; Gajendran, S.S.; Viswanathan, V. Antibacterial synergy between rosmarinic acid and antibiotics against methicillin-resistant Staphylococcus aureus. J. Intercult. Ethnopharmacol. 2016, 5, 358. [Google Scholar] [CrossRef] [PubMed]
  58. Kumar, S.; Pandey, A.K. Chemistry and biological activities of flavonoids: An overview. Sci. World J. 2013, 2013, 162750. [Google Scholar] [CrossRef] [Green Version]
  59. Sangeetha, K.S.S.; Umamaheswari, S.; Reddy, C.U.M.; Kalkura, S.N. Flavonoids: Therapeutic potential of natural pharmacological agents. Int. J. Pharm. Sci. Res. 2016, 7, 3924. [Google Scholar]
  60. Nenaah, G. Antimicrobial activity of Calotropis procera Ait. (Asclepiadaceae) and isolation of four flavonoid glycosides as the active constituents. World J. Microbiol. Biotechnol. 2013, 29, 1255–1262. [Google Scholar] [CrossRef]
  61. Kopel, J.; McDonald, J.; Hamood, A. An Assessment of the In Vitro Models and Clinical Trials Related to the Antimicrobial Activities of Phytochemicals. Antibiotics 2022, 11, 1838. [Google Scholar] [CrossRef]
  62. Pinto, T.; Aires, A.; Cosme, F.; Bacelar, E.; Morais, M.; Oliveira, I.; Ferreira-Cardoso, J.; Anjos, R.; Vilela, A.; Gonçalves, B. Bioactive (Poly) phenols, volatile compounds from vegetables, medicinal and aromatic plants. Foods 2021, 10, 106. [Google Scholar] [CrossRef]
  63. Rather, M.A.; Dar, B.A.; Sofi, S.N.; Bhat, B.A.; Qurishi, M.A. Foeniculum vulgare: A comprehensive review of its traditional use, phytochemistry, pharmacology, and safety. Arab. J. Chem. 2016, 9, S1574–S1583. [Google Scholar] [CrossRef] [Green Version]
  64. Marchese, A.; Barbieri, R.; Coppo, E.; Orhan, I.E.; Daglia, M.; Nabavi, S.M.; Izadi, M.; Abdollahi, M.; Ajami, M. Antimicrobial activity of eugenol and essential oils containing eugenol: A mechanistic viewpoint. Crit. Rev. Microbiol. 2017, 43, 668–689. [Google Scholar] [CrossRef] [PubMed]
  65. Kalleli, F.; Rebey, I.B.; Wannes, W.A.; Boughalleb, F.; Hammami, M.; Tounsi, M.S.; M’Hamdi, M. Chemical composition and antioxidant potential of essential oil and methanol extract from Tunisian and French fennel (Foeniculum vulgare Mill.) seeds. J. Food Biochem. 2019, 43, e12935. [Google Scholar] [CrossRef] [PubMed]
  66. Rebey, I.B.; Bourgou, S.; Wannes, W.A.; Selami, I.H.; Tounsi, M.S.; Marzouk, B.; Fauconnier, M.-L.; Ksouri, R. Comparative assessment of phytochemical profiles and antioxidant properties of Tunisian and Egyptian anise (Pimpinella anisum L.) seeds. Plant Biosyst.-Int. J. Deal. All Asp. Plant Biol. 2018, 152, 971–978. [Google Scholar]
  67. Nasır, A.; Yabalak, E. Investigation of antioxidant, antibacterial, antiviral, chemical composition, and traditional medicinal properties of the extracts and essential oils of the Pimpinella species from a broad perspective: A review. J. Essent. Oil Res. 2021, 33, 411–426. [Google Scholar] [CrossRef]
  68. Rani, V.; Deep, G.; Singh, R.K.; Palle, K.; Yadav, U.C.S. Oxidative stress and metabolic disorders: Pathogenesis and therapeutic strategies. Life Sci. 2016, 148, 183–193. [Google Scholar] [CrossRef] [PubMed]
  69. El-Kersh, D.M.; Mostafa, N.M.; Fayez, S.; Al-Warhi, T.; Abourehab, M.A.S.; Eldehna, W.M.; Salem, M.A. GC-MS metabolites profiling of anethole-rich oils by different extraction techniques: Antioxidant, cytotoxicity and in-silico enzymes inhibitory insights. J. Enzym. Inhib. Med. Chem. 2022, 37, 1974–1986. [Google Scholar] [CrossRef]
  70. Kimondo, J.W. An Evaluation of Antioxidant and Anti-Inflammatory Effects of Natural Foods and Medicinal Plants of the Ilkisonko Maasai Community, Kenya. 2020. Available online: http://erepository.uonbi.ac.ke/handle/11295/154650 (accessed on 30 June 2020).
  71. Danilenko, V.N.; Devyatkin, A.V.; Marsova, M.V.; Shibilova, M.U.; Ilyasov, R.A.; Shmyrev, V.I. Common inflammatory mechanisms in COVID-19 and Parkinson’s diseases: The role of microbiome, pharmabiotics and postbiotics in their prevention. J. Inflamm. Res. 2021, 14, 6349–6381. [Google Scholar] [CrossRef]
Figure 1. Time-kill experiment of (A) Enterococcus faecalis; (B) Staphylococcus aureus; (C) Salmonella typhi; (D) Pseudomonas aeruginosa; (E) Acinetobacter baumannii. After 3 h, the relative viable count of each isolate was measured against aniseed extract and expressed as CFU/mL (% of the control). All bacteria were in the logarithmic phase at the beginning of the experiment, and aliquots were taken at 0, 0.5, 1, 1.5, 2, 3, 4, and 6. The viable colony counts on blood agar were determined as CFU/mL.
Microorganisms 11 01024 g001
Figure 2. Chromatogram of aniseed HPLC. Estragole, cis-anethole, and trans-anethole had the highest RTs at 11.52, 2.82, and 3.55, respectively.
Microorganisms 11 01024 g002
Figure 3. GC–MS spectrum of aniseed methanolic extract.
Microorganisms 11 01024 g003
Figure 4. Representative chromatogram for selectivity of (A) blank standard and IS blank, and (B) zero standard and IS extract.
Microorganisms 11 01024 g004
Figure 5. Calibration curve for the mean area ratio of estragole concentration (ranging from 0.50 to 75.0 ng/mL).
Microorganisms 11 01024 g005
Figure 6. Quantitative analysis of estragole in aniseed. (A) Aniseed fragment ions for estragole standard. (B) Estragole peak retention time was revealed at 1.39. (C) p-anisaldehyde internal standard peak retention time was observed at 1.52.
Microorganisms 11 01024 g006
Figure 7. (a) DPPH scavenging assay of aniseed methanolic extract and Vit C. (b) ABTS scavenging assay of aniseed methanolic extract and Vit C. (c) Reducing power scavenging assay of aniseed methanolic extract and Vit C. Results are mean ± SD of five equivalent measurements. Experiment was carried in triplicate. p value < 0.05 when compared to Vit C.
Microorganisms 11 01024 g007
Table 1. The antibiotic susceptibility test for all studied isolates.
Isolate
Code
PAMCVAAXSAMFATMCPZCDACNTEEOFXNORSXT
E. faecalis
n = 4
10080100758891100377891999179100100100
S. aureus
n = 11
1009592947949I0074718797798499100100
S. typhi
n = 9
10010078919269929793989972881009294
P. aeruginosa
n = 7
1009291897955908844941006691938893
A. baumannii
n = 6
1009749I597910081579695491009710098
Abbreviations: E. faecalis: Enterococcus faecalis; S. aureus: Staphylococcus aureus; S. typhi: Salmonella typhi; P. aeruginosa: Pseudomonas aeruginosa; A. baumannii: Acinetobacter baumannii; P: penicillin; AMC: amoxicillin/clavulanate; VA: vancomycin; SAM: ampicillin/sulbactam; F: nitrofurantoin; ATM: aztreonam; CPZ: cefoperazone; C: chloramphenicol; CN: gentamicin; TE: tetracycline; E: erythromycin; OFX: ofloxacin; NOR: norfloxacin; and SXT: trimethoprim/sulfamethoxazole.
Table 2. VITEK 2 system for the identification and susceptibility testing of Enterococcus faecalis.
AntimicrobialMICInterpretationAntimicrobialMICInterpretation
ESBLPOS+Meropenem1 ≤ 0.25R
Ampicillin≥32RAmikacin≥2R
Ampicillin/sulbactam4SGentamicin≥16R
Clindamycin≥64SErythromycin8R
Ceftriaxone≥64RCiprofloxacin≤4R
Cefepime2INorfloxacin≤64R
Aztreonam16RVancomycin≤0.5R
Ertapenem≤0.5RNitrofurantoin≤16R
Imipenem≤0.25RTrimethoprim/sulfamethoxazole≤32R
Table 3. VITEK 2 system for the identification and susceptibility testing of Staphylococcus aureus.
AntimicrobialMICInterpretationAntimicrobialMICInterpretation
ESBLPOS+Meropenem1 ≤ 0.25R
Ampicillin≥32RAmikacin≥2R
Ampicillin/sulbactam4SGentamicin≥16R
Clindamycin≥64RErythromycin8I
Ceftriaxone≥64RCiprofloxacin≤4R
Cefepime2RNorfloxacin≤64R
Aztreonam16RVancomycin≤0.5S
Ertapenem≤0.5RNitrofurantoin≤16R
Imipenem≤0.25RTrimethoprim/sulfamethoxazole≤32R
Table 4. VITEK 2 system for the identification and susceptibility testing of Salmonella typhi.
AntimicrobialMICInterpretationAntimicrobialMICInterpretation
ESBLPOS+Meropenem1 ≤ 0.25R
Ampicillin≥32RAmikacin≥2R
Ampicillin/sulbactam4SGentamicin≥16R
Clindamycin≥64RErythromycin8R
Ceftriaxone≥64ICiprofloxacin≤4R
Cefepime2RNorfloxacin≤64R
Aztreonam16RVancomycin≤0.5I
Ertapenem≤0.5RNitrofurantoin≤16R
Imipenem≤0.25RTrimethoprim/sulfamethoxazole≤32R
Table 5. VITEK 2 system for the identification and susceptibility testing of Pseudomonas aeruginosa.
AntimicrobialMICInterpretationAntimicrobialMICInterpretation
ESBLPOS+Meropenem1 ≤ 0.25R
Ampicillin≥32RAmikacin≥2R
Ampicillin/sulbactam4RGentamicin≥16R
Clindamycin≥64RErythromycin8I
Ceftriaxone≥64RCiprofloxacin≤4R
Cefepime2RNorfloxacin≤64S
Aztreonam16RVancomycin≤0.5S
Ertapenem≤0.5RNitrofurantoin≤16R
Imipenem≤0.25RTrimethoprim/sulfamethoxazole≤32R
Table 6. VITEK 2 system for the identification and susceptibility testing of Acinetobacter baumannii.
AntimicrobialMICInterpretationAntimicrobialMICInterpretation
ESBLPOS+Meropenem1 ≤ 0.25R
Ampicillin≥32RAmikacin≥2S
Ampicillin/sulbactam4RGentamicin≥16S
Clindamycin≥64RErythromycin8R
Ceftriaxone≥64RCiprofloxacin≤4S
Cefepime2RNorfloxacin≤64R
Aztreonam16RVancomycin≤0.5R
Ertapenem≤0.5RNitrofurantoin≤16R
Imipenem≤0.25RTrimethoprim/sulfamethoxazole≤32R
Table 7. Antimicrobial activity of aniseed methanolic extract against multidrug-resistant bacteria.
IsolateAniseed Methanolic ExtractAmikacin (10 µg/disc)Negative Control
(DMSO, 100 µL)
Enterococcus faecalis18.32 ± 0.5 ab14.27 ± 0.2 ab0.0 ± 0.0
Staphylococcus aureus19.88 ± 0.3 ab16.23 ± 0.1 ab0.0 ± 0.0
Salmonella typhi21.33 ± 0.5 ab20.31 ± 0.3 ab0.0 ± 0.0
Pseudomonas aeruginosa22.86 ± 0.5 ab18.56 ± 0.2 ab0.0 ± 0.0
Acinetobacter baumannii17.56 ± 0.2 ab15.50 ± 0.5 ab0.0 ± 0.0
The mean values (within rows) with different superscripts are significantly different (p < 0.05).
Table 8. MIC and MBC of aniseed extract against isolated bacteria.
IsolateMIC (µg/mL)MBC (µg/mL)
Enterococcus faecalis95190
Staphylococcus aureus125250
Salmonella typhi130260
Pseudomonas aeruginosa125250
Acinetobacter baumannii170340
Table 9. HPLC/MS analysis of aniseed extract.
Phenolic CompoundsConc. (µg/g)RT (min)
Cis-anethole3150.112.82
trans-anethole2312.113.55
Ellagic acid623.544.01
Catechin357.234.52
Kaempferol-O-rutinoside96.325.24
Syringic acid521.495.92
Pyro catechol578.316.04
Eugenol rutinoside234.567.13
O-coumaric acid578.778.11
Vanillin52.368.31
Trans-ferulic acid324.579.32
Naringenin211.239.53
Caffeic acid652.329.75
Rosmarinic acid96.3210.55
Quercitin rhamnoside632.3210.17
Estragole4422.3911.52
Quercitin rhamnoside632.3212.11
Trans-cinnamic37.2512.97
Luteolin23.6513.92
Apegenin-7-O-glucoside55.6215.72
Table 10. Chemical composition of aniseed extract After GC analysis.
IdentificationRT (min)Area %Peak Area
Linolenic acid5.380.3710,147,157.35
Eucalyptol5.451.0829,892,305.40
L-Fenchone6.703.73103,381,896.04
2-9,12-Octadecadienyloxy8.110.4211,620,299.63
Estragole9.4966.851,853,324,123.57
5,7-Dodecadiyn-1,12-diol13.480.369,973,126.83
Caryophyllene15.030.9526,230,030.91
1,3-Benzodioxole19.760.4311,818,138.28
Gibberellic acid20.63.4612,978,627.00
Pentadecanoic acid26.291.0529,100,222.44
Palmitic acid28.604.26118,101,239.86
7,10-octadecadienoic acid29.420.8824,453,817.51
9-octadecenoic acid29.582.3565,019,938.64
Cyclopropanebutanoic acid30.080.369,960,494.88
9,12-octadecadienoic acid31.530.5715,750,740.24
Petroselinic acid31.632.7275,269,544.77
Isochiapin b32.790.246,778,401.90
1-Heptatriacotanol33.000.6117,018,655.01
Hexadecadienoic acid35.520.308,369,888.17
Linoleic acid ethyl ester35.620.339,209,906.53
cis-13-Eicosenoic acid36.150.3810,547,993.14
9-octadecenoic acid36.311.1732,477,736.34
Cyclopropane decanoic acid36.730.7219,892,392.94
9-hexadecenoic acid37.113.61100,140,171.41
9-Hexadecenoic acid, 9-octadecenyl ester38.550.9626,601,291.25
Oleyl oleate39.141.9453,776,181.23
Nonadecatriene-5,14-diol39.682.9080,466,096.09
Table 12. Fragmentation ion and the retention time for estragole standard as well as the quantitative assessment of estragole in aniseed.
Aniseed Retention Time and Fragment Ions for Estragole Standard
CompoundM.wt(m/z)RT (Min)
Estragole148.21501.39
Quantification Results of Estragole in Aniseed
CompoundLinear Range (ng/mL)R2Recovery (%)
Estragole0.5–750.9992101.78% to 104.66%
Abbreviations: M.wt: molecular weight; RT: retention time; R2: correlation coefficient.
Disclaimer/Publisher’s Note: The statements, opinions and data contained in all publications are solely those of the individual author(s) and contributor(s) and not of MDPI and/or the editor(s). MDPI and/or the editor(s) disclaim responsibility for any injury to people or property resulting from any ideas, methods, instructions or products referred to in the content.

