Article

Analysis of Mould Exposure of Immunosuppressed Patients at a German University Hospital

by
Danuta Puhlmann
1,2,3,
Dominic Bergmann
1,2,3,
Silke Besier
1,2,3,
Michael Hogardt
1,2,3,
Thomas A. Wichelhaus
1,2,3,
Sabine Langhans
1,2,3,
Daniel Hack
1,2,3,
Claudia Reinheimer
1,2,3,
Maria J. G. T. Vehreschild
4,
Jens Jung
5 and
Volkhard A. J. Kempf
1,*
1
Institute for Medical Microbiology and Infection Control, University Hospital, Goethe University Frankfurt, 60590 Frankfurt am Main, Germany
2
University Centre of Competence for Infection Control of the State of Hesse, 60590 Frankfurt am Main, Germany
3
University Centre for Infectious Diseases (UCI), University Hospital, Goethe University Frankfurt, 60590 Frankfurt am Main, Germany
4
Department for Internal Medicine II, University Hospital, Goethe University Frankfurt, 60590 Frankfurt am Main, Germany
5
Department 1—Finance and Patient Services, University Hospital, 60590 Frankfurt am Main, Germany
*
Author to whom correspondence should be addressed.
Microorganisms 2023, 11(11), 2652; https://doi.org/10.3390/microorganisms11112652
Submission received: 8 September 2023 / Revised: 21 October 2023 / Accepted: 23 October 2023 / Published: 28 October 2023

Abstract

:
Moulds are ubiquitous components of outdoor and indoor air and local conditions, temperature, humidity and season can influence their concentration in the air. The impact of these factors on mould exposure in hospitals and the resulting risk of infection for low to moderately immunocompromised patients is unclear. In the present retrospective analysis for the years 2018 to 2022, the monthly determined mould contamination of the outdoor and indoor air at the University Hospital Frankfurt am Main is compared with the average air temperature and the relative humidity. Mould infections (Aspergillus spp., Mucorales) of low to moderately immunosuppressed patients of a haematological-oncological normal ward were determined clinically according to the criteria of the European Organisation for Research and Treatment of Cancer (EORTC, Brussels, Belgium) and of the National Reference Centre for Surveillance of Nosocomial Infections (NRC-NI, Berlin, Germany). The data revealed that in the summer months (May–October), increased mould contamination was detectable in the outdoor and indoor air compared to the winter months (November–April). The mould levels in the patient rooms followed the detection rates of the outdoor air. Two nosocomial Aspergillus infections, one nosocomial Mucorales (Rhizopus spp.) infection (according to both NRC-NI and EORTC criteria) and five Aspergillus spp. infections (according to EORTC criteria) occurred in 4299 treated patients (resulting in 41,500 patient days). In our study, the incidence density rate of contracting a nosocomial mould infection (n = 3) was approximately 0.07 per 1000 patient days and appears to be negligible.

1. Introduction

Moulds occur naturally throughout nature and are a component of both outdoor and indoor air. Due to the small size of the spores (2–30 µm), they can travel long distances in the air. Humans are continuously exposed to mould spores [1,2,3,4,5]. Climate, time of day and year as well as local conditions influence the concentration of moulds in the air [1,4]. In nature, mould concentrations can range from 100 colony forming units (CFU) /m3 (in winter) to more than 2000 CFU/m3 (in summer) [1]. Other factors that influence the occurrence of moulds are temperature, humidity or the presence of rotting material [4].
Typical seasonal patterns of exposure to mould spores in outdoor air are known for certain mesophilic mould species such as Cladosporium sp., with the highest mould spore exposure occurring in the summer months (increasing from May to August, decreasing from August to October) [4,6]. Numerous moulds are known to differ significantly in their biological properties and preferred habitats. For example, Aspergillus niger is more commonly found in house dust or plant soil, while Aspergillus fumigatus tends to occur in low concentrations across the region in temperate climates, such as in Germany [4].
Human exposure to moulds can result in various clinical pictures ranging from allergic diseases to serious invasive infections caused by various thermotolerant mould species, the latter occurring mainly in at-risk groups (e.g., immunosuppressed patients) [1,7,8]. In immunocompromised patients, A. fumigatus can cause severe and often fatal lung infections (aspergillosis) [2,8,9,10]. In the case of clinical symptoms, mould infections in humans are detected by clinical microbiologically (by using, e.g., cultivation or molecular methods) and the diagnosis is supported by radiological imaging. Rapid detection of the Aspergillus galactomannan antigen in serum or bronchial secretions can significantly shorten the time to diagnose an aspergillosis [10,11,12,13].
Numerous national guidelines regulate the handling of mould contamination [4,7,14]. For many areas of health care and groups of people (except for severely or highly immunosuppressed patients), there are no strict recommendations for dealing with indoor air contaminated with mould, nor are there any limit values for mould concentrations [9]. This is also due to the fluctuating spore load in the outdoor air and the outdoor air parameters [1,4,9]. The interrelated assessment of mould contamination in outdoor areas and indoor spaces and its possible influence on mould infections (incl. invasive aspergillosis) are currently insufficiently described.
Based on routine airborne microbial measurements, we have created a comprehensive picture of outdoor air and indoor air pollution by thermotolerant moulds in a low-risk area (haematology/oncology normal ward) at the University Hospital Frankfurt am Main (UHF) between the years 2018 and 2022 and related these to nosocomial mould infections to derive possible infection prevention measures.

2. Materials and Methods

2.1. Ethics Vote

No ethics vote is required for the environmental analysis to detect mould contamination of outdoor and indoor air and for a retrospective and anonymised analysis of patient data (decision of the UHF Ethics Committee dated on 14 November 2018).

2.2. Airborne Microbial Measurement

Airborne microbial measurements were conducted monthly at the haematology/oncology ward (ward A0) between January 2018 and December 2022. A few specific measurements were not feasible in the period between 2019 and 2022 due to the COVID-19 pandemic and the resulting need to reorganise patient care. Ward A0 had to be temporarily relocated to other wards during the COVID-19 pandemic for organisational reasons (see Supplementary Figures S1–S3). The airborne microbial measurements as well as the associated laboratory tests were carried out under strict quality-assured conditions according to DIN EN ISO/IEC 17025 standards (certificate number D-PL-13102-01-00).
Airborne microbial measurements were carried out with a MAS 100 NT air sampler (MBV AG, Stäfa, Switzerland) in the centre of each patient room (without mechanical ventilation) and at three measuring points in the corridor area (see Supplementary Figures S1–S3). The external reference measuring points were located outside the respective hospital buildings (see Supplementary Figures S4–S6).
Airborne microbial measurement was carried out using the impaction method. For this, 250 l of air is aspirated in a time of 2 min and 30 s directly onto an agar-based medium plate (malt extract agar, Oxoid, Wesel, Germany) for mould growth. The culture medium plate was removed free of contamination, sealed airtight and then incubated at the Institute for Medical Microbiology and Infection Control for 48 h at 36 °C (incubator B60, Memmert, Schwabach, Germany). Microbial contamination was determined by counting the colonies using the so-called “Feller table” [15]. Laboratory data were documented in the hytec laboratory system (Epinet V.5.2023.01.07, Bochum, Germany). Cultivated moulds were identified using established routine methods (culture, microscopy, etc.); molecular or mass spectrometric analyses were not applied.
From the available results of the airborne microbial measurements, the mean values (see Supplementary Tables S1–S5) of the outdoor reference readings (O), patient rooms (R) and corridors (C), each for one sample day, were calculated and displayed graphically (Excel, Microsoft, Redmond, WA, USA) (Figure 1, Figure 2, Figure 3, Figure 4 and Figure 5). The individual measured values are presented as original data in the supplement (see Supplementary Tables S6–S10).

2.3. Weather Data Collection

The mean air temperature and relative humidity (measured 2 m above the ground) of the outdoor air were determined retrospectively using the data collected by the Frankfurt am Main weather station (ID 1420) of the Climate Data Centre of the German Weather Service (Deutscher Wetterdienst, DWD) [16]. The individual measured values are presented as original data in the supplement (see Supplementary Tables S11–S15).

2.4. Detection of Aspergillus-Infections Using Galactomannan Antigen Detections

For the detection of Aspergillus infection, galactomannan as a cell wall component of Aspergillus spp. was analysed from sera and bronchioalveolar lavages of in-patients on ward A0 (from 1 January 2018 to 31 December 2022) with suspected Aspergillus infections [13,17], using the Platelia Aspergillus ELISA (BioRad, Dreieich, Germany) according to the manufacturer’s instructions.

2.5. Laboratory Testing of Patient Specimen

All laboratory testing was performed under strict quality-controlled DIN ISO 15189:2014 standards (certificate number D–ML–13102–01–00).

2.6. Fungal Culture

Microbiological diagnosis of invasive pulmonary aspergillosis (IPA) was performed by microscopy, fungal culture and PCR (see below) from respiratory samples (sputum, bronchial secretions or bronchoalveolar lavages). Microscopic detection of filamentous fungi was performed using calcofluor white staining. For routine fungal cultures, standard media (Sabouraud dextrose agar; all Oxoid, Wesel, Germany) were inoculated and incubated at least for 7 days (initially 2 days at 37 °C and subsequently 5 days at room temperature to cover the growth of environmental fungal species on the basis of diagnostic standards [18]). In case of suspected IPA, incubation time was prolonged up to 14 days (2 days at 37 °C and 12 days at 30 °C) and, additionally, Sabouraud dextrose broth (Oxoid, Wesel, Germany) was inoculated.

2.7. Laboratory Panfungal, Aspergillus and Mucorales PCR Assays

Molecular detection of moulds was performed from respiratory samples (sputum, brochioalveolar lavage). For DNA-extraction, the High Pure PCR Template Preparation Kit (Roche, Penzberg, Germany) or the QIAsymphony DSP Virus/Pathogen Mini Kit (Qiagen, Hilden, Germany) was used in combination with the QIAsymphony platform. DNA extracts were subjected either to a (i) broad-range (panfungal) PCR targeting the 28S rRNA gene (primer 10F: 5′-GACATGGGTTAGTCGATCCTA-3′ and 12R 5′-CCTTATCTACATTYTTCTATCAAC-3′; 35 cycles: denaturation 30 s at 95 °C, annealing 30 sec at 53 °C, elongation 60 s at 72 °C) using Taq DNA Polymerase (with W-1)-Kit (Invitrogen, Darmstadt, Germany) and ROTI-Mix PCR3 nucleotides (Roth, Germany) as previously described [19], to a (ii) Aspergillus-specific PCR using the A. fumigatus DNA detection Kit according to the manufacturer′s instructions (Axonlab, Polling, Austria) or to a (iii) Mucorales-specific qualitative PCR targeting the 18S rRNA gene (primer ZM1mo, 5′-TTACCRTGAGCAAATCAGARTG-3′ and ZM3mod, 5′-AATCYAAGAATTTCACCTCTAGCG-3′, probe p-ZM, 5′-6FAM-TYRR(G)G(G)B(A)T(T)T(G)T(A)TTT-BBQ-3′; 50 cycles: denaturation 15 sec at 95 °C, annealing and elongation 60 s at 60 °C each) using LightCycler TaqMan Master-Kit (Roche, Mannheim, Germany) as previously described [20].

2.8. Retrospective Analysis of Nosocomial Aspergillus Infections in Immunocompromised Patients

In order to classify the clinical microbiological laboratory diagnostics appropriately with regard to their clinical relevance, the recommendations of the current version of the “Consensus Definitions of Invasive Fungal Disease from the European Organisation for Research and Treatment of Cancer (EORTC) and the Mycoses Study Group Education and Research Consortium” were applied [21]. In addition, according to the definition of the National Reference Centre for Surveillance of Nosocomial Infections (NRC-NI Berlin, Germany), infections (fungal, bacterial) are considered nosocomial at the earliest when symptoms begin on the third day of hospitalisation [22]. Infections existing on the day of admission or manifesting up to the second day after admission are consequently considered as community-acquired infections. The occupancy data of the inpatients with a length of stay of at least three days on the haematological-oncological ward A0 between January 2018 and December 2022 were determined using the EDP hospital information system Orbis (Dedalus Healthcare System Group, Bonn, Germany). Clinical microbiology laboratory data were determined by means of the EDP laboratory information system swisslab (Nexus, Berlin, Germany) and the corresponding patients were checked in clinical information system Orbis with regard to clinical signs of mould infection (Table 1).

3. Results

3.1. Monthly Mould Load Depending on Temperature and Air Humidity

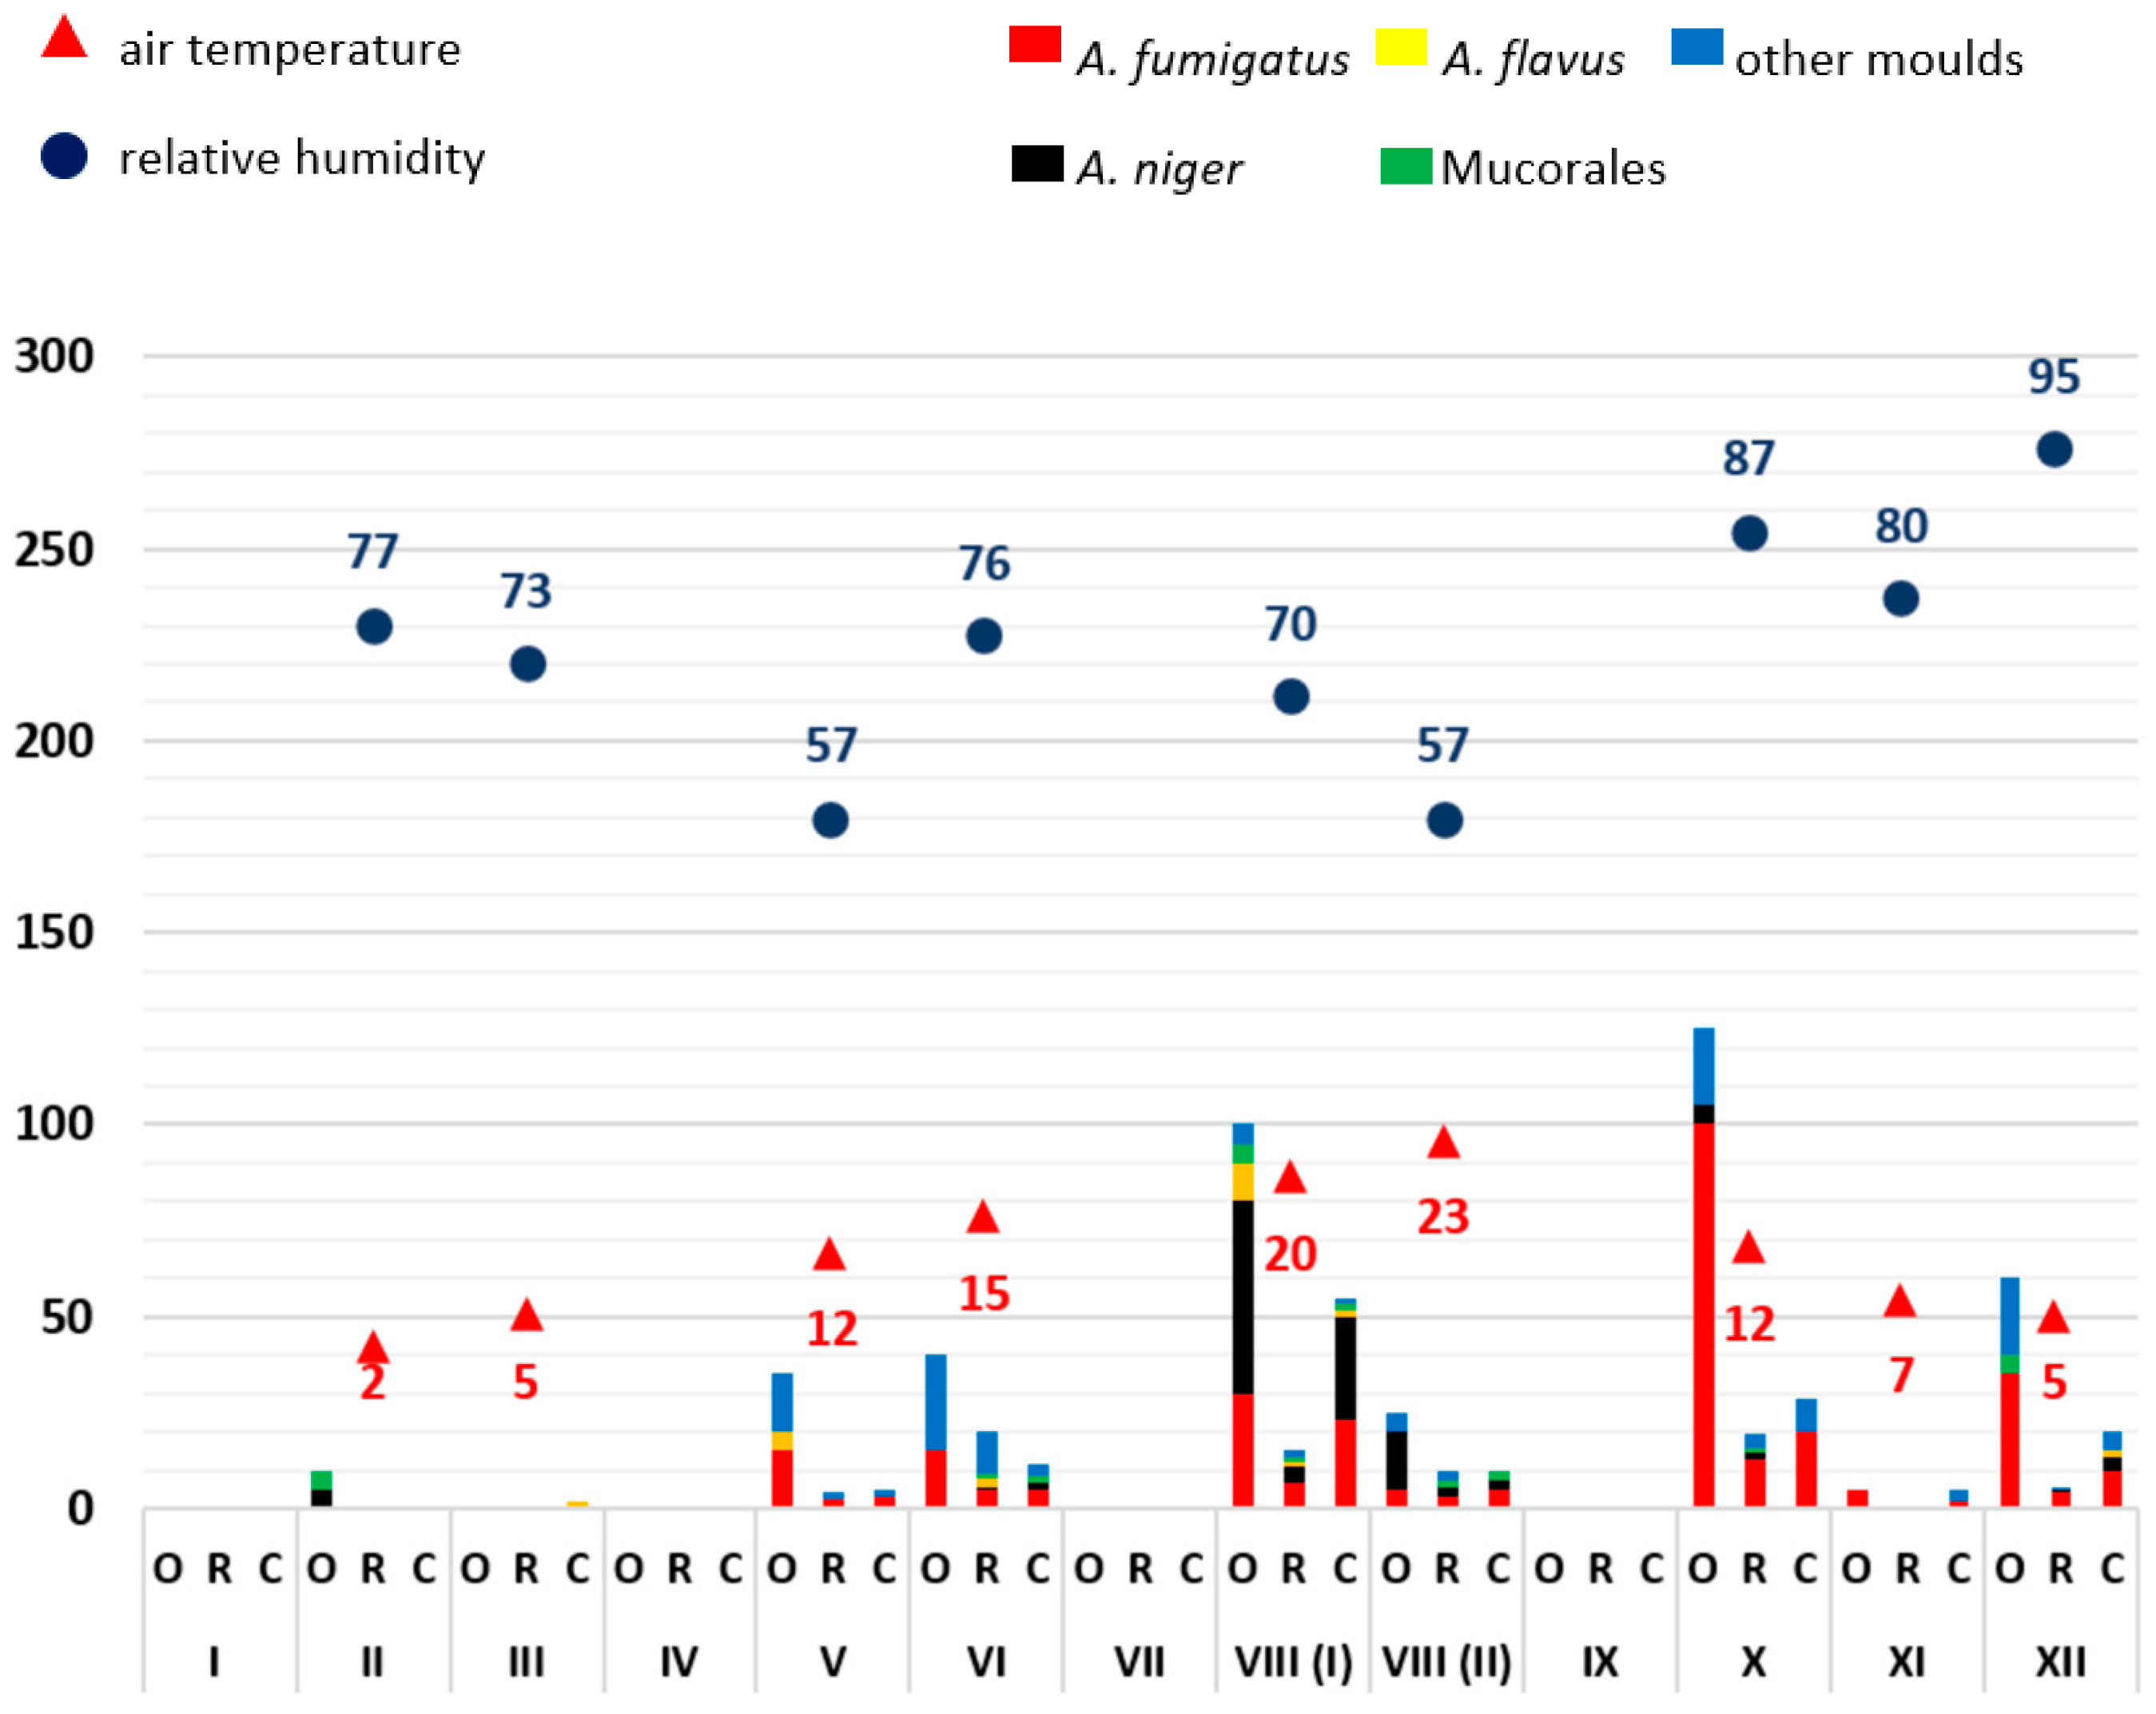
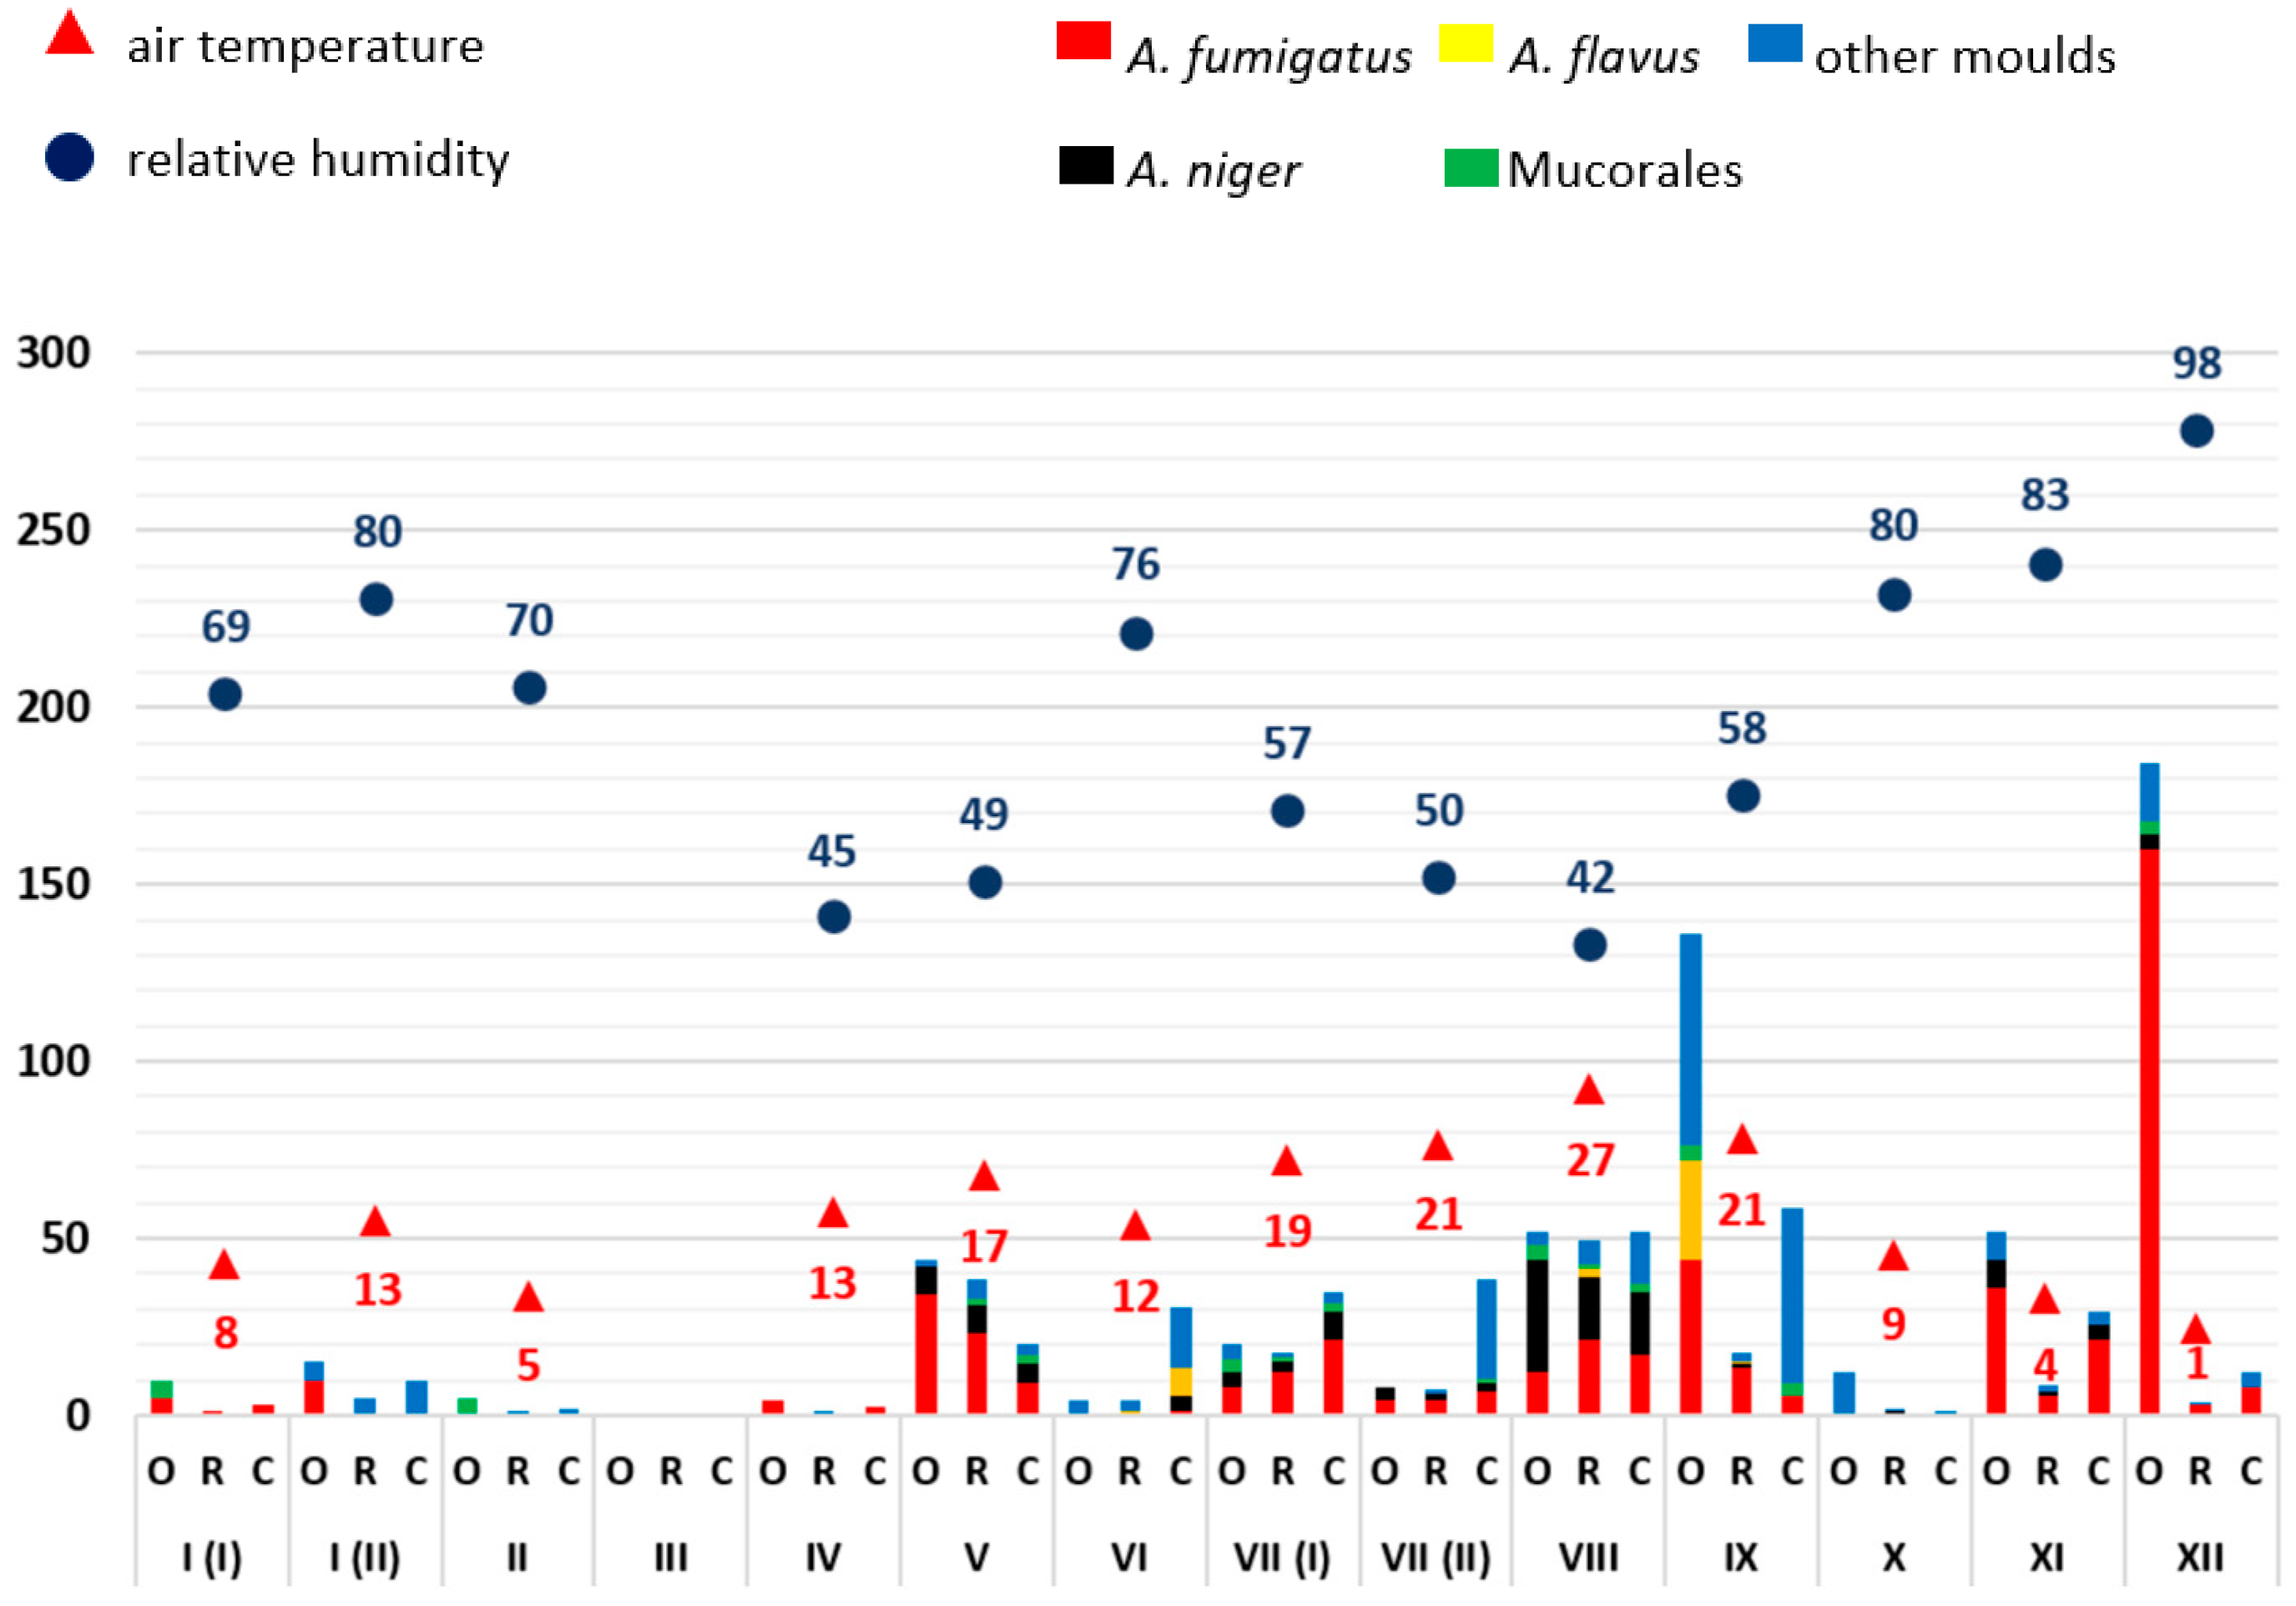
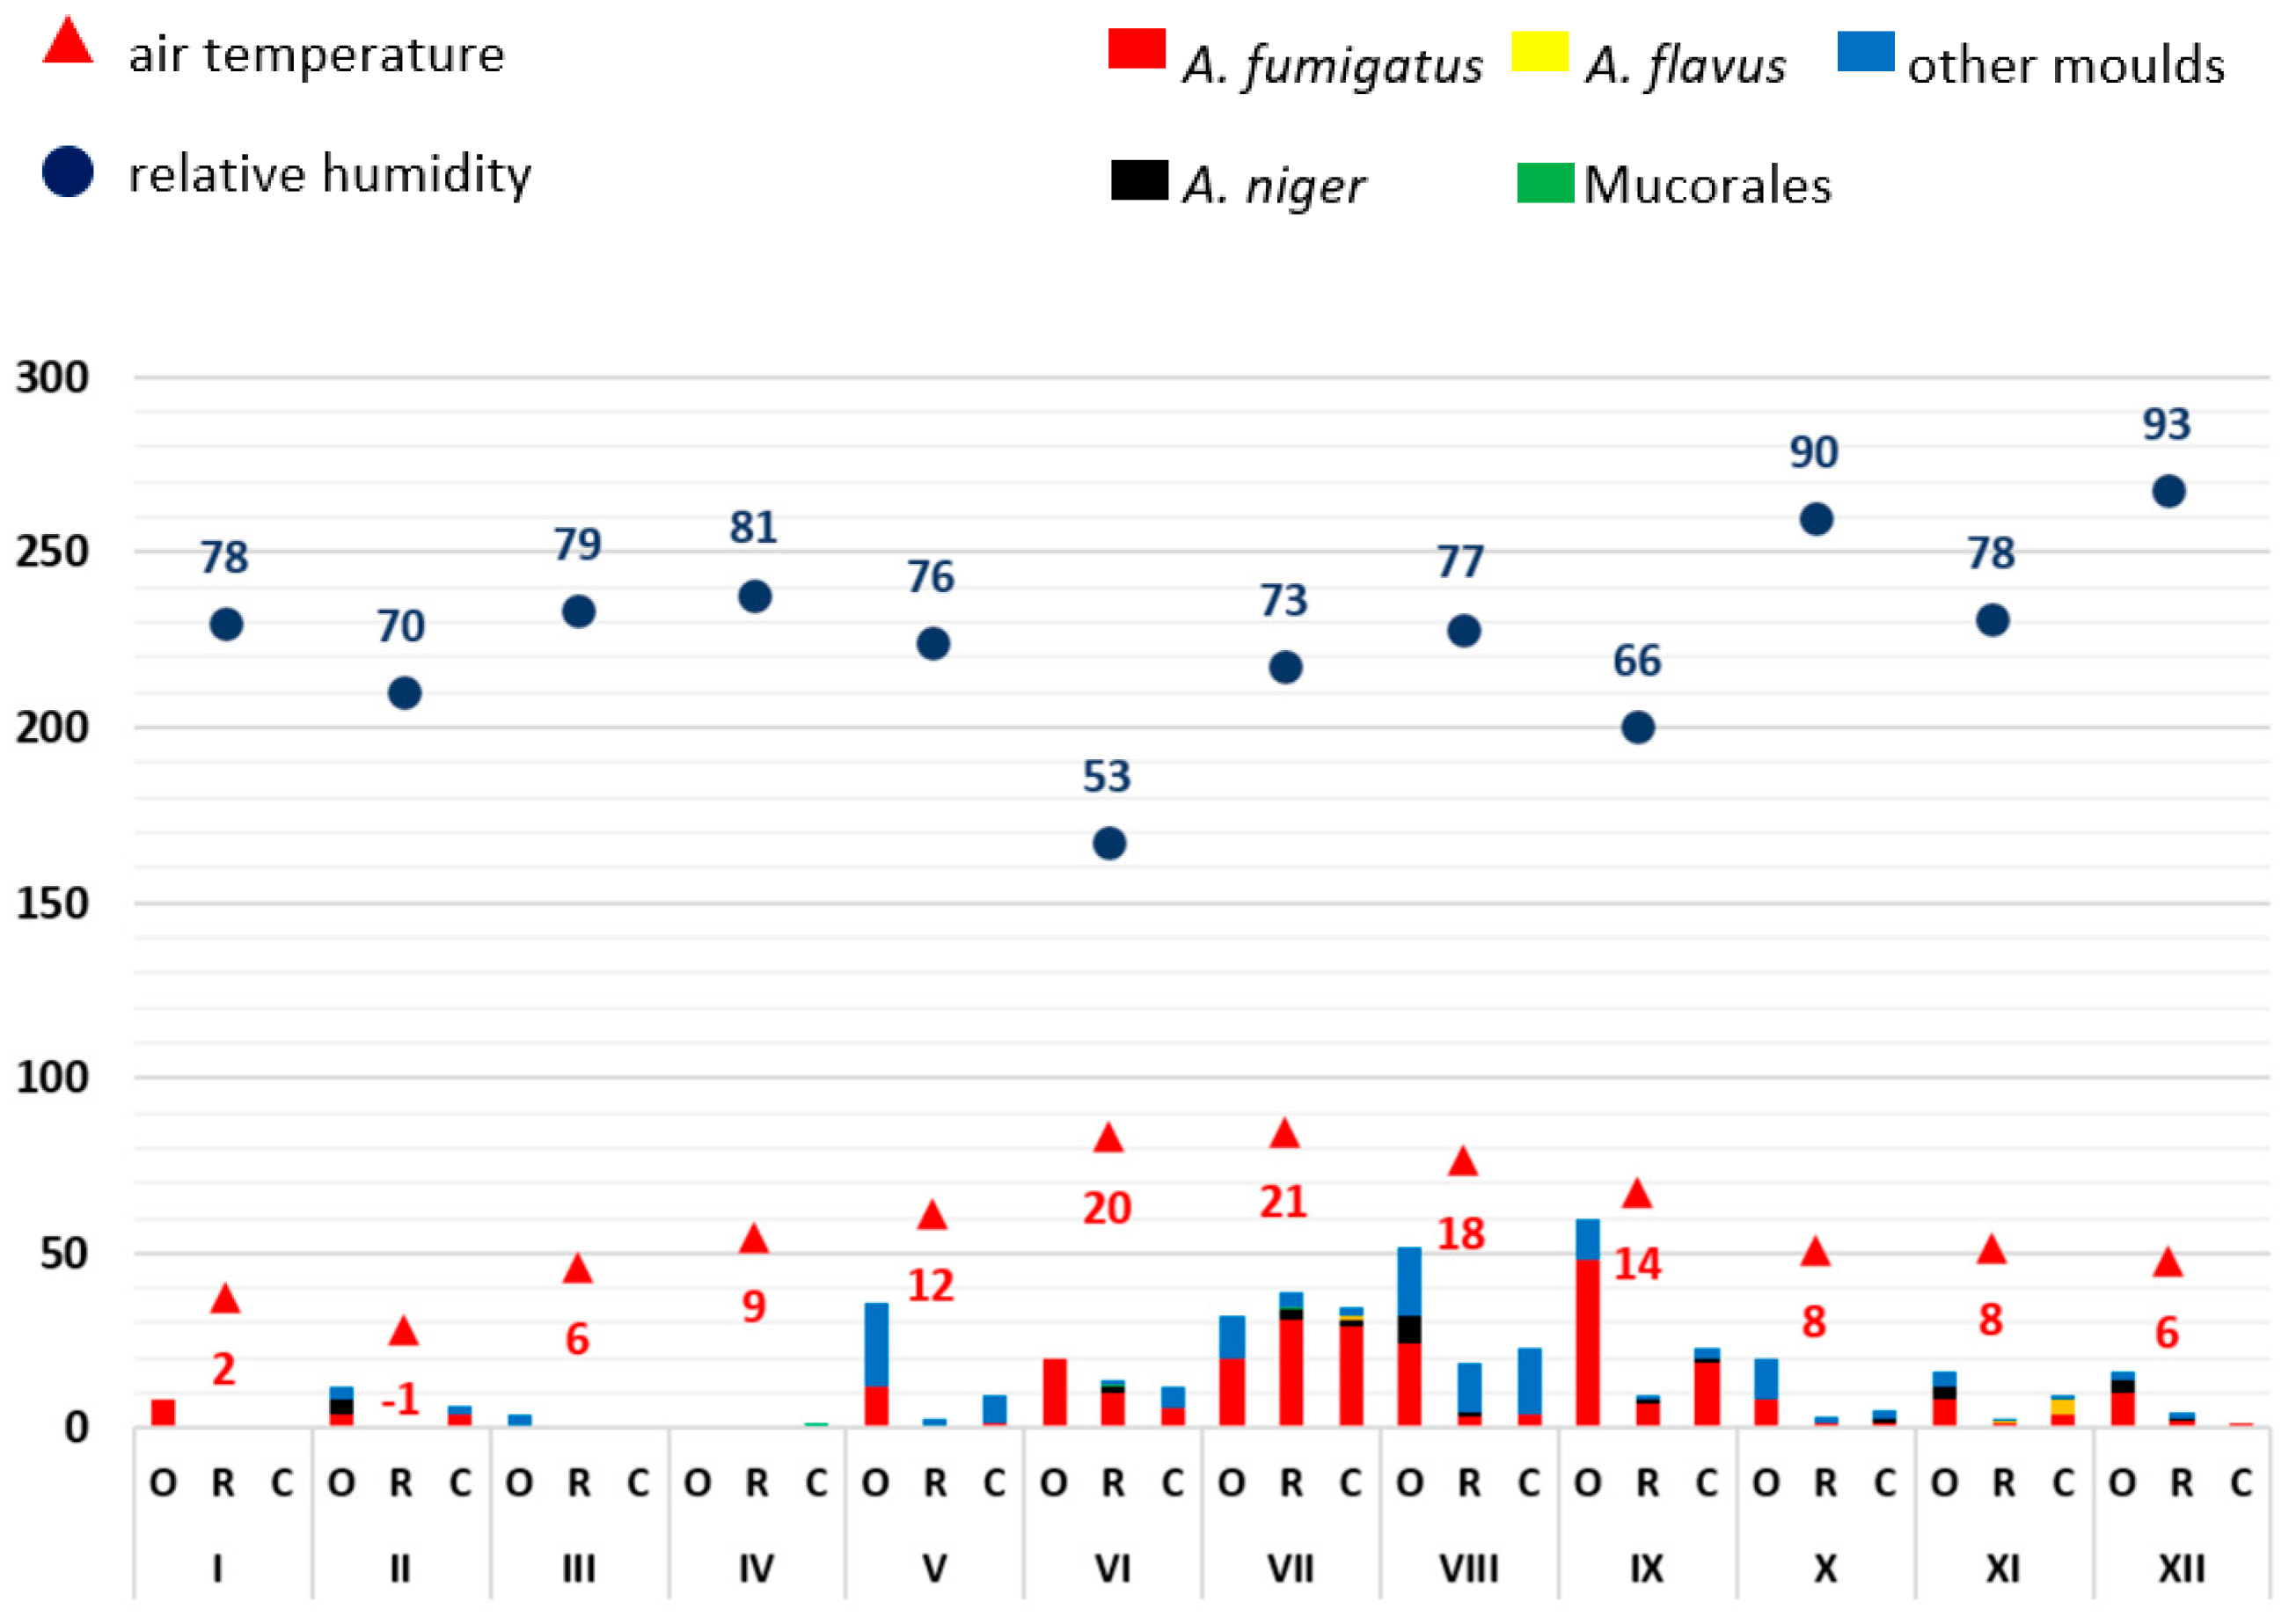
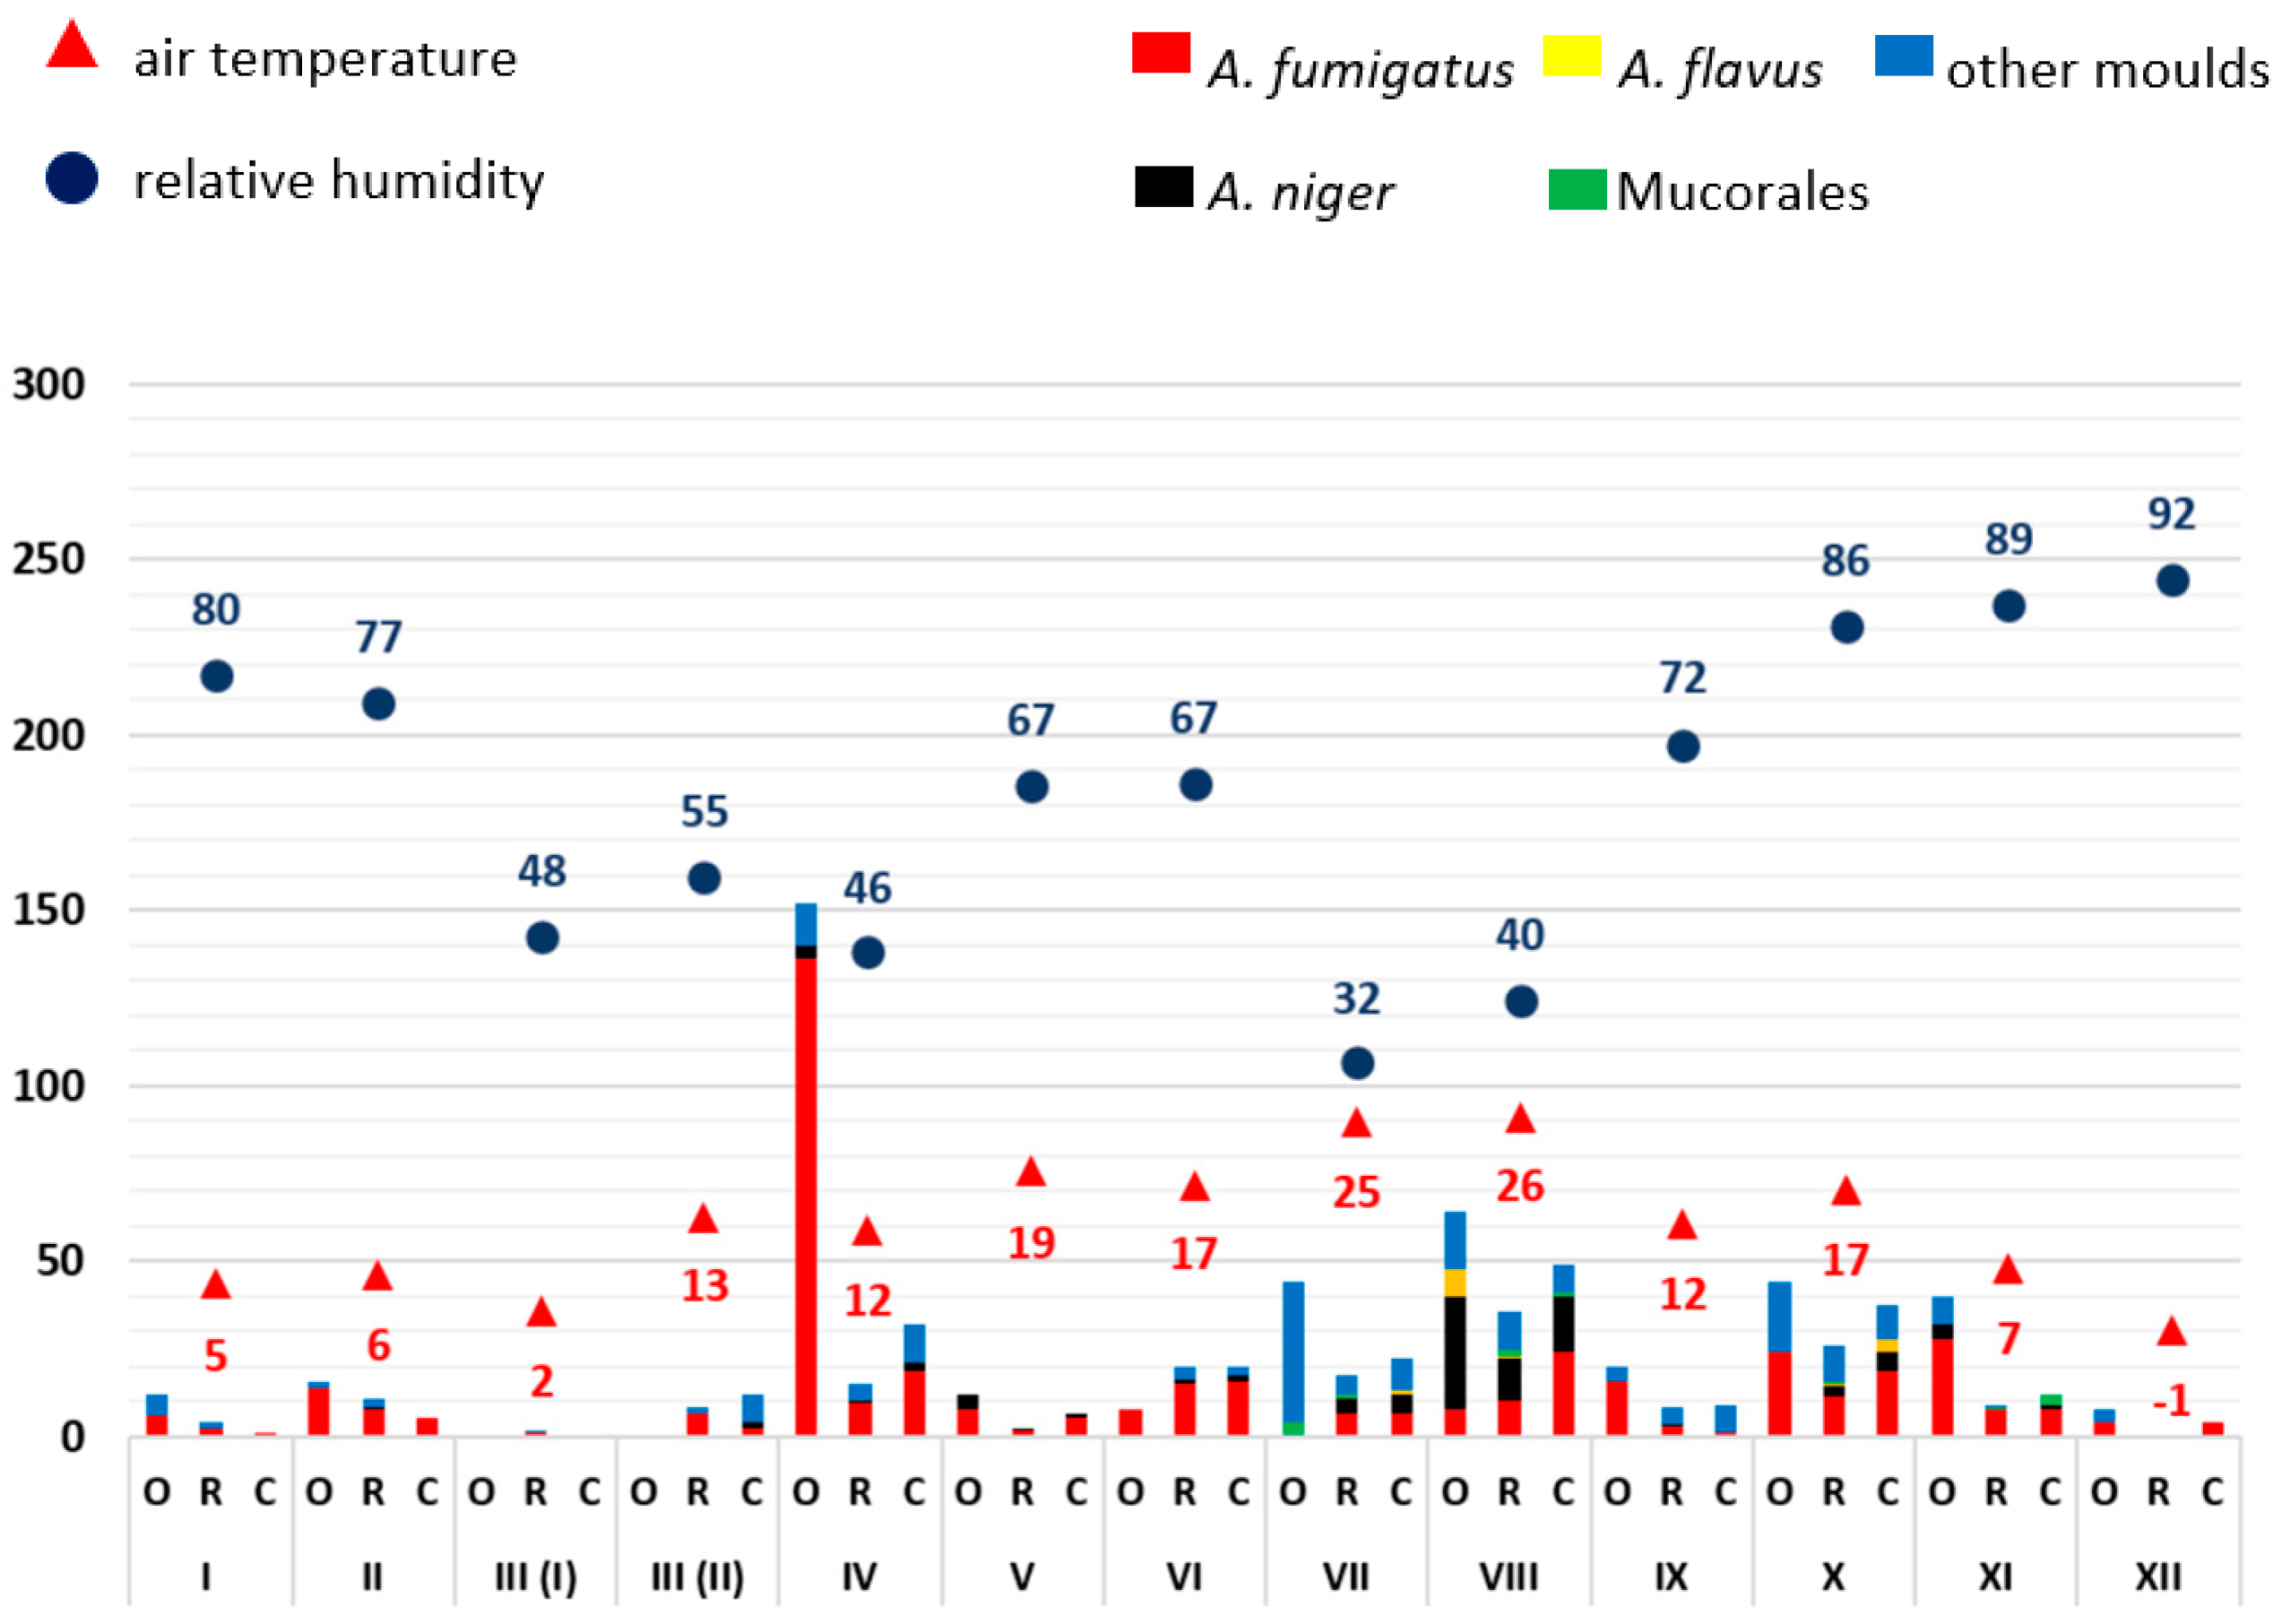
As mould infections in immunocompromised patients are primarily transmitted via the air, the exposure of indoor air to moulds in patient rooms was first analysed over time. Mould measurements on the ward corridors and in front of the building (so-called outdoor reference measuring points) served as comparative measurements. The moulds were identified by routine microbiological methods (A. fumigatus, A. niger, A. flavus, Mucorales, other moulds not further differentiated). A possible influence of weather conditions on mould load of the outdoor air was related to the average relative humidity and air temperature. Data evaluation was carried out in descriptive terms by synopsis of the data in integrated graphical analyses (Figure 1, Figure 2, Figure 3, Figure 4 and Figure 5).
As an example, the results for the year 2022 are given here in detail: In 2022, the outdoor mould concentration from January to December was less than 50 CFU/m3. There were exceptions in April (more than 150 CFU/m3) and in August (more than 60 CFU/m3). In the first half of the year, temperatures ranged from 2 °C to 19 °C, and relative humidity varied between 46% and 80%. In the second half of the year, the outdoor temperature ranged from 26 °C to −1 °C and the relative humidity rose from 32% to 92%. Compared to all other moulds, A. fumigatus was consistently detected in the outside air as well as in the patients’ rooms and corridors.
A. niger detections occurred throughout the year, with an increase in the month of August (between 12 CFU/m3 and 32 CFU/m3). A. flavus and Mucorales were more frequently detected at the end of the year (July to November). In December, there was high humidity (92%) with low outdoor temperature (−1 °C), accompanied by a very low mould load (<10 CFU/m3).
In the other years, the following specific anomalies emerged: In December of 2020 and April of 2022, there were increased detection rates, especially for A. fumigatus; in 2021, only very low mould detection rates were found throughout the year. The highest detection rate in this study was measured at the beginning of August 2018 with 270 CFU/m3, A. fumigatus with 110 CFU/m3 and other moulds with 85 CFU/m3. On this day, the average outdoor temperature was 30 °C and the relative humidity was 40%.
With regard to the number of moulds detected, a trend towards seasonal variation was identified over five years. In the summer months (May–October) there were increased detection rates in outdoor and indoor air compared to the winter months (November–April) with individual exceptions in December 2020 and April 2022. No clear relationship was established between outdoor temperature or humidity. In each of the years between 2018 and 2022, the months of December to April (except December 2019 and 2020) had the lowest mould concentrations in outdoor air. The mould load in the outside air usually exceeded the amount detected in the patient rooms and ward corridors.
The data show that no clear correlation can be established between humidity and temperature on the seasonal air load of moulds. The low detection rates in the months of November to April and the higher detection rates in the months of May to October are notable.

3.2. Analysis of the Frequency of Aspergillus Antigen Detection and Mould Infections

The next step was to identify mould infections in immunosuppressed haematological oncology patients on ward A0 over the observation period from 1 January 2018 to 31 December 2022 and to check a possible relation to season, temperature, humidity and mould contamination of outdoor and indoor air. For this purpose, the monthly number of all patients with a length of stay of at least three days on ward A0 as well as the patient days were determined. In addition, a systematic, retrospective query from the swisslab laboratory information system determined the clinical microbiology laboratory results which were performed during this period to detect mould infections (Aspergillus galactomannan antigen, culture and PCR-based detections). Moreover, the corresponding clinical patient data were retrospectively checked by using the Orbis hospital information system with regard to clinical signs of a patient′s mould infection.
In 2018, one (June 2018) clinically suspected nosocomial mould infection with Aspergillus spp. (antigen test) defined according to EORTC and NRC-NI criteria was detected for 1006 patients. Three further Aspergillus detections, which were to be assessed as community-acquired infections according to NRC-NI criteria (once with Aspergillus spp., antigen test, twice A. fumigatus, culture), did not fulfil the EORTC criteria of an infection. In 2019, one (November 2019) probable Aspergillus niger infection (culture) according to EORTC criteria was detected for 919 patients (community-acquired according to NRC-NI criteria); in addition, one other nosocomial Mucorales (Rhizopus spp., PCR) infection defined according to EORTC criteria as clinically probable and defined by NRC-NI criteria was detected. The further Aspergillus niger detection (culture), which was to be assessed as a community-acquired infection according to NRC-NI criteria, did not fulfil the EORTC criteria of an infection. In 2020, a clinically probable Aspergillus infection according to EORTC criteria and nosocomial Aspergillus spp. defined according to NRC-NI criteria was diagnosed by one patient [August 2020; Aspergillus spp., (PCR and antigen test), A. flavus and A. fumigatus (culture)] for 831 patients. In 2021, no Aspergillus infection was detected for 788 patients. The further A. fumigatus and A. versicolor detection (culture), which was to be assessed as a community-acquired infection according to NRC-NI criteria, did not fulfil the EORTC criteria of an infection. In 2022, no Aspergillus infections were detected for 755 patients according to NRC-NIZ criteria. Two patients were found to be infected with Aspergillus spp. by PCR and antigen test (August 2022: confirmed infection according to EORTC criteria, December 2022: probable infection according to EORTC criteria) (Table 1). The further Aspergillus spp (PCR and antigen test), A. fumigatus (culture) and A. niger detections (culture), which were to be assessed as a community-acquired infections according to NRC-NI criteria, did not fulfil the EORTC criteria.
From these data, it appears that there was rarely a clinical indication to perform a mould infection diagnosis (e.g., for 4299 patients, only 136 laboratory requests to perform a galactomannan test were available). Six out of 136 patients tested positive for galactomannan. In total, six mould infections were detected based on the available diagnostics (antigen test, PCR and culture). Three patients were found to have a nosocomial mould infection (Aspergillus spp., Aspergillus fumigatus, Rhizopus spp.). According to the EORTC criteria, 6 patients suffered from a mould infection (five times probable Aspergillus spp. infection, one confirmed Aspergillus spp. infection and one infection with Rhizopus spp). In relation to all patient days (n = 41,500), the incidence density rate for a nosocomial mould infection is calculated 0.07 per 1000 patient days. There was no clear evidence of a dependency of mould infections on temperature, humidity or mould contamination in the indoor and outdoor air. Both, nosocomial infections and infections according to EORTC criteria were mainly detected in the summer months (June to August) excluding the year 2019 with only one infection according to EORTC criteria.

4. Discussion

Moulds can cause severe infections in immunocompromised patients. In particular, patients with underlying haematological-oncological diseases represent a risk group for mould infections; such infections are associated with an unfavourable prognosis in this patient population [2,5,8,9,23]. In the present retrospective study at the University Hospital Frankfurt am Main, we recorded the mould load in indoor air on a haematological-oncological ward over a period of five years (2018–2022) and related this to the mould load in outdoor air. Furthermore, we recorded the clinically manifest mould infections in the corresponding haematological-oncological patients during this period. To our knowledge, our study is the study with the longest observation period in this regard. It is important to mention that his study cannot establish causative links between exposure and infections.
Moulds occur in the outdoor and indoor air and in different concentrations depending on the season [1,2,3,4]. As a consequence, patient groups with an increased risk of infection (e.g., highly immunosuppressed patients undergoing chemotherapy, stem cell transplantation) are cared for in rooms with a room air conditioning system and filtered air [9] ensuring the absence of moulds. Other, less immunosuppressed patients are often cared for in rooms without an air-conditioning system and are therefore exposed to the regular mould contamination of the air. In addition to the natural mould load, building measures (e.g., renovations) or moisture damage can increase the mould load in the air and thus the risk of infection for the immunocompromised patients [24,25].
Our evaluation of the contamination of outdoor and indoor air with moulds yielded three main results: (i) in the warmer months (May–October), increased mould levels were detectable in the outdoor air, (ii) mould levels in the air of patient rooms followed (at lower concentrations) the detection rates in the outdoor air, and (iii) A. fumigatus was the most frequently detected mould.
The basic mould contamination of the outdoor air varied between 0 and 270 CFU/m3 over the observation period. In the months April–May to September–October, higher mould concentrations were usually present in the outdoor air; in the months November to March, the detection rates were generally lower. These fluctuations seem to be most likely due to an increased ambient temperature, a connection with humidity is not obvious. Individual fluctuations in mould levels (e.g., in December 2020) cannot be explained. Neither construction activities with excavated earth nor demolition works were in progress during this time. Retrospectively, it should be noted that the air measurements took place at different times during the day (usually between 8.00 am and 3.00 pm). The extent to which these different sampling times might have an influence on mould contamination (e.g., influence of traffic, thermal dissipation, etc.) would have to be analysed in more detail, as has already been done in other studies [24]. The low baseline mould levels in 2021 (up to 65 CFU/m3 in October 2021 compared to 100 and 300 CFU/m3 in August 2018 or October 2019) are striking. The reason for this may have been the reduced air circulation due to reduced road traffic during the COVID-19 pandemic.
The contamination of the air with mould spores in the patient rooms always followed the detection rates of mould spores in the outdoor air. However, detection rates in the patient rooms were generally lower than in the outside air. Causes for this can be the ventilation behaviour of the rooms (e.g., increased airing in summer) [24]. In addition, the patient rooms are located in the direction of an inner courtyard, which is different in terms of air circulation from the outdoor reference measuring points the latter located in the direction of a large flowing watercourse (the Main). It is important to mention that we analysed mould levels monthly in our retrospective study. A more frequent sampling would probably make it possible to reduce the variability in mould levels, however, this would be associated with workload in samples drawing and subsequent laboratory analysis.
It remains to be analysed whether elevated mould concentrations (e.g., of up to 100 CFU/m3) can be tolerated in terms of patient safety if, for example, the indoor concentration does not permanently exceed the outdoor concentration and a single mould species is not consistently present in elevated concentrations [24,26]. Concentrations of >50 CFU/m3 of a single mould species, based on indoor mean values (e.g., patient rooms), which might indicate increased exposure [26], were not reached in this study. Contrary to the assertion that soil fungi such as A. fumigatus are present in the air only in low concentrations (5–10 CFU/m3) [1], in our study A. fumigatus was present in higher concentrations throughout the year. This proves that limit values for mould contamination of outdoor air cannot be defined due to the high fluctuation range and are subject to regional influences.
In the entire observation period over five years, a total of only five Aspergillus infections and one Mucorales (Rhizopus spp.) infection were detected, with only three infections being formally (>48 h after patient admission) assessed as nosocomial infections. In one of the infections formally classified as nosocomial (June 2018), Aspergillus antigen detection from the patient’s serum sample remained negative within the first three days; after ten days, Aspergillus antigen was detected in this patient’s bronchial lavage. Based on the typical radiological findings (computed tomography of the thorax), a diagnosis of Aspergillus pneumonia was made according to EORTC criteria and the patient was treated with Voriconazole. Airborne microbial measurement on 8 June 2018 revealed increased outdoor air exposure (>80 CFU/m3), primarily with A. niger (35 CFU/m3) and simultaneously increased indoor air exposure with A. fumigatus in the patient room (22 CFU/m3; compared to outdoor air exposure: 15 CFU/m3). A causal relationship with the mould exposure in the patient’s room cannot be ruled out, as the patient had previously been treated in an inpatient area with an air-conditioning system and was considered severely immunosuppressed before that. There were five days between the admission to the haematological-oncological normal ward, before which, however, it can be assumed that the patient had been exposed to moulds in the private environment. In this respect, the diagnosis “nosocomial Aspergillus infection” is formally correct, but not provable due to the long incubation periods [27].
The other Aspergillus infection formally classified as nosocomial according to NRC-NI criteria was diagnosed via antigen test, PCR and culture in August 2020 in a patient 13 days after admission to the ward (31 August 2020). In addition to the laboratory findings, lung infiltrates were also detected on computed tomography and a diagnosis of Aspergillus infection was made and treated with Voriconazole. Airborne microbial measurements on 7 August revealed an outdoor air load of 52 CFU/m3 (A. fumigatus 12 CFU/m3, A. niger 32 CFU/m3). Elevated concentrations of A. fumigatus (21 CFU/m3) and A. niger (18 CFU/m3) were also present in the patient rooms. Ultimately, however, no provable connection between air exposure and infection is possible here either, given that the patient had been exposed in a private environment for a period of two days immediately beforehand. Generally, it is important to mention that such an analysis cannot prove causative links between mould exposure and infection. Our data definitively cannot establish causative links between exposure and infection. A determination of causative links would only be possible if both the respective environmental and patient mould isolates would have undergone, e.g., a molecular fine-typing. Such analyses would have great potential in determining the sources of (clonal) mould infections and should be analysed in future studies.
A general classification of Aspergillus infections as “community-acquired” or “nosocomial-acquired” seems problematic. In view of this difficulty, the clinical assessment “mould infection” was analysed again in all patients with laboratory evidence of moulds (antigen test, PCR, culture) in a reviewing manner according to EORTC criteria. Again, no temporal accumulation or cluster of mould infections was detectable. Interestingly, the infections formally classified as “nosocomial” as well as infections according to EORTC criteria were mainly detected in the summer months (June to August). Whether this phenomenon is due to the increased mould contamination of the air in these months remains questionable and should be further analysed in subsequent studies with a longer observation period.

5. Conclusions and Future Perspectives

From the above data, the two nosocomially defined Aspergillus infections in 4299 patients and 41,500 patient days result in an incidence density rate of 0.05 per 1000 patient days and one nosocomially defined Mucorales (Rhizopus spp.) infection results in an incidence density rate of 0.02 per 1000 patient days, which we consider to be a very low, possibly even negligible, risk. Due to this low risk, the lack of fluctuation in the detections over five years and the strongly fluctuating detection rates of the pathogens in outdoor and indoor air, it must be discussed whether a systematic recording of mould contamination makes sense. Moreover, in the case of increased detection rates in outdoor and, subsequently, in indoor air and the lack of available options for action, there is no consequence in infection control. Whether a defined mould concentration in the room air can be considered hazardous to the health of low to moderately immunocompromised patients is unlikely when viewed against the findings of our study. Precise limit values for mould contamination probably cannot be established due to the highly fluctuating detection rates and the negligible number of possible nosocomial infections with unclear reference to mould contamination in the room air on normal wards.

Supplementary Materials

The following supporting information can be downloaded at: https://www.mdpi.com/article/10.3390/microorganisms11112652/s1. Figure S1: Floor plan of ward A0, building 23A, ground floor (measuring points: blue dots), University Hospital Frankfurt (UHF), occupancy period January 2018 to March 2020; June 2020 to November 2021 and March 2022 to December 2022. Figure S2: Floor plan of ward 28-1 (A0), building 28, 1st floor (measuring points: blue dots), UHF, occupancy period April 2020 to May 2020. Figure S3: Floor plan of ward B10 (A0), building 23B, 10th upper floor (measuring points: blue dots), UHF, occupancy period December 2021 to February 2022. Figures S4, S5 and S6: External reference measuring points in front of House 23 and House 28 (measuring points: red dots), UHF. Table S1: Mean values of mould values (CFU/m3), 2018 ward A0, UHF. Table S2: Mean values of mould values (CFU/m3), 2019 ward A0, UHF. Table S3: Mean values of mould values (CFU/m3), 2020 ward A0, UHF. Table S4: Mean values of mould values (CFU/m3), 2021 ward A0, UHF. Table S5: Mean values of mould values (CFU/m3), 2022 ward A0, UHF. Table S6: Mould values (CFU/m3), raw data 2018, ward A0, UHF. Table S7: Mould values (CFU/m3), raw data 2019, ward A0, UHF. Table S8: Mould values (CFU/m3), raw data 2020, ward A0, UHF. Table S9: Mould values (CFU/m3), raw data 2021, ward A0, UHF. Table S10: Mould values (CFU/m3), raw data 2022, ward A0, UHF. Table S11: CDC weather data for weather station ID 1420 (2018). Table S12: CDC weather data for weather station ID 1420 (2019). Table S13: CDC weather data for weather station ID 1420 (2020). Table S14: CDC weather data for weather station ID 1420 (2021). Table S15: CDC weather data for weather station ID 1420 (2022).

Author Contributions

Conceptualization, D.P. and V.A.J.K.; methodology, D.P.; validation, V.A.J.K.; formal analysis, D.B., S.B., M.H., T.A.W., S.L., D.H., C.R., M.J.G.T.V. and J.J.; investigation, D.B., S.B., M.H., T.A.W., S.L., D.H., C.R., M.J.G.T.V. and J.J.; data curation, D.P. and V.A.J.K.; writing—review and editing, D.P. and V.A.J.K.; supervision, D.P. and V.A.J.K.; project administration, V.A.J.K. All authors have read and agreed to the published version of the manuscript.

Funding

This work was supported by the State of Hesse, Germany (“Hessisches universitäres Kompetenzzentrum für Krankenhaushygiene”). The funder had no role in study design, data collection and analysis, decision to publish, or preparation of the manuscript.

Data Availability Statement

Not applicable.

Acknowledgments

We thank Laura Diaz-Martinez, Yvonne Körner, Nadine Heimen, Bettina Stietz, Mohamed Saghdaou and Stephanie Beck (Institute for Medical Microbiology and Infection Control, University Hospital, Goethe University, Frankfurt am Main, Germany) for expert technical support.

Conflicts of Interest

The authors declare no conflict of interest.

References

  1. Robert Koch-Institut (RKI). Schimmelpilzbelastung in Innenräumen—Befunderhebung, gesundheitliche Bewertung und Maßnahmen. Bundesgesundheitsblatt-Gesundheitsforschung-Gesundheitsschutz 2007, 50, 1308–1323. [Google Scholar] [CrossRef] [PubMed]
  2. Ortiz, G.; Yagüe, G.; Segovia, M.; Catalán, V. A study of air microbe levels in different areas of a hospital. Curr. Microbiol. 2009, 59, 53–58. [Google Scholar] [CrossRef] [PubMed]
  3. Kolstad, H.A.; Brauer, C.; Iversen, M.; Sigsgaard, T.; Mikkelsen, S. Do indoor molds in nonindustrial environments threaten workers’ health? A review of the epidemiologic evidence. Epidemiol. Rev. 2002, 24, 203–217. [Google Scholar] [CrossRef] [PubMed]
  4. Innenraumlufthygiene-Kommission des Umweltbundesamtes. Leitfaden zur Vorbeugung, Erfassung und Sanierung von Schimmelbefall in Gebäuden (Schimmelpilz-Leitfaden); Umweltbundesamt: Berlin, Germany, 2017; Available online: https://www.umweltbundesamt.de/www.umweltbundesamt.de/schimmelleitfaden (accessed on 22 October 2023).
  5. Chabi, M.L.; Goracci, A.; Roche, N.; Paugam, A.; Lupo, A.; Revel, M.P. Pulmonary aspergillosis. Diagn. Interv. Imaging. 2015, 96, 435–442. [Google Scholar] [CrossRef] [PubMed]
  6. Wiesmüller, G.A.; Heinzow, B.; Aurbach, U.; Bergmann, K.-C.; Bufe, A.; Buzina, W.; Cornely, O.A.; Engelhart, S.; Fischer, G.; Gabrio, T.; et al. S2k-Leitlinie Medizinisch Klinische Diagnostik bei Schimmelpilzexposition in Innenräumen; AWMF-Register-Nr. 161/001, Stand 11.04.2016, Gültig bis 10.04.2021. Available online: https://register.awmf.org/de/leitlinien/detail/161-001 (accessed on 4 April 2023).
  7. Bundesanstalt für Arbeitsschutz und Arbeitsmedizin. Technische Regeln für Biologische Arbeitsstoffe—Einstufung von Pilzen in Risikogruppen (TRBA 460), Juli 2016 GMBl. Nr. 29/30 vom 22.07.2016, S. 562, 5. Änderung: GMBl. Nr. 16-24 vom 20.03.2023, S. 330. Available online: https://www.baua.de/DE/Angebote/Regelwerk/TRBA/TRBA-460.html (accessed on 22 October 2023).
  8. Denham, S.T.; Wambaugh, M.A.; Brown, J.C.S. How Environmental Fungi Cause a Range of Clinical Outcomes in Susceptible Hosts. J. Mol. Biol. 2019, 431, 2982–3009. [Google Scholar] [CrossRef] [PubMed]
  9. Kommission für Krankenhaushygiene und Infektionsprävention beim Robert Koch-Institut (RKI). Anforderungen an die Hygiene bei der medizinischen Versorgung von immunsupprimierten Patienten. Bundesgesundheitsblatt-Gesundheitsforschung-Gesundheitsschutz 2010, 53, 357–388. [Google Scholar] [CrossRef] [PubMed]
  10. Rácil, Z.; Kocmanová, I.; Wagnerová, B.; Winterová, J.; Mayer, J. Vyuzití detekce galaktomannanu pro casnou diagnostiku invazivní aspergilózy [Contribution of galactomannan antigen detection to early diagnosis of invasive aspergillosis]. Klin. Mikrobiol. Infekc. Lek. 2007, 13, 176–183. [Google Scholar] [PubMed]
  11. Einsele, H.; Loeffler, J. Contribution of new diagnostic approaches to antifungal treatment plans in high-risk haematology patients. Clin. Microbiol. Infect. 2008, 14 (Suppl. S4), 37–45. [Google Scholar] [CrossRef] [PubMed]
  12. Verdaguer, V.; Walsh, T.J.; Hope, W.; Cortez, K.J. Galactomannan antigen detection in the diagnosis of invasive aspergillosis. Expert Rev. Mol. Diagn. 2007, 7, 21–32. [Google Scholar] [CrossRef] [PubMed]
  13. Foy, P.C.; van Burik, J.A.; Weisdorf, D.J. Galactomannan antigen enzyme-linked immunosorbent assay for diagnosis of invasive aspergillosis after hematopoietic stem cell transplantation. Biol. Blood Marrow Transplant. 2007, 13, 440–443. [Google Scholar] [CrossRef] [PubMed]
  14. Bundesministerium für Arbeit und Soziales. Verordnung über Sicherheit und Gesundheitsschutz bei Tätigkeiten mit Biologischen Arbeitsstoffen (Biostoffverordnung—BioStoffV). 2013. Available online: https://www.gesetze-im-internet.de/biostoffv_2013/BJNR251410013.html (accessed on 4 April 2023).
  15. Feller, W. An Introduction to Probability Theory and Its Applications. Band 1; Wiley: New York, NY, USA, 1950; ISBN 0-471-25708-7. [Google Scholar]
  16. Deutscher Wetterdienst (DWD). Bundesoberbehörde im Geschäftsbereich des Bundesministeriums für Verkehr und Digitale Infrastruktur, Frankfurter Straße 135, 63067 Offenbach, (CDC—Clima Data Center). Available online: https://cdc.dwd.de/portal/202209231028/view1 (accessed on 4 April 2023).
  17. Arndt, T. Galaktomannan-Test. In Lexikon der Medizinischen Laboratoriumsdiagnostik; Gressner, A.M., Arndt, T., Eds.; Springer Reference Medizin; Springer: Berlin/Heidelberg, Germany, 2019. [Google Scholar] [CrossRef]
  18. Haase, G.; Hamprecht, A.; Held, J.; Kurzai, O.; Rath, P.M.; Schwarz, R.; Steinmann, J.; Bader, O.; Behrens-Baumann, W.; Gräser, Y.; et al. Mikrobiologisch-Infektiologische Qualitätsstandards (MiQ) der Deutschen Gesellschaft für Hygiene und Mikrobiologie (DGHM) e.v., Pilzinfektionen Teil I und II, 14-15/2021; Urban & Fischer: München, Germany; Jena, Germany, 2021. [Google Scholar]
  19. Khot, P.D.; Ko, D.L.; Fredricks, D.N. Sequencing and analysis of fungal rRNA operons for development of broad-range fungal PCR assays. Appl. Environ. Microbiol. 2009, 75, 1559–1565. [Google Scholar] [CrossRef] [PubMed]
  20. Springer, J.; Goldenberger, D.; Schmidt, F.; Weisser, M.; Wehrle-Wieland, E.; Einsele, H.; Frei, R.; Löffler, J. Development and application of two independent real-time PCR assays to detect clinically relevant Mucorales species. J. Med. Microbiol. 2016, 65, 227–234. [Google Scholar] [CrossRef] [PubMed]
  21. Donnelly, J.P.; Chen, S.C.; Kauffman, C.A.; Steinbach, W.J.; Baddley, J.W.; Verweij, P.E.; Clancy, C.J.; Wingard, J.R.; Lockhart, S.R.; Groll, A.H.; et al. Revision and Update of the Consensus Definitions of Invasive Fungal Disease from the European Organization for Research and Treatment of Cancer and the Mycoses Study Group Education and Research Consortium. Clin. Infect. Dis. 2020, 71, 1367–1376. [Google Scholar] [CrossRef] [PubMed]
  22. Robert Koch-Institut (RKI); Nationales Referenzzentrum für Surveillance (NRZ). Definitionen nosokomialer Infektionen für die Surveillance im Krankenhaus-Infektions-Surveillance-System (KISS-Definitionen). 07/2017. Available online: https://www.rki.de/DE/Content/Infekt/Krankenhaushygiene/Nosokomiale_Infektionen/Downloads/RKI_Definitionen_nosokomialer_Infektionen_E-Book.pdf?__blob=publicationFile (accessed on 22 October 2023).
  23. van Burik, J.A.; Magee, P.T. Aspects of fungal pathogenesis in humans. Annu. Rev. Microbiol. 2001, 55, 743–772. [Google Scholar] [CrossRef] [PubMed]
  24. Belizario, J.A.; Lopes, L.G.; Pires, R.H. Fungi in the indoor air of critical hospital areas: A review. Aerobiologia 2021, 37, 379–394. [Google Scholar] [CrossRef] [PubMed]
  25. Martins-Diniz, J.N.; da Silva, R.A.; Miranda, E.T.; Mendes-Giannini, M.J. Monitoramento de fungos anemófilos e de leveduras em unidade hospitalar [Monitoring of airborne fungus and yeast species in a hospital unit]. Rev. Saude Publica 2005, 39, 398–405. [Google Scholar] [CrossRef] [PubMed]
  26. Rao, C.Y.; Burge, H.A.; Chang, J.C. Review of quantitative standards and guidelines for fungi in indoor air. J. Air Waste Manag. Assoc. 1996, 46, 899–908. [Google Scholar] [CrossRef] [PubMed]
  27. Viscoli, C.; Castagnola, E. Geoclimatic factors and invasive aspergillosis after allogeneic hematopoietic stem cell transplantation: New perspectives for patient management? Clin. Infect. Dis. 2010, 50, 1598–1600. [Google Scholar] [CrossRef] [PubMed]
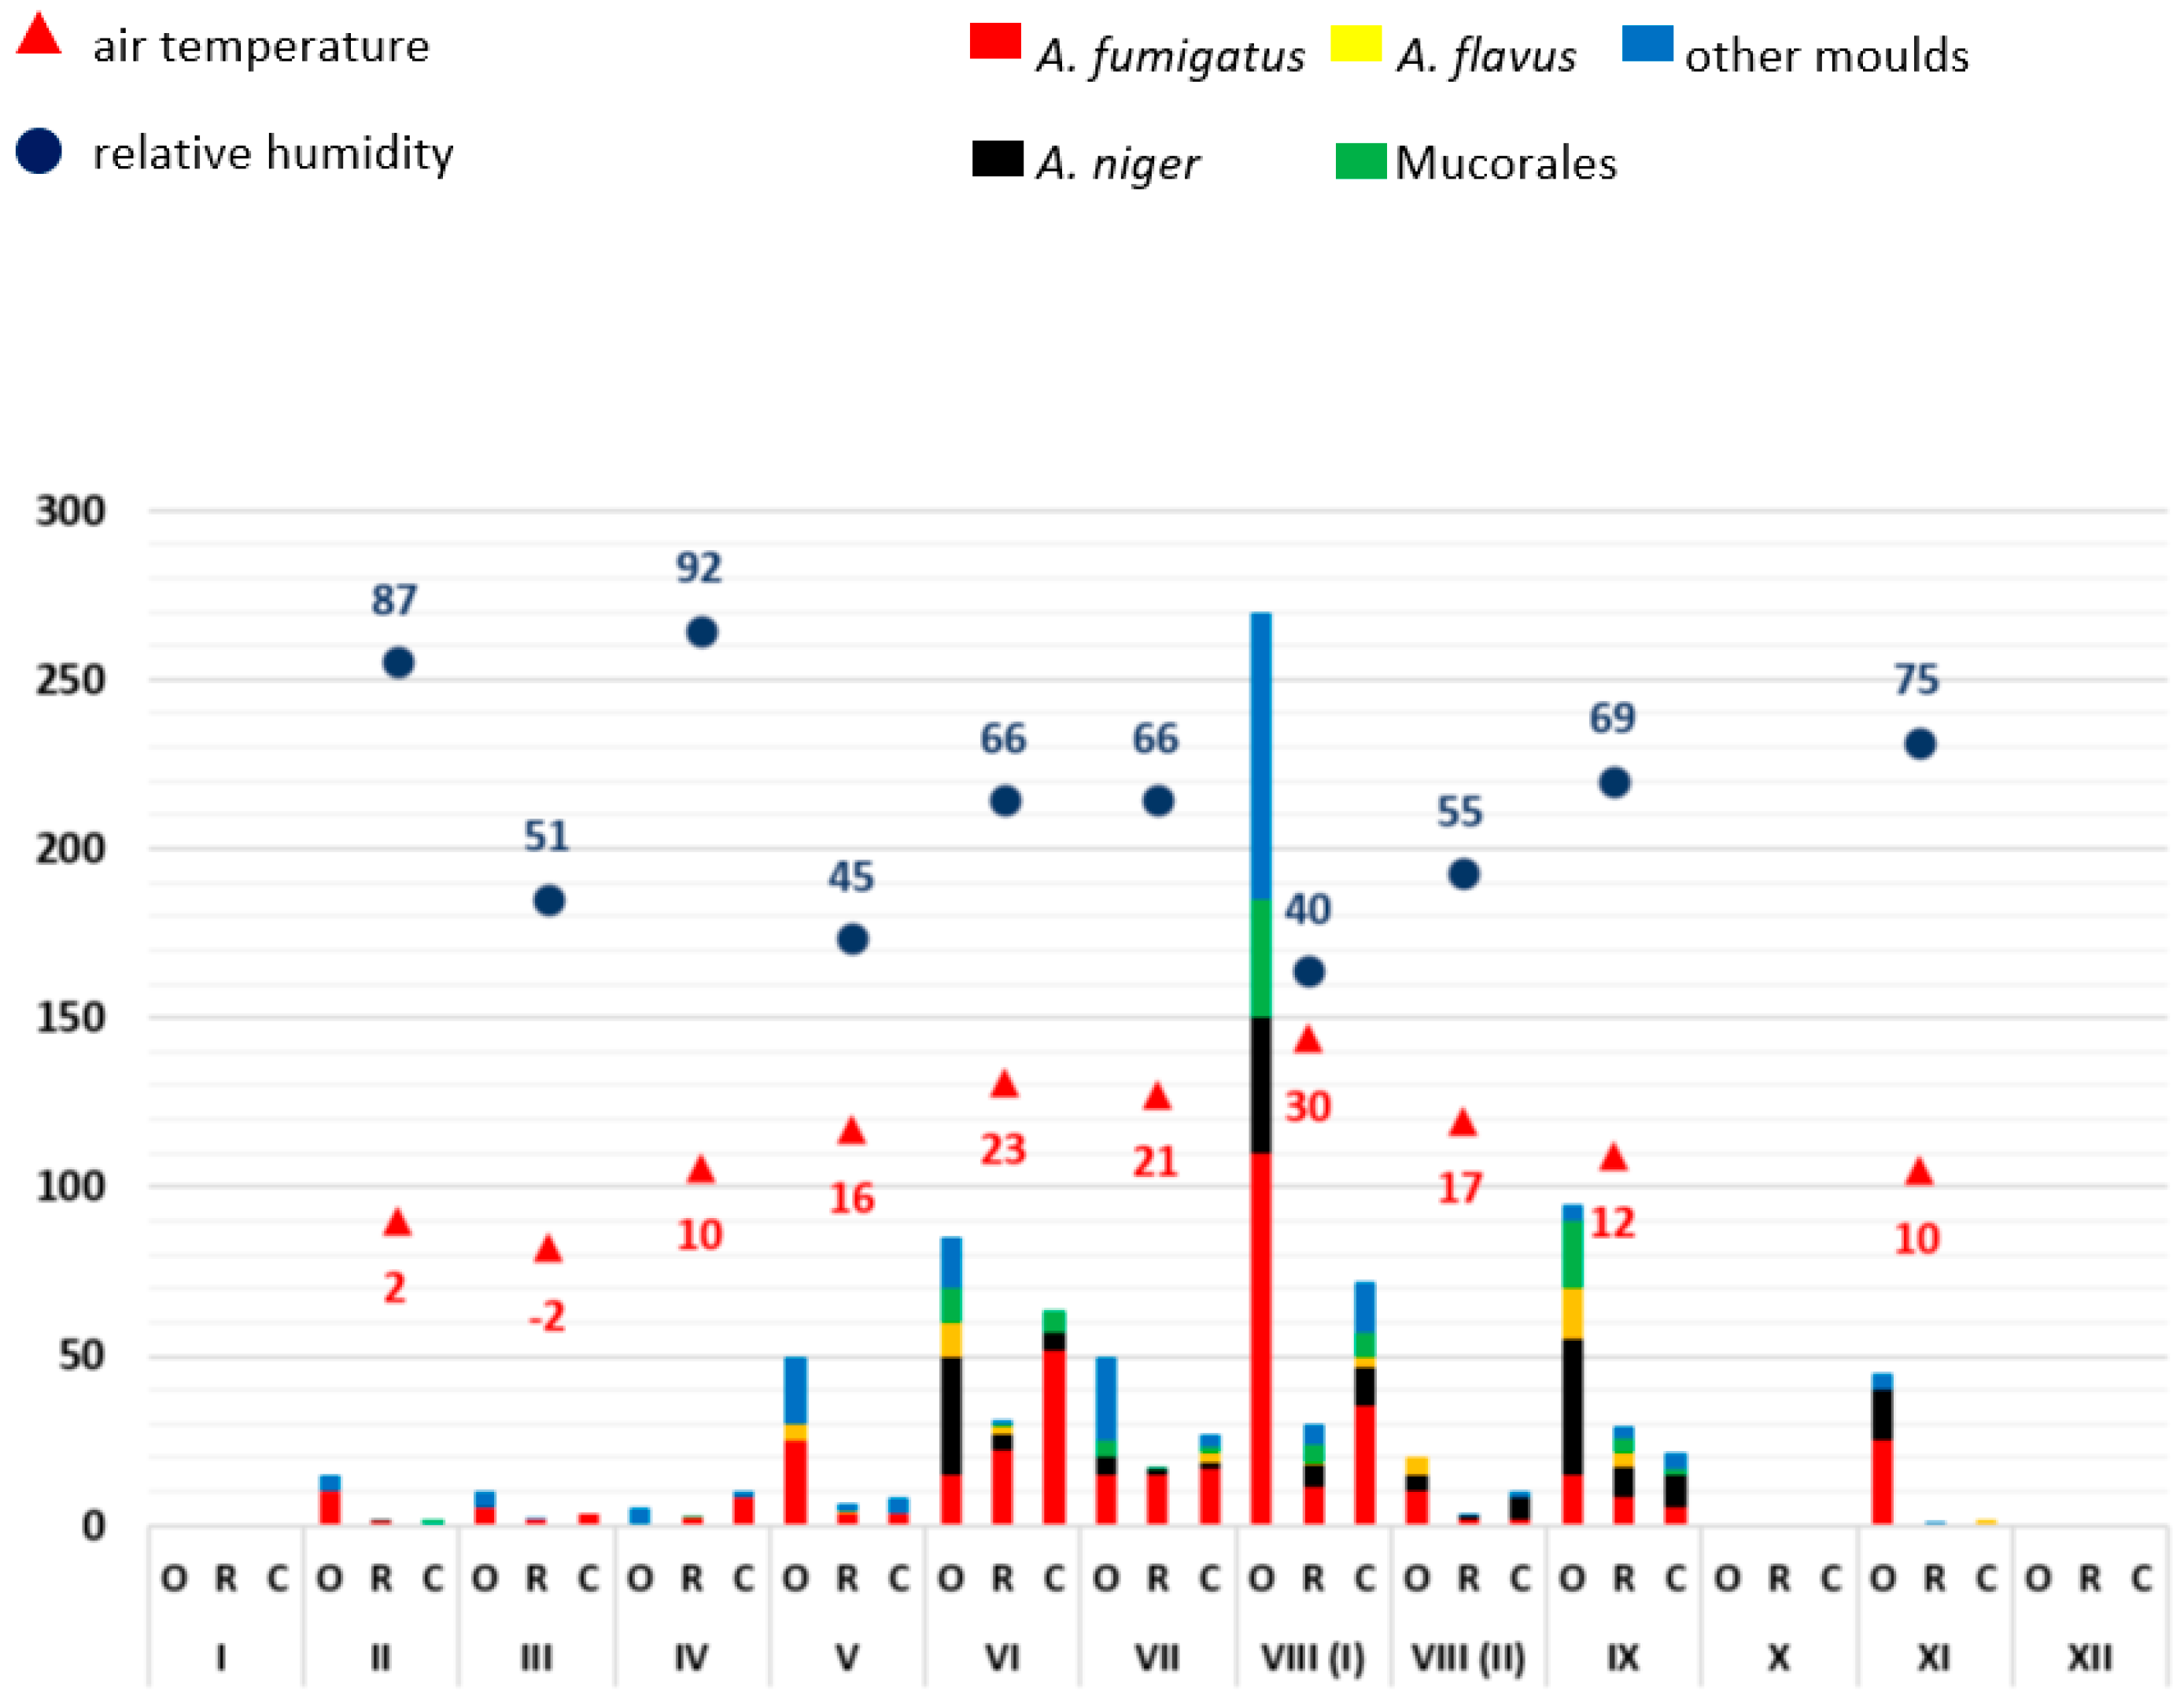
Figure 1. Overview of the frequency of mould detections at ward A0 in 2018. The moulds detected are colour-coded (see key in the figure). The average relative outdoor humidity in % and the air temperature in °C (2 m above the ground) are also shown. The months are indicated in Roman numerals. The number of pathogens detected is shown as colony-forming units (CFU/m3; mean values). O: measured values outside the building (reference measuring point), R: measured values in patient rooms, C: measured values in the corridor.
Microorganisms 11 02652 g001
Figure 2. Overview of the frequency of mould detections at ward A0 in 2019. The moulds detected are colour-coded (see key in the figure). The average relative outdoor humidity in % and the air temperature in °C (2 m above the ground) are also shown. The months are indicated in Roman numerals. The number of pathogens detected is shown as colony-forming units (CFU/m3; mean values). O: measured values outside the building (reference measuring point), R: measured values in patient rooms, C: measured values in the corridor.
Microorganisms 11 02652 g002
Figure 3. Overview of the frequency of mould detections at ward A0 (with relocation) in 2020. The moulds detected are colour-coded (see key in the figure). The average relative outdoor humidity in % and the air temperature in °C (2 m above the ground) are also shown. The months are indicated in Roman numerals. The number of pathogens detected is shown as colony-forming units (CFU/m3; mean values). O: measured values outside the building (reference measuring point), R: measured values in patient rooms, C: measured values in the corridor.
Microorganisms 11 02652 g003
Figure 4. Overview of the frequency of mould detections at ward A0 (with relocation) in 2021. The moulds detected are colour-coded (see key in the figure). The average relative outdoor humidity in % and the air temperature in °C (2 m above the ground) are also shown. The months are indicated in Roman numerals. The number of pathogens detected is shown as colony-forming units (CFU/m3; mean values). O: measured values outside the building (reference measuring point), R: measured values in patient rooms, C: measured values in the corridor.
Microorganisms 11 02652 g004
Figure 5. Overview of the frequency of mould detections at ward A0 (with relocation) in 2022. The moulds detected are colour-coded (see key in the figure). The average relative outdoor humidity in % and the air temperature in °C (2 m above the ground) are also shown. The months are indicated in Roman numerals. The number of pathogens detected is shown as colony-forming units (CFU/m3; mean values). O: measured values outside the building (reference measuring point), R: measured values in patient rooms, C: measured values in the corridor.
Microorganisms 11 02652 g005
Table 1. Overview of occupancy rates, diagnostics and mould infections, ward A0, years 2018–2022.
2018
Month010203040506070809101112Total
Patients a (n)8774998486759385798879771006
Patient days a (n)7156318046807397568527327258678416769018
Aspergillus AG detection (n)0000010000012
Aspergillus culture pos. (n)0101000000002
Aspergillus PCR pos. (n)0000000000000
Mucorales PCR pos. (n)0000000000000
Mould infections NI b (n)0000010000001
Mould infections EORTC (n) c000001 d0000001
2019
Month010203040506070809101112Total
Patients a (n)707176777476757977778681919
Patient days a (n)7247357948107897437358528857138447299353
Aspergillus AG detection (n)0000000000000
Aspergillus culture pos. (n)0000000010102
Aspergillus PCR pos. (n)0000000000000
Mucorales PCR pos. (n)0000001000001
Mould infections NI b (n)0000001000001
Mould infections EORTC (n) c0000001 d0001 d02
2020
Month01020304 e05 e06070809101112Total
Patients a (n)776887707477816260695056831
Patient days a (n)7897448006426636897777646987904145678337
Aspergillus AG detection (n)0000000100001
Aspergillus culture pos. (n)0000000100001
Aspergillus PCR pos. (n)0000000100001
Mucorales PCR pos. (n)0000000000000
Mould infections NI b (n)0000000100001
Mould infections EORTC (n) c00000001 d00001
2021
Month010203040506070809101112 fTotal
Patients a (n)565270646175747980884940788
Patient days a (n)5905326866166137926937928618415082697793
Aspergillus AG detection (n)0000000000000
Aspergillus culture pos. (n)0010000010002
Aspergillus PCR pos. (n)0000000000000
Mucorales PCR pos. (n)0000000000000
Mould infections NI b (n)0000000000000
Mould infections EORTC (n) c0000000000000
2022
Month01 f02 f03040506070809101112Total
Patients a (n)564537465975765971718080755
Patient days a (n)4703882633886016897936147316306927406999
Aspergillus AG detection (n)0000100100013
Aspergillus culture pos. (n)0010210000015
Aspergillus PCR pos. (n)0000000100023
Mucorales PCR pos. (n)0000000000000
Mould infections NI b (n)0000000000000
Mould infections EORTC (n) c00000001 g0001 d2
a Length of stay >3 days. b Nosocomial infection (NI) according to NRC-NI definition (>48h) [22]. c Infection according to EORTC criteria [21]. d Infection probable according to EORTC classification [21]. e Ward transfer from ward A0 (Building 23A) to ward 28-1 (Building 28). f Ward transfer from ward A0 (Building 23B) to ward 10B (Building 23B). g Infection confirmed according to EORTC classification [21].
Disclaimer/Publisher’s Note: The statements, opinions and data contained in all publications are solely those of the individual author(s) and contributor(s) and not of MDPI and/or the editor(s). MDPI and/or the editor(s) disclaim responsibility for any injury to people or property resulting from any ideas, methods, instructions or products referred to in the content.