Article

Estimation of Carbon Metabolism in Saccharomyces cerevisiae Acclimatized to Glycerol Assimilation with Quantitative PCR

1
Graduate School of Bionics, Tokyo University of Technology, 1404-1 Katakuramachi, Hachioji 192-0982, Tokyo, Japan
2
School of Bioscience and Biotechnology, Tokyo University of Technology, 1404-1 Katakuramachi, Hachioji 192-0982, Tokyo, Japan
*
Author to whom correspondence should be addressed.
These authors contributed equally to this work.
Microorganisms 2022, 10(6), 1173; https://doi.org/10.3390/microorganisms10061173
Submission received: 3 May 2022 / Revised: 23 May 2022 / Accepted: 6 June 2022 / Published: 7 June 2022
(This article belongs to the Special Issue Functional Microbial Diversity for Biotechnology)

Abstract

:
Saccharomyces cerevisiae has the potential to produce value-added chemicals; however, this strain is restricted by using glycerol as a carbon source. Although acclimatization of S. cerevisiae as a glycerol-assimilating strain was confirmed so far, the reason why S. cerevisiae can be acclimatized was not clear in detail with limited information on the metabolic changes. In this report, glycerol-assimilating strains from S. cerevisiae BY4741 were isolated, and the biomass production, ethanol fermentation, and transcription levels related to glycolysis and the tricarboxylic acid cycle under aerobic and slightly anaerobic conditions were analyzed. As the results show, although µmax was equal to 0.15 h−1 between wildtype and glycerol-assimilating strains in an aerobic culture including glucose, the differences in max biomass production and percentage yields of ethanol and transcription levels between the two strains were shown. In slightly anaerobic culture, the differences in transcription levels downstream of glycolysis were also displayed. In the case of the glycerol-assimilating strain with glycerol under aerobic conditions, although the transcription levels related to ethanol production were sufficient, the ethanol production was not detected. Additionally, the biomass production reached a plateau even in the culture containing sufficient glycerol, indicating that the redox imbalance even in the cells of the glycerol-acclimatized strain could disturb the utilization of glycerol. The obtained knowledge will promote the use of glycerol resources with the glycerol-acclimatized S. cerevisiae in view of carbon recycling.

1. Introduction

In industry, glycerol is abundantly produced as a byproduct. As an example, under biodiesel production, a considerable amount of crude glycerol is produced as a byproduct with its weight equivalent to 10% (w/w) of the produced biodiesel weight during transesterification with animal fats/vegetable oils and alcohols [1]. By producing not only biodiesel but also foodstuff [2], etc., a large amount of crude glycerol is produced and the price of the crude glycerol is discounted to around 225~235 USD ton−1 [3]; therefore, glycerol can be an attractive carbon resource. Additionally, the use of the crude glycerol can also be attractive because it deeply relates to carbon recycling societies. Therefore, research and development for the effective use of the promising glycerol are strongly required based on the abundance and carbon recycling [4]. Microbial utilization is one such attractive method since several microorganisms exhibit a tolerance to the contaminants in crude glycerol and an ability to utilize glycerol as an alternate carbon source for sugars [2]. So far, the method of using microorganisms has been evaluated directly to convert glycerol to the value-added chemicals [2]. In recent decades, Saccharomyces cerevisiae has attracted a lot of attention in the field of industrial biotechnology to produce biofuel, fine pharmaceutical chemicals, and many value-added substances [5] because the strain exhibits robustness towards several conditions in industrial bioprocesses [6], safety [7], low sensitivity to several stresses derived from methanol and heavy-ions unlike bacteria [8,9], abundantly available biological and genetic information [6,10], and easy manipulability for creating mutant strains [10]. However, S. cerevisiae shows higher utilization activity for glucose and much lower for glycerol, and the strain requires a long acclimatization period to utilize glycerol [11]. So far, unfortunately, information with regard to S. cerevisiae including the switching of intracellular metabolism by glycerol acclimatization has not been revealed in detail [12].
This study tried to evaluate the cell response of the glycerol-acclimatized strain derived from S. cerevisiae. A haploid strain S. cerevisiae BY4741 as the wildtype was cultivated, step-wise, with the restricted liquid media containing glycerol as a carbon source, and the isolates were obtained as glycerol-acclimatized strains derived from BY4741 on an agarose plate of synthetic glycerol medium. Afterwards, the acclimatized strains were aerobically cultivated in the synthetic media containing glucose or glycerol, respectively, and the different utilization activities were evaluated among the acclimatized strains and the wildtype. Additionally, the intracellular metabolism under aerobic and slightly anaerobic conditions (hereafter, simply anaerobic conditions) were determined using analyses of gene transcription levels with quantitative PCR (qPCR). Additionally, the transformation of the acclimatized strains was performed with the plasmid harboring the S. cerevisiae ori region, aiming to show the possibility of glycerol use with the transformant derived from the acclimatized strains. This study aims to disclose the response of the BY4741 wildtype strain under the glycerol condition. The obtained knowledge could estimate the metabolic reaction-limiting steps and be useful for creating glycerol-assimilating strains with genetic engineering for value-added products by using glycerol (e.g., waste glycerol as a by-product).

2. Materials and Methods

2.1. Experimentally Original Strains and Culturing Media

The Saccharomyces cerevisiae BY4741 strain (MATa, his3Δ1, leu2Δ0, met15Δ0, ura3Δ0) [13] was purchased from Funakoshi (Tokyo, Japan) as a laboratory haploid strain. Optical density at 600 nm (OD600) was measured to quantify the strain amount with U-2900 (Hitachi High-Technologies Corporation, Tokyo, Japan). The media used in this paper were used as mentioned below. Firstly, yeast extract peptone dextrose medium (YPD: 10 g·L−1 yeast extract, 20 g·L−1 peptone, 20 g·L−1 glucose), which was a nutrient-rich medium for S. cerevisiae, was used to stimulate S. cerevisiae from the glycerol stock. Secondly, yeast extract peptone glycerol medium (YPG: 10 g·L−1 yeast extract, 20 g·L−1 peptone, 20 g·L−1 glycerol), which changed only one of the YPD components from sugar glucose to sugar alcohol glycerol, was used to apply S. cerevisiae nutrient restriction. Thirdly, yeast nitrogen base glycerol medium (YNBG: 6.7 g·L−1 yeast nitrogen base without amino acids, 20 g·L−1 glycerol, 20 mg·L−1 L-histidine, 100 mg·L−1 L-leucine, 20 mg·L−1 L-methionine, 20 mg·L−1 uracil), which switched the nitrogen source based on YPG and synthetic defined medium as mentioned below, was used to pick up the glycerol-acclimatized strains. The medium could provide S. cerevisiae glycerol as the main carbon source. The YNBG plate contained 1.5% (w/v) agarose in YNBG to separate colonies. Fourthly, synthetic-defined medium (SD: 6.7 g·L−1 yeast nitrogen base without amino acids, 20 g·L−1 glucose, 20 mg·L−1 L-histidine, 100 mg·L−1 L-leucine, 20 mg·L−1 L-methionine, 20 mg·L−1 uracil), which contained glucose instead of glycerol in YNBG, was used to check S. cerevisiae’s biological properties [14,15].

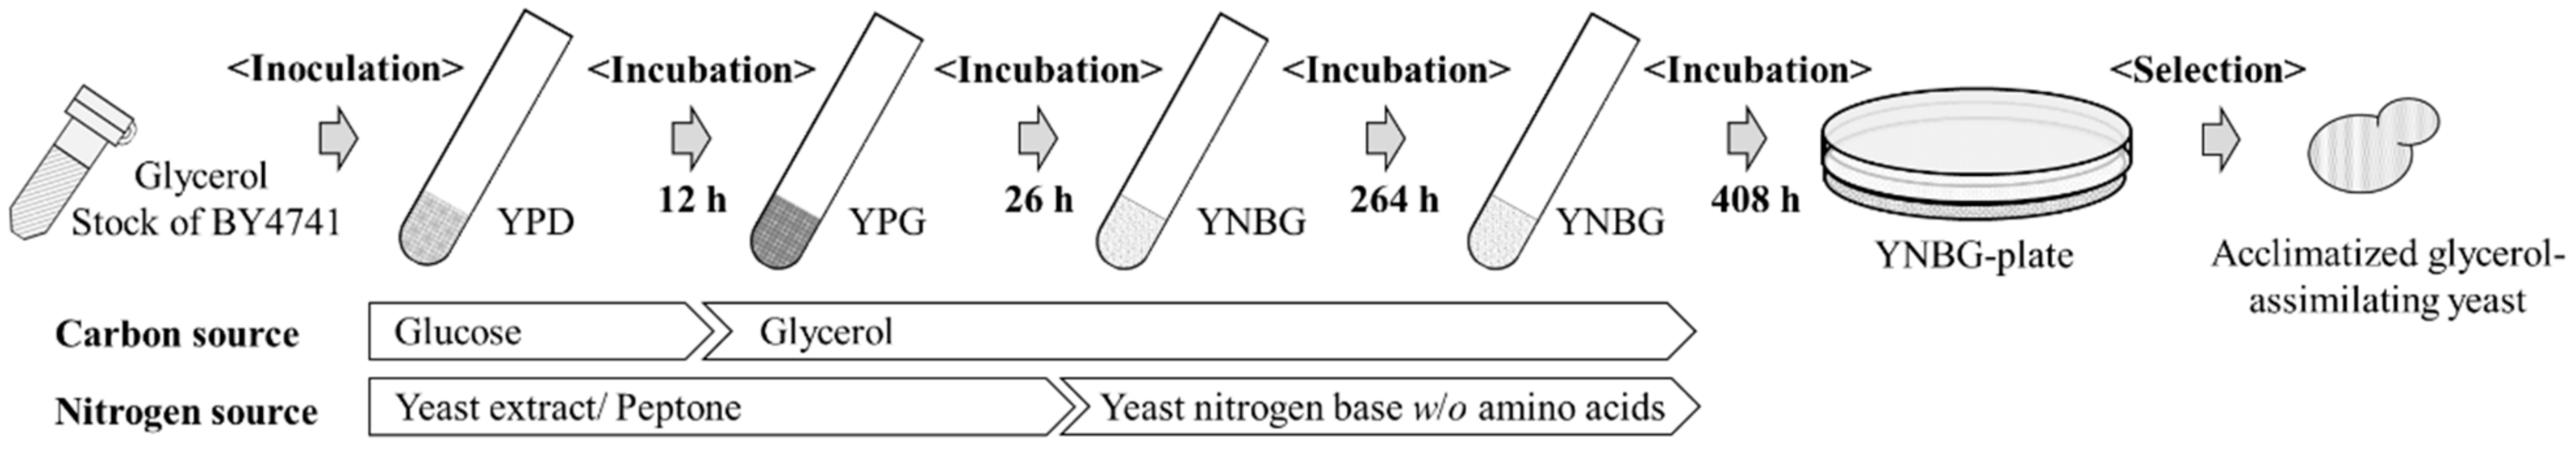
2.2. Selection of Acclimatized Strains in YNBG Medium

BY4741 wildtype strain was continuously cultured to be acclimatized as a glycerol-assimilating strain in restricted media of carbon sources under aerobic conditions (Figure 1). Stocked BY4741 was recovered in YPD medium at 140 spm (stroke per minutes) at 30 °C for 12 h. The recovered strain was cultured in YPG medium inoculated at initial OD600 = 0.1 at 140 spm at 30 °C for 26 h. Then, the strain was bred inoculated at the initial OD600 = 0.1 at 140 spm at 30 °C for 264 and 408 h in the YNBG media. Later, the diluted broth was spread on the YNBG plate, and the acclimatized glycerol-assimilating strains were isolated from a single colony.

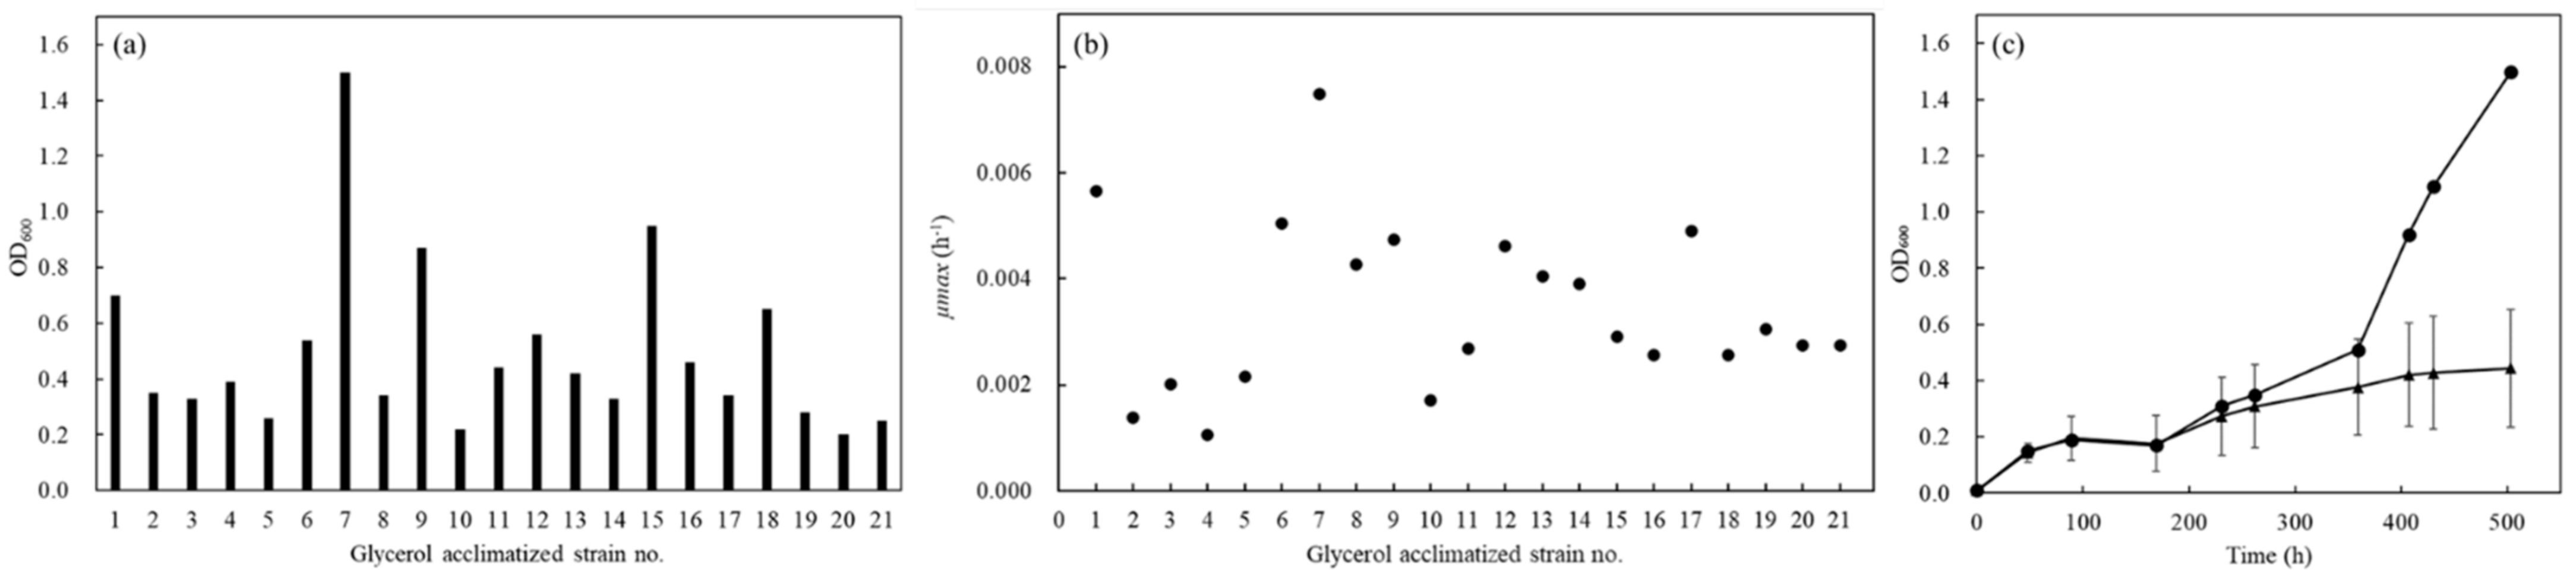
2.3. Primary Evaluation of Growth of Isolated Glycerol-Acclimatized Strains in YNBG Medium

Twenty-one strains isolated from the YNBG plate were cultured aerobically in YNBG at 140 spm at 30 °C for 572 h. The pre-incubated strains were inoculated at initial OD600 = 0.01, and cultivated aerobically in YNBG medium at 140 spm at 30 °C for 503 h. The growth was evaluated with the values of OD600.

2.4. Secondary Evaluation of Growth of No.7 in YNBG Medium

The isolated strain no.7 was cultured aerobically in YNBG at 140 spm at 30 °C as a pre-cultivation. The pre-incubated no.7 at the middle of the exponential phase was harvested and inoculated as at initial OD600 = 0.01. The cultivation was performed in YNBG medium at 140 spm at 30 °C. Test-tubes were equipped with a silico plug under aerobic conditions and with a tightly held lid for anaerobic conditions.

2.5. Evaluation of Relative Growth Rate and Doubling Time

Relative growth rate (µ) and doubling time (td) were calculated using the formulas presented below (t1: sampling time 1 (h); t2: sampling time 2 (h) (t2 > t1); S1: scale of concentration indicated by OD600 at t1; S2: scale of concentration indicated by OD600 at t2).
μ   =   l n ( S 2 / S 1 ) t 2     t 1   h 1
t d   =   l n 2 μ m a x   h

2.6. Determination of Biomass Production

Dry cell weights (DCW) of wildtype strain and no.7 were determined with calibration curves of OD600 versus DCW specifically to both strains, respectively. The biomass production was calculated with the DCW and its volume and the unit was defined as g·L−1.

2.7. Quantification of Carbon Source and Ethanol by HPLC

Under aerobic condition performed with test-tubes equipped with a silico plug, the cultivation of the wildtype strain was started at OD600 = 0.1 in SD, and no.7 strain was also started at OD600 = 0.1 in SD and YNBG at 140 spm at 30 °C, respectively. In total, 1 mL of each broth was collected at the middle of the exponential phase, and the supernatant was obtained by centrifugation at 5000× g for 1 min. On the other hand, under anaerobic conditions performed with test-tubes equipped with a tightly held lid, the wildtype strain was inoculated at OD600 = 1 in SD, and no.7 strain was also inoculated at OD600 = 1 in SD and YNBG at 140 spm at 30 °C, respectively. The anaerobic condition was set up by tightly closing the lid of the test-tube. Then, 1 mL of each broth was collected at 24 h, and the supernatant was obtained by centrifugation at 5000× g for 1 min. The supernatant was filtered with a Millex® syringe filter (pore size 0.45 µm) (Merck Millipore Ltd., County Cork, Ireland), and the flow-through was analyzed with the HPLC system. The HPLC system consisted of a LC-20AD pump (Shimadzu, Kyoto, Japan), a CTO-10A column oven (Shimadzu), an SPD-20AV detector (Shimadzu), a RezexTM RHM-Monosaccharide H+ column (300 mm × 7.8 mm) (Phenomenex, Tokyo, Japan), and a 7725 injector (Rheodyne, Bensheim, Germany). The concentrations of glucose, glycerol, and ethanol were identified and quantified at 190 nm with chromatographic data monitored by the SPD-20AV detector. The mobile phase was water, the column oven was set at 30 °C, and the flow rate was 0.6 mL·min−1.

2.8. Confirmation of Relevance of Glycerol-Acclimatized Strain No.7 to Wildtype

Glycerol-acclimatized strain no.7 was determined as the strain derived from BY4741 by sequencing glycerol 3-phosphatase 2 (GPP2). The gene of GPP2 was amplified by PCR with the specific primer-pair for GPP (forward primer: atgggattgactactaaacctctatc; reverse primer: ccatttcaacagatcgtcc). The amplicon was sequenced by Macrogen Japan Corporation (Tokyo, Japan). Gene sequence information of BY4741 was obtained from the Basic Local Alignment Search Tool supported by the National Center for Biotechnology Information in the US.

2.9. Transcript Analysis

Wildtype and no.7 strains were cultivated in SD at 140 spm at 30 °C under aerobic/anaerobic conditions; no.7 strain was also in YNBG at 140 spm at 30 °C under aerobic/anaerobic conditions. Aerobic and anaerobic conditions were created with a test-tube equipped with a silico plug and a tightly held lid. The strains collected were approximately 5 mg estimated using an OD600-dry cell weight (DCW) calibration curve by centrifugation at 5000× g for 1 min. The collected strains were mixed with 50 µL of QIAzol Lysis Reagent (QIAGEN, Tokyo, Japan) and shaken for 5 min. After keeping the shaken samples at 23 °C for 5 min, 10 µL of chloroform was added and placed on ice for 3 min. The treated samples were centrifuged at 21,500× g for 1 min, and the supernatant was mixed with 25 µL of isopropanol. The supernatant was discarded after centrifugation at 21,500× g for 1 min and the precipitant was rinsed with 75% ethanol. The dried precipitant was dissolved in 10 µL of RNase free water. The prepared sample as total RNA was used to synthesize complementary DNA (cDNA) using a ReverTra Ace® qPCR RT Master Mix with gDNA Remover (TOYOBO, Osaka, Japan). With the cDNA, qPCR was performed with THUNDERBIRD SYBR qPCR Mix (TOYOBO) using Mx qPCR Systems (Agilent, CA, USA). The average threshold cycle values were evaluated throughout the logarithmic amplification phase, and were normalized using the level of the RDN18. The qPCR primers (Table S1) were designed by Primer3Plus algorithm (https://dev.primer3plus.com/index.html (accessed on 6 January 2022)) based on each predicted gene sequence from the genome information. The abbreviated gene information is listed in Supplementary Table S1 and the primer information is also displayed in Supplementary Table S2.

2.10. Yeast Transformation

Transformation of glycerol-acclimatized no.7 was performed with pATP425 [16] using the lithium acetate method with a S. cerevisiae Direct Transformation kit (FUJIFILM Wako chemicals, Saitama, Japan). The transformants were isolated on a selective SD plate containing 1.5% (w/v) agarose at 30 °C for 2–3 days.

3. Results and Discussion

3.1. Overview of Picking up BY4741 Strains Acclimatized to Glycerol Assimilation

Yeast model strain S. cerevisiae BY4741 (wildtype strain, hereafter expressed simply ‘wildtype’) was pressured, stepwise, to be acclimatized for assimilating glycerol as the carbon source with the three media, YPD, YPG, and YNBG (Figure 1). By cultivating in YNBG, although the strains did not show increasing OD600 as cell-growth in the first cultivation for 264 h, the strains exhibited gradually enhancing OD600 to over 0.5 in the second cultivation for 408 h.
The glycerol utilization of S. cerevisiae was surveyed, and the findings support selection of the specific strains. The acclimatization of S. cerevisiae with a long cultivation time in the synthetic glycerol medium was also shown by previous reports [17]. The selection method with the stepwise carbon-restricted media was appropriate for isolating the glycerol-acclimatized strains in our study (Figure 1).

3.2. Growth Profiles of Glycerol-Acclimatized Strains

The cultivated group was acclimatized to utilize glycerol in the second YNBG cultivation. Finally, 21 strains were successfully picked up as the strains acclimatizing to utilize glycerol on the YNBG plate and named as no.1 to no.21. The growth properties of no.1~21 strains were analyzed primarily to select the most acclimatized strain in the group (Figure 2). In the group, the values of OD600 indicating growth widely ranged from 0.2 to 1.5 after 503 h of cultivation, and the OD-value of no.7 was a top score (Figure 2a). Max relative growth rates (µmax) of those segregants were 0.0011~0.0075 h−1 (Figure 2b), and the best scores of µmax and doubling time of no.7 were 0.0075 h−1 and 93 h. However, the lag phase of no.7 was over 169 h and there were few differences in the group. Strain no.7 showed different growth in the acclimatized group, especially after cultivation for 169 h, and the OD-value was 1.5-fold higher than the average of the values in the group (Figure 2c). The no.7 was evaluated to reveal the strain origin by comparing the DNA sequence of GPP2, and 753 bp of the DNA sequence was identical between wildtype and no.7.
After the acclimatization, the 21 of segregants showed different growth curves in YNBG, indicating that the acclimatized BY4741 consisted of multiple strains (Figure 2). As the results showed, the wildtype had intraspecies diversity regarding glycerol assimilation that even derived from the purchased strain. As reported by Barnett et al. [18] and Swinnen et al. [17], S. cerevisiae strains over-cultivated in synthesized glycerol medium could have a high intraspecies diversity. The no.7 was picked up as the most glycerol-acclimatized strain in the group and was certified as the S. cerevisiae-derived strain. The no. 7 showed 0.0075 h−1 of µmax (td: 92.4 h) as the best score in the group; however, the value was quite low compared to µmax ≥ 0.08 h−1 of S. cerevisiae CBS 6412-13A [17]. Additionally, over 169 h of lag phase was long versus the lag phase ≤35 h of S. cerevisiae CBS 6412-13A [17]. Those results could suggest the possibility of insufficient acclimatization to the previously reported strain, meaning that the isolated strain no.7 was analyzed more in YNBG.

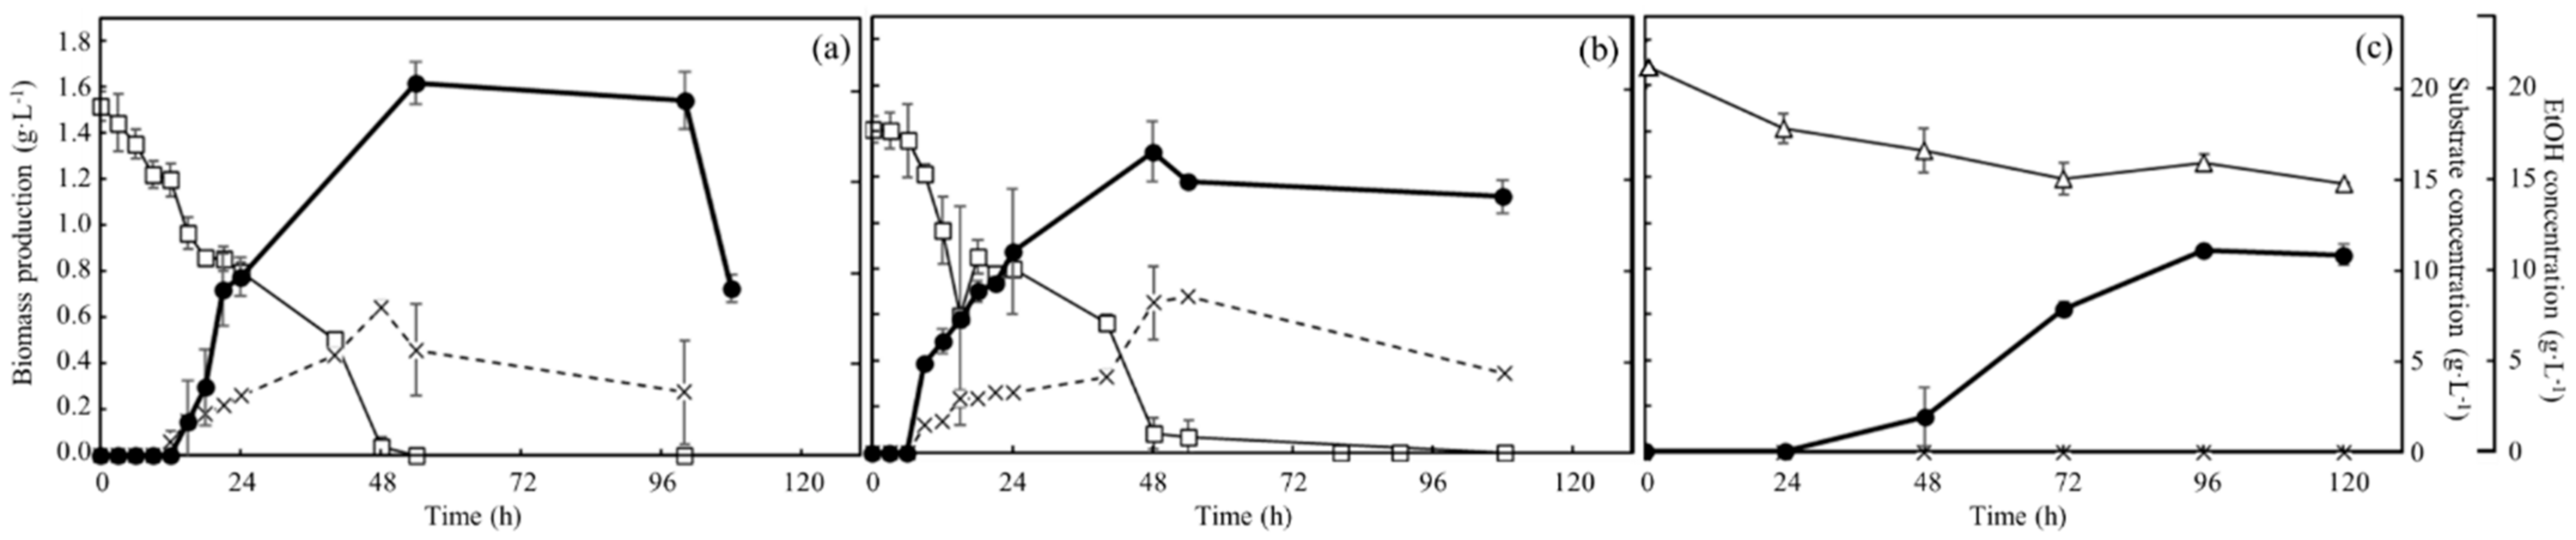
3.3. Time-Course Profiles of Biomass Production, Carbon Source Consumption, and Ethanol Production of Wildtype and No.7 in Each Medium under Aerobic Condition

The time-course profiles of concentrations of biomass production, substrates (glucose/glycerol), and ethanol under aerobic conditions are shown in Figure 3. Especially, the biomass profile of no.7 in YNBG was analyzed for a secondary evaluation. Regarding the wildtype in SD (Figure 3a), the biomass production was 1.6 g·L−1 at 54 h as the top value in those groups. The ethanol concentration reached 8.1 ± 0.4 g·L−1 at 48 h and gradually decreased to 3.4 g·L−1 at 100 h. Glucose was almost consumed in 48 h, and the timing was corresponding to the time points of the max values of biomass production and ethanol concentration. Depending on the analysis with OD600, the values of µmax and td of wildtype in SD were 0.15 h−1 and 4.5 h. Regarding no.7 in SD (Figure 3b), biomass production peaked at 1.3 ± 0.1 g·L−1 at 48 h. The ethanol concentration also peaked at 8.3~8.6 g·L−1 at 48~54 h, and then decreased to 4.6 g·L−1 by 108 h and glucose was almost completely consumed in 48 h. The µmax and td, calculated with OD600, were 0.15 h−1 and 4.6 h. Concerning no.7 in YNBG (Figure 3c), the biomass production was 0.9 ± 0.1 g·L−1 at 96 h as the maximum value in the condition. No ethanol concentration was detected until 120 h. Glycerol was consumed and the concentration was decreased from 21.4 to 15.1 g·L−1 in 72 h. No ethanol production was detected in YNBG and no correlation between glycerol consumption and ethanol production was confirmed. However, there was a correlation between biomass production and glycerol consumption, and the increase in biomass production reached the plateau at 96 h after stopping the consumption of glycerol at 72 h. The values of µmax and td of no.7 in YNBG were 0.034 h−1 and 20 h. After reaching the bottom value of glycerol once, the glycerol concentration was around 14.8~15.9 g·L−1 as the stationary value until 216 h.
The analyses of time-course profiles regarding concentrations of biomass, substrates (glucose and glycerol), and ethanol revealed the different properties of the strains and media (Figure 3). Culturing in SD, the µmax and the td of both strains of wildtype and no.7 in SD were 0.15 h−1 and 4.5~4.6 h. According to the findings and previous reports [19], the result displayed no difference in mitotic rate between no.7 and wildtype when glucose existed as a carbon source in the broth. However, there was a difference in biomass production between both strains, and the biomass production by no.7 could only reach around 80% of the one with the wildtype. The findings could indicate the change in metabolism in no.7 due to the acclimatization. Additionally, the results showing that the percent yield of ethanol by no.7 was approximately 95% at 54 h and higher than around 80% by wildtype might also mean a change in metabolism by the acclimatization. Both strains consumed the produced ethanol after glucose depletion at 48 h, indicating gluconeogenesis to secure an energy source. On the other hand, the µmax and the td of no.7 in YNBG were 0.034 h−1 and 20 h, indicating that those values were strongly enhanced 4.5-fold towards those (µmax: 0.0075 h−1; td: 92.4 h) of the isolate no.7 shown in Figure 2. Although the µmax of no.7 did not yet reach 0.08 h−1 of S. cerevisiae CBS 6412-13A [17], no.7 showed enough glycerol-assimilating activity comparing to wildtype. The no.7 gradually ingested glycerol in 72 h and biomass production increased until 96 h, meaning that no.7 could increase the biomass production with the glycerol taken-up in the cells after ingesting glycerol as a carbon source. After 96 h, no.7 did not consume glycerol and kept the biomass production for the time being. Additionally, the no.7 fermented no ethanol. Thus, no.7 could not aggressively perform the glycerol metabolism. Regarding the ethanol fermentation, no.7 might not control the redox balance in the cells. Generally, S. cerevisiae produces ethanol to recover NAD+. NAD+ is redacted to NADH when glyceraldehyde 3-phosphate reacts to d-1,3-bisphosphoglycerate in glycolysis [20,21]. The sum quantity of NAD+ and NADH is normally constant in a cell: without recovering NAD+, the metabolic reaction will stop after passing through glycolysis. In glycerol metabolism, ethanol could not be produced to regenerate NAD+ from NADH because of the difference in reduction power between glucose and glycerol, meaning that no.7 could not use glycerol as a carbon resource. Previously, Yu et al. constructed the strain overexpressing glycerol dehydrogenase and dihydroxyacetone kinase strongly to deliver glycerol to dihydroxyacetone phosphate as a component of glycolysis, resulting in the engineered strain being aerobically fermented ethanol with glycerol [22]. Therefore, although no ethanol fermentation by no.7 possibly implied little glycerol delivering to glycolysis, the possibility was low because of the biomass increase of no.7 with glycerol.

3.4. Time-Course Profiles of Carbon Source Consumption and Ethanol Production of Wildtype and No.7 in Each Medium under Anaerobic Condition

In the anaerobic broths of wildtype in SD, no.7 in SD, and no.7 in YNBG, the concentrations of glucose and glycerol as the substrate and ethanol as a kind of fermentation product were clearly detected by HPLC analyses (Table 1). After quantification, both strains of wildtype and no.7 in SD consumed 18.2 ± 0.5 and 21.6 ± 0.5 g·L−1 of glucose in 24 h, and those strains produced 8.5 ± 0.2 and 10.2 ± 0.5 g·L−1 of ethanol. The theoretical ethanol yield from 20 g·L−1 of glucose was 10.2 g·L−1, and wildtype and no.7 displayed 92.0 ± 4.7% and 92.4 ± 4.7% of the percent yield of ethanol in the culturing condition under the anaerobic condition in this study. On the other hand, no.7 in YNBG used no glycerol and fermented no ethanol.
Concerning wildtype in SD, no.7 in SD, and no.7 in YNBG, the anaerobic tendencies of using substrates (glucose and glycerol) and producing ethanol were evaluated (Table 1). In this study, wildtype and no.7 displayed around 8.5~10.2 g·L−1 and 92% as the yield and percent yield of ethanol. According to previous reports [23], the ethanol fermentation of BY4741 is 104.4 ± 3.1 g·L−1, and the percent yield of ethanol was 84.4–89.6%. Comparing our results with the previously reported ones, the values of ethanol fermentation in this study were better or higher. Therefore, with continuously adding glucose or increasing glucose concentration in the medium, wildtype and no.7 could possibly show the enhanced ethanol yield. On the other hand, no.7 performed no glycerol consumption, and no ethanol fermentation even under anaerobic conditions. The reason why no.7 did not ferment ethanol with glycerol might be that the strain could not control the redox balance in cells requiring surplus oxidation power towards NADH or NADPH during glycerol assimilation through these pathways. According to a previous report [24], nitrite was used to control redox balance in yeast cell as an oxidant and a reductant (balancer) and supported ethanol fermentation with a carbon source not derived from glucose. Therefore, no.7 could not control the redox balance and ferment no ethanol.

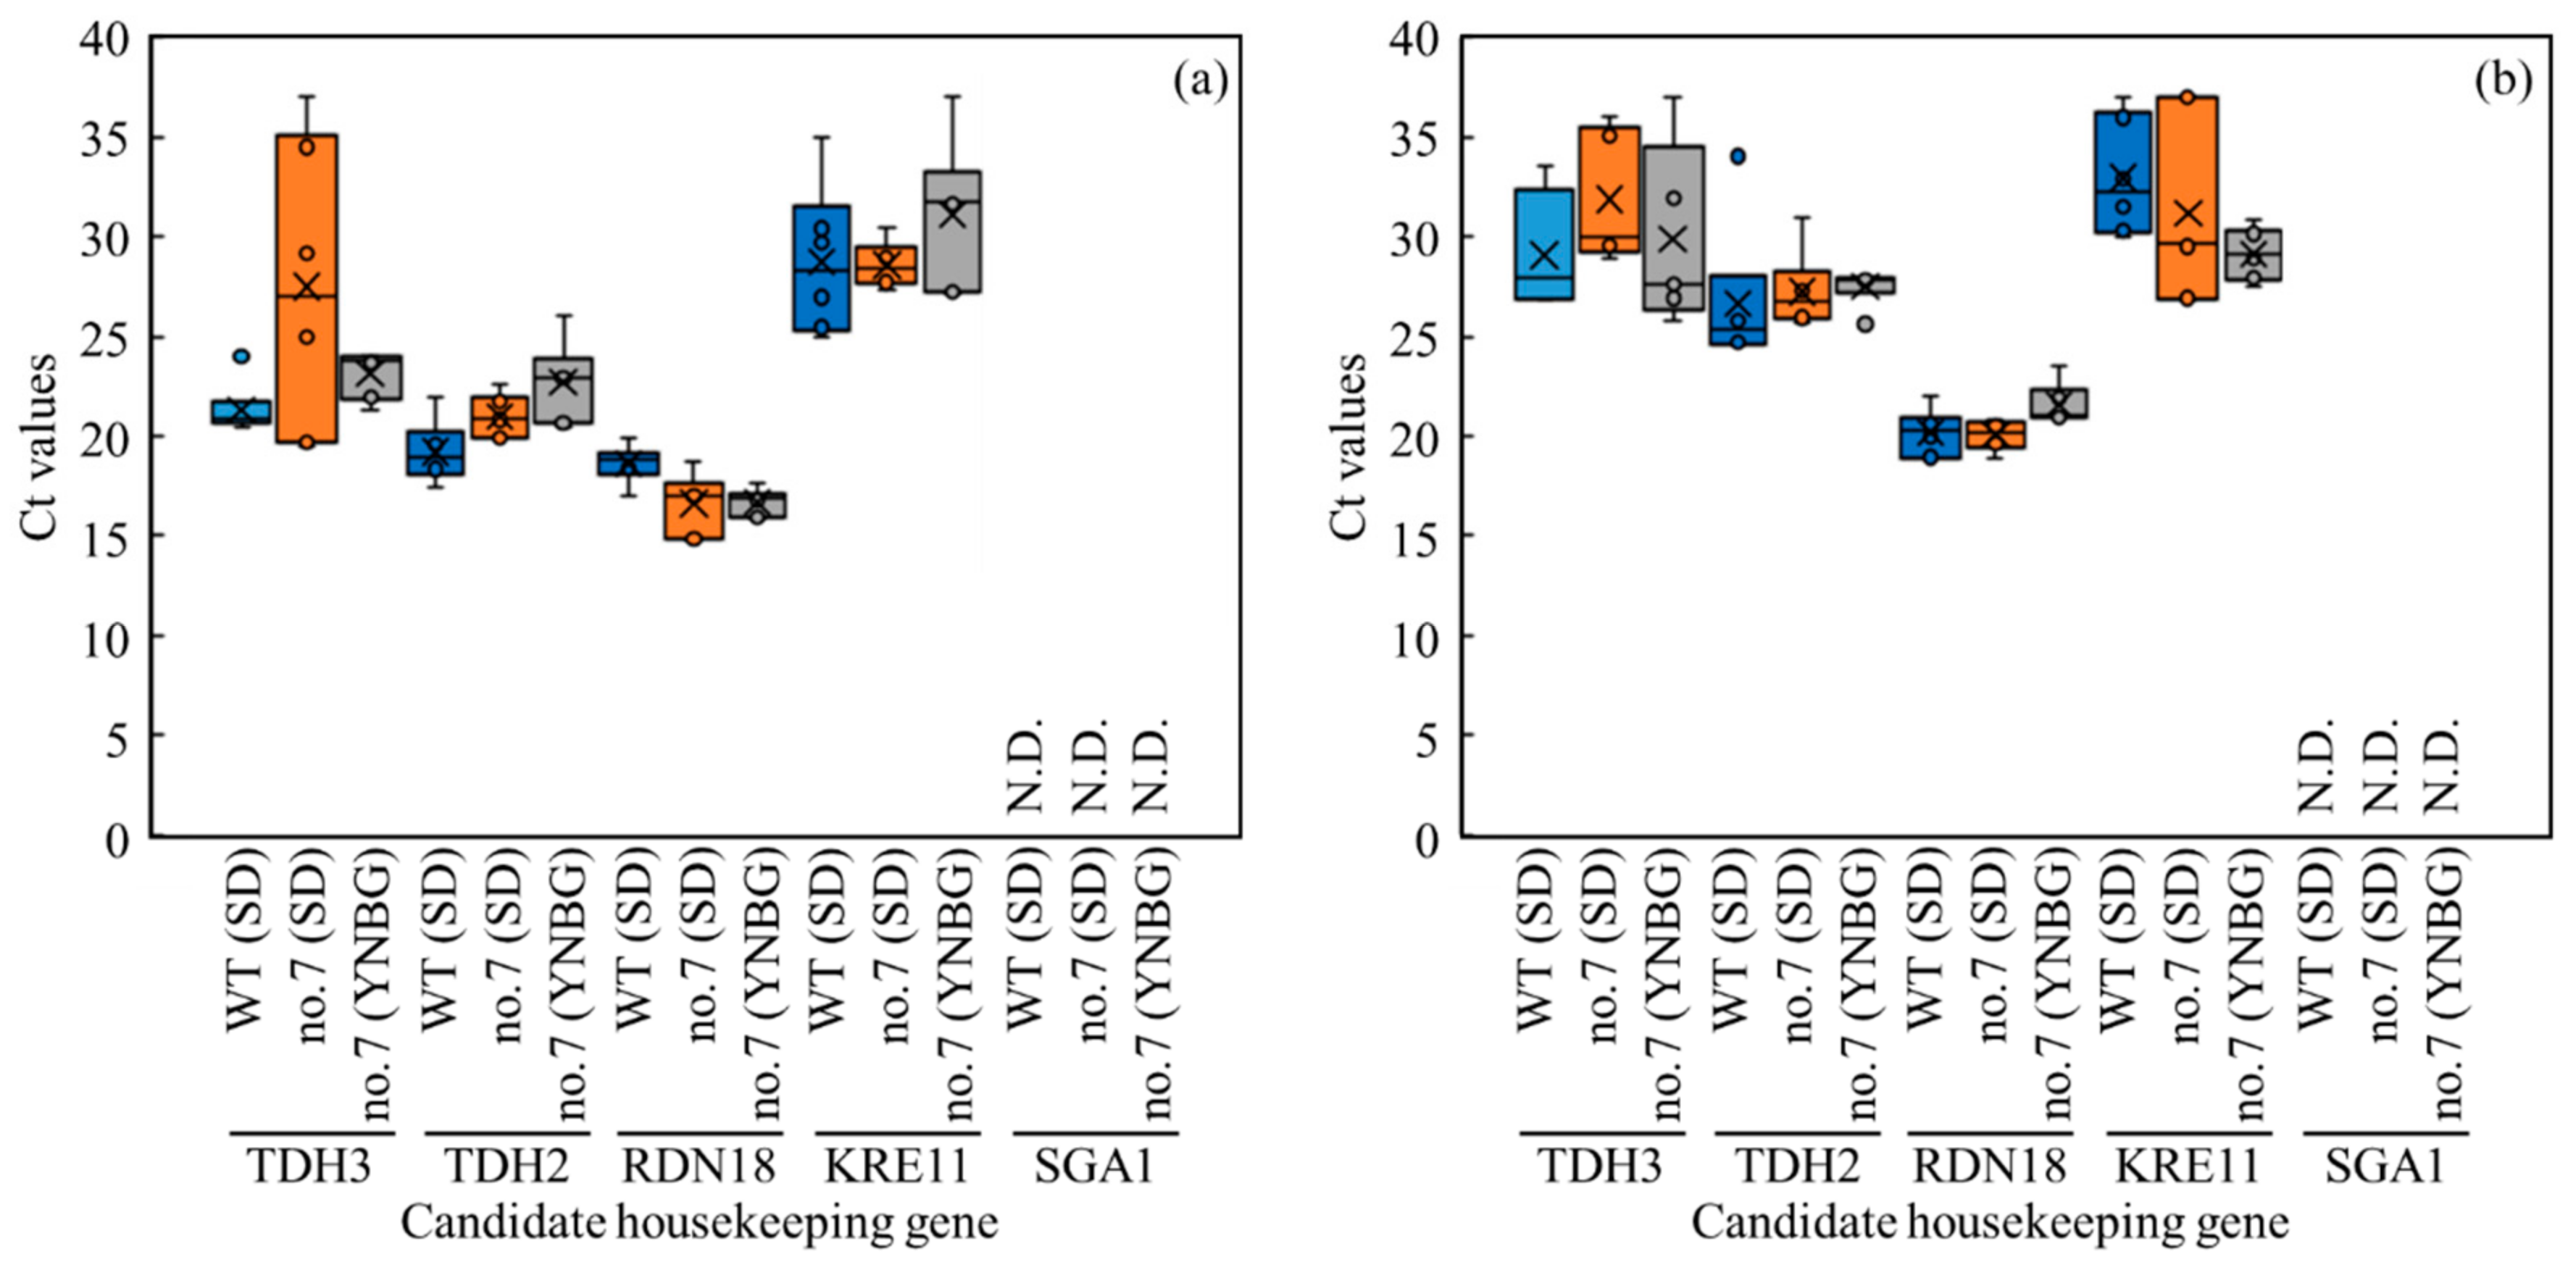
3.5. Distribution of Transcription Levels of Candidate Genes as Housekeeping Genes in Wildtype and No.7

In this study, to precisely estimate the metabolic shifts of wildtype and no.7 under each culture condition in view of transcriptomics, the transcription levels of TDH3, TDH2 (glyceraldehyde-3-phosphate dehydrogenase), RDN18 (structural constituent of ribosome/translation), KRE11 (unknown/ER to Golgi vesicle-mediated transport), and SGA1 (glucan 1,4-alpha-glucosidase) as the candidate housekeeping genes [25,26,27] were evaluated by qPCR (Figure 4). In the results, excluding SGA1, delta Rn values of TDH3, TDH2, RDN18, KRE11, and SGA1 were logistically increased even with the differences in wildtype and no.7 under different conditions, meaning those of transcription. Under aerobic conditions, the qPCR results showed the stable transcriptions of TDH3, TDH2, RDN18, and KRE11 (Figure 4a). The cycle threshold (Ct) values of RDN18 were 18.6 ± 1.0, 16.6 ± 1.6, and 16.6 ± 0.7 of the wildtype in SD, no.7 in SD, and no.7 in YNBG, and the values were stable in the candidate housekeeping gene group. The SGA1 did not work well as a housekeeping gene in this study because of the unstable Ct values. In fact, in six time trials, the Rn value of SGA1 was not detected four times in wildtype in SD, five times in no.7 in SD, and four times in no.7 in YNBG. The item of the Ct value of SGA1 was displayed as not detected (N.D.) since the Rn values were not sufficient. Under anaerobic conditions, the qPCR results showed the stable transcriptions of TDH3, TDH2, RDN18, and KRE11 (Figure 4b). The Ct values of RDN18 were 20.2 ± 1.2, 20.2 ± 1.2, and 21.0 ± 0.1 of wildtype in SD, no.7 in SD, and no.7 in YNBG, and the values were also stable corresponding to the data under aerobic conditions. The SGA1 also did not work as a housekeeping gene in this study with the unstable Rn values. Actually, in six time trials, the transcription of SGA1 was not detected five times in wildtype in SD, five times in no.7 in SD, and in all trials of no.7 in YNBG. As with the aerobic condition, the item of the Ct value of SGA1 was displayed as N.D.
Accurately performing qPCR requires the selection of housekeeping genes suited to each experiment to avoid huge scattering of the transcript level; therefore, various housekeeping genes were selected depending on each experiment so far (Figure 4). The genes of TDH3, TDH2, RDN18, and KRE11 were steadily transcribed. Especially, the transcription of RDN18 was stable in all strains, media, and aerobic/anaerobic conditions; therefore, this RDN18 was used as the housekeeping gene. TDH3 and TDH2 were isogenes at the boundary between the preparatory phase and pay-off phase in glycolysis. TDH3 and TDH2 were important enzymes for generating reduction power in glycolysis, estimating that the isogenes could be regularly transcribed in all conditions. The transcription regarding RDN18 was estimated as below: maintaining the translation of genes is required to save lives so the stable construction of ribosomes at a place of translation is needed; RDN18 was a structural constituent of ribosome/translation, meaning that RDN18 could be stably transcribed without huge scattering in any conditions. Additionally, the Ct value of RDN18 was the lowest in the candidates under aerobic and anaerobic conditions, meaning of the highest transcription level. The result could indicate that RDN18 was an essential component for maintaining biological activity and showing the requirement of stable and high-level transcription. These findings are in accordance with the low Ct value of RDN18 without huge scattering derived from the previous report by Teste et al. [25]. KRE11 was unknown/ER to Golgi vesicle-mediated transport. Therefore, the level of transcription could depend on the cell needs of proteins requiring transportation, meaning the scattering of the levels. The reason why the transcription of SGA1 did not appear could be that there was no need to hydrolyze terminal 1,4-linked alpha-D-glucose residues from non-reducing ends of polysaccharide chains with the release of beta-glucose under those conditions. Depending on those results regarding the Ct values, it was finally decided to use RDN18 as the housekeeping gene.

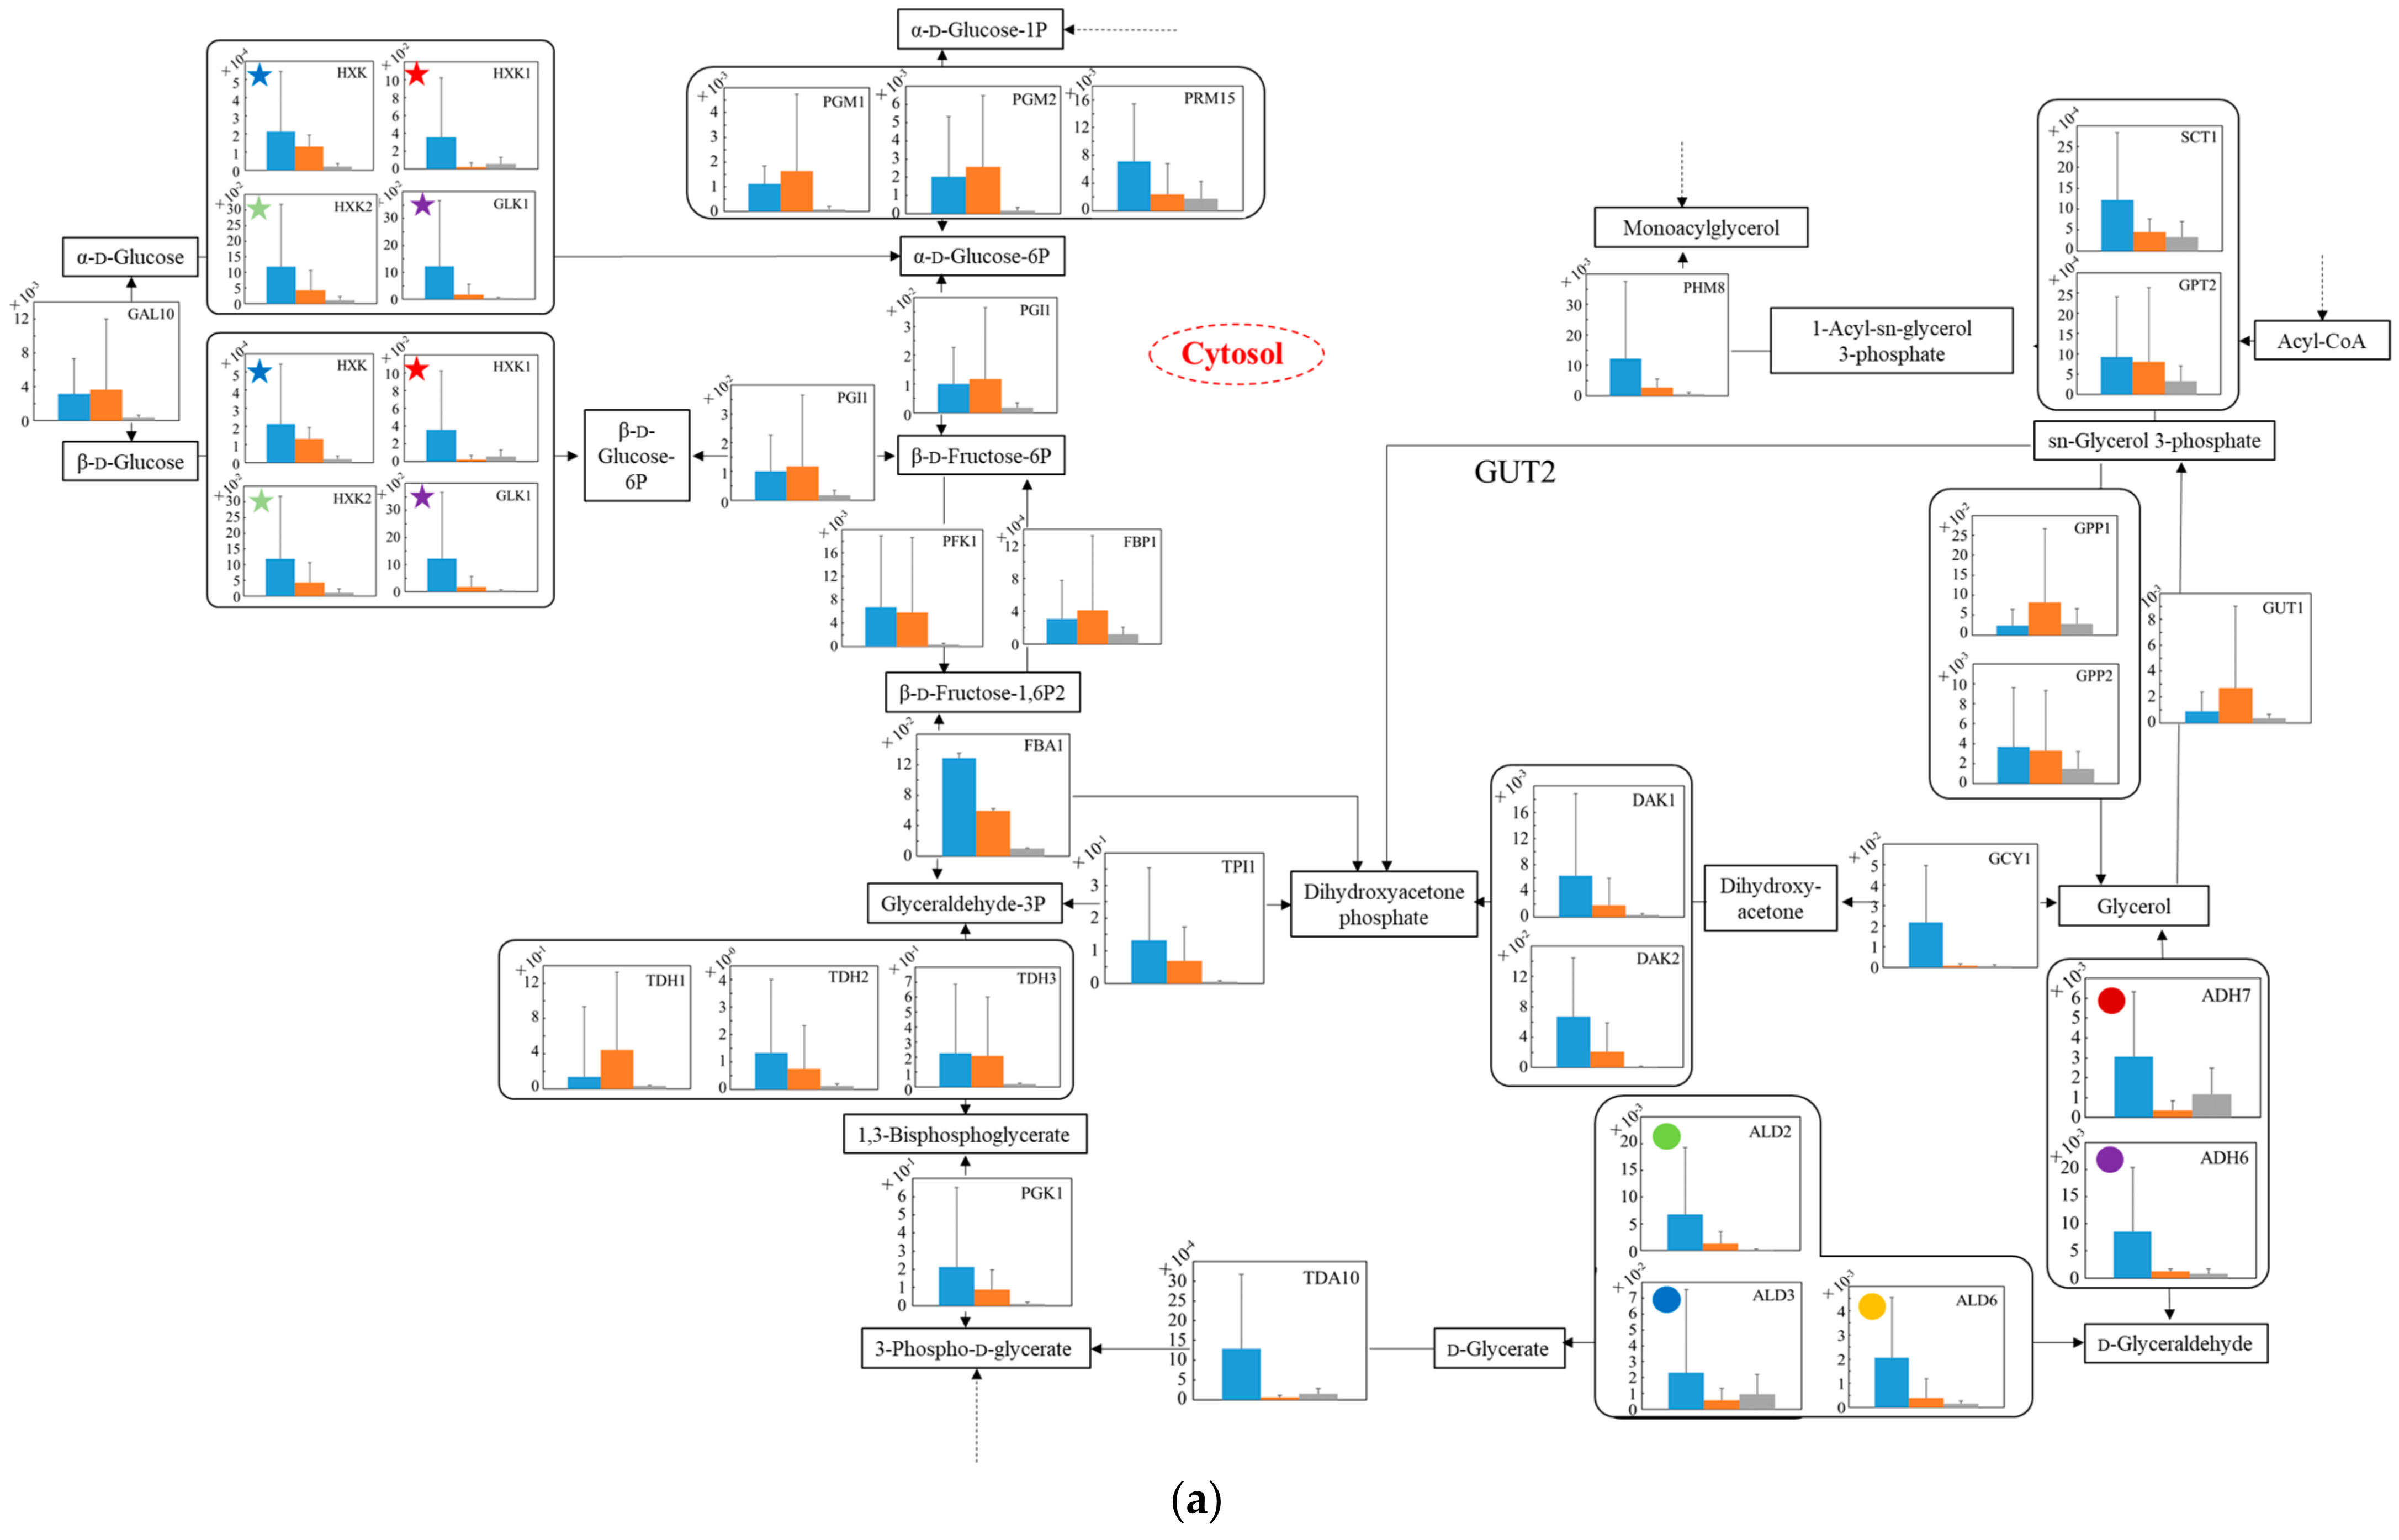
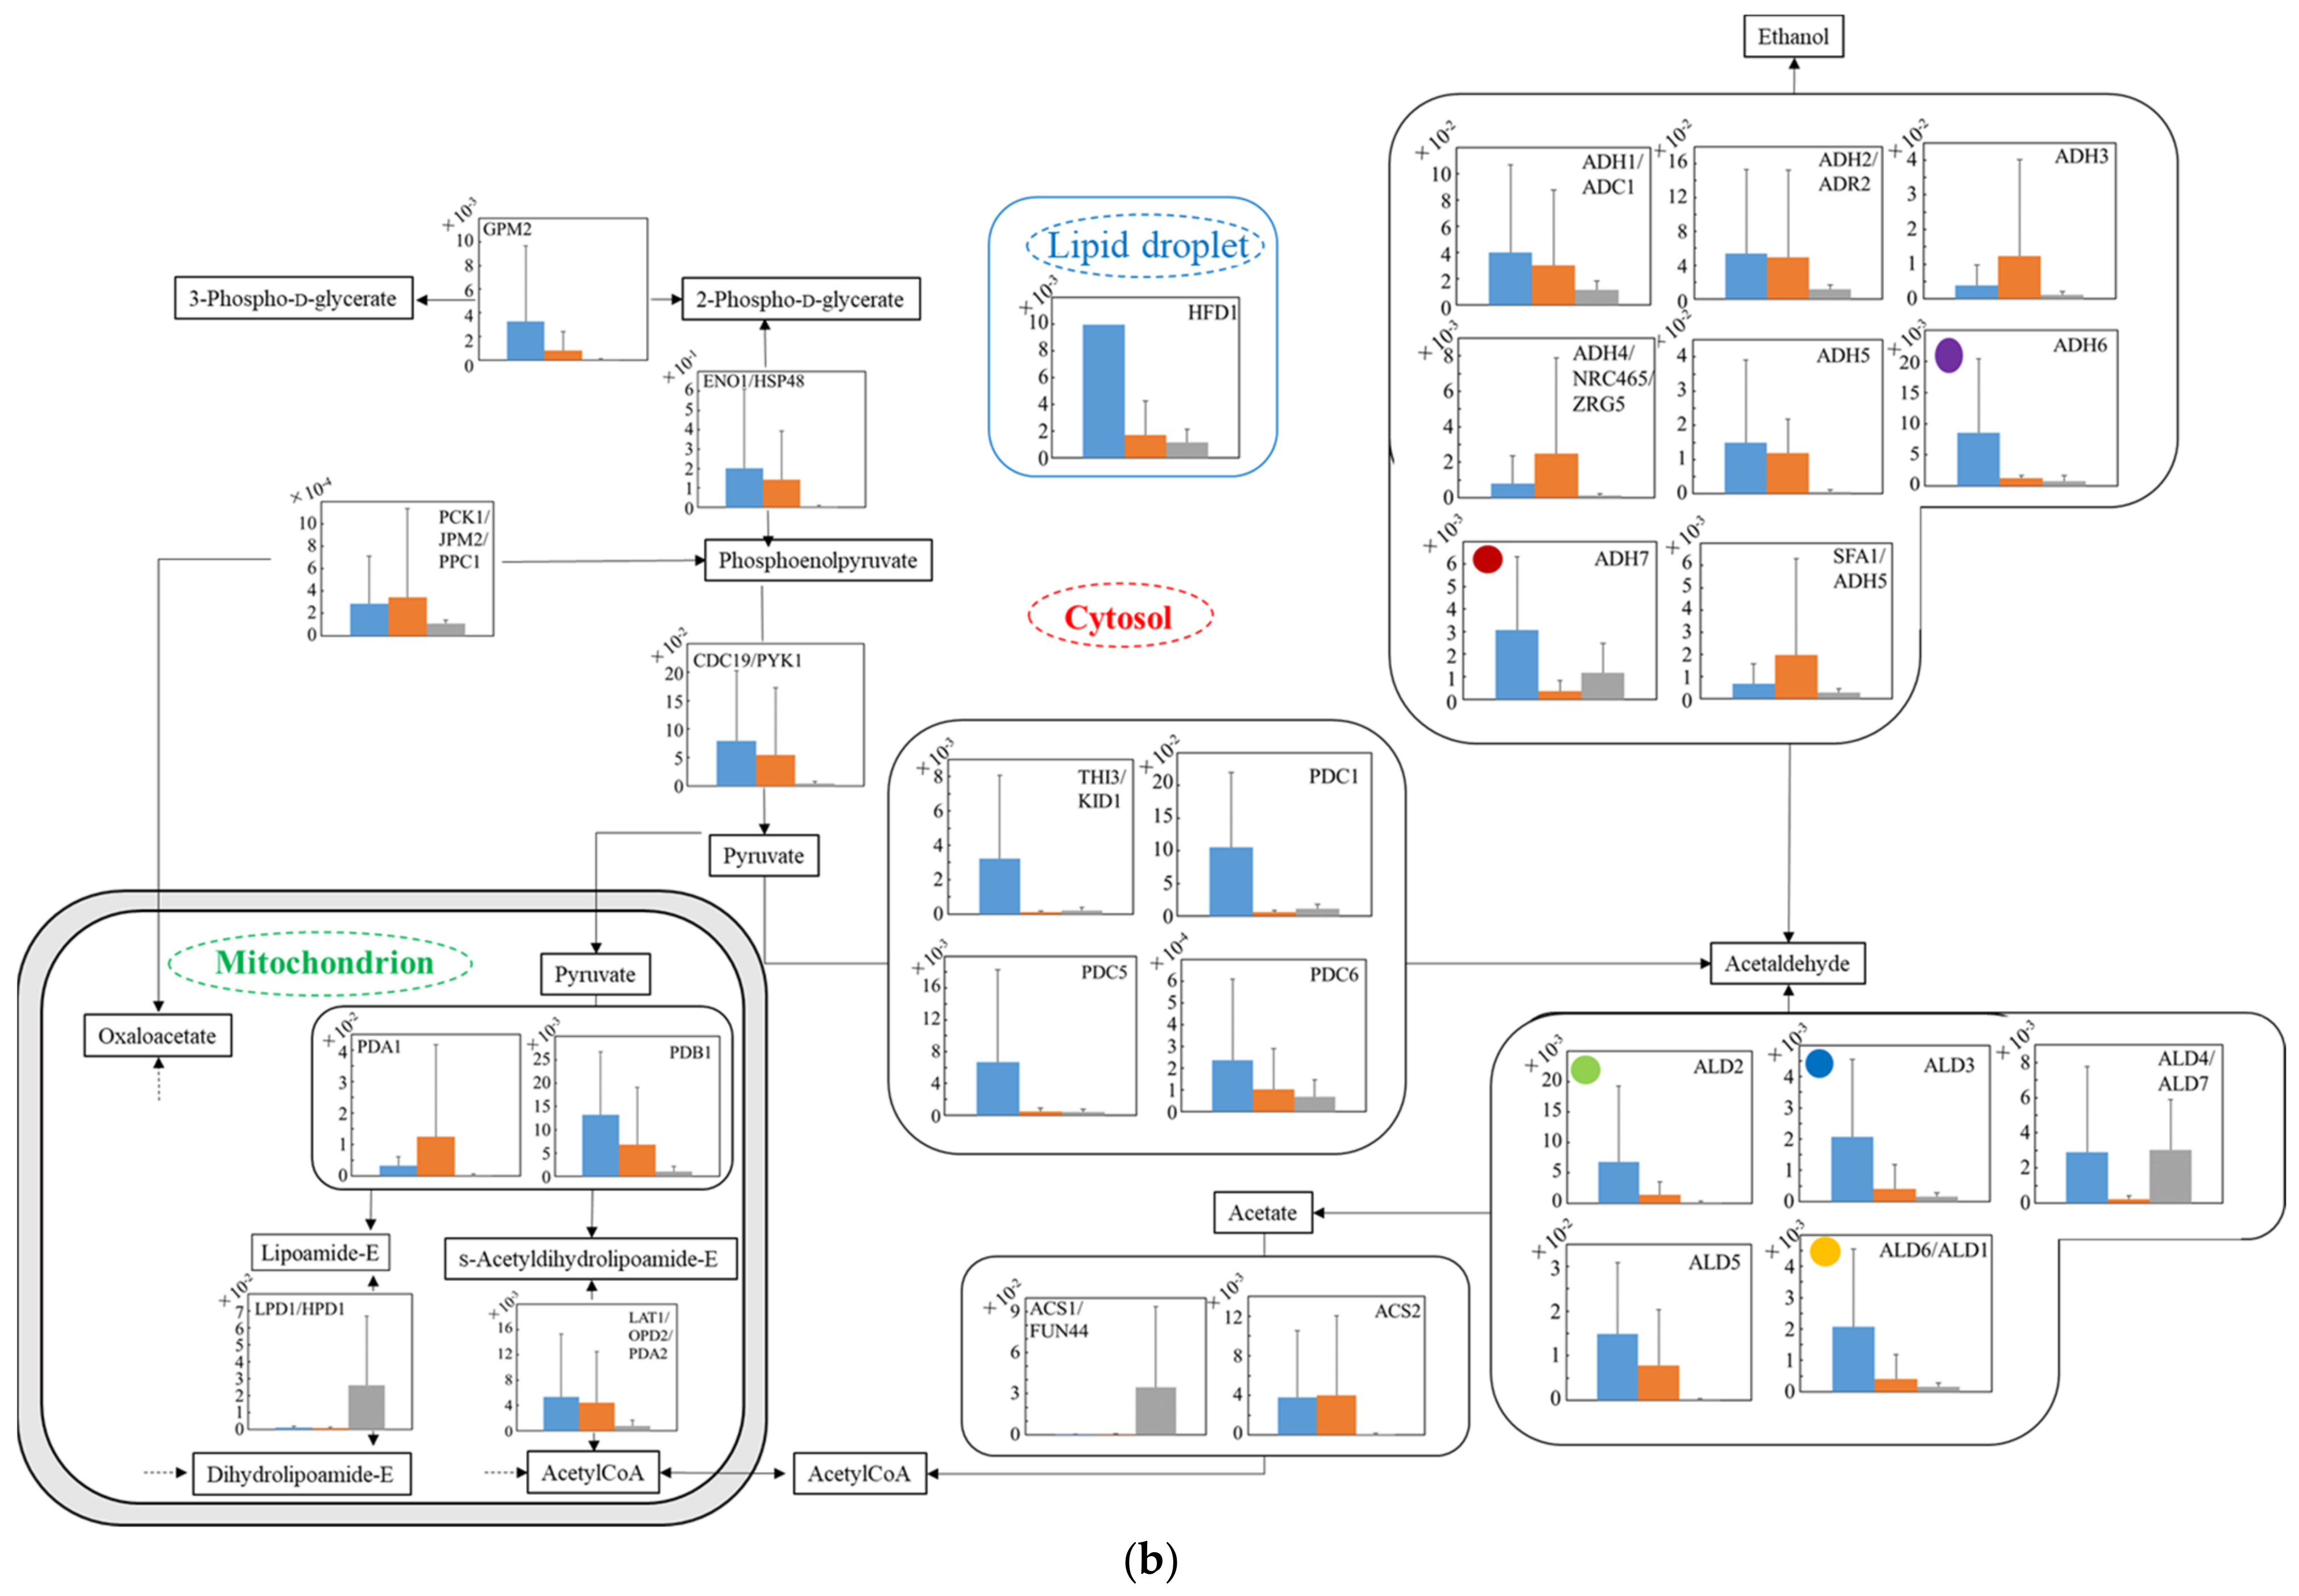
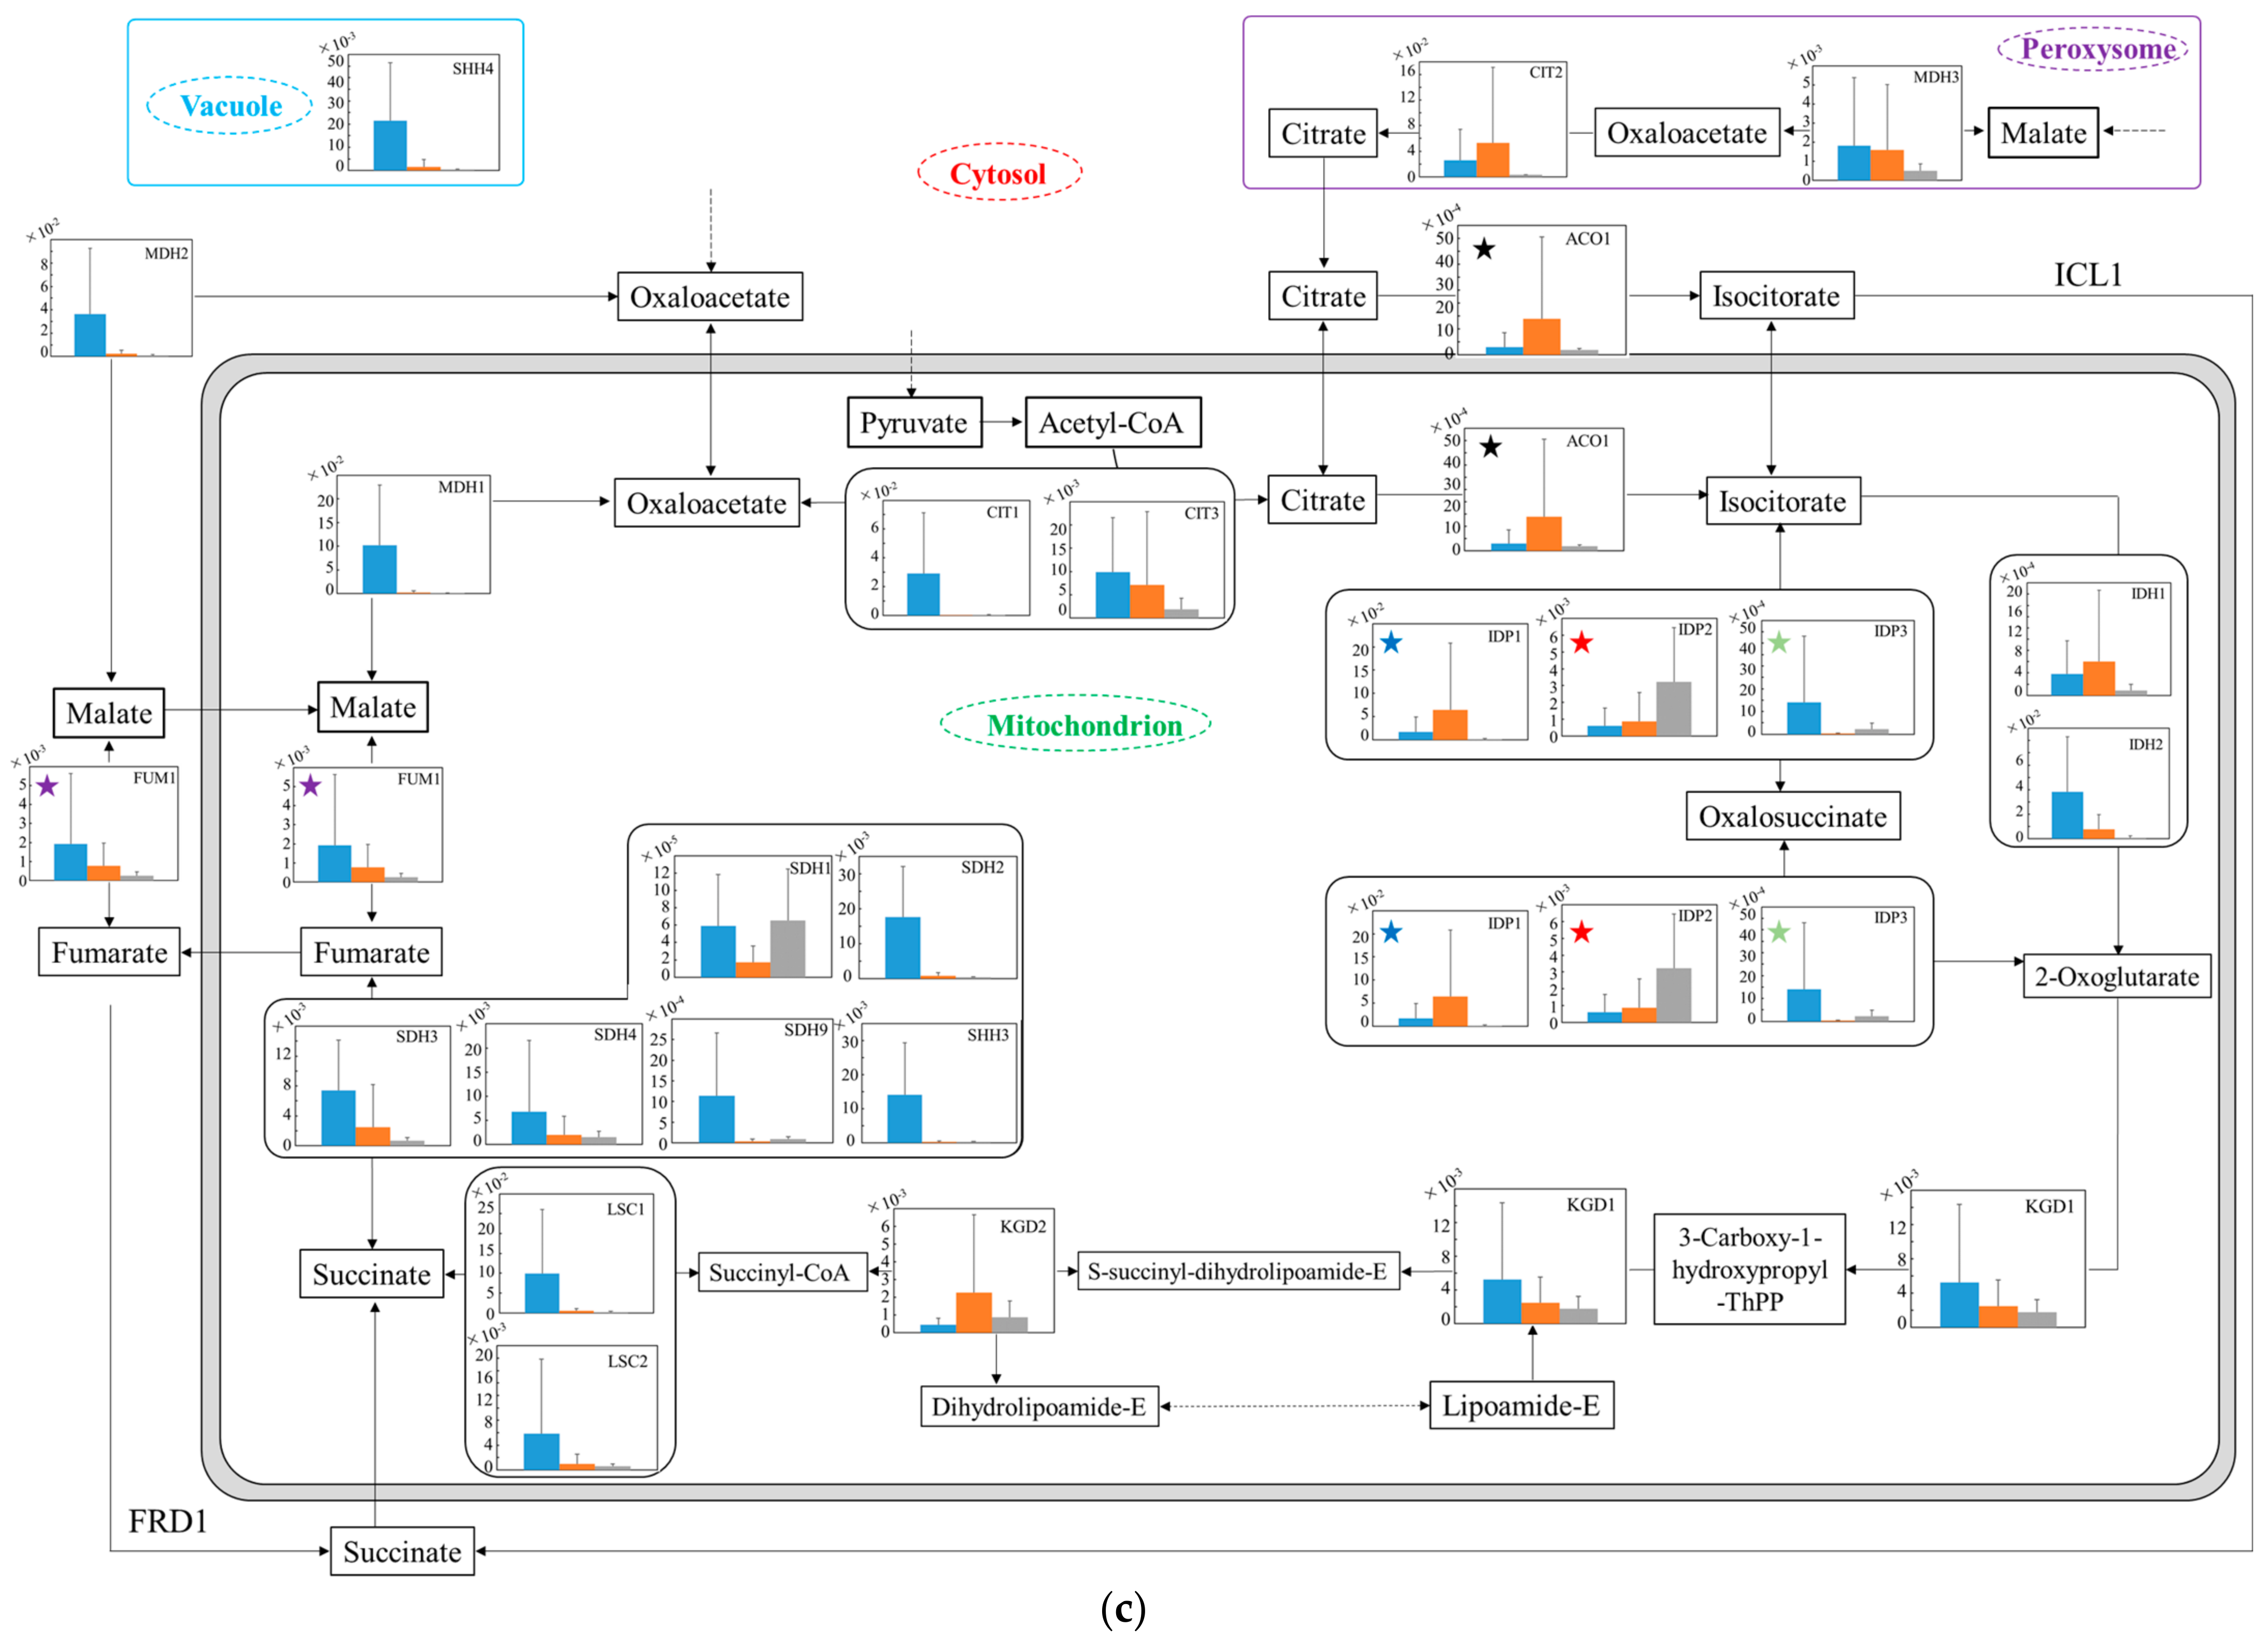
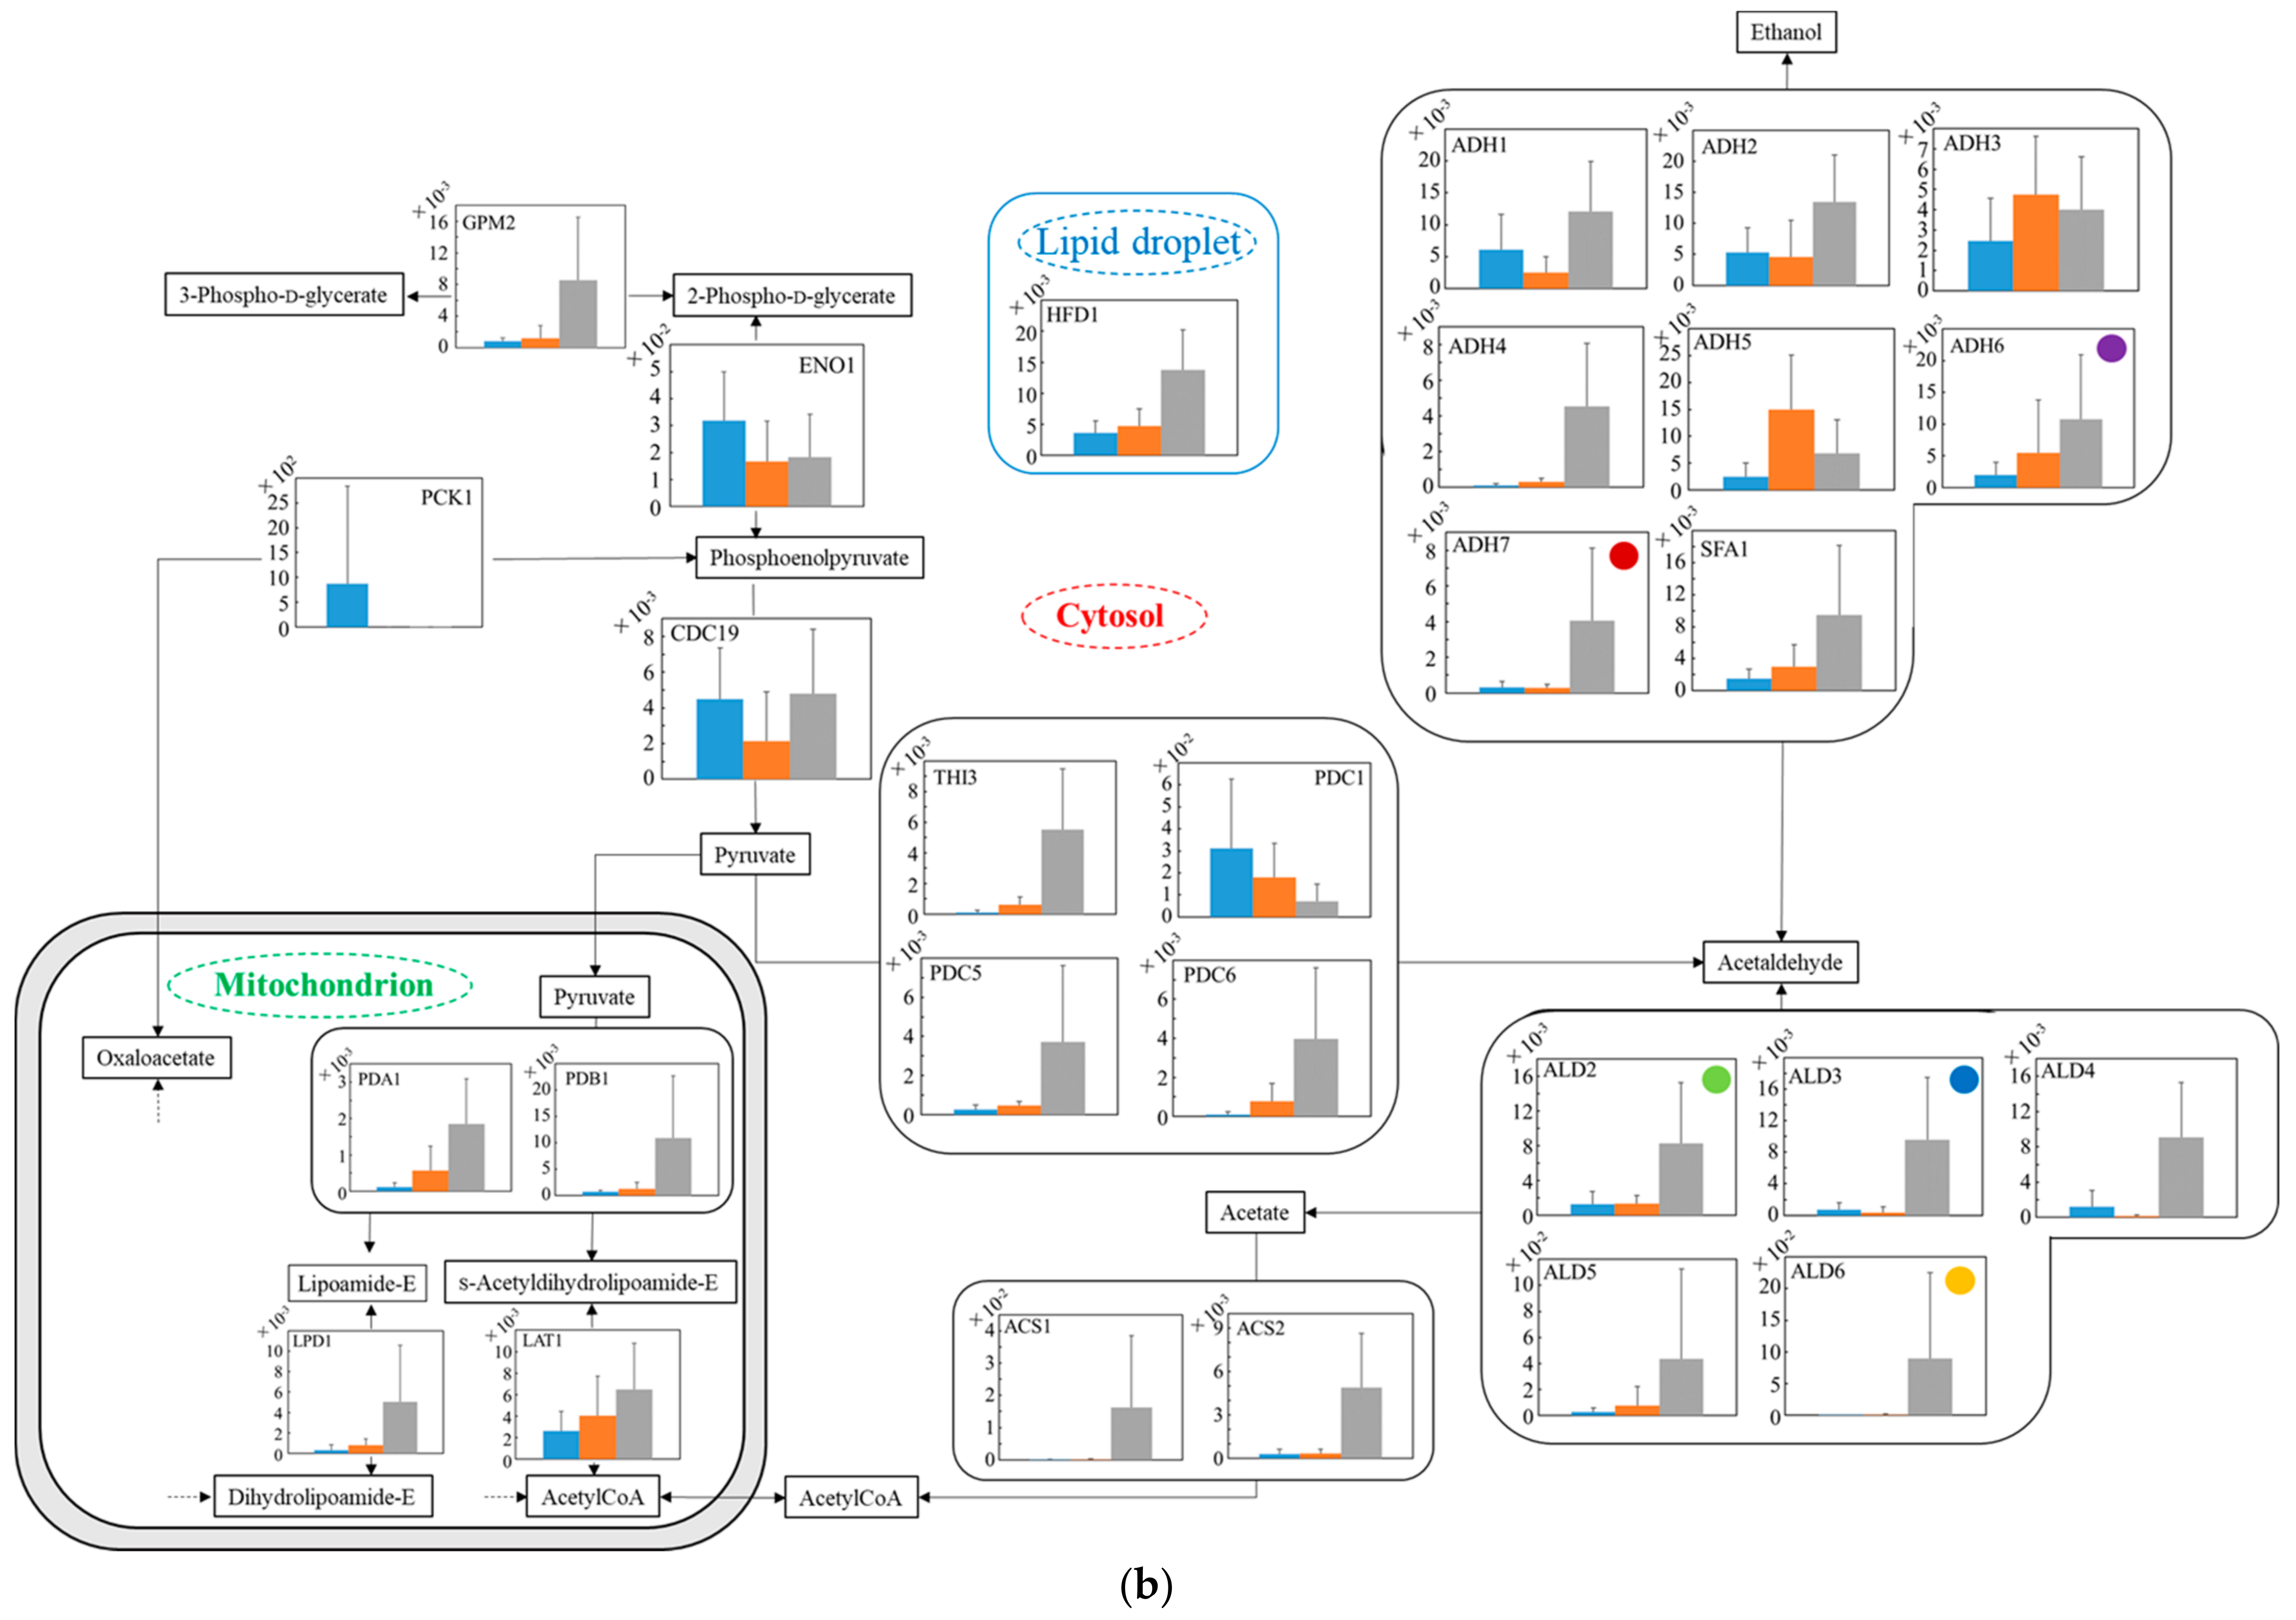
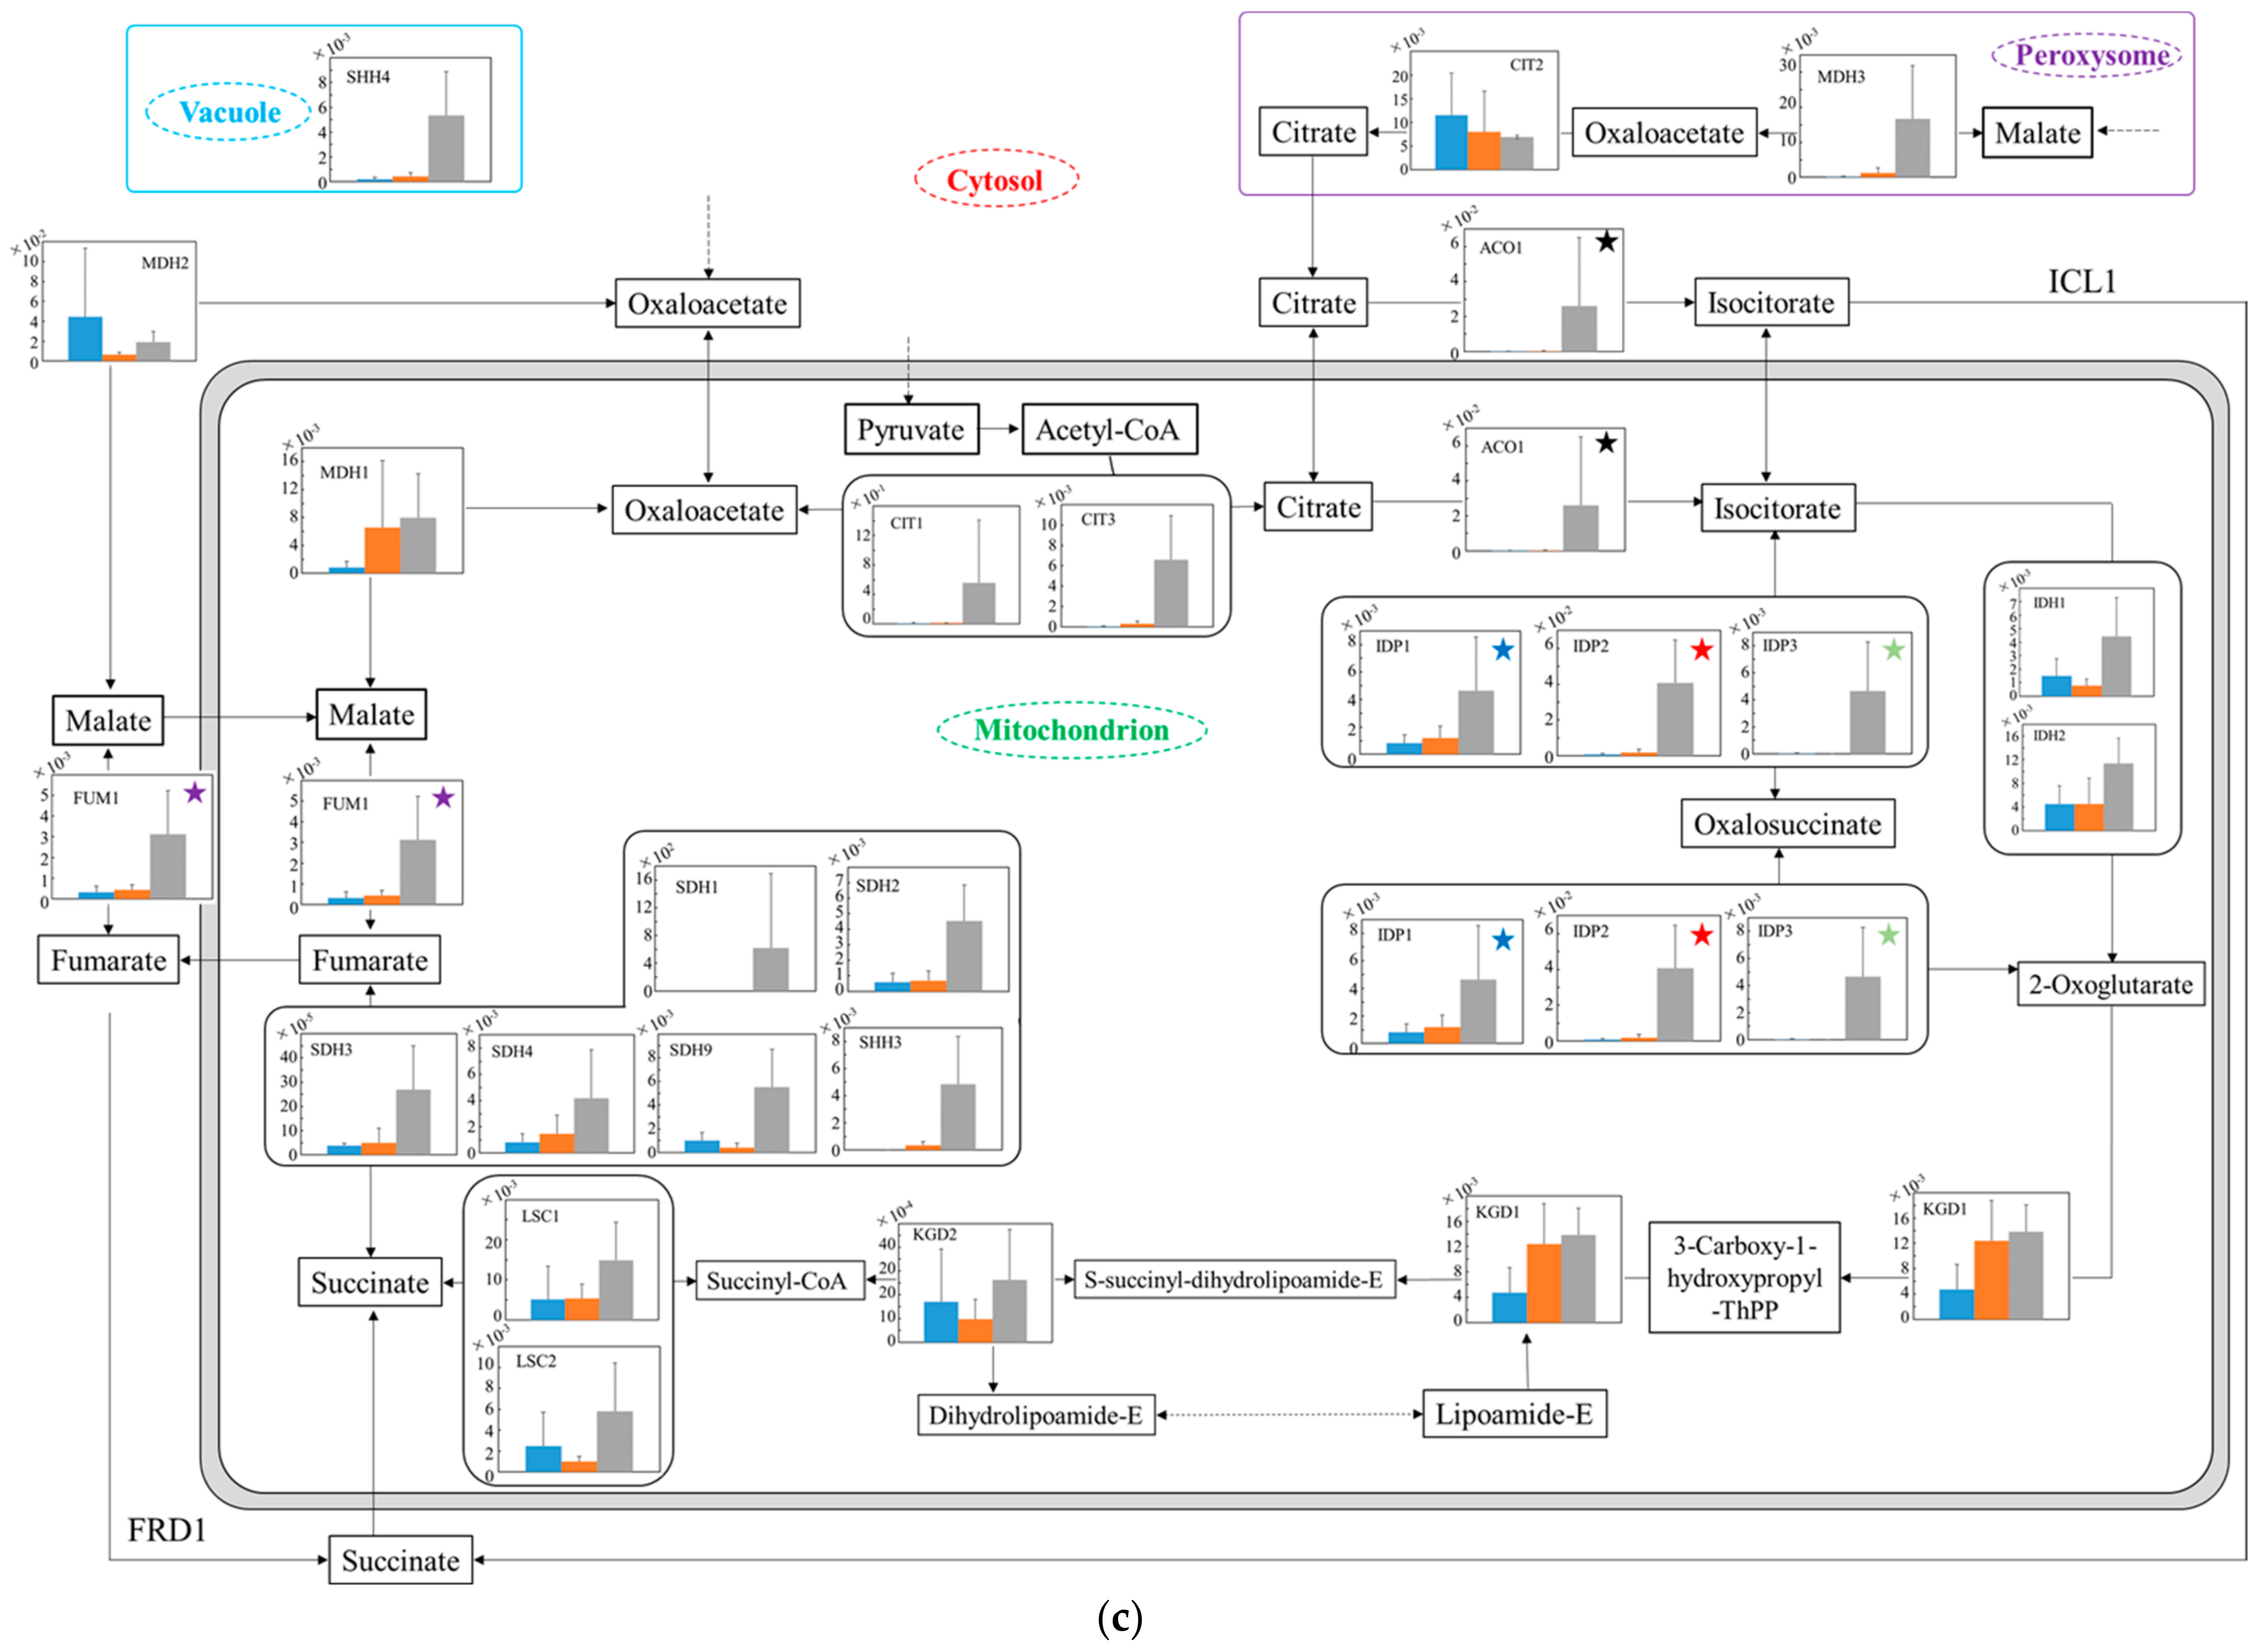
3.6. Relative Quantification of mRNA of Wildtype and No.7 in SD and in SD/YNBG under Aerobic Condition

To estimate the difference in carbon metabolism in each strain under aerobic conditions (Figure 5), the transcription levels were analyzed in the glucose–glycerol pathway (Figure 5a), pyruvate–ethanol pathway (Figure 5b), and tricarboxylic acid (TCA) cycle (Figure 5c). In Figure 5a, regarding the glucose metabolism in glycolysis, the transcription levels from glucose to 3-phospho-d-glycerate of no.7 in YNBG were mostly low compared to those of both strains in SD. Regarding the metabolism from glycerol to glycolysis, in spite of the strain difference, the transcription levels of GCY1 and DAK1/DAK2 via dihydroxyacetone in SD were higher than the ones in YNBG. On the other hand, the transcription levels of ADH7 and ALD3 via d-glyceraldehyde even in YNBG were similar to those in SD. Additionally, via sn-glycerol 3-phosphate, the transcription level of GUT1 of no.7 in YNBG was not improved. In Figure 5b, as for the metabolic production from pyruvate to ethanol, the transcription levels of THI3, PDC6, PDC5, and PDC1 especially of wildtype in SD were higher than the ones of no.7 in both media. In no.7, although the transcription levels of LPD1 regarding the metabolism from pyruvate to oxaloacetate in YNBG were higher than the ones in SD, the transcription levels of LAT1 regarding metabolism from pyruvate to acetyl CoA in SD were higher than the ones in YNBG. Concerning the metabolism from acetyl CoA to acetate, the switching between ACS2 and ACS1 was detected depending on the carbon sources of glucose and glycerol. In Figure 5c, from isolate to 2-oxoglutarate in the TCA cycle, the transcription level of IDP2 of no.7 in YNBG was higher than the others. On the other hand, IDH1/IDH2 in SD were highly translated compared to in YNBG. Similarly, between fumarate and succinate in the TCA cycle, although the transcription levels of wildtype were higher than the others, the transcription level of SDH1 of no.7 was improved similar to the case of wildtype. Regarding the later metabolism of the TCA cycle, in SD, the transcription levels related to enzymes from succinate to citrate in wildtype trended to be higher than the ones in no.7. The transcription level of MDH2 in wildtype was especially higher than the others in no.7.
The transcription levels were analyzed to estimate the metabolic differences between wildtype and the glycerol-acclimatized strain no.7 under aerobic conditions (Figure 5). In Figure 5a, in spite of the strain differences, the transcription levels from glucose to 3-phospho-D-glycerate in YNBG were mostly lower than the ones in SD. In YNBG under aerobic respiration, no.7 did not need to metabolize glucose so that the strong transcriptions in the preparatory phase of glycolysis as the upper stream from 1,3-bisphosphoglycerate would be not required for energy production. Additionally, regarding the metabolism from glycerol to glycolysis in YNBG, the transcription levels of GCY1 and DAK1/DAK2 were mostly depressed and also the level of GUT1 was not improved. Previous reports by Ho et al. and Islam et al. proved that the activated GUT and DAK by genetic engineering improved glycerol use in S. cerevisiae [28,29]; however, those transcription levels were not upregulated in no.7. The reason why no.7 can utilize glycerol was not based on the activities of those pathways of glycerol intake. On the other hand, the transcription levels of ADH7 and ALD3 even in YNBG were similar to the ones in SD regardless of strain difference. At least, in no.7, glycerol could also flow into glycolysis via D-glycerate under aerobic conditions so that the strain could use glycerol. In SD, in the pathway of glycerol to glycolysis, higher transcription levels of wildtype than of no.7 could indicate the recovery of NAD+ (e.g., reactions by DAK1 and DAK2) to use glucose in glycolysis. The findings might also show a correlation with the different biomass production between wildtype and no.7. In Figure 5b, in SD, the results implied that the metabolic activity from pyruvate to acetaldehyde in wildtype was higher than in no.7. Indeed, in SD, the ethanol production by wildtype was higher than by no.7, and the values were 5.5 ± 0.2 and 4.2 ± 0.4 g·L−1 by wildtype and no.7 at 40 h. There were probably few possibilities that the enzymatic activity of ADH decreased the metabolic activity due to a lot of the ADH isozymes existing and the activity remaining from acetaldehyde to ethanol. Therefore, the metabolic activity from pyruvate to acetaldehyde in no.7 could be depressed in ethanol fermentation. The transcription levels downstream from pyruvate were changed depending on the carbon sources, due to metabolic flow not escaping into the TCA cycle. In the case of using glucose as a carbon source, the production of acetate could be enhanced by activated LAT1; using glycerol, the production of dihydroxy lipoamide could be promoted by acerated LPD1. In Figure 5c, the transcription levels related to enzymes from succinate to citrate in the TCA cycle in wildtype trended to be higher than in no.7. By nature, S. cerevisiae is a facultative anaerobic organism, and the TCA cycle is activated to prepare oxidative phosphorylation under aerobic conditions using glucose aggressively. From isolate to 2-oxoglutarate in the TCA cycle, no.7 could switch the transcription of IDP2 or IDH1/IDH2 depending on the media. The results might indicate the change in metabolic flow with carbon source, meaning that the carbon metabolic flow from isocitrate could pass though oxalosuccinate in YNBG and directly to 2-oxoglutarate in SD. Similarly, between fumarate and succinate in the TCA cycle, no.7 could preferably use SDH1 rather than the other enzymes in YNBG. The TCA cycle activities in no.7, which was acclimatized with glycerol, might decrease comparing to the ones in wildtype. In fact, as shown in Figure 3, no.7 displayed lower biomass production than wildtype, and there was a possibility of decreasing energy producing efficiency. The higher transcription level of MDH2 in wildtype could indicate that the metabolic reaction from malate to oxaloacetate was supported by cytosolic MDH2 not only in the TCA cycle.
The total trait of transcription levels no.7 was compared to that of another glycerol-assimilating strain. Kawai et al. also obtained glycerol-assimilating strains from S. cerevisiae by repeated subcultivation in a glycerol-based medium [30]. The transcription levels of the strains in glycerol-based medium were compared to those in glucose-based media, resulting in the transcription levels of TDH2, ENO2, and CDC19 as key genes being downregulated in glycolysis; the levels of most genes were upregulated excluding FUM1 in the TCA cycle. Especially, in the TCA cycle, the transcription levels regulating the metabolic reaction between succinate and fumarate were enhanced. In the ethanol-producing pathway, the levels regulating the reaction between acetaldehyde and ethanol were maintained or increased, excluding ADH1. On the other hand, in this study, no.7 also depressed the transcription levels of TDH, ENO, and CDC so that glycerol-assimilating strains might decrease the activity in glycolysis. In the TCA cycle in no.7, although the transcription levels of enzymes regulating the reaction between succinate and fumarate showed few differences, one of SDH1 displayed the increment trait. Additionally, between isocitrate and 2-oxiglutarate, the trait of shift in the pathway might also be indicated by the increased transcription level of IDP2. Unlike glycolysis, the TCA cycle may try to maintain a metabolic response. In the metabolic reaction between acetaldehyde and ethanol in no.7, although the trait of maintained or decreased transcription levels was confirmed, the transcription level of ADH7 was enhanced. The results might indicate that no.7 tried to maintain the reaction activity similar to the glycerol-assimilating strains picked up by Kawai et al. Therefore, no.7 showed similarities to another glycerol-assimilating strain from S. cerevisiae in the transcription tendency of the genes related to glycerol assimilation; however, the transcription tendency of each gene was different, indicating the diversity of S. cerevisiae.

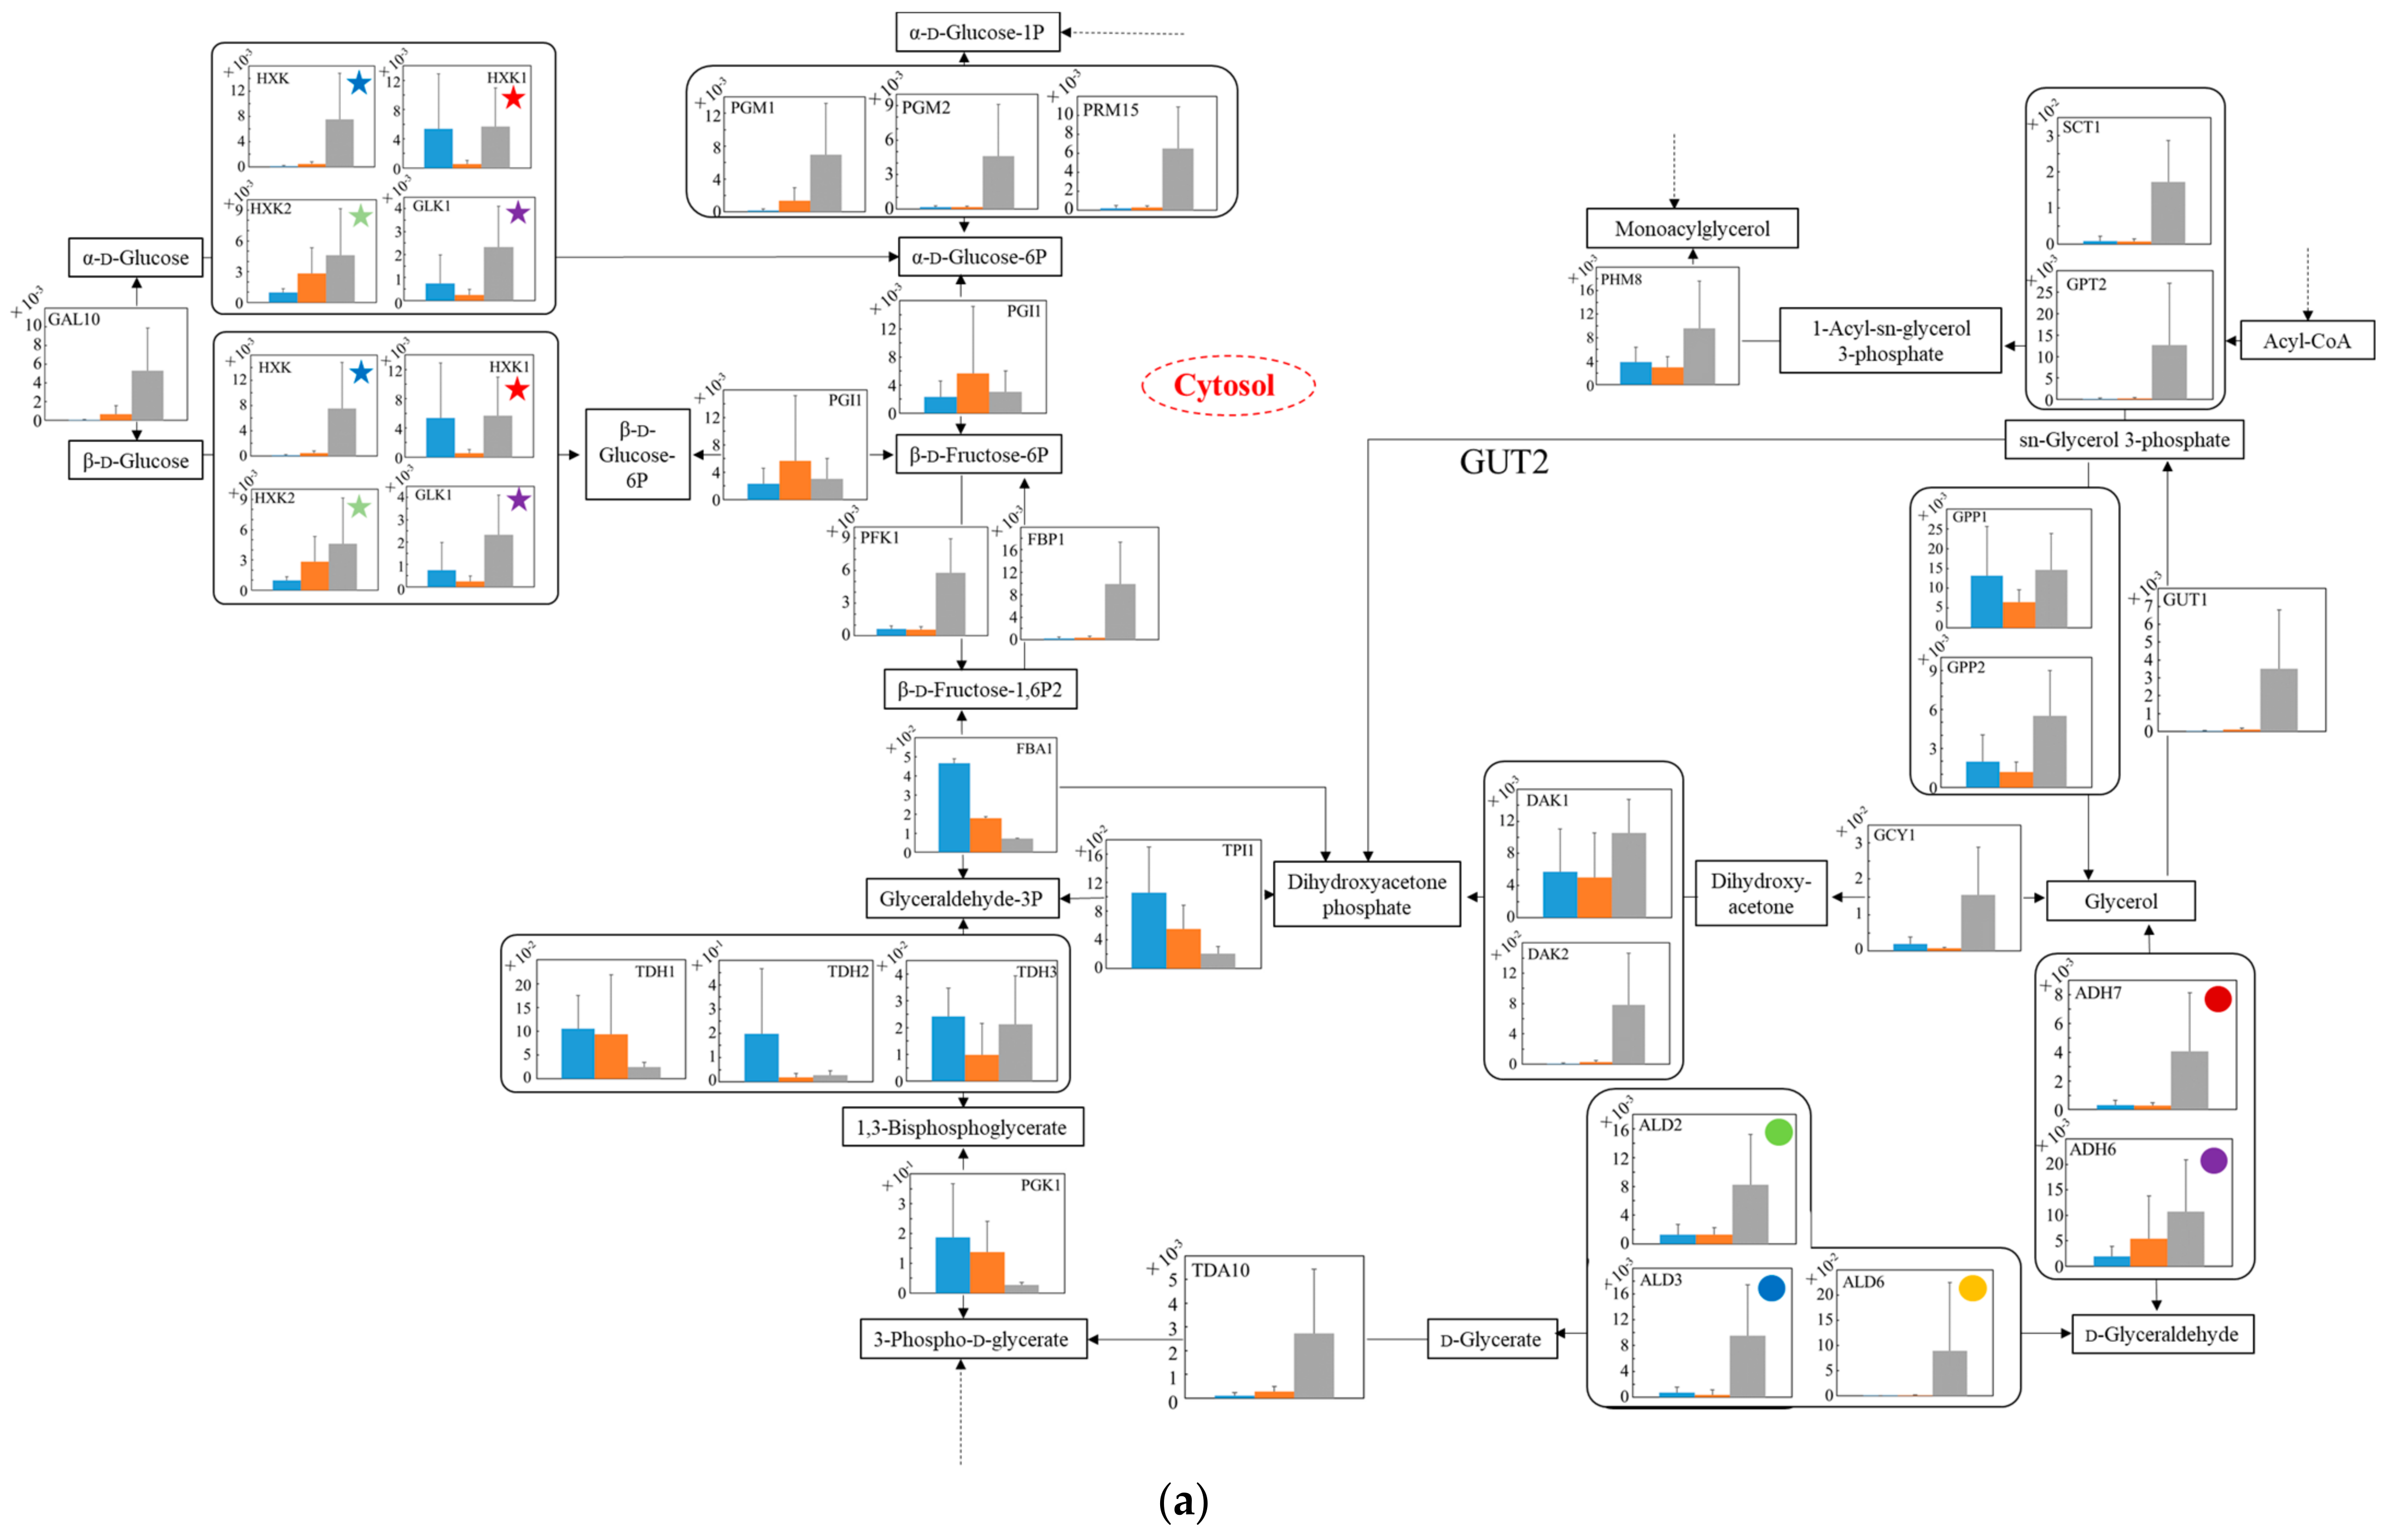
3.7. Relative Quantification of mRNA of Wildtype and No.7 in SD and in SD/YNBG under Anaerobic Condition

Estimating the carbon metabolism around glycolysis and the TCA cycle in each strain under anaerobic conditions (Figure 6), the transcription levels were also analyzed in the glucose-glycerol pathway (Figure 6a), pyruvate-ethanol pathway (Figure 6b), and TCA cycle (Figure 6c). In Figure 6a, in regard to the metabolism from glycerol to glycolysis, even in YNBG, the transcription levels through the pathway via dihydroxyacetone in no.7 were similar or superior to the ones in the wildtype. The phenomena under anaerobic conditions were different to those under aerobic conditions. Especially, the transcription levels of DAK2 and GCY1 of no.7 in YNBG were higher than the others. Relating to via dihydroxyacetone phosphate, the transcription level of GUT1 of no.7 in YNBG was also superior to the others. On the other hand, in YNBG, all transcription levels through the pathway via D-glyceraldehyde in no.7 were higher than the others. In spite of the difference in wildtype and no.7, the level of PGK in SD was superior to that in YNBG. In Figure 6b, regarding the metabolism from pyruvate to ethanol, regardless of the strain differences, the transcription levels relating to enzymes in YNBG were almost the same and/or higher than the ones in SD. In Figure 6c, regarding the later metabolism in TCA cycle, in spite of the strain differences in wildtype and no.7, the transcription levels of enzymatic genes from succinate to citrate in YNBG tended to be higher than the ones in SD. The phenomena under anaerobic conditions were also different to those under aerobic conditions. Regarding the metabolic reaction between malate and oxalate, MDH2 of wildtype in SD, MDH1/MDH2 of no.7 in SD, and MDH1/MDH2/MDH3 of no.7 in YNBG were detected as well-balanced transcription.
Additionally, under anaerobic conditions, the transcription levels were analyzed to estimate the metabolic differences between wildtype and the glycerol-acclimatized strain no.7 (Figure 6). In Figure 6a, the transcription levels from glycerol to glycolysis were activated in YNBG. Under anaerobic conditions, the enhanced expression of enzymes related to intake of glycerol could be reinforced to move glycerol into glycolysis. Especially, the significant enhancement of GUT1, which was not detected under aerobic conditions, could significantly support glycerol assimilation via dihydroxyacetone. However, provided that the transcription level of PGK in glycolysis was not enough in no.7 in YNBG, the main carbon metabolic flow might be the pathway via D-glyceraldehyde. In Figure 6b, in YNBG, the transcription levels related to ethanol fermentation under anaerobic conditions were mostly enhanced rather than under aerobic condition, and the level of ADH4 was especially improved. Although the higher expression would promote the expression of the ethanol-producing enzymes in no.7 in YNBG, the ethanol production was not detected. Therefore, with glycerol as a carbon source, the redox balance in cells would be difficult to control: especially the oxidation of NADH through acetaldehyde to ethanol would be difficult, resulting in no ethanol production. In Figure 6c, from succinate to citrate in the TCA cycle, the transcription levels of no.7 tended to be higher than those of wildtype, and the phenomena were opposite under aerobic conditions. The no.7 strain could activate the transcription to create energy under anaerobic conditions because the strain could utilize glycerol. In the metabolic reaction relating to malate and oxalate, the use of enzymes could be different depending on the condition. As a result, wildtype in SD, no.7 in SD, and no.7 in YNBG could use mainly MDH2, MDH1/MDH2, and MDH1/MDH2/MDH3, respectively. In S. cerevisiae, cytosolic MDH2 could originally play a main role in the reaction, and MDH1 and MDH3 were possibly able to join to the reaction by glycerol acclimatization. In the reaction, NADH can be reduced by metabolic flow from oxalate to malate so that the transcription levels relating to the genes might be improved to obtain reduction power.

4. Conclusions

In this study, 21 glycerol-assimilating strains were successfully picked up from S. cerevisiae BY4741. The 21 strains showed different growth curves in YNBG indicating intraspecies diversity even though they were segregants. The no.7, which showed the highest relative growth rate in the 21 strains, was picked up to analyze the glycerol assimilation system of S. cerevisiae. Although no.7 displayed no difference in µmax and the td for wildtype when glucose existed as a carbon source in the broth, there was a difference in biomass production and the percent yield of ethanol. The results could indicate the change in metabolism in no.7 by acclimatization. In the glycerol medium, no.7 could increase the biomass production with glycerol taken up in the cells after ingesting glycerol as a carbon source. After the process, no.7 did not consume glycerol for the time being nor ferment ethanol. The reason why no.7 did not ferment ethanol with glycerol might be that the strain could not control the redox balance in cells requiring surplus oxidation power towards NADH or NADPH during glycerol assimilation through these pathways. To perform qPCR, transcription levels of TDH3, TDH2, RDN18, KRE11, and SGA1 were evaluated for use as housekeeping genes. The transcription of RDN18 was stable in all strains, media, and aerobic/anaerobic conditions because the RDN18 was deeply related to construction of ribosomes. Therefore, this RDN18 was used as the housekeeping gene. Under aerobic conditions, without the strain differences, the transcription levels from glucose to 3-phospho-D-glycerate in YNBG were mostly lower than the ones in SD. Additionally, regarding the metabolism from glycerol to glycolysis in YNBG, the transcription levels of GCY1 and DAK1/DAK2 were mostly depressed; GUT1 was not improved; ADH7 and ALD3 even in YNBG were similar to the ones in SD regardless of strain difference. Especially, GCY1 was depressed as a different property of the no.7 strain to wildtype. At least, in no.7, glycerol could also flow into glycolysis via D-glycerate under aerobic conditions so that the strain could use glycerol. From isolate to 2-oxoglutarate in the TCA cycle, no.7 could switch the transcription of IDP2 or IDH1/IDH2 depending on the media. Those results might indicate the change in metabolic flow with carbon source, meaning that the carbon metabolic flow from isocitrate could pass though oxalosuccinate in YNBG and directly to 2-oxoglutarate in SD. The TCA cycle might attempt to maintain a metabolic response not like glycolysis. Therefore, no.7 showed similarities to other glycerol-assimilating strains; however, the different transcription tendency of each gene could indicate the diversity of S. cerevisiae. Additionally, under anaerobic conditions, the transcription levels of no.7 from glycerol to glycolysis were activated in YNBG. Especially, the significant enhancement of the GUT1 was not detected under aerobic conditions. The result could significantly support glycerol assimilation via dihydroxyacetone. In YNBG, the transcription levels related to ethanol fermentation were mostly enhanced and ADH4 was especially improved even without ethanol production. Therefore, with glycerol as a carbon source, the redox balance in cells would be difficult to control: especially the oxidation of NADH through acetaldehyde to ethanol would be difficult, resulting in no ethanol production. In the TCA cycle, our results showed the possibility to change the enzymes for the metabolic reaction relating to malate and oxalate depending on the condition. In S. cerevisiae, cytosolic MDH2 could originally play a major role in the reaction, and MDH1 and MDH3 could possibly join the glycerol acclimatization. In the reaction, NADH can be reduced by metabolic flow from oxalate to malate, resulting in the transcription levels possibly being improved to obtain reduction power.
This study estimated the metabolic switching by qPCR with glycerol acclimatization of S. cerevisiae, and endowed knowledge to use glycerol as a carbon source by S. cerevisiae. For instance, this research displayed that low PGK1 transcription could be related to the metabolic rate-limiting step in a glycerol-based medium. Improvement in PGK1 transcription is possible to enhance the use of waste glycerol with S. cerevisiae, which has robustness and can be genetically modified. The resource recovery of wasted glycerol will support the decreasing environmental stresses.

Supplementary Materials

The following supporting information can be downloaded at: https://www.mdpi.com/article/10.3390/microorganisms10061173/s1, Supplementary Table S1 is gene information used in analyses of qPCR. All data were mainly provided by Alliance of Genome Resources, November 2021 and support data were obtained from additional references [31,32,33,34,35,36,37,38,39,40]. Supplementary Table S2 is primer-pair information of each enzyme gene prepared for qPCR.

Author Contributions

Conceptualization, A.N.; methodology, A.N.; data curation, A.N., K.Z., R.M. and N.Y.; writing—original draft preparation, A.N. and K.Z.; writing—review and editing, A.N.; project administration, A.N.; funding acquisition, A.N. All authors have read and agreed to the published version of the manuscript.

Funding

This work was supported by Japan Society for the Promotion of Science (JSPS) (JSPS KAKENHI Grant Number: 18H06006) and Nihon Morita Yakusho Co., Ltd. for research funding.

Institutional Review Board Statement

Not applicable.

Informed Consent Statement

Not applicable.

Acknowledgments

The authors deeply appreciate the kind help from Yuri Sakihama.

Conflicts of Interest

The authors declare no conflict of interest.

References

  1. Clomburg, J.M.; Gonzalez, R. Anaerobic fermentation of glycerol: A platform for renewable fuels and chemicals. Trends Biotechnol. 2013, 31, 20–28. [Google Scholar] [CrossRef] [PubMed] [Green Version]
  2. Yang, F.; Hanna, M.A.; Sun, R. Value-added uses for crude glycerol—A byproduct of biodiesel production. Biotechnol. Biofuels 2012, 5, 13. [Google Scholar] [CrossRef] [Green Version]
  3. Johnson, E.; Sarchami, T.; Kießlich, S.; Munch, G.; Rehmann, L. Consolidating biofuel platforms through the fermentative bioconversion of crude glycerol to butanol. World J. Microbiol. Biotechnol. 2016, 32, 103. [Google Scholar] [CrossRef]
  4. Raza, M.; Inayat, A.; Abu-Jdayil, B. Crude glycerol as a potential feedstock for future energy via thermochemical conversion processes: A review. Sustainability 2021, 13, 12813. [Google Scholar] [CrossRef]
  5. Nandy, S.K.; Srivastava, R.K. A review on sustainable yeast biotechnological processes and applications. Microbiol. Res. 2018, 207, 83–90. [Google Scholar] [CrossRef] [PubMed]
  6. Parapouli, M.; Vasileiadis, A.; Afendra, A.S.; Hatziloukas, E. Saccharomyces cerevisiae and its industrial applications. AIMS Microbiol. 2020, 6, 1–31. [Google Scholar] [CrossRef]
  7. European Food Safety Authority. Scientific opinion on the safety and efficacy of Saccharomyces cerevisiae (NBRC 0203), Lactobacillus plantarum (NBRC 3070) and Lactobacillus casei (NBRC 3425) as a silage additive for all species. EFSA J. 2013, 11, 3362. [Google Scholar]
  8. Soares, E.V.; Hebbelinck, K.; Soares, H.M. Toxic effects caused by heavy metals in the yeast Saccharomyces cerevisiae: A comparative study. Can. J. Microbiol. 2003, 49, 336–343. [Google Scholar] [CrossRef]
  9. Yasokawa, D.; Murata, S.; Iwahashi, Y.; Kitagawa, E.; Nakagawa, R.; Hashido, T.; Iwahashi, H. Toxicity of methanol and formaldehyde towards Saccharomyces cerevisiae as assessed by DNA microarray analysis. Appl. Biochem. Biotechnol. 2010, 160, 1685–1698. [Google Scholar] [CrossRef] [PubMed]
  10. Schindler, D. Genetic engineering and synthetic genomics in yeast to understand life and boost biotechnology. Bioengineering 2020, 7, 137. [Google Scholar] [CrossRef] [PubMed]
  11. Ochoa-Estopier, A.; Lesage, J.; Gorret, N.; Guillouet, S.E. Kinetic analysis of a Saccharomyces cerevisiae strain adapted for improved growth on glycerol: Implications for the development of yeast bioprocesses on glycerol. Bioresour. Technol. 2010, 102, 1521–1527. [Google Scholar] [CrossRef]
  12. Klein, M.; Swinnen, S.; Thevelein, J.M.; Nevoigt, E. Glycerol metabolism and transport in yeast and fungi: Established knowledge and ambiguities. Environ. Microbiol. 2017, 19, 878–893. [Google Scholar] [CrossRef] [Green Version]
  13. Brachmann, C.B.; Davies, A.; Cost, G.J.; Caputo, E.; Li, J.; Hieter, P.; Boeke, J.D. Designer deletion strains derived from Saccharomyces cerevisiae S288C: A useful set of strains and plasmids for PCR-mediated gene disruption and other applications. Yeast 1998, 14, 115–132. [Google Scholar] [CrossRef]
  14. Merico, A.; Ragni, E.; Galafassi, S.; Popolo, L.; Compagno, C. Generation of an evolved Saccharomyces cerevisiae strain with a high freeze tolerance and an improved ability to grow on glycerol. J. Ind. Microbiol. Biotechnol. 2011, 38, 1037–1044. [Google Scholar] [CrossRef] [PubMed]
  15. Nakanishi, A.; Bae, J.; Kuroda, K.; Ueda, M. Construction of a novel selection system for endoglucanases exhibiting carbohydrate-binding modules optimized for biomass using yeast cell-surface engineering. AMB Express 2012, 2, 56. [Google Scholar] [CrossRef] [Green Version]
  16. Ishii, J.; Kondo, T.; Makino, H.; Ogura, A.; Matsuda, F.; Kondo, A. Three gene expression vector sets for concurrently expressing multiple genes in Saccharomyces cerevisiae. FEMS Yeast Res. 2014, 14, 399–411. [Google Scholar] [CrossRef] [Green Version]
  17. Swinnen, S.; Klein, M.; Carrillo, M.; McInnes, J.; Nguyen, H.T.T.; Nevoigt, E. Re-evaluation of glycerol utilization in Saccharomyces cerevisiae: Characterization of an isolate that grows on glycerol without supporting supplements. Biotechnol. Biofuels 2013, 6, 157. [Google Scholar] [CrossRef] [PubMed] [Green Version]
  18. Barnett, J.A.; Payne, R.W.; Yarro, D. Yeasts: Characteristics and Identification, 3rd ed.; Cambridge University: Cambridge, UK, 2000. [Google Scholar]
  19. Paciello, L.; de Alteriis, E.; Mazzoni, C.; Palermo, V.; Zueco, J.; Parascandola, P. Performance of the auxotrophic Saccharomyces cerevisiae BY4741 as host for the production of IL-1β in aerated fed-batch reactor: Role of ACA supplementation, strain viability, and maintenance energy. Microbial. Cell Factories 2009, 8, 70. [Google Scholar] [CrossRef] [Green Version]
  20. Xiberras, J.; Klein, M.; Nevoigt, E. Glycerol as a substrate for Saccharomyces cerevisiae based bioprocesses—Knowledge gaps regarding the central carbon catabolism of this ‘non-fermentable’ carbon source. Biotechnol. Adv. 2019, 37, 107378. [Google Scholar] [CrossRef] [PubMed]
  21. Bakker, B.M.; Overkamp, K.M.; van Maris, A.J.; Kötter, P.; Luttik, M.A.; van Dijken, J.P.; Pronk, J.T. Stoichiometry and compartmentation of NADH metabolism in Saccharomyces cerevisiae. FEMS Microbiol. Rev. 2001, 25, 15–37. [Google Scholar] [CrossRef] [PubMed]
  22. Yu, K.O.; Kim, S.W.; Han, S.O. Engineering of glycerol utilization pathway for ethanol production by Saccharomyces cerevisiae. Bioresour. Technol. 2010, 101, 4157–4161. [Google Scholar] [CrossRef]
  23. Sasaki, K.; Tsuge, Y.; Kawaguchi, H.; Yasukawa, M.; Sasaki, D.; Sazuka, T.; Kamio, E.; Ogino, C.; Matsuyama, H.; Kondo, A. Sucrose purification and repeated ethanol production from sugars remaining in sweet sorghum juice subjected to a membrane separation process. Appl. Microbiol. Biotechnol. 2017, 101, 6007–6014. [Google Scholar] [CrossRef]
  24. Peña-Moreno, I.C.; Parente, D.C.; da Silva, J.M.; Mendonça, A.A.; Rojas, L.A.V.; de Morais-Junior, M.A.; de Barros-Pita, W. Nitrate boosts anaerobic ethanol production in an acetate-dependent manner in the yeast Dekkera bruxellensis. J. Ind. Microbiol. Biotechnol. 2019, 46, 209–220. [Google Scholar] [CrossRef] [PubMed]
  25. Teste, M.A.; Duquenne, M.; François, J.M.; Parrou, J.L. Validation of reference genes for quantitative expression analysis by real-time RT-PCR in Saccharomyces cerevisiae. BMC Mol. Biol. 2009, 10, 99. [Google Scholar] [CrossRef] [Green Version]
  26. Dohn, R.; Xie, B.; Back, R.; Selewa, A.; Eckart, H.; Rao, R.P.; Basu, A. mDrop-seq: Massively parallel single-cell RNA-seq of Saccharomyces cerevisiae and Candida albicans. Vaccines 2021, 10, 30. [Google Scholar] [CrossRef]
  27. Vaudano, E.; Noti, O.; Costantini, A.; Garcia-Moruno, E. Identification of reference genes suitable for normalization of RT-qPCR expression data in Saccharomyces cerevisiae during alcoholic fermentation. Biotechnol. Lett. 2011, 33, 1593–1599. [Google Scholar] [CrossRef]
  28. Ho, P.W.; Swinnen, S.; Duitama, J.; Nevoigt, E. The sole introduction of two single-point mutations establishes glycerol utilization in Saccharomyces cerevisiae CEN.PK derivatives. Biotechnol. Biofuels 2017, 10, 10. [Google Scholar] [CrossRef] [Green Version]
  29. Islam, Z.; Kleina, M.; Aßkampa, M.R.; Ødumb, A.S.R.; Nevoigta, E. A modular metabolic engineering approach for the production of 1,2-propanediol from glycerol by Saccharomyces cerevisiae. Metab. Eng. 2017, 44, 223–235. [Google Scholar] [CrossRef] [Green Version]
  30. Kawai, K.; Kanesaki, Y.; Yoshikawa, H.; Hirasawa, T. Identification of metabolic engineering targets for improving glycerol assimilation ability of Saccharomyces cerevisiae based on adaptive laboratory evolution and transcriptome analysis. J. Biosci. Bioeng. 2019, 128, 162–169. [Google Scholar] [CrossRef]
  31. Papapetridis, I.; Verhoeven, M.D.; Wiersma, S.J.; Goudriaan, M.; van Maris, A.J.A.; Pronk, J.T. Laboratory evolution for forced glucose-xylose co-consumption enables identification of mutations that improve mixed-sugar fermentation by xylose-fermenting Saccharomyces cerevisiae. FEMS Yeast Res. 2018, 18, foy056. [Google Scholar] [CrossRef] [Green Version]
  32. Thakur, S.S.; Geiger, T.; Chatterjee, B.; Bandilla, P.; Fröhlich, F.; Cox, J.; Mann, M. Deep and highly sensitive proteome coverage by LC-MS/MS without prefractionation. Mol. Cell Proteom. 2011, 10, M110.003699. [Google Scholar] [CrossRef] [Green Version]
  33. Petelenz-Kurdziel, E.; Kuehn, C.; Nordlander, B.; Klein, D.; Hong, K.-K.; Jacobson, T.; Dahl, P.; Schaber, J.; Nielsen, J.; Hohmann, S.; et al. Quantitative analysis of glycerol accumulation, glycolysis and growth under hyper osmotic stress. PLoS Comput. Biol. 2013, 9, e1003084. [Google Scholar] [CrossRef] [PubMed]
  34. Marta, V.; Kostyantyn, V. Metabolic engineering for high glycerol productionby the anaerobic cultures of Saccharomyces cerevisiae. Appl. Microbiol. Biotechnol. 2016, 101, 4403–4416. [Google Scholar]
  35. Daran-Lapujade, P.; Jansen, M.L.A.; Daran, J.M.; van Gulik, W.; de Winde, J.H.; Pronk, J.T. Role of transcriptional regulation in controlling fluxes in central carbon metabolism of Saccharomyces cerevisiae: A chemostat culture study. J. Biol. Chem. 2004, 279, 9125–9138. [Google Scholar] [CrossRef] [Green Version]
  36. Yu, M.; Juwono, N.K.P.; Foo, J.L.; Leong, S.S.; Chang, M.W. Metabolic engineering of Saccharomyces cerevisiae for the overproduction of short branched-chain fatty acids. Meta Eng. 2016, 34, 36–43. [Google Scholar] [CrossRef]
  37. Bakker, B.M.; Bro, C.; Kotter, P.; Luttik, M.A.H.; Dijken, J.P.; Pronk, J.T. The Mitochondrial alcohol Dehydrogenase Adh3p Is Involved in a Redox Shuttle in Saccharomyces cerevisiae. J. Bacteriol. 2000, 182, 4730–4737. [Google Scholar] [CrossRef] [Green Version]
  38. Hoang, P.T.N.; Ko, J.K.; Gong, G.; Um, Y.; Lee, S.M. Genomic and phenotypic characterization of a refactored xylose-utilizing Saccharomyces cerevisiae strain for lignocellulosic biofuel production. Biotechnol. Biofuel Bioprod. 2018, 11, 268. [Google Scholar] [CrossRef] [Green Version]
  39. Costenoble, R.; Valadi, H.; Gustafsson, L.; Niklasson, C.; Franzén, C.J. Microaerobic glycerol formation in Saccharomyces cerevisiae. Yeast 2000, 16, 1483–1495. [Google Scholar] [CrossRef]
  40. Norbeck, J.; Blomberg, A. Metabolic and regulatory changes associated with growth of Saccharomyces cerevisiae in 1.4 M NaCl: Evidence for osmotic induction of glycerol dissimilation via the dihydroxyacetone pathway. J. Biol. Chem. 1997, 272, 5544–5554. [Google Scholar] [CrossRef] [Green Version]
Figure 1. Overview of picking up glycerol acclimatized strains. BY4741 strains were acclimatized to glycerol assimilation gradually by nutrient pressure.
Microorganisms 10 01173 g001
Figure 2. Growth profile of glycerol-acclimatized strains on YNBG medium after selection from the YNBG plate. (a) Growth of glycerol-acclimatized strains was evaluated with the OD600 value after 503 h cultivation in YNBG medium; (b) µmax of each glycerol-acclimatized strain in YNBG medium was displayed; (c) growth profiles of glycerol-acclimatized strains were evaluated using each OD600 value. The growth profiles are shown as symbols of circles (no.7) and triangles (averaged growth of glycerol-acclimatized strains without no.7). Error bars indicate standard deviation of OD600 of glycerol-acclimatized strains without no.7. The growth profiles in YNBG were used for the primary evaluation.
Microorganisms 10 01173 g002
Figure 3. Time-course profiles of biomass production, carbon source consumption, and ethanol production of wildtype and no.7 in each medium under aerobic conditions. The figures show the profiles of (a) wildtype in SD, (b) no.7 in SD, and (c) no.7 in YNBG, under aerobic conditions. Symbols of the closed circle bold line, open square thin line, open triangle thin line, and cross-broken line correspond to biomass production (g·L−1), glucose concentration (g·L−1), glycerol concentration (g·L−1), and ethanol concentration (g·L−1), respectively. Glucose and glycerol concentrations are summarized as the substrate concentration in the figures. The growth profile depending on values of OD600 in YNBG was used as the secondary evaluation, and the values were converted into biomass production with the calibration curve.
Microorganisms 10 01173 g003
Figure 4. Distribution overview of transcription levels shown as Ct values of candidate genes as housekeeping genes in no.7 and wildtype. Boxplot representation of raw Ct values obtained from amplification curves (n = 6). Lower and upper boundaries of the box indicate the 25th and the 75th percentiles, the thin line within the box marks the median, and the whiskers (error bars) below and above the box indicate the 10th and 90th percentiles, respectively. CT values were obtained under (a) aerobic and (b) anaerobic conditions.
Microorganisms 10 01173 g004
Figure 5. Relative quantification of mRNA of wildtype and no.7 in SD and in SD/YNBG under aerobic conditions. Shown data are the relative mRNA levels normalized by the level of RDN18 as a housekeeping gene and by level of each gene of wildtype and no.7 under different media (SD and YNBG) at the exponential phase. The relative mRNA levels of wildtype in SD, no.7 in SD, and no.7 in YNBG are shown as blue, orange, and gray bars, respectively. Error bars indicate the SD of six replicate experiments (n = 6). The metabolic map is divided into three parts mainly including the (a) glucose–glycerol pathway, (b) pyruvate-ethanol pathway, and (c) TCA cycle. The same-colored star marks in same figures mean transcription levels of the same enzymes; same-colored circles marks in (a,b) mean transcription levels of the same enzymes, especially ALDs and ADHs.
Microorganisms 10 01173 g005aMicroorganisms 10 01173 g005bMicroorganisms 10 01173 g005c
Figure 6. Relative quantification of mRNA of wildtype and no.7 in SD and in SD/YNBG under anaerobic conditions. Shown data are the relative mRNA levels normalized by level of RDN18 as a housekeeping gene and by level of each gene of wildtype and no.7 under different media (SD and YNBG) at 24 h. The relative mRNA levels of wildtype in SD, no.7 in SD, and no.7 in YNBG are shown as blue, orange, and gray bars, respectively. Error bars indicate the SD of six replicate experiments (n = 6). The metabolic map is divided into three parts mainly including the (a) glucose–glycerol pathway, (b) pyruvate-ethanol pathway, and (c) TCA cycle. The same-colored star marks in the same figures mean transcription levels of the same enzymes; same-colored circle marks in (a,b) mean transcription levels of the same enzymes, especially ALDs and ADHs.
Microorganisms 10 01173 g006aMicroorganisms 10 01173 g006bMicroorganisms 10 01173 g006c
Table 1. Time-course profiles of carbon source consumption and ethanol production of wildtype and no.7 in each medium under anaerobic condition. Experimental replication was undertaken three times, respectively.
Wildtype in SDNo.7 in SDNo.7 in YNBG
0 h24 h0 h24 h0 h24 h
Glucose (g·L−1)20.8 ± 1.12.6 ± 0.622.3 ± 1.20.7 ± 0.7
Glycerol (g·L−1) 21.7 ± 2.522.1 ± 0.2
Ethanol (g·L−1)0.0 ± 0.08.5 ± 0.20.0 ± 0.010.2 ± 0.50.0 ± 0.00.0 ± 0.0
Publisher’s Note: MDPI stays neutral with regard to jurisdictional claims in published maps and institutional affiliations.

