Article

Response of Carbon Emissions and the Bacterial Community to Freeze–Thaw Cycles in a Permafrost-Affected Forest–Wetland Ecotone in Northeast China

1
Heilongjiang Province Key Laboratory of Geographical Environment Monitoring and Spatial Information Service in Cold Regions, Harbin Normal University, Harbin 150025, China
2
Heilongjiang Province Collaborative Innovation Center of Cold Region Ecological Safety, Harbin 150025, China
3
Cryosphere Research Station on the Qinghai-Tibet Plateau, State Key Laboratory of Cryospheric Science, Northwest Institute of Eco-Environment and Resources, Chinese Academy of Sciences, Lanzhou 730000, China
*
Author to whom correspondence should be addressed.
Microorganisms 2022, 10(10), 1950; https://doi.org/10.3390/microorganisms10101950
Submission received: 25 August 2022 / Revised: 21 September 2022 / Accepted: 27 September 2022 / Published: 30 September 2022
(This article belongs to the Section Environmental Microbiology)

Abstract

:
Climate warming can affect freeze–thaw cycle (FTCs) patterns in northern high-latitude regions and may affect permafrost carbon emissions. The response of carbon release and microbial communities to FTCs has not been well characterized. Here, we conducted laboratory incubation experiments to investigate the relationships among carbon emissions, bacterial community, and soil variables in a permafrost-affected forest–wetland ecotone in Northeast China. The emission rates of CO2 and CH4 increased during the FTCs. FTC amplitude, FTC frequency, and patch type had significant effects on carbon emissions. FTCs increased the contents of soil DOC, NH4+-N, and NO3-N but reduced bacterial alpha diversity. CO2 emissions were mainly affected by bacterial alpha diversity and composition, and the inorganic nitrogen content was the important factor affecting CH4 emissions. Our findings indicated that FTCs could significantly regulate CO2 and CH4 emissions by reducing bacterial community diversity and increasing the concentration of available soil substrates. Our findings shed new light on the microorganism-substrate mechanisms regulating the response patterns of the soil carbon cycle to FTCs in permafrost regions.

1. Introduction

The global air temperature is expected to increase by more than 1.5–2 °C in this century if no effective emission reduction measures are taken [1]. Under a warming climate, the carbon cycle in permafrost regions will make a major contribution to the global carbon budget due to its large amount of stored carbon and the high sensitivity of carbon release to temperature [2,3,4]. Permafrost degradation, including a deeper active layer, and reduction of permafrost areas have been widely observed in northern high latitudes [5,6,7], and this process can promote the microbial utilization of soil organic matter that has accumulated over the past thousands of years [8,9].
Climate warming can increase soil temperature and thaw permafrost, which can increase microbial activities and promote the decomposition of organic matter; it can also alter soil freeze–thaw cycle (FTCs) patterns. FTCs play a vital role in the soil biogeochemical process [10,11] via several mechanisms. First, phase changes of soil water in the freezing phase can destroy soil aggregate structure and promote the release of nutrients from soil lattices and colloids [12]. The melting of ice can increase the liquid water content of the soil, which can benefit the growth of anaerobic microorganisms [13]. Second, low temperature during the freezing stage can lead to the death of some microorganisms and plant roots. The nutrients and carbon substrate released from this organic matter can be used by survivors in the thawing stage to further enhance soil respiration [14,15]. Third, greenhouse gases produced during the freezing period remain in soil due to a physical barrier [16], and these gases can be released after the melting of ice [17]. Therefore, FTCs have a strong effect on CH4 and CO2 emissions, and peak values usually occur during the initial phase of spring and autumn FTCs [18]. Although the mechanisms and processes underlying the effects of FTCs on greenhouse gases have been studied, the quantitative effects of FTCs on carbon release have not yet been characterized. This knowledge gap can introduce significant uncertainty in future predictions of the permafrost carbon cycle.
In northern permafrost regions, climate warming rapidly leads to the degradation of permafrost [19], and this will alter the soil hydrothermal process and result in changes in vegetation composition and community succession [20,21]. Vegetation type can also affect soil carbon emissions [22,23]. Therefore, the ecological ecotone also requires consideration in studies of permafrost carbon release given that soil moisture levels, thermal regimes, and microhabitat types vary among ecological ecotones [24]. However, the response of soil carbon emissions and the bacterial community to the FTCs in different ecotones of permafrost regions are rarely known.
The DaXing’an Mountains, located on the southern boundary of the Eurasian permafrost zone, have experienced rapid warming over the past 100 years [25]. This area provides an excellent opportunity to examine the effects of FTCs on ecotones because it is a high-temperature permafrost region. Here, we collected soil samples from forest and wetland patches to investigate the effects of FTCs on the release rates of greenhouse gases and the factors driving them using laboratory experiments. The main goals of this study were to (1) determine the effect of FTC amplitude and frequency on soil carbon emissions and the bacterial community in different forest–wetland ecotones and (2) investigate the mechanisms underlying the regulation of the microbial community and substrate availability for CO2 and CH4 emissions under FTCs. We hypothesized that FTCs and ecotone type have a strong effect on soil carbon emissions and bacterial community structure, and FTCs might regulate CO2 and CH4 emissions by altering bacterial community diversity and increasing available soil substrates.

2. Materials and Methods

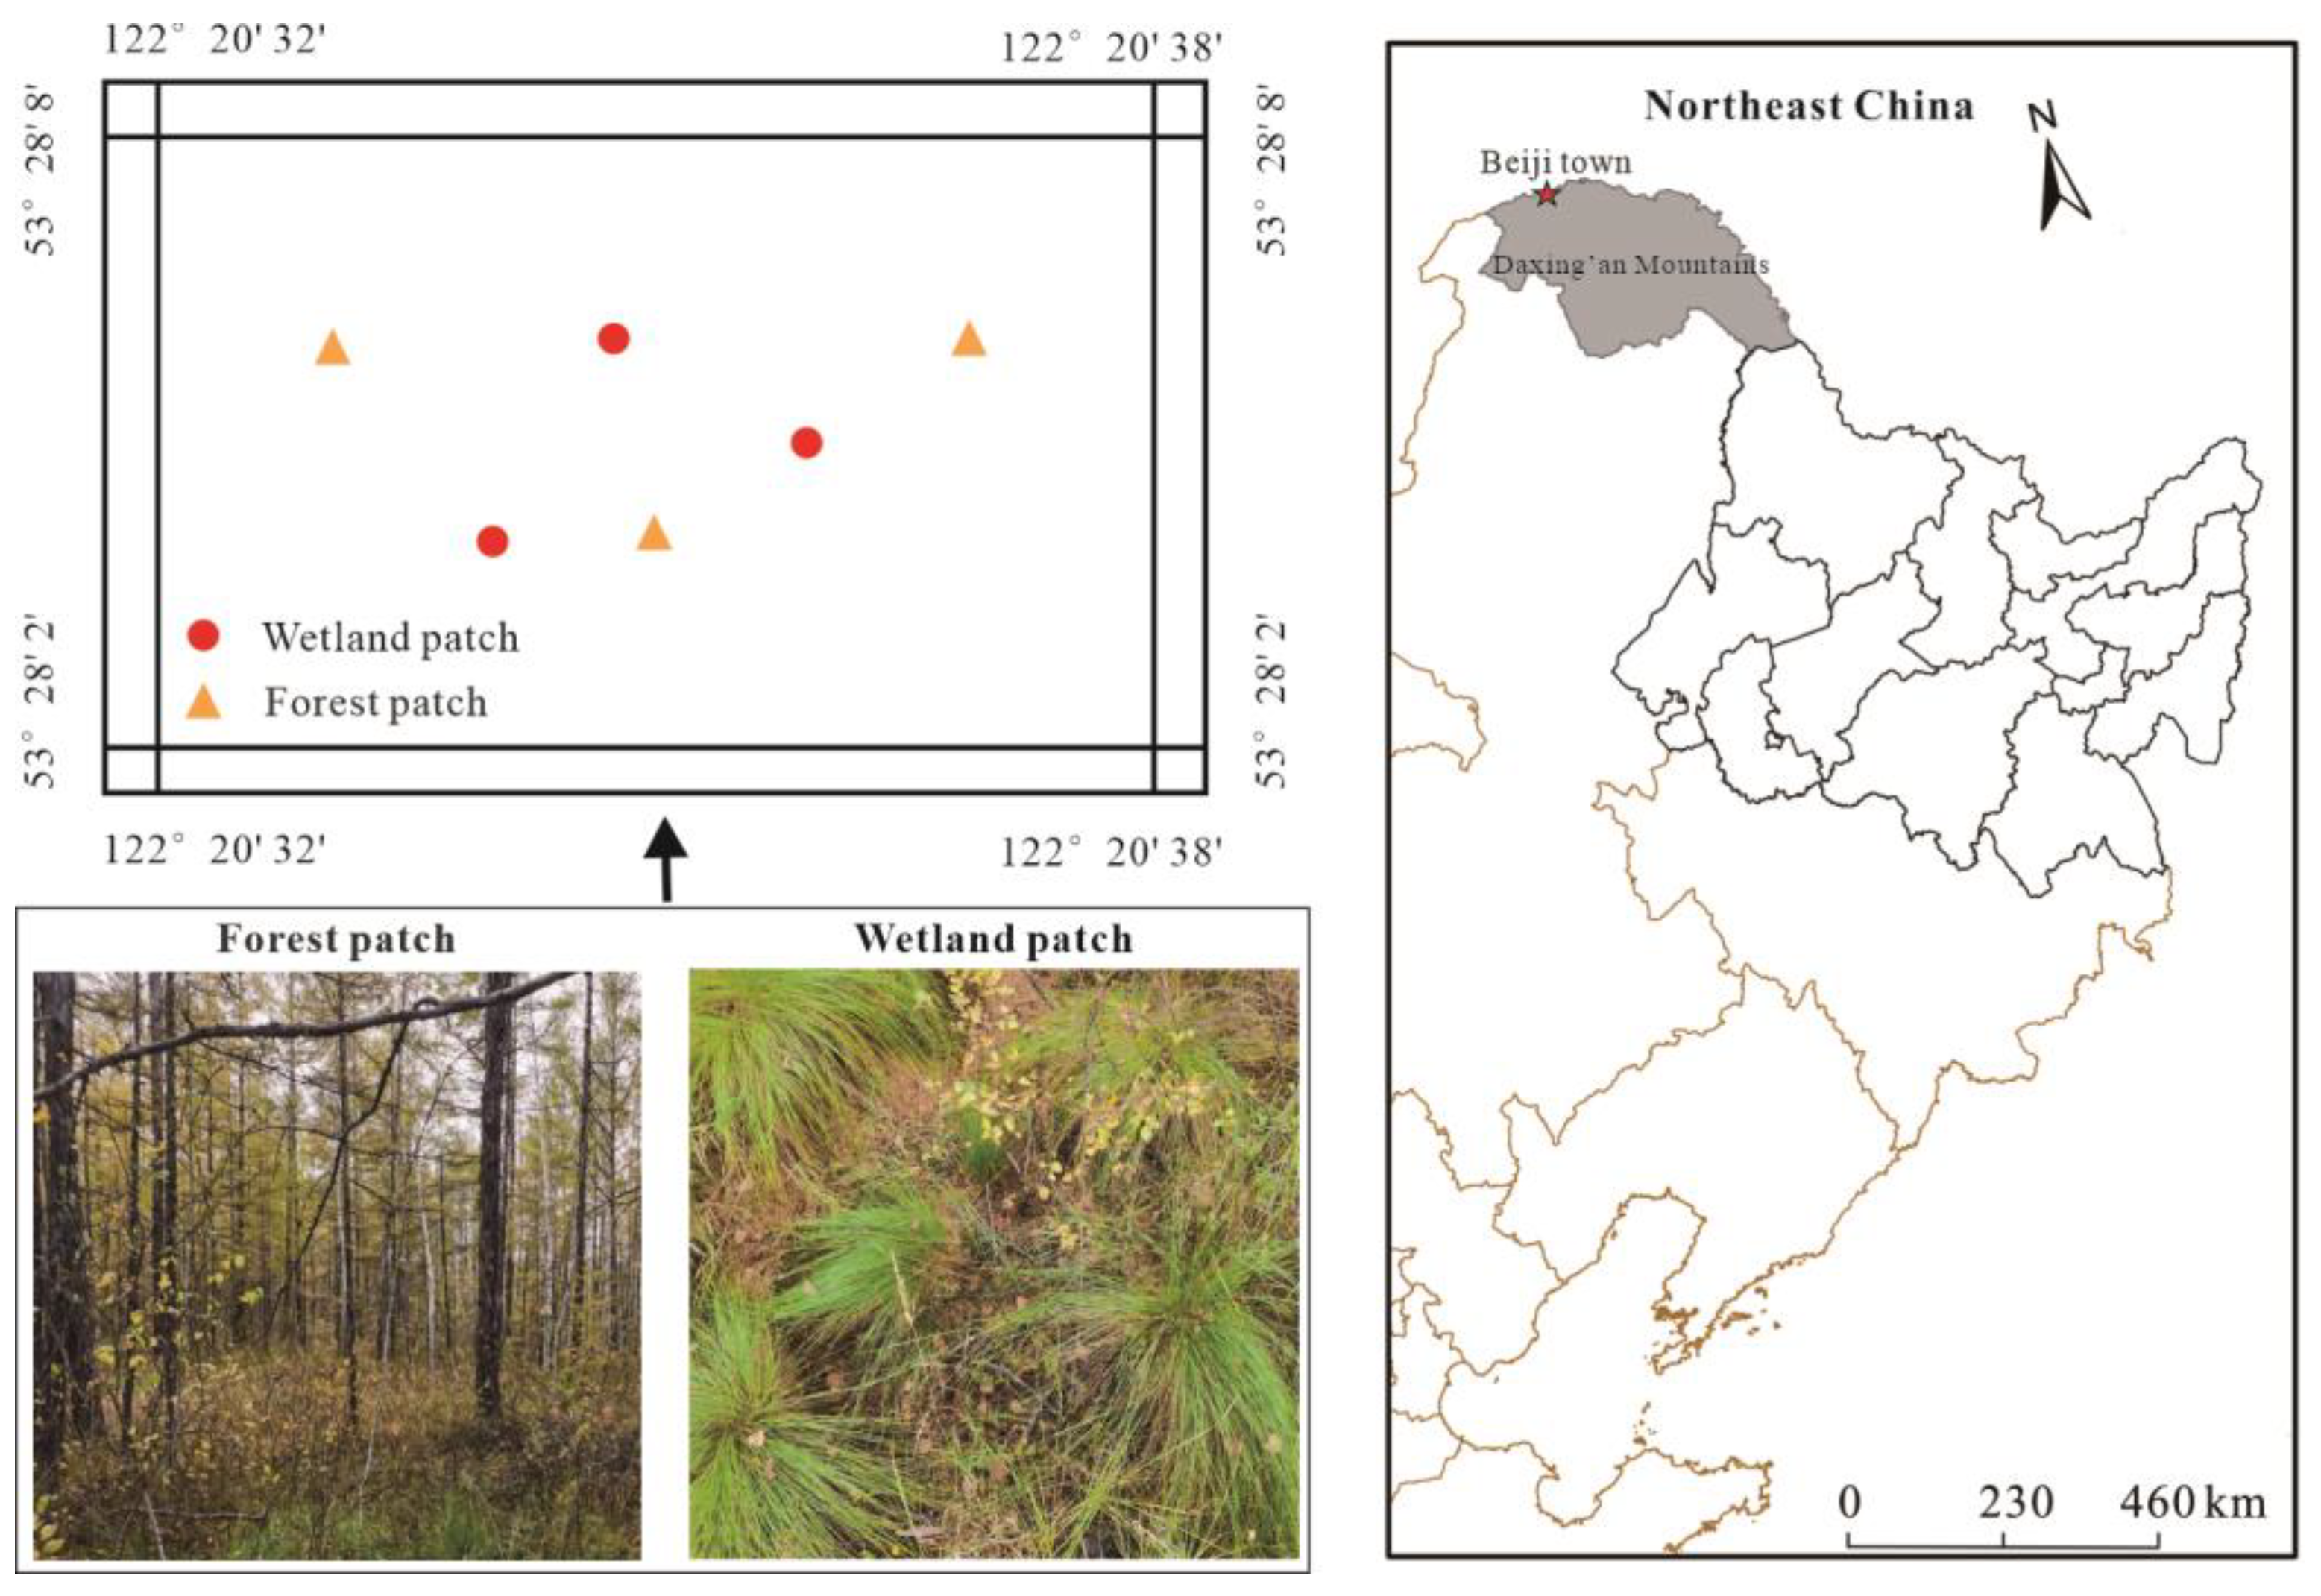
2.1. Site Description

This study was performed in a permafrost-affected forest–wetland ecotone in Beiji town, Daxing’an Mountains, Northeast China (Figure 1). The area experiences a typical cold temperate continental monsoon climate with an annual mean air temperature and precipitation of −2.19 °C and 549.9 mm, respectively [26]. The depth of the active layer is approximately 90–100 cm and 125–135 cm in wetland and forest patches, respectively, and measurements of the active layer were taken manually using a stainless steel drill in September 2020. The multiple diurnal FTCs begin in early May, and the spring FTC period lasts approximately two weeks; the autumn FTC period lasts approximately a week in mid-October [26]. The dominant species of the forest patches are Larix gmelina Ruprecht, Ledum palustre Linn., Betula ovalifolia Ruprecht, and Vaccinium uliginosum Linn., and Eriophorum vaginatum Linn. mainly occurs in wetland patches.

2.2. Soil Sampling and Experimental Design

In early September 2020, three Larix gmelina Ruprecht forest patches and Eriophorum vaginatum Linn. wetland patches in the forest–wetland ecotone were selected for sampling. Three soil cores (0–10 cm) were collected with a soil auger after removing the litter and aboveground vegetation in each patch [27,28]. The samples were divided into three subsamples. One subsample was used for bacterial analysis, the second subsample was sieved by a 4 mm mesh filter for incubation experiments and used for measurements of the content of soil dissolved organic carbon (DOC), ammonium nitrogen (NH4+-N), and nitrate nitrogen (NO3-N) [29]; the rest of the soils were sieved through a 0.25 mm mesh filter after being air-dried to determine soil pH.
Fresh soil (equivalent to 20 g of dry soil) with field moisture levels was incubated in 500 mL glass bottles. The samples were preincubated at 5 °C for 5 days before the FTC experiment to restore the normal activity of soil microorganisms [30,31,32]. The soil was frozen for 24 h and thawed for 24 h, which corresponded to a single FTC. The two FTC amplitudes were −5–5 °C and −10–10 °C, respectively [33]. After preincubation (CK) and the 1st [32,33], 3rd (close to the shortest FTC duration of 10 cm soil depth, 5 days), and 9th FTCs (close to the longest FTC duration of 10 cm soil depth, 17 days) [26], 10 mL gas samples were collected with a syringe with a three-way valve, and were analyzed using a gas chromatograph (Agilent 7890B, USA) (Table 1). Emission rates of CO2 and CH4 were calculated according to Lang et al. [34].
The soil carbon and nitrogen contents were measured after preincubation and the 1st, 3rd, and 9th FTCs. The DOC content was extracted by mixing soil samples with distilled water, shaking for 30 min, then centrifuging at 8000 rpm for 20 min [35] and supernatant was filtered by 0.45 μm filter membrane and then determined by TOC analyzer (Multi N/C 2100 analyzer Analytik Jena, Germany). Extraction of the content of soil NH4+-N and NO3-N was performed using 2 mol L−1 KCl solution and shaking for 1 h [36], and was measured with a continuous flowing analyzer (SAN++ Skalar, Netherlands). Measurement of soil pH used a pH meter (PHS-25, Shanghai, China) at 1:10 soil water ratio [37]. Soil moisture content was determined by the weighting method after drying at 105 °C for 12 h [38]. In this study, the soil water content and pH of the forest patches were 23.38 ± 0.81% and 5.04 ± 0.04, respectively; the soil water content and pH of the wetland patches were 84.41 ± 5.36% and 4.84 ± 0.01, respectively.

2.3. Soil Microbial Analysis

Soil bacterial community samples were taken after preincubation and the 1st, 3rd, and 9th FTCs. An E.Z.N.A.® soil DNA kit (Omega Bio-tek, Norcross, GA, USA) was used for extracting genomic DNA of microbial communities. DNA quality was estimated using 1% agarose gel electrophoresis, and measured by NanoDrop 2000 spectrophotometer (Thermo Scientific, Waltham, MA, USA). Amplification of 16S rRNA gene occurred by the primer pairs 515F (5′-GTGCCAGCMGCCGCGG-3′) and 806R (5′-GGACTACHVGGTWTCTAAT-3′). The details of thermal cycling were pre-denaturation for 3 min at 95 °C, 27 cycles (30 s at 95 °C, 30 s at 55 °C, and 45 s at 72 °C), and ultimately extension at 72 °C for 10 min. Each sample had three replicates. An AxyPrep DNA Gel Extraction Kit was used for the purification of PCR products (Axygen Biosciences, Union City, CA, USA), quantification for Quantus™ Fluorometer (Promega, Madison, WI, USA), and sequencing was performed on Illumina MiSeq PE300 platform (Illumina, San Diego, CA, USA).
The quality of the original sequences was controlled using Fastp software [39] spliced with Flash software [40]; sequences were clustered according to 97% similarity using UPARSE software [41], and chimeras were removed [41,42]. Each sequence was annotated using RDP classifier [43], the Silva 16S rRNA database (Silva v138) was compared, and the comparison threshold was set to 70%. The OTU table was rarefied at the lowest sequencing depth of the experimental samples. All the raw sequences have been deposited in the NCBI database under accession number PRJNA872837.

2.4. Data Analysis

SPSS 20.0 was used for statistical analysis. Differences in the soil carbon content, nitrogen content, and carbon emissions among experimental treatments or patch types were evaluated using independent samples t-tests [44]. Three-way ANOVA was performed to evaluate the effect of FTC amplitude, FTC frequency, patch type, and interactions on soil carbon content, nitrogen content, and carbon emissions [45]. Stepwise regression analysis was performed to analyze the main controlling factors of soil carbon emissions [46]. Redundancy analysis (RDA) used CANOCO 5.0 to clarify the relationship between soil substrates and bacterial phyla [47]. Non-metric multidimensional scaling (NMDS) and partial least squares discriminant analysis (PLS-DA) were performed using the Majorbio cloud platform to clarify the feedback of bacterial community structure to FTCs [48,49,50]. Student’s t-tests were carried out to determine differences in alpha diversity among treatments [51]. Other figures were drawn in Origin 2022b.

3. Results

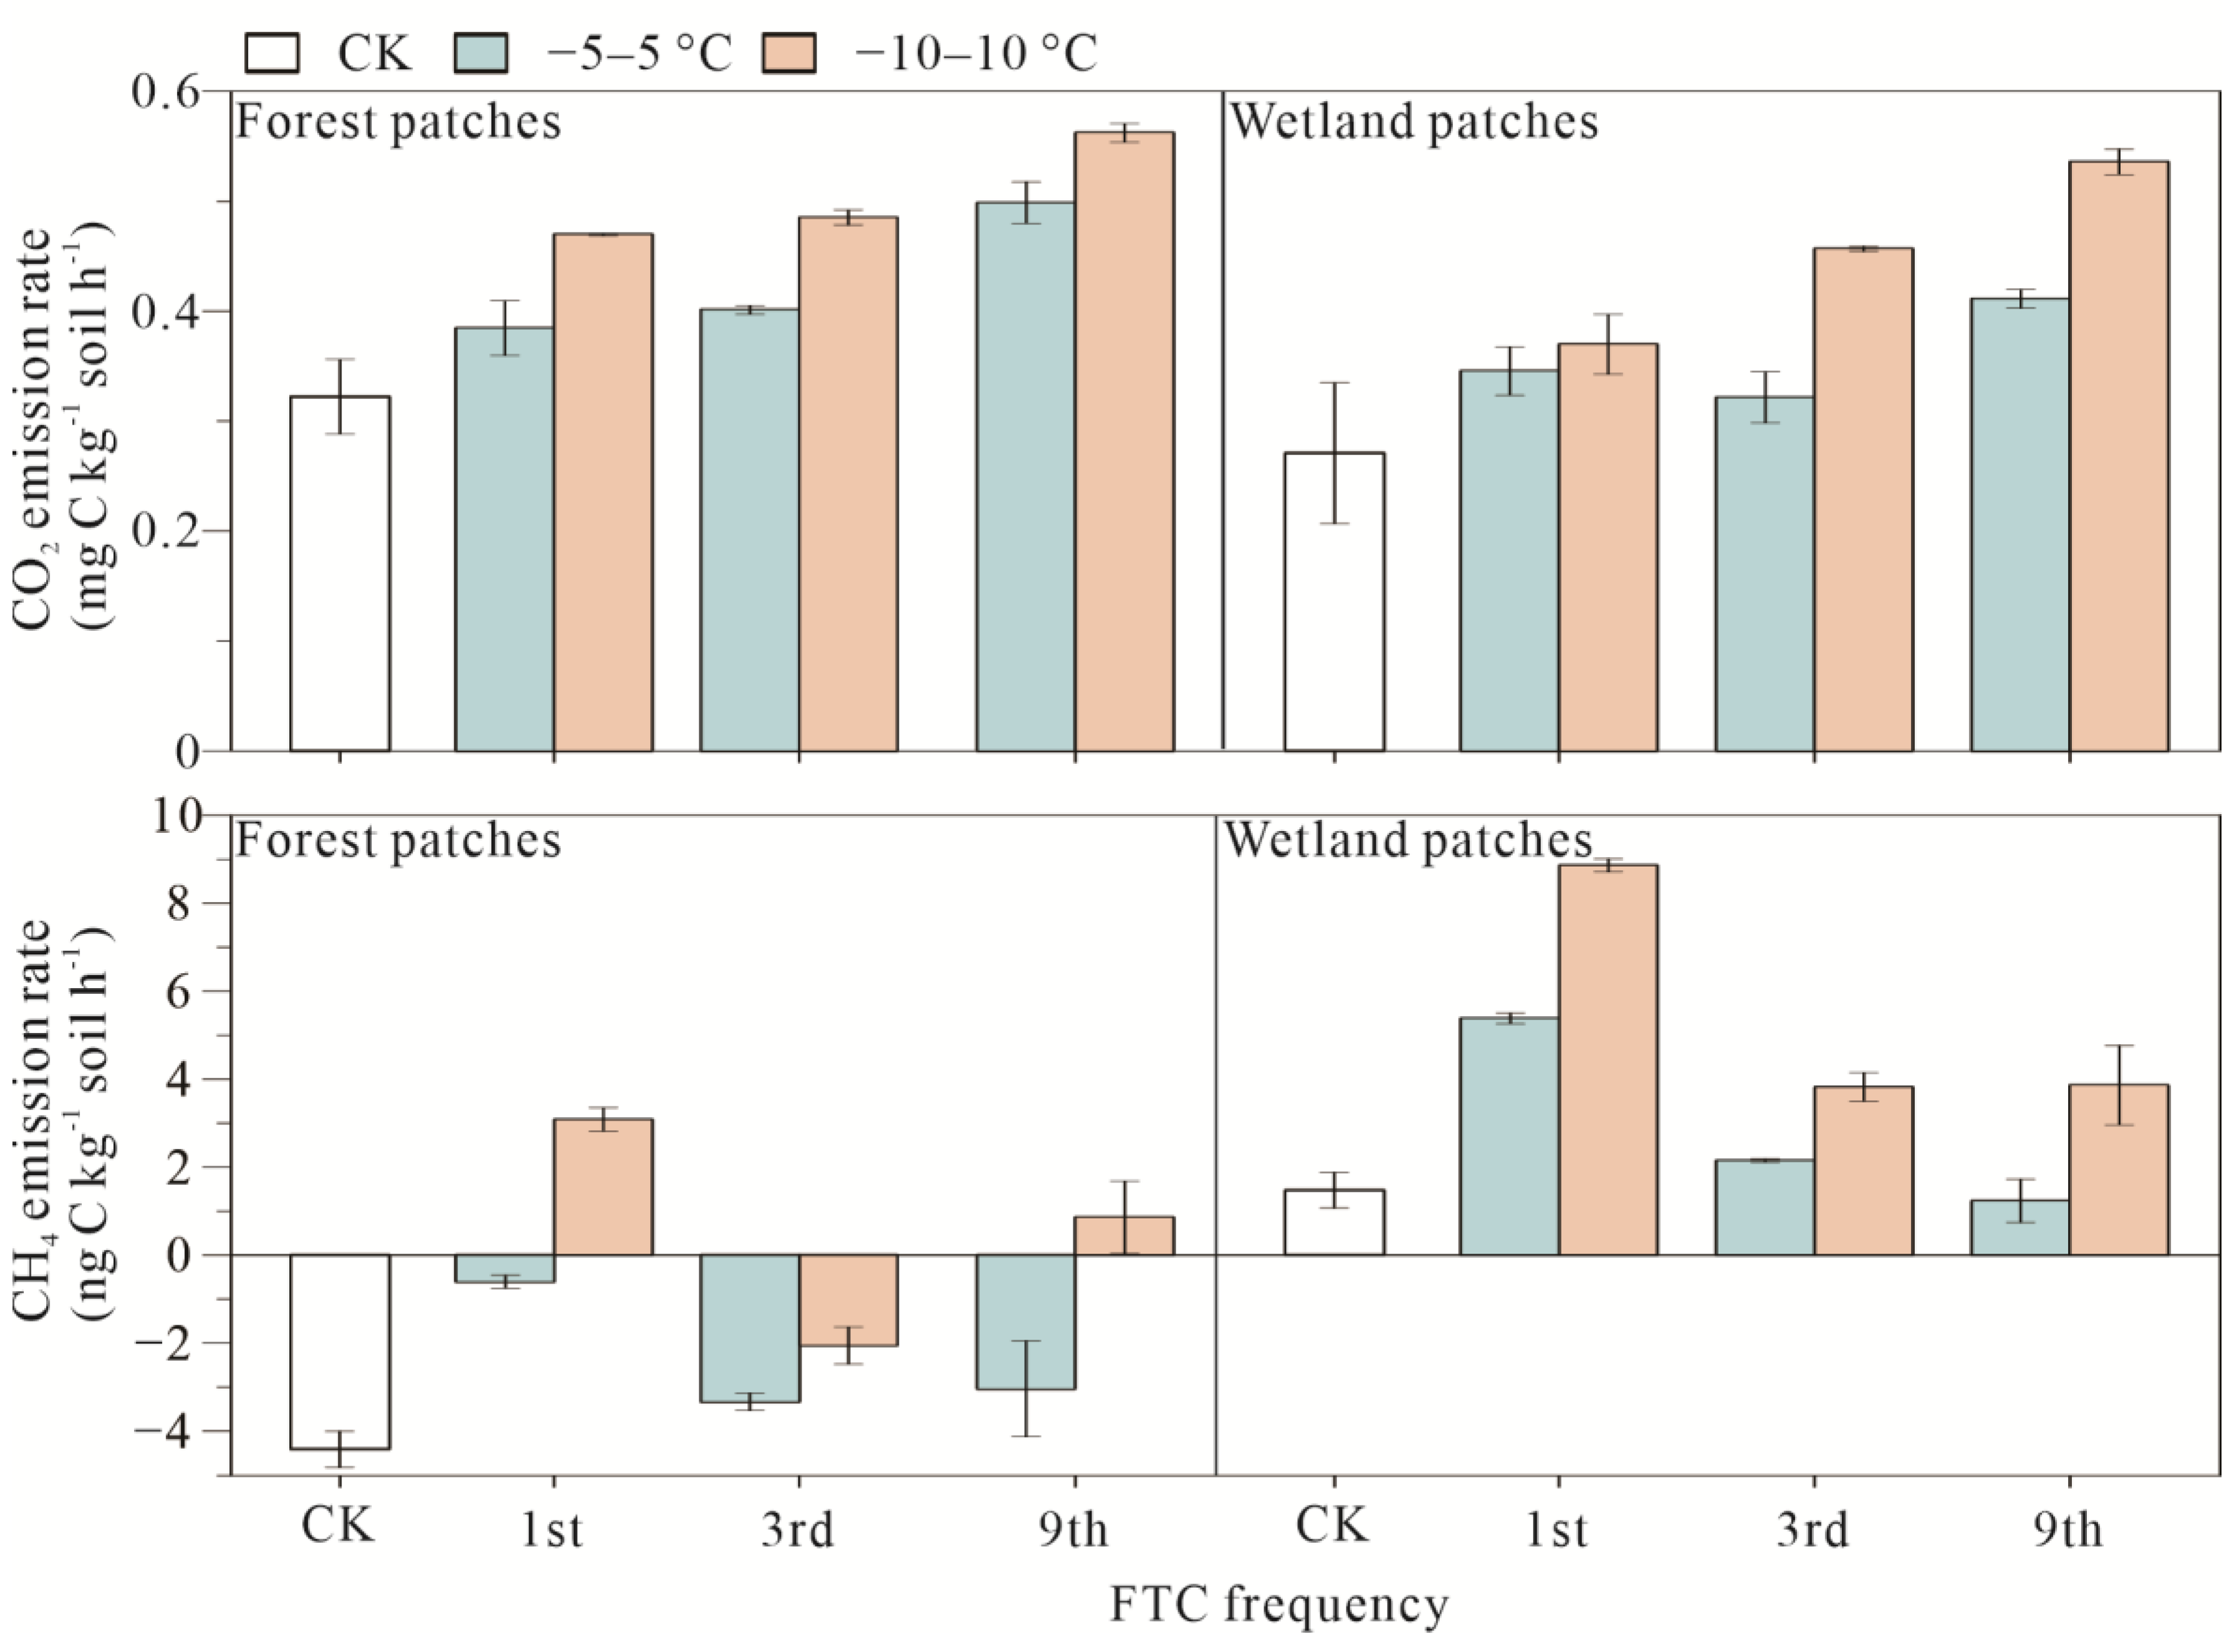
3.1. Soil Carbon Emissions of Forest and Wetland Patches after FTCs

Compared with the preincubation period, higher CO2 and CH4 emissions were found during FTCs, and this effect was more pronounced in the −10–10 °C treatment (p < 0.05). FTC frequency increased the CO2 emission rates and decreased the CH4 emission rates in both the forest patches and wetland patches (Figure 2). The forest patches had a higher CO2 emission rate, and the wetland patches had a higher CH4 emission rate. FTC amplitude, FTC frequency, and patch type significantly affected CO2 and CH4 emissions (p < 0.05) (Table S1).

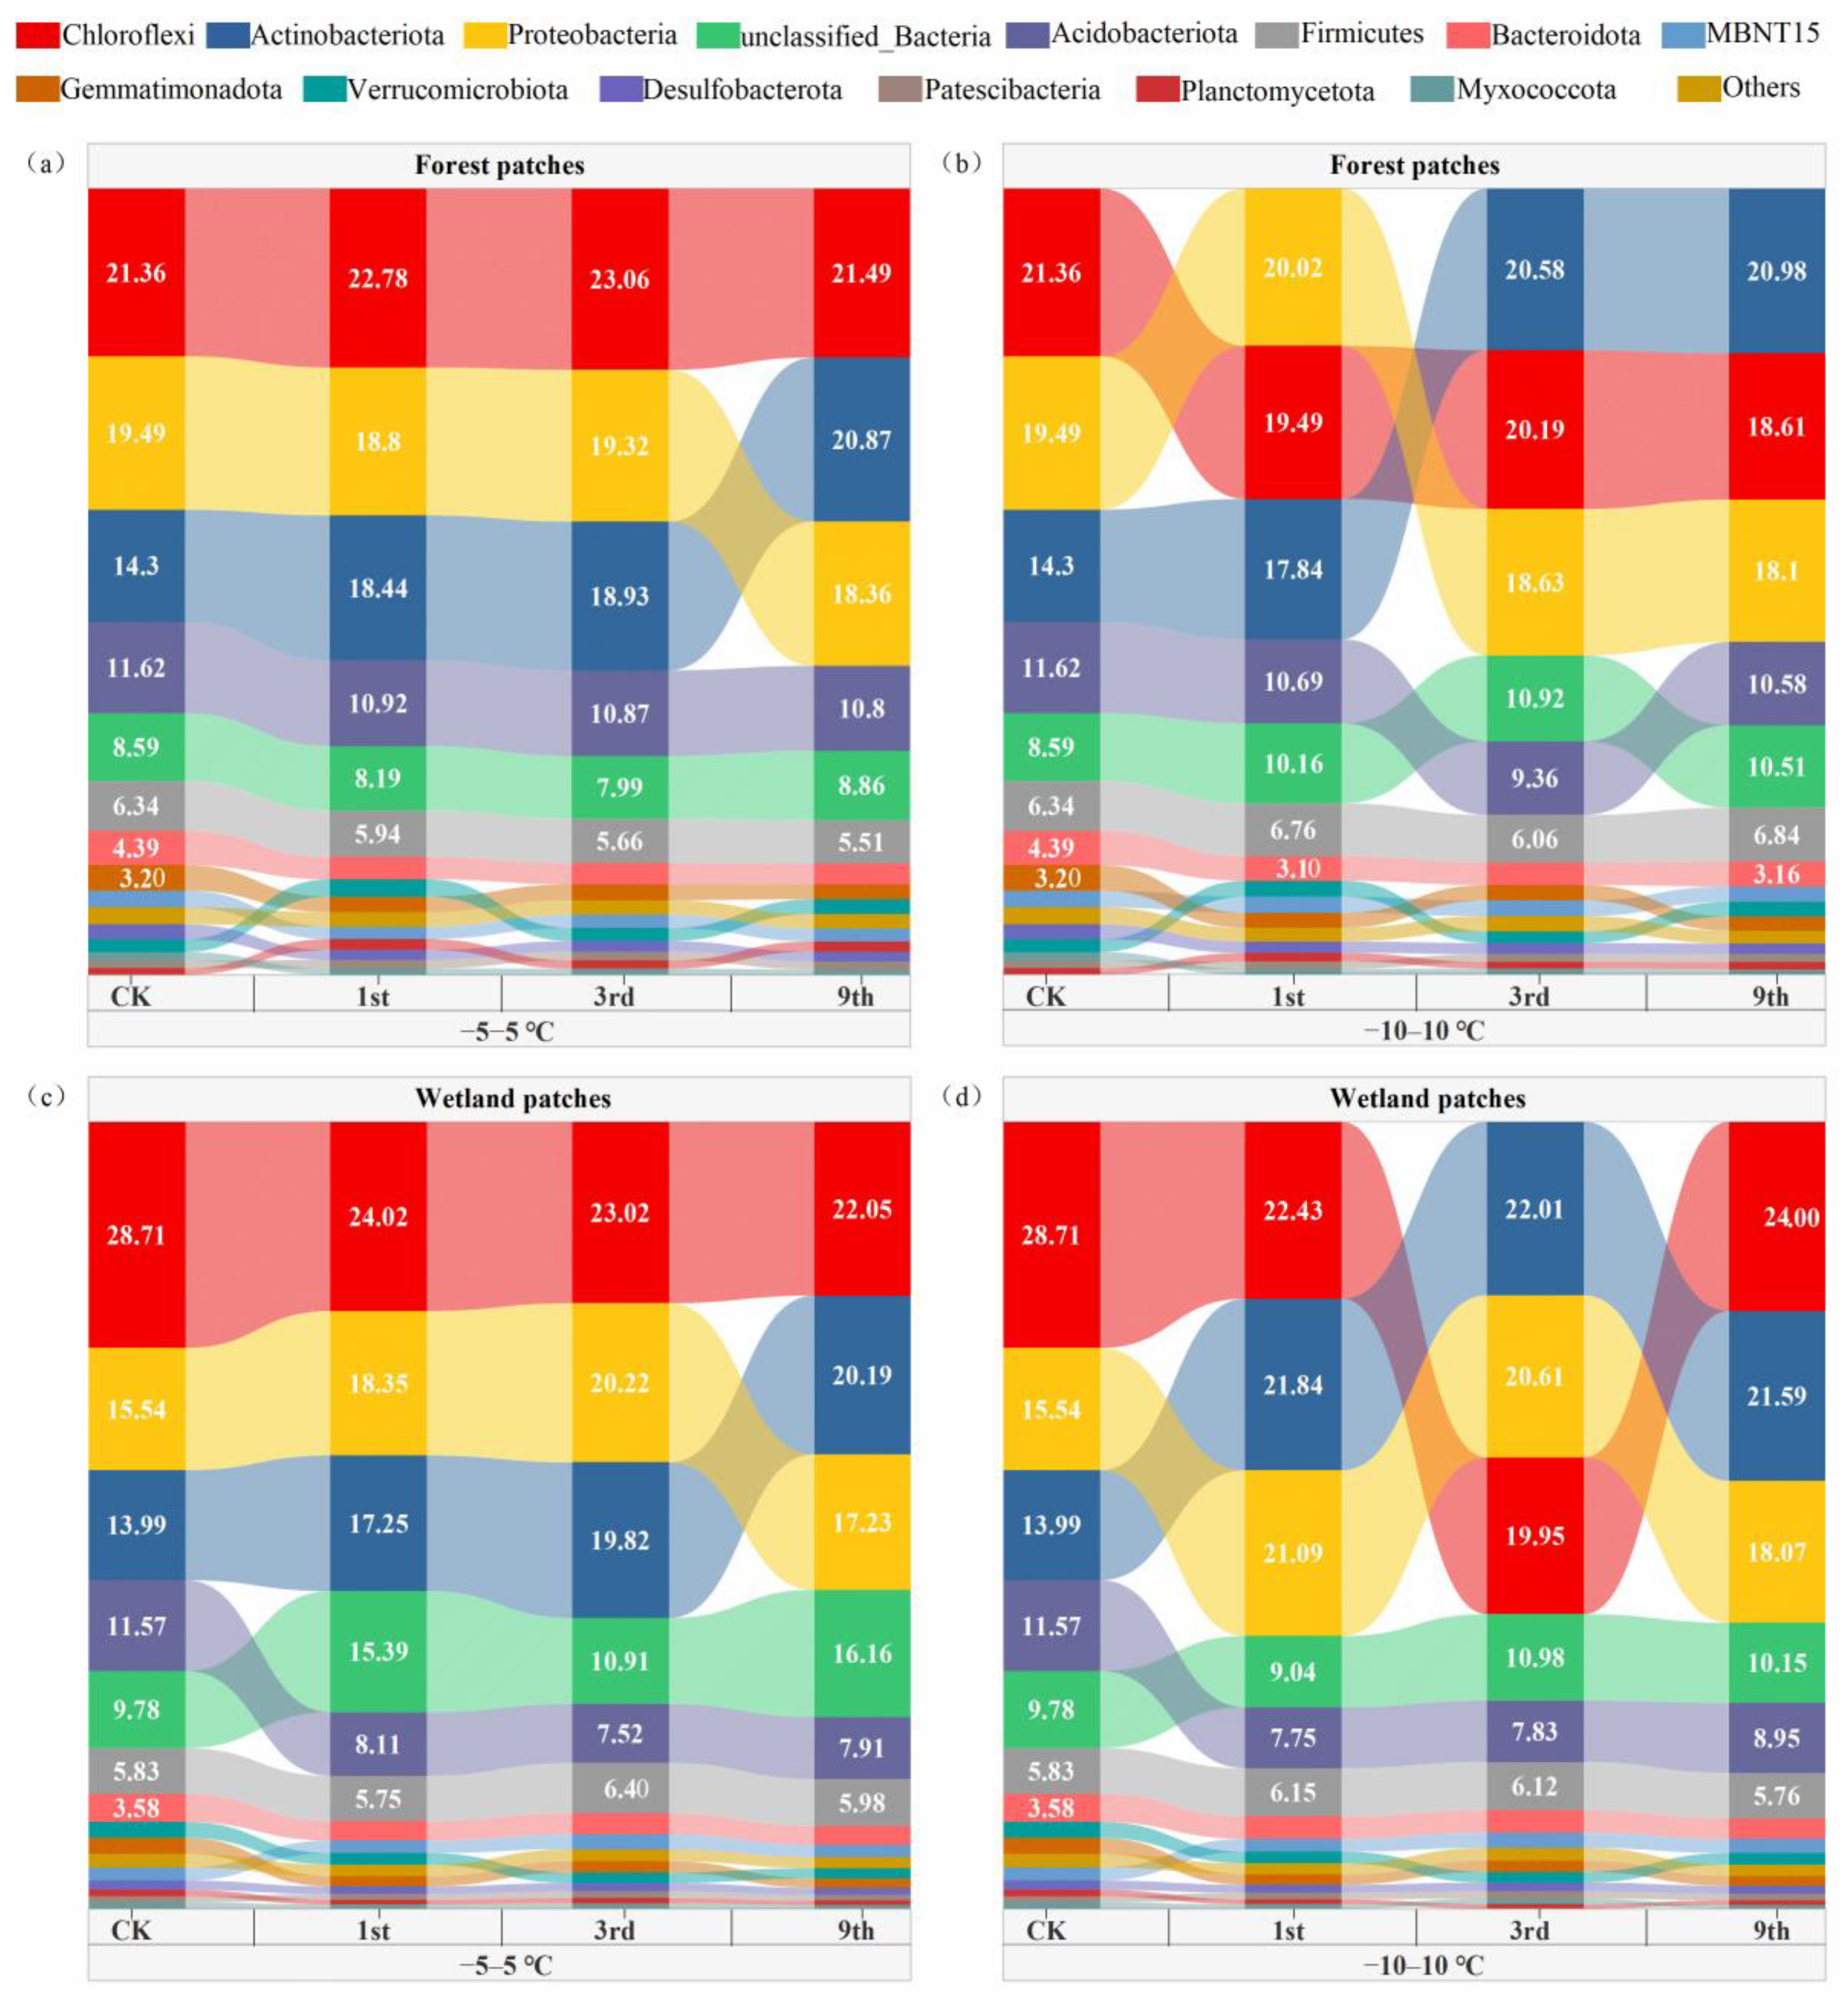
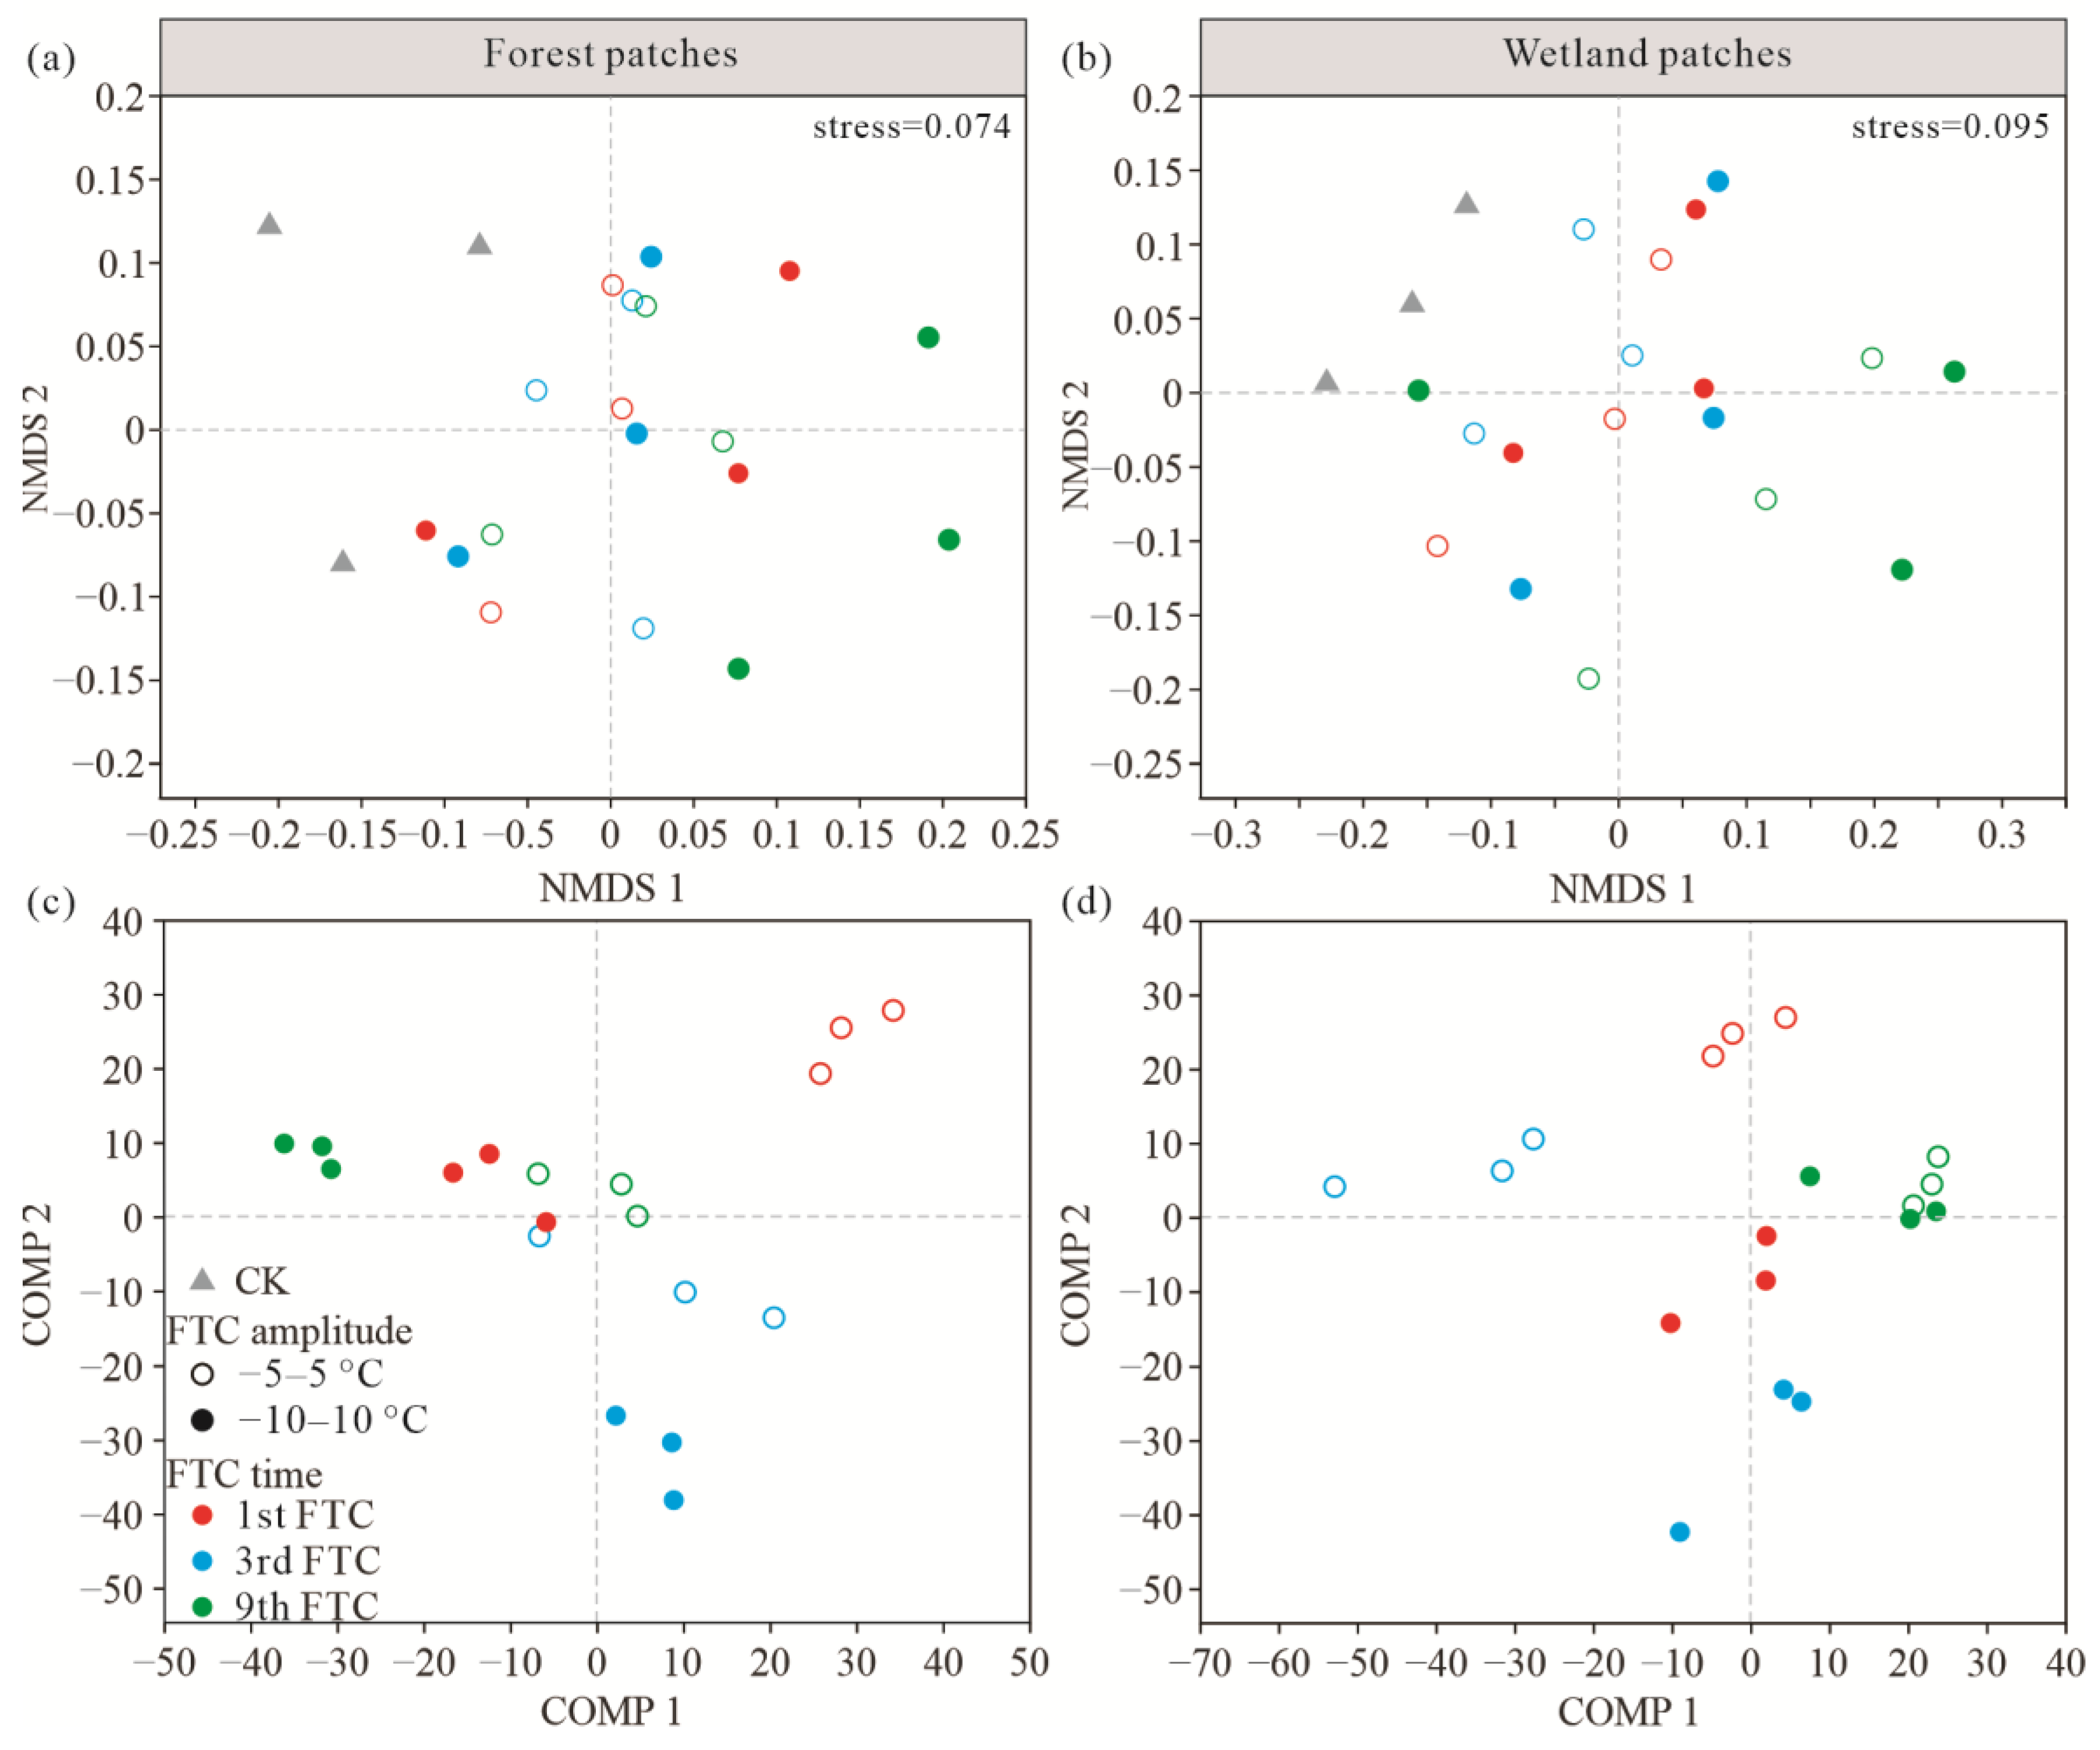
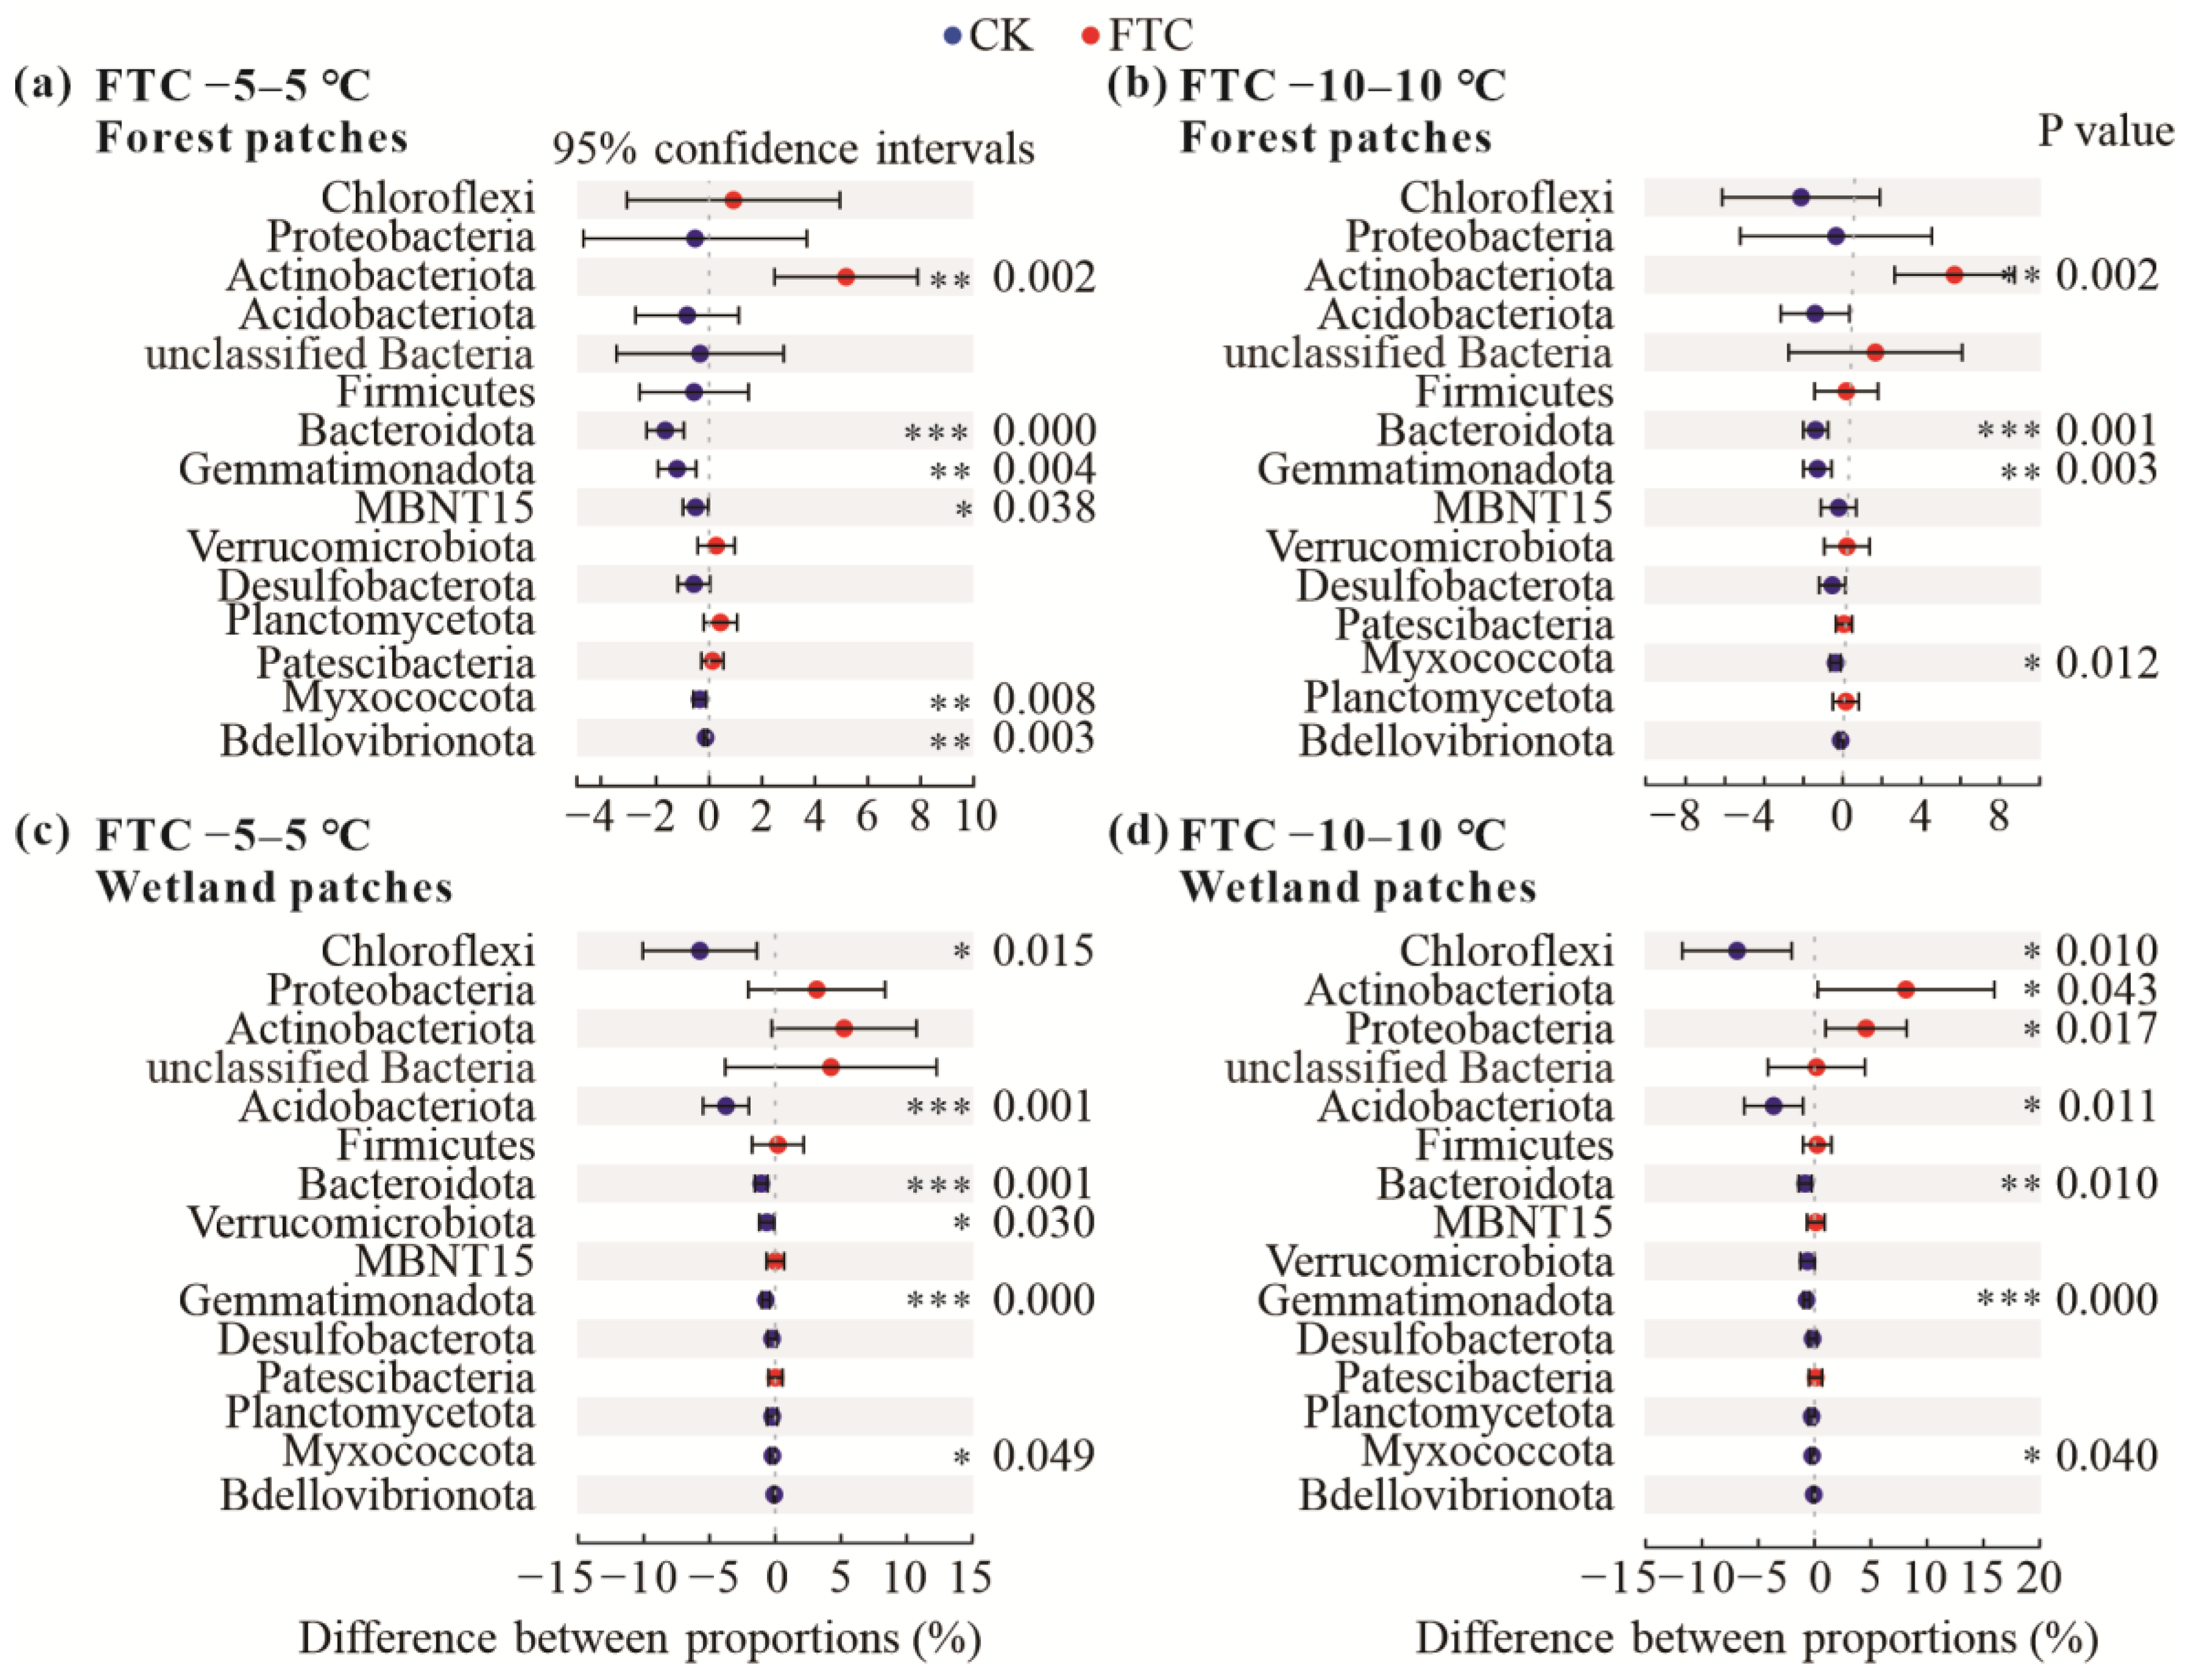
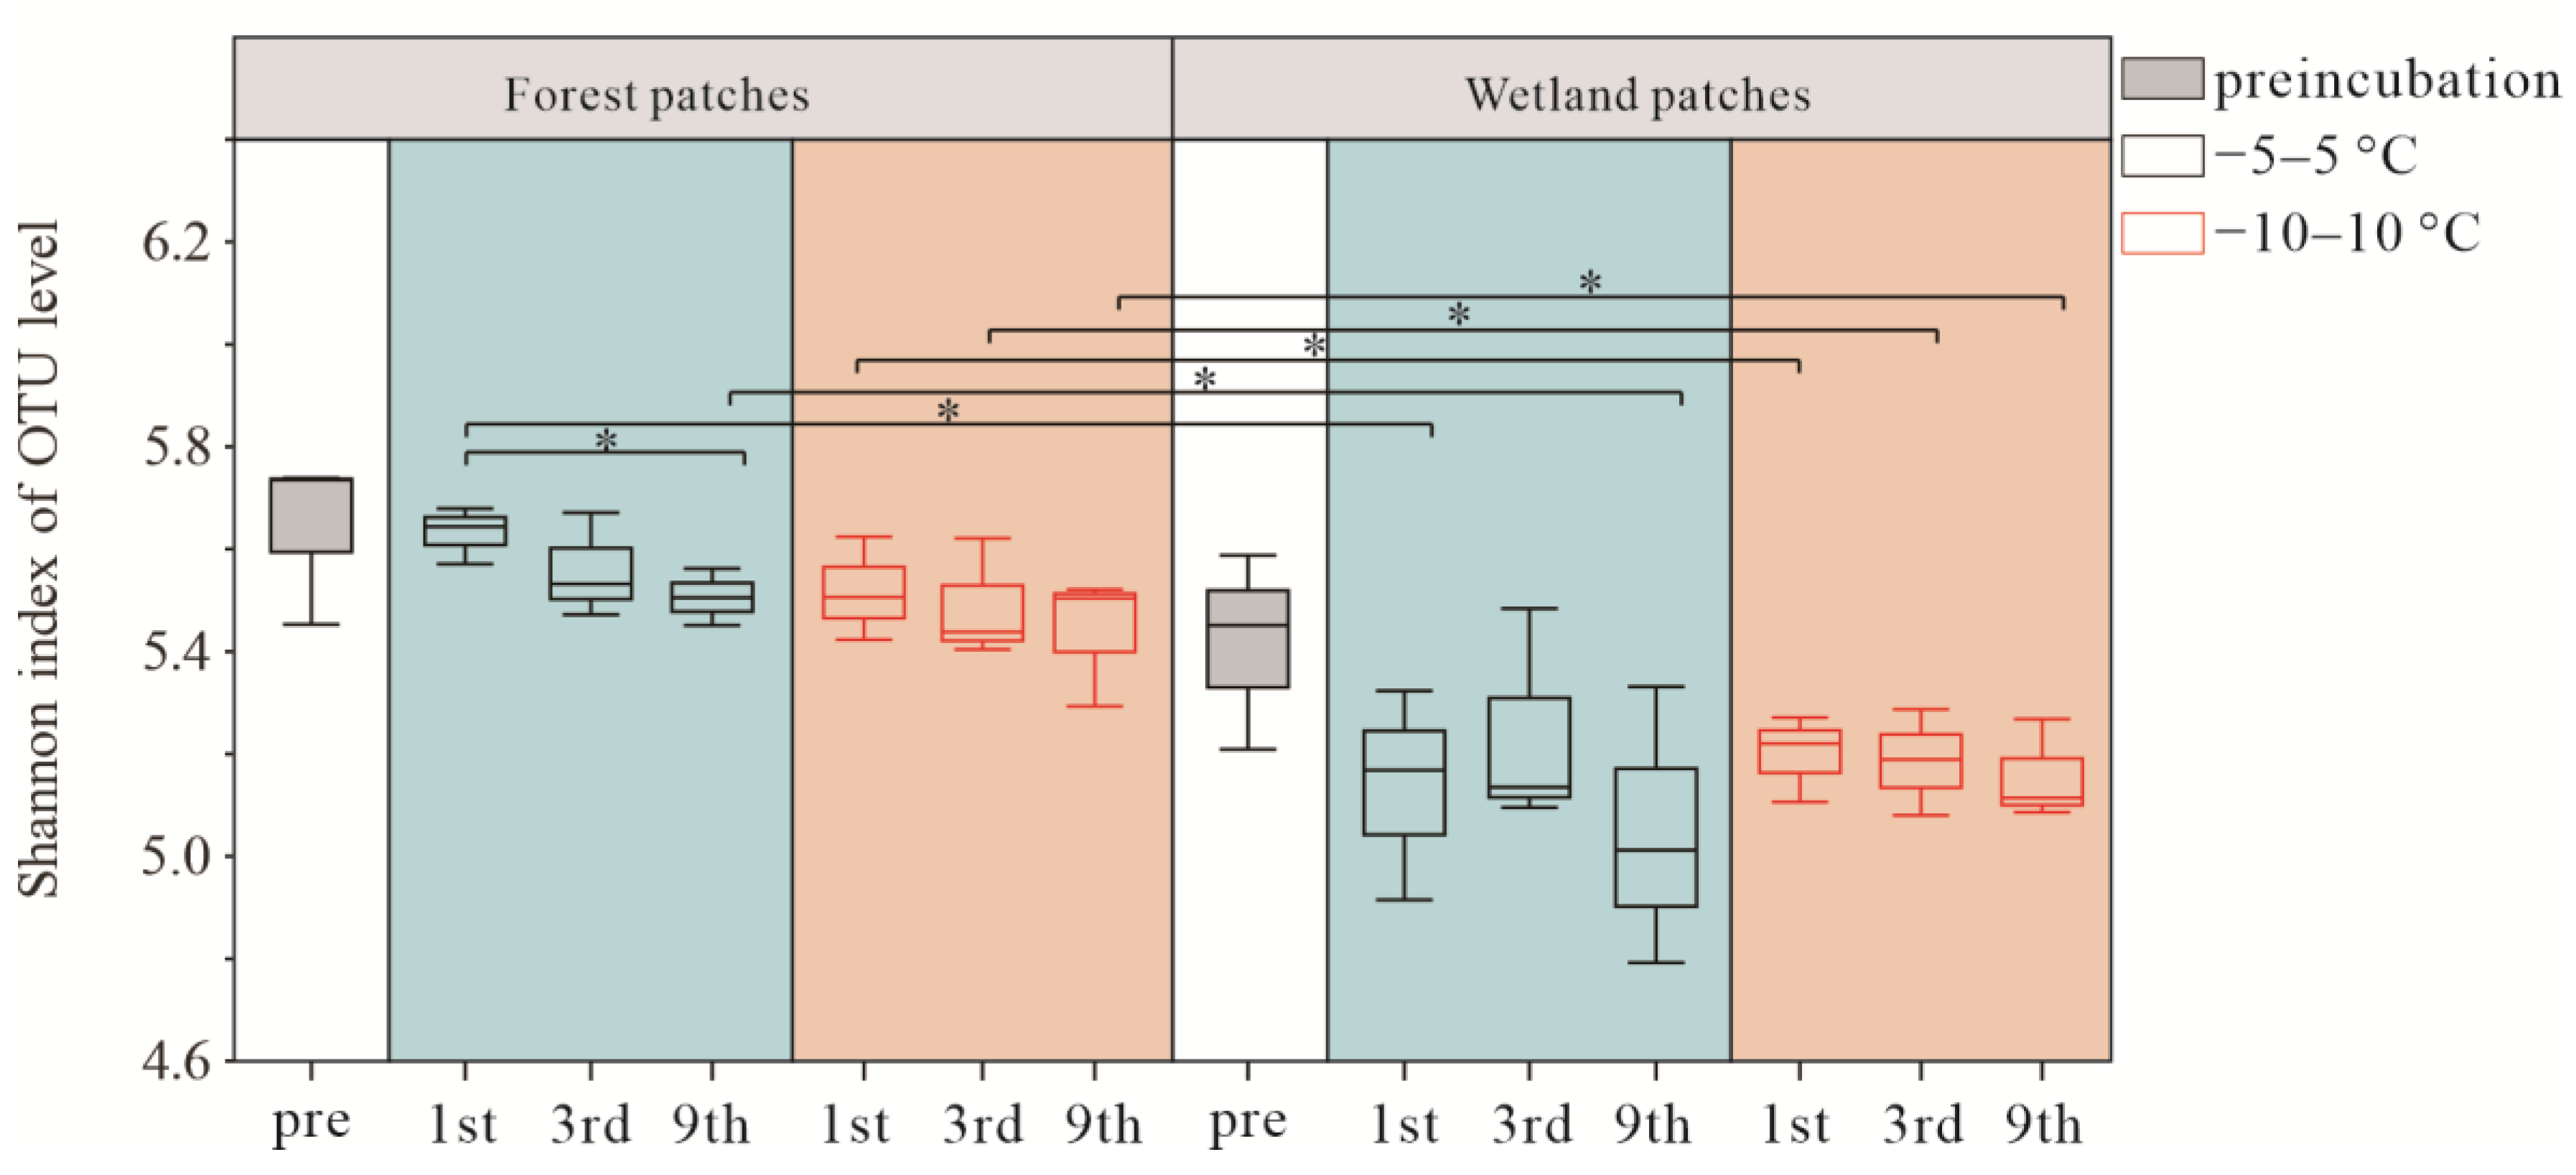
3.2. Soil Bacterial Community Composition and Diversity after FTCs

Chloroflexi, Actinobacteriota, Proteobacteria, Acidobacteriota, and Firmicutes were the dominant phyla across all control samples and FTC treatments and accounted for more than 80% of all taxa, excluding unclassified bacteria (Figure 3). No significant differences were found in the relative abundance of bacterial phyla under treatments with different FTC frequencies. Therefore, we compared the average relative abundances of bacterial phyla in the treatments with the three FTCs with those of the preincubation samples. FTCs significantly increased the relative abundance of Actinobacteriota in forest and wetland patches under both FTC amplitudes (−5–5 °C and −10–10 °C). The relative abundances of Bacteroidota and Myxococcota decreased regardless of the FTC amplitude and patch type. Significant decreases were observed in a greater number of bacterial taxa in the wetland patches compared with the forest patches. Significant decreases in Chloroflexi and Acidobacteriota were only observed in the wetland patches (Figure 4).
Shannon index slightly decreased after FTCs, and the FTC amplitude had no significant effect on the Shannon index in both wetland and forest patches. The Shannon index in forest patches was significantly higher than that in wetland patches (Figure 5). The NMDS analysis revealed differences in the soil bacterial community between preincubation and FTC treatments (Figure 6a,b). To clarify the effects of FTC amplitude and frequency on bacterial communities, we used PLS-DA, by which random differences between groups were ignored and systematic differences between groups were highlighted (Figure 6c,d). Comp 1 revealed a contrast between the two FTC amplitudes in the wetland patches, suggesting that FTC amplitude in the wetland patches had significant effects on bacterial community structure (Figure 6d). Although comp 1 and comp 2 did not separate groups in the forest patches, obvious separation between groups was still observed (Figure 6c).

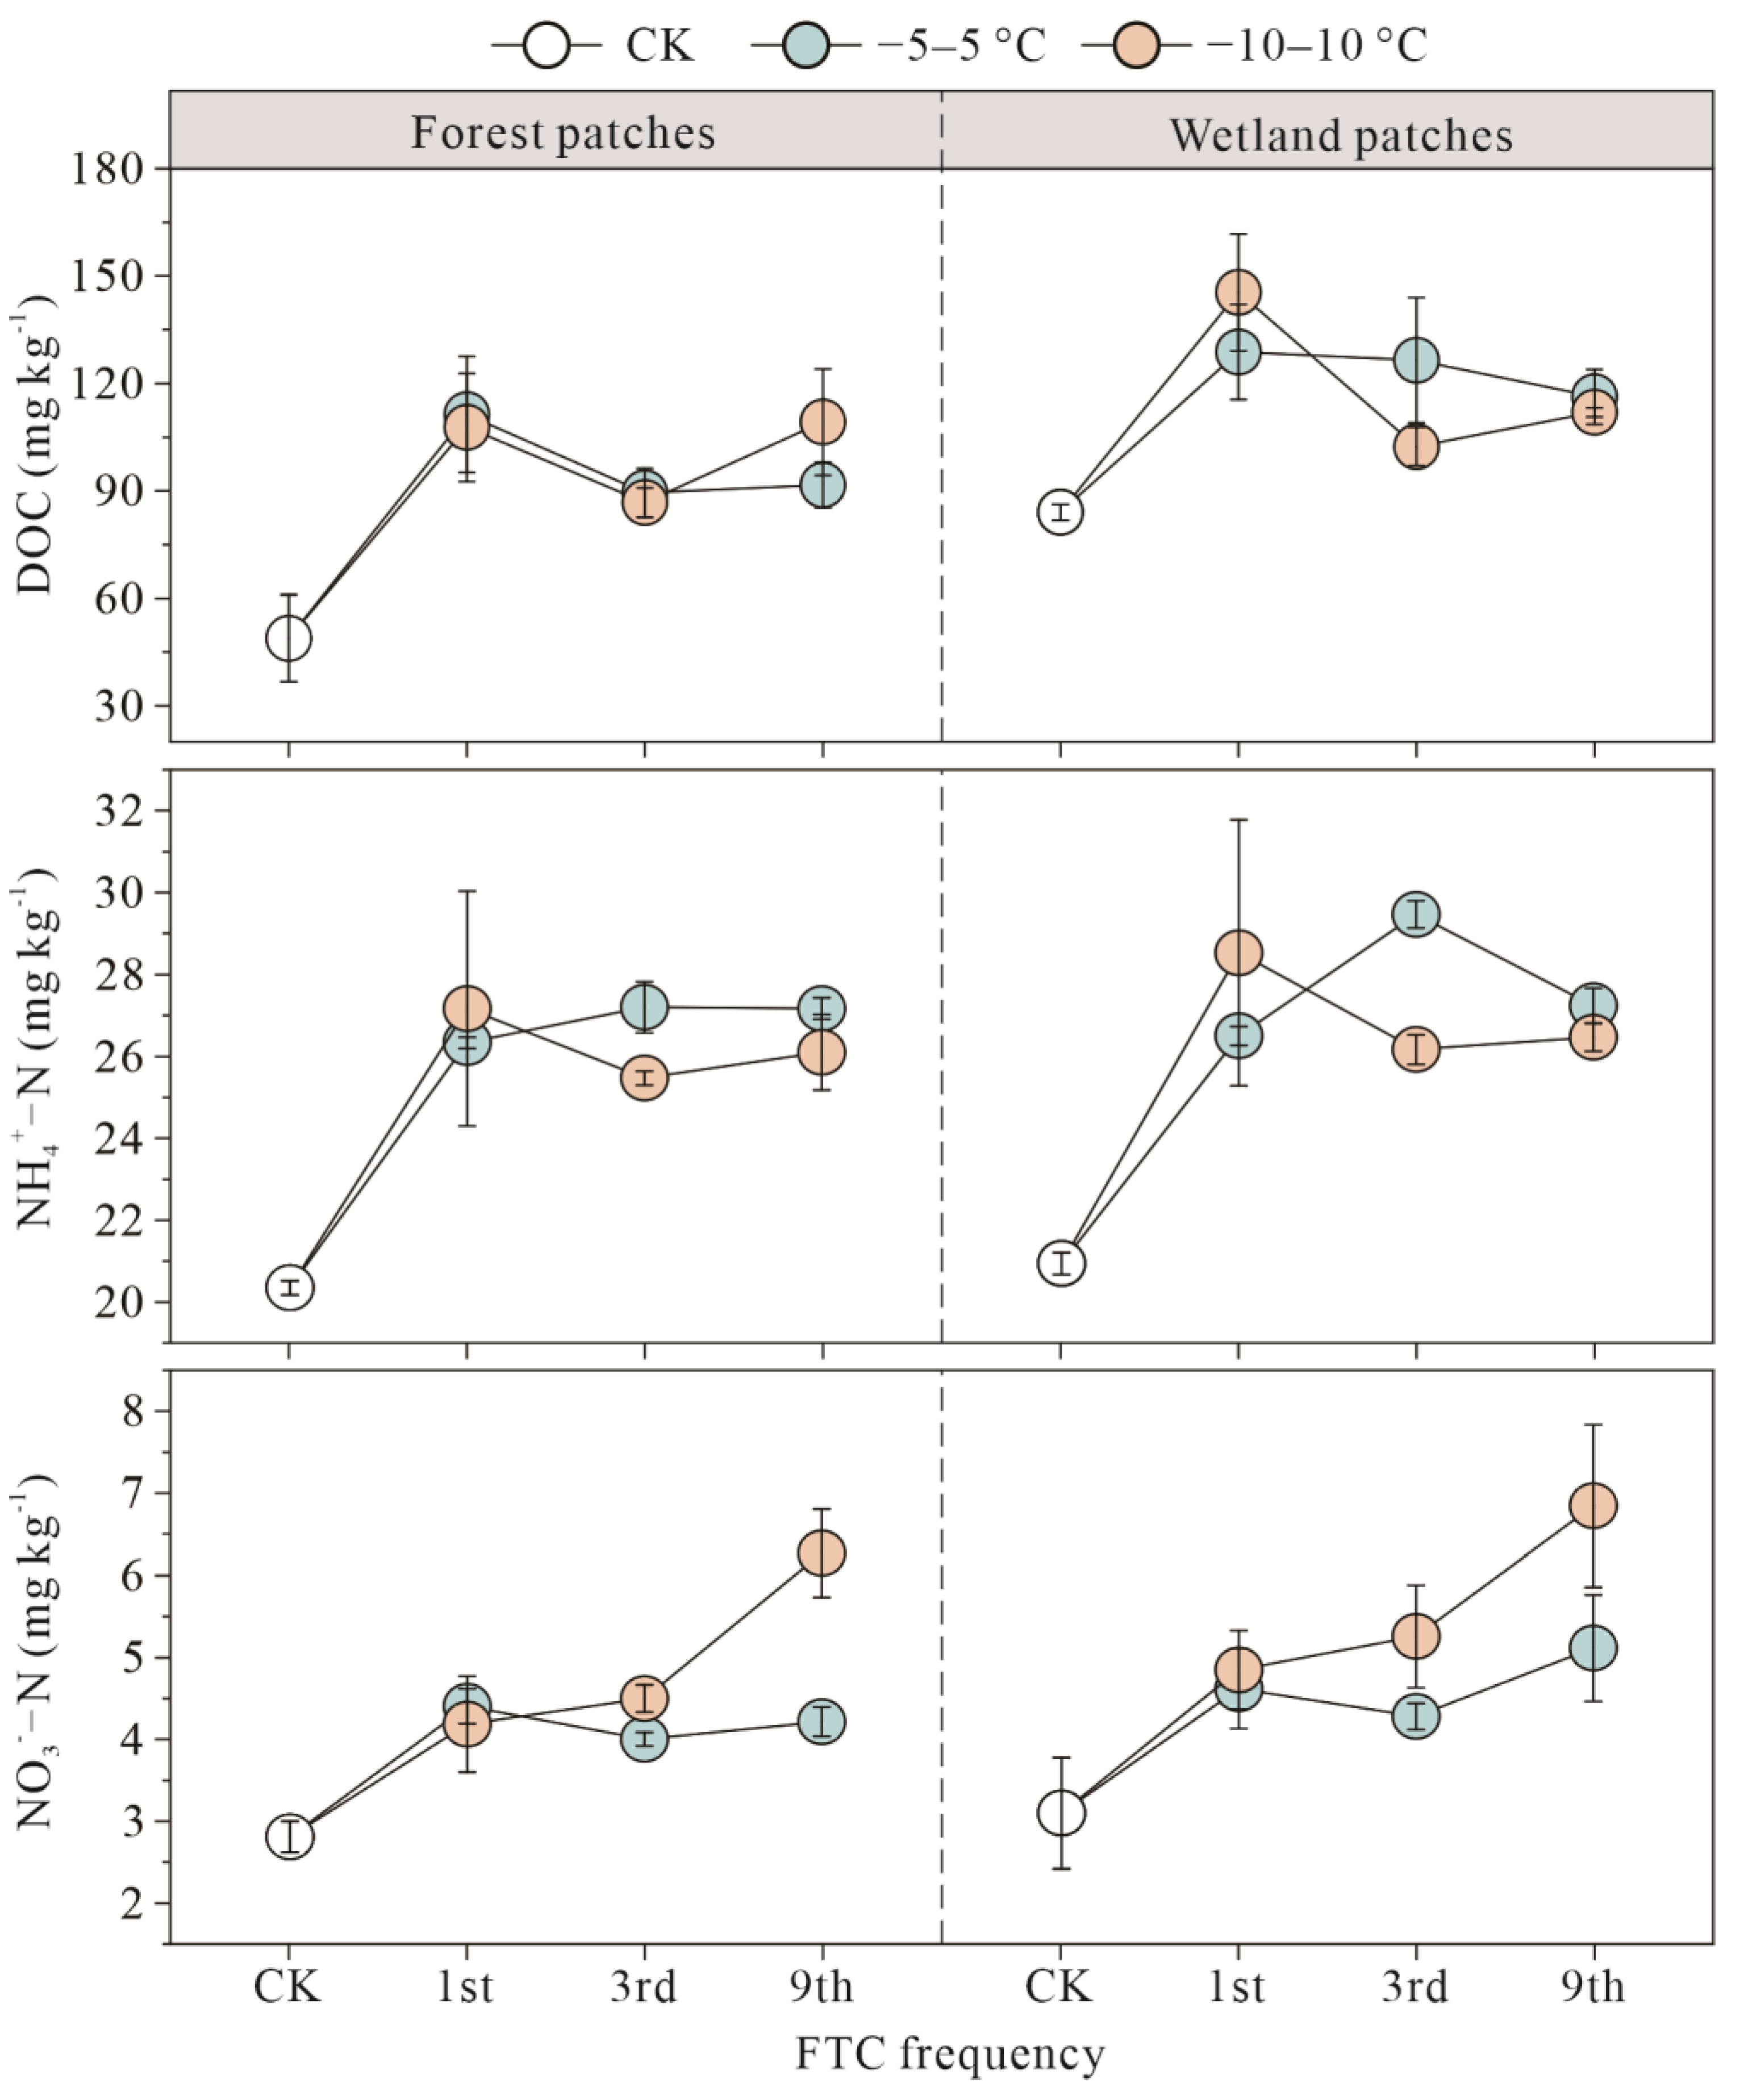
3.3. Soil Substrates of Forest and Wetland Patches after FTCs

The initial DOC content of the wetland patches and forest patches was 84.02 ± 2.26 mg kg−1 and 48.91 ± 12.09 mg kg1, respectively. After various FTCs, the DOC content increased under the two FTC amplitudes (Figure 7). There was a significant difference in the average rate of increase in the DOC content between the forest patches (−5–5 °C: 99.36 ± 14.24%; −10–10 °C: 107.02 ± 14.86%) and wetland patches (−5–5 °C: 47.39 ± 4.57%; −10–10 °C: 42.73 ± 15.51%) (p < 0.05) (Table S2). FTCs had no significant effect on the NH4+-N content (Table S2). The percent increase in the content of NO3-N was significantly higher under the −10–10 °C treatment (forest patches: 77.43 ± 23.08%; wetland patches: 82.37 ± 19.66%) than under the −5–5 °C treatment (forest patches: 49.71 ± 4.15%; wetland patches: 50.74 ± 7.81%).

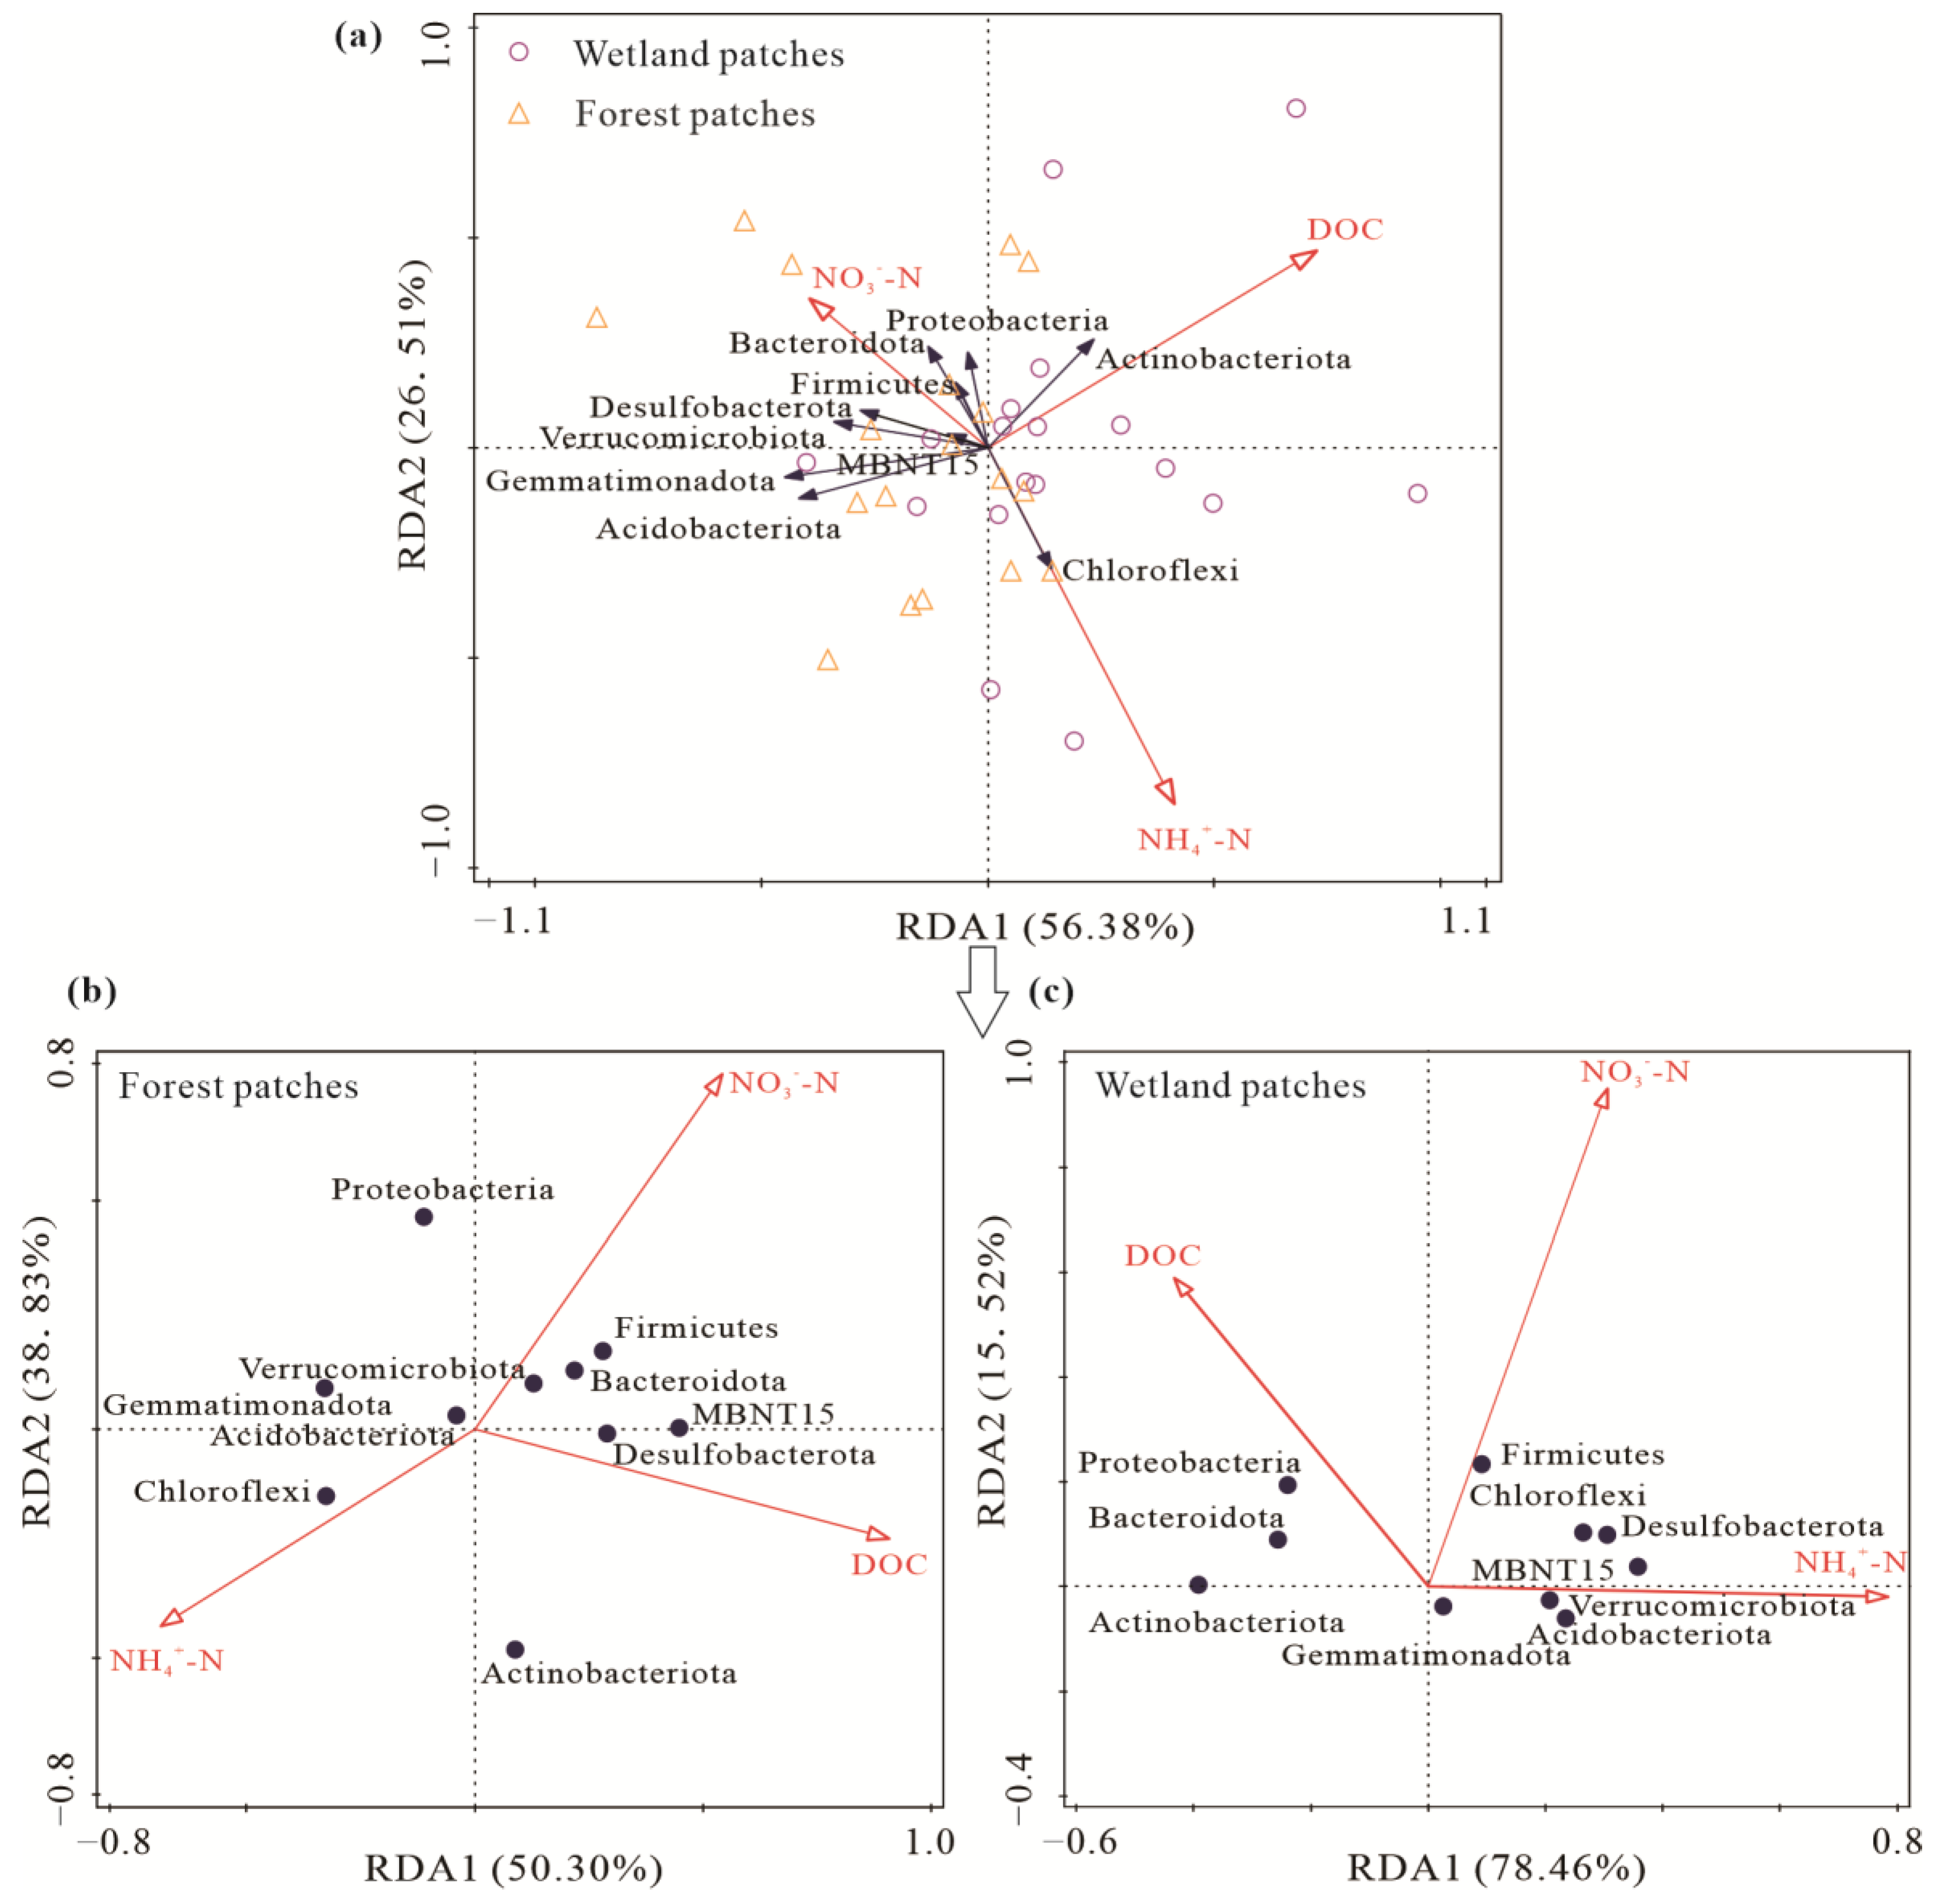
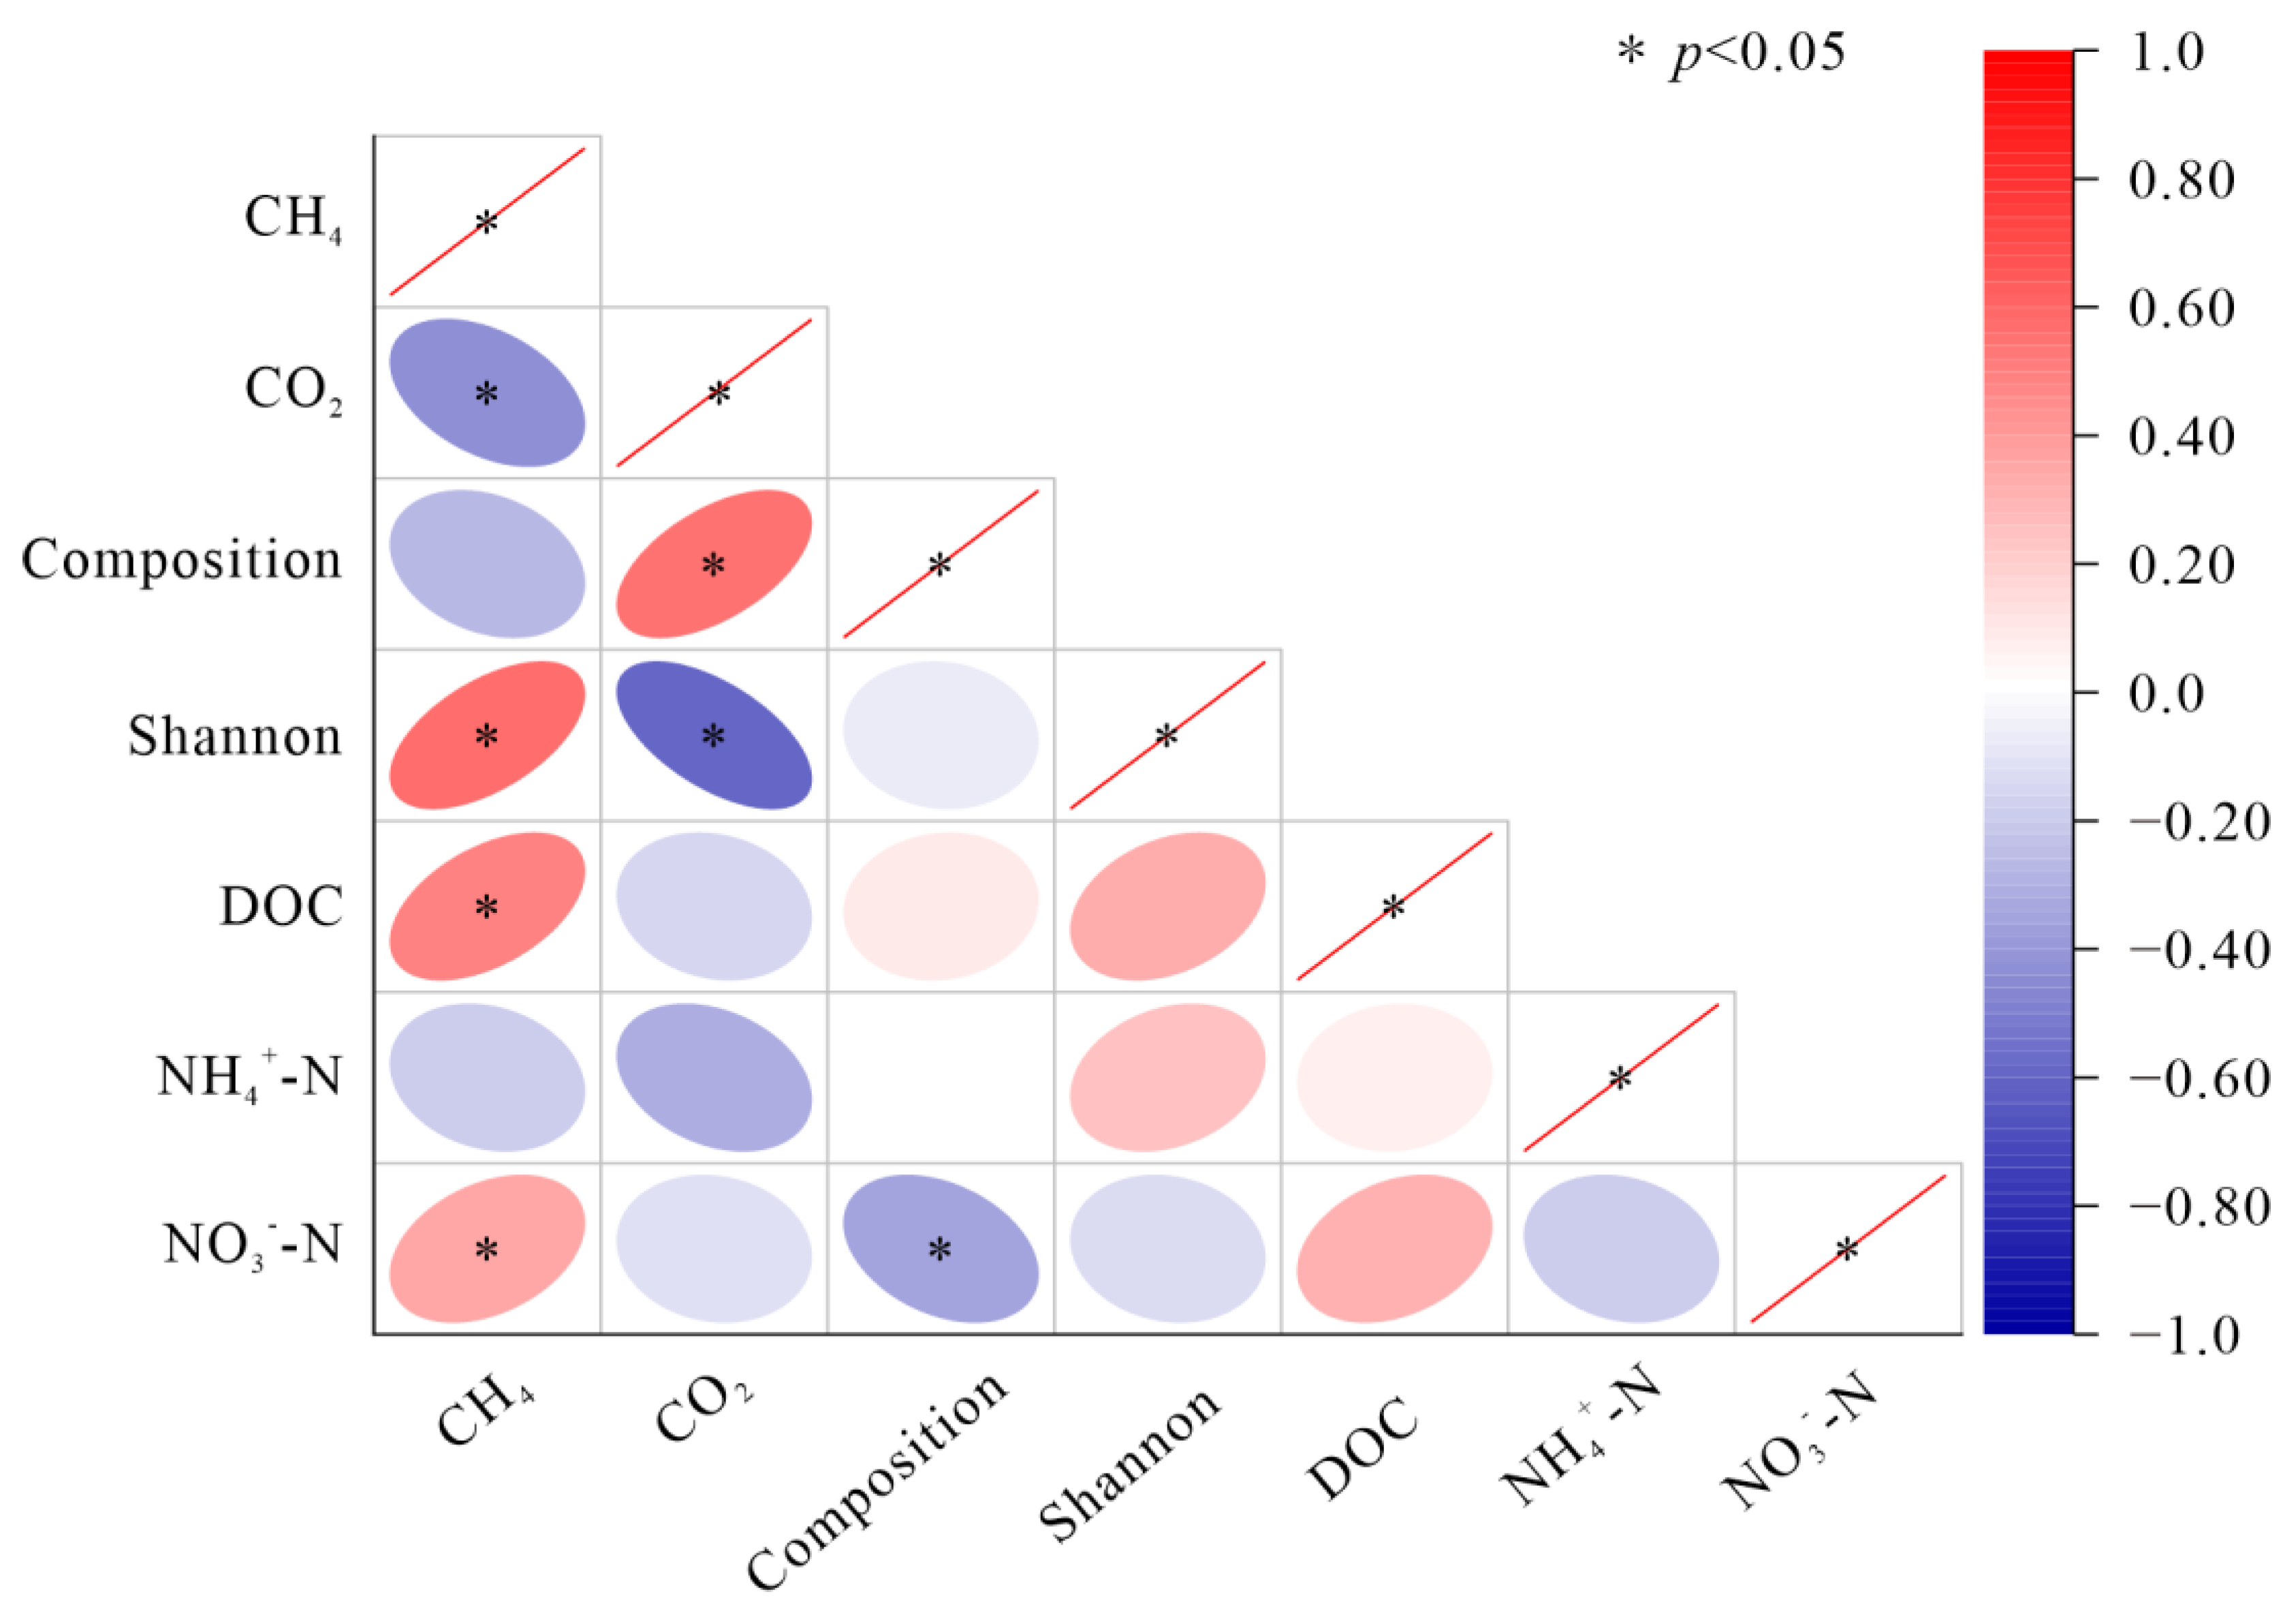
3.4. Relationship among Soil Carbon Emissions, the Soil Bacterial Community, and Soil Substrates

The two axes of the RDA explained 82.89% of the total variances between bacterial phyla and the soil carbon and nitrogen contents (Figure 8a). The DOC and NO3-N contents were the most important factors affecting bacterial phyla, which explained 56.38% and 26.51% of the variances, respectively. The relative abundance of Actinobacteriota and Proteobacteria has a significantly positive relationship with soil DOC content, while it was significantly negative related with the NH4+-N content. The relative abundance of Chloroflexi showed a significantly positive correlation with soil NH4+-N content, while it was significantly negatively correlated with the NO3-N content. The correlations between soil bacterial phyla and substrates were slightly different between two patch types (Figure 8b,c). In forest patches, the relative abundance of Proteobacteria was significantly negatively correlated with DOC content. In wetland patches, NH4+-N content was significantly positive correlated with Firmicutes and negatively correlated with Actinobacteriota. The correlations between Proteobacteria and DOC content as well as Chloroflexi and NO3-N content were opposite for forest and wetland patches.
Correlation analysis showed that the CH4 emission rate was significantly positively correlated with soil DOC, NO3-N contents, and Shannon index (Figure 9). CO2 emission rate had a significantly negative relationship with Shannon index, while it was positively correlated with bacterial composition (Figure 9). In addition, soil CH4 and CO2 emission rates showed the same correlation with substrates and bacterial diversity in different patches (Figure S1). To remove multicollinearity, stepwise multiple linear regression was used to find out the main biological and non-biological factors affecting CH4 and CO2 emissions in different patches (Table 2). Regardless of patch type, CO2 and CH4 emissions were affected by Proteobacteria. The main non-biological factors affecting the CH4 emission rate were NO3-N in forest patches and the NH4+-N and NO3-N content for wetland patches. Variation in CO2 emissions was largely explained by Chloroflexi, Proteobacteria, Actinobacteriota, MBNT5, and Gemmatimonadota for forest patches and by the Actinobacteriota, Proteobacteria, Acidobacteriota, Gemmatimonadota, and Desulfobacterota for wetland patches.

4. Discussion

4.1. Response of Carbon and Nitrogen to FTCs

In this study, FTCs increased the contents of DOC, NH4+-N, and NO3-N both under the −5–5 °C and −10–10 °C treatments for the two patches. Previous findings also reported that DOC content significantly increased after FTCs in peatlands in Northeast China [52], pristine grassland soil of southern Edmonton [53], sub-arctic heath tundra mesocosms [54], and meadows in the Sanjiang Plain [55]. The FTC amplitude had no significant effects on DOC content, which could be due to the fact that DOC is easily mineralized by microorganisms [56]. In this study, the soil carbon emission increased with FTC amplitude, which might indicate a rapid consumption of DOC at the −10–10 °C treatment. The FTCs can significantly increase NH4+-N content [57], which is related to the conversion of nitrogen in soil [58]. During FTCs, the NO3-N content increases when the production of nitrogen via mineralization and nitrification is higher than its consumption via denitrification [55]. With the increase of FTC frequency, the increase rate of carbon and nitrogen contents reduced, indicating that the first FTC already stimulated the maximum release of soil substrates [58,59]. Generally, FTCs increase the contents of carbon and nitrogen by killing microbial cells [60], which can release nutrients inside microbial cells into soil solution [61]. FTCs can also physically destroy soil aggregates and release nutrients [62,63]. The organic macromolecules will break down into smaller organic molecules when combined with soil aggregates, which further increases the DOC content [64].

4.2. Soil Bacterial Community Composition and Diversity Respond to FTCs

The response of the relative abundance of bacteria to FTCs varied among phyla. Some bacterial phyla are resistant to FTCs, and FTCs eventually result in decreases in less competitive phyla [65]. In this study, FTCs significantly increased the relative abundance of Actinobacteriota, which was consistent with previous studies [65,66,67,68]. This might be related to the filamentous and spore-forming properties of Actinobacteria, which can improve their ability to acquire resources during FTCs [69]. Männistö et al. [70] found that the relative abundances of Proteobacteria in arctic tundra significantly decreased after FTCs. In this study, FTCs decreased the abundance of Proteobacteria in the forest patches, which might stem from the fact that the increase in the abundance of Actinobacteriota was greater in the forest patches than in the wetland patches. Actinomycetes can produce secondary metabolites such as antibiotics under pressure, which allows them to outperform Proteobacteria [71]. Firmicutes include spore-forming groups such as Clostridia, which leads to its resistance to environmental interference [72]. The relative abundance of Firmicutes in both forest and wetland patches did not respond significantly to FTCs [70]. Gemmatimonadota prefer dry environments [73], and freezing may reduce the soil water supply and result in desiccation; however, the subsequent thawing process might induce rapid changes in the osmotic pressure balance inside and outside of cells, which can result in decreases in microbial activity [74]. Thus, the relative abundances of Gemmatimonadota decreased significantly after FTC treatment in Han et al. [66].
In this study, the relative abundance of Actinobacteriota and Proteobacteria has a significantly positive relationship with soil DOC content, which was agreed with Fierer et al. [75] and Schostag et al. [76]. The oligotrophic Acidobacteria significantly negatively correlated with soil DOC content [77]. Moreover, the relative abundance of Acidobacteria showed significant correlation with inorganic nitrogen content in different patches because Acidobacteria have multiple transport systems that promote ammonia, amino acids, and maintain growth by immobilizing inorganic nitrogen in the soil [78,79]. The correlations between bacterial phyla and substrates were slightly different between two patch types, which is reasonable because the original physico-chemical variables are different. For example, soil water contents greatly affected the changes in bacterial community composition [80].
Shannon index slightly decreased after FTCs, indicating that richness declined after FTCs. Changes in soil moisture, temperature, and substrate can directly or indirectly affect bacterial community structure [50,81,82]. In our study, the FTC amplitude and frequency had no significant effects on soil bacterial alpha diversity, but significant differences were observed between the two patches. These findings were consistent with the study of Ji et al. [83], showing that the bacterial alpha diversity of permafrost reflects adaptation to FTC stress. Generally, FTCs cause changes in the water phase, which changes the microbial niche and, thus, affects microbial diversity [84], and the significant differences in the soil water content between forest and wetland patches might explain the differences in soil bacterial alpha diversity between the two patches. NMDS and PLS-DA showed that both the amplitude and frequency of FTCs affected soil bacterial beta diversity, indicating that FTCs altered the structure of the soil bacterial community [85,86,87].

4.3. Response of Soil Carbon Emissions to FTCs and Its Relationship with the Soil Bacterial Community and Soil Substrates

FTCs increased the emission rates of CO2 and CH4, and this has been demonstrated in several previous studies [32,33,88,89,90]. The increases in greenhouse gas emissions might be related to the increases in soil carbon and nitrogen content caused by FTCs. Generally, FTCs destroy soil aggregates and microbial cells through a transition phase of soil moisture and low temperature, thereby releasing protected organic matter and enhancing the accessibility of substrates for microorganisms [91,92]. FTC amplitude, FTC frequency, and patch type significantly affected the CO2 and CH4 emission rates. FTC amplitude was significantly correlated with soil carbon emissions, which can be explained by the fact that high-intensity FTCs can supply more nutrients [93,94]. Although carbon emissions gradually decrease when readily available soil substrates are depleted [58], there were only nine FTCs in our experiment, which might be far from the number of FTCs that would be required to generate limitations in the amount of available substrate.
There were significant correlations among soil substrates, the bacterial community, and soil carbon emissions, and the stepwise regression analysis showed that the main factors affecting CO2 and CH4 emissions were bacterial community and inorganic nitrogen content. This result indicated that FTCs affect carbon emissions via soil substrates and the bacterial community. Dong et al. [95] found there were significantly positive relationships between CO2 emissions and most bacterial phyla abundances and diversity. Microbial community structure in the permafrost region is also a good predictor of CO2 emissions [96]. Actinobacteriota can perform refractory carbon degradation [97], and their genomes are thought to be rich in glycoside hydrolases that show good performance in cellulose, starch, and xylan degradation [98]. Proteobacteria are thought to have a positive correlation with the availability of carbon [76,99]. Significant negative relationships were observed between Gemmatimonadota and CO2 emissions [100,101]. Chloroflexi can affect CO2 emissions because the class Anaerolineae comprises anaerobic heterotrophic bacteria capable of decomposing carbohydrates and amino acids [102,103]. We also found that CH4 emissions were significantly correlated with NH4+-N and NO3-N contents, which is consistent with the results of Jiang et al. [104] and Zhang et al. [105]. This finding likely stems from the ability of NO3-N and NH4+-N to inhibit CH4 oxidation [106,107].

5. Conclusions

We examined the response of soil carbon emissions to FTCs in forest–wetland ecotone in a permafrost zone. Based on laboratory incubation experiments, we found that soil substrates as well as CO2 and CH4 emissions increased after the FTC treatment. FTCs did not change the dominant phyla taxa, but greatly affected the bacterial communities during different FTCs. FTC frequency, FTC amplitude, and patch type significantly affected CO2 and CH4 emissions. CH4 emission was affected by inorganic nitrogen content, and bacterial diversity and composition were the main factors affecting CO2 emissions. The relationship among carbon emissions, soil substrates, and bacterial community suggested that the accelerating effects of FTCs on CO2 and CH4 emissions were mainly related to the increasing microbial utilization of substrates, and FTC should be considered in the estimation of permafrost carbon emissions in a changing climate.

Supplementary Materials

The following supporting information can be downloaded at: https://www.mdpi.com/article/10.3390/microorganisms10101950/s1. Table S1: Three-way factorial ANOVA of the effects of FTC amplitude, FTC frequency, patch type, and their interactions on CO2 and CH4 emission rates. Table S2: Three-way ANOVA for evaluating the effects of FTC amplitude, FTC frequency, patch type, and their interactions on DOC, NH4+-N, and NO3-N contents. Figure S1: Pearson correlations among soil carbon emissions, bacterial diversity, and substrates in forest and wetland patches.

Author Contributions

Conceptualization, C.L.; methodology, C.L., X.D., X.W. and D.M.; investigation, C.L., X.D., Y.W. and H.M.; writing—original draft preparation, C.L.; writing—review and editing, C.L., X.D., X.W., D.M. and M.L.; funding acquisition, S.Z. All authors have read and agreed to the published version of the manuscript.

Funding

This research was funded by the Key Joint Program of National Natural Science Foundation of China (NSFC) and Heilongjiang Province for Regional Development (U20A2082), the National Natural Science Foundation of China (No. 41971151, 41941015), and Natural Science Foundation of Heilongjiang Province of China (No. TD2019D002).

Institutional Review Board Statement

Not applicable.

Informed Consent Statement

Not applicable.

Data Availability Statement

Data are available on request.

Conflicts of Interest

The authors declare no conflict of interest.

Abbreviations

FTCsfreeze–thaw cycles
CO2carbon dioxide
CH4 methane
DOCdissolved organic carbon
NH4+-Nammonium nitrogen
NO3-N nitrate nitrogen
RDAredundancy analysis
NMDSnon-metric multidimensional scaling
PLS-DApartial least squares discriminant analysis

References

  1. Arias, P.; Bellouin, N.; Coppola, E.; Jones, R.; Krinner, G.; Marotzke, J.; Naik, V.; Palmer, M.; Plattner, G.K.; Rogelj, J.; et al. Climate Change 2021: The Physical Science Basis. Contribution of Working Group14 I to the Sixth Assessment Report of the Intergovernmental Panel on Climate Change; Technical Summary; Cambridge University Press: Cambridge, UK, 2021. [Google Scholar]
  2. Mu, C.C.; Abbott, B.W.; Norris, A.J.; Mu, M.; Fan, C.Y.; Chen, X.; Jia, L.; Yang, R.M.; Zhang, T.J.; Wang, K. The status and stability of permafrost carbon on the Tibetan Plateau. Earth Sci. Rev. 2020, 211, 103433. [Google Scholar] [CrossRef]
  3. Schimel, D.S. Terrestrial ecosystem and carbon cycle. Glob. Chang. Biol. 2006, 1, 77–91. [Google Scholar] [CrossRef]
  4. Song, Y.Y.; Liu, C.; Song, C.C.; Wang, X.W.; Ma, X.Y.; Gao, J.L.; Gao, S.Q.; Wang, L.L. Linking soil organic carbon mineralization with soil microbial and substrate properties under warming in permafrost peatlands of Northeastern China. CATENA 2021, 203, 105348. [Google Scholar] [CrossRef]
  5. Hollesen, J.; Elberling, B.; Jansson, P.E. Future active layer dynamics and carbon dioxide production from thawing permafrost layers in Northeast Greenland. Glob. Chang. Biol. 2011, 17, 911–926. [Google Scholar] [CrossRef]
  6. Jin, H.J.; Yu, Q.H.; Lü, L.Z.; Guo, D.X.; He, R.X.; Yu, S.P.; Sun, G.Y.; Li, Y.W. Degradation of permafrost in the Xing’anling Mountains, Northeastern China. Permafr. Periglac. Process. 2007, 18, 245–258. [Google Scholar] [CrossRef]
  7. Li, X.Y.; Jin, H.J.; Wang, H.W.; Marchenko, S.S.; Shan, W.; Luo, D.L.; He, R.X.; Spektor, V.; Huang, Y.D.; Li, X.Y. Influences of forest fires on the permafrost environment: A review. Adv. Clim. Chang. Res. 2021, 12, 48–65. [Google Scholar] [CrossRef]
  8. Schuur, E.A.; McGuire, A.D.; Schädel, C.; Grosse, G.; Harden, J.; Hayes, D.J.; Hugelius, G.; Koven, C.D.; Kuhry, P.; Lawrence, D.M. Climate change and the permafrost carbon feedback. Nature 2015, 520, 171–179. [Google Scholar] [CrossRef] [PubMed]
  9. Wu, X.D.; Zhao, L.; Hu, G.J.; Liu, G.M.; Li, W.P.; Ding, Y.J. Permafrost and land cover as controlling factors for light fraction organic matter on the southern Qinghai-Tibetan Plateau. Sci. Total Environ. 2018, 613, 1165–1174. [Google Scholar] [CrossRef]
  10. Koven, C.D.; Ringeval, B.; Friedlingstein, P.; Ciais, P.; Cadule, P.; Khvorostyanov, D.; Krinner, G.; Tarnocai, C. Permafrost carbon-climate feedbacks accelerate global warming. Proc. Natl. Acad. Sci. USA 2011, 108, 14769–14774. [Google Scholar] [CrossRef] [PubMed]
  11. Zimov, S.A.; Schuur, E.A.; Chapin, F.S., III. Permafrost and the global carbon budget. Science 2006, 312, 1612–1613. [Google Scholar] [CrossRef]
  12. Edwards, L.M. The effects of soil freeze–thaw on soil aggregate breakdown and concomitant sediment flow in Prince Edward Island: A review. Can. J. Soil Sci. 2013, 93, 459–472. [Google Scholar] [CrossRef]
  13. Congreves, K.; Wagner-Riddle, C.; Si, B.; Clough, T.J. Nitrous oxide emissions and biogeochemical responses to soil freezing-thawing and drying-wetting. Soil Biol. Biochem. 2018, 117, 5–15. [Google Scholar] [CrossRef]
  14. Groffman, P.M.; Hardy, J.P.; Fashu-Kanu, S.; Driscoll, C.T.; Cleavitt, N.L.; Fahey, T.J.; Fisk, M.C. Snow depth, soil freezing and nitrogen cycling in a northern hardwood forest landscape. Biogeochemistry 2011, 102, 223–238. [Google Scholar] [CrossRef]
  15. Margesin, R.; Neuner, G.; Storey, K.B. Cold-loving microbes, plants, and animals—Fundamental and applied aspects. Naturwissenschaften 2007, 94, 77–99. [Google Scholar] [CrossRef]
  16. Yang, J.S.; Zhou, W.M.; Liu, J.S.; Hu, X.J. Dynamics of greenhouse gas formation in relation to freeze/thaw soil depth in a flooded peat marsh of Northeast China. Soil Biol. Biochem. 2014, 75, 202–210. [Google Scholar] [CrossRef]
  17. Song, C.C.; Zhang, J.B.; Wang, Y.Y.; Wang, Y.S.; Zhao, Z.C. Emission of CO2, CH4 and N2O from freshwater marsh in northeast of China. J. Environ. Manag. 2008, 88, 428–436. [Google Scholar] [CrossRef]
  18. Song, C.C.; Xu, X.F.; Sun, X.X.; Tian, H.Q.; Sun, L.; Miao, Y.Q.; Wang, X.W.; Guo, Y.D. Large methane emission upon spring thaw from natural wetlands in the northern permafrost region. Environ. Res. Lett. 2012, 7, 034009. [Google Scholar] [CrossRef]
  19. Wisser, D.; Marchenko, S.; Talbot, J.; Treat, C.; Frolking, S. Soil temperature response to 21st century global warming: The role of and some implications for peat carbon in thawing permafrost soils in North America. Earth Syst. Dyn. 2011, 2, 121–138. [Google Scholar] [CrossRef]
  20. Jorgenson, M.T.; Racine, C.H.; Walters, J.C.; Osterkamp, T.E. Permafrost degradation and ecological changes associated with a warmingclimate in central Alaska. Clim. Chang. 2001, 48, 551–579. [Google Scholar] [CrossRef]
  21. Yang, Z.P.; Ou, Y.H.; Xu, X.L.; Zhao, L.; Song, M.H.; Zhou, C.P. Effects of permafrost degradation on ecosystems. Acta Ecol. Sin. 2010, 30, 33–39. [Google Scholar] [CrossRef]
  22. Gill, A.L.; Giasson, M.A.; Yu, R.; Finzi, A.C. Deep peat warming increases surface methane and carbon dioxide emissions in a black spruce-dominated ombrotrophic bog. Glob. Chang. Biol. 2017, 23, 5398–5411. [Google Scholar] [CrossRef]
  23. Ward, S.E.; Ostle, N.J.; Oakley, S.; Quirk, H.; Henrys, P.A.; Bardgett, R.D. Warming effects on greenhouse gas fluxes in peatlands are modulated by vegetation composition. Ecol. Lett. 2013, 16, 1285–1293. [Google Scholar] [CrossRef] [PubMed]
  24. Chistyakov, K.; Amosov, M.; Kurochkin, Y.N.; Lessovaia, S.; Strelkov, I.; Tyusov, G. Tundra and Steppe Locations of Altai Highland Depressions: Features of Vegetation Community and Soil Cover and Their Thermal Regime. Contemp. Probl. Ecol. 2021, 14, 231–240. [Google Scholar] [CrossRef]
  25. Jin, H.J.; Jin, X.Y.; He, R.X.; Luo, D.L.; Chang, X.L.; Wang, S.L.; Marchenko, S.S.; Yang, S.Z.; Yi, C.L.; Li, S.J. Evolution of permafrost in China during the last 20 ka. Sci. China Earth Sci. 2019, 62, 1207–1223. [Google Scholar] [CrossRef]
  26. Dong, X.F.; Liu, C.; Li, M.; Ma, D.L.; Chen, Q.; Zang, S.Y. Variations in active layer soil hydrothermal dynamics of typical wetlands in permafrost region in the Great Hing’an Mountains, northeast China. Ecol. Indic. 2021, 129, 107880. [Google Scholar] [CrossRef]
  27. Song, Y.Y.; Song, C.C.; Shi, F.X.; Wang, M.Q.; Ren, J.S.; Wang, X.W.; Jiang, L. Linking plant community composition with the soil C pool, N availability and enzyme activity in boreal peatlands of Northeast China. Appl. Soil Ecol. 2019, 140, 144–154. [Google Scholar] [CrossRef]
  28. Schuman, G.; Reeder, J.; Manley, J.; Hart, R.; Manley, W. Impact of grazing management on the carbon and nitrogen balance of a mixed-grass rangeland. Ecol. Appl. 1999, 9, 65–71. [Google Scholar] [CrossRef]
  29. Teklay, T.; Shi, Z.; Attaeian, B.; Chang, S.X. Temperature and substrate effects on C & N mineralization and microbial community function of soils from a hybrid poplar chronosequence. Appl. Soil Ecol. 2010, 46, 413–421. [Google Scholar]
  30. Qin, S.Q.; Kou, D.; Mao, C.; Chen, Y.L.; Chen, L.Y.; Yang, Y.H. Temperature sensitivity of permafrost carbon release mediated by mineral and microbial properties. Sci. Adv. 2021, 7, eabe3596. [Google Scholar] [CrossRef]
  31. Schroeder, J.; Kammann, L.; Helfrich, M.; Tebbe, C.C.; Poeplau, C. Impact of common sample pre-treatments on key soil microbial properties. Soil Biol. Biochem. 2021, 160, 108321. [Google Scholar] [CrossRef]
  32. Wu, X.; Wang, F.F.; Li, T.; Fu, B.J.; Lv, Y.H.; Liu, G.H. Nitrogen additions increase N2O emissions but reduce soil respiration and CH4 uptake during freeze–thaw cycles in an alpine meadow. Geoderma 2020, 363, 114157. [Google Scholar] [CrossRef]
  33. Wang, J.Y.; Song, C.C.; Hou, A.X.; Wang, L.L. CO2 emissions from soils of different depths of a permafrost peatland, Northeast China: Response to simulated freezing–thawing cycles. J. Plant Nutr. Soil Sci. 2014, 177, 524–531. [Google Scholar] [CrossRef]
  34. Lang, M.; Cai, Z.C.; Chang, S.X. Effects of land use type and incubation temperature on greenhouse gas emissions from Chinese and Canadian soils. J. Soils Sediments 2011, 11, 15–24. [Google Scholar] [CrossRef]
  35. Ghani, A.; Dexter, M.; Perrott, K. Hot-water extractable carbon in soils: A sensitive measurement for determining impacts of fertilisation, grazing and cultivation. Soil Biol. Biochem. 2003, 35, 1231–1243. [Google Scholar] [CrossRef]
  36. Lu, R.K. Soil Agricultural Chemical Analysis Method; China Agricultural Science and Technology Press: Beijing, China, 2000; pp. 1–315. [Google Scholar]
  37. Wood, T.E.; Lawrence, D. No short-term change in soil properties following four-fold litter addition in a Costa Rican rain forest. Plant Soil 2008, 307, 113–122. [Google Scholar]
  38. De Jonge, L.; Jacobsen, O.; Moldrup, P. Soil water repellency: Effects of water content, temperature, and particle size. Soil Sci. Soc. Am. J. 1999, 63, 437–442. [Google Scholar] [CrossRef]
  39. Chen, S.F.; Zhou, Y.Q.; Chen, Y.R.; Gu, J. fastp: An ultra-fast all-in-one FASTQ preprocessor. Bioinformatics 2018, 34, i884–i890. [Google Scholar] [CrossRef]
  40. Mago, T.; Salzberg, S.L. FLASH: Fast Length Adjustment of Short Reads to Improve Genome Assemblies. Bioinformatics 2011, 27, 2957–2963. [Google Scholar] [CrossRef]
  41. Edgar, R.C. UPARSE: Highly accurate OTU sequences from microbial amplicon reads. Nat. Methods 2013, 10, 996. [Google Scholar] [CrossRef]
  42. Stackebrandt, E.; Goebel, B.M. Taxonomic note: A place for DNA-DNA reassociation and 16S rRNA sequence analysis in the present species definition in bacteriology. Int. J. Syst. Evol. Microbiol. 1994, 44, 846–849. [Google Scholar] [CrossRef]
  43. Wang, Q.; Garrity, G.M.; Tiedje, J.M.; Cole, J.R. Naive Bayesian classifier for rapid assignment of rRNA sequences into the new bacterial taxonomy. Appl. Environ. Microbiol. 2007, 73, 5261–5267. [Google Scholar] [CrossRef] [PubMed]
  44. Gerald, B. A Brief Review of Independent, Dependent and One Sample t-test. Int. J. Appl. Math. Theor. Phys. 2018, 4, 50. [Google Scholar] [CrossRef] [Green Version]
  45. van Eeuwijk, F.A.; Kroonenberg, P.M. Multiplicative models for interaction in three-way ANOVA, with applications to plant breeding. Biometrics 1998, 54, 1315–1333. [Google Scholar] [CrossRef]
  46. Bubier, J.L.; Moore, T.R.; Bellisario, L.; Comer, N.T.; Crill, P.M. Ecological controls on methane emissions from a northern peatland complex in the zone of discontinuous permafrost, Manitoba, Canada. Glob. Biogeochem. Cycles 1995, 9, 455–470. [Google Scholar] [CrossRef]
  47. Van Den Wollenberg, A.L. Redundancy analysis an alternative for canonical correlation analysis. Psychometrika 1977, 42, 207–219. [Google Scholar] [CrossRef]
  48. Messan, K.S.; Jones, R.M.; Doherty, S.J.; Foley, K.; Douglas, T.A.; Barbato, R.A. The role of changing temperature in microbial metabolic processes during permafrost thaw. PLoS ONE 2020, 15, e0232169. [Google Scholar] [CrossRef] [PubMed]
  49. Taguchi, Y.-H.; Oono, Y. Relational patterns of gene expression via non-metric multidimensional scaling analysis. Bioinformatics 2005, 21, 730–740. [Google Scholar] [CrossRef] [PubMed]
  50. Wu, X.D.; Zhao, L.; Liu, G.M.; Xu, H.Y.; Zhang, X.L.; Ding, Y.J. Effects of permafrost thaw-subsidence on soil bacterial communities in the southern Qinghai-Tibetan Plateau. Appl. Soil Ecol. 2018, 128, 81–88. [Google Scholar] [CrossRef]
  51. Gibbons, J.D.; Chakraborti, S. Comparisons of the Mann-Whitney, Student’st, and alternate t tests for means of normal distributions. J. Exp. Educ. 1991, 59, 258–267. [Google Scholar] [CrossRef]
  52. Wang, J.Y.; Song, C.C.; Wang, X.W.; Song, Y.Y. Changes in labile soil organic carbon fractions in wetland ecosystems along a latitudinal gradient in Northeast China. CATENA 2012, 96, 83–89. [Google Scholar] [CrossRef]
  53. Feng, X.J.; Nielsen, L.L.; Simpson, M.J. Responses of soil organic matter and microorganisms to freeze–thaw cycles. Soil Biol. Biochem. 2007, 39, 2027–2037. [Google Scholar] [CrossRef]
  54. Grogan, P.; Michelsen, A.; Ambus, P.; Jonasson, S. Freeze–thaw regime effects on carbon and nitrogen dynamics in sub-arctic heath tundra mesocosms. Soil Biol. Biochem. 2004, 36, 641–654. [Google Scholar] [CrossRef]
  55. Yu, X.F.; Zou, Y.C.; Jiang, M.; Lu, X.G.; Wang, G.P. Response of soil constituents to freeze–thaw cycles in wetland soil solution. Soil Biol. Biochem. 2011, 43, 1308–1320. [Google Scholar] [CrossRef]
  56. Song, Y.; Zou, Y.C.; Wang, G.P.; Yu, X.F. Altered soil carbon and nitrogen cycles due to the freeze-thaw effect: A meta-analysis. Soil Biol. Biochem. 2017, 109, 35–49. [Google Scholar] [CrossRef]
  57. Vestgarden, L.S.; Austnes, K. Effects of freeze–thaw on C and N release from soils below different vegetation in a montane system: A laboratory experiment. Glob. Chang. Biol. 2009, 15, 876–887. [Google Scholar] [CrossRef]
  58. Herrmann, A.; Witter, E. Sources of C and N contributing to the flush in mineralization upon freeze–thaw cycles in soils. Soil Biol. Biochem. 2002, 34, 1495–1505. [Google Scholar] [CrossRef]
  59. Henry, H.A. Soil freeze–thaw cycle experiments: Trends, methodological weaknesses and suggested improvements. Soil Biol. Biochem. 2007, 39, 977–986. [Google Scholar] [CrossRef]
  60. Gao, D.C.; Bai, E.; Yang, Y.; Zong, S.W.; Hagedorn, F. A global meta-analysis on freeze-thaw effects on soil carbon and phosphorus cycling. Soil Biol. Biochem. 2021, 159, 108283. [Google Scholar] [CrossRef]
  61. Risk, N.; Snider, D.; Wagner-Riddle, C. Mechanisms leading to enhanced soil nitrous oxide fluxes induced by freeze–thaw cycles. Can. J. Soil Sci. 2013, 93, 401–414. [Google Scholar] [CrossRef]
  62. Xiao, L.; Zhang, Y.; Li, P.; Xu, G.; Shi, P.; Zhang, Y. Effects of freeze-thaw cycles on aggregate-associated organic carbon and glomalin-related soil protein in natural-succession grassland and Chinese pine forest on the Loess Plateau. Geoderma 2019, 334, 1–8. [Google Scholar] [CrossRef]
  63. Zhang, B.L.; Wu, X.K.; Zhang, W.; Chen, X.M.; Zhang, G.S.; Ai, X.; Sun, L.K.; Zhang, B.G.; Liu, G.X.; Chen, T. Diversity and succession of Actinobacteria in the forelands of the Tianshan Glacier, China. Geomicrobiol. J. 2016, 33, 716–723. [Google Scholar] [CrossRef]
  64. Larsen, K.S.; Jonasson, S.; Michelsen, A. Repeated freeze–thaw cycles and their effects on biological processes in two arctic ecosystem types. Appl. Soil Ecol. 2002, 21, 187–195. [Google Scholar] [CrossRef]
  65. Zhang, B.; Chen, Q.; Wen, J.H.; Ding, X.L.; Agathokleous, E. Straw addition decreased the resistance of bacterial community composition to freeze–thaw disturbances in a clay loam soil due to changes in physiological and functional traits. Geoderma 2022, 424, 116007. [Google Scholar] [CrossRef]
  66. Han, C.L.; Gu, Y.J.; Kong, M.; Hu, L.W.; Jia, Y.; Li, F.M.; Sun, G.J.; Siddique, K.H. Responses of soil microorganisms, carbon and nitrogen to freeze–thaw cycles in diverse land-use types. Appl. Soil Ecol. 2018, 124, 211–217. [Google Scholar] [CrossRef]
  67. Kielak, A.M.; Barreto, C.C.; Kowalchuk, G.A.; Van Veen, J.A.; Kuramae, E.E. The ecology of Acidobacteria: Moving beyond genes and genomes. Front. Microbiol. 2016, 7, 744. [Google Scholar] [CrossRef] [PubMed]
  68. Kumar, N.; Grogan, P.; Chu, H.; Christiansen, C.T.; Walker, V.K. The effect of freeze-thaw conditions on arctic soil bacterial communities. Biology 2013, 2, 356–377. [Google Scholar] [CrossRef] [PubMed]
  69. Jones, S.E.; Ho, L.; Rees, C.A.; Hill, J.E.; Nodwell, J.R.; Elliot, M.A. Streptomyces exploration is triggered by fungal interactions and volatile signals. eLife 2017, 6, e21738. [Google Scholar] [CrossRef] [PubMed]
  70. Männistö, M.K.; Tiirola, M.; Häggblom, M.M. Effect of freeze-thaw cycles on bacterial communities of Arctic tundra soil. Microb. Ecol. 2009, 58, 621–631. [Google Scholar] [CrossRef]
  71. Traxler, M.F.; Kolter, R. Natural products in soil microbe interactions and evolution. Nat. Prod. Rep. 2015, 32, 956–970. [Google Scholar] [CrossRef]
  72. Paredes-Sabja, D.; Setlow, P.; Sarker, M.R. Germination of spores of Bacillales and Clostridiales species: Mechanisms and proteins involved. Trends microbiol. 2011, 19, 85–94. [Google Scholar] [CrossRef]
  73. DeBruyn, J.M.; Nixon, L.T.; Fawaz, M.N.; Johnson, A.M.; Radosevich, M. Global biogeography and quantitative seasonal dynamics of Gemmatimonadetes in soil. Appl. Environ. Microbiol. 2011, 77, 6295–6300. [Google Scholar] [CrossRef] [PubMed]
  74. Wilson, S.L.; Walker, V.K. Selection of low-temperature resistance in bacteria and potential applications. Environ. Technol. 2010, 31, 943–956. [Google Scholar] [CrossRef] [PubMed]
  75. Fierer, N.; Bradford, M.A.; Jackson, R.B. Toward an ecological classification of soil bacteria. Ecology 2007, 88, 1354–1364. [Google Scholar] [CrossRef]
  76. Schostag, M.; Priemé, A.; Jacquiod, S.; Russel, J.; Ekelund, F.; Jacobsen, C.S. Bacterial and protozoan dynamics upon thawing and freezing of an active layer permafrost soil. ISME J. 2019, 13, 1345–1359. [Google Scholar] [CrossRef]
  77. Ho, A.; Di Lonardo, D.P.; Bodelier, P.L. Revisiting life strategy concepts in environmental microbial ecology. FEMS Microbiol. Ecol. 2017, 93, fix006. [Google Scholar] [CrossRef] [PubMed]
  78. Nikrad, M.P.; Kerkhof, L.J.; Häggblom, M.M. The subzero microbiome: Microbial activity in frozen and thawing soils. FEMS Microbiol. Ecol. 2016, 92, fiw081. [Google Scholar] [CrossRef] [PubMed]
  79. Urakawa, R.; Shibata, H.; Kuroiwa, M.; Inagaki, Y.; Tateno, R.; Hishi, T.; Fukuzawa, K.; Hirai, K.; Toda, H.; Oyanagi, N. Effects of freeze–thaw cycles resulting from winter climate change on soil nitrogen cycling in ten temperate forest ecosystems throughout the Japanese archipelago. Soil Biol. Biochem. 2014, 74, 82–94. [Google Scholar] [CrossRef]
  80. Jiang, N.; Juan, Y.H.; Tian, L.L.; Chen, X.D.; Sun, W.T.; Chen, L.J. Soil water contents control the responses of dissolved nitrogen pools and bacterial communities to freeze-thaw in temperate soils. BioMed Res. Int. 2020, 2020, 6867081. [Google Scholar] [CrossRef] [PubMed]
  81. Isobe, K.; Oka, H.; Watanabe, T.; Tateno, R.; Urakawa, R.; Liang, C.; Senoo, K.; Shibata, H. High soil microbial activity in the winter season enhances nitrogen cycling in a cool-temperate deciduous forest. Soil Biol. Biochem. 2018, 124, 90–100. [Google Scholar] [CrossRef]
  82. Ren, J.S.; Song, C.C.; Hou, A.X.; Song, Y.Y.; Zhu, X.Y.; Cagle, G.A. Shifts in soil bacterial and archaeal communities during freeze-thaw cycles in a seasonal frozen marsh, Northeast China. Sci. Total Environ. 2018, 625, 782–791. [Google Scholar] [CrossRef] [PubMed]
  83. Ji, X.M.; Liu, M.H.; Yang, J.L.; Feng, F.J. Meta-analysis of the impact of freeze–thaw cycles on soil microbial diversity and C and N dynamics. Soil Biol. Biochem. 2022, 168, 108608. [Google Scholar] [CrossRef]
  84. Henry, H.A. Climate change and soil freezing dynamics: Historical trends and projected changes. Clim. Chang. 2008, 87, 421–434. [Google Scholar] [CrossRef]
  85. Dong, Z.H.; Li, J.F.; Chen, L.; Wang, S.; Shao, T. Effects of freeze–thaw event on microbial community dynamics during red clover ensiling. Front. Microbiol. 2019, 10, 1559. [Google Scholar] [CrossRef] [PubMed]
  86. Juan, Y.H.; Jiang, N.; Tian, L.L.; Chen, X.D.; Sun, W.T.; Chen, L.J. Effect of freeze-thaw on a midtemperate soil bacterial community and the correlation network of its members. BioMed Res. Int. 2018, 2018, 8412429. [Google Scholar] [CrossRef]
  87. Li, Y.X.; Wang, L.X.; Tian, L.; Zheng, H.F.; Ou, Y.; Yan, B.X.; Cui, H.; Bao, M.W.; Zhang, S.Q.; Guan, F.C. Dissolved organic carbon, an indicator of soil bacterial succession in restored wetland under freeze-thaw cycle. Ecol. Eng. 2022, 177, 106569. [Google Scholar] [CrossRef]
  88. Liu, X.; Qi, Z.M.; Wang, Q.; Ma, Z.W.; Li, L.H. Effects of biochar addition on CO2 and CH4 emissions from a cultivated sandy loam soil during freeze-thaw cycles. Plant Soil Environ. 2017, 63, 243–249. [Google Scholar]
  89. Ludwig, B.; Teepe, R.; de Gerenyu, V.L.; Flessa, H. CO2 and N2O emissions from gleyic soils in the Russian tundra and a German forest during freeze–thaw periods—a microcosm study. Soil Biol. Biochem. 2006, 38, 3516–3519. [Google Scholar] [CrossRef]
  90. Walz, J.; Knoblauch, C.; Böhme, L.; Pfeiffer, E.-M. Regulation of soil organic matter decomposition in permafrost-affected Siberian tundra soils-Impact of oxygen availability, freezing and thawing, temperature, and labile organic matter. Soil Biol. Biochem. 2017, 110, 34–43. [Google Scholar] [CrossRef]
  91. Kim, D.; Vargas, R.; Bond-Lamberty, B.; Turetsky, M. Effects of soil rewetting and thawing on soil gas fluxes: A review of current literature and suggestions for future research. Biogeosciences 2012, 9, 2459–2483. [Google Scholar] [CrossRef]
  92. Zhu, R.B.; Liu, Y.S.; Ma, E.D.; Sun, J.J.; Xu, H.; Sun, L.G. Greenhouse gas emissions from penguin guanos and ornithogenic soils in coastal Antarctica: Effects of freezing–thawing cycles. Atmos. Environ. 2009, 43, 2336–2347. [Google Scholar] [CrossRef]
  93. Kreyling, J.; Schumann, R.; Weigel, R. Soils from cold and snowy temperate deciduous forests release more nitrogen and phosphorus after soil freeze–thaw cycles than soils from warmer, snow-poor conditions. Biogeosciences 2020, 17, 4103–4117. [Google Scholar] [CrossRef]
  94. Pelster, D.E.; Chantigny, M.H.; Rochette, P.; Bertrand, N.; Angers, D.A.; Zebarth, B.J.; Goyer, C. Rates and intensity of freeze–thaw cycles affect nitrous oxide and carbon dioxide emissions from agricultural soils. Can. J. Soil Sci. 2019, 99, 472–484. [Google Scholar] [CrossRef]
  95. Dong, X.F.; Liu, C.; Ma, D.L.; Wu, Y.F.; Man, H.R.; Wu, X.W.; Li, M.; Zang, S.Y. Organic carbon mineralization and bacterial community of active layer soils response to short-term warming in the Great Hing’an Mountains of Northeast China. Front. Microbiol. 2021, 12, 802213. [Google Scholar] [CrossRef] [PubMed]
  96. Ernakovich, J.G.; Lynch, L.M.; Brewer, P.E.; Calderon, F.J.; Wallenstein, M.D. Redox and temperature-sensitive changes in microbial communities and soil chemistry dictate greenhouse gas loss from thawed permafrost. Biogeochemistry 2017, 134, 183–200. [Google Scholar] [CrossRef]
  97. Barret, M.; Morrissey, J.P.; O’gara, F. Functional genomics analysis of plant growth-promoting rhizobacterial traits involved in rhizosphere competence. Biol. Fertil. Soils 2011, 47, 729–743. [Google Scholar] [CrossRef]
  98. Pold, G.; Billings, A.F.; Blanchard, J.L.; Burkhardt, D.B.; Frey, S.D.; Melillo, J.M.; Schnabel, J.; van Diepen, L.T.; DeAngelis, K.M. Long-term warming alters carbohydrate degradation potential in temperate forest soils. Appl. Environ. Microbiol. 2016, 82, 6518–6530. [Google Scholar] [CrossRef]
  99. Samad, T.; Billings, N.; Birjiniuk, A.; Crouzier, T.; Doyle, P.S.; Ribbeck, K. Swimming bacteria promote dispersal of non-motile staphylococcal species. ISME J. 2017, 11, 1933–1937. [Google Scholar] [CrossRef]
  100. Guo, Z.; Han, J.; Li, J.; Xu, Y.; Wang, X. Effects of long-term fertilization on soil organic carbon mineralization and microbial community structure. PLoS ONE 2019, 14, e0211163. [Google Scholar]
  101. Yang, Y.J.; Liu, H.X.; Dai, Y.C.; Tian, H.X.; Zhou, W.; Lv, J.L. Soil organic carbon transformation and dynamics of microorganisms under different organic amendments. Sci. Total Environ. 2021, 750, 141719. [Google Scholar] [CrossRef]
  102. Yamada, T.; Sekiguchi, Y. Cultivation of uncultured chloroflexi subphyla: Significance and ecophysiology of formerly uncultured chloroflexi’subphylum i’with natural and biotechnological relevance. Microbes Environ. 2009, 24, 205–216. [Google Scholar] [CrossRef] [PubMed]
  103. Zheng, J.F.; Chen, J.H.; Pan, G.X.; Wang, G.M.; Liu, X.Y.; Zhang, X.H.; Li, L.Q.; Bian, R.J.; Cheng, K.; Zheng, J.W. A long-term hybrid poplar plantation on cropland reduces soil organic carbon mineralization and shifts microbial community abundance and composition. Appl. Soil Ecol. 2017, 111, 94–104. [Google Scholar] [CrossRef]
  104. Jiang, L.; Song, Y.Y.; Sun, L.; Song, C.C.; Wang, X.W.; Ma, X.Y.; Liu, C.; Gao, J.L. Effects of warming on carbon emission and microbial abundances across different soil depths of a peatland in the permafrost region under anaerobic condition. Appl. Soil Ecol. 2020, 156, 103712. [Google Scholar] [CrossRef]
  105. Zhang, Y.F.; Song, C.C.; Wang, X.W.; Chen, N.; Zhang, H.; Du, Y.; Zhang, Z.G.; Zhu, X.H. Warming effects on the flux of CH4 from peatland mesocosms are regulated by plant species composition: Richness and functional types. Sci. Total Environ. 2022, 806, 150831. [Google Scholar] [CrossRef]
  106. Hütsch, B.W.; Webster, C.P.; Powlson, D.S. Methane oxidation in soil as affected by land use, soil pH and N fertilization. Soil Biol. Biochem. 1994, 26, 1613–1622. [Google Scholar] [CrossRef]
  107. Wang, Z.P.; Delaune, R.D.; Lindau, C.W.; Patrick, W.H. Methane production from anaerobic soil amended with rice straw and nitrogen fertilizers. Fertil. Res. 1992, 33, 115–121. [Google Scholar] [CrossRef]
Figure 1. Sampling sites of forest–wetland ecotone in Northeast China.
Microorganisms 10 01950 g001
Figure 2. CO2 and CH4 emission rates of forest and wetland patches under different FTCs.
Microorganisms 10 01950 g002
Figure 3. Relative abundance of soil bacterial phyla after FTCs. (a) forest patches, −5–5 °C FTC treatment; (b) forest patches, −10–10 °C FTC treatment; (c) wetland patches, −5–5 °C FTC treatment; (d) wetland patches, −10–10 °C FTC treatment. Values in column represent the relative abundance of bacteria on phylum level.
Microorganisms 10 01950 g003
Figure 4. Differences in relative abundance of phyla (top 15) between preincubation and FTCs treatments (average of the 1st, 3rd, and 9th FTCs). (a) forest patches, −5–5 °C FTC treatment; (b) forest patches, −10–10 °C FTC treatment; (c) wetland patches, −5–5 °C FTC treatment; (d) wetland patches, −10–10 °C FTC treatment. Data are shown as the difference in proportions. * indicates p < 0.05; ** indicates p < 0.01; *** indicates p < 0.001.
Microorganisms 10 01950 g004
Figure 5. Bacterial alpha diversity under the different FTCs. * p < 0.05.
Microorganisms 10 01950 g005
Figure 6. NMDS (a,b) and PLS-DA plots (c,d) revealing the effects of FTCs on the bacterial community. Hollow circles and solid circles indicate different FTC amplitudes. Hollow circles indicate FTCs at −5–5 °C; solid circles indicate FTCs at −10–10 °C.
Microorganisms 10 01950 g006
Figure 7. Effects of FTCs on soil DOC, NH4+-N, and NO3-N contents.
Microorganisms 10 01950 g007
Figure 8. Redundancy analysis of soil bacterial phyla and the soil carbon and nitrogen contents in forest–wetland ecotone (a), forest patches (b) and wetland patches (c).
Microorganisms 10 01950 g008
Figure 9. Pearson correlations among soil carbon emissions, bacterial diversity, and substrates after incubation. Red indicates positive correlations, and blue indicates negative correlations. * indicates significant correlations at the 0.05 level.
Microorganisms 10 01950 g009
Table 1. Details of the FTC simulation experiment.
EcotoneSoil Water ContentFTC AmplitudeFTC PeriodSampling Time
Forest patchesField water content (23.38 ± 0.81%)−5–5 °C and −10–10 °C2 days (the treated sample was frozen at −5 °C or −10 °C for 24 h and thawed at 5 °C or 10 °C for 24 h)After preincubation (CK) and the 1st, 3rd, and 9th FTCs
Wetland patchesField water content (84.41 ± 5.36%)
Table 2. The biological and abiotic factors related to CO2 and CH4 emission rates in forest and wetland patches.
Patch type Adjusted R2F-StatisticpSignificant Variables (p < 0.05)Beta Coefficient
Forest patchesBiological factorsCH40.8945.7510.035Proteobacteria0.575
Bacteroidota1.145
CO20.87818.487<0.001Chloroflexi−0.547
Actinobacteriota0.295
Proteobacteria−0.423
MBNT150.646
Gemmatimonadota−0.608
Non-biological factorsCH40.45611.2540.029NO3-N0.536
CO20.3128.7270.009DOC0.594
Wetland patchesBiological factorsCH40.31613.6170.04Proteobacteria1.689
Firmicutes−1.295
Patescibacteria−1.287
CO20.7298.6430.01Actinobacteriota2.181
Proteobacteria−1.370
Acidobacteriota0.646
Gemmatimonadota0.672
Desulfobacterota0.518
Non-biological factorsCH40.68919.8420.009NH4+-N−0.712
NO3-N0.615
CO2---None-
Note: For the linear regressions, we standardized predictors (mean = 0, SD = 1) to permit the interpretation of coefficients as effect sizes.
Publisher’s Note: MDPI stays neutral with regard to jurisdictional claims in published maps and institutional affiliations.

