Improving the Performance of Pump-Controlled Circuits for Single-Rod Actuators


Abstract
:1. Introduction
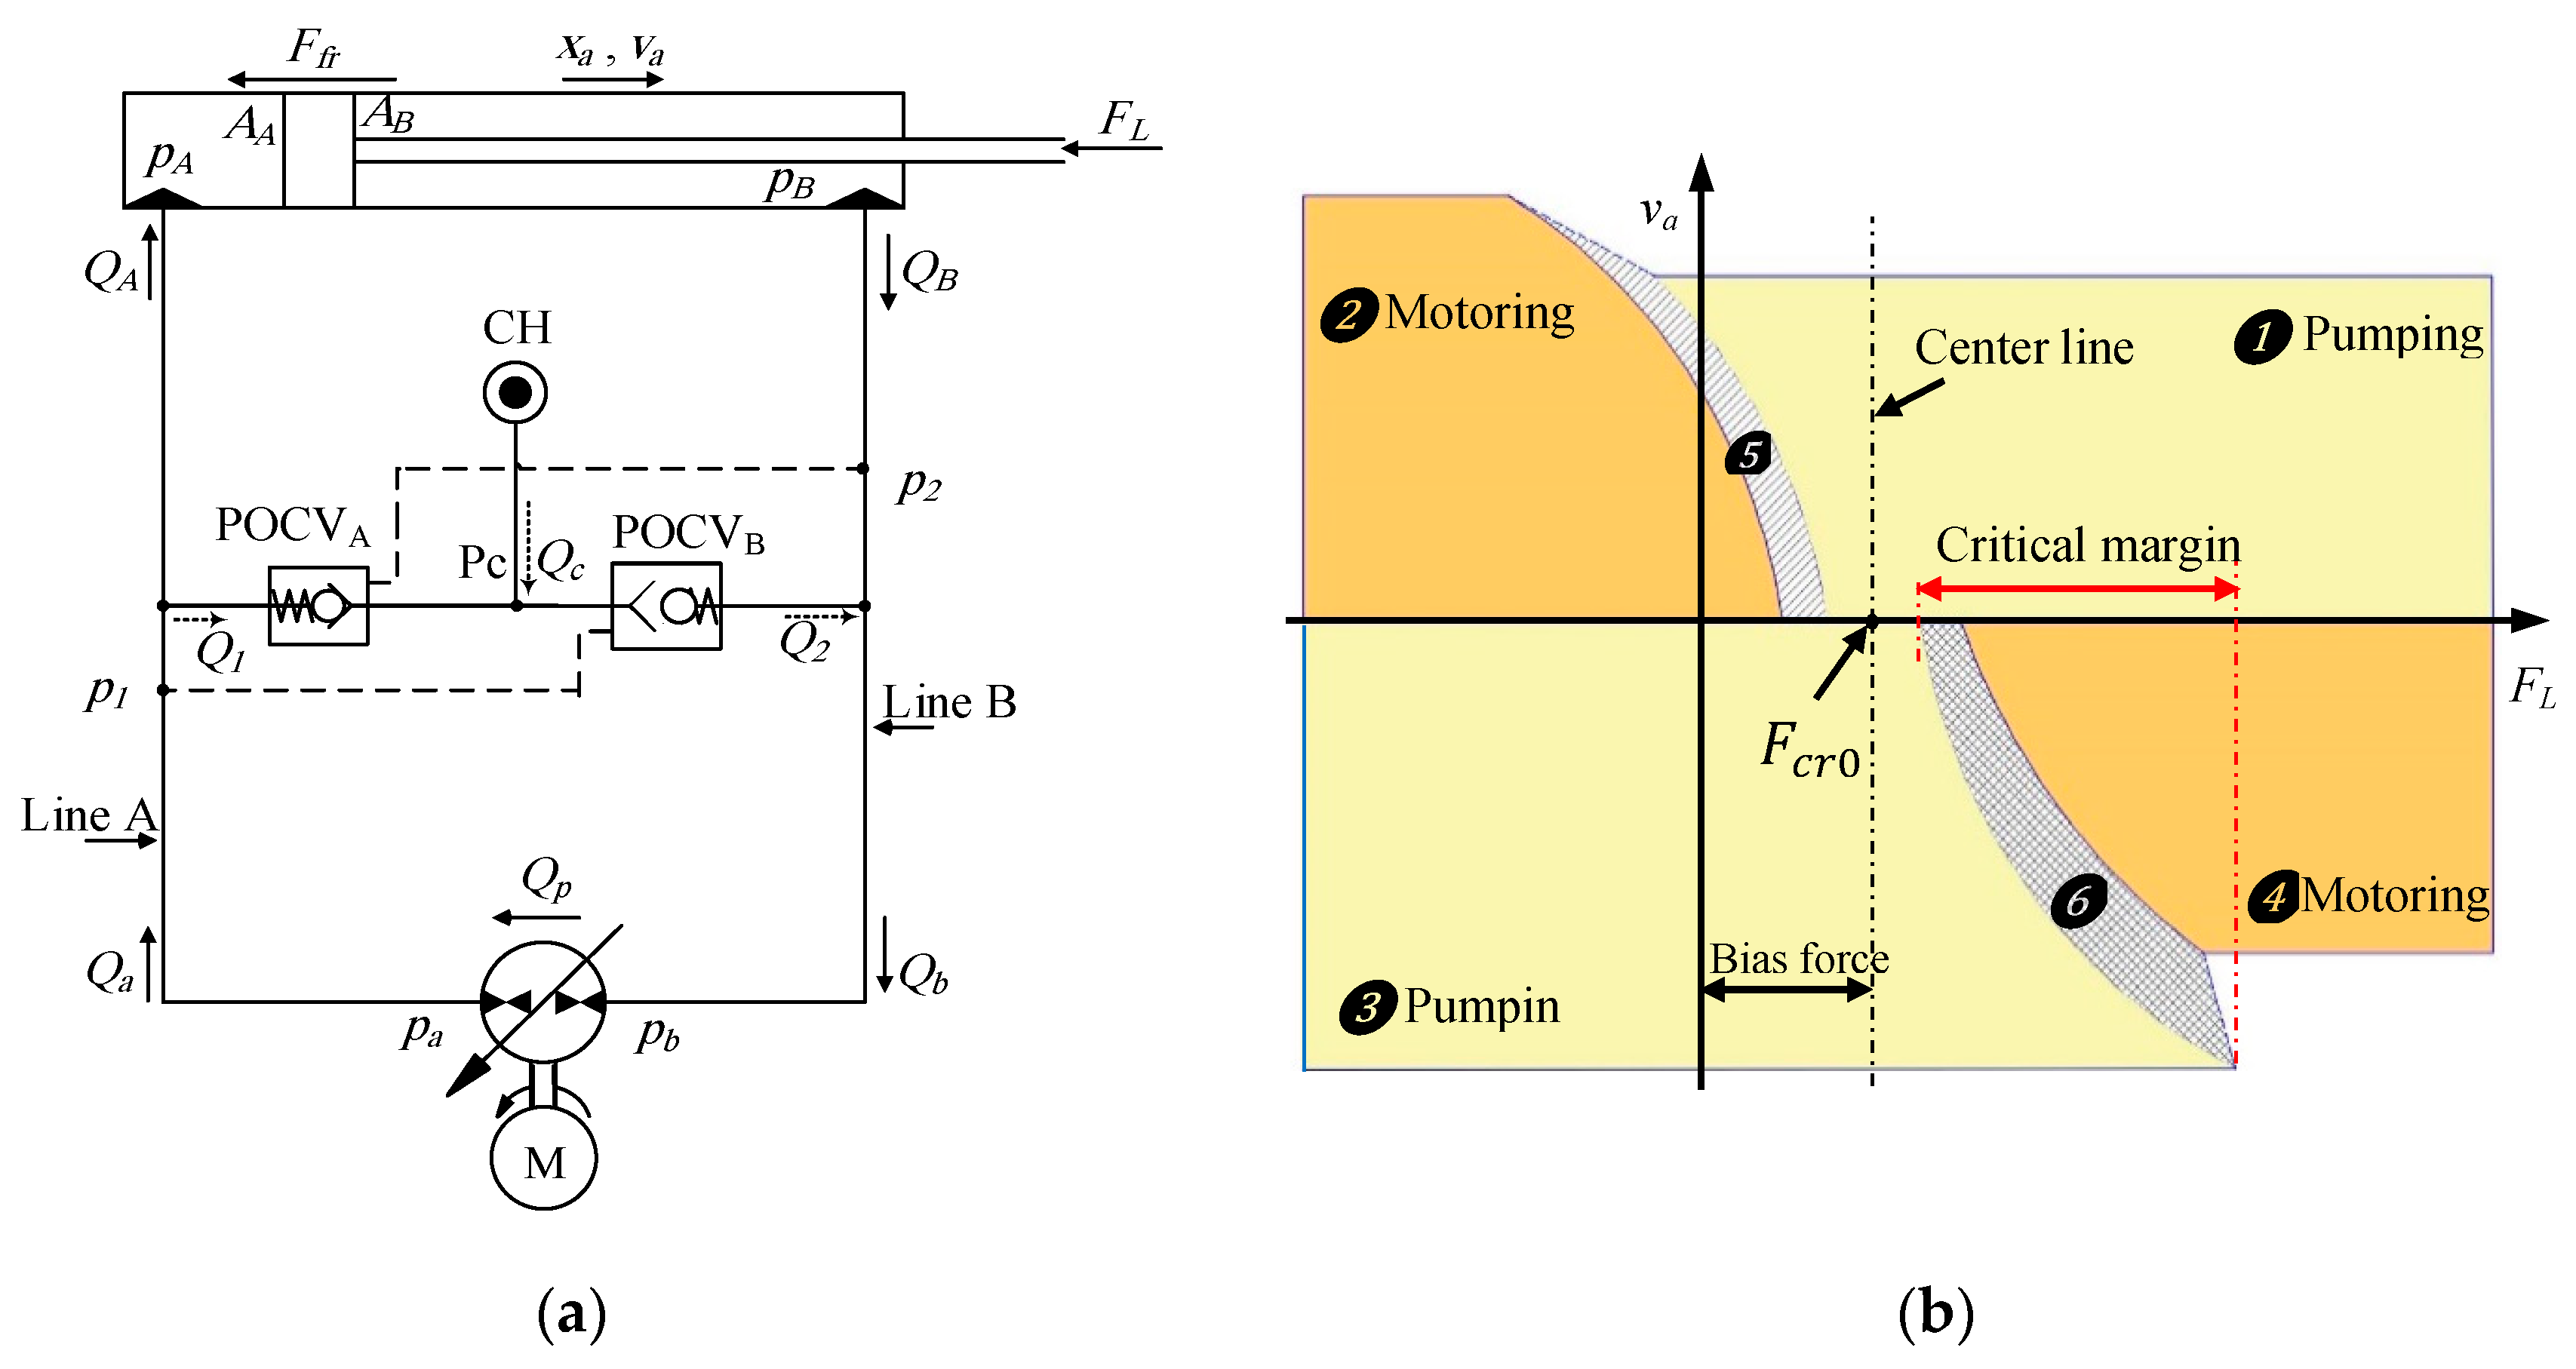
2. Problem Statement and Proposed Solution
2.1. Mathematical Model
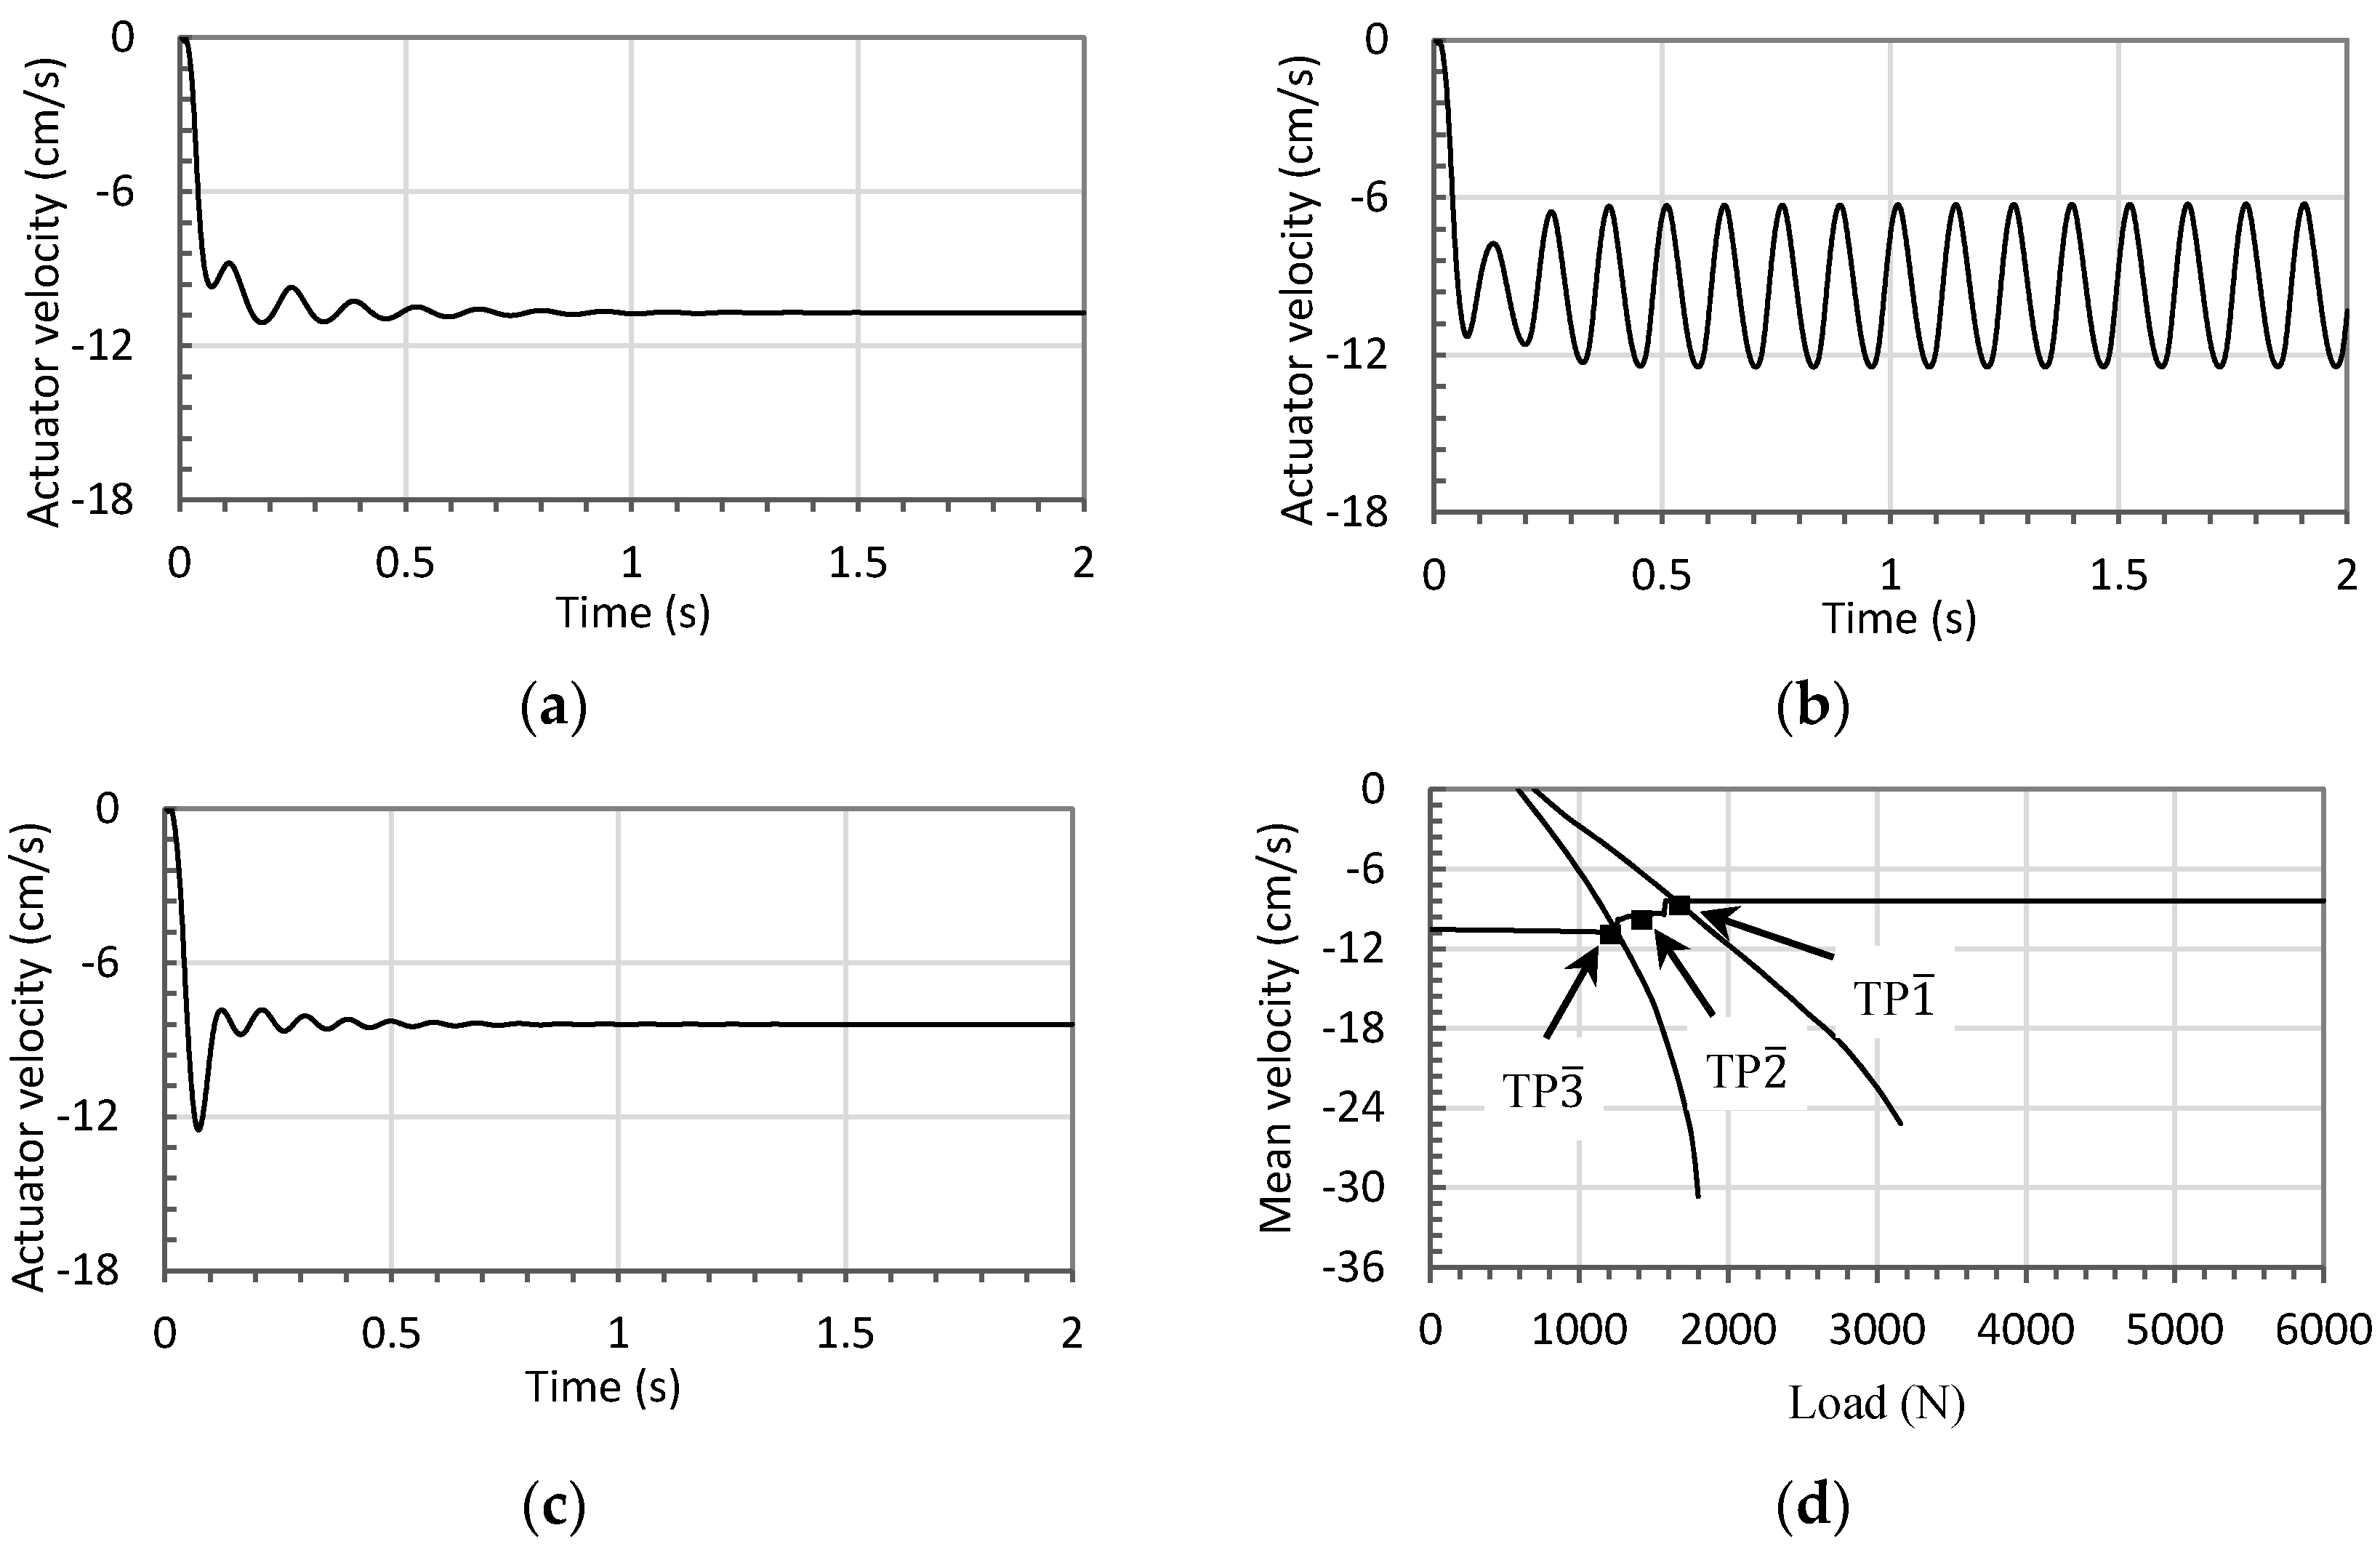
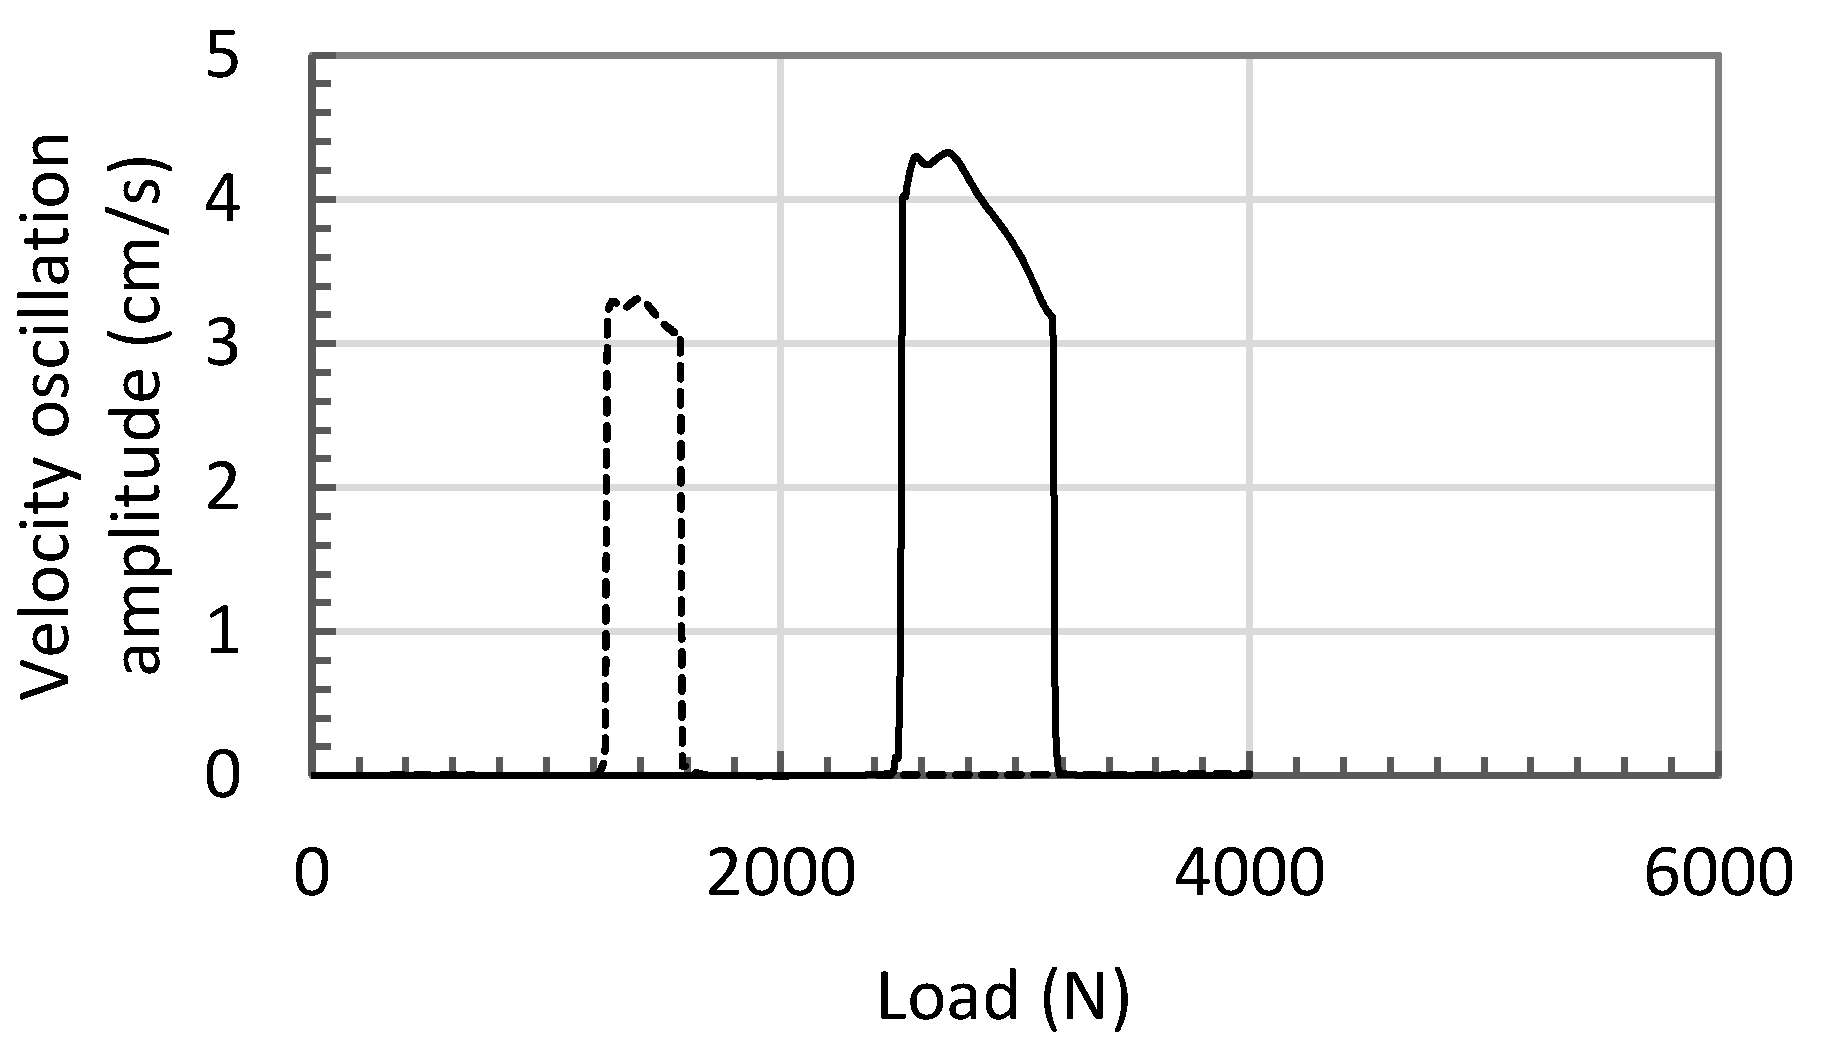
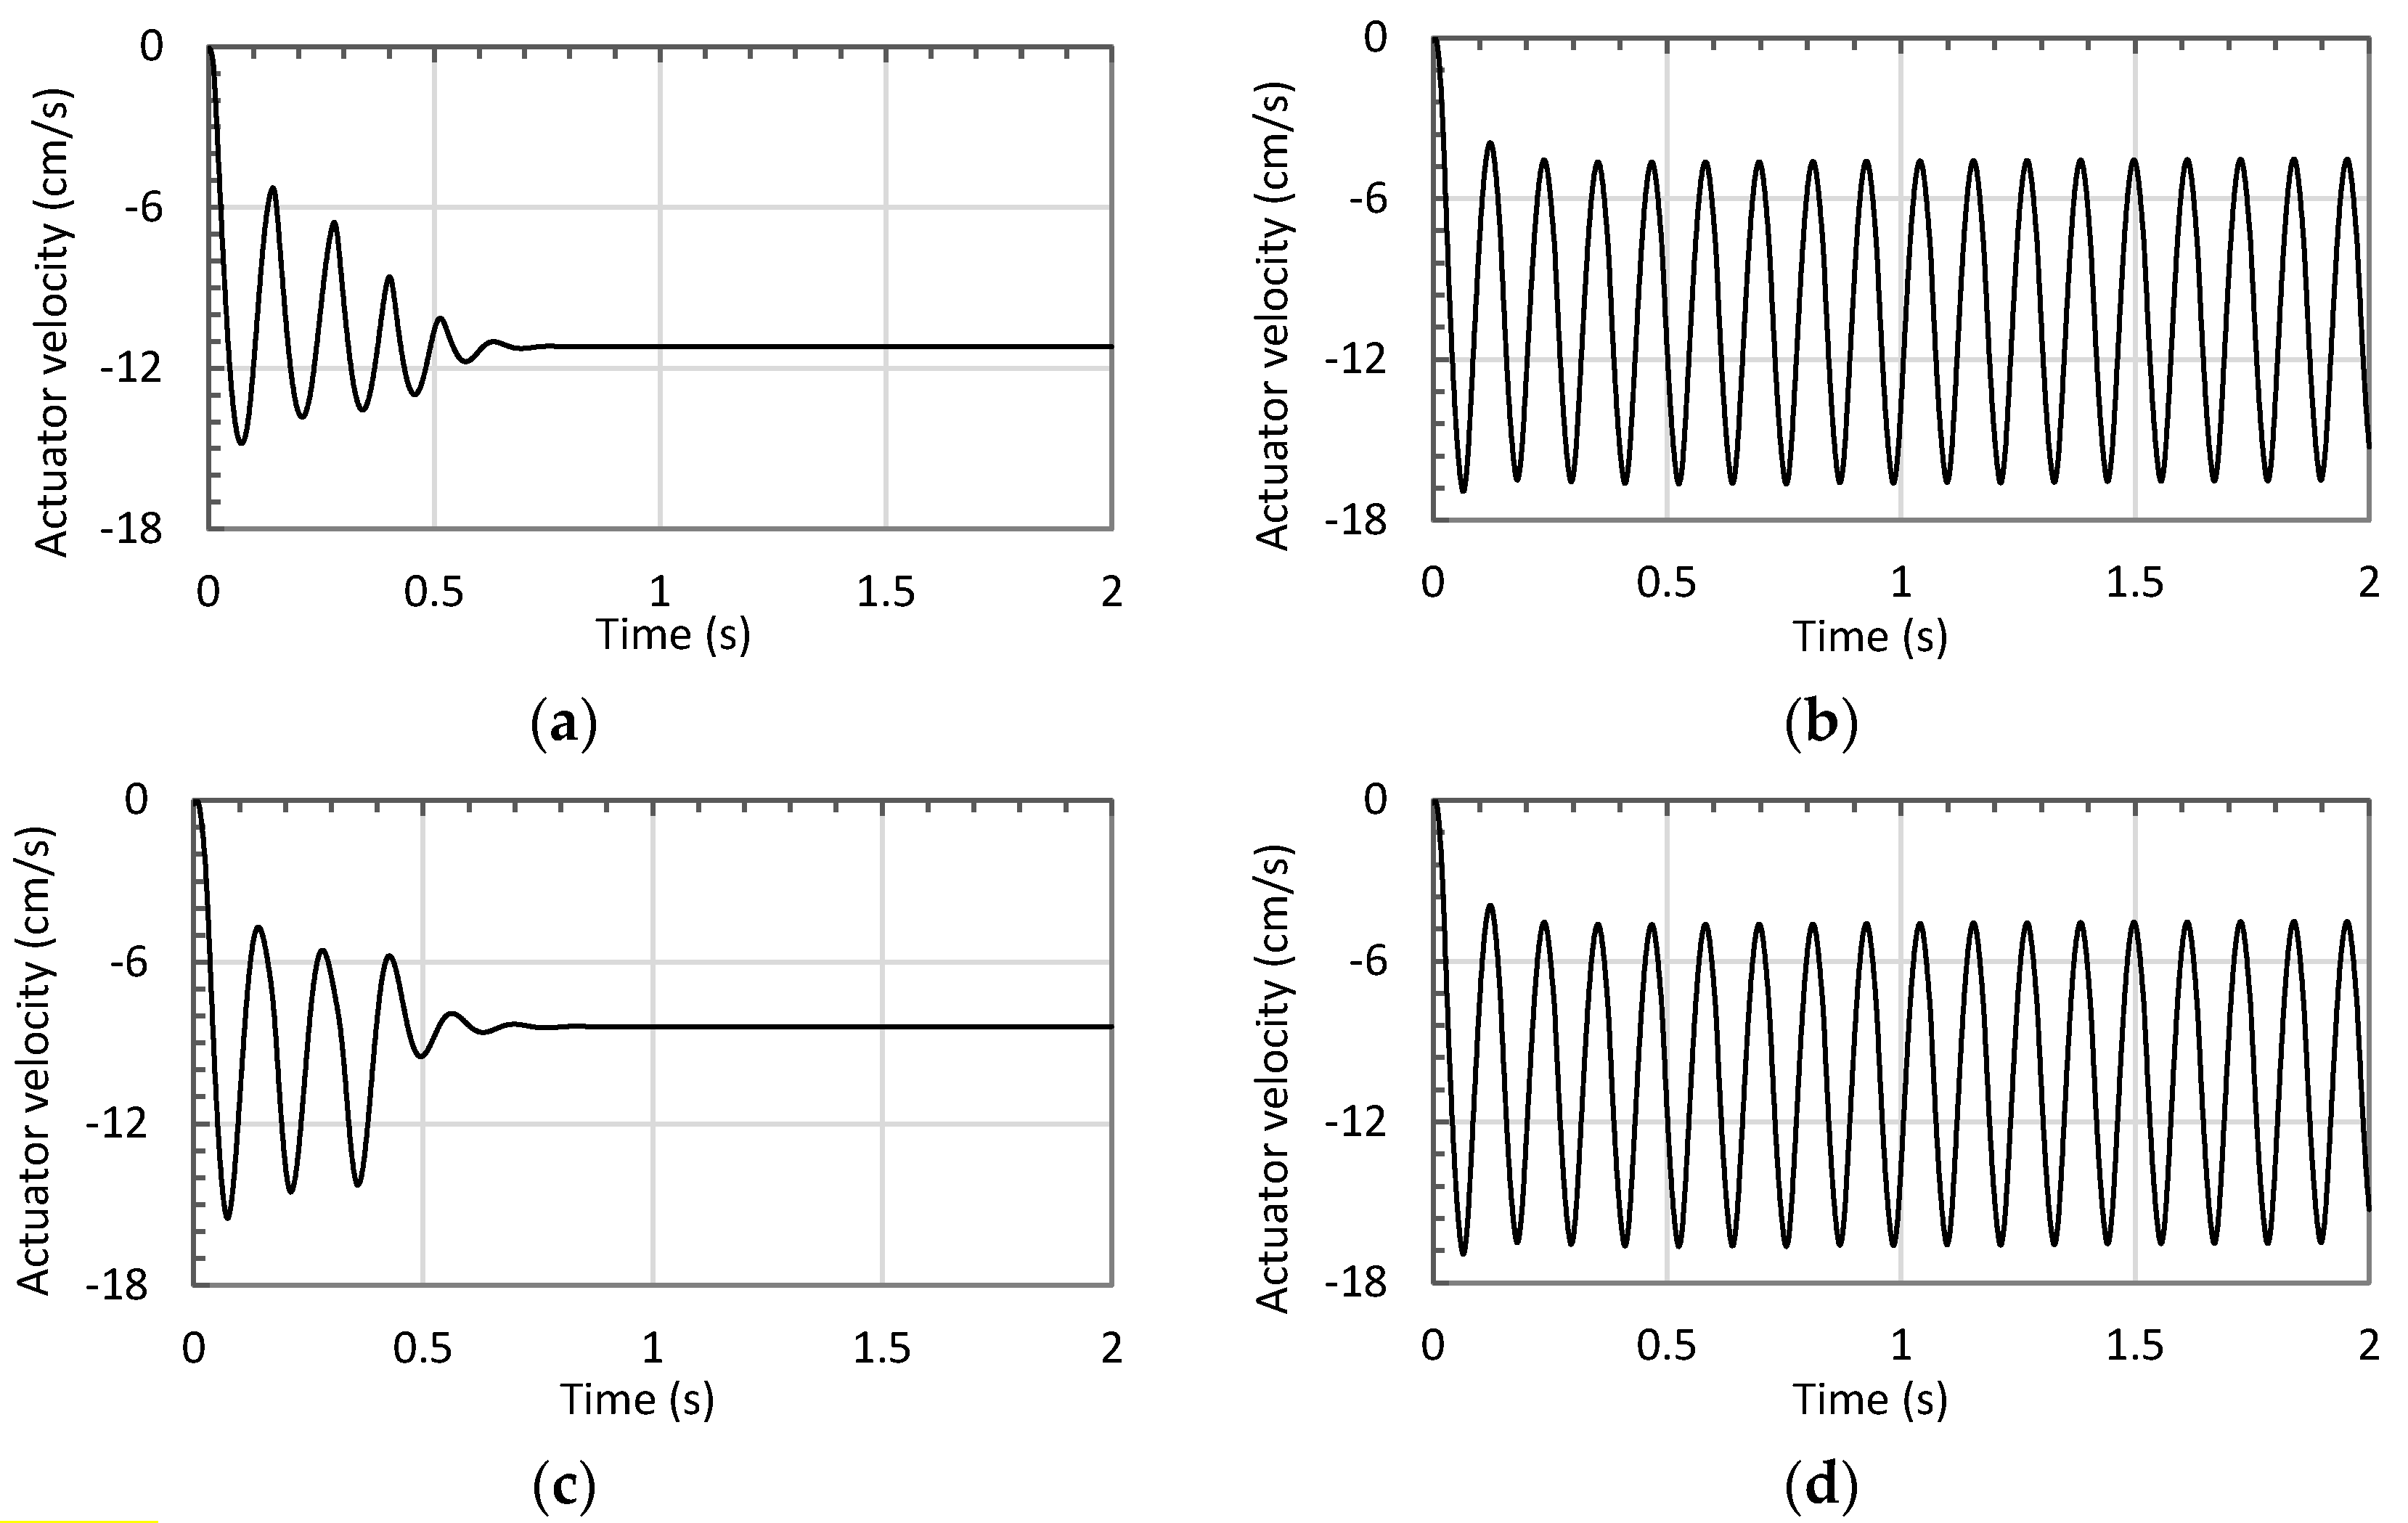
2.2. Simulation Studies
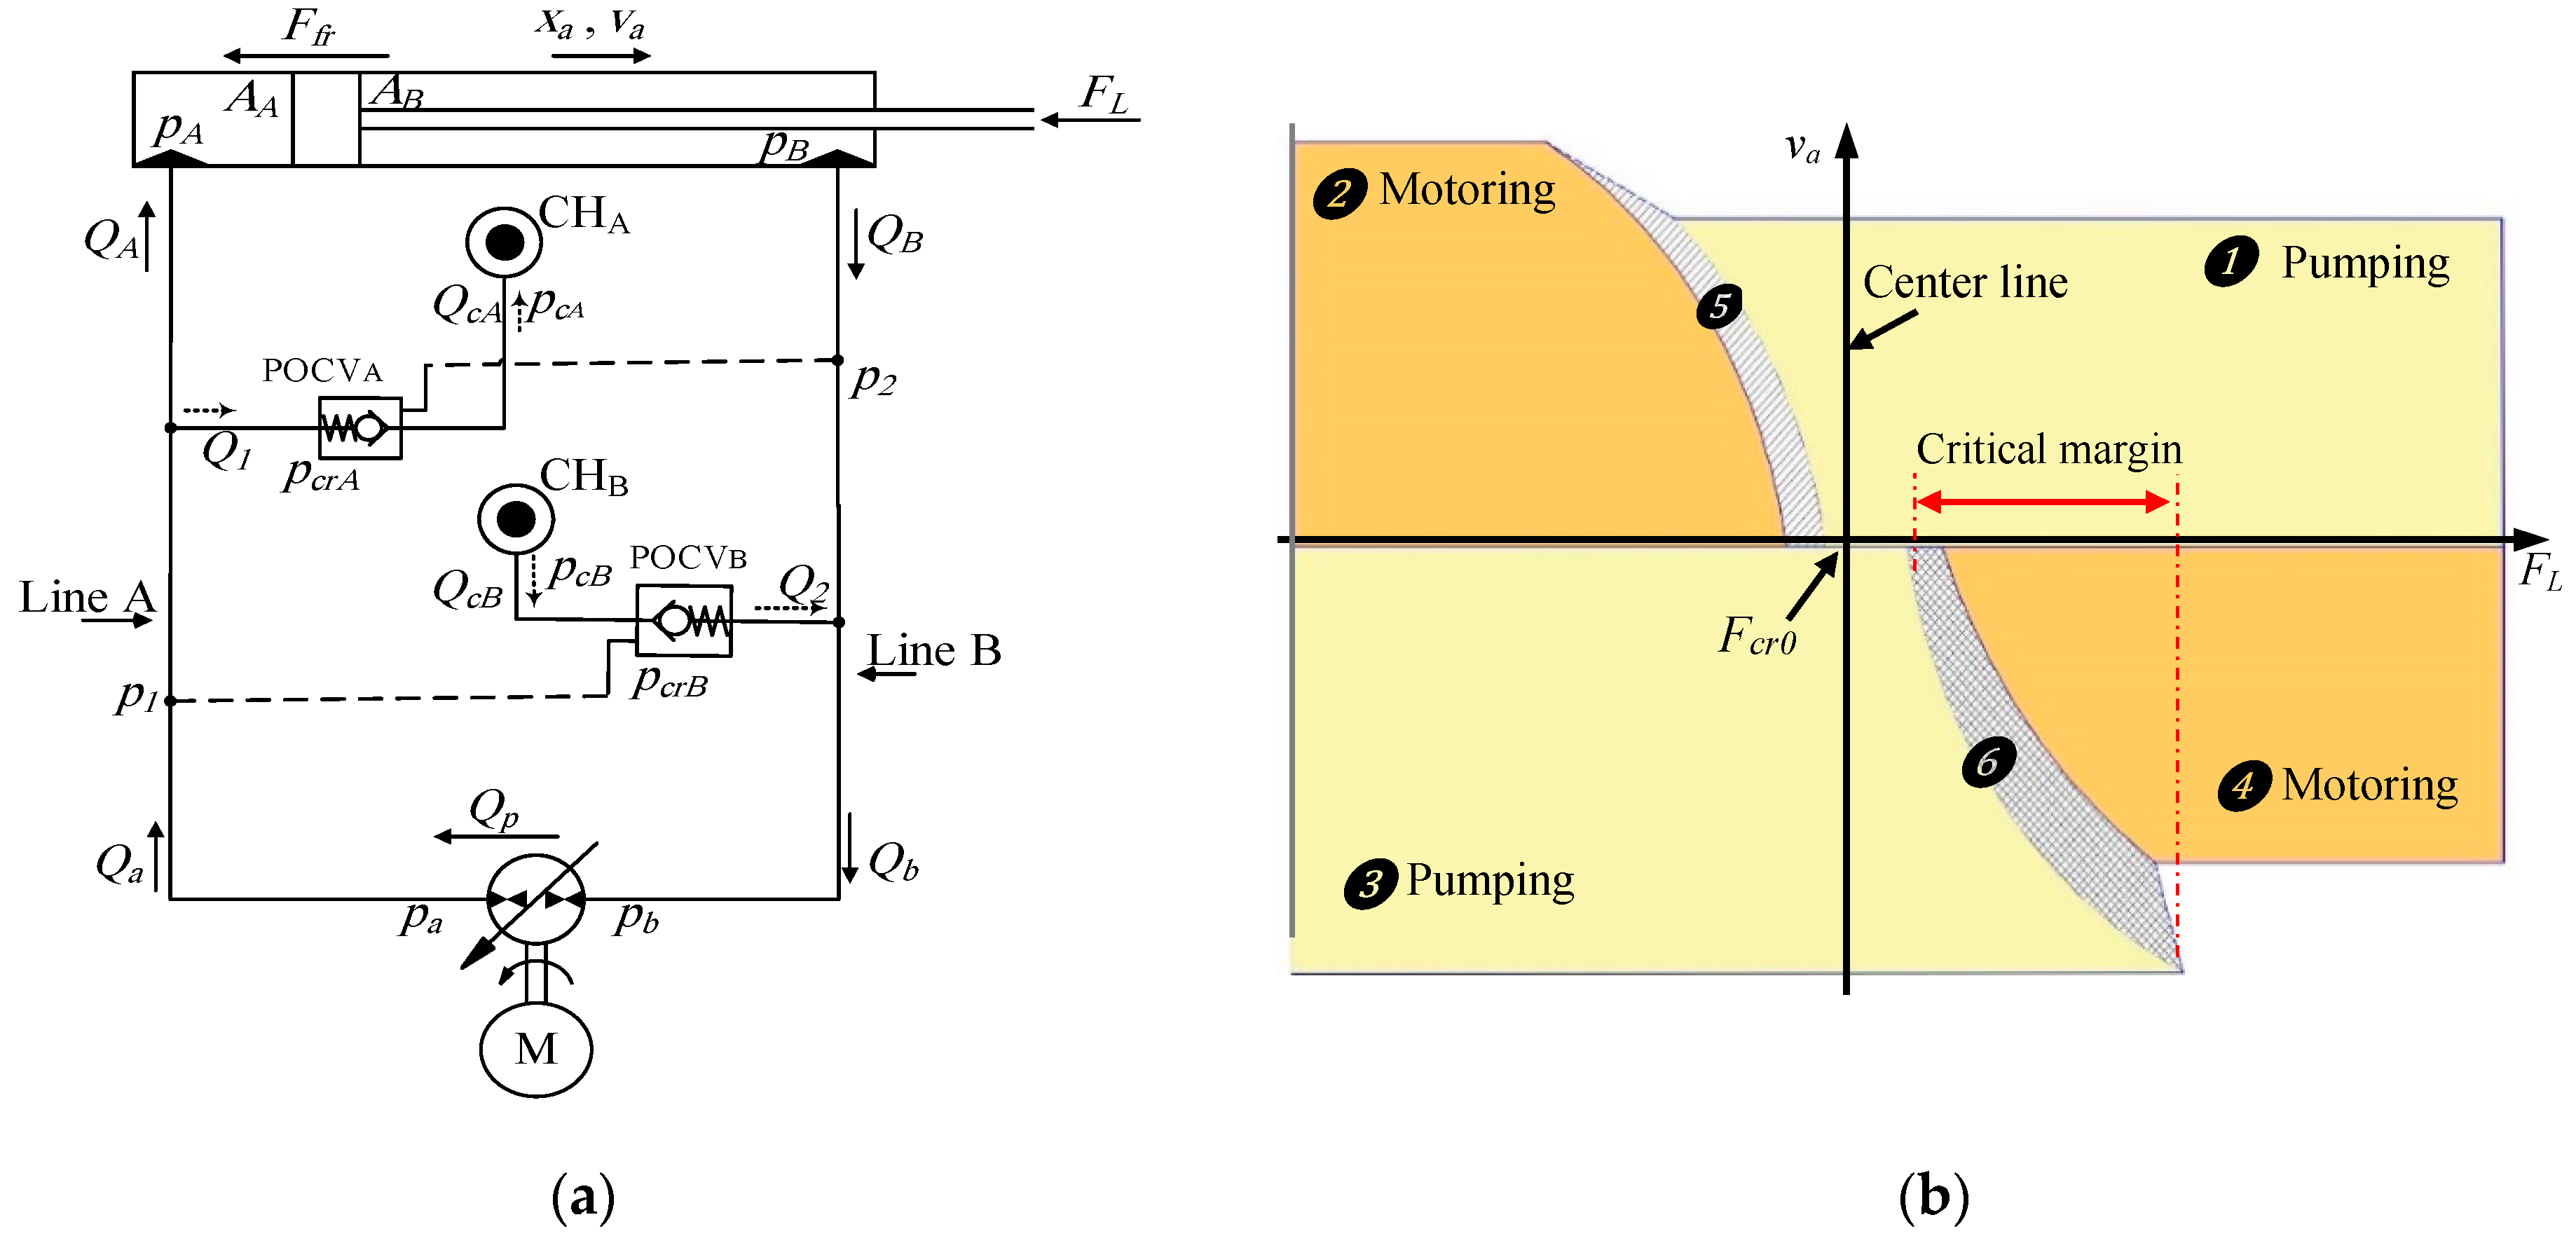
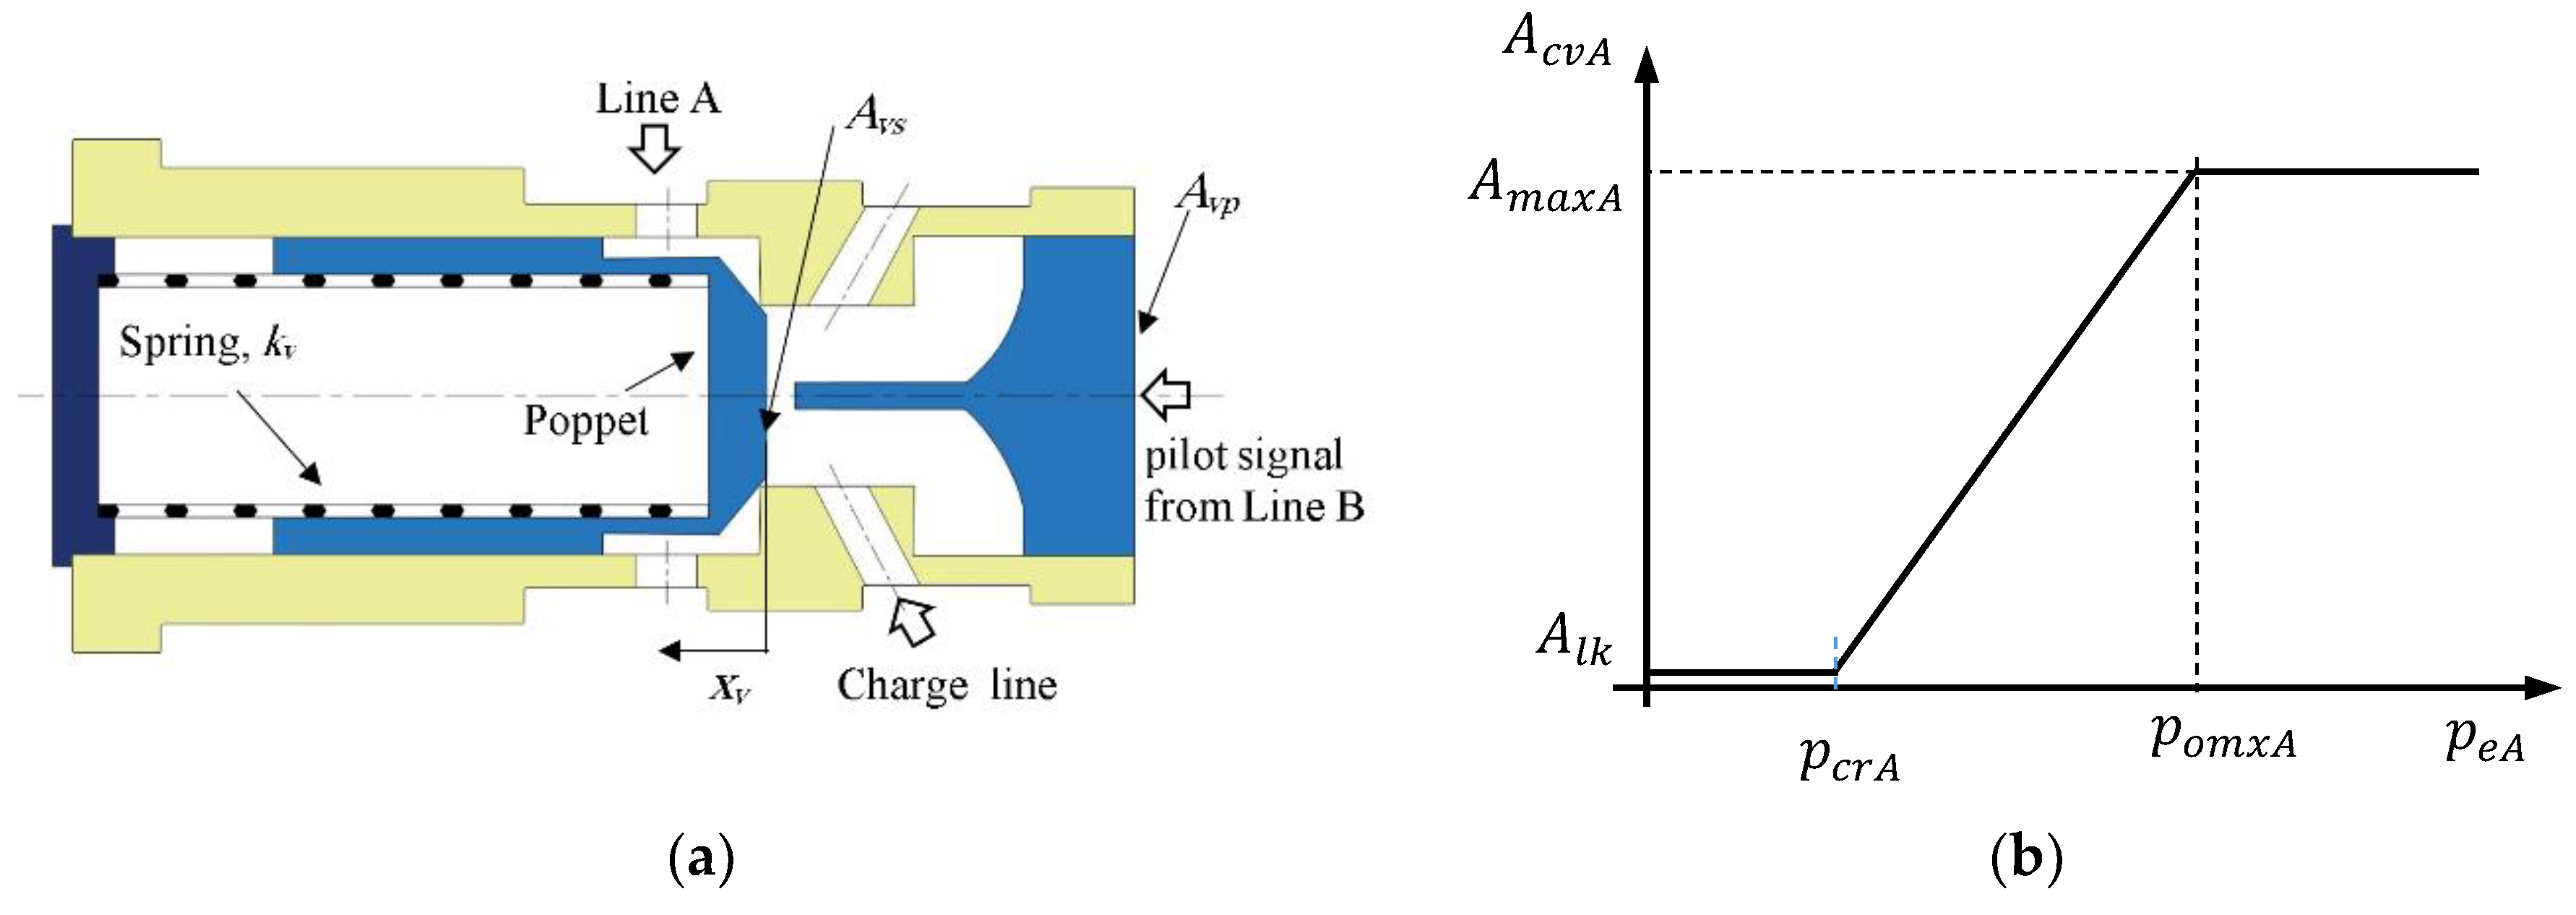
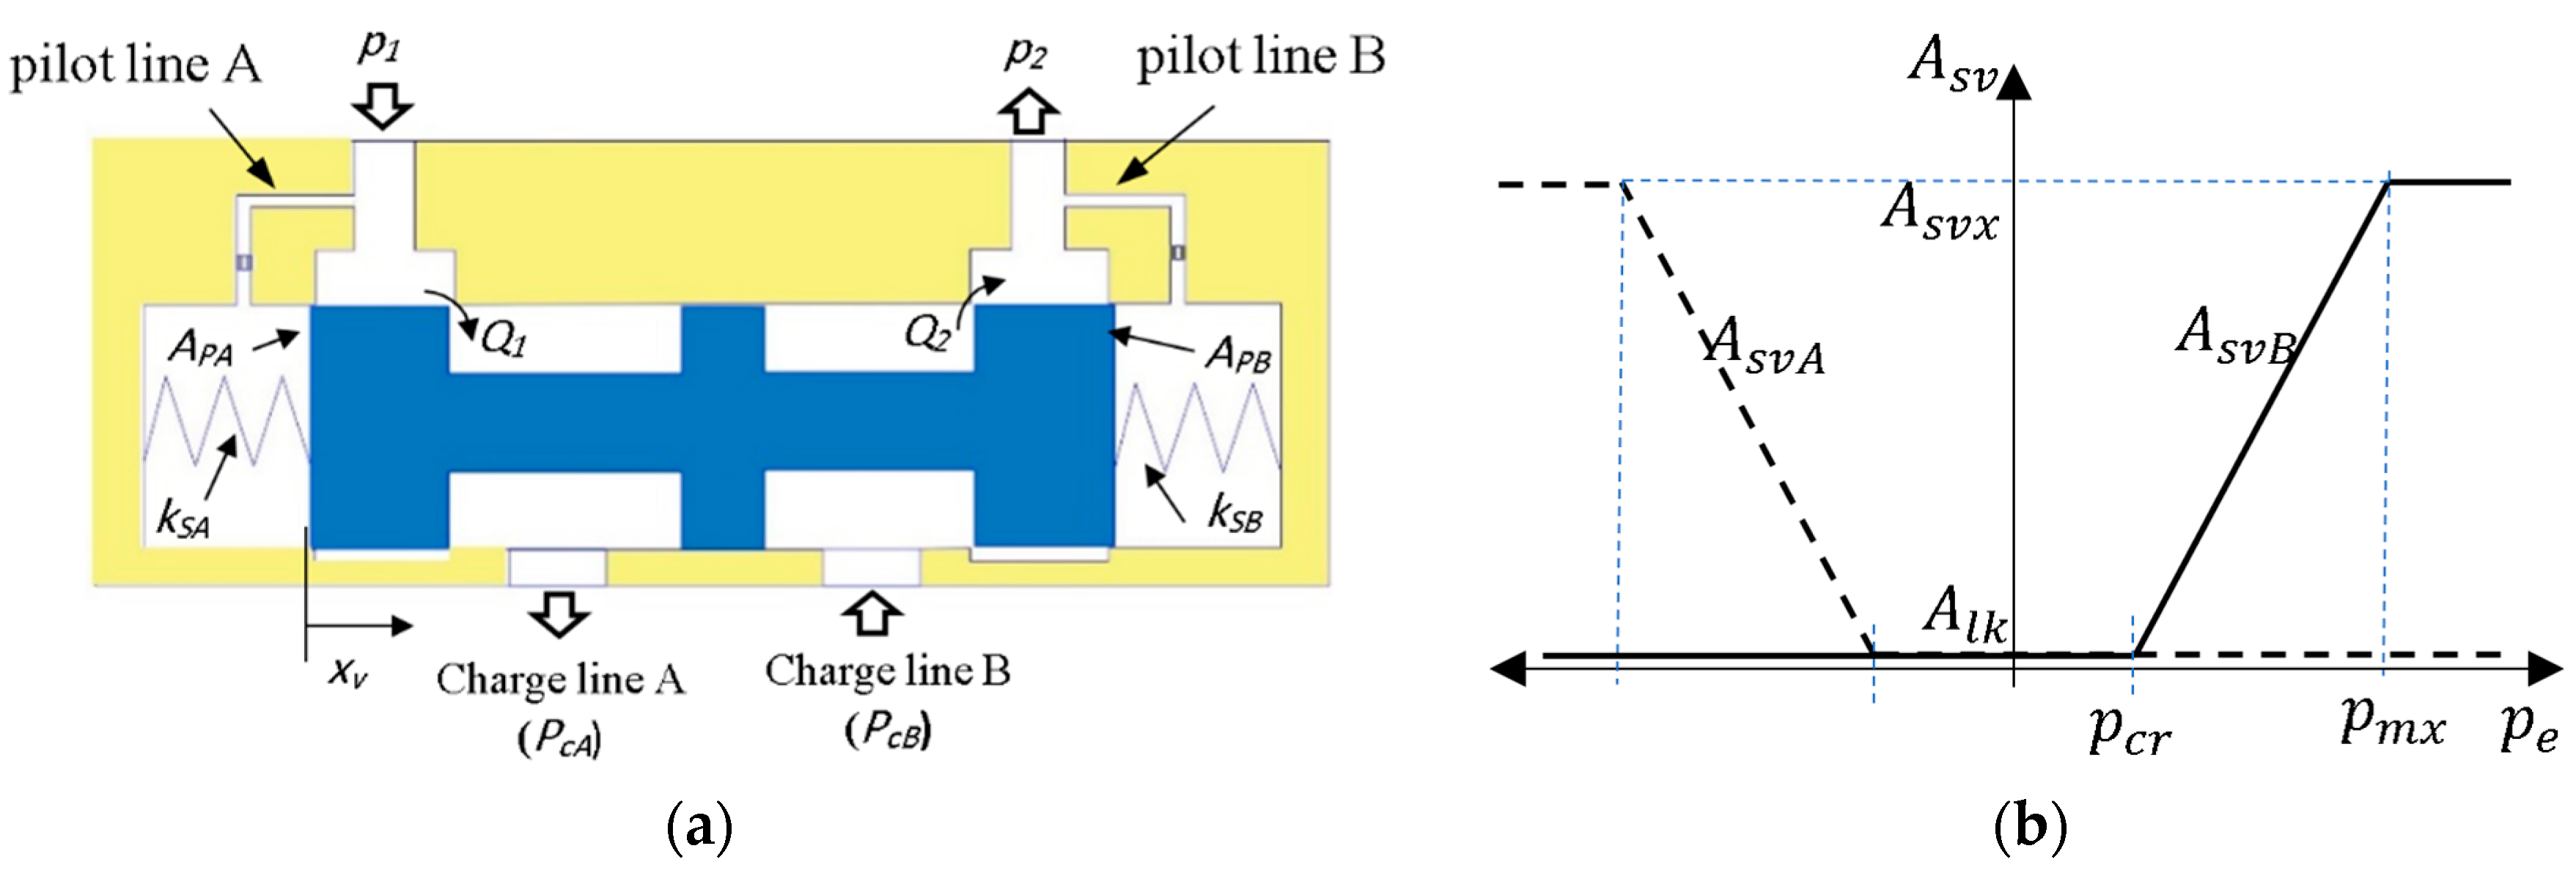
3. Extension of Approach to Circuits that Utilize Shuttle Valves
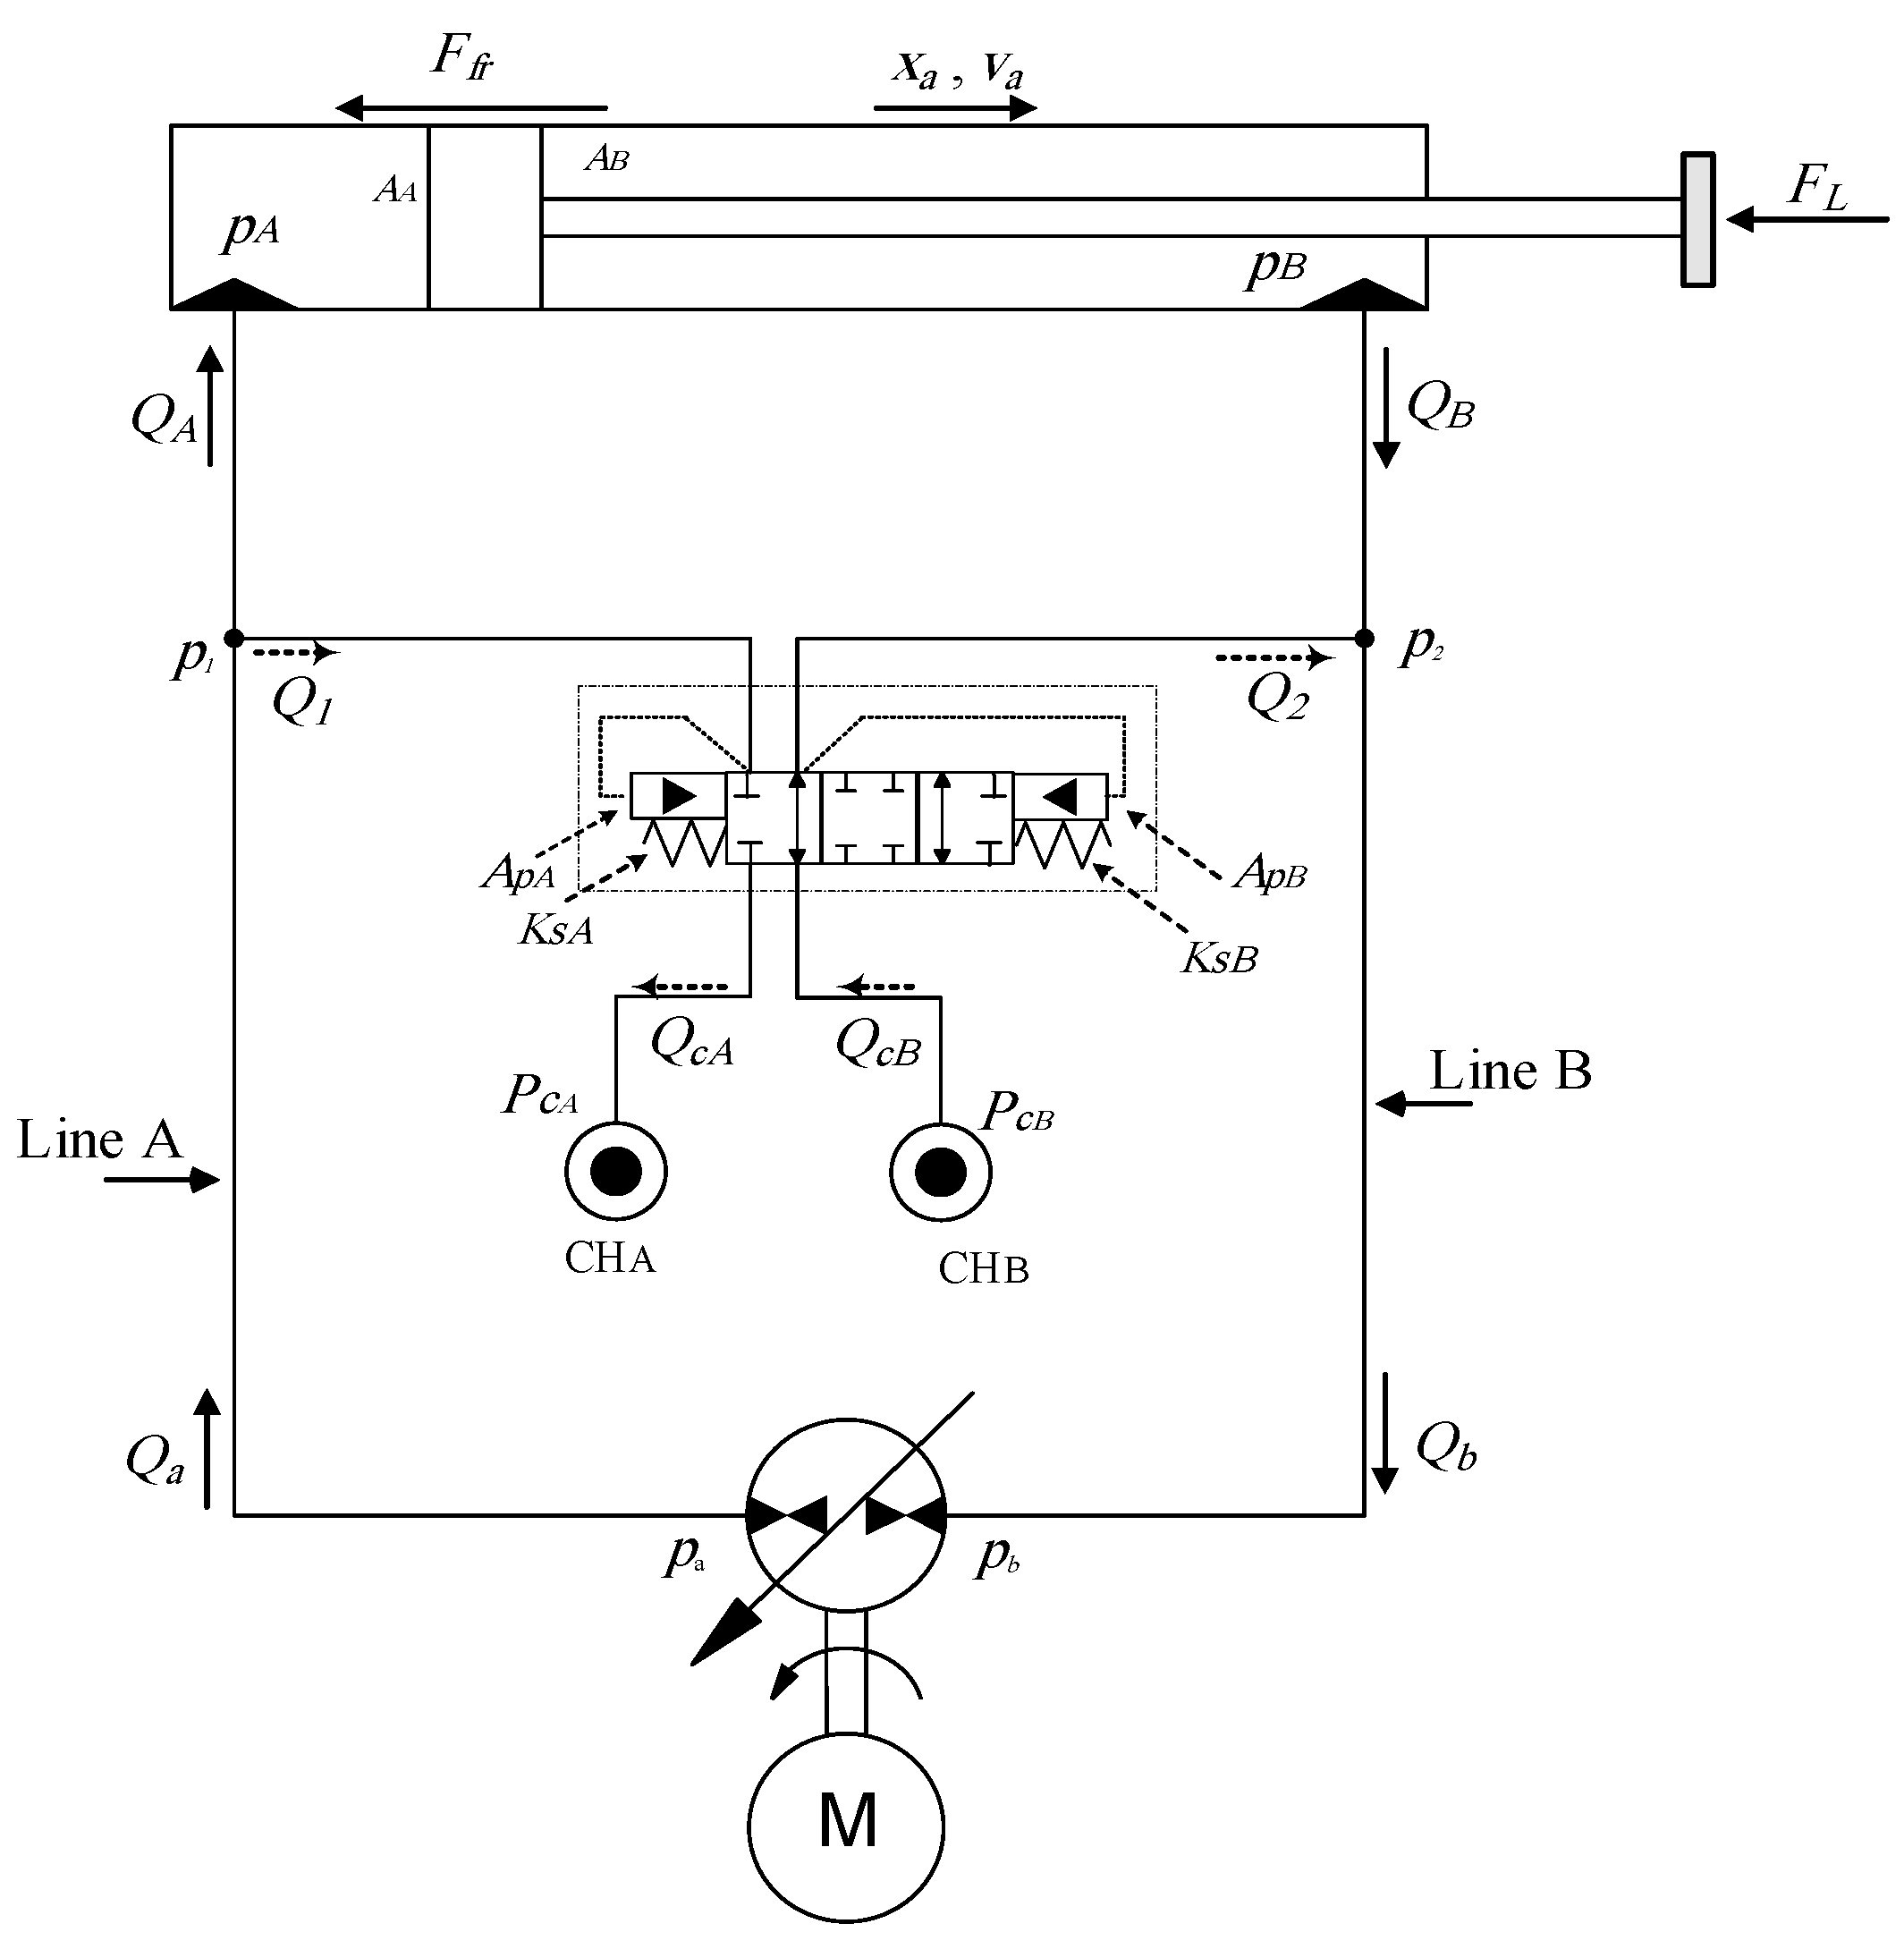
3.1. Mathematical Model
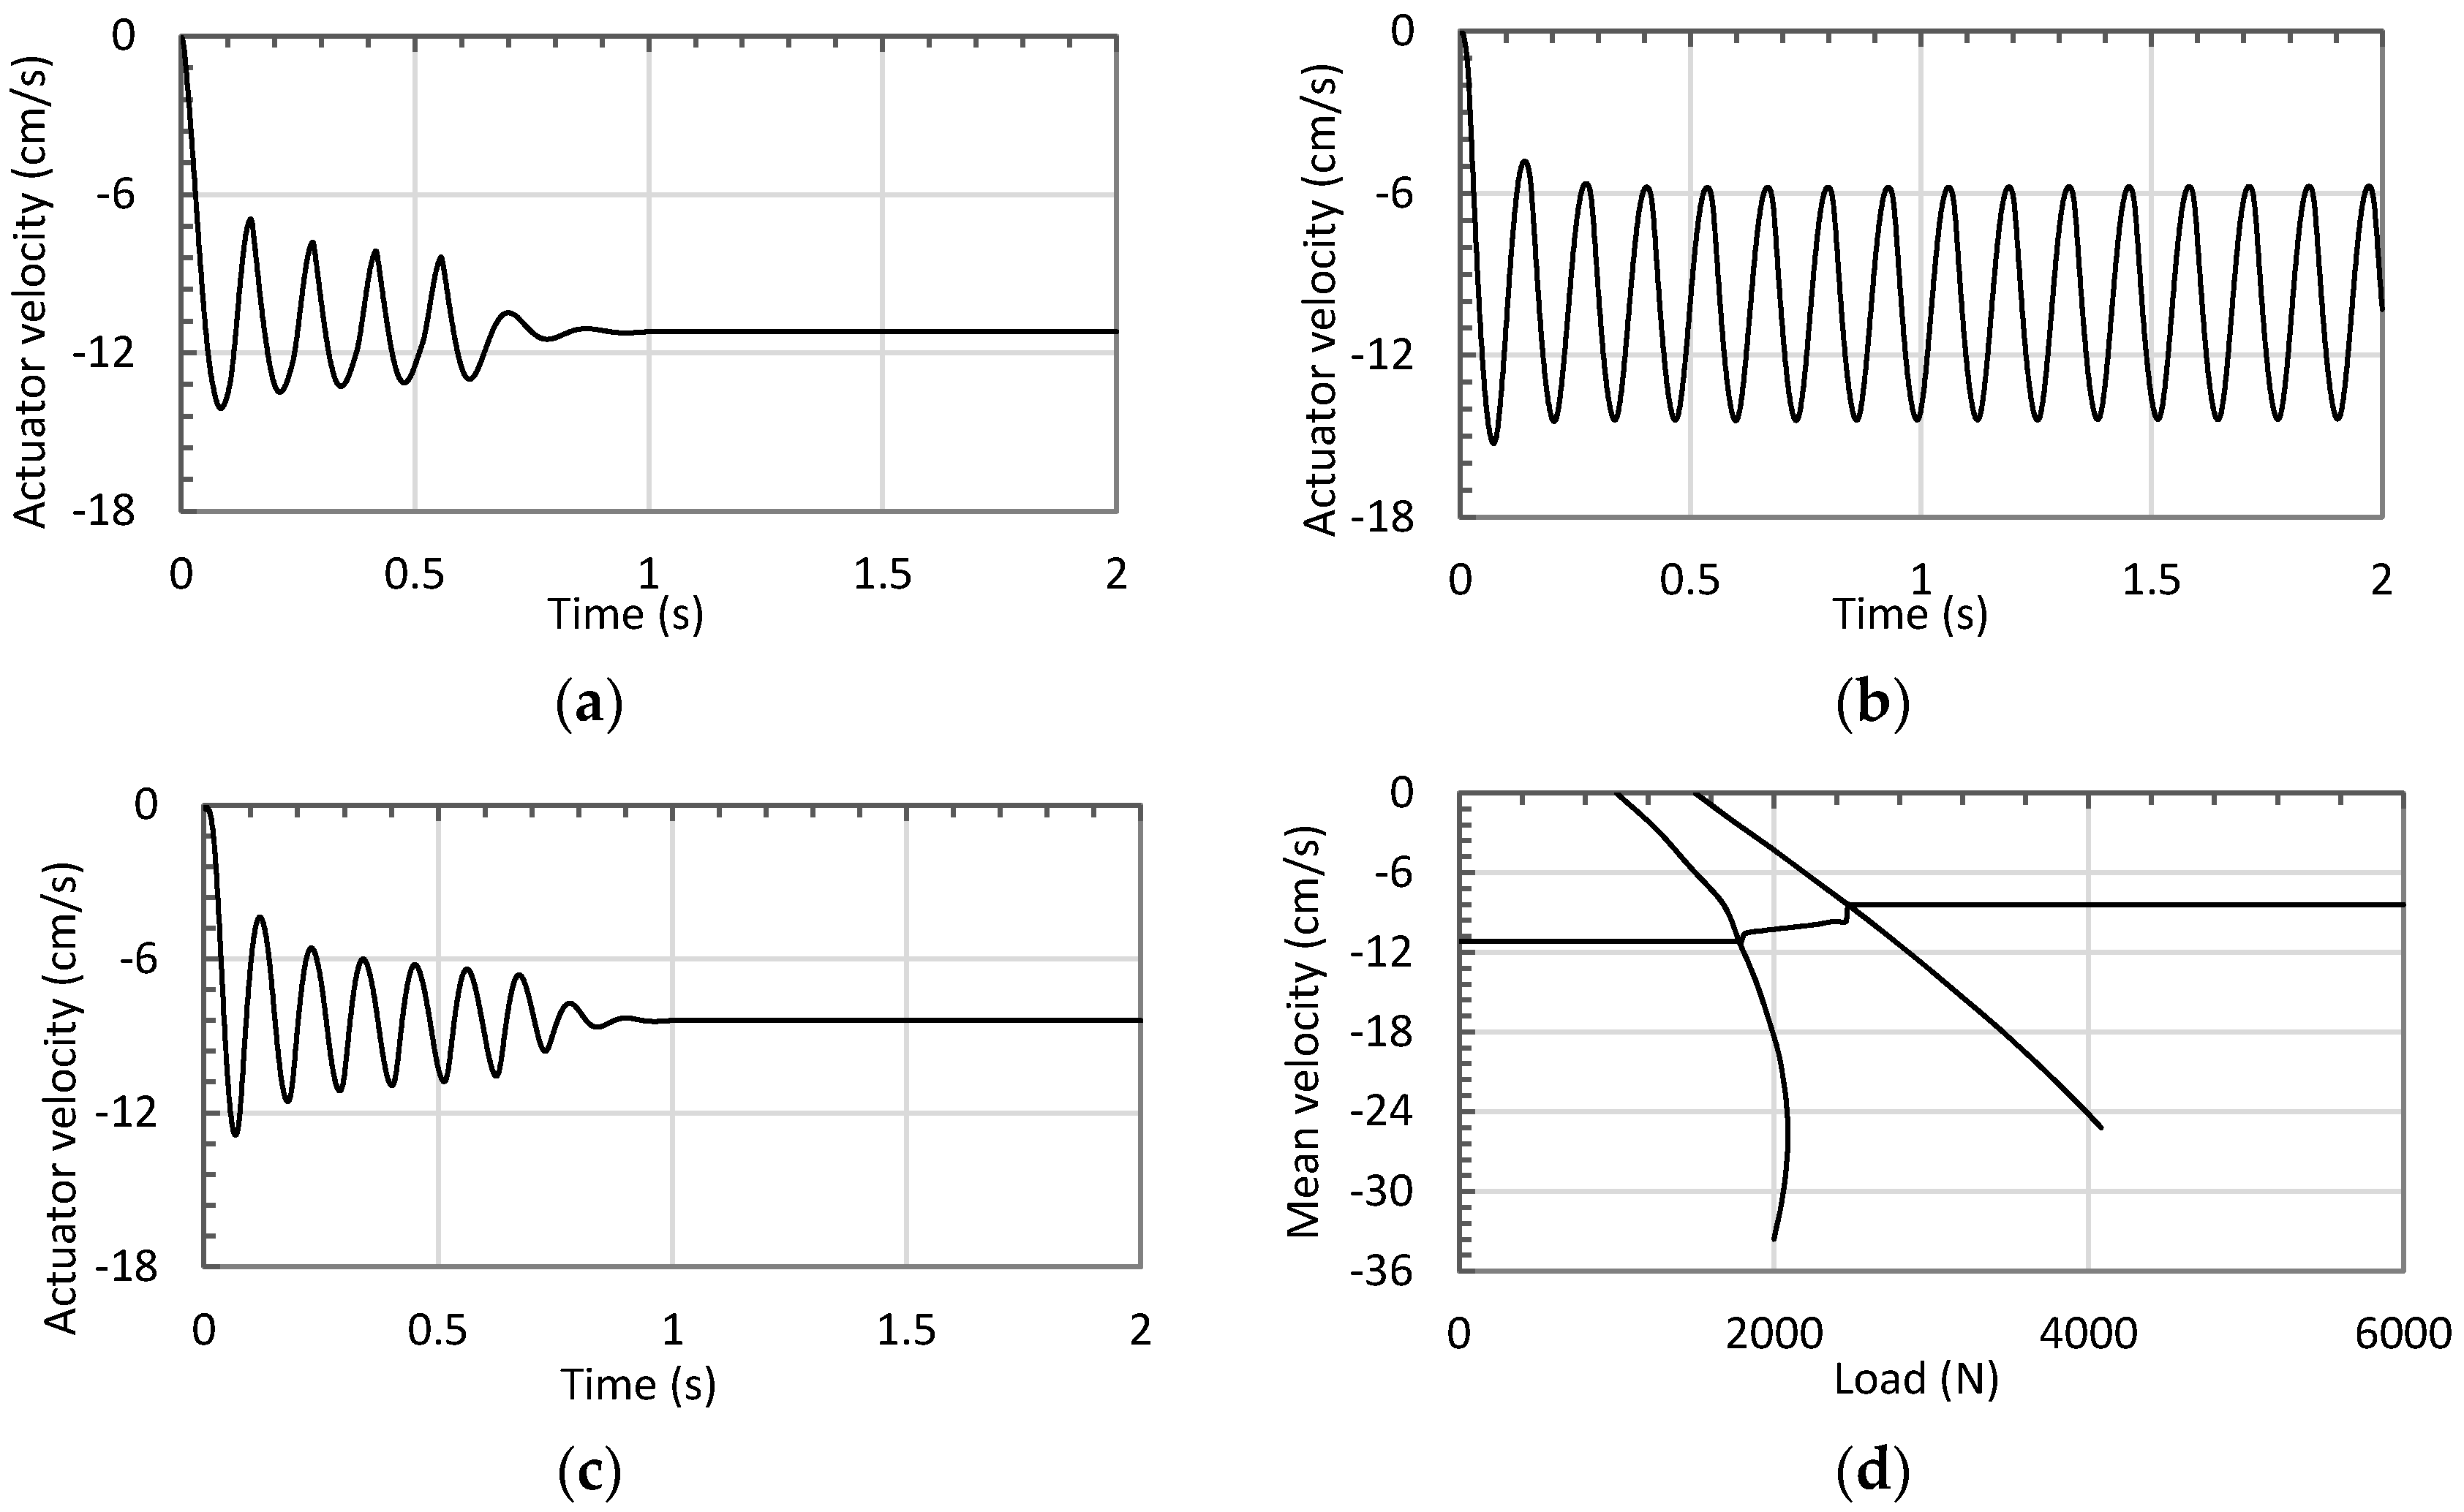
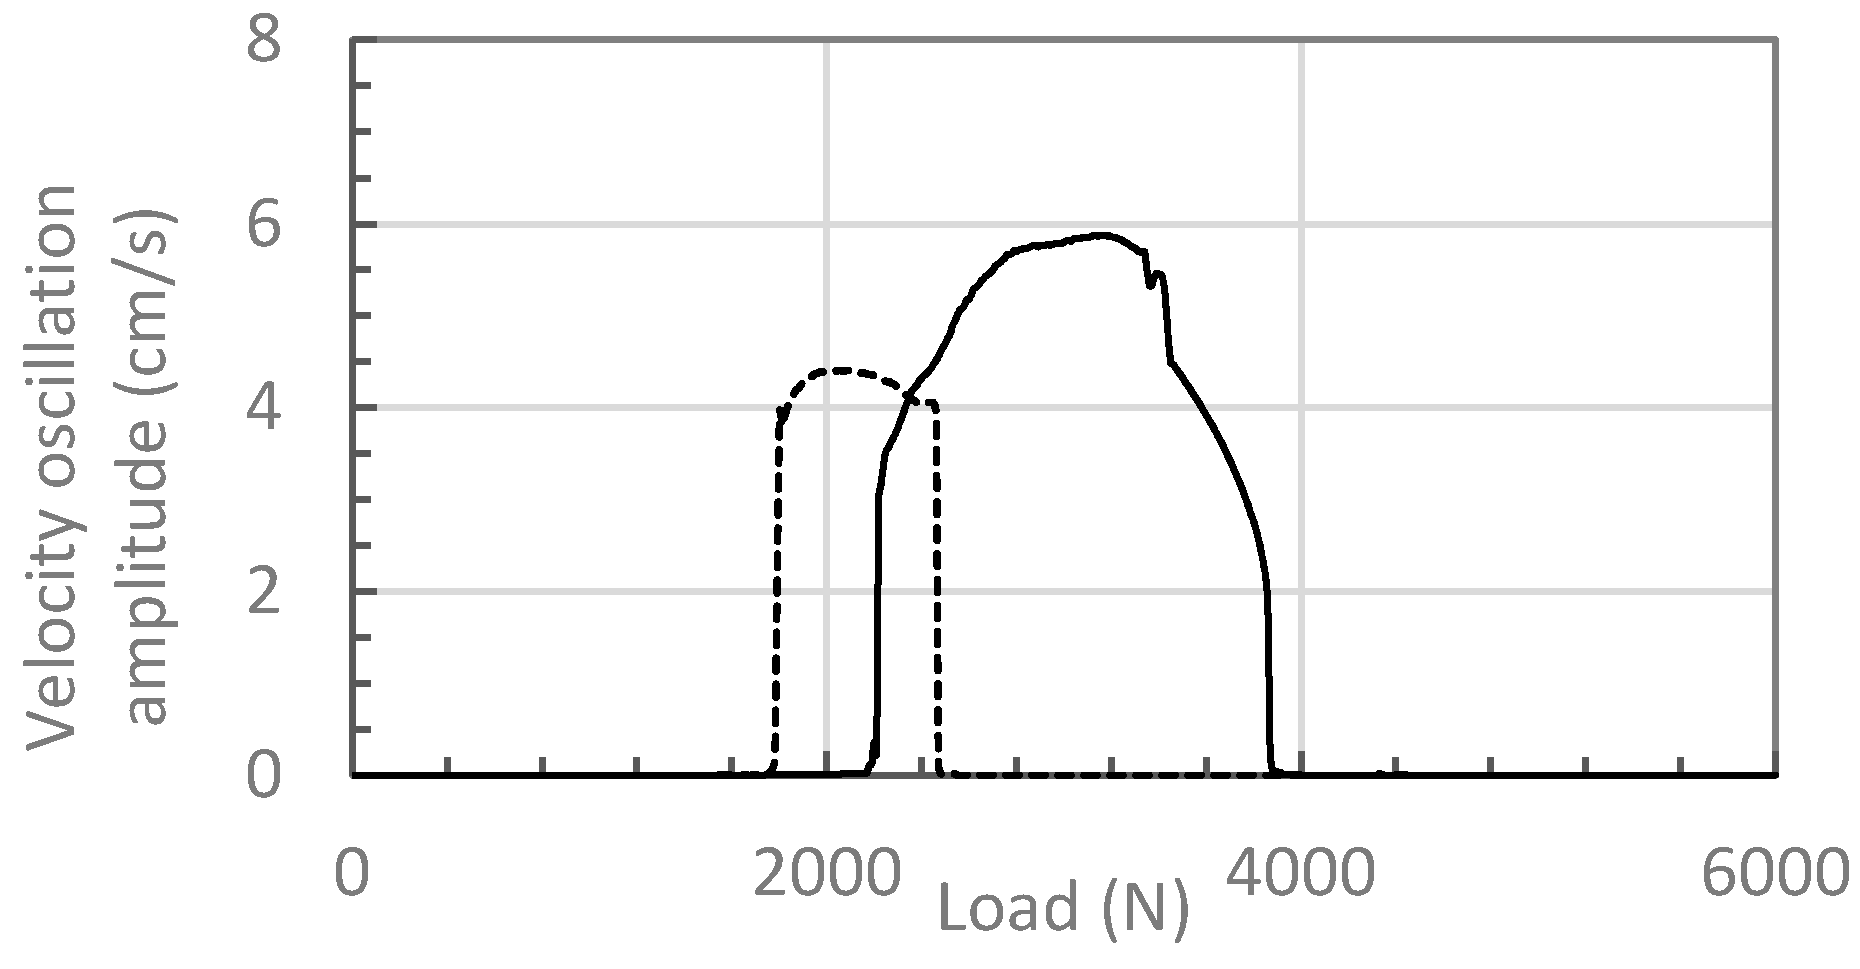
3.2. Simulation Sen, opening area otudies
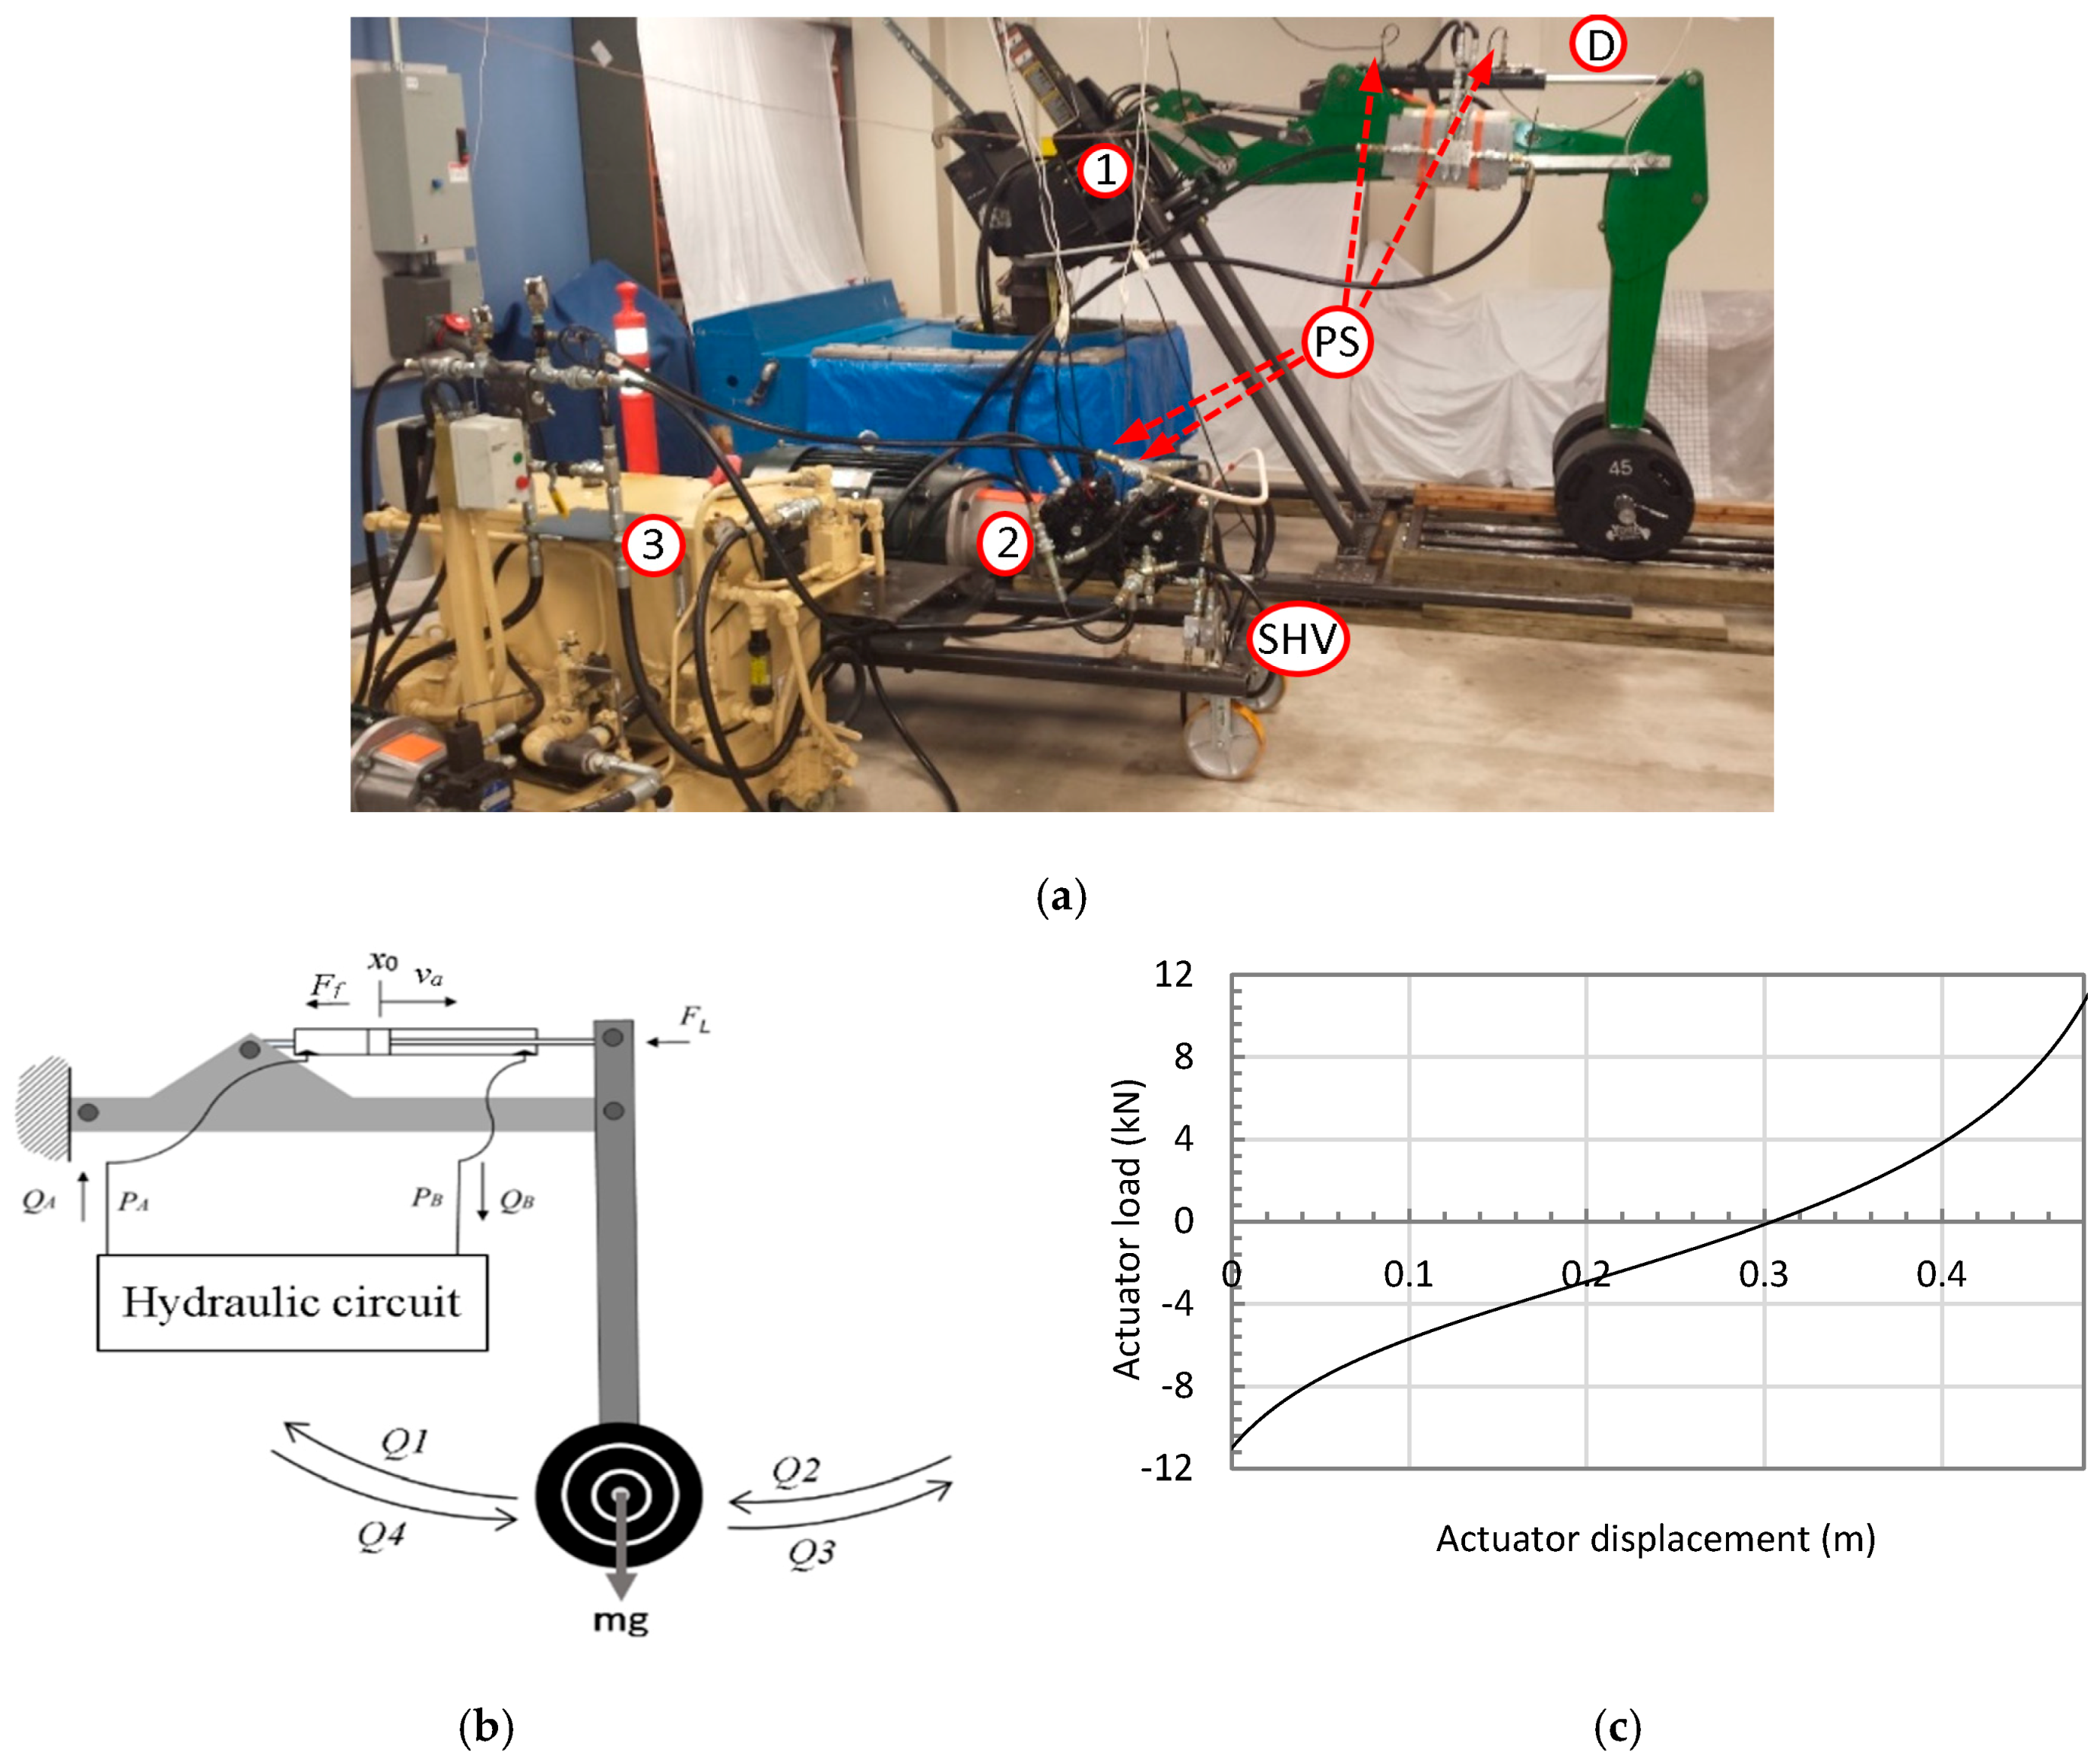
4. Experimental Evaluations
5. Conclusions
Author Contributions
Acknowledgments
Conflicts of Interest
References
- Ritelli, G.F.; Vacca, A. Energetic and dynamic impact of counterbalance valves in fluid power machines. Energy Convers. Manag. 2013, 76, 701–711. [Google Scholar] [CrossRef]
- Zemmerman, J.D.; Pelosi, M.; Williamson, C.A.; Ivantysynova, M. Energy consumption of an LS excavator hydraulic system. In Proceedings of the ASME International Mechanical Engineering Congress and Exposition (IMECE), Seattle, WA, USA, 11–15 November 2007; pp. 117–126. [Google Scholar]
- Imam, A.; Rafiq, M.; Jalayeri, E.; Sepehri, N. Design, implementation and evaluation of a pump-controlled circuit for single rod actuators. Actuators 2017, 6, 10. [Google Scholar] [CrossRef]
- Cleasby, K.G.; Plummer, A.R. A novel high efficiency electrohydrostatic flight simulator motion system. In Proceedings of the Symposium on Fluid Power and Motion Control (FPMC 2008), Bath, UK, 10–12 September 2008; pp. 437–449. [Google Scholar]
- Zimmerman, J.D. Toward Optimal Multi-Actuator Displacement Controlled Mobile Hydraulic Systems. Ph.D. Thesis, Purdue University, West Lafayette, IN, USA, 2012. [Google Scholar]
- Imam, A.; Rafiq, M.; Jalayeri, E.; Sepehri, N. A pump-controlled circuit for single-rod cylinders that incorporates limited throttling compensating Valves. Actuators 2018, 7, 13. [Google Scholar] [CrossRef]
- Li, J.; Fu, Y.; Wang, Z.; Zhang, G. Research on fast response and high accuracy control of an airborne electro hydrostatic actuation system. In Proceedings of the 2004 International Conference on Intelligence, Mechatronics and Automotion, Changdu, China, 26–31 August 2004. [Google Scholar]
- Bossche, D. The A380 flight control electrohydrostatic actuators, achievements and lessons learnt. In Proceedings of the 25th International Congress of Aeronautical Sciences, Hamburg, Germany, 3–8 September 2006. [Google Scholar]
- Hewett, A. Hydraulic Circuit Flow Control. U.S. Patent 5,329,767, 19 July 1994. [Google Scholar]
- Ivantysynova, M. The swash plate machine for displacement control unit with great development potentiality. In Proceedings of the First International Fluid Technology Colloqium (IFK), Aachen, Germany, 17–18 March 1998. [Google Scholar]
- Wang, L.; Book, W.J.; Huggins, J.D. A hydraulic circuit for single rod cylinder. J. Dyn. Syst. Meas. Control ASME 2012, 134, 011019. [Google Scholar] [CrossRef]
- Jalayeri, E.; Imam, A.; Zeljko, T.; Sepehri, N. A throttle-less single-rod hydraulic cylinder positioning system: Design and experimental evaluation. Adv. Mech. Eng. 2015, 7, 1–14. [Google Scholar] [CrossRef]
- Caliskan, H.; Balkan, T.; Platin, B.E. A complete analysis and a novel solution for instability in pump controlled asymmetric actuators. J. Dyn. Syst. Meas. Control 2015, 137, 091008. [Google Scholar] [CrossRef]
- Rahmfeld, R.; Ivantysynova, M. Displacement controlled linear actuator with differential cylinder—A way to save primary energy in mobile machines. In Proceedings of the 5th International Conference on Fluid Power Transmission and Control (ICFP’2001), Hangzhou, China, 3–5 April 2001. [Google Scholar]
- Williamson, C.; Ivantysynova, M. Pump mode prediction for four-quadrant velocity control of valveless hydraulic actuators. In Proceedings of the 7th JFPS International Symposium on Fluid Power, Toyama, Japan, 15–18 September 2008; pp. 323–328. [Google Scholar]
- Michel, S.; Weber, J. Electrohydraulic compact-drives for low power applications considering energy-efficiency and high inertial loads. In Proceedings of the 7th FPNI PhD Symposium on Fluid Power, Reggio Emilia, Italy, 27–30 June 2012; pp. 869–888. [Google Scholar]
- MathWorks. Available online: https://www.mathworks.com/help/physmod/hydro/ref/cylinderfriction.html?requestedDomain=www.mathworks.com (accessed on 1 December 2018).
- Williamson, C. Power Management for Multi-Actuator Mobile Machines with Displacement Controlled Hydraulic. Ph.D. Thesis, University of Purdue, West lafayette, IN, USA, 2010. [Google Scholar]
- Merritt, H.E. Hydraulic Control Systems; John Wily and Sons: New York, NY, USA, 1967. [Google Scholar]


| Parameter | Definition | Values |
|---|---|---|
| Common Values | ||
| Area of piston cap side | 31.67 × 10⁻⁴ [m2] | |
| Area of piston rod side | 23.75 × 10⁻⁴ [m2] | |
| Actuator area ratio | 0.75 | |
| Seal pre-loading force | 400 [N] | |
| Oil bulk modulus | 0.689 × 10⁹ [Pa] | |
| Linearized coefficient for pump flow | 133 × 10−6 [m3/s/V] | |
| Initial oil volume at side A of the circuit | 0.008 [m3] | |
| Initial oil volume at side B of the circuit | 0.006 [m3] | |
| Coulomb friction coefficient | 0.0001 [N/Pa] | |
| Viscous friction coefficient | 10000 [N/m/s] | |
| Equivalent mass | 400 [kg] | |
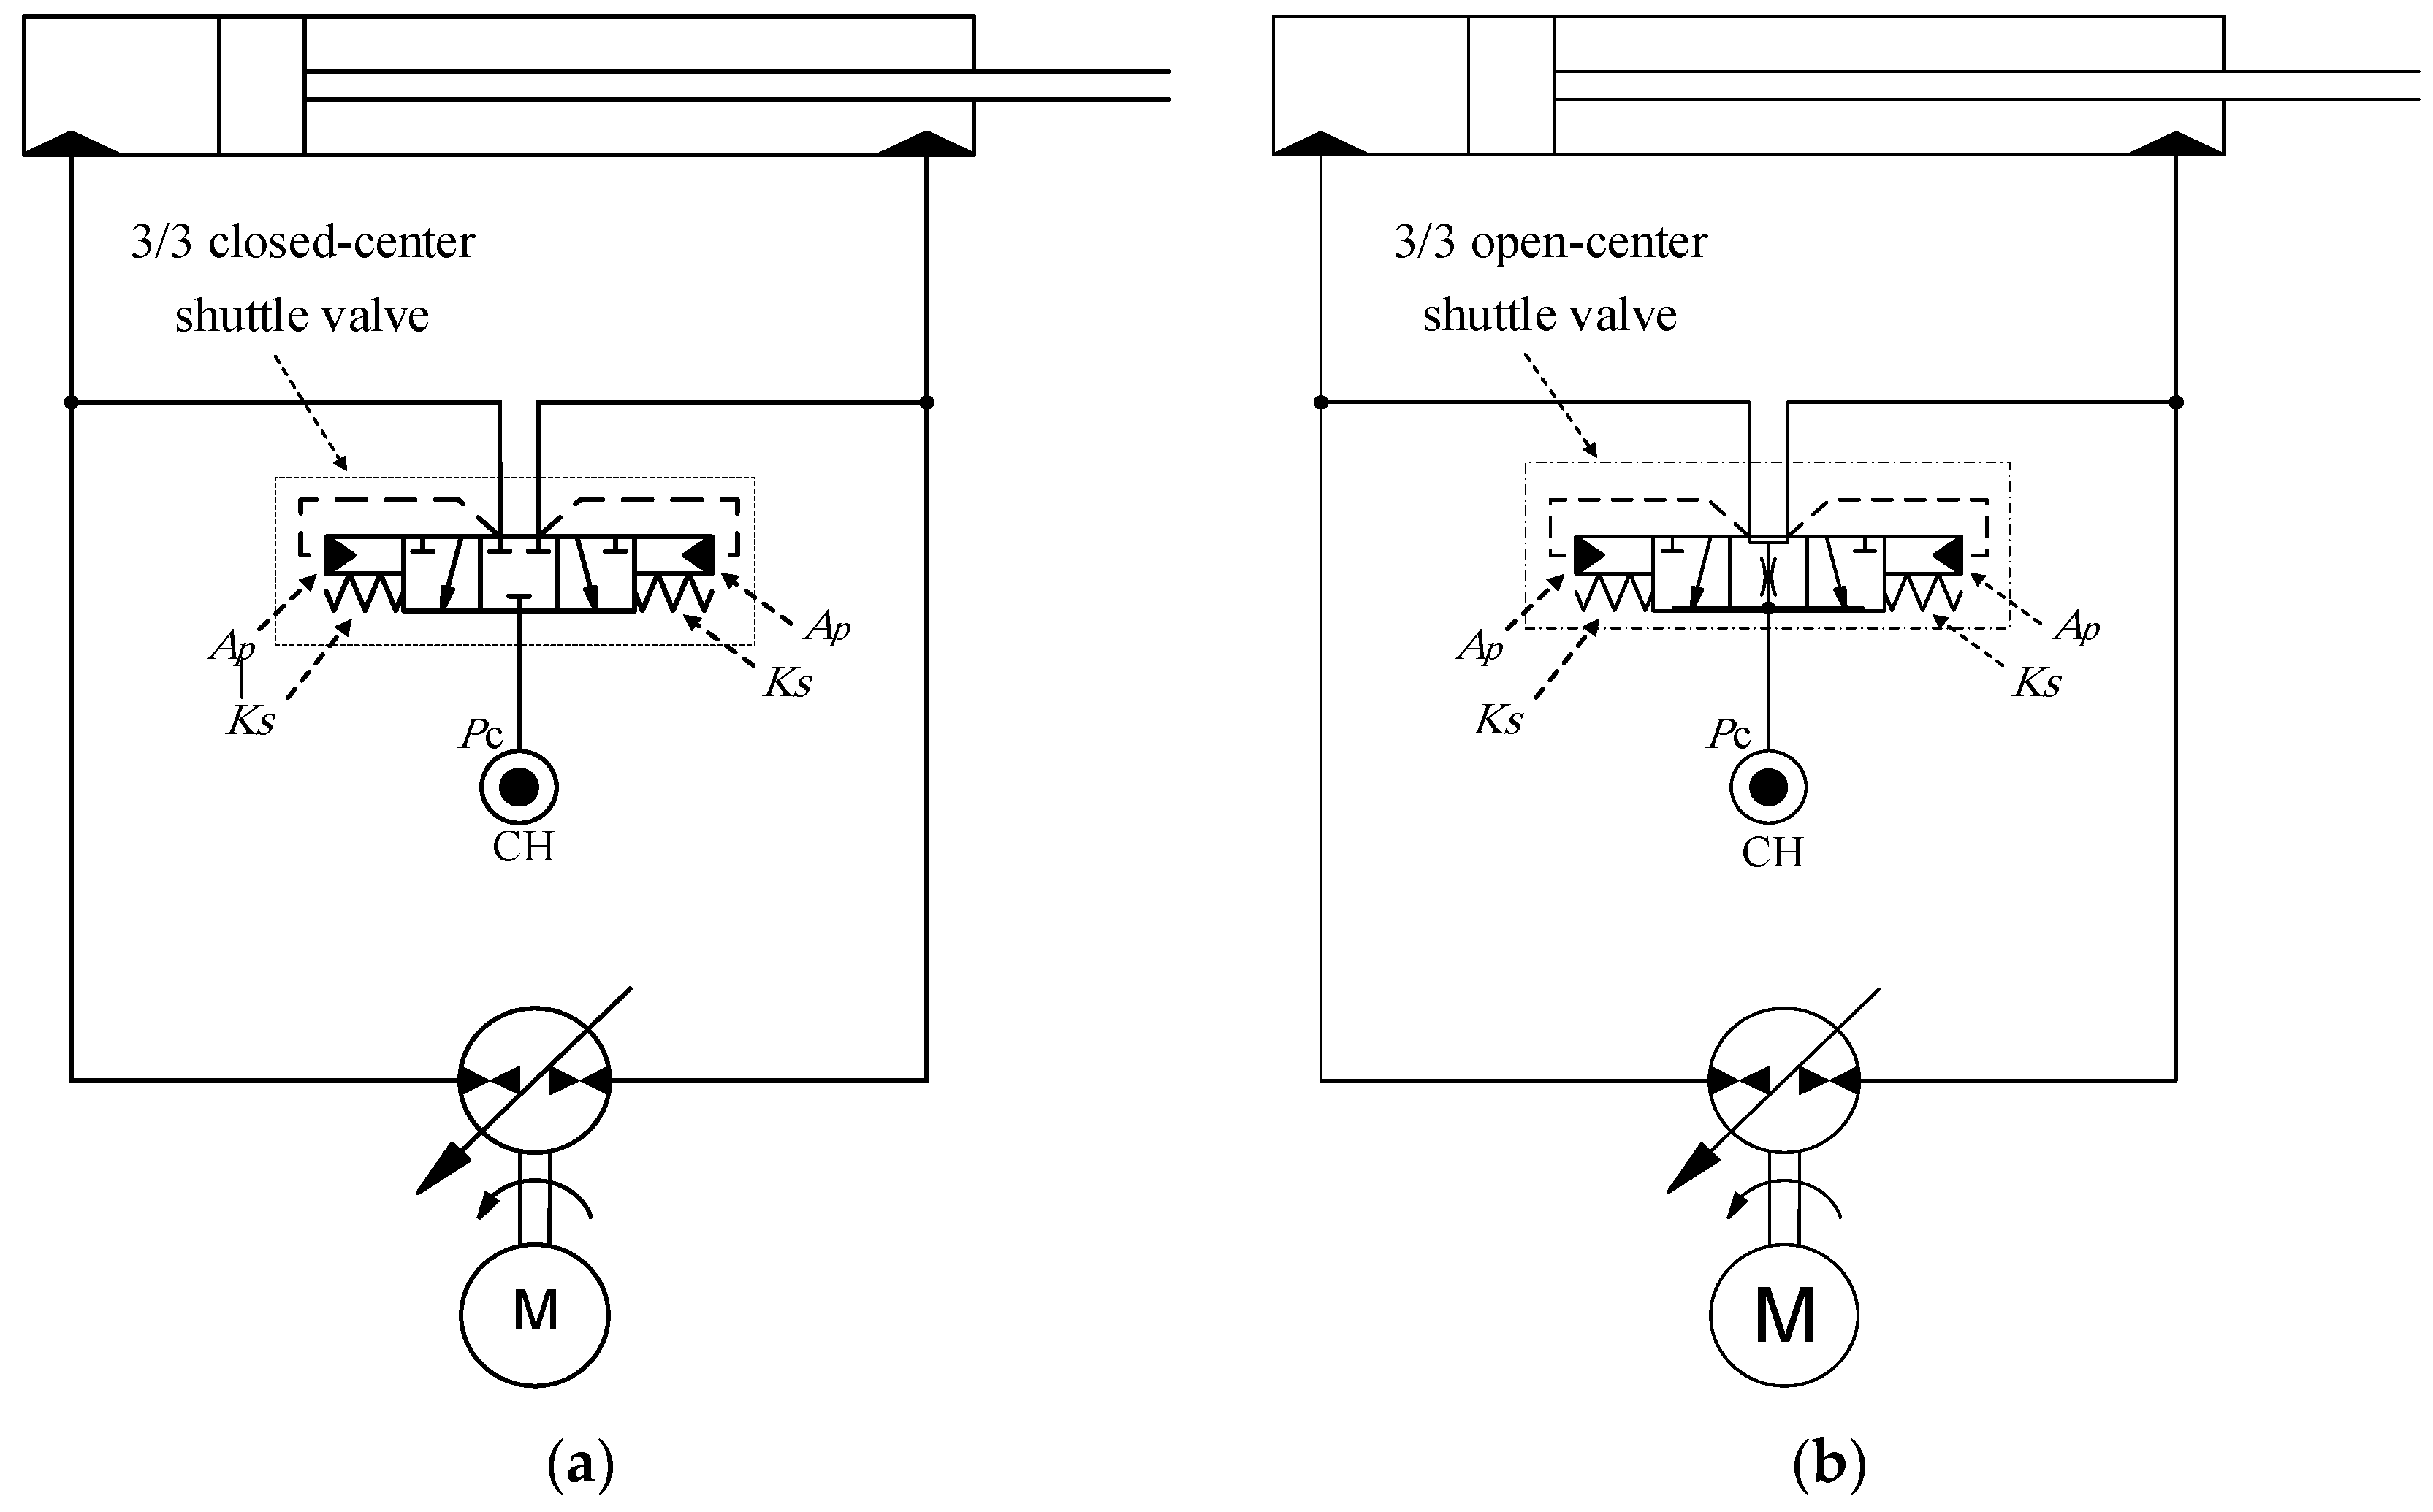
| Parameters for Figure 1: | ||
| Valve cracking pressure | 0.2 [MPa] | |
| Charger pressure | 1.38 [MPa] | |
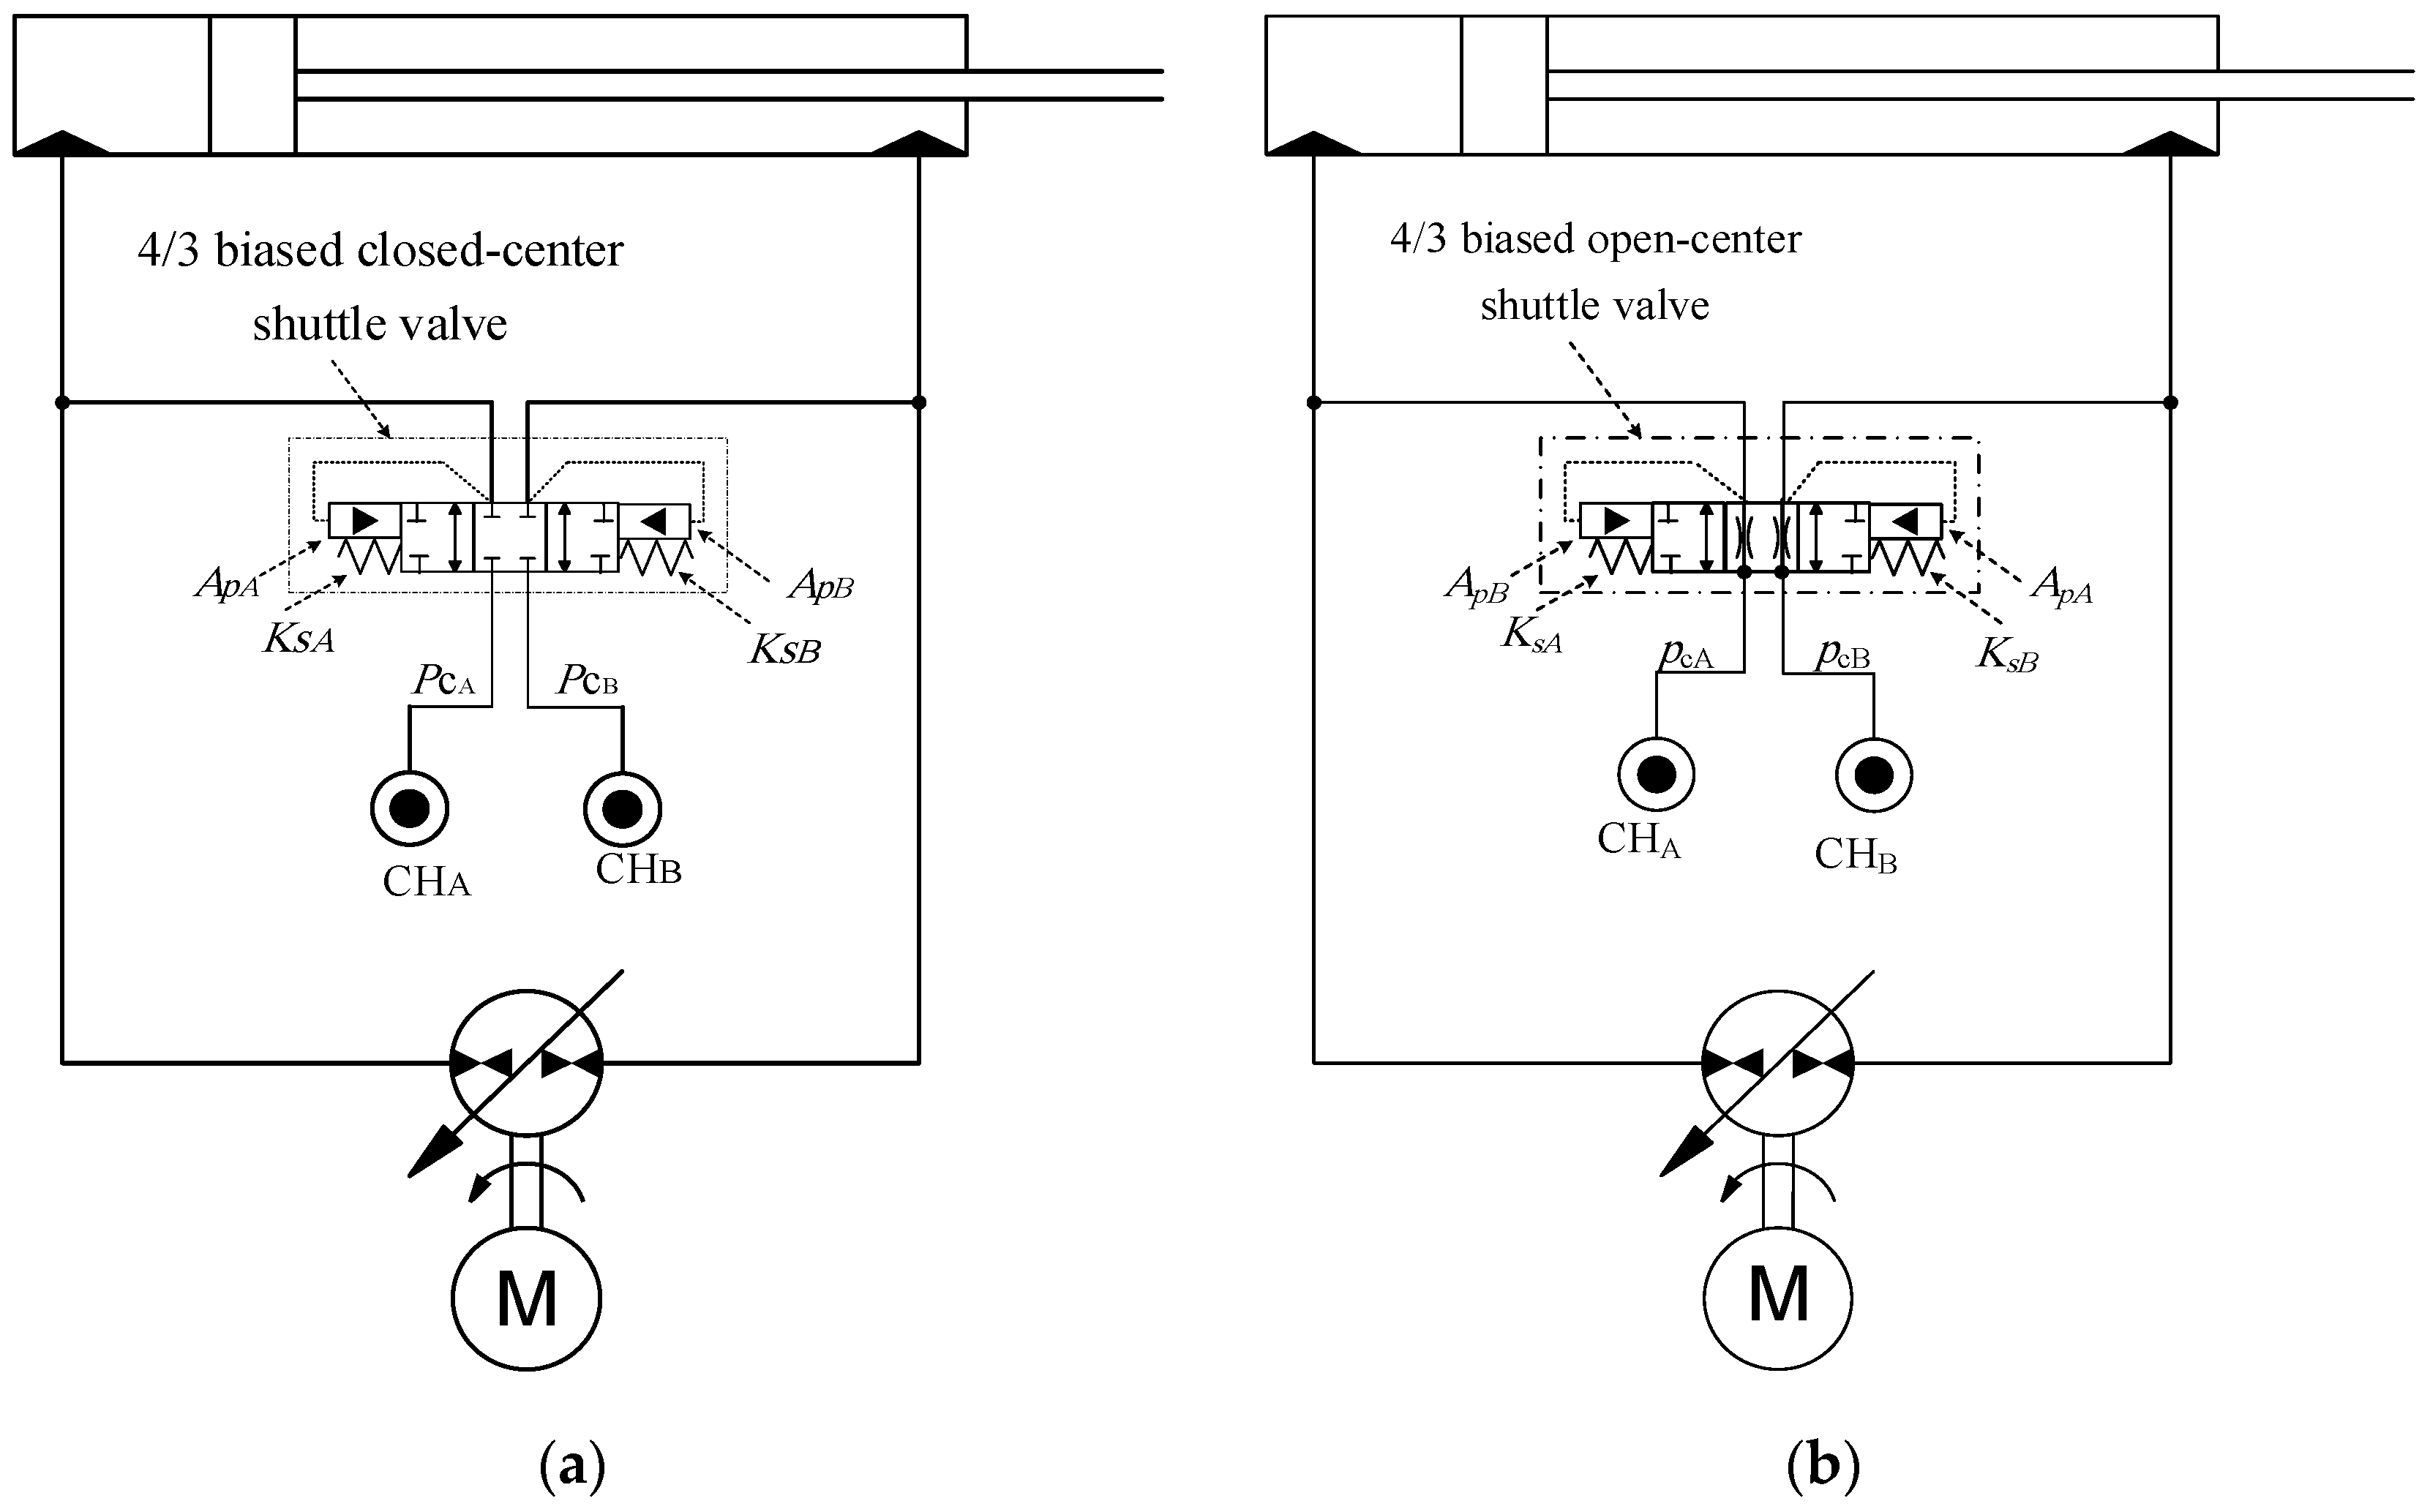
| Parameters for Figure 2: | ||
| POCVA cracking pressure | 0.2 [MPa] | |
| POCVB cracking pressure | 0.2 [MPa] | |
| Side A charger pressure | 1.16 [MPa] | |
| Side B charger pressure | 1.54 [MPa] | |
| Main Components | Specification | |
|---|---|---|
| 1 | JD-48 actuator cap-side area, area ratio, and stroke | , 0.75, 55 cm. |
| 2 | Main pump unit | 28 electrically controlled variable swash plate piston pump (Sauer-Danfoss 42 series) derived by a 50 hp, 1775 rpm induction motor (Toshiba 320 TC). |
| 3 | Charge pump unit | 180-284 psi adjustable pressure vane pump (Northman VPVC-F40-A1) |
| DS | Displacement sensor | Bourns, accuracy 5 μm. |
| PS | Pressure transducer | Ashcroft K1, accuracy 0.5% at 3000 psi |
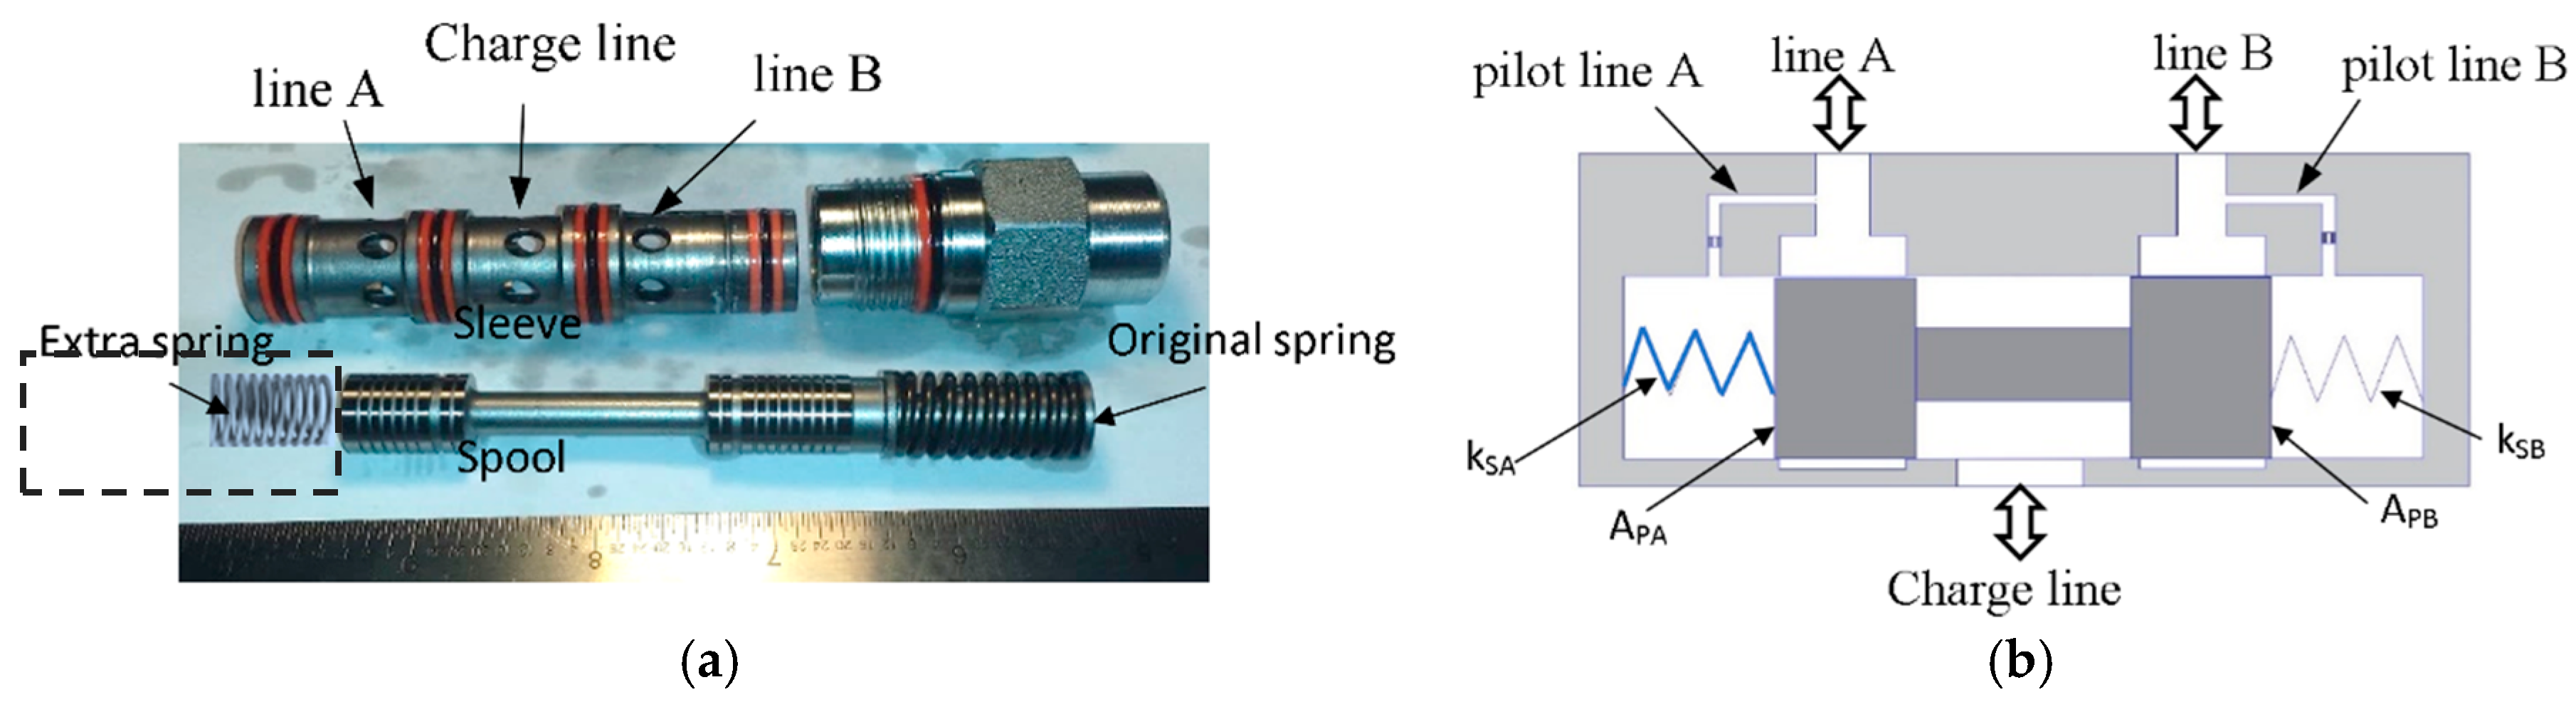
| CC-SHV | Shuttle valve, closed-center | Parker model: K04F3, cracking pressure 37 psi. |
| OC-SHV | Shuttle valve, open-center | Sunhydraulics model: DSCL, cracking pressure 30 psi. |
© 2019 by the authors. Licensee MDPI, Basel, Switzerland. This article is an open access article distributed under the terms and conditions of the Creative Commons Attribution (CC BY) license (http://creativecommons.org/licenses/by/4.0/).
Share and Cite
Imam, A.; Rafiq, M.; Zeljko, T.; Sepehri, N. Improving the Performance of Pump-Controlled Circuits for Single-Rod Actuators. Actuators 2019, 8, 26. https://doi.org/10.3390/act8010026
Imam A, Rafiq M, Zeljko T, Sepehri N. Improving the Performance of Pump-Controlled Circuits for Single-Rod Actuators. Actuators. 2019; 8(1):26. https://doi.org/10.3390/act8010026
Chicago/Turabian StyleImam, Ahmed, Moosa Rafiq, Tomas Zeljko, and Nariman Sepehri. 2019. "Improving the Performance of Pump-Controlled Circuits for Single-Rod Actuators" Actuators 8, no. 1: 26. https://doi.org/10.3390/act8010026
APA StyleImam, A., Rafiq, M., Zeljko, T., & Sepehri, N. (2019). Improving the Performance of Pump-Controlled Circuits for Single-Rod Actuators. Actuators, 8(1), 26. https://doi.org/10.3390/act8010026