Article

Application of a Nonlinear Hammerstein-Wiener Estimator in the Development and Control of a Magnetorheological Fluid Haptic Device for Robotic Bone Biopsy

1
Department of Mechanical and Industrial Engineering, University of Toronto, 5 King’s College Road, Room 106, Toronto, ON M5S3G8, Canada
2
Division of Neurosurgery, The Hospital for Sick Children, 555 University Avenue, Room 1504, Toronto, ON M5G1X8, Canada
3
Institute of Biomaterials and Biomedical Engineering, University of Toronto, Rosebrugh Building, 164 College Street, Room 407, Toronto, ON M5S3G9, Canada
*
Author to whom correspondence should be addressed.
Actuators 2018, 7(4), 83; https://doi.org/10.3390/act7040083
Submission received: 16 August 2018 / Revised: 13 November 2018 / Accepted: 21 November 2018 / Published: 1 December 2018

Abstract

:
A force generator module (FGM) based on magnetorheological fluid (MRF) was developed to provide force-feedback information for applications in tele-robotic bone biopsy procedures. The FGM is capable of rapidly re-producing a wide range of forces that are common in bone biopsy applications. As a result of the nonlinear nature of MRF, developing robust controllers for these mechanisms can be challenging. In this paper, we present a case study motivated by robotic bone biopsy. We use a non-linear Hammerstein-Wiener (H-W) estimator to address this challenge. The case is presented through three studies. First, an experiment to develop design constraints is presented and describes biopsy force measurements for various animal tissues. Required output forces were found to range between <1 N and <50 N. A second study outlines the design of the FGM and presents the experimental characterization of the hysteretic behavior of the MRF. This data is then used as estimators and validators to develop the nonlinear Hammerstein-Wiener (H-W) model of the MRF. Validation experiments found that the H-W model is capable of predicting the behavior of the MRF device with 95% accuracy and can eliminate hysteresis in a closed-loop control system. The third study demonstrates the FGM used in a 1-DOF haptic controller in a simulated robotic bone-biopsy. The H-W control tracked the input signal while compensating for magnetic hysteresis to achieve optimal performance. In conclusion, the MRF-based device can be used in surgical robotic operations that require a high range of force measurements.

1. Introduction

Telerobotic surgery is being increasingly applied to a variety of medical procedures. Such systems provide haptic feedback to the operator to realistically transmit tissue interactions for safe and appropriate manipulation. However, current haptic interfaces have several shortcomings that limit their use in medical applications such as a bone biopsy. For example, many existing medical haptic devices currently used are intended for soft tissue manipulation. In applications such as bone biopsies, surgeons must penetrate both soft tissue and hard tissue and, therefore, require haptic technologies capable of rapidly shifting between the sensation of small and large forces that would be associated with such tissues. There is no commercially available device that reliably provides such performance. Consequently, robot-assisted bone biopsy surgeries are currently performed in two steps. First, robot guidance is used to approach the biopsy site through soft tissue and then the robot is stopped and the second phase of performing the cortical bone biopsy is continued manually [1]. This two-step approach is inefficient and can introduce errors, which may present risks to patients.
Frequently, surgeons report the lack of effective haptic feedback as a major limitation in current robotic surgeries [2]. The inability to detect applied force often leads to increased forces applied through the device, which results in tissue trauma and potential complications. Wager and Howe [3] reported that force sensation reduces tissue damage risk, which is indexed by the level of applied force.
Many of the current tele-robotic systems available rely on graphical visual display rather than direct haptic force-feedback to convey information to the surgeon. Although substantial information about environmental properties and forces can be acquired through visual observations of the surgical instrument, it would be preferable to depend less on visual cues and more on force sensation. This is particularly true for “blind” operations such as biopsy where the visual distortions of the tissue may be less apparent and, therefore, less helpful for inferring applied tissue forces.
To overcome these limitations for robotic bone biopsy, it is necessary to develop a haptic device that can render a high dynamic range of forces while maintaining high accuracy. This paper presents the development of a prototype force generator module (FGM (FGM refers to the force-generating module that we have designed and built based on the MRF. This is a naming convention used solely for this study. FGM consists of a 1 DOF mechanism.)) based on magnetorheological fluid (MRF (MRFs refers to a magnetorheological fluid in general.)) that can be used in constructing future haptic force-feedback devices for tele-operated surgical robots.
An MRF is a suspension of micron-sized ferromagnetic particles in a nonmagnetic carrier fluid whose rheological characteristics change continuously and reversibly within a few milliseconds in response to external magnetic fields [4,5]. Some examples of haptic interfaces and rehabilitation devices based on MRFs have been utilized in medical applications outlined in References [6,7,8,9]. Magnetorheological fluids offer the following advantages: First, they rapidly respond to magnetic field changes within 10–30 ms [10] and they are capable of reversibly shifting from free-flowing liquids to semisolids. These features make MRFs suitable for mimicking the tissue interactions that need to be transmitted by surgical haptic devices [4]. Moreover, MRF devices are controlled intrinsically by adjusting the magnetic field intensity applied to them [11] and the electromagnets, which generate the magnetic field around the MRF, can be controlled with a low-voltage power supply (2–24 V, 1–2 A) and power amplitudes between 2 W and 50 W [4,12]. These features can simplify the mechanism design while offering a wide range of output forces. In general, MRFs operate with magnetic fields in the range of 0.1–0.4 T.
In this work, we present a series of three studies that progressively build to outline the development of a force generating module (FGM) for use in constructing haptic feedback master-manipulators for bone-biopsy procedures. The first study focuses on the collection of design constraints through the characterization of the tissue forces experienced in robotic bone-biopsy. Although many studies present tissue force data, there exists no dedicated experimental investigation of maximum penetration force in a bone biopsy procedure. Furthermore, continuous force-signals are required for the development of non-linear controllers to predict the behavior of MRF. As a result, we describe an experiment that is used to obtain this data. These results are compared to previous work as a reference. For example, Ong and Bouazza-Marouf (2000) [13] reported bone biopsy forces ranging from 2 N to 50 N in porcine femurs. Alam et al. reported bovine femoral shaft force measurements of 25 N to 85 N [14] and Lee et al. [15] reported an abrupt decrease in force beyond the depth of a pilot hole while drilling into bone.
The second study outlines the development of the FGM including its physical construction, a description of the modelling techniques used to predict the behavior of the non-linear MRF, and validation experiments. MRF-based devices have been extensively integrated in a variety of mechanical devices especially with robotics applications [16,17,18]. Furthermore, rehabilitation devices and haptic interfaces based on MRFs have been utilized in many medical applications. In Reference [19], Ahmadkhanlou et al. developed an MRF-based damper in a steer-by-wire vehicle that provides haptic feedback to the driver. The study in Reference [7] describes a 2-DOF MRF-based joystick for virtual reality applications. Additionally, a semi-active high-performance 2-DOF MRF-based display was developed by Yamaguchi [8]. Through these studies, various methods have been proposed to model the non-linear behavior of MRF by using both parametric and nonparametric techniques.
Parametric models are favored because they are easy to implement [20]. The most common parametric models include the Bingham model, the Bouc-Wen model, and phenomenological models [21,22,23]. However, parametric models based on physical elements can be divergent if initial assumptions are incorrect or if appropriate parameter constraints are not applied [24]. Furthermore, for MRF devices, it can be difficult to account for nonlinear and hysteretic behaviors using these parametric techniques and this approach often requires substantial computational time, which yields lower accuracy solutions in practice.
Alternatively, nonparametric modeling approaches such as interpolation techniques [25] and neural-based methods [26] employ analytical expressions to describe the characteristics of a modeled device. Nonparametric models are robust to linear, nonlinear, and hysteretic systems and, therefore, they are better able to predict the dynamic responses of MRF-based devices. However, their modelling architecture and training methods are complex. Thus, in this study, we propose the use of a nonlinear black-box model to overcome the disadvantages of these conventional approaches.
Block-oriented models are established based on limited knowledge of the underlying physics or dynamics of the system [27], which simplifies their modelling architecture and training methods. Therefore, block-oriented models have a low cost of identification, are appropriate for control design [28], and are preferred for nonlinear systems because they provide flexible parameterization for nonlinear systems [29]. One such approach is the nonlinear Hammerstein-Wiener (H-W) model.
The third study presented in this work describes the development of a feedback control strategy. Previous studies used the force feedback sensor and magnetic induction measurement imbedded in their system to eliminate and reduce off-state force of the MRF-based device [30]. In this study, we are using the H-W model as an estimator. This study investigates the utility of incorporating the FGM into a master-slave configuration for tele-robotic bone biopsy.
The primary contributions of this work include the following: First, experiments that characterize the tissue-forces expected for bone-biopsy, which provide important design constraints for developing similar haptic devices. Second, the detailed design of an MRF based device is an improvement to prior work [31]. Third, a detailed description of the H-W black-box modeling strategy is used to predict the behavior of the MRF as well as experimental characterization of the model’s performance when it is applied to the FGM. Fourth, a feedback control strategy is proposed and its performance when the FGM is applied in a telerobotic setup for biopsying ex vivo tissue samples is assessed.

2. Materials and Methods

2.1. Study One: Biopsy Tissue-Force Characterization

This section describes experiments used to characterize the forces required in the bone biopsy. The forces required for soft tissue and bone manipulation were previously characterized in Reference [32]. However, to develop the FGM, a continuous set of data that closely replicates the surgical conditions is required. This section describes the experimental methods used to collect this information.

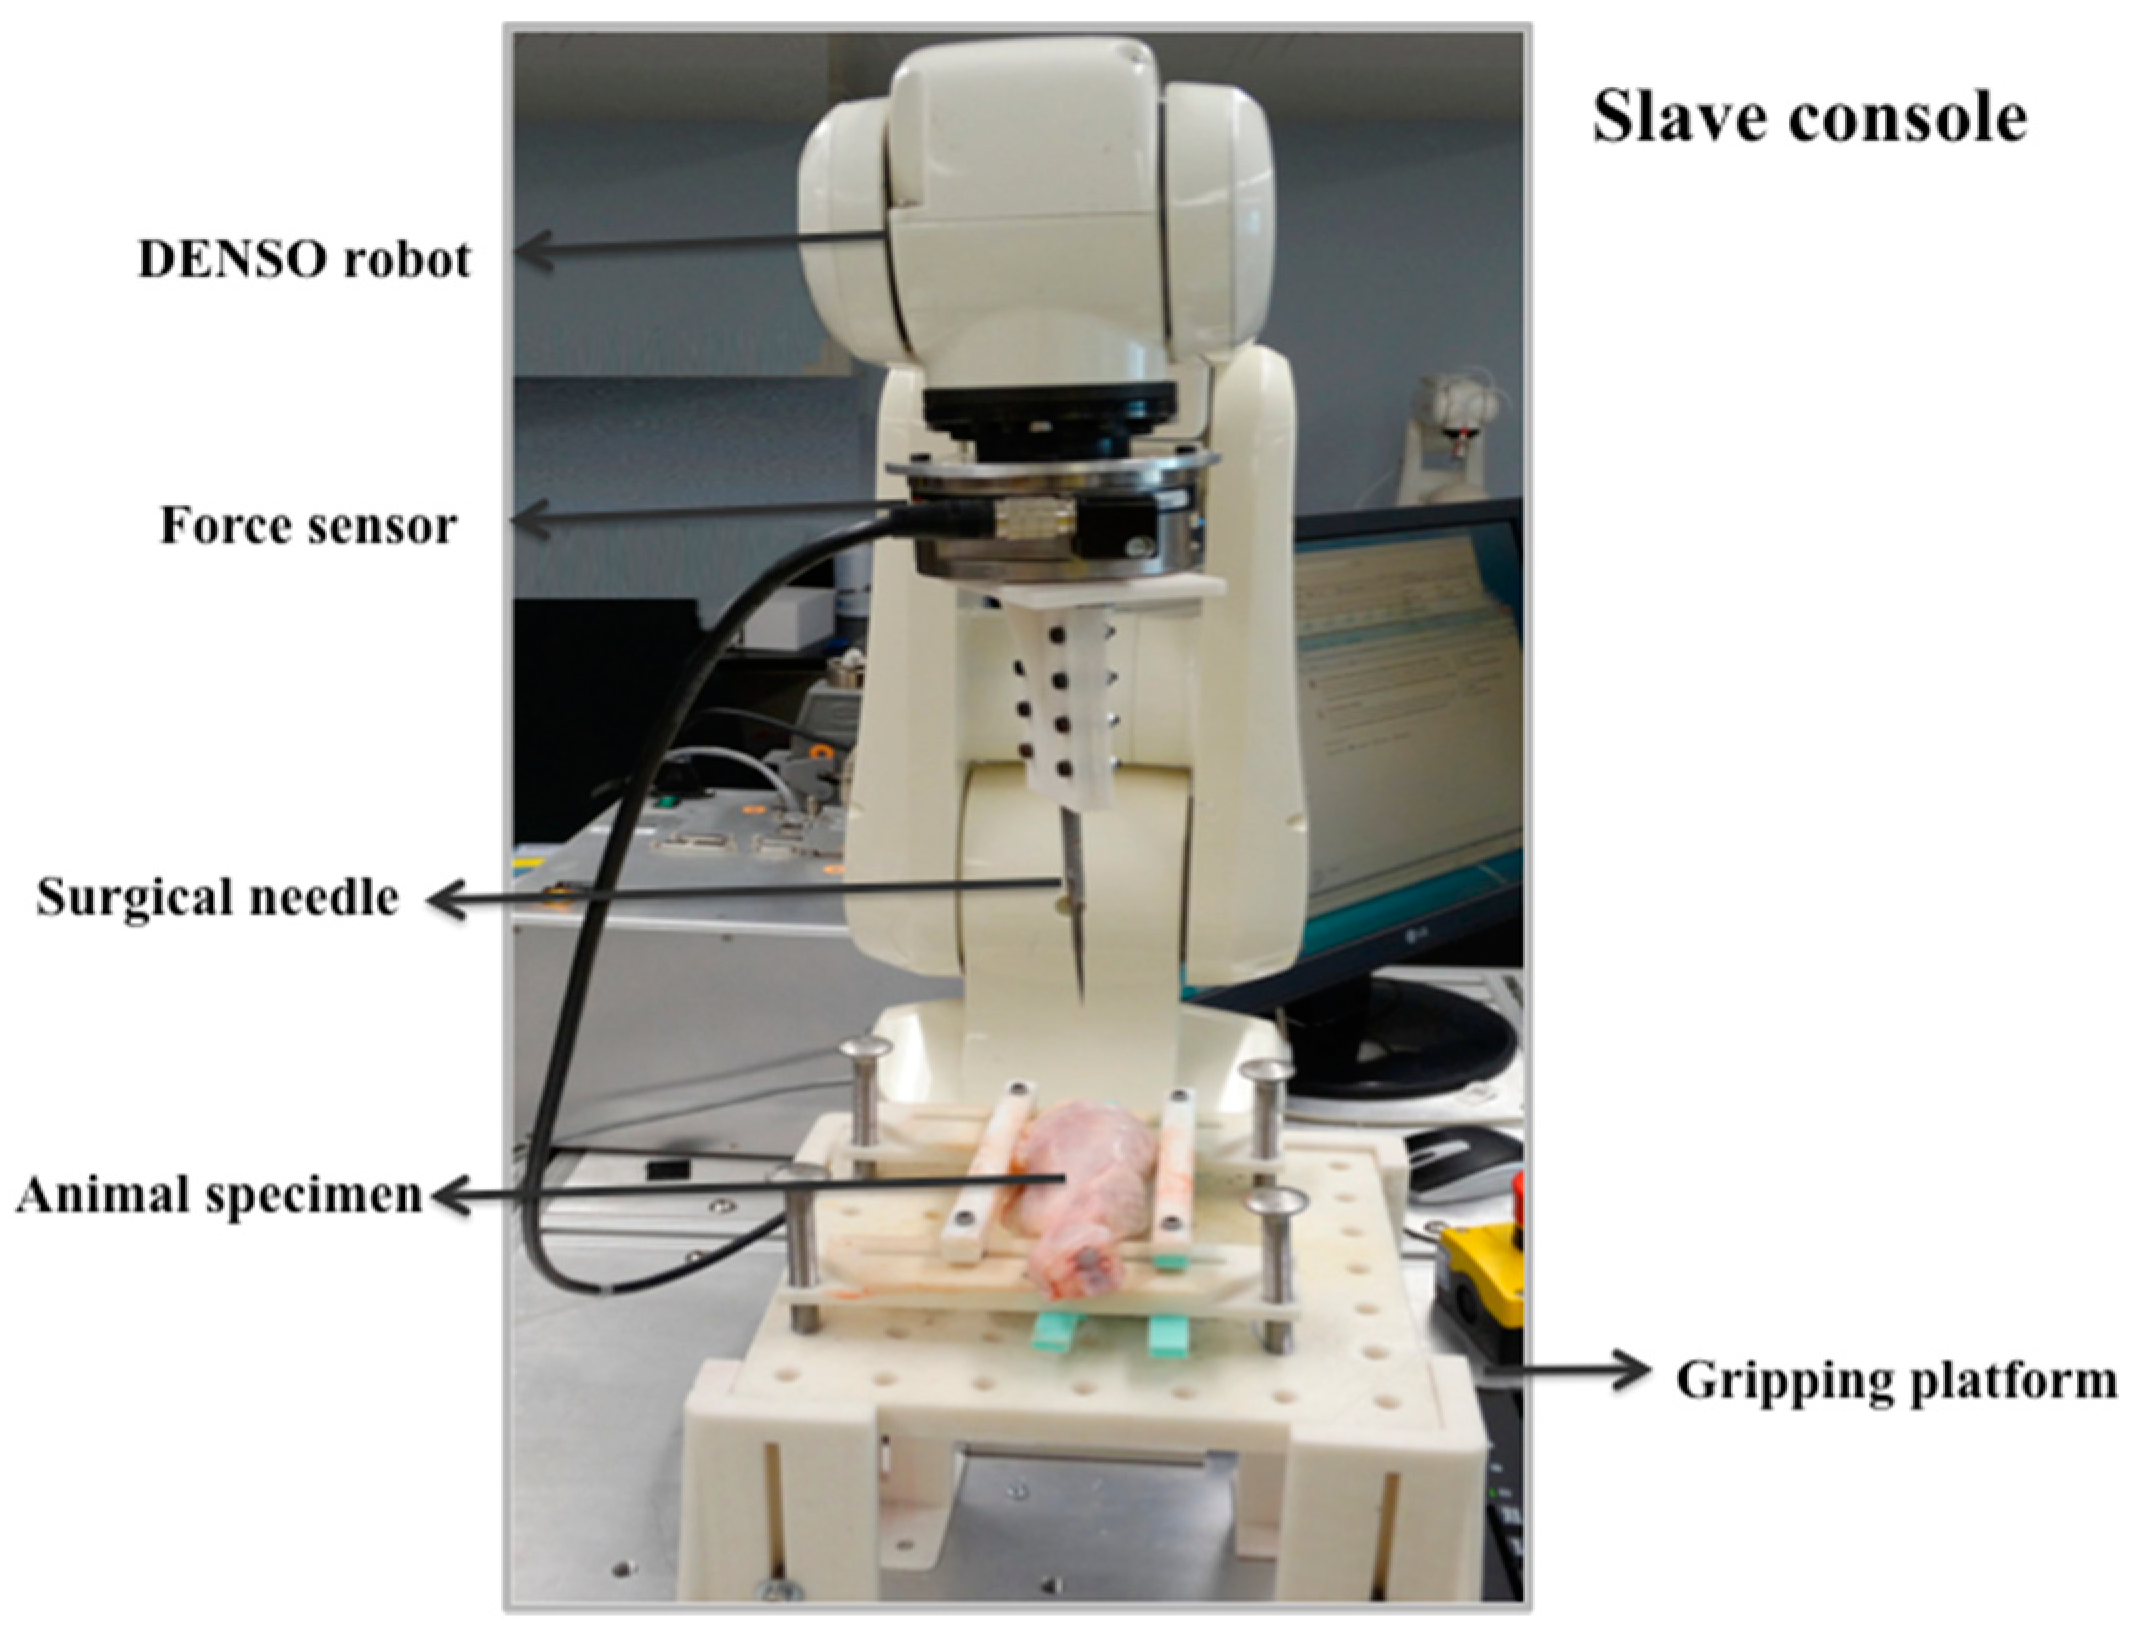
2.1.1. Robotic Testing Platform

The experimental setup consists of a platform for gripping different tissue specimens and a needle attached to the tip of the slave robot for penetrating the tissues. The slave console (Figure 1) included a DENSO VP series six-axis articulated robot, a control module (DENSO Robotics, Aichi, Japan), and a Gamma multi-axis ATI force/torque sensor (ATI Industrial Automation, NC, USA) equipped with a 16-bit data acquisition board (National Instruments, Austin, TX, USA). The robot used an open-architecture interface with the QUARC 2.2 DENSO robot block set, Simulink®, and MATLAB® (MATHWORKS, Natick, MA, USA). This six-degrees-of-freedom manipulator can perform orientation, insertion, and rotation of the needle. A 15–24-cm long surgical needle with a standard bevel tip with an external diameter of 1.27 mm was fixed to the force sensor by using a 3D printed handle coupler. The robot was programmed to penetrate through the tissue at a 90° angle without spinning. These parameters follow the expected motion of the robotic biopsy procedure for which the FGM was developed.
The force sensor was installed at the distal end of the robotic arm of the slave robot. Force was measured while applying tension to various types of tissues through a driving needle. The force sensor was located between the DENSO Robot’s end-effector and needle holder and its maximum force capacity was 32 N in the x and y (orthogonal) directions and 100 N in the z (axial) direction with a 0.025-N resolution. The Simulink model recorded only voltage data for the insertion force from the force sensor. The data was recorded in the axial direction via a 16-bit A/D converter.

2.1.2. Soft-Tissue Testing Procedure

Experiments with ex vivo animal tissues were performed at the Hospital for Sick Children (Toronto, ON, Canada). Experimental data was collected for porcine liver and heart, bovine liver and heart, and chicken breast. Porcine and bovine models have been documented [33,34] as feasible animal models to study human heart and liver physiology and mechanics. However, the preliminary tests performed on these soft animal tissues were solely to verify the operation of the device in a low tissue-force specimen and they were used as an approximation. A mounting fixture was designed and 3D-printed to hold the tissues. The needle was cyclically driven through the tissues at a constant rate of 30 Hz. Force vectors were produced and a MATLAB® program was developed to extract the data. The extracted data were transferred to statistical software (SPSS 20.0.0, IBM, New York, NY, USA). The median, interquartile range, and maximum forces exerted on each specimen were calculated in SPSS.

2.1.3. Bone Tissue Testing Procedure

A similar experimental procedure to Section 2.1.2 was implemented to collect input data for high tissue-forces. This data is based on drilling into the following bone specimens: bovine femur, porcine femur, and chicken femur. These bone specimens were selected to imitate the characteristics of adult and pediatric bones. The bone of interest in this study is the femur and animal femurs are reasonably similar to the human femur in terms of geometry and material properties [35]. The femur was selected because, first, it is a common site of injury in orthopedic trauma that requires drilling [36] and, second, it is the longest, strongest, and heaviest bone in the body. Lastly, it can provide a wide range of drilling forces due to its heterogeneity.
The femur was rigidly clamped to the fixture so that the long axis of the femur shaft was perpendicular to the drilling direction. A small pilot hole was drilled into the outer layer of the bone cortex to guide the surgical drill bit (2 mm diameter) during drilling, which proceeded until the bit penetrated the opposite side of the cortex. No cooling mechanism was employed in this experiment, which imitates clinical practice. Noise in the force signal was corrected to enable identification of the maximum, median, and interquartile ranges by smoothing all raw data with the running average function in MATLAB®. All force data for each femur type were combined into one matrix and inputted into SPSS for post hoc analysis and extraction of significant information (p < 0.05).

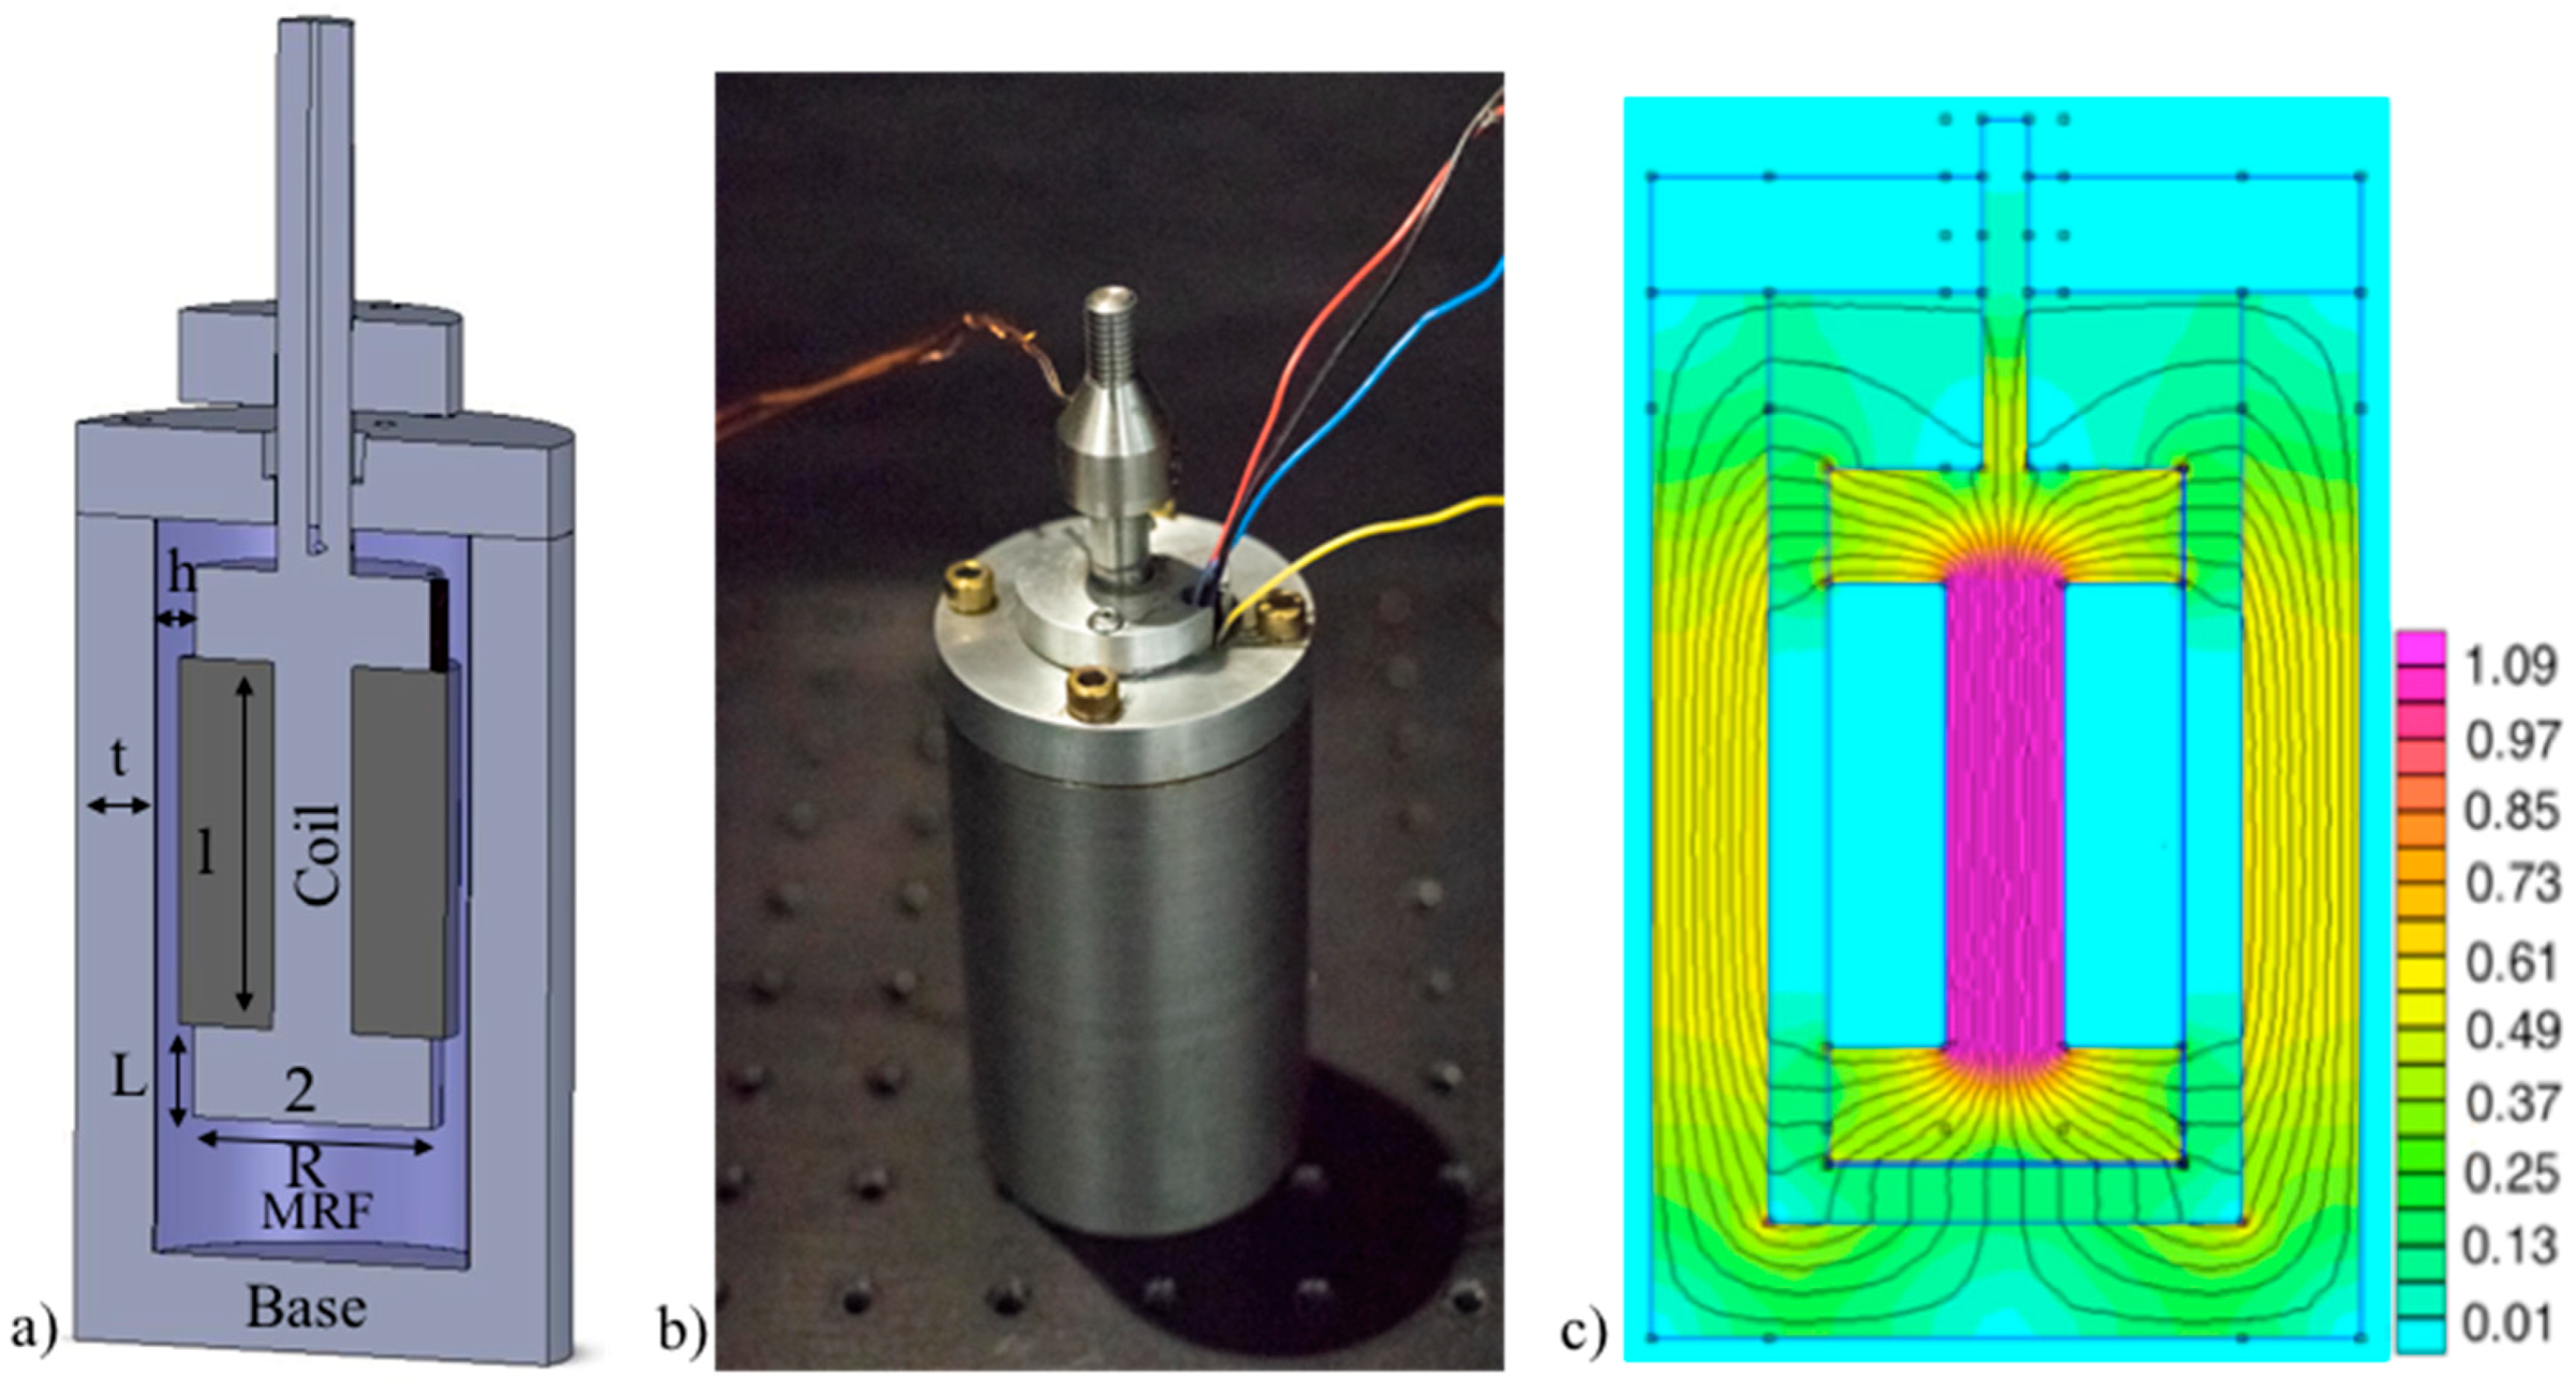
2.2. Study Two: Development of the Force Generating Module (FGM)

This section describes the development of the force generating module (FGM). The development of the FGM is broken into two phases: the physical design and prototyping of the FGM and the modeling and control strategy used to predict the behavior of the MRF.

2.2.1. FGM Device Fabrication

The primary steps in the design process were the selection of a magnetorheological fluid (MRF), the selection of structural materials, and the selection of magnetic circuitry design. After establishing a preliminary design, a model of that design was validated through magnetostatic analysis with Finite Element Method Magnetics (FEMM) [37] software, which enabled the magnetic flux distribution inside the device to be visualized (Figure 2). FEMM was used to simulate an accurate magnetic field distribution across the fluid, which enables the design of the dimensions of the actuator, the selection of component materials, and the number of coil turns. A counter plot of the magnetic flux path and flux density is shown in Figure 2c. The flux path is shown in counter lines that loops through the fluid and the structure. The relationship between the dynamic yield stress of the MR fluid and applied magnetic field is provided in Lord technical data [38]. The yield stress of the fluid increases almost linearly with respect to the magnetic flux density before it begins to saturate around 0.7 T. Qin et al. explains the relationship between the yield stress and magnetic field in detail [39]. From Figure 2, the saturation point of the fluid is around 0.6 T in ‘h’ (marked in Figure 2a). Note that the flux density is uniformly distributed in the fluid.
The MRF FGM prototype consists of a dash-pot design that includes a base that fully encapsulates the MRF and coil, which is shown in Figure 2. The core of the coil and the body of the base device are made of 1010 steel, which is a magnetically conductive material, to reduce the loss of magnetic field energy in the ferromagnetic material, improve magnetic energy utilization, and reduce device volume. The B-H curve of 1010 steel indicates a magnetic induction saturation of approximately 1.6 T for steel parts [40], which is considerably larger than that generated in the device. Therefore, in designing the device, magnetic induction did not exceed a maximum flux density of 1.6 T. A 24-AWG magnetic wire with 1100 turns was fabricated to fit a coil bobbin and provide a large value of ampere-turns with minimal current supply [41,42]. The magnetic coil was built into the articulating rod of the dashpot. The rod was designed to articulate into and out of the base of the FGM by moving the coil through the fluid. A linear actuator (100 mm, 150:1, 12 V with potentiometer feedback, Actuonix Motion Devices Inc., Victoria, BC, Canada) was externally attached to the rod for experimental assessment. The linear actuator was used to experimentally control the distance travelled and the frequency of movement of the FGM during the characterization experiments described in the following sections. This also ensured that the coil did not collide with the top and bottom of the case during experimental characterization.
The MRF fills the chamber. To seal the top of the dashpot and the container, we used O-rings (PTFE (generic Teflon) a 1.5” steel (3/8 OD, 11/32 ID)) to prevent the fluid from leaking. To enhance the seal life, anti-wear, and lubricity, in this study, the fluid in the actuator was replaced after two uses.
When current is supplied to the coil, the iron particles inside the MRF align themselves in the direction of the applied field and this behavior can be used to vary the resistance force supplied by the MRF onto the translation rod, which is shown in Figure 2.

2.2.2. Nonlinear Black-Box Model of Magnetorheological Fluid

To effectively use the FGM, a model capable of reliably predicting the behavior of the MRF is required. This section describes a modeling structure using a nonlinear black-box model to address this objective. These models represent a series of connections between static nonlinear elements and a dynamic linear model [43]. This technique uses observed input and output measurement data from the system to develop a block-oriented model that approximates the true behavior of the system. Implementing a nonlinear black-box model follows a four-step procedure: (1) Empirical measurement data collection, (2) selection of a modeling technique, (3) selection of the criterion used to fit the observed data, and (4) model validation. This section will describe the development of the model and the following section will describe the procedure used to collect the experimental data needed for implementation.
In general, a nonlinear black-box model can be considered as a concatenation mapping from previously observed data to a regressor space, which is followed by a nonlinear function expansion-type mapping to the space of the system’s output [44]. Therefore, only the measured input and output and their previous values are required to implement this approach. The system identification approach used for a black-box model is formulated below.
u t = [ u ( 1 ) ,   u ( 2 ) ,   , u ( t ) ]
y t = [ y ( 1 ) ,   y ( 2 ) ,   , y ( t ) ]
where the observed inputs are denoted by u(t), the outputs are denoted by y(t), and t is the time of measurements in seconds. Given a set of input and output data, a model describing the relationship between past observations, which are denoted as the vector of input and output values, [ u t 1 , y t 1 ] , and the current output, y ( t ) , is represented below.
y ( t ) =   g   ( u t 1 , y t 1 , θ ) + v ( t )
Equation (3) is a general dynamic model with a noise signal, v ( t ) , added to the output. The noise signal represents the prediction error in cases where the output, y ( t ) , is not an exact function of past data. This term accounts for the measurement error. For ideal models, the values of v ( t ) approach zero such that g   ( u t 1 , y t 1 ) is a good predictor of y ( t ) . The objective is to approximate the function given below.
g   ( u t 1 , y t 1 , θ ) = g ( ϕ ( t ) , θ )
Function g ( ϕ ( t ) , θ ) includes two mappings. First, past observations are mapped onto a vector, ϕ ( t ) , with a fixed dimension and, second, ϕ ( t ) is mapped to the output space. Vector ϕ ( t )   ϕ ( u t 1 , y t 1 ) is referred to as the regression vector and its components are referred to as regressors. Therefore, a regressor is a variable containing previous inputs and/or system outputs and the selected regressor is referred to as the regression vector. Generally, for dynamic systems, developing a nonlinear model is decomposed into the following sub-problems: (1) Selecting the regression vectors, ϕ ( t ) , from past input and output data and (2) determining the nonlinear mapping, g   ( ϕ ,   θ ) , from the regression space onto the output space. Here, θ = [ θ 1   θ 2 θ p ] is the parameter vector with ( p ) parameters to be estimated in the identification problem.
For MRF haptic device applications, there are several nonlinear models that can be used, which are mentioned below. For nonlinear models, regressors are combined with a nonlinear function rather than a weighted sum, which is employed by linear models. Nonlinear models are represented by the equation below.
y ( t ) = g ( y ( t 1 ) , y ( t 2 ) , ,   u ( t ) ,   u ( t 1 ) ,   u ( t 2 ) , )
In this case, g ( . ) is a function of a nonlinear model that represents system nonlinearities [45]. The function g ( . ) can be represented by using wavelet functions, sigmoid functions, or multilayered neural networks. For nonlinear estimators, the model order is defined as the number of past outputs, past inputs, and input delays used for predicting the output at a given time. Typically, the model orders are chosen by trial and error [45]. However, we utilized the Akaike information criterion (AIC) because it provides a preliminary order set [46,47]. Based on the AIC method, our model order was determined by minimizing the sum of the squared distance between an assumed model, y ^ ( t ) , and the true model, y ( t ) [43]. The AIC was used to select the model order, which corroborated our assumption that output force should be predicted by six regressors (i.e., y ( t 1 ) , y ( t 2 ) , u ( t 1 ) ,   u ( t 2 ) ,   u ( t 3 ) ,   and   u ( t 4 ) ); u ( t ) , and y ( t ) were represented physically by the input current to the plant and the output force measured by the MRF-based device, respectively).

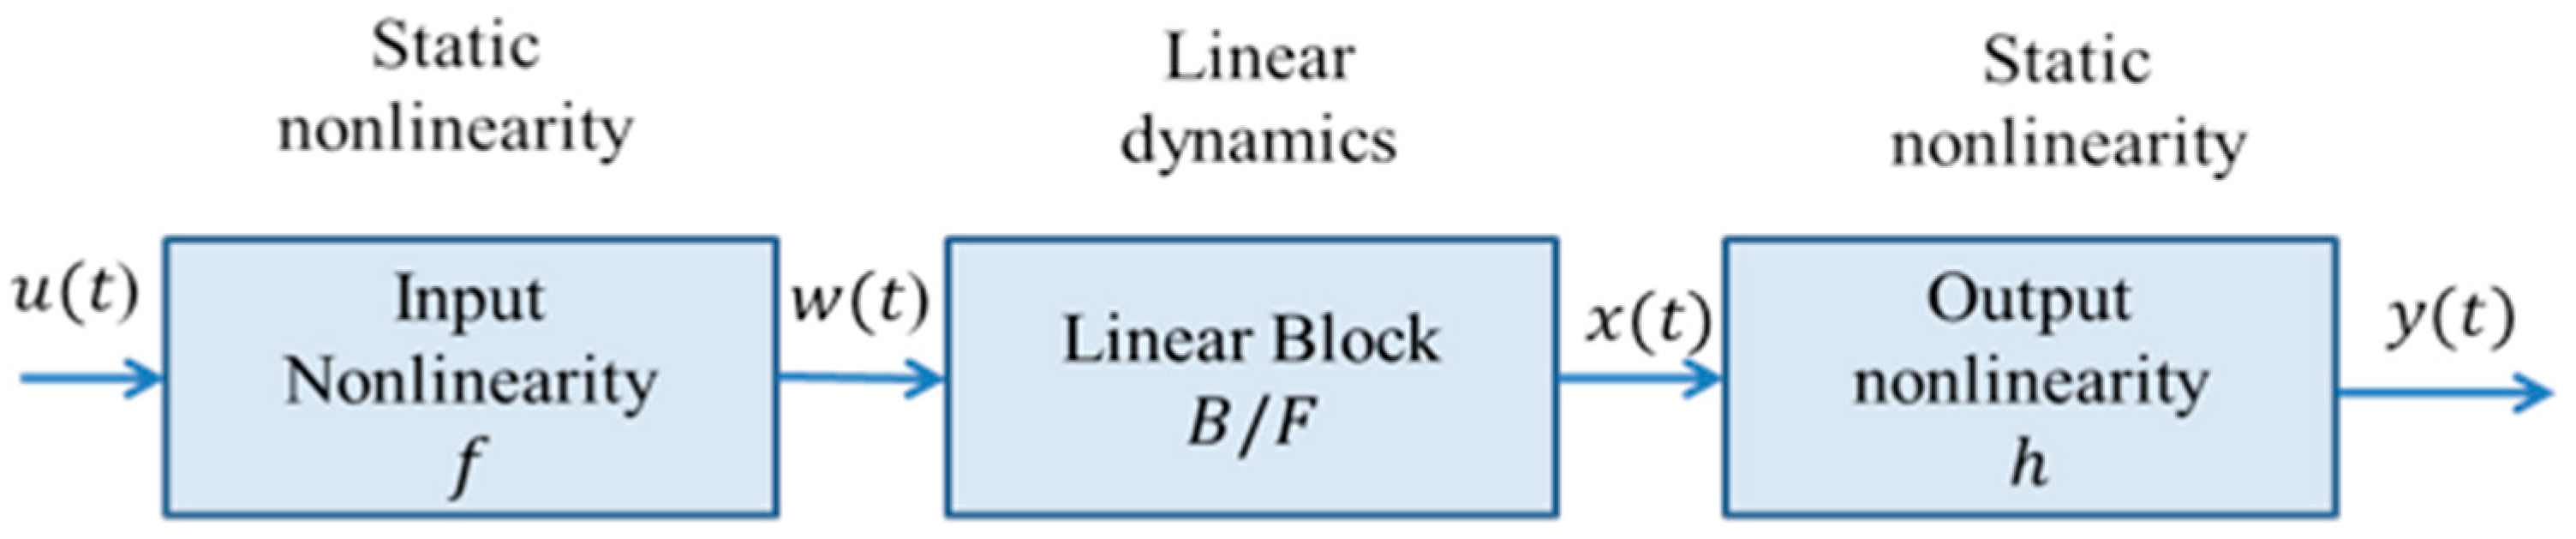
2.2.3. Hammerstein-Wiener (H-W) Model

Black-box models such as the Hammerstein model, Wiener model, and Hammerstein-Wiener (H-W) model are unrelated to physiological models and, therefore, are more flexible and better able to adapt to data, which results in a superior fitting when compared to alternative techniques [48]. In a black-box model, the objective is to parameterize g   ( ϕ ,   θ ) in a flexible manner, so that it can approximate any feasible true functions, g   ( ϕ ) , with accuracy. The Hammerstein model consists of cascade connections of static nonlinearity, f , which is followed by a linear dynamic block. The Wiener model is obtained by reversing the order in which static nonlinearity and the linear dynamic model occur in the Hammerstein model. The H-W model is implemented if a cascade of two static nonlinear blocks and one linear block are used. Only the linear block contains dynamic elements. The H-W model is among the most widely used nonlinear black-box models [49]. The block diagram in Figure 3 represents the structure of the H-W model.
where:
  • w ( t ) = f ( u ( t ) ) is a nonlinear function that transforms input data, u ( t ) . The dimensions of w(t) and u(t) are the same.
  • x ( t ) = B / F w ( t ) is a linear TF. The dimensions of x(t) and y(t) are the same. B and F are polynomials described for ny outputs and nu inputs and they contain the following terms: B j , i ( q ) F j , i ( q ) , where j = 1 , 2 , , n y and i = 1 , 2 , , n u .
  • y ( t ) = h ( x ( t ) ) is a nonlinear function that maps the output of the linear block to the system output.
The actions of f and h on the input and output ports of the linear block are referred to as input and output nonlinearity, respectively. The input and output nonlinearity functions are static (memoryless) where output values at a given time, t , depend only on the input values at that time. These functions can be configured as sigmoid networks, wavelet networks, piecewise linear functions, or polynomials. The final step is to validate the model after estimating it. The model is validated by using a dataset that is different from those used for modeling.

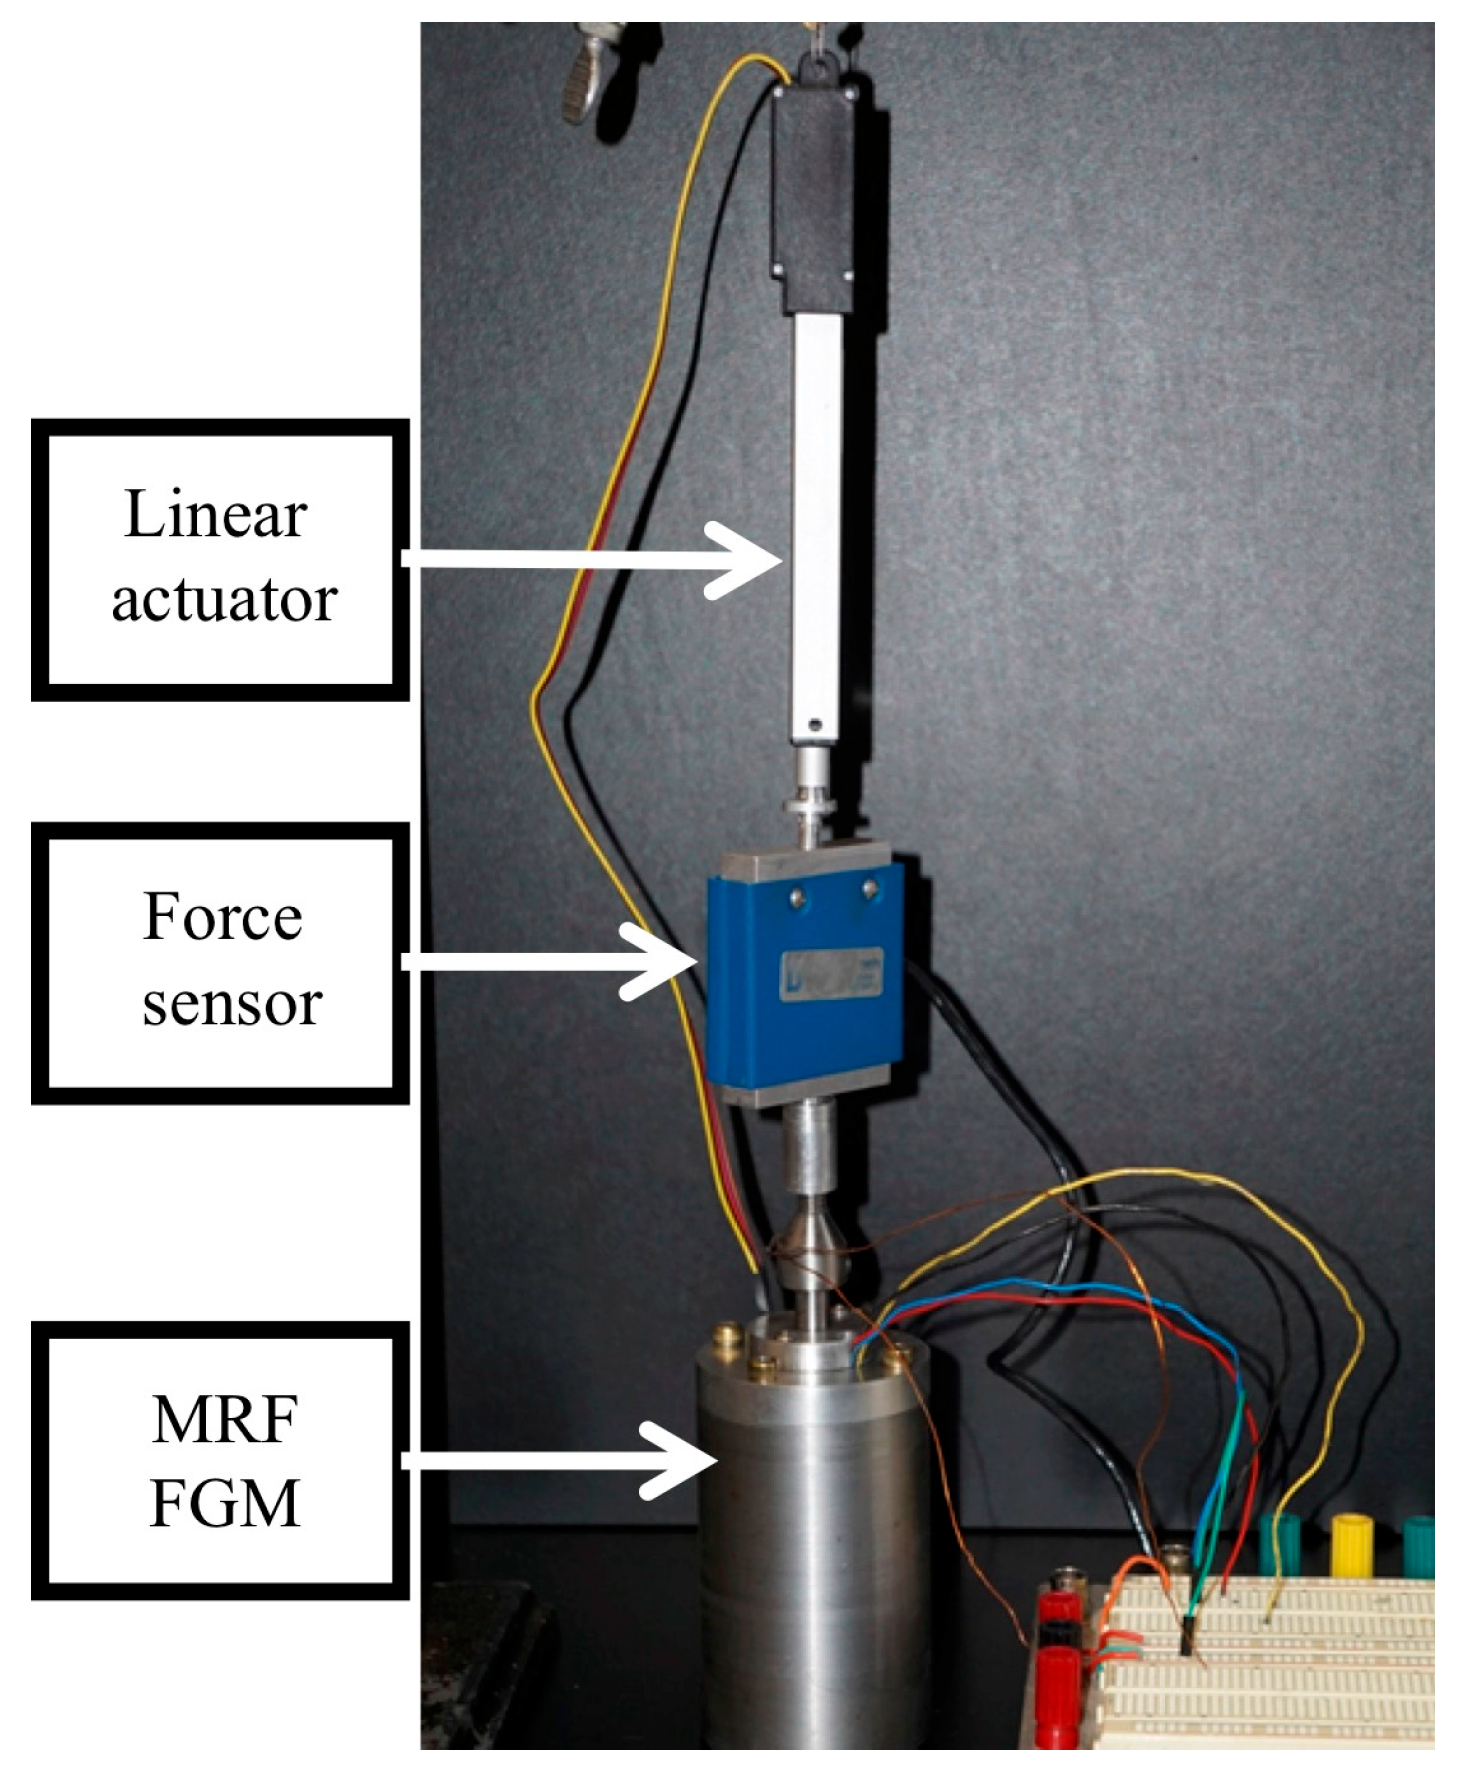
2.2.4. Fabrication of FGM Force Measurement Experimental Rig

This section describes the modeling technique implemented for FGM. To complete the development of the FGM, training and assessment datasets that exemplify the behavior of the MRF under the intended operating conditions must be collected. This data is used to build the Hammerstein-Wiener black-box model and then to characterize its performance. The following sections describe the construction of an experimental measurement rig used to collect the datasets, a description of the methods used to collect the data, and a discussion of the metrics used to assess the performance of the H-W model used in the FGM.
An experimental setup was constructed (Figure 4) to perform a series of quasi-static tests to investigate the behavior of the MRF device and to measure the force range produced by the FGM. The experimental set-up included the MRF, an electromagnetic coil, a power supply, a force transducer, a data acquisition unit, and a linear actuator.
In this system, a force transducer was attached to the coil by a rigid rod. The force transducer was an SMT S-Type overload protected load cell (Interface Inc., Atlanta, GA, USA). At the other end, the force sensor was attached to an L16 linear actuator (100 mm, 150:1, 12 V with potentiometer feedback, Actuonix Motion Devices Inc., Victoria, BC, Canada) that drives the rod into and out of the body of the FGM. The linear actuator was fixed to an external rigid mounting arm and was aligned with the MRF device so that it articulated axially. The linear actuator was controlled by pulse width modulation (PWM) using an Arduino UNO (Arduino, Italy) microcontroller [50]. For the purposes of this study, the speed and vertical position of the rod were held fixed. The rod was lowered at a constant velocity towards the base and the velocity was 10 mm/s. For the purposes of the initial FGM characterization, we felt that a single speed and rod configuration were sufficient. Both Goncalves [51] and Koo [52] have studied the force, current, and velocity relationship for MRF in detail. The results from their study show that, at a given current, the peak force generated from the proposed device is independent of velocity. Their device was capable of generating a continuously variable force in the range of the off-state to on-state damping force. Therefore, to focus more on characterizing the force capability of the device, the FGM was studied at a constant velocity.
The current in the coil was increased and decreased from 0.1 A to 1.5 A in 0.1-A steps. The current supplied to the coil created a magnetic flux (B). This field caused the fluid to change its state from liquid to semi-solid within 10 ms. The force sensor measured the force required for the rod to move into and out of the fluid at a fixed current supplied to the coil. This procedure was repeated five times for each 0.1-A step and the resultant force measurements were averaged. The standard deviation of the measured forces was 0.2 N. The force produced by the MRF actuator depends on the coil current-induced magnetic field. Force measurements were fed to a data acquisition system for further processing in MATLAB®.

2.2.5. H-W Model Validation

To validate the effectiveness of the H-W model, the measured input and output data was divided into two subsets known as the identification and validation datasets. Following the model development using the identification dataset, model quality was determined by comparing the validation output with the measured output of the system under the test. Measured and simulated data can be compared qualitatively, quantitatively, or based on statistical methods [53]. Qualitative approaches involve visual inspections of the differences between the output and validation data plots. Quantitative approaches are based on performance metrics such as mean squared error (MSE), final prediction error (FPE), and goodness of fit. The MSE measures estimator quality by assessing the differences among model-estimated values and empirical values. The FPE determines model quality by simulating a situation where the model is tested on a different dataset. It describes the accuracy and complexity of the model [54]. Moreover, FPE measures are used when comparing several different models and, according to Akaike’s theory [46], the most accurate model has the smallest FPE. In this study,
F P E = v 1 + d N 1 d N
where v is the loss function, d is the total number of parameters and N is the number of values in the dataset. The loss function is defined as the sum of squared errors.
v = t = 1 N e 2 ( t )
where e ( t ) = y ( t ) y ^ ( t ) and y and y ^ denote estimated data and the corresponding model output, respectively. To evaluate how well the model fits with actual data, the goodness of fit (%) is calculated by using the MSE as its cost function.
f i t = y ^ y 2 N
The most effective model has the minimum MSE, minimum FPE, and maximum goodness of fit. After recording the system’s input and output, the measured data is divided into several datasets for training, testing, and validating the model. For MRF haptic device applications, there are several nonlinear models that can be used such as polynomials, sigmoid networks, piecewise functions, and wavelet networks. For nonlinear models, regressors are combined with a nonlinear function rather than a weighted sum such as in linear models.

2.3. Study Three: Implementation of Closed-Loop Control Strategy with Robotic Test-Platform

This section describes the implementation of the closed-loop control with a robotic test platform. Following the design of the FGM prototype and the development of a model of the MRF, we developed a closed-loop control strategy with the aim of incorporating the FGM into a master-slave configuration with the robotic-tissue testing system. Two control strategies were implemented. The first system is based on conventional closed-loop control with a force-sensor and the second system is a novel control loop design based on the nonlinear H-W modeling technique. Both these strategies are discussed in the following section.

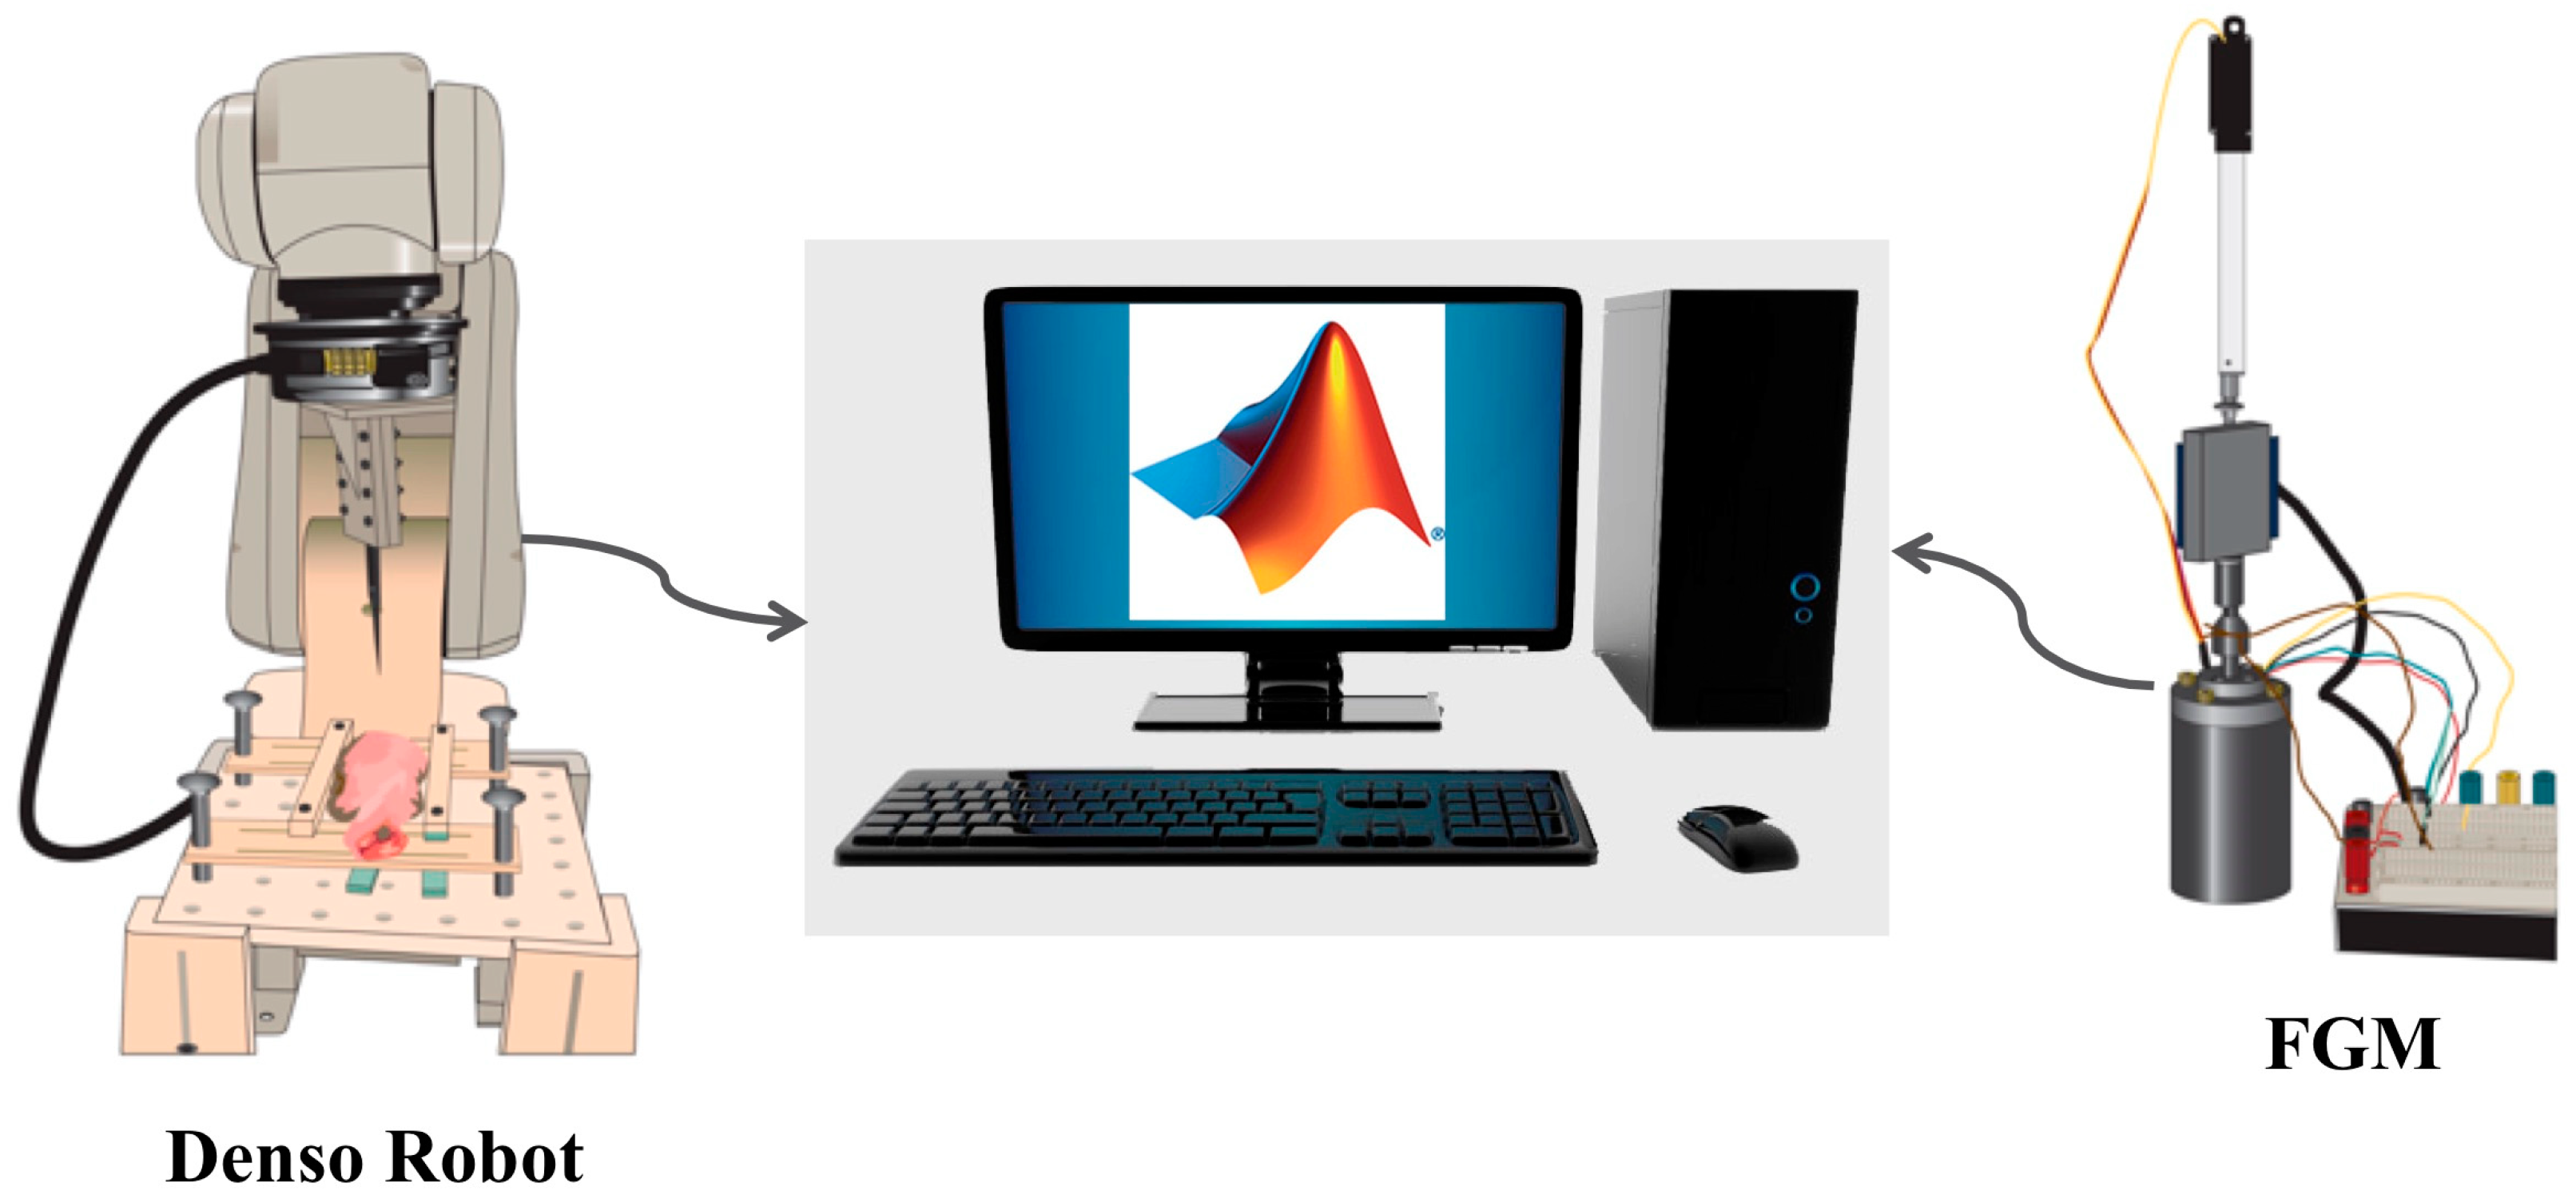
2.3.1. Experimental Set-Up

To assess the performance of the FGM in a haptic feedback system for the bone biopsy, the device was implemented in the experimental set-up outlined in Figure 5. The FGM was used as a master for the teleoperation of the robotic testing platform.
In this experiment, the tissue force measurements from the slave-console (the robotic test platform) were used as inputs into the FGM. To simulate a human user manipulating the FGM as a master-console, a linear actuator and a load-cell were rigidly connected to the FGM. The linear actuator applied a specified displacement to the FGM and the output force generated by this device was recorded and compared to the original tissue-forces recorded at the slave-console.

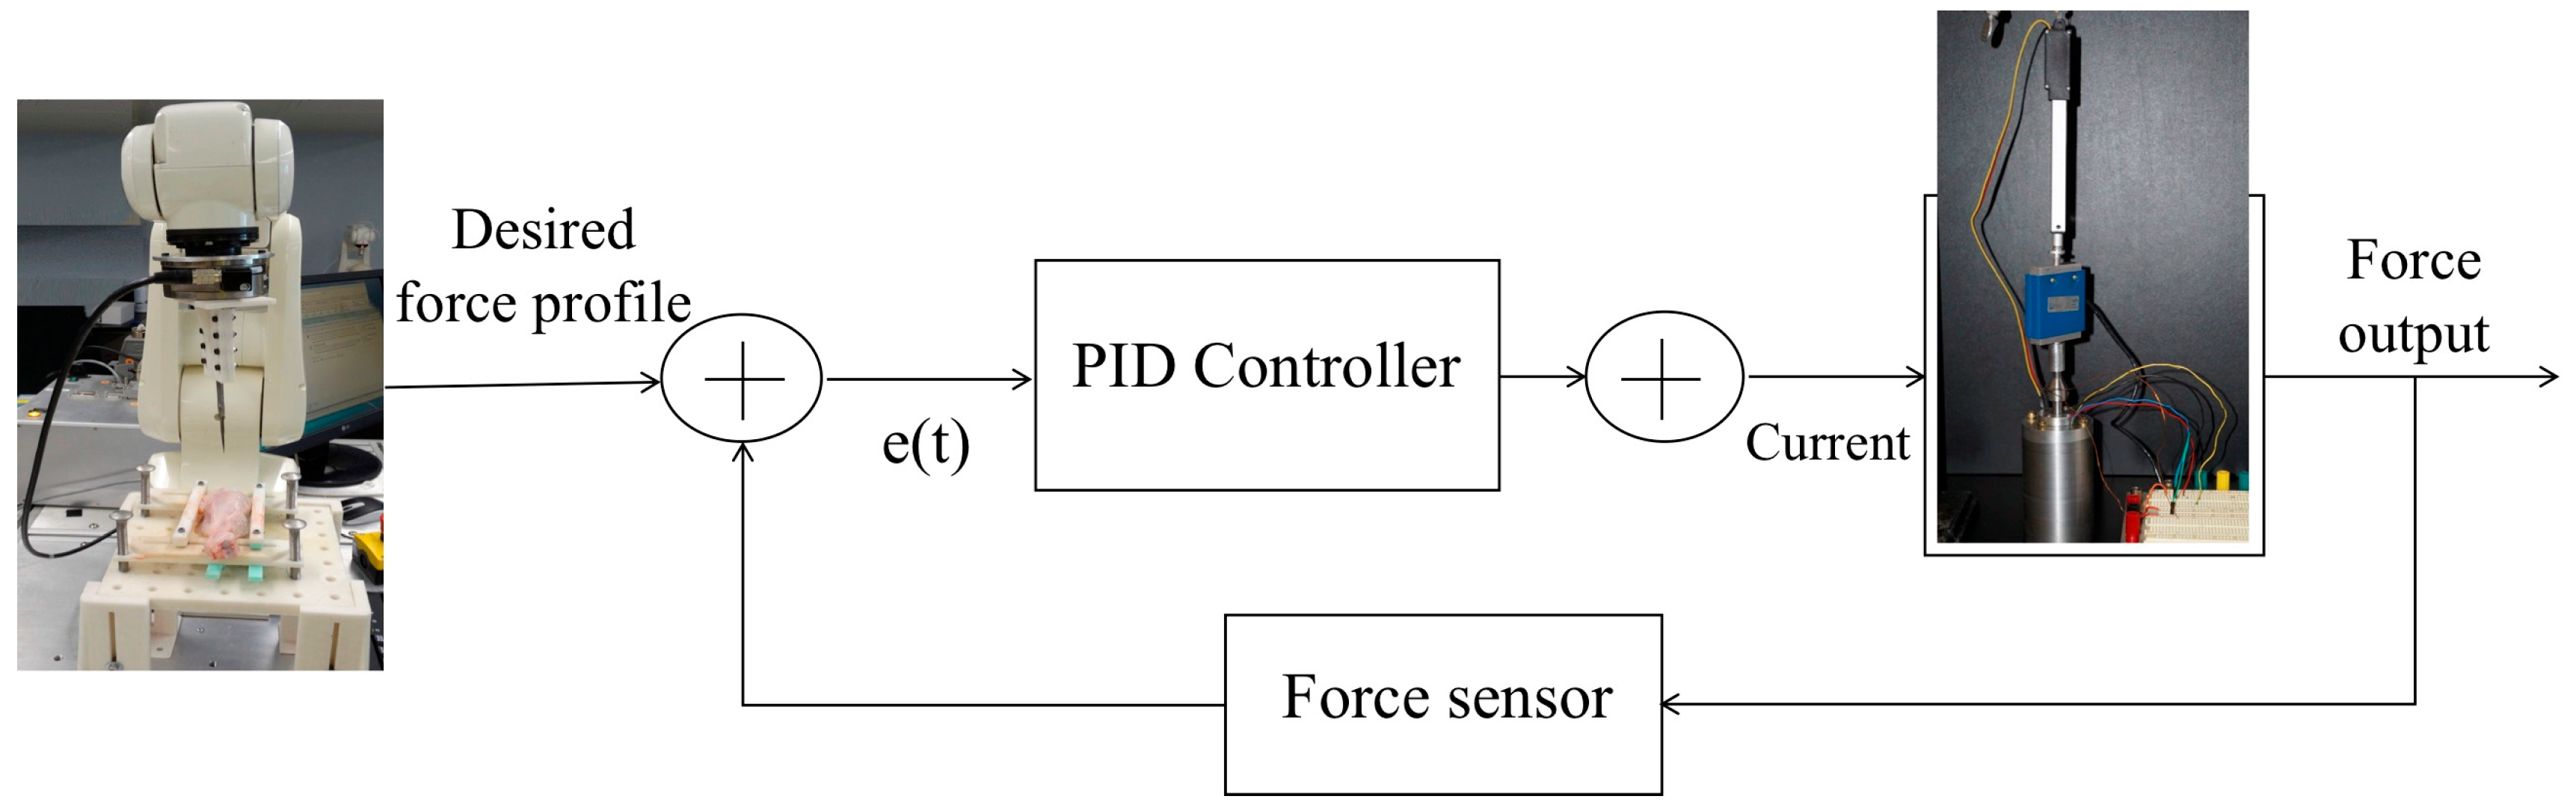
2.3.2. Closed-Loop Control with a Force Sensor

The first closed-loop control strategy involved a force sensor, which is shown in Figure 6. The force signals such as various sine waves with different frequencies were inputted into the closed loop as the target force profile. The load cell measured the force required to move the rod into and out of the fluid. The force values measured by the force sensor were subtracted from the desired force to generate the error signal sent to the PID controller.

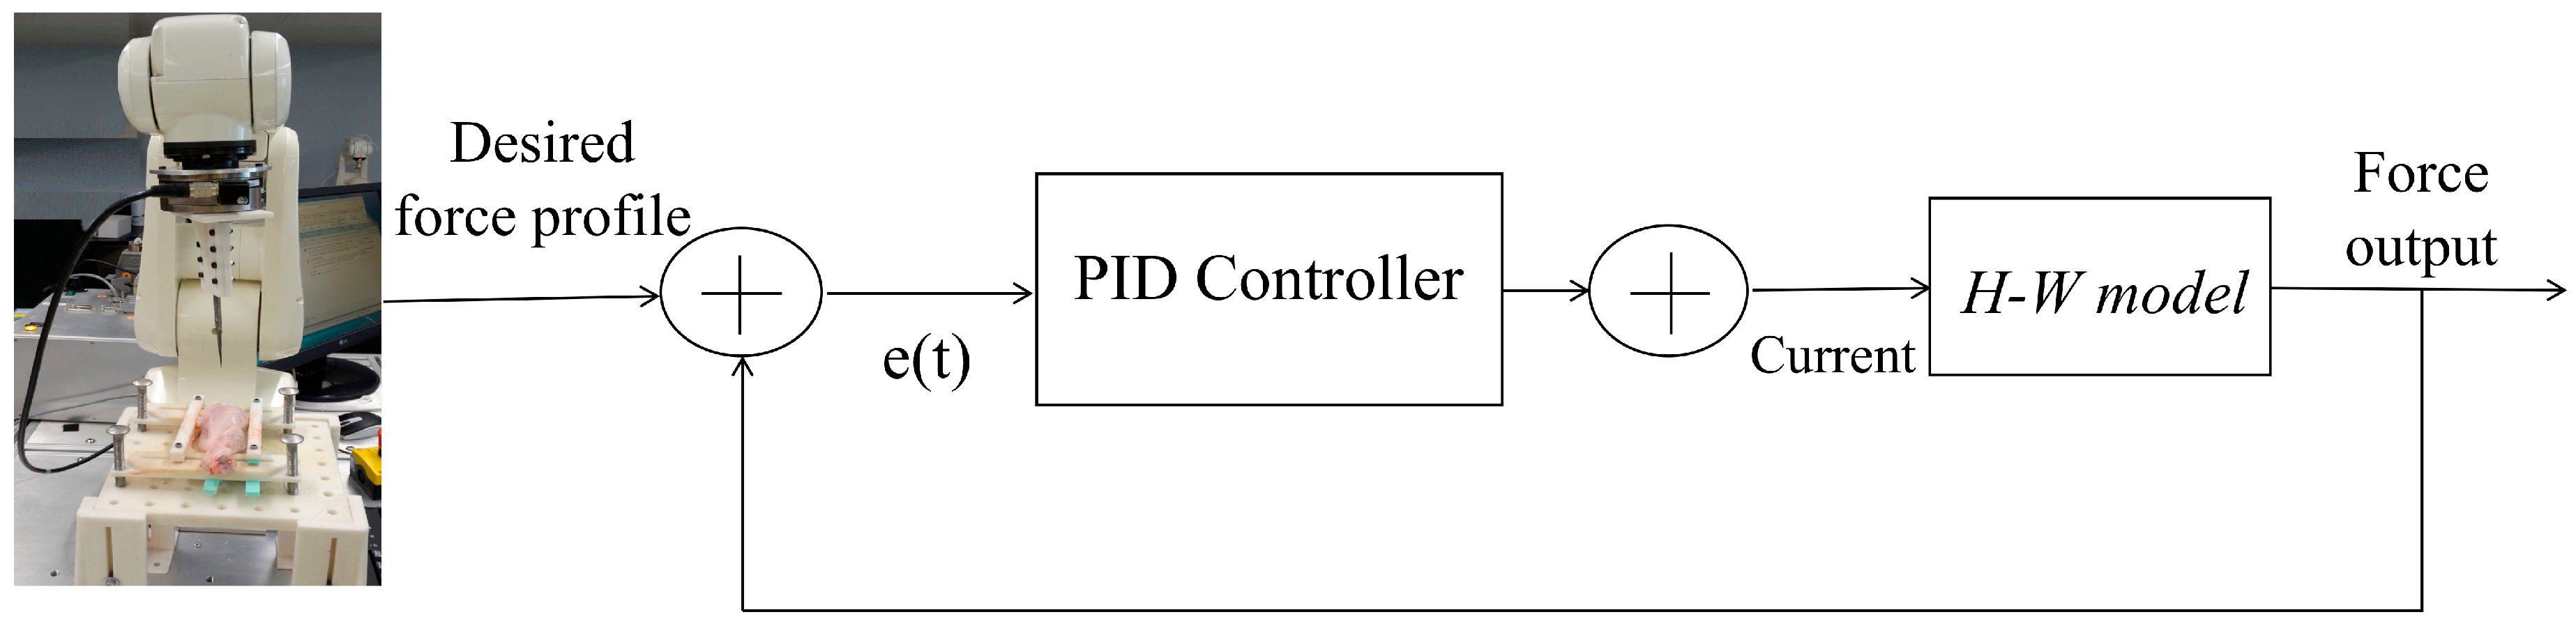
2.3.3. Model-Based Predictive Control

The H-W model that was implemented based on signals recorded from the master-slave setup was used as the plant model in this closed-loop control scheme (depicted in Figure 7). The estimated nonlinear model must be linearized to make it suitable for a control design [55]. In this study, a linear approximation for a given input signal was used to linearize the nonlinear H-W model of our MRF-based device. In this technique, the linear approximation was computed based on a mean square error. This linear model was structurally similar to the original nonlinear model and provides the best fit between a given input and the corresponding simulated response of the nonlinear model. For H-W models, linear approximation estimates a linear output-error model using the same model order [56].
Various input signals were first used to compare the output signals obtained from the model and force sensor. The root-mean-square error (RMSE) was used to compare model estimates with force measurements from the force sensor. The model was linearized after this comparison. Afterward, the linearized estimated model was used in a feedback control loop to tune PID gains by subtracting the error between the estimated and desired force. The controller used the estimated output force value from the H-W model as its feedback signal. The PID controllers were tuned experimentally to obtain optimal control results (i.e., fastest response and minimum overshoot).

3. Results

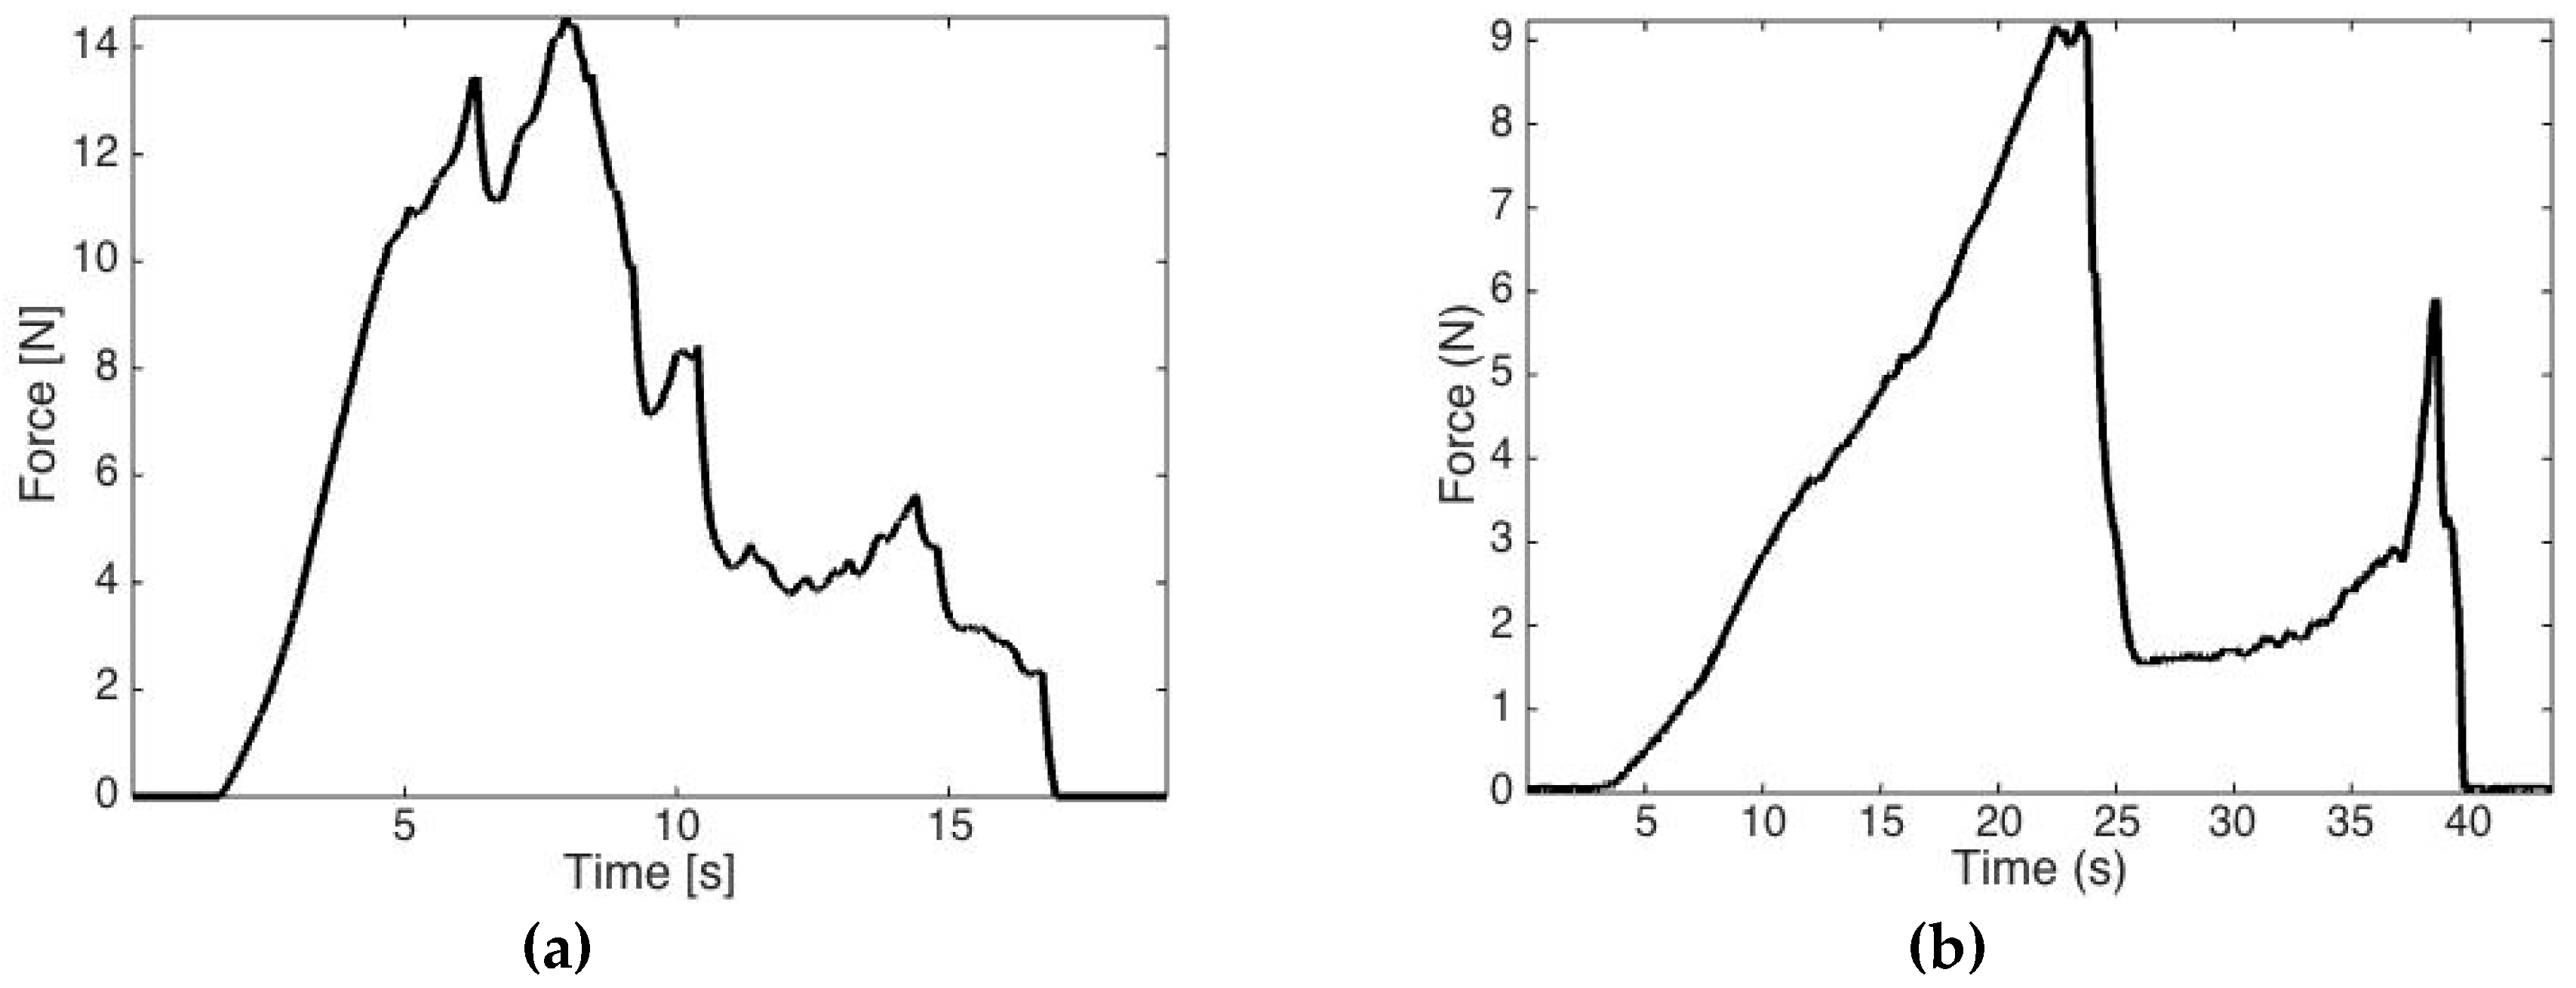
3.1. Study One: Tissue Characterization

For each type of tissue, five sets of data were collected. The data for each tissue type and the associated puncture forces are reported in Table 1. The puncture force for the bovine heart was more than that for the other soft tissues. An example force profile for liver tissue, for which force increased steadily, followed by a peak and then a sharp decrease, which is shown in Figure 8a. The puncture times were diverse because of the differing tissue structures. The puncture times for porcine heart, porcine liver, bovine heart, bovine liver, and chicken bone were 10.22 ± 1.44 s, 6.78 ± 0.44 s, 8.32 ± 0.93 s, 7.05 ± 1.22 s, and 25.9 ± 3.12 s, respectively.
An example of the penetration force required during bone drilling is shown in Figure 8b. Note that the force increased and then reached a peak value as the drill bit became fully engaged with the bone cortex. Subsequently, the force decreased as the surgical drill bit exited the cortex. Even though the shapes of the force profiles for different bone types differed slightly, abrupt variations are always observed at layer transitions. This phenomena is of particular interest and in-part has motivated this work to focus on MRF for use in haptic devices. The maximum and median force values for each specimen are reported in Table 1.
From Table 1, the range of expected force output for haptic feedback falls between values >0.1 N and <60 N. The results also indicate that the drilling and soft-tissue dissection forces rapidly shift in 200 ms and, therefore, the FGM should be designed to meet these requirements.

3.2. Study Two: Design of MRF FGM

A decision matrix was used to select the most suitable fluid for this application. The suitability for this application is related to minimizing zero-field viscosity (when there is no magnetic field) and density. MRF-122EG was selected as the best candidate MRF owing predominantly to its low no-field viscosity. The characteristic of the MRF FGM is summarized in Table 2.
When the current in the coil was increased from 0.1 A to 1.5 A, the magnetic flux around the fluid was measured to be in the range of 0.06 to 0.3 T. The force sensor measured a force of 0 N to 47 N as the current was increased from 0 A to 1.5 A. The off-state force was around 0.4 N for the maximum current applied. The designed MRF device is 1.5 Kg and requires only currents of up to 1.5 A to create such an output force. The standard deviation of the measured force was 0.2 ± 0.01 N. Figure 9 depicts the force and input-current relationship.
Figure 9 demonstrates that force correlates directly with input current. However, the path when increasing the current is not the same as when reducing the current back to zero due to the ferromagnetic nature of the materials, which create the flux path. Residual magnetism remains within the fluid after the external magnetic field is removed. This residual magnetism results in the hysteresis behavior shown in the figure. This hysteresis is caused primarily by magnetization of the steel elements in the MRF containment device when the supply current in the coil is varied. The current-force curve is nonlinear because the relationship between MRF-122EG and the applied magnetic field is not linear.

3.3. H-W Black-Box Model

The dataset used for estimating the H-W model was from soft animal tissue and bone, which is explained in Section 2.1.2 and Section 2.1.3. The dataset was divided into estimation and validation data points (Figure 10). Nonlinear black-box models were developed to increase the model fitness and then the models were performed and tested on both the soft tissue and bone datasets. The first step in estimating the black-box models was to select a model order for the linear block of the H-W model. The linear block of the H-W model was a TF with the model order defined as the numbers of poles, zeros, and input delays, which were determined through trial and error. The model order obtained for this TF was two zeros, three poles, and one input delay. The model order of the linear block in this case remained the same while various nonlinear estimators were examined.
Model quality was determined after model estimation by comparing the validation output with the actual system output. Qualitative and quantitative comparisons of the measured and simulated datasets were performed.
The H-W model provided flexible parameterization for nonlinear models. We selected a range of input and output functions for the nonlinear blocks of the H-W model to determine the best model for estimating the system and describing the nonlinearities of the MRF device. The MSE, FPE, and goodness of fit were calculated to assess model quality. The estimators and their model properties are reported in Table 3. From Table 3, Nlhw3 was selected as the best model. The nonlinear input and output channels of this model constituted a sigmoid network. Moreover, the Nlhw3 model had the smallest MSE and FPE together with the best goodness of fit. Nlhw3 simulation for the validation data are presented in Figure 11. The same validation dataset was used to verify model accuracy in H-W modeling. This model’s goodness of fit was close to 95%.

3.4. Study Three: Control Strategy

The desired force profile was tracked with the force sensor output serving as the feedback signal. The desired force profile tracked a 1-Hz sine wave (Figure 12). However, there was an initial force of 4 N due to a load upon force sensor produced primarily by the weight of the dashpot and attached coil. This load can be considered an offset value and subtracted from the actual measured force via an interface.
To validate the control methods, current patterns of varying frequencies and amplitudes were applied to the MRF-based device and a multistep force signal was applied to all control schemes. The results, which are shown in Figure 13, confirm that the H-W model provides excellent tracking with no off-state force while canceling the magnetic hysteresis within the MRF-based device.

4. Discussion

In this study, we present the development of a new magnetorheological-fluid force generating module that is intended for use in haptic feedback devices. In particular, this technology is targeted for applications that require rapid force changes from soft to hard tissues, which is seen in bone biopsy procedures. The work was divided into three parts. The first study outlined ex vivo tissue-force measurements to constrain the FGM development. The second study described the development, modeling, and characterization of the FGM as a proof of concept. The final study presented the FGM implemented in a master-slave configuration to control a robotic biopsy procedure and outlines an H-W feedback control strategy used to apply the FGM in a simulated surgical scenario [57].
The first study focused on collecting a continuous input data-set of biopsy forces using ex vivo tissue samples. This data was needed for developing the FGM’s controller and could not be taken from literature alone. The results of the tissue force characterization obtained in this study lie within the ranges reported in the previous work [13,14,15]. However, making an inter-study evaluation is challenging because the methods and tools used were very different. The differences include a wide variety of experimental conditions such as drill bit diameter, feed rate, spindle speed, bone type, and drill bit type. The results presented in this study are the first to measure forces at different locations on various animal femurs under the same test conditions. Other designers developing bone biopsy systems can use these results.
The experimental methods used in the tissue-forces study were based on ex vivo non-perfused organs. Therefore, these methods have the following limitations: First, the measured forces obtained may have higher values than true force measurements from living tissues because post-mortem tissues stiffen with time [58]. Second, factors such as the geometric properties of the needles and insertion angles may affect insertion forces [59]. However, for this study, a force approximation is sufficient since the aim of this work focused on investigating the modeling of the proposed actuator. Consequently, only one type of a commonly used needle and one type of a commonly used drill bit were selected to penetrate soft tissues and bone, respectively. This selection was made to maintain consistency between experiments and to achieve the goal of assessing the FGM technology as a proof-of-concept. However, future research will focus on applying the FGM to surgical simulations where these variables are not fixed.
Following the tissue study, the FGM was fabricated and a model of the non-linear behavior of the MRF was developed. To the best of the authors knowledge, this is the first study to apply the nonlinear black-box H-W modeling approach to an MRF haptic device. Within the H-W modeling technique, hysteresis and friction were approximated with a cascade of nonlinear functions. Friction is an inevitable problem in the design of MRF-based devices. Even when the friction force caused by the seal of the MRF is maintained at its minimum value, friction still exists in the system, which is experienced by the operator. Therefore, static friction, which is a source of nonlinearity within MRF-based devices, is intrinsic to this model because it is based on the input and output measurements from the device.
From a physical performance perspective, the FGM exhibits a wide range of force output compared to prior studies [60], which makes it suitable for applications in haptic interfaces. It is important to mention that this is the first study that designed an FGM for the bone biopsy even though other MRF based haptic interfaces have been used in other applications. For example, in Reference [61], Liu et al. designed and modeled an MRF device in a disc shape for applications in virtual reality. In this work, the authors claim that the torque range is between 0 to 700 N·cm. Furthermore, researchers at the University of Tsukuba developed a string-based glove for haptic feedback, which provided up to 7 N of feedback force to the index finger and the thumb [62].
Considering the FMG modeling performance, quantitative statistical analyses and visual inspection of the H-W model estimation demonstrated strong agreement between the H-W model predictions and the measured data. The goodness of fit was close to 95% for the input and output measurements obtained for animal tissues in the master-slave robotic setup. The model with the sigmoid network outperformed the other models, which are in agreement with the properties and shape of a sigmoid function [63]. A sigmoid network can model the system with more dynamics more smoothly than other modeling methods. This is because of the global shape of a sigmoid function. The shape of the sigmoid function consists of linear rise and a saturation field. The linear rise is related to current-dependent hysteretic behavior in the pre-yield region (i.e., the stress applied to the fluid is below a critical yield stress value [64]). The magnetic particles in the MRF experience saturation (yield stress plateaus) at high magnetic flux. Additionally, the computational time associated with the sigmoid network is low, which makes it advantageous over other methods. The results of the remaining nonlinear modeling methods used in this study are alike (Table 3).
The developed model can be used in the form of a lookup table or an analytical function in a closed loop control system. The generalized model structure can be expanded to other MRF devices with a wider dynamic range as long as reliable measurements of device inputs and outputs can be obtained. In addition, this modeling technique is especially suitable for devices for which precision is paramount and extremely accurate modeling is needed.
The design of the FGM prototype has the following limitations: First, MRF sedimentation and degradation are drawbacks of the current design. To address this issue, and to ensure a homogeneous distribution of the fluid and iron particles, the MRF was mixed or replaced every few days. Future designs should incorporate methods to prolong the use of the MRF through automated mixing. Additionally, the major limitation of this technology is the hysteretic behavior of MRF. This limitation is partially a result of the residual magnetization in the ferromagnetic materials in the structure after the removal of the applied magnetic field. The non-linear behavior reduces force measurement accuracy. The residual magnetization generates a considerable off-state force (in this study, 2.66 N), which is particularly undesirable in applications such as haptics. The H-W control tracked the input signal, which is recorded from the tissues via a slave robot, while compensating for magnetic hysteresis to achieve optimal performance.
The two control strategies implemented in this study were a force feedback controller, which is a common strategy used for such devices and was considered a “gold standard” for comparison and a novel nonlinear modeling and control technique, which was compared to the force-feedback controller. Conventional force feedback-based controllers have limitations such as latency in measurement, instability in control loops resulting from contact with rigid tissue, and noise [24]. Therefore, this method fails to maintain its performance at high frequencies.
The novel control strategy used closed-loop control based on nonlinear H-W modeling and, therefore, it can be implemented without an external force sensor. This is a major improvement. This approach has substantial advantage to applications where eliminating the requirement for an external sensor is necessary. In addition, force sensors diminish accuracy substantially when contacting a rigid tissue. Furthermore, accurate modeling techniques eliminated the need for additional hardware components, which decreased the weight of the device. This closed-loop control system can be a part of a self-sensing control system, which provides several advantages including simplicity, robustness, and a more optimized design than conventional control loops.
The model implemented in this study covers a wide range of the dynamics of the actuator when compared to other modeling methods such as the Preisach hysteresis model [65] whose resolution is limited. The Preisach model requires a weighted function that is constructed from experimental data [66]. Thus, a large number of data points are required to obtain a good model. The number of data points available and the repeatability of the system’s behavior have direct effects on the model’s accuracy [67]. The presently employed nonlinear model was able to predict the behavior of the actuator successfully and is an excellent candidate for closed-loop control. It represents a promising alternative to existing hysteresis models and control techniques. Ultimately, the range of output force and the performance of the MRF-based actuator make it suitable for creating haptic controllers for bone biopsy applications.
Using ex vivo tissue samples from the telerobotic setup allowed for quantification of the forces required during the biopsy of tissues from typical soft tissues to bone and is the addition to our prior study [68].

5. Conclusions

This work presents the design and fabrication of an MRF-based haptic device for robotic bone biopsy. The device design was broken into three complimentary studies. The first study included a robotic setup and was designed to record force measurements from different ex-vivo tissues to characterize design requirements for the MRF device. A wide range of force magnitudes (from soft tissue to bone) were recorded via the slave robot and inputted into the proposed device. A second study outlined the development of a force generating module where the force measurements were used as estimators and validators for a nonlinear black-box model used to predict the behavior of the MRF. An analysis of the modeling performance was completed for the nonlinear black-box models of the MRF-based device. The modeling results indicated that the H-W model is capable of predicting the behavior of the MRF with high precision. Following the assessment of the H-W model, a third series of experiments were designed to validate the feasibility of using H-W modeling in a closed-loop control. The root mean square error of the nonlinear H-W model was 0.34, which confirms that the model can be used to estimate the output force of the device accurately. Therefore, it was concluded that the control technique constructed based on the H-W model can provide the desired force profile with no hysteresis.

Author Contributions

E.S. conceived and designed the experiments. E.S. performed the experiments. E.S. analyzed the data. A.A.G., J.M.D., K.W.E., and M.K., and contributed reagents/materials/analysis tools. E.S. and K.W.E. wrote the paper.

Funding

This work was supported financially by Andrew A. Goldenberg’s Natural Sciences and Engineering Research Council of Canada (NSERC)—Collaborative Health Research Projects (CHRP) Grant 385860-10.

Acknowledgments

The authors would like to acknowledge the contribution of Peyman Shokrollahi, Dale Podolsky, Kimia Sorouri, and Thomas Looi and the Center of Image Guided Innovation and Therapeutic Innovations at the Hospital for Sick Children in Toronto, Canada.

Conflicts of Interest

The authors declare no conflict of interest.

References

  1. Moche, M.; Zajonz, D.; Kahn, T.; Busse, H. MRI-guided procedures in various regions of the body using a robotic assistance system in a closed-bore scanner: Preliminary clinical experience and limitations. J. Magn. Reson. Imaging 2010, 31, 964–974. [Google Scholar] [CrossRef] [PubMed] [Green Version]
  2. Okamura, A.M. Haptic feedback in robot-assisted minimally invasive surgery. Curr. Opin. Urol. 2009, 19, 102–107. [Google Scholar] [CrossRef] [PubMed] [Green Version]
  3. Wagner, C.R.; Howe, R.D. Force feedback benefit depends on experience in multiple degree of freedom robotic surgery task. IEEE Trans. Robot. 2007, 23, 1235–1240. [Google Scholar] [CrossRef]
  4. Olabi, A.G.; Grunwald, A. Design and application of magneto-rheological fluid. Mater. Des. 2007, 8, 2658–2664. [Google Scholar] [CrossRef] [Green Version]
  5. Bhau, K.K.; Satyajit, R.P.; Suresh, M.S. Synthesis and characterization of magneto-rheological (MR) fluids for MR brake application. Eng. Sci. Technol. 2015, 18, 432–438. [Google Scholar]
  6. Bicchi, A.; Raugi, M.; Rizzo, R.; Sgambelluri, N. Analysis and design of an electromagnetic system for the characterization of Magneto-Rheological fluids for haptic interfaces. IEEE Trans. Magn. 2005, 41, 1876–1879. [Google Scholar] [CrossRef]
  7. Li, W.; Liu, B.; Kosasih, P.; Zhang, X. A 2-DOF MR actuator joystick for virtual reality applications. Sens. Actuators 2007, 137, 308–320. [Google Scholar] [CrossRef]
  8. Yamaguchi, Y.; Furusho, S.; Kimura, S.; Koyanagi, K. Development of high-performance MR actuator and its application to 2D force display. Int. J. Mod. Phys. B 2005, 19, 1485–1491. [Google Scholar] [CrossRef]
  9. Blake, J.; Gurocak, H. Haptic glove with MR brakes for virtual reality. IEEE/ASME Trans. Mechatron. 2009, 14, 606–615. [Google Scholar] [CrossRef]
  10. Koo, J.H.; Goncalves, F.D.; Ahmadian, M. A comprehensive analysis of the response time of MR dampers. Smart Mater. Struct. 2006, 15, 351–358. [Google Scholar] [CrossRef]
  11. Poynor, J.C. Innovative Designs for Magneto-Rheological Dampers. Ph.D. Thesis, Virginia Polytechnic Institute and State University, Blacksburg, VA, USA, 2001. [Google Scholar]
  12. Kciuk, M.; Turczyn, R. Properties and application of magnetorheological fluids. J. Achiev. Mater. Manuf. Eng. 2006, 18, 127–130. [Google Scholar]
  13. Ong, F.R.; Bouazza-Marouf, K. Evaluation of bone strength: Correlation between measurements of bone mineral density and drilling force. Proc. Inst. Mech. Eng. 2000, 214, 385–399. [Google Scholar] [CrossRef] [PubMed] [Green Version]
  14. Alam, K.; Mitrofanov, A.V.; Silberschmidt, V.V. Experimental investigations of forces and torque in conventional and ultrasonically-assisted drilling of cortical bone. Med. Eng. Phys. 2011, 33, 234–239. [Google Scholar] [CrossRef] [PubMed] [Green Version]
  15. Lee, J.; Gozen, B.A.; Ozdoganlar, O.B. Modeling and experimentation of bone drilling force. J. Biomech. 2012, 45, 1076–1083. [Google Scholar] [CrossRef] [PubMed]
  16. Chen, J.Z.; Liao, W.H. Design, testing and control of a magnetorheological actuator for assistive knee braces. Smart Mater. Struct. 2010, 19, 035029. [Google Scholar] [CrossRef]
  17. Kikuchi, T.; Oda, K.; Furusho, J. Leg-robot for demonstration of spastic movements of brain-injured patients with compact magnetorheological fluid clutch. Adv. Robot. 2010, 24, 671–686. [Google Scholar] [CrossRef]
  18. Yadmellat, P.; Shafer, A.S.; Kermani, M.R. Design and development of a single-motor, two-DOF, safe manipulator. IEEE/ASME Trans. Mech. 2014, 19, 1384–1391. [Google Scholar] [CrossRef]
  19. Ahmadkhanlou, F.; Washington, G.N.; Bechtel, S.E.; Wang, Y. MagnetoRheological fluid based automotive steer-by-wire systems. In Smart Structures and Materials 2006: Industrial and Commercial Applications of Smart Structures Technologies; International Society for Optics and Photonics: San Diego, CA, USA, 2006; Volume 6171. [Google Scholar]
  20. Boada, M.J.L.; Calvo, J.A.; Boada, B.L.; Diaz, V. Modeling of a magnetorheological damper by recursive lazy learning. Int. J. Non-Linear Mech. 2011, 46, 479–485. [Google Scholar] [CrossRef]
  21. Stanway, R.; Sproston, J.L.; Stevens, N.G. Non-linear modeling of an electrorheological vibration damper. J. Electrostat. 1987, 20, 167–184. [Google Scholar] [CrossRef]
  22. Spencer, B.F.; Dyke, S.J.; Sain, M.K.; Carlson, J.D. Phenomenological model of a magneto-rheological damper. J. Eng. Mech. 1997, 123, 230–238. [Google Scholar] [CrossRef]
  23. Choi, S.B.; Lee, S.K. A hysteresis model for the field-dependent damping force of amagneto-rheological damper. J. Sound Vib. 2001, 245, 375–383. [Google Scholar] [CrossRef]
  24. Truong, D.Q.; Ahn, K.K. Nonlinear black-box models and force-sensorless damping control for damping systems using magneto-rheological fluid dampers. Sens. Actuators 2011, 167, 556–573. [Google Scholar] [CrossRef]
  25. Hudha, K.; Jamaluddin, H.; Samin, P.M.; Rahman, R.A. Non-parametric linearised data driven modelling and force tracking control of a magnetorheological damper. Int. J. Veh. Des. 2008, 46, 250–269. [Google Scholar] [CrossRef]
  26. Chang, C.C.; Roschke, P. Neural Network Modeling of a Magnetorheological Damper. J. Intell. Mater. Syst. Struct. 1998, 9, 755–764. [Google Scholar] [CrossRef]
  27. Rahiman, M.H.F.; Taib, M.N.; Salleh, Y.M. Black box modeling of steam distillation essential oil extraction system using NNARX Structure. In Proceedings of the 2007 International Conference on Intelligent and Advanced Systems, Kuala Lumpur, Malaysia, 25–28 November 2007; pp. 1059–1062. [Google Scholar]
  28. Biagiola, S.I.; Figueroa, J.L. Wiener and Hammerstein uncertain models identification. Math. Comput. Simul. 2009, 79, 3296–3313. [Google Scholar] [CrossRef]
  29. Wingerden, J.; Verhaegen, M. Closed-loop subspace identification of Hammerstein-Wiener models. In Proceedings of the 48th IEEE Conference on Decision and Control, Shanghai, China, 15–18 December 2009; pp. 3637–3642. [Google Scholar] [CrossRef]
  30. Gonenc, B.; Gurocak, H. Virtual needle insertion with haptic feedback using a hybrid actuator with DC servomotor and MR-brake with Hall-effect sensor. Mechatronics 2012, 22, 1161–1176. [Google Scholar] [CrossRef]
  31. Shokrollahi, E.; Price, K.; Drake, J.M.; Goldenberg, A.A. Design and development of magnetorheological fluid-based passive actuator. In Proceedings of the 2015 37th Annual International Conference of the IEEE Engineering in Medicine and Biology Society (EMBC), Milan, Italy, 25–29 August 2015; pp. 4883–4886. [Google Scholar]
  32. Macavelia, T.; Salahi, M.; Olsen, M.; Crookshank, M.; Schemitsch, E.H.; Ghasempoor, A.; Janabi Sharifi, F.; Zdero, R. Biomechanical measurements of surgical drilling force and torque in human versus artificial femurs. J. Biomech. Eng. 2012, 134, 12. [Google Scholar] [CrossRef] [PubMed]
  33. Brouwer, I.; Ustin, J.; Bentley, L.; Sherman, A.; Dhruv, N.; Tendick, F. Measuring in vivo animal soft tissue properties for haptic modeling in surgical simulation. Med. Meets Virtual Real. 2001, 9, 69–74. [Google Scholar]
  34. Simone, C.; Okamura, A.M. Modeling of needle insertion forces for robot-assisted percutaneous therapy. In Proceedings of the 2002 IEEE International Conference on Robotics and Automation (Cat. No.02CH37292), Washington, DC, USA, 11–15 May 2002; pp. 2085–2091. [Google Scholar]
  35. Allotta, B.; Giacalone, G.; Rinaldi, L. A hand-held drilling tool for orthopedic surgery. IEEE/ASME Trans. Mech. 1997, 2, 218–229. [Google Scholar] [CrossRef]
  36. Stankewich, C.J.; Chapman, J.; Muthusamy, R.; Quaid, G.; Schemitsch, E.; Tencer, A.F.; Ching, R.P. Relationship of mechanical factors to the strength of proximal femur fractures fixed with cancellous screws. J. Orthop. Trauma 1996, 10, 248–257. [Google Scholar] [CrossRef] [PubMed]
  37. Meeker, D.C. Finite Element Method Magnetics, Version 4.2. Available online: http://www.femm.info (accessed on 31 October 2014).
  38. Corporation Lord, MRF-122EG Magneto-Rheological Fluid. 2013. Available online: http://www.lord.com/products-and-solutions/magnetorheological-(mr)/product.xml/1644/1 (accessed on 04 July 2014).
  39. Qin, H.; Song, A.; Zeng, X.; Hu, S. Design and evaluation of a small-scale multi-drum magnetorheological brake. J. Intell. Mater. Syst. Struct. 2018, 29, 2607–2618. [Google Scholar] [CrossRef]
  40. Jiles, D.C.; Thoelkc, J.B.; Devine, M.K. Numerical determination of hysteresis parameters for the modeling of magnetic properties using the theory of ferromagnetic hysteresis. IEEE Trans. Magn. 1992, 28, 27–35. [Google Scholar] [CrossRef]
  41. Jolly, M.; Bender, J.; Carlson, J. Properties and applications of commercial Magneto-Rheological fluids. J. Intell. Mater. Syst. Struct. 1998, 10, 5–13. [Google Scholar] [CrossRef]
  42. Avraam, M.T. MR-Fluid Brake Design and Its Application to a Portable Muscular Rehabilitation Device. Ph.D. Thesis, Université Libre de Bruxelle, Bruxelle, Belgium, 2009. [Google Scholar]
  43. Ljung, L. System Identification: Theory for the User; Prentice-Hall: Englewood Cliffs, NJ, USA, 1987. [Google Scholar]
  44. Wang, D.H.; Liao, W.H. Modeling and control of magnetorheological fluid dampers using neural networks. Smart Mater. Struct. 2004, 14, 111. [Google Scholar] [CrossRef]
  45. Hussain, M.N.M.; Omar, A.M.; Saidin, P.; Samat, A.A.A.; Hussain, Z. Identification of Hammerstein-Weiner system for normal and shading operation of photovoltaic system. Int. J. Mach. Learn. Comput. 2012, 2, 239. [Google Scholar] [CrossRef]
  46. Akaike, H. Stochastic theory of minimal realization. IEEE Trans. Autom. Control 1974, 19, 667–674. [Google Scholar] [CrossRef]
  47. Giwa, A.; Karacan, S. Nonlinear black-box modeling of a reactive distillation process. J. Eng. Res. Technol. 2012, 1, 548–557. [Google Scholar]
  48. Ljung, L. Black-box models from input-output measurements. In Proceedings of the 18th IEEE Instrumentation and Measurement Technology Conference. Rediscovering Measurement in the Age of Informatics (Cat. No.01CH 37188), Budapest, Hungary, 21–23 May 2001; pp. 138–146. [Google Scholar]
  49. Patcharaprakiti, N.; Kirtikara, K.; Chenvidhya, D.; Monyakul, V.; Muenpinij, B. Modeling of single phase inverter of photovoltaic system using system identification. In Proceedings of the 2010 Second International Conference on Computer and Network Technology, Bangkok, Thailand, 23–25 April 2010; pp. 462–466. [Google Scholar]
  50. D’Ausilio, A. Arduino: A low-cost multipurpose lab equipment. Behav. Res. Methods 2012, 44, 305–313. [Google Scholar] [CrossRef] [PubMed]
  51. Goncalves, F.D. Characterizing the Behavior of Magnetorheological Fluids at High Velocities and High Shear Rates. Ph.D. Thesis, Virginia Polytechnic Institute and State University, Blacksburg, VA, USA, 2005. [Google Scholar]
  52. Koo, J.H. Using Magnetorheological Dampers in Semiactive Tuned Vibration Absorbers to Control Structural Vibrations. Ph.D. Thesis, Virginia Polytechnic Institute and State University, Blacksburg, VA, USA, 2003. [Google Scholar]
  53. Murray-smith, D.J. Methods for the external validation of continuous system simulation models: A review. Math. Comput. Model. Dyn. Syst. 1998, 4, 5–31. [Google Scholar] [CrossRef]
  54. Akaike, H. Power spectrum estimation through autoregressive model fitting. Ann. Inst. Statist. Math. 1969, 21, 407–419. [Google Scholar]
  55. Guni, G.; Irawan, A. Identification and characteristics of parallel actuation robot’s leg configuration using Hammerstein-Wiener approach. J. Electr. Electron. Control Instrum. 2016, 1, 10. [Google Scholar]
  56. Vörös, J. An iterative method for Hammerstein-Wiener systems parameter identification. J. Electr. Eng. 2004, 55, 328–331. [Google Scholar]
  57. Shokrollahi, E.; Goldenberg, A.A.; Drake, J.M.; Eastwood, K.W.; Kang, M. Development and control of a magnetorheological haptic device for robot assisted surgery. In Proceedings of the 2017 39th Annual International Conference of the IEEE Engineering in Medicine and Biology Society (EMBC), Seogwipo, Korea, 11–15 July 2017; pp. 3926–3929. [Google Scholar]
  58. Samur, E.; Sedef, M.; Basdogan, C.; Avtan, L.; Duzgun, O. A robotic indenter for minimally invasive measurement and characterization of soft tissue response. Med. Image Anal. 2007, 11, 361–373. [Google Scholar] [CrossRef] [PubMed]
  59. Jiang, S.; Li, P.; Yu, Y.; Liu, J.; Yang, Z. Experimental study of needle–tissue interaction forces: Effect of needle geometries, insertion methods and tissue characteristics. J. Biomech. 2014, 47, 3344–3353. [Google Scholar] [CrossRef] [PubMed] [Green Version]
  60. Najmaei, N. Design of a Haptic Interface for Medical Applications Using Magneto-Rheological Fluid Based Actuators. Ph.D. Thesis, University of Western Ontario, London, ON, Canada, 2014. [Google Scholar]
  61. Liu, B.; Li, W.H.; Kosasih, P.B. Development of an MR-brake-based haptic device. Smart Mater. Struct. 2007, 15, 1960–1966. [Google Scholar] [CrossRef]
  62. Iwata, H.; Nakagawa, T.; Nakashima, T. Force display for presentation of rigidity of virtual objects. J. Robot. Mech. 1992, 24, 39–42. [Google Scholar] [CrossRef]
  63. Wang, E.R.; Ma, X.Q.; Rakheja, S.; Su, C.Y. Modeling hysteretic characteristics of an MR-fluid damper. In Proceedings of the 41st IEEE Conference on Decision and Control, Las Vegas, NV, USA, 10–13 December 2002; pp. 537–550. [Google Scholar]
  64. Wang, D.H.; Liao, W.H. Magnetorheological fluid dampers: A review of parametric modeling. Smart Mater. Struct. 2011, 20, 02300. [Google Scholar] [CrossRef]
  65. Erol, O.G.; Gonenc, B.; Senkal, D.; Alkan, S.; Gurocak, H. Magnetic induction control with embedded sensor for elimination of hysteresis in magnetorheological brakes. J. Intell. Mater. Syst. Struct. 2012, 23, 427–440. [Google Scholar] [CrossRef]
  66. Joseph, D.S. Parameter Identification for the Preisach Model of Hysteresis. Ph.D. Thesis, Virginia Polytechnic Institute and State University, Blacksburg, VA, USA, 2001. [Google Scholar]
  67. Igarashi, H.; Lederer, D.; Kost, A.; Honma, H.; Nakata, T. Numerical investigation of Preisach and Jiles models for magnetic hysteresis. J. Comput. Math. Electr. Electron. Eng. 1998, 17, 357–363. [Google Scholar] [CrossRef]
  68. Shokrollahi, E. Design and Development of a Force Generator Based on Magnetorheological Fluid. Ph.D. Thesis, University of Toronto, Toronto, ON, Canada, 2018. [Google Scholar]
Figure 1. Slave console comprising a DENSO robot, force sensor, surgical needle, animal tissue, and gripping platform.
Actuators 07 00083 g001
Figure 2. (a) The cross sectional view of MRF FGM, the MRF close to the coil, and within the base. The dimensions are as follows: l = 0.06 m, L = 0.01 m, t = 0.01 m, h = 0.005 m, R = 0.015 m, and r = 0.005 m. The coil is between the fluid and the base of the FGM. (b) Photograph of the MRF FGM. (c) Magnetic field distribution inside the MRF FGM that shows the magnitude of the flux density (T) within the MRF gap obtained with FEMM. The flux path is marked by contour lines, which form a loop through the structure.
Actuators 07 00083 g002
Figure 3. Block diagram of the H-W model consisting of a linear dynamic block cascaded between two static nonlinear blocks.
Actuators 07 00083 g003
Figure 4. Schematic architecture of the experimental setup.
Actuators 07 00083 g004
Figure 5. Experimental setup when connecting the FGM to the slave robot using a computer setting with MATLAB.
Actuators 07 00083 g005
Figure 6. Control loop design using a force sensor in the feedback loop.
Actuators 07 00083 g006
Figure 7. Control loop design using a nonlinear H-W model to estimate output force.
Actuators 07 00083 g007
Figure 8. (a) Example of a soft tissue force measurement (bovine liver). (b) Example of the bone drilling force profile (chicken femur).
Actuators 07 00083 g008
Figure 9. Applied current-force diagram. The two curves represent the two force values present in the system at each current level due to hysteresis. The observed hysteresis can be attributed to magnetization of steel components in the device.
Actuators 07 00083 g009
Figure 10. The dataset was divided into estimation (used for estimating the model) and validation (used for validating the results) data. (a) Input to the device based on the actual force measurements for a bovine heart tissue. (b) Output measured from the force sensor. The first 8 seconds of the input-output measurements was used estimation data. The next 8 seconds of data was used as validation data.
Actuators 07 00083 g010
Figure 11. Nonlinear black-box H-W model simulations of the validation data. The orange and black traces represent the simulated and measured output force values, respectively.
Actuators 07 00083 g011
Figure 12. Closed-loop control with force sensor (input: 1 Hz sine wave).
Actuators 07 00083 g012
Figure 13. Multistep input with (a) a force sensor and (b) H-W modeling.
Actuators 07 00083 g013
Table 1. Puncture force associated with different tissue types.
TissueMaximum Force [N]Median Force [N]
Porcine heart2.57 ± 0.291.16 ± 0.10
Porcine liver1.78 ± 0.300.94 ± 0.36
Bovine heart5.70 ± 0.292.76 ± 0.47
Bovine liver2.34 ± 0.82860.66 ± 0.56
Chicken breast0.61 ± 0.10.44 ± 0.08
Chicken leg9.50 ± 0.315.20 ± 0.10
Bovine femora50.0 ± 2.2624.00 ± 1.25
Porcine femora49.20 ± 1.9022.10 ± 2.10
Table 2. Summary of FGM design and performance parameters.
ParameterValue
Height10 cm
Outer diameter6 cm
Weight1.5 Kg
Materials 1010 steel, MRF122-EG
Core radius2 cm
Core outer radius3 cm
Core length6 cm
Wire gauge24 AWG
Number of turns
Off-state force
Working range
1100
0.4 N
0.4–47 N
Linear actuator
Power consumption
L16 linear actuator (100 mm, 150:1, 12 V w/potentiometer feedback)
12 W
Table 3. Nonlinear input and output channel estimators assessed in H-W modeling.
ModelNonlinearModel Properties
Input ChannelOutput ChannelFit (%)MSEFPE
Nlhw1Piecewise linearPiecewise linear71.950.05400.0800
Nlhw2Sigmoid networkPiecewise linear75.510.06600.0600
Nlhw3Sigmoid networkSigmoid network94.840.00020.0001
Nlhw4Wavelet networkSigmoid network79.000.08100.0500
Nlhw5Wavelet networkWavelet network69.880.10000.3000
Nlhw6Polynomial Wavelet network72.020.00040.0004
Nlhw7Polynomial Polynomial65.909.0001.200

