Article

Scalloping and Stress Concentration in DRIE-Manufactured Comb-Drives

1
Sapienza University of Rome, Dept. Structural and Geotechnical Engineering, 00184 Rome, Italy
2
Università degli studi Niccolò Cusano, 00166 Rome, Italy
3
MNF-CMM Kessler Foundation for Research, 38123 Trento, Italy
4
Gruppo Nazionale di Fisica Matematica, 00185 Rome, Italy
5
Department of Engineering, Università degli studi di Roma Tre, 00154 Rome, Italy
*
Author to whom correspondence should be addressed.
Current address: Dipartimento di Ingengeria, via della vasca navale 79, 00146 Rome, Italy.
Actuators 2018, 7(3), 57; https://doi.org/10.3390/act7030057
Submission received: 23 July 2018 / Revised: 30 August 2018 / Accepted: 4 September 2018 / Published: 5 September 2018
(This article belongs to the Special Issue Micromanipulation)

Abstract

:
In the last decades, microelectromechanical systems have been increasing their number of degrees of freedom and their structural complexity. Hence, most recently designed MEMSs have required higher mobility than in the past and higher structural strength and stability. In some applications, device thickness increased up to the order of tens (or hundred) of microns, which nowadays can be easily obtained by means of DRIE Bosch process. Unfortunately, scalloping introduces stress concentration regions in some parts of the structure. Stress concentration is a dangerous source of strength loss for the whole structure and for comb-drives actuators which may suffer from side pull-in. This paper presents an analytical approach to characterize stress concentrations in DRIE micro-machined MEMS. The method is based on the linear elasticity equations, the de Saint-Venant Principle, and the boundary value problem for the case of a torsional state of the beam. The results obtained by means of this theoretical method are then compared with those obtained by using two other methods: one based on finite difference discretization of the equations, and one based on finite element analysis (FEA). Finally, the new theoretical approach yields results which are in accordance with the known value of the stress concentration factor for asymptotically null radius notches.

1. Introduction

Interest in microelectromechanical systems devices has steadily increased in the last years. Micro-scale technologies have proven to be very effective, playing a prominent role in a wide variety of applications from different fields, such as drug delivery [1,2,3,4,5], aerospace [6,7], medical diagnosis [8,9], surgical applications [10,11,12], and cell manipulation [13,14,15].
Since 2013 [16,17], a new class of MEMS, equipped with Conjugate Surface Flexure Hinges (CSFH) has been developed [18,19] and fabricated [20]. A sample of CSFH is depicted in Figure 1. These systems consist essentially of micro compliant mechanisms where the flexure hinges are manufactured as CSFHs. In such kind of flexure, the thickest rigid elements are linked by a certain number of CSFHs, where each CSFH consists of a curved beam together with a portion of a conjugate-profile pair, as illustrated in Figure 1. According to the CSFH design, the center of each arc is coincident with the center of the elastic weights of the curved beam [21].
The availability of CSFH hinges gave rise to the design and fabrication of new devices, such as microrobots [16,17,22,23,24] micromechanisms [17,25], microgrippers [18,26,27,28], and even a microtribometer [29].
In-plane MEMSs perform properly only if their flexible elements offer high compliance selectivity around the perpendicular axis. Hence, high aspect ratio structures are desirable. While surface micro-machining offers, typically, thickness from 2 to 5 μ m, the Deep-Reactive Ion Etching (DRIE) process is used to obtain thickness of 50 μ m and much more.
Since 1993 [30], Bosch DRIE process has introduced an effective method to provide, simultaneously, high mask selectively and very high anisotropy of the etched structure. In 1999, the scalloping observed on vertical walls during time multiplexed deep etching (TMDE), the roughness of horizontal surfaces exposed to the glow discharge, and the radius at the bottom of etched features were highlighted [31]. Few years later, it was demonstrated that important features of the samples, such as achievable anisotropy, etching uniformity, fillet radii, and, mainly, surface roughness, are strongly dependent on chamber pressure, applied coil and electrode power, and reactant gases flow rate [32]. This experimental observation lays the groundwork for the present investigation. In fact, scalloped sidewall roughness affects the performance of DRIE-manufactured comb-drives from both an electrical and a mechanical point of view. An example of DRIE-manufactured rotary comb-drive is depicted in Figure 1.
Considering the electrical aspect, scalloping determines, along the thickness of the device layer, gap variations between the facing surfaces of the fixed and movable fingers. Therefore, it affects the force or the torque exerted by the linear or rotary comb-drive, respectively. Furthermore, charge concentrations occur in sharp edges [33], determining variations of the electric field along the thickness direction.
From a mechanical perspective, it was observed that [31,32] post etch behavior for specimens with high surface roughness always indicated low fracture strength, whereas for specimens with better surface quality there was a wider distribution in sample strength. In addition, recent experimental tests [34] showed that some teeth are subject to lateral pull-in, with possible large deflection and instability.
The present investigation focuses on the mechanical aspect.
As discussed in the next paragraph, one source of strength decay is the stress concentration factor, which holds in those zones where surface discontinuities appear. In high aspect ratio DRIE Bosch process, problems and challenges regarding scalloping attenuation have been reported in various investigations [35,36,37,38,39,40], although the problem presented several difficulties.
More recently, it has been shown that the sidewall roughness varies with the depth and depends on the trench width. In addition, the surface upper region exhibits a scalloping morphology, while the rougher lower region shows a curtaining morphology [41]. Although cryogenic-DRIE (see for example Refs. [42,43,44,45]) has recently been employed to fabricate trenches with highly vertical sidewalls and obtained relatively smooth surfaces, Bosch DRIE remains of great interest for the construction of many devices.
In 2012, a study [46] dedicated to Through-Silicon Via (TSV) technology showed that an etch method not based on Bosch process can get quite smooth sidewalls with no scalloping, together with a good control of the etched profile.
Since scalloping is not acceptable in specific applications, a dedicated effort has been provided to control and reduce it, mainly based on the optimization of DRIE process parameters [47,48,49,50], or, alternatively, removing it after fabrication [38].
Unfortunately, indentations and notches on the surface of a DRIE manufactured device give rise to high stress concentration that leads the samples to break at an unexpectedly low load.
The present work intends to contribute in filling this gap and to investigate about the shear stress distribution in the neighborhood of each single scalloped discontinuity on the walls device.
Hence, to develop a theoretical model, a uniform cantilever beam with circular cross section has been considered. To model the scalloping effect, a circular region, or notch, has been subtracted from the beam cross section. The center of the notch lies on the cross section profile.
By applying the linear elasticity theory to the beam with notched cross section, the shear stress distribution can be obtained analytically for the case of pure torsion. The idea of studying the beam torsional state can be justified by considering that stress concentration is actually due to tangential tensions. In addition, the shearing force is quite likely eccentric with respect to the center of shear of the cross-section. This implies a twisting moment acting on the beam, which is dangerous because of the very low torsion rigidity of thin-walled open profiles. Furthermore, the equations are integrated also by using a numerical approach based on finite discretization of the section and finite differences. Finally, the results are compared to those obtained with finite element analysis (FEA).

2. Motivation of This Work

The Bosh DRIE process is performed by means of pulsed regimes in two steps: in the first one, plasma etches the wafer along mainly the vertical direction, while in the second phase a passivation layer (Polytetrafluoroethylene) is chemically deposited on the silicon surface thanks to the action of a source gas (usually Octafluorocyclobutane). The two steps are iterated in such a way that, after each surface passivation phase, an etching phase follows, during which ions attack selectively the passivation layer at the bottom of the trench but not along the side walls. This iterative process permits very deep vertical etching [30]. However, the etching phase affects also the lateral walls and so the side is not perfectly planar, but it is rather undulating, as pictorially represented in Figure 2. The first image, reported in Figure 2a, represents a simplified scheme of a portion of a SOI wafer, after four cycles (note that the stop layer, represented in gray color, is reached after one more cycle only). The central cantilever beam appears after the wet etching phase, as illustrated in Figure 2b,c, during which the oxide is partially removed.
As known, any geometric irregularity on the cross section of a beam is responsible for stress concentration, which decreases its actual strength. The capability of micro-electromechanical systems (MEMS) to move is a direct consequence of their embedded flexures. According to the adopted process, a SOI (Silicon on Insulator) is used to obtain a suspended so-called device layer that can move along in-plane directions. The geometry of the device is designed and then transferred to the device layer by means of a mask. In the device layer, there are some pseudo-rigid parts that achieve motion capability because of the presence of flexible micro-beams. It is therefore clear that the strength of the micro-beams affects performance and reliability of the whole microsystem.
Given the large variety of applications, micro-beams in MEMS are used for many different purposes. For example, they can be used either to create the fingers (linear or curved) of a comb-drive actuators or as a structural element (once again linear of curved) of a flexure. Therefore, these micro-beams are generally subject to local or distributed external forces that induce shear tensions on the beam cross-section. These forces may act along either an out-of-plane or an in-plane direction. Out-of-plane tensions are represented in Figure 2b, while in-plane tensions are depicted in Figure 2c. In the case of comb-drive actuators, fingers are subject to the lateral pull-in effect, and therefore they are inflected around an axis that is orthogonal to the pane of motion (in-plane inflection). On the other hand, surface forces, such as electrostatic forces, may act perpendicularly to the plane of motion, giving rise to out-of-plane inflection.
Furthermore, since the gaps among fingers can be reduced to as small as one micron, the possible inflection is responsible for stitching, which makes the MEMS practically impossible to use any further. The mechanics of adhesion this context has been extensively discussed in a recent review [51], where some fundamental parameters for microscale adhesion in MEMS are discussed in detail.
Figure 3 shows scalloping over nine fingers of a circular comb-drive that the authors use for MEMS actuation. Although comb-drives fingers do not present direct contacts, mechanical impacts, vibrations or electrostatic field forces can still play a certain action on the fingers.
However, a much greater stress state is generated on the curved beam which sustains the moving parts. For example, in the case of CSFH hinges [34], the curved beam is bent around an axis which is orthogonal to the plane of motion.
Figure 4 shows how scalloping produces roughness on one finger surface.

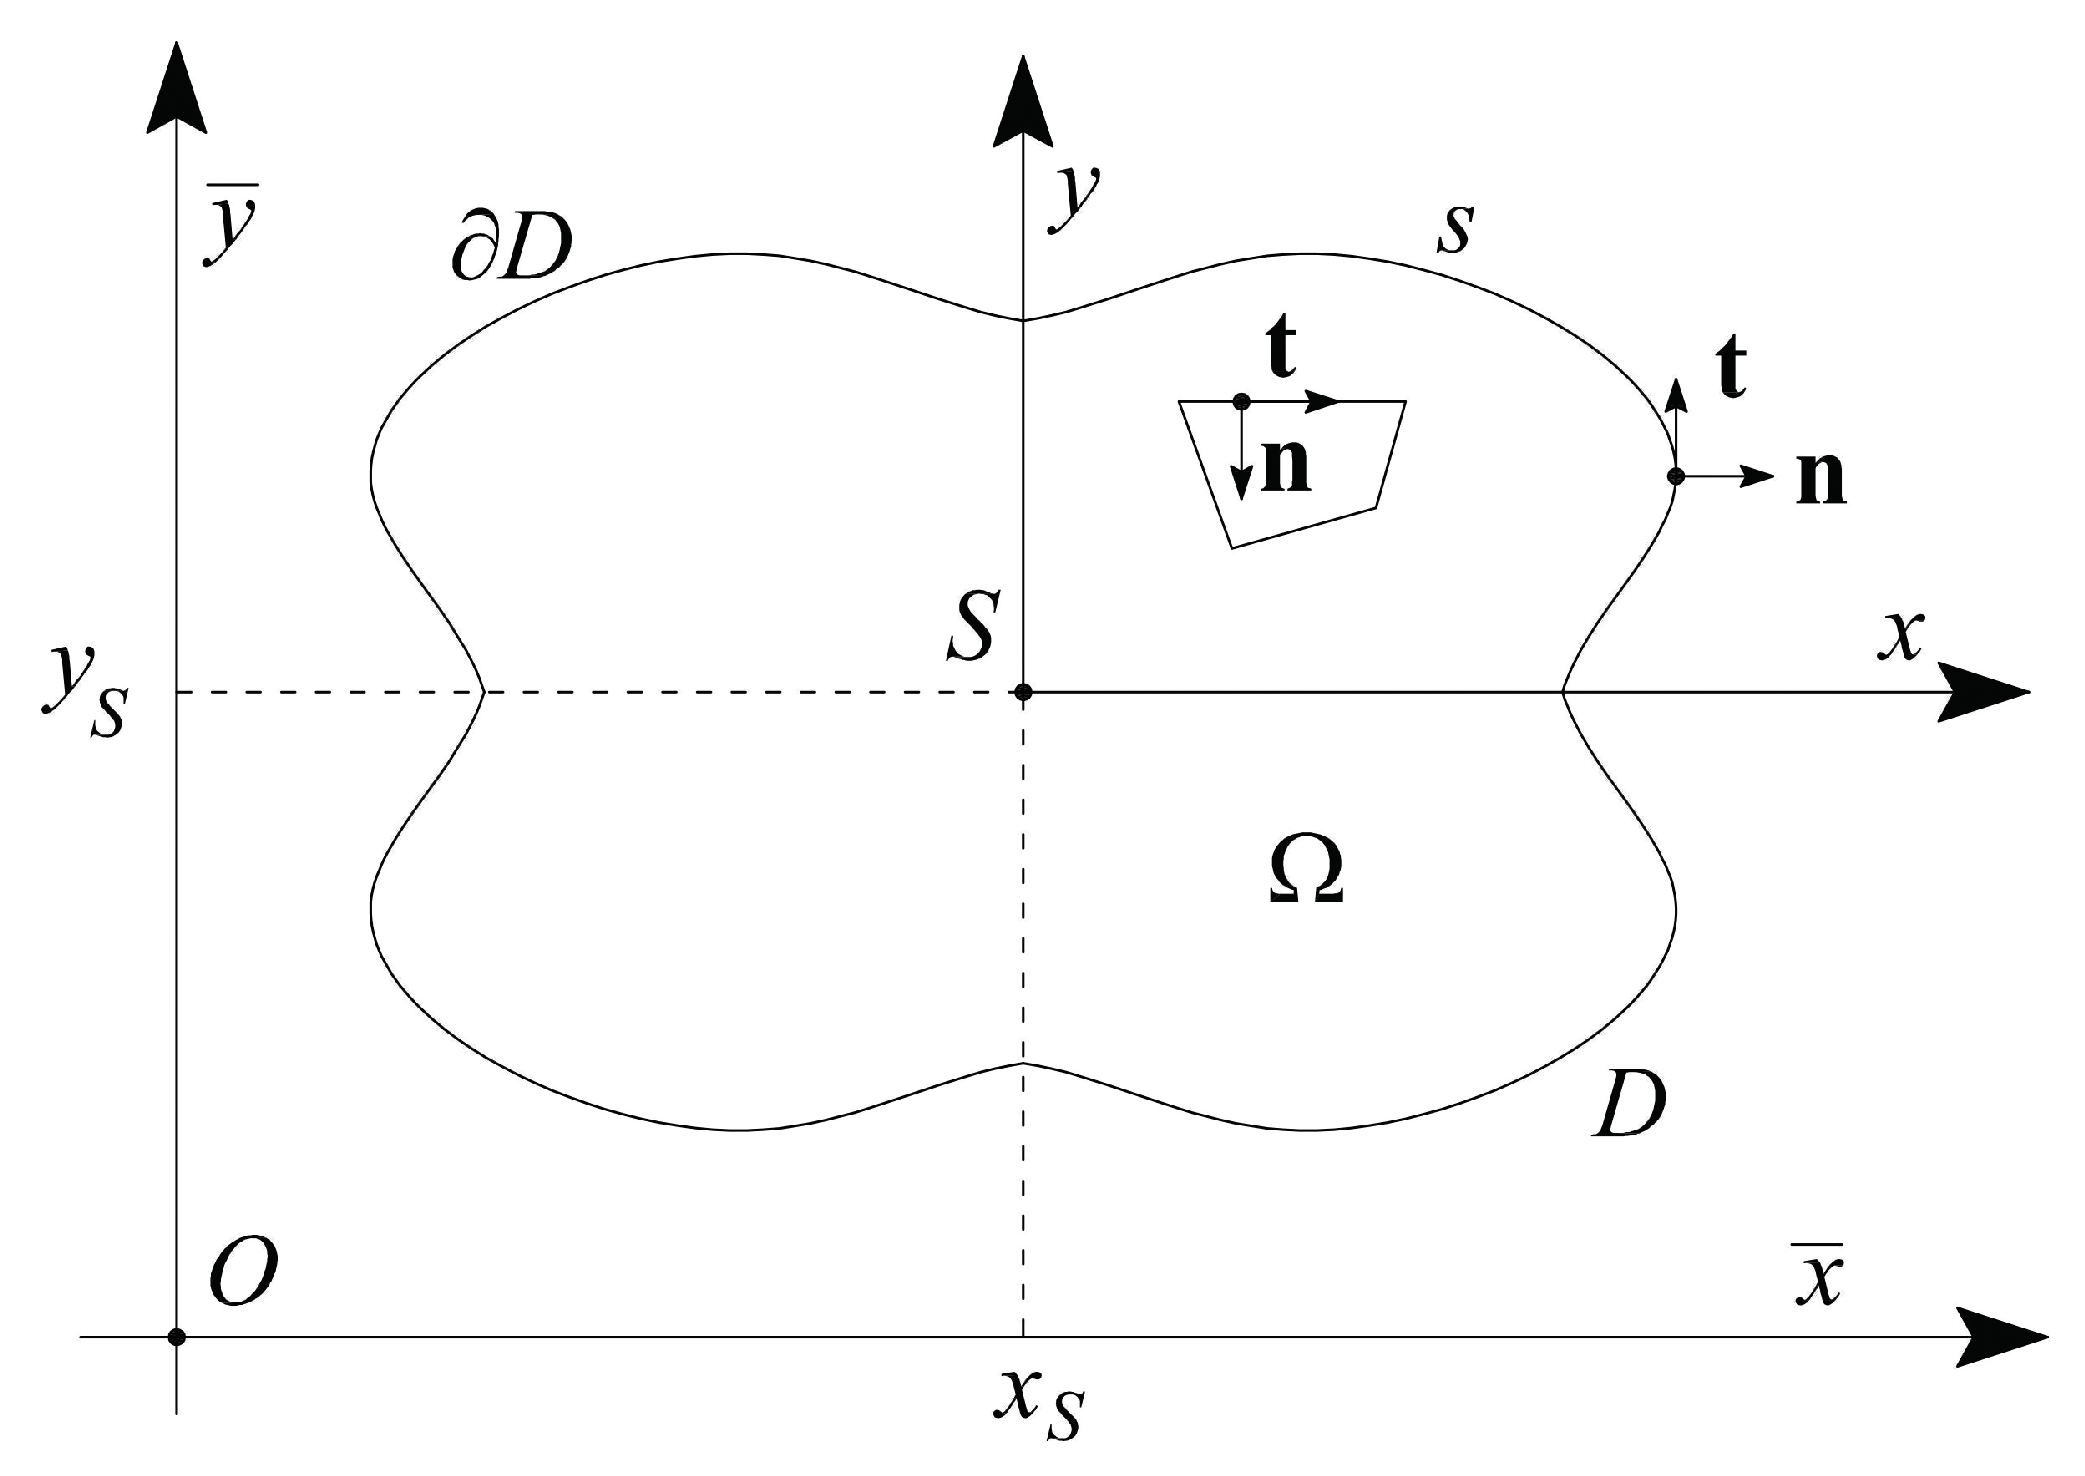
3. Theoretical Background

We refer to a prismatic beam as a region bounded by an exterior cylindrical surface and two terminal plane sections perpendicular to the generators [52]. The beam axis has a mild curvature compared to its thickness, so the theory for straight beams can be extended to this case of study. According to Ref. [53], this assumption is true when the ratio of the curvature radius to thickness is greater than 5.
The generic cross-section is depicted in Figure 5. Axes x and y, not necessarily principal of inertia, intersect each other in the centroid S and form an orthogonal Cartesian frame with z lying along the direction of the beam axis.
The present formulation applies with no restriction to cross-sections of arbitrary shape and also to hollow beams. However, the case of simply-connected domain is analyzed here.
In the case of two axes of symmetry, the section centroid coincides with the center of shear, and extension, bending, and torsion are uncoupled if forces are applied to S [54,55,56,57,58].
The cross-section is a domain D of area Ω , bounded by the exterior directrix s whose direction is uniquely defined asking the associated outward normal n and tangent t unit vectors to form a right-handed system with the unit vector e ^ z .
In the following sections, shear stresses is determined from the theory of linear elasticity. Once the stress and strain tensors are defined, the semi-inverse method of Saint-Venant [59,60,61] is applied by setting [52,54,55,57,58]
σ x = σ y = τ x y 0 ,
the equilibrium equations, neglecting body forces, read
τ x z z = 0 ,
τ y z z = 0 ,
σ z z + τ x z x + τ y z y = 0 .
Assuming the exterior surface to be free of stress corresponds to setting
τ x z d y τ y z d x = 0
on D , with d y = n x d s and d x = n y d s .
The hypotheses of isotropy and linear elastic behavior of the material lead to the stress-strain relations:
σ z = E ϵ z = E w z ,
τ x z = G γ x z = G u z + w x ,
τ y z = G γ y z = G v z + w y ,
where u = [ u , v , w ] T is the small displacement field, and E and G are Young’s and shear modulus, respectively.
The stress resultants on the cross-section are the normal and shear forces T z , T x , T y and the twisting and bending couples M z , M x and M y :
T z = D σ z d x d y , M x = D y σ z d x d y , T x = D τ x z d x d y , M y = D x σ z d x d y , T y = D τ y z d x d y , M z = D ( x τ y z y τ x z ) d x d y .

4. Shear Stresses in Torsion

As mentioned in Section 1, we focus on the shear stress concentration due to a scallop-like geometry in a beam subject to pure torsion. To compute the shear stresses, the solution of Poisson’s problems, with Neumann or Dirichlet boundary conditions, is required. Such problems imply the use of Laplace operator in two dimensions [52,54,55,56,57,58,62].
Pure torsion is defined as the partial solution of the problem of shear stresses where σ z 0 (implying the absence of shear forces and bending moments) [52]. The shear stresses τ = [ τ x z , τ y z ] T satisfy the simplified equilibrium equation:
div τ = τ x z x + τ y z y = 0 .
When a twisting couple M z is applied to the free end of a clamped beam, the flatness of the section is preserved only if the beam has circular cross-sections. In all other cases, the longitudinal displacement w is not linear in the variables x and y, causing a warping of the section.
Assuming the torsion angle of the cross-section ω o = ω o ( z ) to be small, the displacement field u in pure torsion is devoid of rigid contributions,
u = ω o ( z ) y , v = ω o ( z ) x , w = θ g ( x , y ) ,
where the constant parameter θ = d ω o d z is the twist of the centroidal fiber and g ( x , y ) is the so-called warping function.
Generally, the function g ( x , y ) is not linear in x and y and causes the loss of flatness of the section. It is defined only up to an additive constant and can be made unique by the constraint
D g d x d y = 0 .
Deriving shear strains as shown in Equations (6) and (7) allows us to write shear stresses as:
τ x z = G θ g x y , τ y z = G θ g y + x .
By substituting Equation (11) into the equilibrium condition, Equation (9), leads to
G θ 2 g 2 x + 2 g 2 y = 0 .
Together with the boundary condition in Equation (4) it determines the following Neumann’s problem:
2 g = 0 in D , g n = 1 2 s x 2 + y 2 on D ,
with 2 Laplace operator in the plane of the domain D. The solution g ( x , y ) of this boundary value problem is unique up to an additive constant, and can be found in a closed form only for some simple cases (e.g., circular cross-sections, where g = 0 is an exact solution and fulfills the boundary condition [52]). Once the problem is solved, shear stresses are determined by means of Equation (11).
Another formulation of the problem can be derived defining Prandtl’s stress function Φ ( x , y ) such that
τ x z = G θ Φ y , τ y z = G θ Φ x .
The equilibrium condition, Equation (9), is satisfied when the stress function Φ is a solution of the problem:
2 Φ = 2 in D , d Φ = 0 on D .
Since the addition of a constant to Φ does not affect stresses, the constant value Φ 0 on the outer boundary D 0 can be set equal to 0. In hollow beams (multiple connected domains), the values of Φ 0 i on the inner boundaries D i cannot be chosen arbitrarily, but must satisfy the circuital conditions
D i Φ n d s = 2 Ω i , i = 1 , 2 , , n
where Ω i denotes the area of the ith cavity. This constraint, which is necessary to ensure the displacement w has one value, cannot in general be solved explicitly within numerical analysis [56,63].
The torsion cross sectional rigidity J, entering the linear constitutive relationship for the twisting couple,
M z = G J θ ,
can be determined by integrating Prantdl’s stress function over the section [52,54,55,56,57,58,62]:
J = 2 D Φ d x d y .

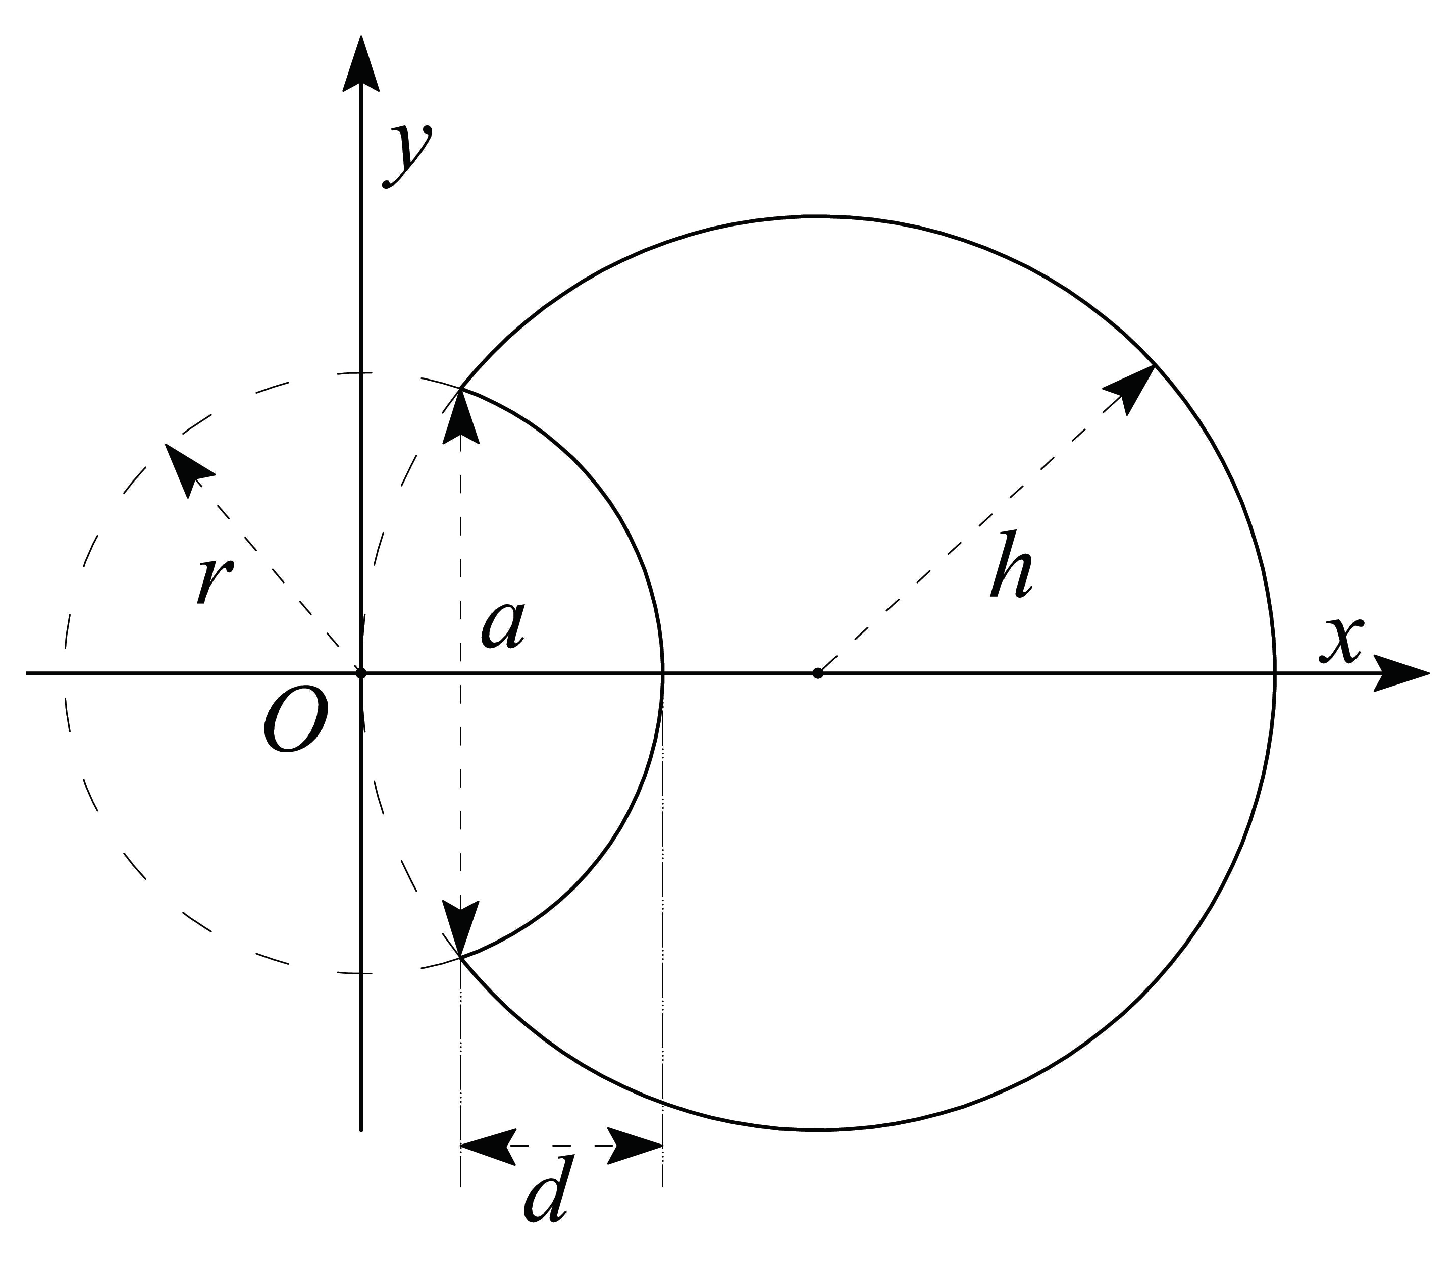
5. Circular Notched Cross-Section

As recalled in previous sections, the shear stress field is the solution of elliptic boundary value problems defined on the cross-section of the beam. Such problems are generally solved by means of finite differences or FEA.
However, the scheme presented here takes advantage of the simple form that the stress functions present for some particular geometries.
The warping function g ( x , y ) and its harmonic conjugate Z ( x , y ) = Φ ( x , y ) + 1 2 x 2 + y 2 are two functions which are coupled by the Cauchy-Riemann relations, i.e.,
g x = Z y , g y = Z x .
Simple analytical solutions of Laplace equation are given by polynomials in the complex variable x + i y , such that the generic m-th term is
g + i Z = ( p m + i q m ) ( x + i y ) m ,
with [52]
g = p m x m m ( m 1 ) 2 x m 2 y 2 + + q m m x m 1 y + , Z = p m m x m 1 y + + + q m x m m ( m 1 ) 2 x m 2 y 2 + .
In the case of negative values of m in Equation (15), the function g + i Z will present poles, i.e., singularity points where the function approaches an infinite value. Thus, negative exponents m are possible in Equation (15), provided that the generated poles fall out of the elastic region D. For example, for m = 1 , there is one simple pole in the origin:
g + i Z = ( p 1 + i q 1 ) ( x i y ) x 2 + y 2 .
In this case, the stress function
Φ ( x , y ) = h r 2 x x 2 + y 2 1 2 x 2 + y 2 + h x + 1 2 r 2
is regular inside the domain D, vanishes on the boundaries x 2 + y 2 = r 2 and ( x h ) 2 + y 2 = h 2 and satisfies the problem in Equation (14) (it is Prandtl’s stress function for the torsion of a circular cross-section beam, of radius h, with a circular notch of radius r centred on its surface, see Figure 6). Considering the details shown in Figure 4, the circular shape of notches is assumed to be a first approximation fitting the real profile.
The associated warping function is, up to a constant,
g ( x , y ) = 1 r 2 x 2 + y 2 h y .
Thus, for a beam with such a cross-section undergoing pure torsion, shear stresses can be easily evaluated with Equation (11) or (13) by partial differentiation of either g or Φ .

6. Theoretical Aspects in the Finite Element Formulation
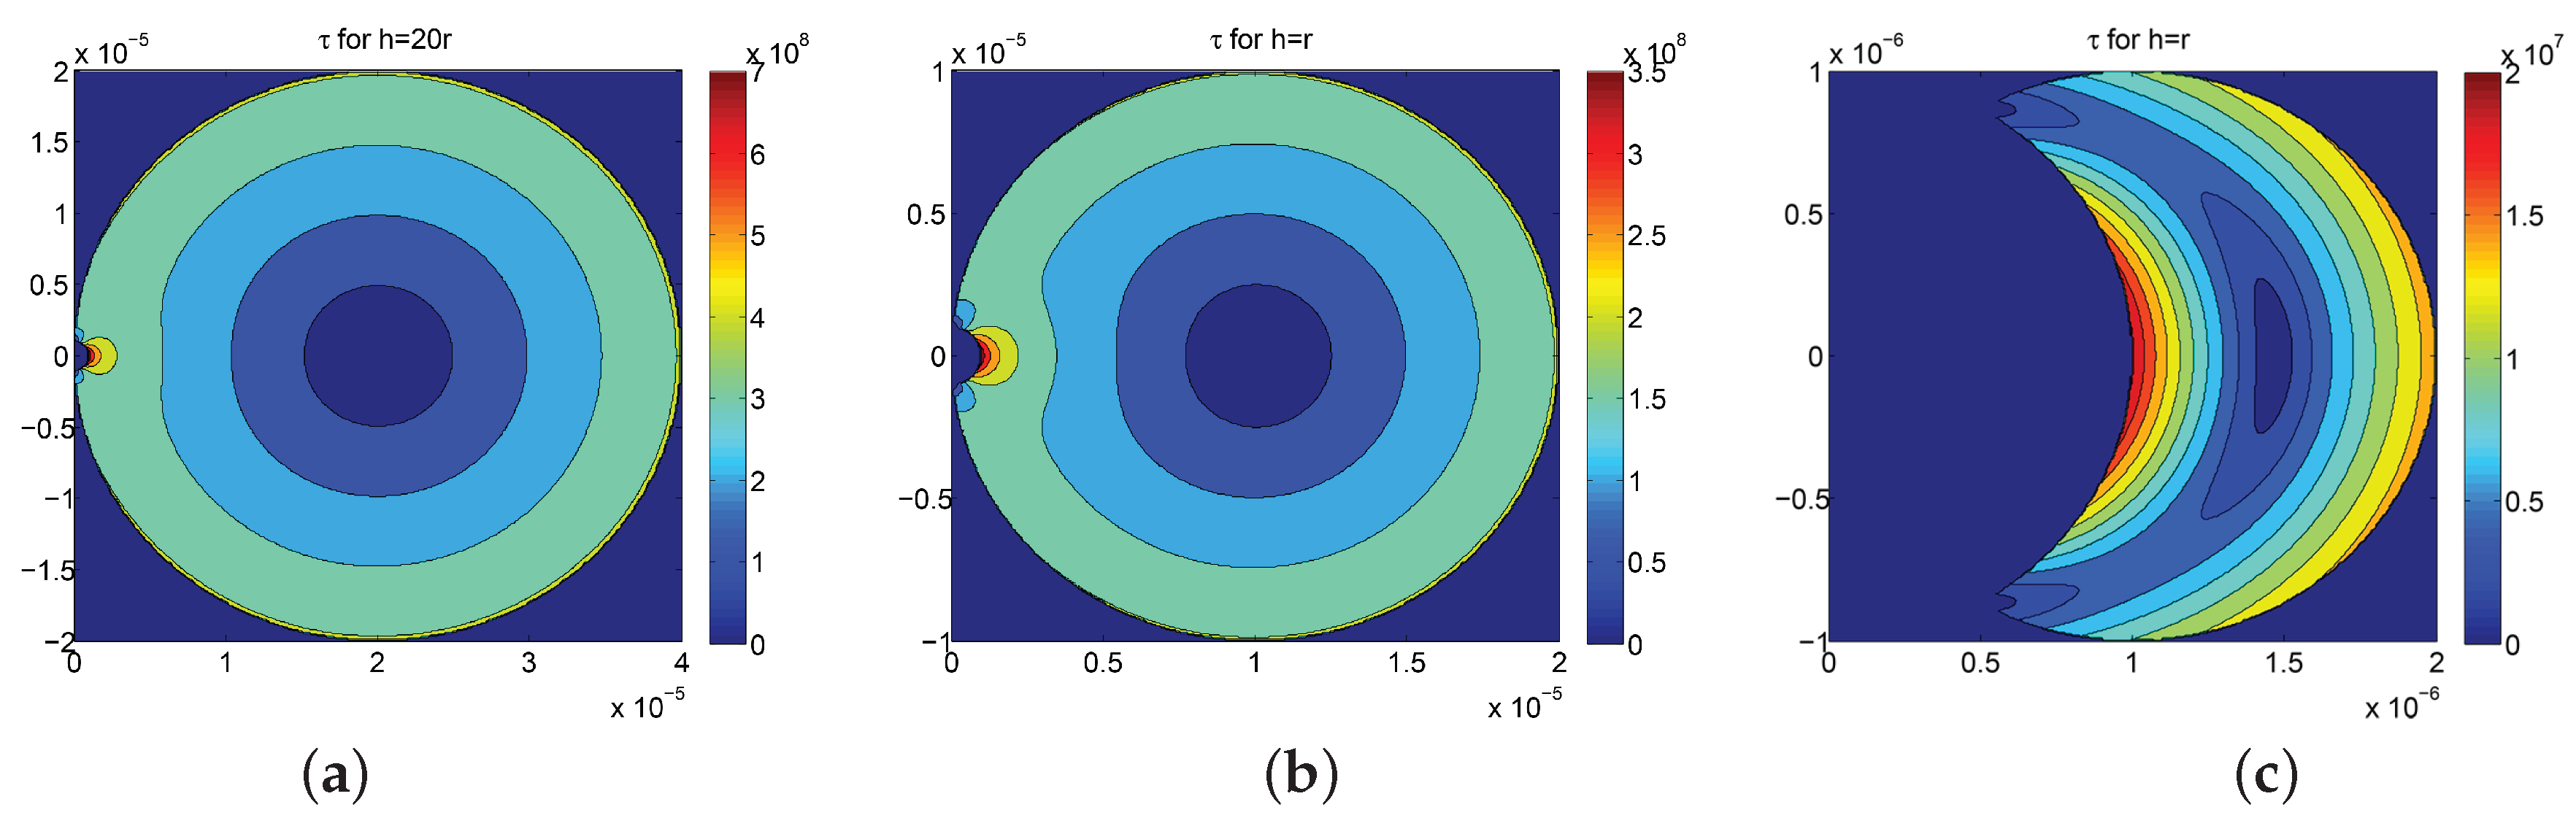
The second order partial differential equation problem (with Dirichlet or Neumann boundary conditions) can be written, in its strong formulation, as:
2 φ = f 0 ( x , y ) in D φ n = f 1 ( x , y ) or φ ( s ) = f 2 ( s ) in D
in the previous equations,
f 0 ( x , y ) = 0 , f 1 ( x , y ) = 1 2 s x 2 + y 2 ,
in the case φ ( x , y ) = g , while
f 0 ( x , y ) = 2 , f 2 ( x , y ) = Φ 0 ,
in the case φ ( x , y ) = Φ .
The weak form of the problem, which can be implemented by most finite element solvers, can be obtained by a weighted residuals method, introducing a set of weighting functions, η . The integral sum over the domain D in the product of the weights η by the residual R = 2 φ + f 0 ( x , y ) is required to vanish
G ( φ , η ) = D R η d Ω = D 2 φ + f 0 η d Ω = 0 .
Integration by parts, and Neumann’s boundary condition, provide the weak form of the boundary value problem:
G ( φ , η ) = D φ · η + η f 0 d Ω D η f 1 d s = 0 ,
with the gradient in the plane of the domain D.
The condition for η is η = 0 on D . The integral over the boundary will then vanish in the case of Dirichlet boundary conditions.
Equation (20) can be solved approximately using the finite element method; the domain D is first decomposed into a number of sub-domains, each one having n nodes.
The nodal approximations for the coordinates vector x = [ x , y ] T , the unknown function φ and the weighting function η are built using the same shape function N I . Once their values in the nodes are known, the interpolations which derive are:
x ˜ = I = 1 n N I x I , φ ˜ = I = 1 n N I φ I , η ˜ = I = 1 n N I η I ,
where the ~ (tilde) sign denotes the value of the indicated function.
Inserting the nodal approximations in Equation (21) into the weak form of Equation (20), and summing over the subdomains leads to the finite element problem:
G ( φ , η ) = e = 1 G e = e = 1 I = 1 n K = 1 n η I K I K e φ K P I e = 0 ,
with the global matrix K I K and the vector P I formed by the elementary matrices and vectors:
K I K e = D e N I · N K d Ω e
P I e = D e f 0 ( x , y ) N I d Ω e + D f 1 ( x , y ) N I d s .
To compute shear stresses, we must solve the linear system in Equation (22). To this end, the cross-section D properties, the second order moments of inertia, I x x , I x y , I y y , and the centroid coordinates x S and y S , as well as the derivatives of the shape functions N with respect to x and y, must be known.

7. Stress Analysis

The presented methods can be specialized for the study of the above-mentioned class of CSFH-based microdevices. A member of this class is characterized by the presence of an embedded CSFH hinge, which is composed of a flexible curved element connecting a couple of conjugate profiles. One possible configuration is depicted in Figure 7. Relative motion among the pseudo-rigid parts i and j is possible because the thin cross-section of the curved element k behaves as a flexible rod.
The technological limitations or the application complexity do not guarantee that the flexible curved beam k is subject only to pure bending. On the contrary, the tension field is rather complex and also includes shear component on the cross section. In fact, if a curved beam is considered, in-plane shear stress (as in Figure 2b) is always present, while out-of-plane, or transverse, shear stress (Figure 2c) is likely to be present for several reasons. One of them, already pointed out in Section 1, is that the shearing force on the beam is quite likely eccentric with respect to the shear center, thus implying a twisting couple. Considering that beams are thin-walled, we know this implies remarkable shear stress.
Since the aim of this paper is restricted to the analysis of stress concentration, it is reasonable to simplify the general case of curved beam by a straight axis beam with in-plane shear at one end. For this reason, the stress distribution over a cross section of the beam is investigated, and increase in the overall tension maximum value is monitored to avoid unpleasant damages or fractures at unexpectedly low loads.
In the following paragraphs, the elementary beam theory is applied to the case of a circular cross-section shaft with a circular shaped notch undergoing pure torsion. Stresses are computed by using the analytical solution of the equations shown in Section 5. Then, two more methods, both having numerical nature, are used to compare their results with the analytical solutions: finite differences and finite elements.

7.1. Analytical Solution

For the geometry in Figure 6, it has been shown that Prandtl’s stress function
Φ ( x , y ) = h r 2 x x 2 + y 2 1 2 x 2 + y 2 + h x + 1 2 r 2 ,
and the warping function
g ( x , y ) = 1 r 2 x 2 + y 2 h y ,
have to satisfy Equations (11) and (13):
τ x z = G θ g x y = G θ Φ y , τ y z = G θ g y + x = G θ Φ x .
The stress function and the partial derivatives can be rewritten in terms of polar coordinates, by introducing ρ 2 = x 2 + y 2 :
Φ = x h 1 r ρ 2 1 2 ρ 2 r 2 , Φ x = h 1 + r ρ 2 x , Φ y = y 2 x h r ρ 2 1 .
Some physical parameters have to be imposed to evaluate the vector τ = [ τ x z , τ y z ] T : the radii of the beam and of the notch h and r, as well as the twist of the centroidal fiber θ and the shear modulus G. Some plausible values are considered, although they do not resemble the exact geometry of the real device. This does not affect the accuracy of the results, since this calculations are not intended to give an exact solution, for which more accurate experimental studies are needed, in the first place. However, it is thought that, by assigning proper values to the parameters, the following computations give a close enough picture of the real stress field at a section of the hinge.
From the literature [32], we set 1 μ m as fixed value for r, radius of the notch. Stresses were then studied for h linearly varying from 1   μ m to 20   μ m with steps of 1   μ m .
We then imposed:
  • beam radius, h = 1 ÷ 20 μ m
  • notch radius, r = 1 μ m
  • G = 70 GPa
  • torsion relative angle ω o = 5 = 0.0873 rad
  • beam length z = 300   μ m
  • twist of the centroidal fiber θ = d ω o d z = 291 rad m
The results were implemented and plotted using Matlab © . The stresses were initially computed deriving partially Φ in a 10,000 nodes sample grid in x and y over the domain D; the grid was then refined with 40,000 and, finally, 160,000 nodes.
Figure 8a,b represents the shear vector fields in the cross section and around the notch for the two cases h = 10 r and h = 20 r , respectively, in different scaled grids.
Figure 9a-c shows the shear stress field obtained by composing τ x z and τ y z , for different values of h r ratio, 20, 10 and 1, respectively.
However, for the sake of the present investigation, the area around the notch is more interesting than the bulk of the cross-section, and so a detailed computation was performed within the same coordinate system and number of nodes over a sample grid narrowed to a 3 r × 3 r square. Results, for h = 20 r , are shown in Figure 10a. Similar conclusions can be obtained by considering the case for which h = r , as depicted in Figure 10b.
Stress is concentrated around the circular arc midpoint, being the point where the maximum stress is attained.

7.2. Numerical Solution via Finite Difference Discretization

The computation by means of finite differences has been implemented using the free version of the software FlexPDE (Version 6.36).
The resulting stress field, obtained over a 587 nodes grid, is shown in Figure 11a–c, together with the plots of its two components τ x z and τ y z , and the stress function Φ .

7.3. Numerical Solution via Finite Element Analysis

Finally, straight axis beams with circular section and circular notch were modeled by means of standard 3D modeling and FEA package ANSYS © .
Three different geometries were considered, thus three different solid models were built. Taking r = 1 μ m, three cross sections with h = 20 r , h = 10 r and h = r , respectively, were used to extrude the solid model of the beam. Using the same physical parameters in the previous methods, and imposing again 5 relative rotation among the end sections, the values of tension modules were obtained at the nodes.
The adopted meshes, for the three h to r ratios, are represented in Figure 12a, Figure 13a and Figure 14a.
The maximum shear stress fields are also reported in Figure 12b,c, for the case h = r , while the two groups in Figure 13b,c and Figure 14b,c concern the two cases h = 10 r and h = 20 r , respectively.

7.4. Discussion about the Achieved Results

The obtained results have shown that the maximum shear stress holds in the center of the notch arc. Such point is called core point in Table 1. On the other hand, two other points have been considered, namely, the the upper and lower edge points of the notch, which correspond to the scallops spikes. In such points, called edge points in Table 1, the stress (denoted with τ e d g e ) is virtually null. This is consistent with the fact that such point belongs to a stagnation zone of the tension field.
Of course, symmetry implies identical solution for the top and the bottom edge points. Shear stress has been computed in these points using three methods. The analytical solution yields null values (i.e., zero, to the best of the numerical approximation of the floating point accuracy), while the other two methods give values much smaller (practically null values) than the those calculated in the core. This difference with the analytical method is certainly due to the discretization approximation of the numerical approaches.
The proposed analytical method gave us the opportunity to calculate stress in many different points and sections. For example, τ e d g e and τ max could be calculated as a function of the ratio ρ of the notch radius r to the circular section radius h. The results obtained have shown that the maximum stress decreases as ρ = r h increases. This is consistent with the physics of the phenomenon since, as h reduces in size, the discontinuity in the field becomes less severe. Considering the edge points, τ e d g e also shows a similar decreasing trend as h decreases. As mentioned above, its magnitude remains significantly lower than the τ max stress achieved at the notch core. Figure 15 shows the dependency of τ max and τ e d g e upon the r h ratio.
The diagram reported in Figure 15 concerns the tension absolute values that hold in the notch core and edge as a function of ρ . However, this result would convey rather little insight if it was not reduced to a physical model equivalent to the scalloped notch. For this purpose, there are still two particular problems to be solved:
  • the definition of an equivalence criterion for relating the adopted simplified geometry (see Figure 6) to the original geometry (see Figure 2 and Figure 4); and
  • the introduction of a reliable index of the severity of stress concentration.

7.4.1. Adopted Equivalence Criterion

One advantage of the adopted cross section is that it is very simply described by means of analytical and geometrical tools. For example, referring back again to Figure 6, it is clear that the scalloped notch is represented by the circular segment having r, d and a as radius, depth and chord, respectively. One characteristic of scalloping is the dimensionless ratio δ of the notch depth d to the chord a. The two dimensionless parameters ρ and δ can be easily related using two simple, well-known geometrical equations for the circular segment, namely,
d = r r 2 a 2 4 a = r 4 h 2 r 2 h

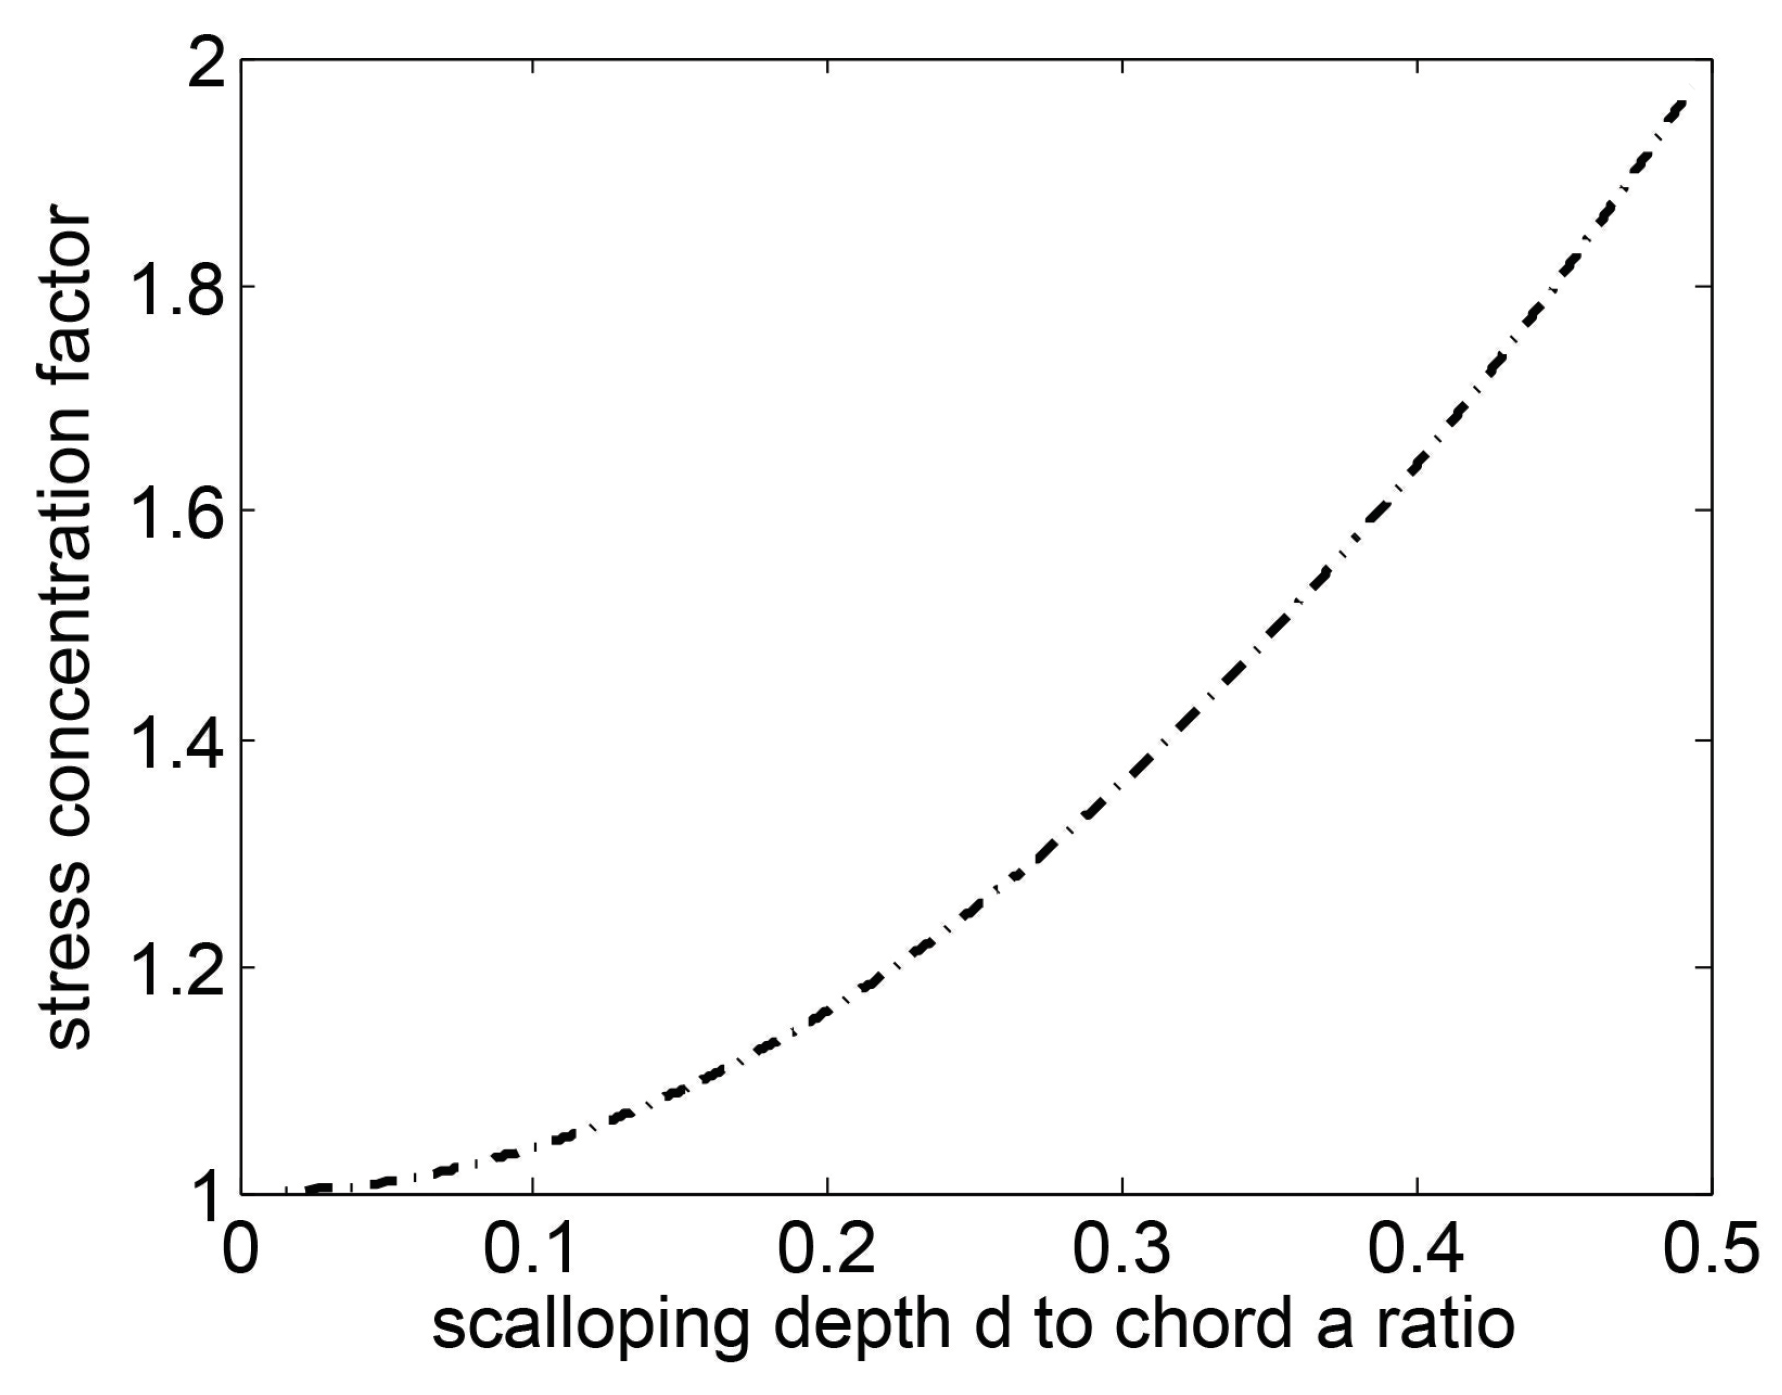
7.4.2. Stress Concentration Factor

The stress concentration factor K t , for the considered beam, can be calculated as the ratio of the maximum stress on the notch core τ max by the stress calculated on a point positioned on the other side of the beam section (with reference to Figure 6, this points is on the x axis, opposite to the origin O).
The adopted equivalence criterion and the introduction of K t give rise to an interesting interpretation of the iterative application of the analytical method.
Figure 16 reports the values of the stress concentration factor K t as a function of the parameter η = ρ 1 = h r , which spans, in the real domain, from 1 2 (which correspond to a beam with null cross sectional area) to . There are no reasons for η to go beyond the order of magnitude of tens and so 40 has been regarded as the maximum. The trend shows a sudden increase of K t for small increments of η . For values of η greater than about 5, K t tends asymptotically to 2. However, according to the equivalence criterion, the scalloping geometry is better characterized by the ratio δ = d a .
By using Equations (25), it is possible to evaluate the ratio δ of the scalloping dept d to chord a as a function of η (see Figure 17).
Finally, the relation between η and δ can be used to obtain the explicit dependency of K t upon δ , as reported in Figure 18. In fact, the dependency of K t on η and of the latter on δ , can be combined together to get, via function composition, K t δ .
When δ = 0 , which corresponds to a smooth wall, no stress concentration occurs ( K t = 1 ). However, for positive values of δ , the trend depicted in Figure 18 shows that the notch depth d has a great impact on stress concentration. The maximum value of K t is 2 and it corresponds to a notch which has its center on a vertical wall (with h > > r ).
Thanks to the above-presented analysis, it is possible to state that the stress concentration factor tends asymptotically to the theoretical value 2 as the scalloping depth increases with respect to the scalloped chord, where the limit value is already known in the literature (see, for example, Ref. [65]).
Consequently, it can be also stated, as a general principle, that, for a DRIE micromachined beam with apparent and not treated scalloping, the strength can decrease to the half value of the strength of the same beam with no notches.

8. Conclusions

The wide range of applications has made MEMS more complicated. Therefore, their mechanical structure and internal stress state also become more complex. In many of those applications, MEMS are called to interact with the environment and so they need high aspect ratios, which can be achieved by manufacturing them via DRIE process. Unfortunately, the etched profiles cannot always get rid of the scalloping problem, which induces a dangerous increase of concentrated stress in the structure. Since this stress concentration gives rise to evident loss of structural strength for silicon, it is important to take into account the effects of scalloping on stress concentration in this kind of structures.
In this paper, three different methods are proposed for stress concentration characterization of silicon DRIE micromachined structures. All of them use a straight axis beam with a circular section and a circular notch. The first approach is based on the theory of linear elasticity and evaluates the shear stresses for pure torsion (stress concentration being due to shear state only). The other two methods use numerical approach: finite difference and finite element analysis. Although the three methods are very different in nature, the obtained values are fairly comparable. Furthermore, using the analytical method makes it easier to obtain diagrams that show the stress concentration factor with respect to the notch radius. The asymptotic value of the stress concentration factor, as a function of the notch relative radius, is in accordance with the literature. This leads to the conclusion that, in DRIE manufactured notched beams, strength is virtually half of the one with no notches.

Author Contributions

Conceptualization, all authors; Methodology, S.B. and G.R.; Software, S.B. and N.P.B.; Validation, all authors; Formal Analysis, S.B., G.R. and M.V.; Investigation and resources for fabrication, A.B. and P.B.; Data curation, all authors; Writing-original draft preparation, review, editing, and visualization, M.V. and N.P.B.; and Supervision, P.B. and G.R.

Funding

This research received no external funding.

Conflicts of Interest

The authors declare no conflict of interest.

References

  1. Elman, N.; Ho Duc, H.; Cima, M. An implantable MEMS drug delivery device for rapid delivery in ambulatory emergency care. Biomed. Microdevices 2009, 11, 625–631. [Google Scholar] [CrossRef] [PubMed]
  2. Li, Y.; Shawgo, R.; Tyler, B.; Henderson, P.; Vogel, J.; Rosenberg, A.; Storm, P.; Langer, R.; Brem, H.; Cima, M. In vivo release from a drug delivery MEMS device. J. Control. Release 2004, 100, 211–219. [Google Scholar] [CrossRef] [PubMed] [Green Version]
  3. Lo, R.; Li, P.Y.; Saati, S.; Agrawal, R.; Humayun, M.; Meng, E. A passive MEMS drug delivery pump for treatment of ocular diseases. Biomed. Microdevices 2009, 11, 959–970. [Google Scholar] [CrossRef] [PubMed]
  4. Voskerician, G.; Shive, M.; Shawgo, R.; Von Recum, H.; Anderson, J.; Cima, M.; Langer, R. Biocompatibility and biofouling of MEMS drug delivery devices. Biomaterials 2003, 24, 1959–1967. [Google Scholar] [CrossRef]
  5. Xie, Y.; Xu, B.; Gao, Y. Controlled transdermal delivery of model drug compounds by MEMS microneedle array. Nanomed. Nanotechnol. Biol. Med. 2005, 1, 184–190. [Google Scholar] [CrossRef] [PubMed]
  6. Ibrahim, D. Using MEMS accelerometers in aerospace and defence electronics. Electron. World 2012, 118, 16–21. [Google Scholar]
  7. Leclerc, J. MEMs for aerospace navigation. IEEE Aerosp. Electron. Syst. Mag. 2007, 22, 31–36. [Google Scholar] [CrossRef]
  8. Hsu, H.; Hariz, A.; Omari, T.; Teng, M.; Sii, D.; Chan, S.; Lau, L.; Tan, S.; Lin, G.; Haskard, M.; et al. Development of a MEMS based manometric catheter for diagnosis of functional swallowing disorders. J. Phys. Conf. Ser. 2006, 34, 955–960. [Google Scholar] [CrossRef]
  9. Sun, H.; Fu, G.; Xie, H. A MEMS accelerometer-based real-time motion-sensing module for urological diagnosis and treatment. J. Med. Eng. Technol. 2013, 37, 127–134. [Google Scholar] [CrossRef] [PubMed]
  10. Horvath, I.; Panayotatos, P.; Lu, Y. Si MEMS microbearing with integrated safety sensors for surgical applications. Microelectron. J. 2001, 32, 1–9. [Google Scholar] [CrossRef]
  11. Lou, L.; Ramakrishna, K.; Shao, L.; Park, W.; Yu, D.; Lim, L.; Wee, Y.; Kripesh, V.; Feng, H.; Chua, B.; et al. Sensorized guidewires with MEMS tri-axial force sensor for minimally invasive surgical applications. In Proceedings of the 2010 Annual International Conference of the IEEE Engineering in Medicine and Biology, Buenos Aires, Argentina, 31 August–4 September 2010; pp. 6461–6464. [Google Scholar]
  12. To, G.; Qu, W.; Mahfouz, M. ASIC Design for Wireless Surgical MEMS Device and Instrumentation. In Proceedings of the 2006 International Conference of the IEEE Engineering in Medicine and Biology Society, New York, NY, USA, 30 August–3 September 2006; pp. 5892–5895. [Google Scholar]
  13. Chronis, N.; Lee, L. Polymer mems-based microgripper for single cell manipulation. In Proceedings of the 17th IEEE International Conference on Micro Electro Mechanical Systems (MEMS), Maastricht, The Netherlands, 25–29 January 2004; pp. 17–20. [Google Scholar]
  14. Kim, K.; Liu, X.; Zhang, Y.; Sun, Y. Nanonewton force-controlled manipulation of biological cells using a monolithic MEMS microgripper with two-axis force feedback. J. Micromech. Microeng. 2008, 18, 055013. [Google Scholar] [CrossRef]
  15. Belfiore, N.P.; Verotti, M.; Crescenzi, R.; Balucani, M. Design, optimization and construction of MEMS-based micro grippers for cell manipulation. In Proceedings of the ICSSE 2013—IEEE International Conference on System Science and Engineering, Budapest, Hungary, 4–6 July 2013; pp. 105–110. [Google Scholar]
  16. Balucani, M.; Belfiore, N.P.; Crescenzi, R.; Verotti, M. The development of a MEMS/NEMS-based 3 D.O.F. compliant micro robot. Int. J. Mech. Control 2011, 12, 3–10. [Google Scholar]
  17. Belfiore, N.P.; Simeone, P. Inverse kinetostatic analysis of compliant four-bar linkages. Mech. Mach. Theory 2013, 69, 350–372. [Google Scholar] [CrossRef]
  18. Verotti, M.; Dochshanov, A.; Belfiore, N.P. Compliance Synthesis of CSFH MEMS-Based Microgrippers. J. Mech. Des.-Trans. ASME 2017, 139, 022301. [Google Scholar] [CrossRef]
  19. Belfiore, N.P.; Broggiato, G.; Verotti, M.; Crescenzi, R.; Balucani, M.; Bagolini, A.; Bellutti, P.; Boscardin, M. Development of a MEMS technology CSFH based microgripper. In Proceedings of the 23rd International Conference on Robotics in Alpe-Adria-Danube Region, Smolenice, Slovakia, 3–5 September 2014; Institute of Electrical and Electronics Engineers Inc.: Piscataway Township, NJ, USA, 2015. [Google Scholar]
  20. Bagolini, A.; Ronchin, S.; Bellutti, P.; Chistè, M.; Verotti, M.; Belfiore, N.P. Fabrication of Novel MEMS Microgrippers by Deep Reactive Ion Etching With Metal Hard Mask. J. Microelectromech. Syst. 2017, 26, 926–934. [Google Scholar] [CrossRef]
  21. Belfiore, N.P.; Scaccia, M.; Ianniello, F.; Presta, M. Selective Compliance Hinge. U.S. Patent 8,191,204 B2, 5 June 2012. [Google Scholar]
  22. Balucani, M.; Belfiore, N.P.; Crescenzi, R.; Genua, M.; Verotti, M. Developing and modeling a plane 3 DOF compliant micromanipulator by means of a dedicated MBS code. In Proceedings of the 2011 NSTI Nanotechnology Conference and Expo, NSTI-Nanotech, At Boston, MA, USA, 13–16 June 2011; Volume 2, pp. 659–662. [Google Scholar]
  23. Belfiore, N.P.; Balucani, M.; Crescenzi, R.; Verotti, M. Performance analysis of compliant mems parallel robots through pseudo-rigid-body model synthesis. In Proceedings of the ASME 2012 11th Biennial Conference on Engineering Systems Design and Analysis, Nantes, France, 2–4 July 2012; Volume 3, pp. 329–334. [Google Scholar]
  24. Belfiore, N.P.; Emamimeibodi, M.; Verotti, M.; Crescenzi, R.; Balucani, M.; Nenzi, P. Kinetostatic optimization of a MEMS-based compliant 3 DOF plane parallel platform. In Proceedings of the ICCC 2013—IEEE 9th International Conference on Computational Cybernetics, Tihany, Hungary, 8–10 July 2013; pp. 261–266. [Google Scholar]
  25. Nenzi, P.; Crescenzi, R.; Dolgyi, A.; Klyshko, A.; Bondarenko, V.; Belfiore, N.P.; Balucani, M. High density compliant contacting technology for integrated high power modules in automotive applications. In Proceedings of the Electronic Components and Technology Conference, San Diego, CA, USA, 29 May–1 June 2012; pp. 1976–1983. [Google Scholar]
  26. Dochshanov, A.; Verotti, M.; Belfiore, N.P. A Comprehensive Survey on Microgrippers Design: Operational Strategy. J. Mech. Des.-Trans. ASME 2017, 139, 070801. [Google Scholar] [CrossRef]
  27. Verotti, M.; Dochshanov, A.; Belfiore, N.P. A Comprehensive Survey on Microgrippers Design: Mechanical Structure. J. Mech. Des.-Trans. ASME 2017, 139, 060801. [Google Scholar] [CrossRef]
  28. Di Giamberardino, P.; Bagolini, A.; Bellutti, P.; Rudas, I.; Verotti, M.; Botta, F.; Belfiore, N.P. New MEMS tweezers for the viscoelastic characterization of soft materials at the microscale. Micromachines 2017, 9, 15. [Google Scholar] [CrossRef]
  29. Belfiore, N.P.; Prosperi, G.; Crescenzi, R. A simple application of conjugate profile theory to the development of a silicon micro tribometer. In Proceedings of the ASME 2014 12th Biennial Conference on Engineering Systems Design and Analysis, Copenhagen, Denmark, 25–27 July 2014; Volume 2. [Google Scholar]
  30. Laermer, F.; Schlip, A. Method of Anisotropically Etching Silicon. U.S. Patent 5,501,893, 26 March 1996. [Google Scholar]
  31. Ayön, A.A.; Chen, K.S.; Lohner, K.A.; Spearing, S.M.; Sawin, H.H.; Schmidt, M.A. Deep Reactive Ion Etching of Silicon. In Proceedings of the Symposium AA Materials Science of Microelectromechanical Systems (MEMS), Boston, MA, USA, 1–2 December 1998; Volume 546. [Google Scholar]
  32. Chen, K.S.; Ayön, A.A.; Zhang, X.; Spearing, S. Effect of process parameters on the surface morphology and mechanical performance of silicon structures after deep reactive ion etching (DRIE). J. Microelectromech. Syst. 2002, 11, 264–275. [Google Scholar] [CrossRef] [Green Version]
  33. Fricker, H. Why does charge concentrate on points? Phys. Educ. 1989, 24, 157. [Google Scholar] [CrossRef]
  34. Crescenzi, R.; Balucani, M.; Belfiore, N.P. Operational characterization of CSFH MEMS technology based hinges. J. Micromech. Microeng. 2018, 28, 055012. [Google Scholar] [CrossRef] [Green Version]
  35. Mita, Y.; Sugiyama, M.; Kubota, M.; Marty, F.; Bourouina, T.; Shibata, T. Aspect Ratio Dependent Scalloping Attenuation in Drie and an Application to Low-Loss Fiber-Optical Switches. In Proceedings of the 19th IEEE International Conference on Micro Electro Mechanical Systems, Istanbul, Turkey, 22–26 January 2006; pp. 114–117. [Google Scholar]
  36. Pham, P.; Dao, D.; Amaya, S.; Kitada, R.; Sugiyama, S. Fabrication and characterization of smooth Si mold for hot embossing process. IEEJ Trans. Sens. Micromach. 2007, 127, 187–191. [Google Scholar] [CrossRef]
  37. Song, I.H.; Peter, Y.A.; Meunier, M. Smoothing dry-etched microstructure sidewalls using focused ion beam milling for optical applications. J. Micromech. Microeng. 2007, 17, 1593–1597. [Google Scholar] [CrossRef]
  38. Defforge, T.; Song, X.; Gautier, G.; Tillocher, T.; Dussart, R.; Kouassi, S.; Tran-Van, F. Scalloping removal on DRIE via using low concentrated alkaline solutions at low temperature. Sens. Actuators A-Phys. 2011, 170, 114–120. [Google Scholar] [CrossRef]
  39. Hung, Y.J.; Lee, S.L.; Thibeault, B.J.; Coldren, L.A. Realization of silicon nanopillar arrays with controllable sidewall profiles by holography lithography and a novel single-step deep reactive ion etching. In Symposia P Q R Low-Dimensional Functional Nanostructures-Fabrication, Characterization and Applications; Materials Research Society Online Proceedings Library Archive, Cambridge University Press: Cambridge, UK, 2010; Volume 1258. [Google Scholar]
  40. Inagaki, N.; Sasaki, H.; Shikida, M.; Sato, K. Selective removal of micro-corrugation by anisotropic wet etching. In Proceedings of the TRANSDUCERS 2009—2009 International Solid-State Sensors, Actuators and Microsystems Conference, Denver, CO, USA, 21–25 June 2009; pp. 1865–1868. [Google Scholar]
  41. Phinney, L.; McKenzie, B.; Ohlhausen, J.; Buchheit, T.; Shul, R. Characterization of SOI MEMS sidewall roughness. In Proceedings of the ASME 2011 International Mechanical Engineering Congress and Exposition, Denver, CO, USA, 11–17 November 2011; Volume 11, pp. 187–193. [Google Scholar]
  42. Chekurov, N.; Grigoras, K.; Peltonen, A.; Franssila, S.; Tittonen, I. The fabrication of silicon nanostructures by local gallium implantation and cryogenic deep reactive ion etching. Nanotechnology 2009, 20, 065307. [Google Scholar] [CrossRef] [PubMed]
  43. De Boer, M.; Gardeniers, J.; Jansen, H.; Smulders, E.; Gilde, M.J.; Roelofs, G.; Sasserath, J.; Elwenspoek, M. Guidelines for etching silicon MEMS structures using fluorine high-density plasmas at cryogenic temperatures. J. Microelectromech. Syst. 2002, 11, 385–401. [Google Scholar] [CrossRef] [Green Version]
  44. Murakami, K.; Wakabayashi, Y.; Minami, K.; Esashi, M. Cryogenic dry etching for high aspect ratio microstructures. In Proceedings of the IEEE Micro Electro Mechanical Systems, Fort Lauderdale, FL, USA, 10 February 1993; IEEE: Piscataway, NJ, USA, 1993; pp. 65–70. [Google Scholar]
  45. Sainiemi, L.; Franssila, S. Mask material effects in cryogenic deep reactive ion etching. J. Vac. Sci. Technol. B 2007, 25, 801–807. [Google Scholar] [CrossRef]
  46. Morikawa, Y.; Murayama, T.; Sakuishi, T.; Nakamura, T.; Kurimoto, T.; Nakamuta, Y.; Kimura, I.; Suu, K. Scallop Free si Etching and Low Cost Integration Technologies for 2.5D Si Interposer; International Microelectronics Assembly and Packaging Society: Research Triangle Park, NC, USA, 2012; pp. 998–1000. [Google Scholar]
  47. Guo, M.; Chou, X.; Mu, J.; Liu, B.; Xiong, J. Fabrication of micro-trench structures with high aspect ratio based on DRIE process for MEMS device applications. Microsyst. Technol. 2013, 19, 1097–1103. [Google Scholar] [CrossRef]
  48. Miller, K.; Li, M.; Walsh, K.; Fu, X.A. The effects of DRIE operational parameters on vertically aligned micropillar arrays. J. Micromech. Microeng. 2013, 23, 035039. [Google Scholar] [CrossRef]
  49. Ma, Z.; Jiang, C.; Yuan, W.; He, Y. Large-scale patterning of hydrophobic silicon nanostructure arrays fabricated by dual lithography and deep reactive ion etching. Nano-Micro Lett. 2013, 5, 7–12. [Google Scholar] [CrossRef]
  50. Wang, Z.; Jiang, F.; Yu, D.; Zhang, W. Si Etching for TSV Formation. ECS Trans. 2014, 60, 407–412. [Google Scholar] [CrossRef]
  51. Zhao, Y.P.; Wang, L.S.; Yu, T.X. Mechanics of adhesion in MEMS—A review. J. Adhes. Sci. Technol. 2003, 17, 519–546. [Google Scholar] [CrossRef]
  52. Fraeijs de Veubeke, B.M. A Course in Elasticity; Springer: New York, NY, USA, 1979; pp. 135–200. [Google Scholar]
  53. Boresi, A.; Schmidt, R. Advanced Mechanics of Materials; John Wiley & Sons: Hoboken, NJ, USA, 2003. [Google Scholar]
  54. Dell’Isola, F.; Ruta, G.C. Outlooks in Saint-Venant theory III. Torsion and flexure in sections of variable thickness by formal expansions. Arch. Mech. 1997, 49, 321–343. [Google Scholar]
  55. Andreaus, U.; Ruta, G. A review of the problem of the shear centre(s). Contin. Mech. Thermodyn. 1998, 10, 369–380. [Google Scholar] [CrossRef]
  56. Paolone, A.; Ruta, G.; Vidoli, S. Torsion in multi-cell thin-walled girders. Acta Mech. 2009, 206, 163–171. [Google Scholar] [CrossRef]
  57. Ruta, G. On the flexure of a Saint-Venant cylinder. J. Elast. 1998, 52, 99–110. [Google Scholar] [CrossRef]
  58. Ruta, G. On Kelvin’s formula for torsion of thin cylinders. Mech. Res. Commun. 1999, 26, 591–596. [Google Scholar] [CrossRef]
  59. Saint-Venant, B. Mémoire sur la torsion des prismes. Mem. Savants Etrang. 1855, 14, 233–560. [Google Scholar]
  60. Clebsch, R.F.A. Theorie der Elasticität Fester Körper; B. G. Teubner: Leipzig, Germany, 1862. [Google Scholar]
  61. Iesan, D. On Saint-Venant’s problem. Arch. Ration. Mech. Anal. 1986, 91, 363–373. [Google Scholar] [CrossRef]
  62. Muskhelishvili, N.I. Some Basic Problems of the Mathematical Theory of Elasticity; Noordhoff Ltd.: Groningen, The Netherlands, 1963; pp. 571–607. [Google Scholar]
  63. Gruttman, F.; Sauer, R.; Wagner, W. Shear Stresses in Prismatic Beams with Arbitrary Cross-Sections. Int. J. Numer. Methods Eng. 1999, 45, 865–889. [Google Scholar] [CrossRef]
  64. Cecchi, R.; Verotti, M.; Capata, R.; Dochshanov, A.; Broggiato, G.; Crescenzi, R.; Balucani, M.; Natali, S.; Razzano, G.; Lucchese, F.; et al. Development of micro-grippers for tissue and cell manipulation with direct morphological comparison. Micromachines 2015, 6, 1710–1728. [Google Scholar] [CrossRef]
  65. Timoshenko, S.; Goodier, J. Theory of Elasticity; McGraw-Hill: New York, NY, USA, 1970. [Google Scholar]
Figure 1. Curved beam adopted in CSHF hinges and comb-drive fingers.
Actuators 07 00057 g001
Figure 2. A simplified representation of the SOI wafer after four cycles of the D-RIE process (a), and of a cantilever beam after oxide wet etching, subject to out-of-plane (b) and in-plane (c) shear tension.
Actuators 07 00057 g002
Figure 3. Comb-drive finger region.
Actuators 07 00057 g003
Figure 4. Scalloping details in one finger.
Actuators 07 00057 g004
Figure 5. Cross-section with nomenclature.
Actuators 07 00057 g005
Figure 6. Reference frame, cross-section with radius h, and notch with radius r.
Actuators 07 00057 g006
Figure 7. Flexural hinge geometry (see also Refs. [15,64]).
Actuators 07 00057 g007
Figure 8. Shear stress vector field with the analytical approach in a: (a) 20 μ m × 20 μ m grid; and (b) 3 μ m × 3 μ m grid.
Actuators 07 00057 g008
Figure 9. Shear stress module (Pa) in the cross section calculated through a 400 × 400 nodes grid with the analytical approach where: h r = 20 (a); h r = 10 (b); and h r = 20 (c).
Actuators 07 00057 g009
Figure 10. Shear stress module (Pa) around the notch for: h r = 20 (a); and h r = 1 (b).
Actuators 07 00057 g010
Figure 11. Shear stress ( 10 8 Pa) map for: h = 20 r (a); h = 10 r (b); and h = r (c).
Actuators 07 00057 g011
Figure 12. Summary of the results obtained by applying FEA to the case r = h : (a) mesh; (b) shear stress; and (c) shear stress in the section.
Actuators 07 00057 g012
Figure 13. FEA applied to the case h = 10 r : (a) mesh; and (b,c) shear stress.
Actuators 07 00057 g013
Figure 14. FEA applied to the case h = 20 r : (a) mesh; and (b,c) shear stress.
Actuators 07 00057 g014
Figure 15. Stress (Pa) at the edge and at the core of the notch, as a function of ρ = r h r .
Actuators 07 00057 g015
Figure 16. Stress Concentration Factor vs. η = h r .
Actuators 07 00057 g016
Figure 17. Ratio δ of the scalloping dept d to chord a as a function of η .
Actuators 07 00057 g017
Figure 18. Stress Concentration Factor vs. δ .
Actuators 07 00057 g018
Table 1. Comparison of Results.
hPointPosition τ (MPa)
xyAnalyticalFlex PDEFEA
mid*min, max*
rCorer019.920.320.3724.66
Edge r 2 ± 3 2 r 0<6.0 × 10 3 6.8 × 10 3 6.8 × 10 3
10 r Corer0356390 391.93 485.78
Edge r 20 ± 399 20 r 0<20 1.49 1.49
20 r Corer0727928 802.01 991.85
Edge r 40 ± 1599 40 r 0<150 7.08 6.25
mid: referred to mid section; min, max: minimum and maximum values.

