1. Introduction
Plasma actuators have been widely studied as active flow-control devices because they are thin, lightweight, free of moving parts, and capable of rapid response [
1,
2,
3,
4]. In particular, dielectric barrier discharge (DBD) plasma actuators generate an induced wall jet through electrohydrodynamic body forcing produced by ionized gas using an asymmetric electrode arrangement and are therefore well suited to near-wall flow control [
5,
6,
7]. Their application has been investigated in a wide range of problems, including separation control, boundary-layer control, and transition control [
8,
9,
10,
11,
12,
13,
14,
15,
16,
17]. Among these applications, boundary-layer transition control is especially demanding because the target flow structures are often confined to a very narrow near-wall region. Numerous studies have examined plasma-based transition control in different scenarios [
18,
19,
20,
21]. For example, Grundmann and Tropea demonstrated significant attenuation of Tollmien–Schlichting waves by unsteady plasma forcing [
18]. Rizzetta and Visbal numerically showed delayed transition and improved aerodynamic performance for excrescence-induced transition [
19]. In swept-wing boundary layers, Yadala et al. experimentally demonstrated transition delay through plasma-based base-flow modification [
20], and similarly, Miwa et al. achieved transition delay by reducing the crossflow component near the leading edge [
21]. These examples indicate that, when the target instability or base-flow modification is localized very close to the wall, the actuator must deliver momentum selectively within that region. If the induced jet spreads into unintended parts of the boundary layer, it may behave as an additional disturbance rather than as a controlled base-flow modification. Therefore, a near-wall-confined jet or thin-layer forcing is desirable for selective transition control. In actual boundary-layer and crossflow-transition-control applications, the relevant near-wall scale depends on the boundary-layer thickness, viscous length scale, and the wall-normal location or extent of the target instability. For example, plasma-based crossflow-reduction studies [
20,
21] targeted velocity modification in the near-wall part of the boundary layer, where a thinner induced jet and forcing pattern would provide a more selective input.
In conventional single-dielectric-barrier-discharge (SDBD) plasma actuators, the induced flow is accelerated near the exposed electrode, but the resulting wall jet generally spreads as it develops downstream [
5,
22]. As a result, the actuation region is not maintained as a thin layer confined close to the wall but instead tends to occupy a finite wall-normal extent. This is not necessarily problematic in applications where broad near-wall momentum addition is sufficient; however, it becomes a limitation when selective forcing is required within a very narrow region of the boundary layer. Various modified electrode arrangements have also been explored to enhance the induced flow or alter the jet direction. For example, sliding-discharge and tri-electrode configurations can strengthen the induced flow and produce more directional acceleration under certain conditions [
23,
24,
25,
26], and multi-electrode designs have been explored from the viewpoint of thrust enhancement and momentum transfer [
27]. However, the resulting flow structures are often complex, and local jet deviation or broadened forcing regions may still arise depending on the electrode arrangement and driving conditions. Stable formation of a thin near-wall forcing layer remains challenging.
One promising approach to address this limitation is miniaturization of the actuator. By reducing the actuator scale, the flow and forcing regions generated near each electrode may themselves be made thinner, which is attractive for applications requiring highly localized near-wall actuation [
28,
29,
30,
31]. Houser et al. demonstrated the feasibility of microfabricated DBD plasma actuators using thin-film electrode fabrication [
28]. Hink et al. further showed that the performance of microfabricated actuators depends strongly on dielectric thickness, electrode structure, and operating voltage [
30], indicating that simple miniaturization alone does not necessarily provide sufficient momentum input, even with finer geometries. Numerical design optimization studies of micro plasma actuators have also emphasized the importance of electrode geometry and dielectric properties in determining actuator performance [
32].
To compensate for this limitation, multi-element and parallelized configurations have been investigated so that the effect of individual elements can be accumulated while maintaining actuation close to the wall [
33,
34,
35]. Forte et al. showed that the induced-flow characteristics can be significantly affected by multi-electrode arrangement [
33]. In shear-flow applications, superposed AC-DBD actuator outputs have also been used to generate prescribed three-dimensional disturbances, highlighting the importance of actuator arrangement and output superposition [
36]. Do et al. reported crosstalk between successive DBD modules in closely arranged configurations [
35]. These studies suggest that repeated re-acceleration by downstream elements may help suppress downstream spreading of the jet, although close packing can also intensify mutual interaction and generate non-ideal flow structures. To mitigate such effects, Sato et al. developed an integrated multiple-electrode actuator using pulsed-DC actuation for successively accelerated ionic-wind generation under low-voltage operation [
37], following earlier work on pulsed-DC plasma actuation [
38]. Nakamura et al. further proposed a multi-stage arrangement designed to suppress crosstalk while enhancing induced-flow acceleration [
39]. However, it remains unclear whether such concepts can realize a thin near-wall forcing layer at the microscale without introducing non-ideal forcing patterns, because reduced electrode spacing may intensify inter-element interaction.
Clarifying this issue requires examination of not only the overall jet structure but also the near-electrode flow structure that governs jet formation and sustainment. This structure is expected to depend strongly on actuator design, driving waveform, and inter-element interaction, and in turn to determine the jet thickness and spatial arrangement of the forcing pattern. Time-resolved particle image velocimetry (PIV) studies of developing pulsed plasma jets have illustrated the usefulness of resolving near-field vortex dynamics for understanding downstream jet development [
40]. Beyond plasma actuation, related challenges of localized high-frequency forcing and near-boundary response measurement have been addressed in microscale acoustofluidic systems, where ultrasound can provide non-contact actuation [
41,
42,
43]. Although these platforms differ fundamentally from plasma actuators, they share the need to resolve spatially confined actuation effects and near-boundary responses at the microscale.
Conventional PIV is an effective tool for evaluating velocity fields and has therefore been widely used for plasma-actuator-induced jet measurements. However, its interrogation-window-based processing limits the spatial resolution available in regions with small geometric scales and large local velocity gradients. Single-pixel ensemble-correlation approaches have been proposed to obtain higher-spatial-resolution velocity fields near walls and steep velocity gradients [
44], and have been applied to plasma-actuator measurements [
45]. Such high-density velocity fields also enable more spatially resolved evaluation of the gradients required for estimating the body-force field of plasma actuators. PIV-based body-force estimation has shown that the spatial distribution of forcing can be inferred, at least semi-quantitatively, from measured velocity fields [
46]. Applying this estimation to single-pixel PIV data can therefore provide a more detailed representation of the near-electrode forcing distribution [
45]. Together with conventional PIV for mean-flow comparison, these approaches can be used to evaluate the formation of a thin near-wall forcing layer in micro plasma actuator arrays and to compare their near-electrode flow structures with those of conventional configurations.
In this study, photolithographically fabricated micro actuator arrays were experimentally investigated in quiescent air to clarify the potential and limitations of near-wall-confined plasma actuation. Two specific actuator configurations were examined: a micro single-dielectric-barrier-discharge actuator array (micro-SDBD) and a micro pulsed-DC actuator array (micro-PDC). A representative micro-SDBD geometry was first identified by preliminary thrust-based screening, and the selected micro actuator configurations were then evaluated in terms of near-wall jet confinement. In addition to conventional PIV, single-pixel PIV was applied to resolve the near-electrode flow structure, and the streamwise body-force distribution was estimated from the high-spatial-resolution velocity fields as a semi-quantitative diagnostic indicator. For comparison, corresponding conventional-scale SDBD and pulsed-DC actuators were also evaluated under representative operating conditions. Through these analyses, the present study characterizes the near-wall jet and forcing structures of the tested micro-parallelized configurations. Particular attention is given to inter-element interaction and to the effects of actuator configuration and driving method on the formation of a thin near-wall forcing pattern. The applicability of single-pixel PIV for high-spatial-resolution characterization of micro-scale plasma-actuator flows is also assessed.
2. Materials and Methods
2.1. Actuator Configuration and Operating Principles
In this study, micro-SDBD and micro-PDC actuator arrays were investigated using the same micro-actuator platform. Here, the term platform refers to the common integrated layout and substrate structure, whereas the fabricated micro actuator array denotes the physical test article consisting of multiple integrated elements arranged in the streamwise direction.
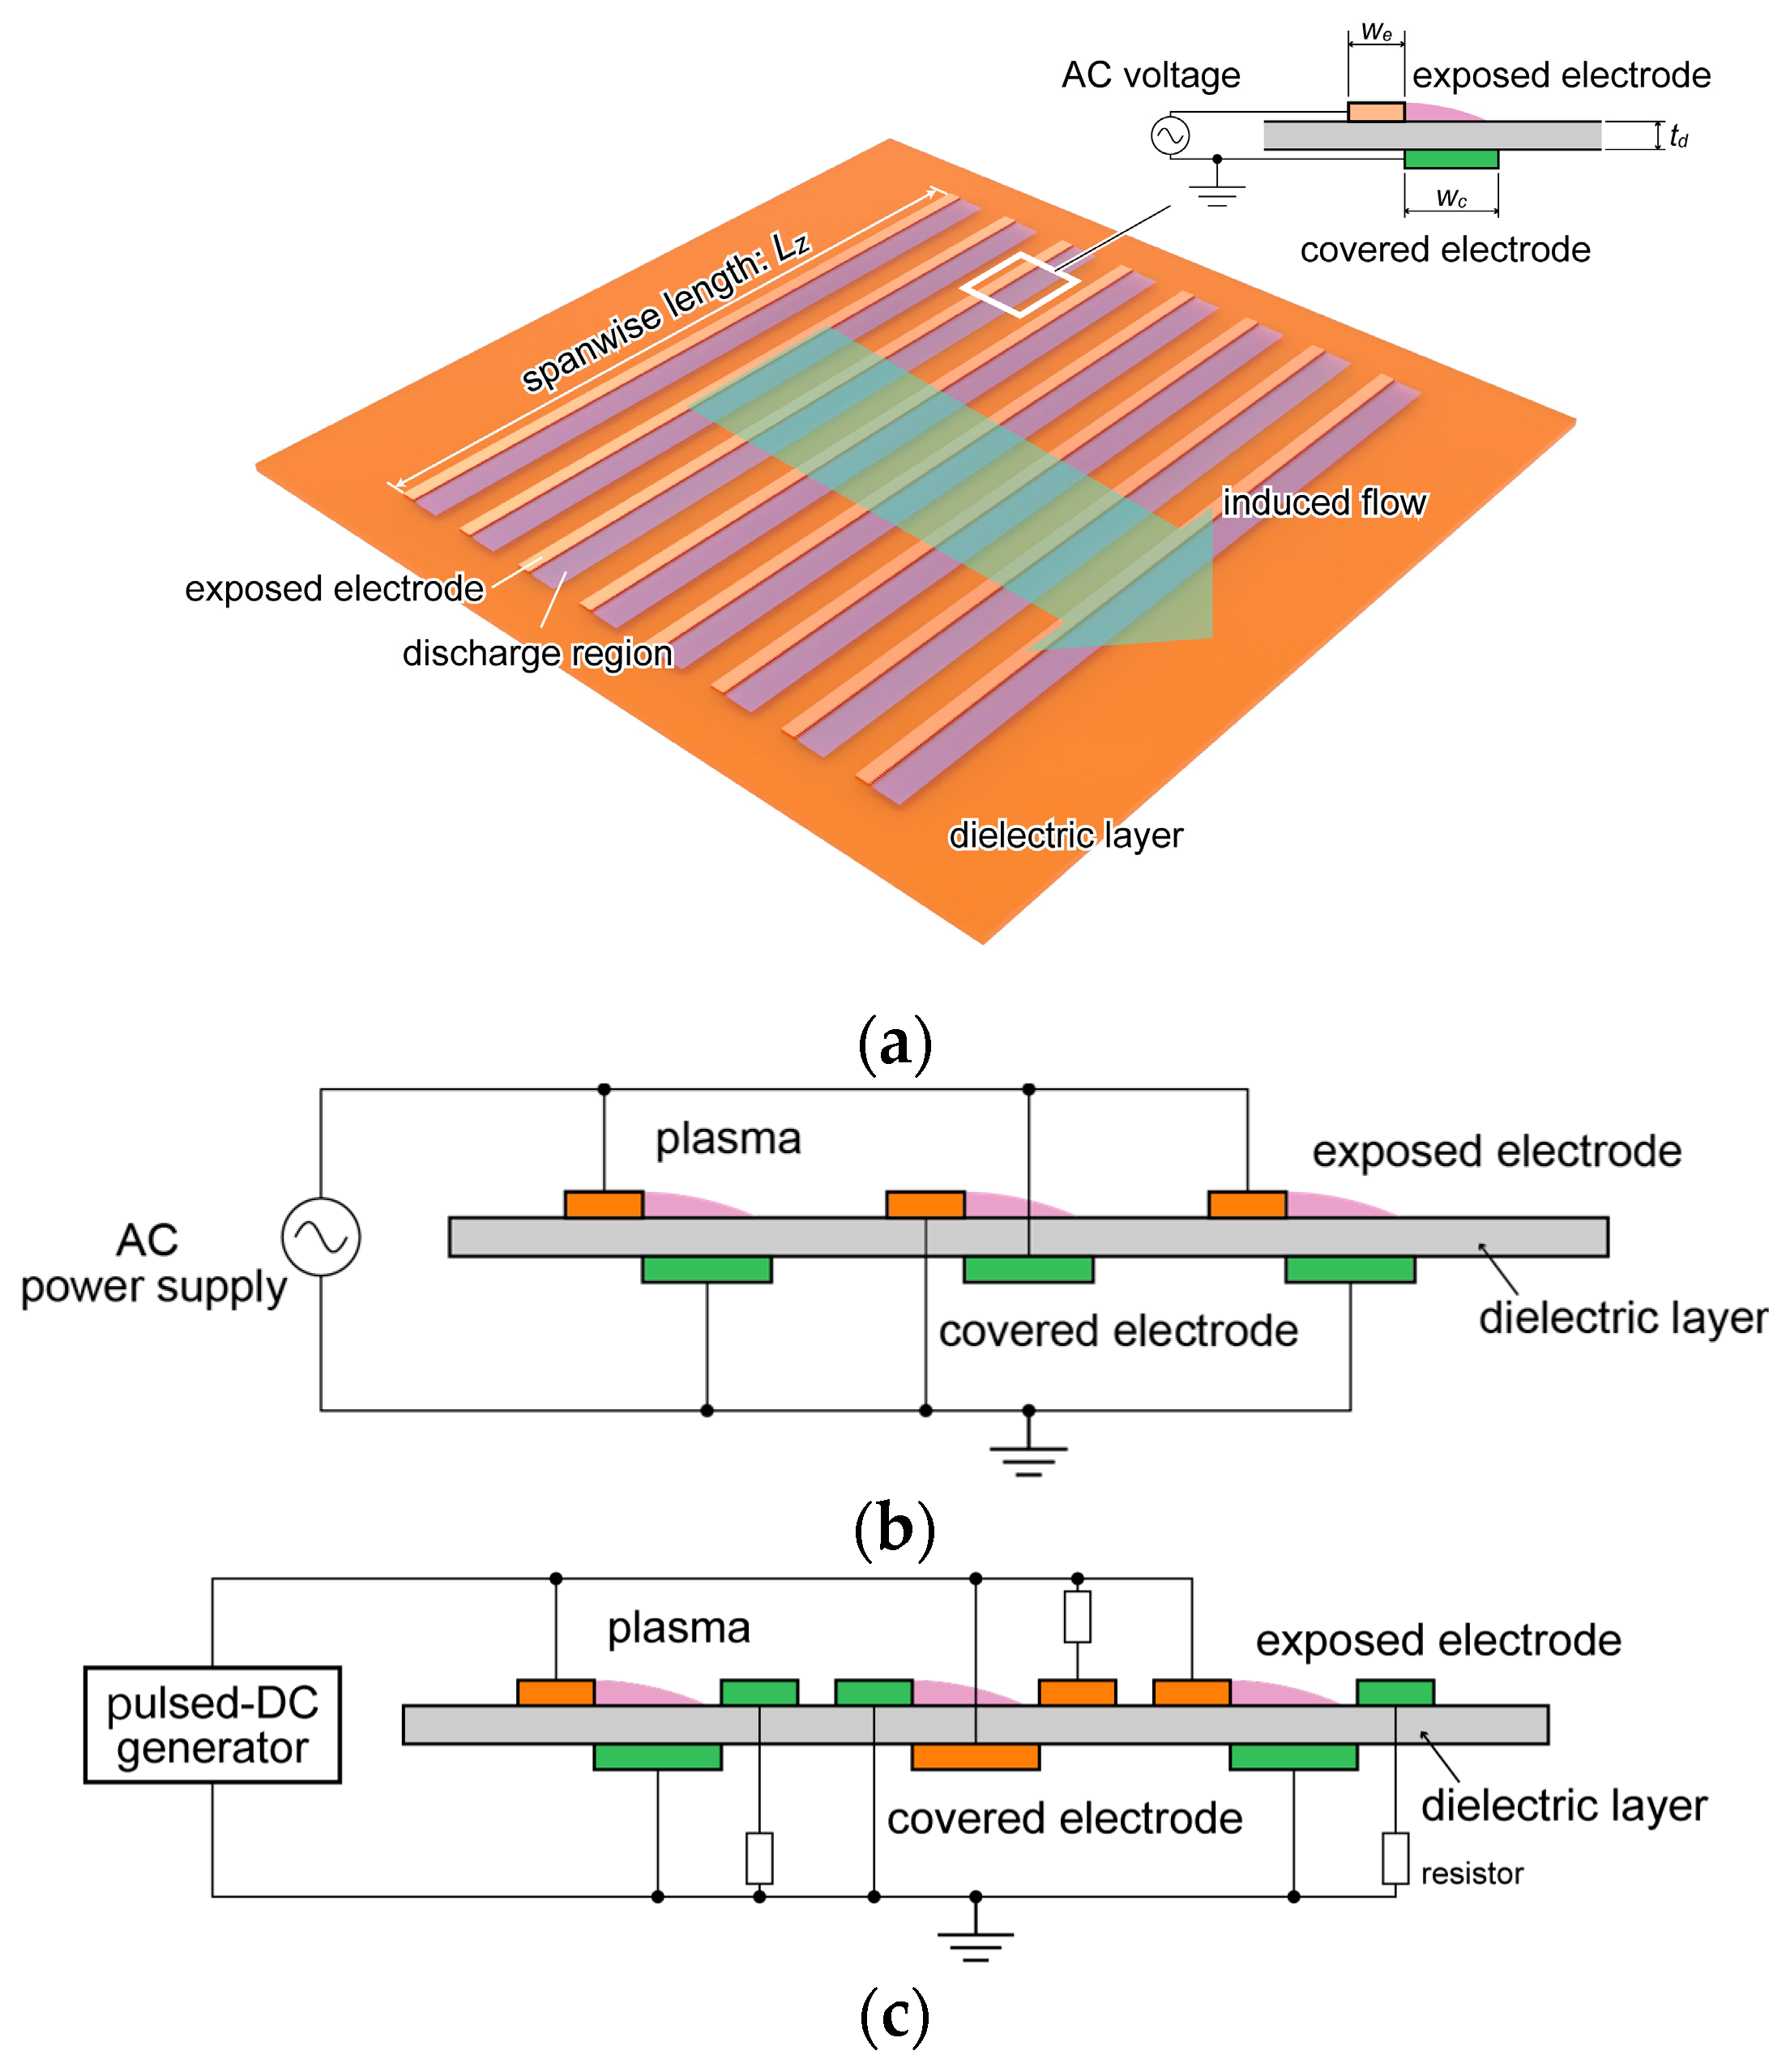
Figure 1a shows an overall schematic of the platform, while the cross-sectional structures of the micro-SDBD and micro-PDC actuator arrays are presented in
Figure 1b and
Figure 1c, respectively. The geometric parameters are defined as follows: exposed electrode width
, covered electrode width
, third electrode width
, dielectric thickness
, electrode thickness
, spanwise length
, number of elements
, and element spacing
. The coordinate system was defined such that
and
represent the streamwise, wall-normal, and spanwise directions, respectively.
The micro-SDBD actuator is a miniaturized version of the basic SDBD plasma-actuator configuration. It consists of an exposed electrode and a covered electrode separated by a dielectric layer. Applying an AC high voltage generates a discharge near the edge of the exposed electrode, which creates a body force that induces a wall-parallel flow.
The micro-PDC actuator adds a third electrode to this basic configuration. The third electrode is located at the end of the covered electrode opposite the discharge-side edge of the exposed electrode. The micro-PDC actuator is driven by a pulsed-DC waveform. In this mode, air ionization is primarily triggered by the short-duration grounding of the covered electrode, while the accelerating field is set by the applied DC bias. This partial decoupling of ionization and voltage control is expected to promote the downstream acceleration of ions [
38]. The third electrode serves to remove accumulated charges from the dielectric surface. In the present arrangement, the third electrode of one element and the exposed electrode of the next element are connected to the same driving side, resulting in an alternating polarity pattern between adjacent elements. This electrode arrangement was adopted to suppress unintended discharge between adjacent elements while forming a potential difference at the intended locations [
37].
For both types, the discharge-side edge of the exposed electrode was given a serrated shape. Serrated electrodes have been reported to help define discharge-onset locations and improve the spanwise uniformity of the discharge distribution [
47,
48], resulting in a more uniform induced flow [
49]. In the present design, the serration consisted of isosceles triangular teeth with a base width of 200 μm and a height of 200 μm.
For comparison, conventional-scale SDBD and PDC actuators with the same basic electrode arrangements were also used. The conventional PDC actuator used the same three-electrode arrangement as the micro-PDC actuator but differed in geometric scale, dielectric thickness, spanwise discharge length, and number of elements. Based on the geometric parameters defined above, representative actuator configurations were selected for the subsequent evaluations. The operating conditions are described in a later section.
2.2. Micro Actuator Fabrication Process
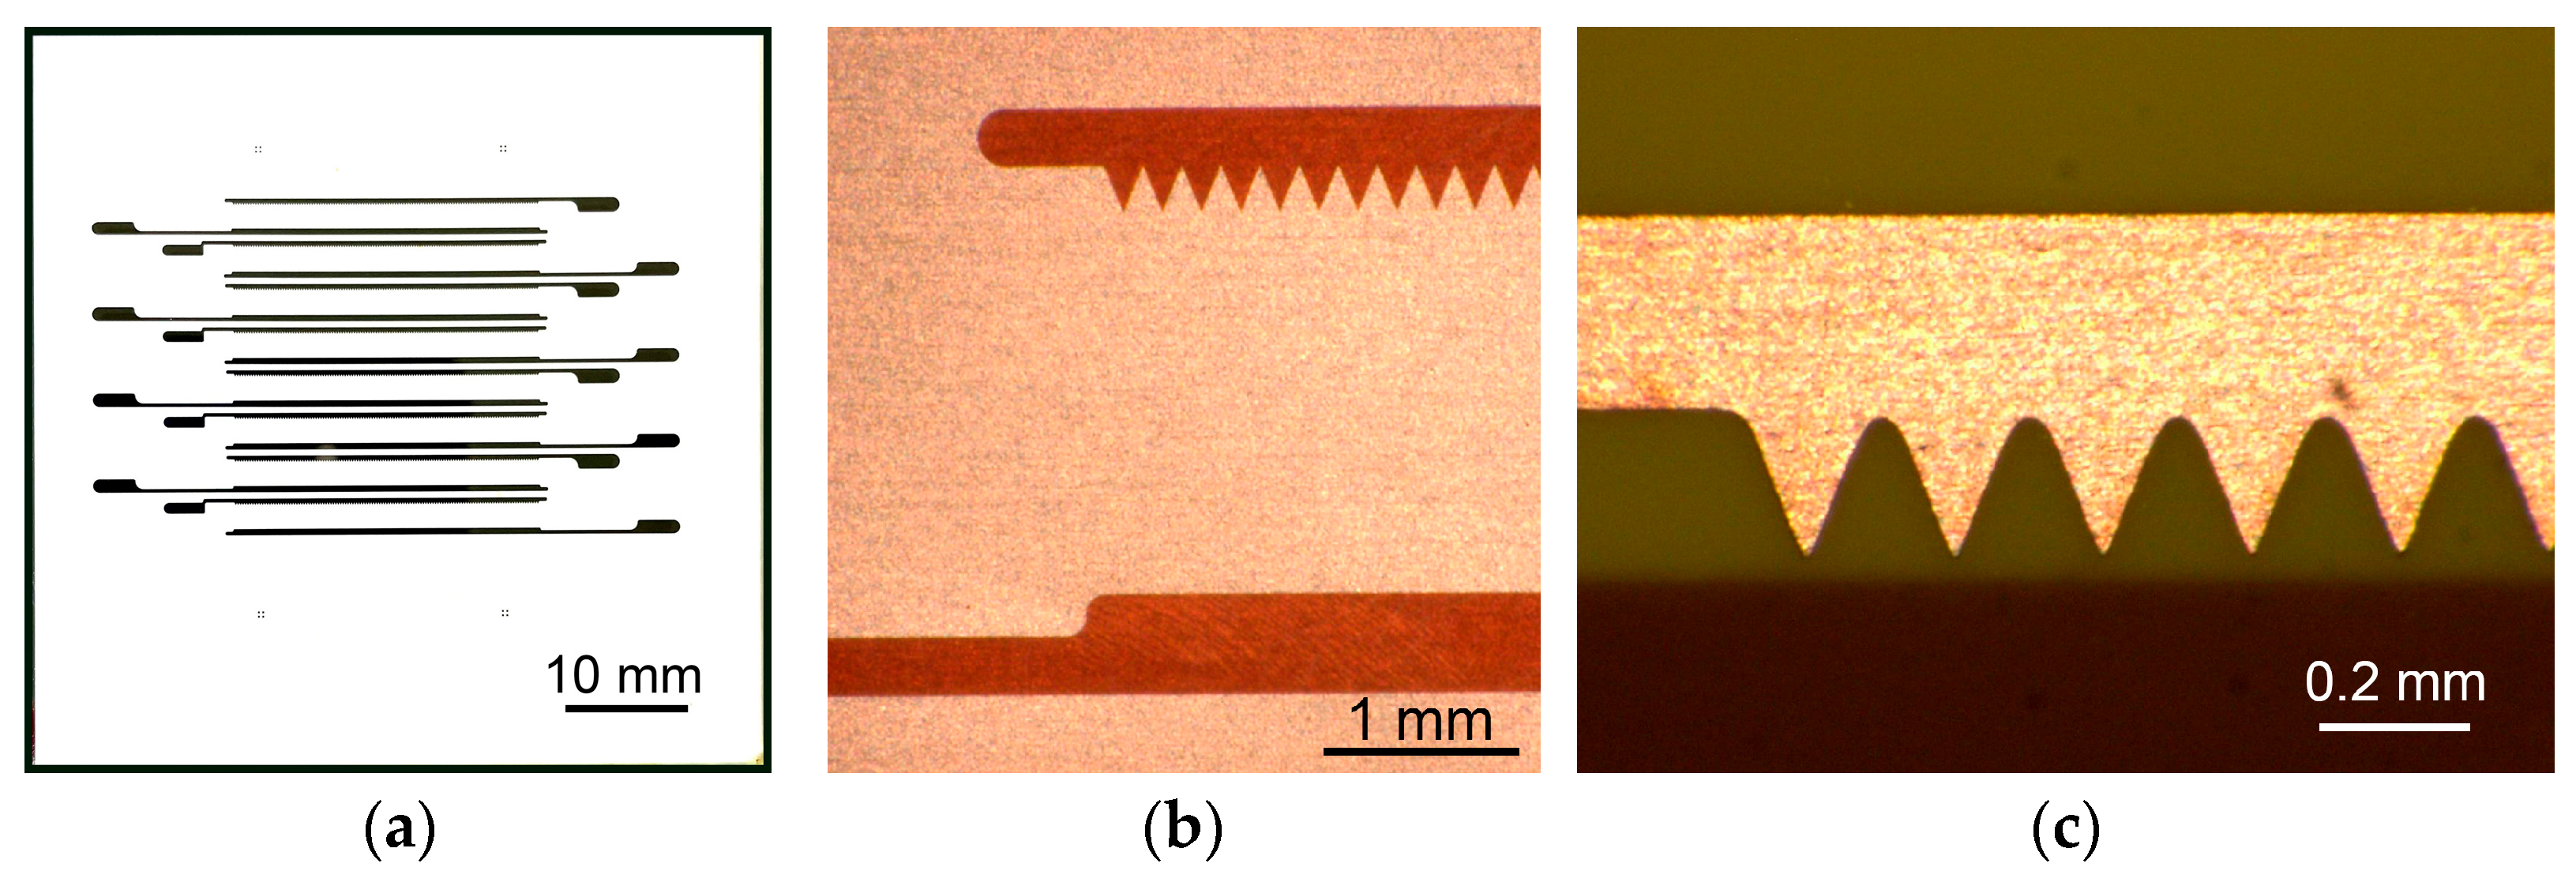
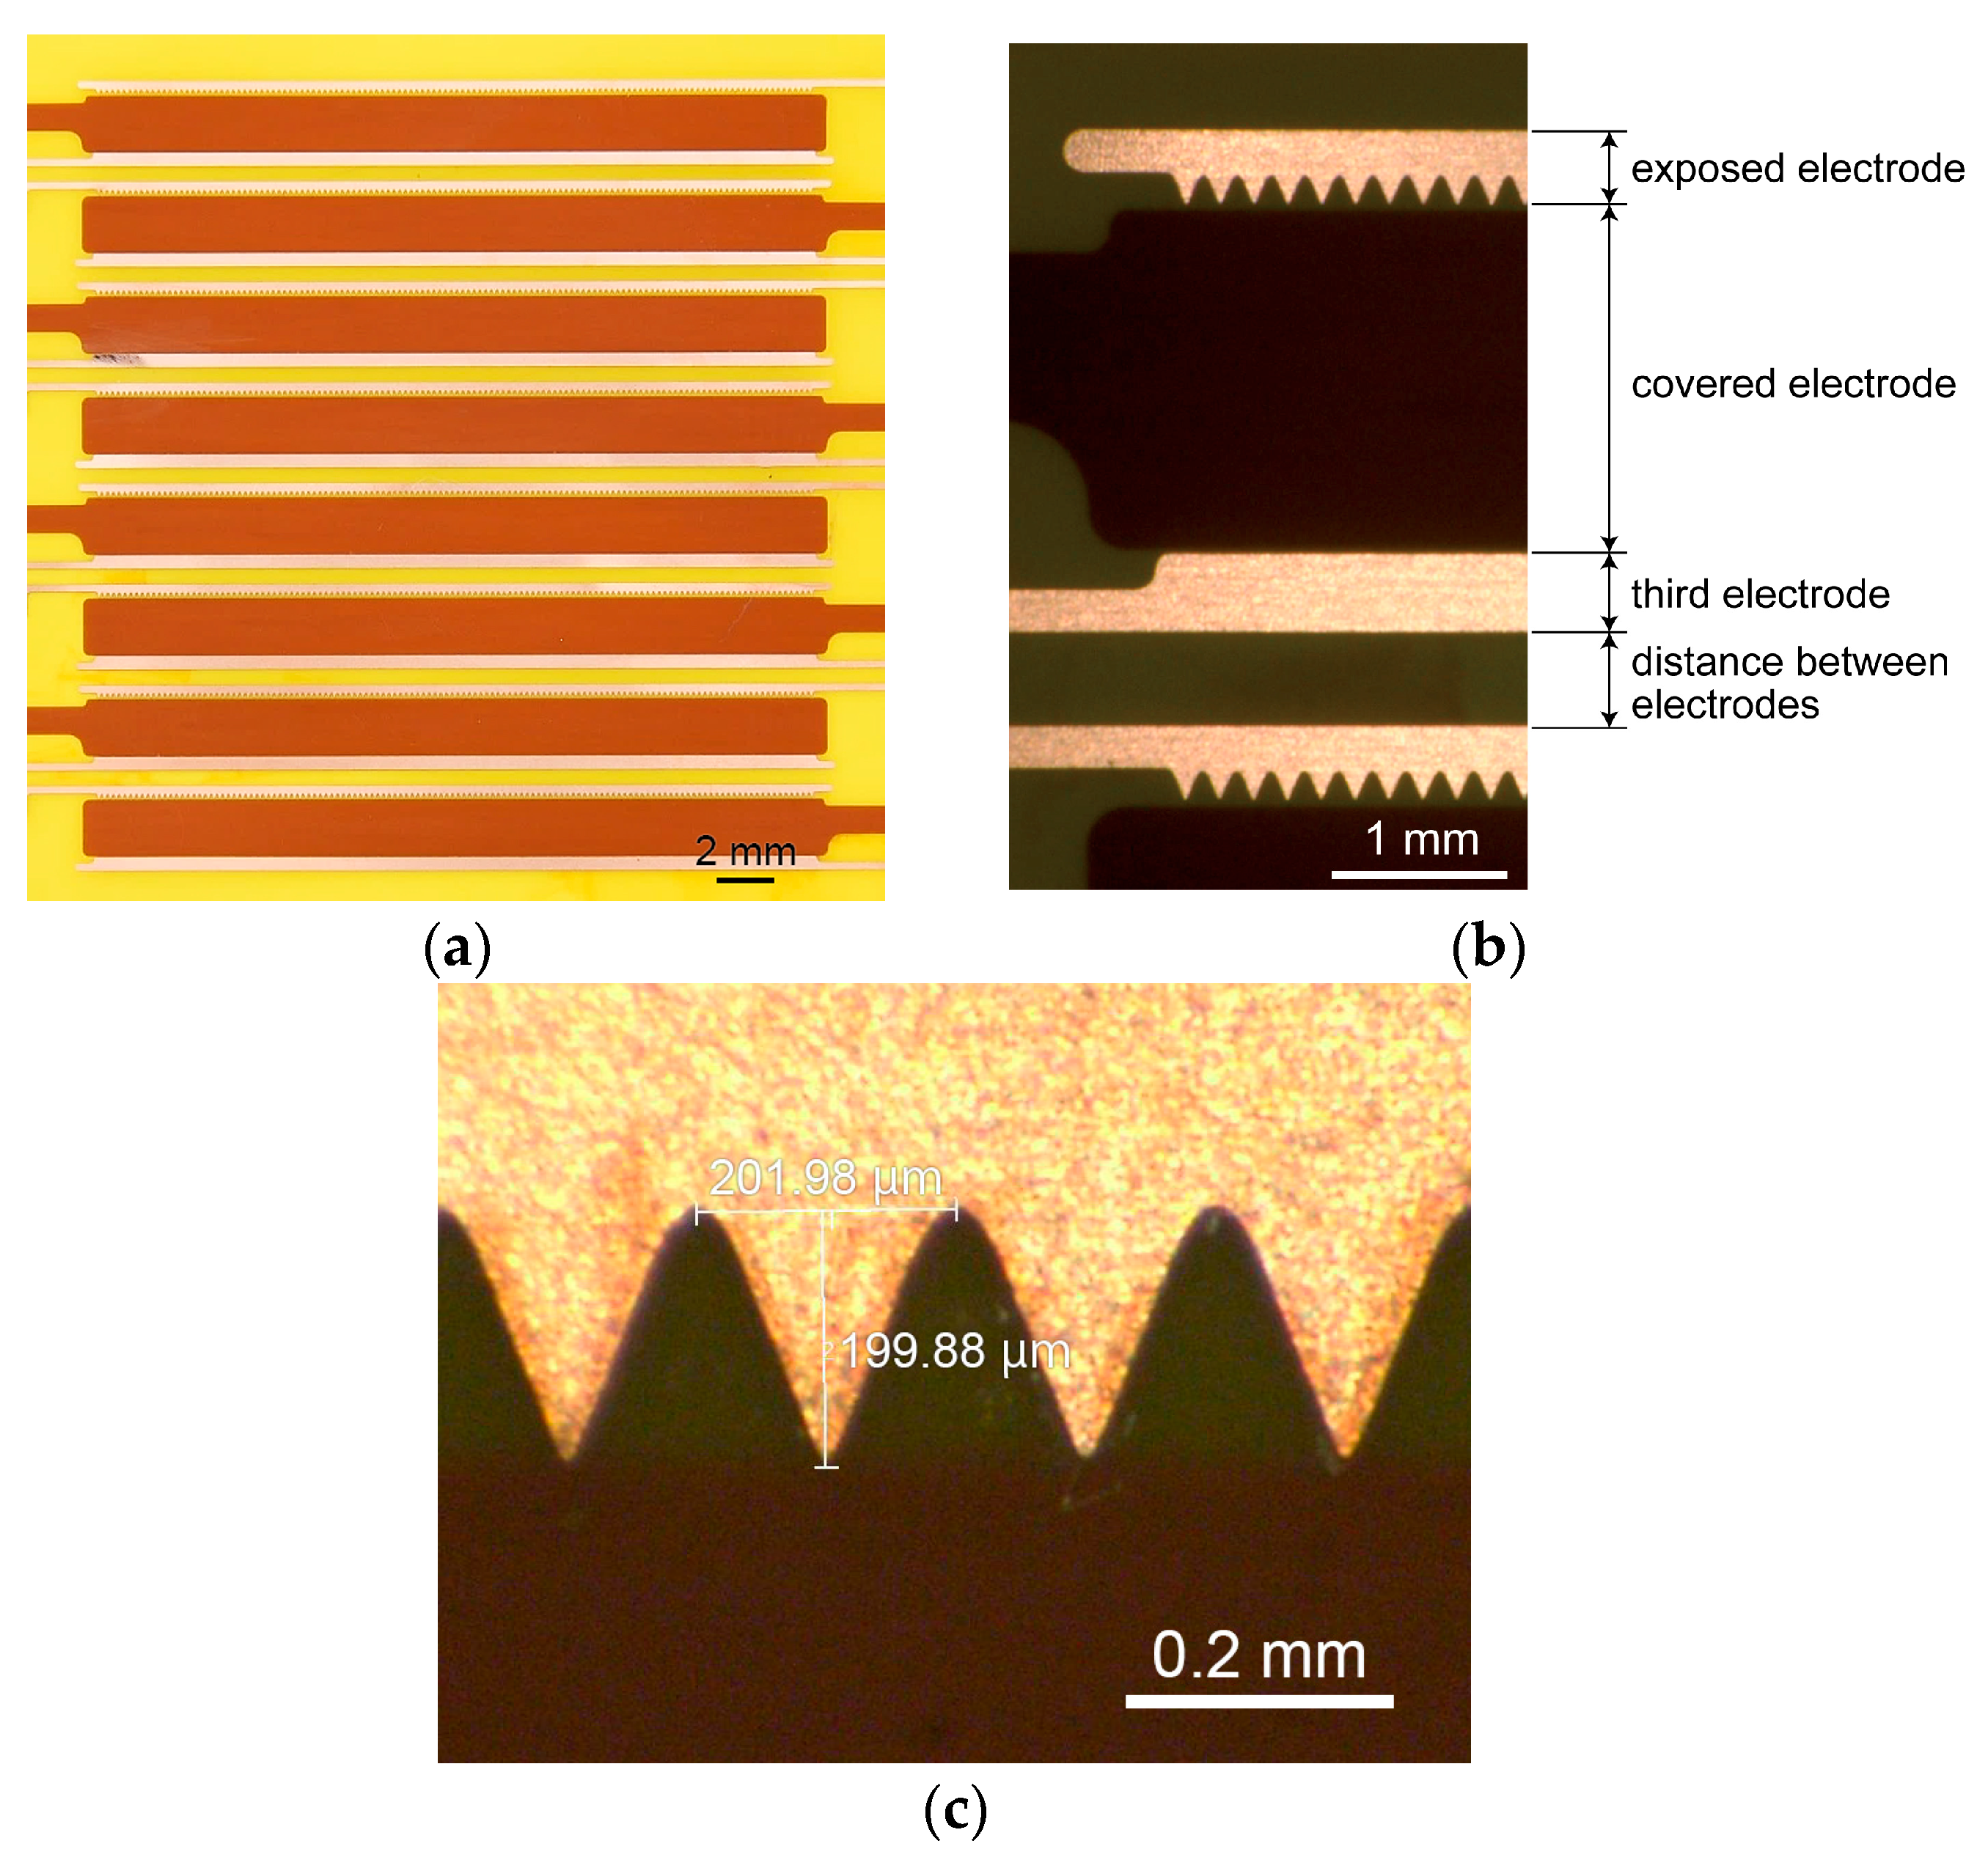
The micro actuators were fabricated using photolithography, with representative process images shown in
Figure 2.
Figure 2a presents a photomask pattern of the micro actuator array,
Figure 2b shows the resist pattern after exposure and development, and
Figure 2c provides an enlarged view of the etched serrated electrode structure. Through these processes, the overall actuator pattern, including the local electrode geometries and fine serrated features, was formed in an integrated manner.
Photolithography was selected because it enables high-precision processing of fine geometries and allows simultaneous formation of all integrated elements on the platform. Furthermore, the use of a photomask ensures reproducible fabrication of identical patterns. A flexible copper-clad laminate (FCCL) was used as the substrate, consisting of a 25 μm thick polyimide film with 12 μm thick copper layers on both sides. These layers were laminated by pressure without an adhesive. This adhesive-free structure was suitable for the present micro-actuators because it provided a well-defined dielectric thickness and electrode–dielectric interface.
The photomask was prepared from a CAD pattern and fabricated using a laser direct imaging system. Preliminary microscopy observations revealed systematic geometric deviations caused by side etching, particularly in the serrated features. For the 12 μm thick copper layer used in this study, the serration geometry exhibited a dimensional error of approximately 40 μm, whereas the error in straight segments was limited to approximately 12 μm. To compensate for this effect, the photomask geometry for the serrated features was corrected in advance so that the final etched pattern approached the intended dimensions. The photolithography process involved resist coating, exposure, development, and etching. For the resist coating, a positive G-line photoresist, OFPR-800 (Tokyo Ohka Kogyo Co., Ltd., Kawasaki, Japan), was spin-coated onto the cleaned FCCL at 2000 rpm for 25 s, followed by 4000 rpm for 5 s, and then baked at 90 °C for 7 min. Exposure was performed for 25 s using a mask aligner (MA-20, Mikasa Co., Ltd., Tokyo, Japan), and development was carried out with NMD-3 2.38% (Tokyo Ohka Kogyo Co., Ltd., Kawasaki, Japan). Etching was conducted in a temperature-controlled bath at 45 °C using a ferric chloride aqueous solution (H-1000A, Sunhayato Corp., Tokyo, Japan). These processes were applied to both sides of the substrate to form the complete electrode patterns. As shown in
Figure 2, this process provided sufficient reproducibility for both the overall actuator pattern and the fine serrated features required for the subsequent evaluations.
2.3. Power Supply and Driving Circuit
Because the SDBD and PDC actuators differ not only in actuator structure but also in driving method, separate power-supply systems were configured for each. For the micro-SDBD actuator, a TTL signal generated by a function generator was input to a custom-modified commercial power amplifier and a custom high-voltage transformer, and a sinusoidal AC high voltage was applied to the exposed electrode, thereby generating a surface dielectric-barrier discharge.
For the micro-PDC actuator, the output of a high-voltage DC power supply (HAR-30R10, Matsusada Precision Inc., Kusatsu, Japan) was fed to a pulsed-DC generation circuit and supplied as a DC bias to both electrodes, while the covered electrode was periodically grounded by short-duration pulses. In this circuit, the covered electrode was connected through a current-limiting resistor and switched to ground potential by a fast solid-state switch driven by a TTL pulse signal. High-speed switching under high-voltage conditions was achieved using stacked SiC MOSFETs (SCT2H12NZ, 1700 V, 3.7 A, ROHM Co., Ltd., Kyoto, Japan) and the associated gate-drive circuit. Under a typical switching condition, the measured voltage waveform showed a fall time of approximately 84 ns and an effective grounding duration of approximately 1.6 μs. The waveform exhibited a sharp voltage collapse followed by a slower recovery process, which is qualitatively consistent with previously reported transient behavior of pulsed-DC plasma actuators [
44]. The repetition frequency was 6 kHz.
2.4. Procedure for Preliminary Thrust-Based Screening
A preliminary thrust evaluation was conducted to select a representative micro-SDBD geometry for the subsequent flow-field measurements. The thrust was measured directly using an analytical balance (AUW320, Shimadzu Corp., Kyoto, Japan) combined with a lever mechanism. In this setup, the horizontal force generated by the plasma-actuator elements was evaluated as thrust. For comparison across different configurations, the thrust was evaluated per unit spanwise length, and, when necessary, the thrust per element was also considered. For each condition, measurements were recorded for approximately 10 s, and the representative value was obtained by averaging the output over the interval in which a stable discharge was observed.
During the screening, thrust responses were compared for different exposed electrode widths, covered electrode widths, and element spacings. The thrust-measurement results and the selected geometry are presented in
Section 3.2.
2.5. PIV Measurement Setup and Flow-Field Evaluation
Two-dimensional particle image velocimetry (2D PIV) was used for the flow-field evaluation.
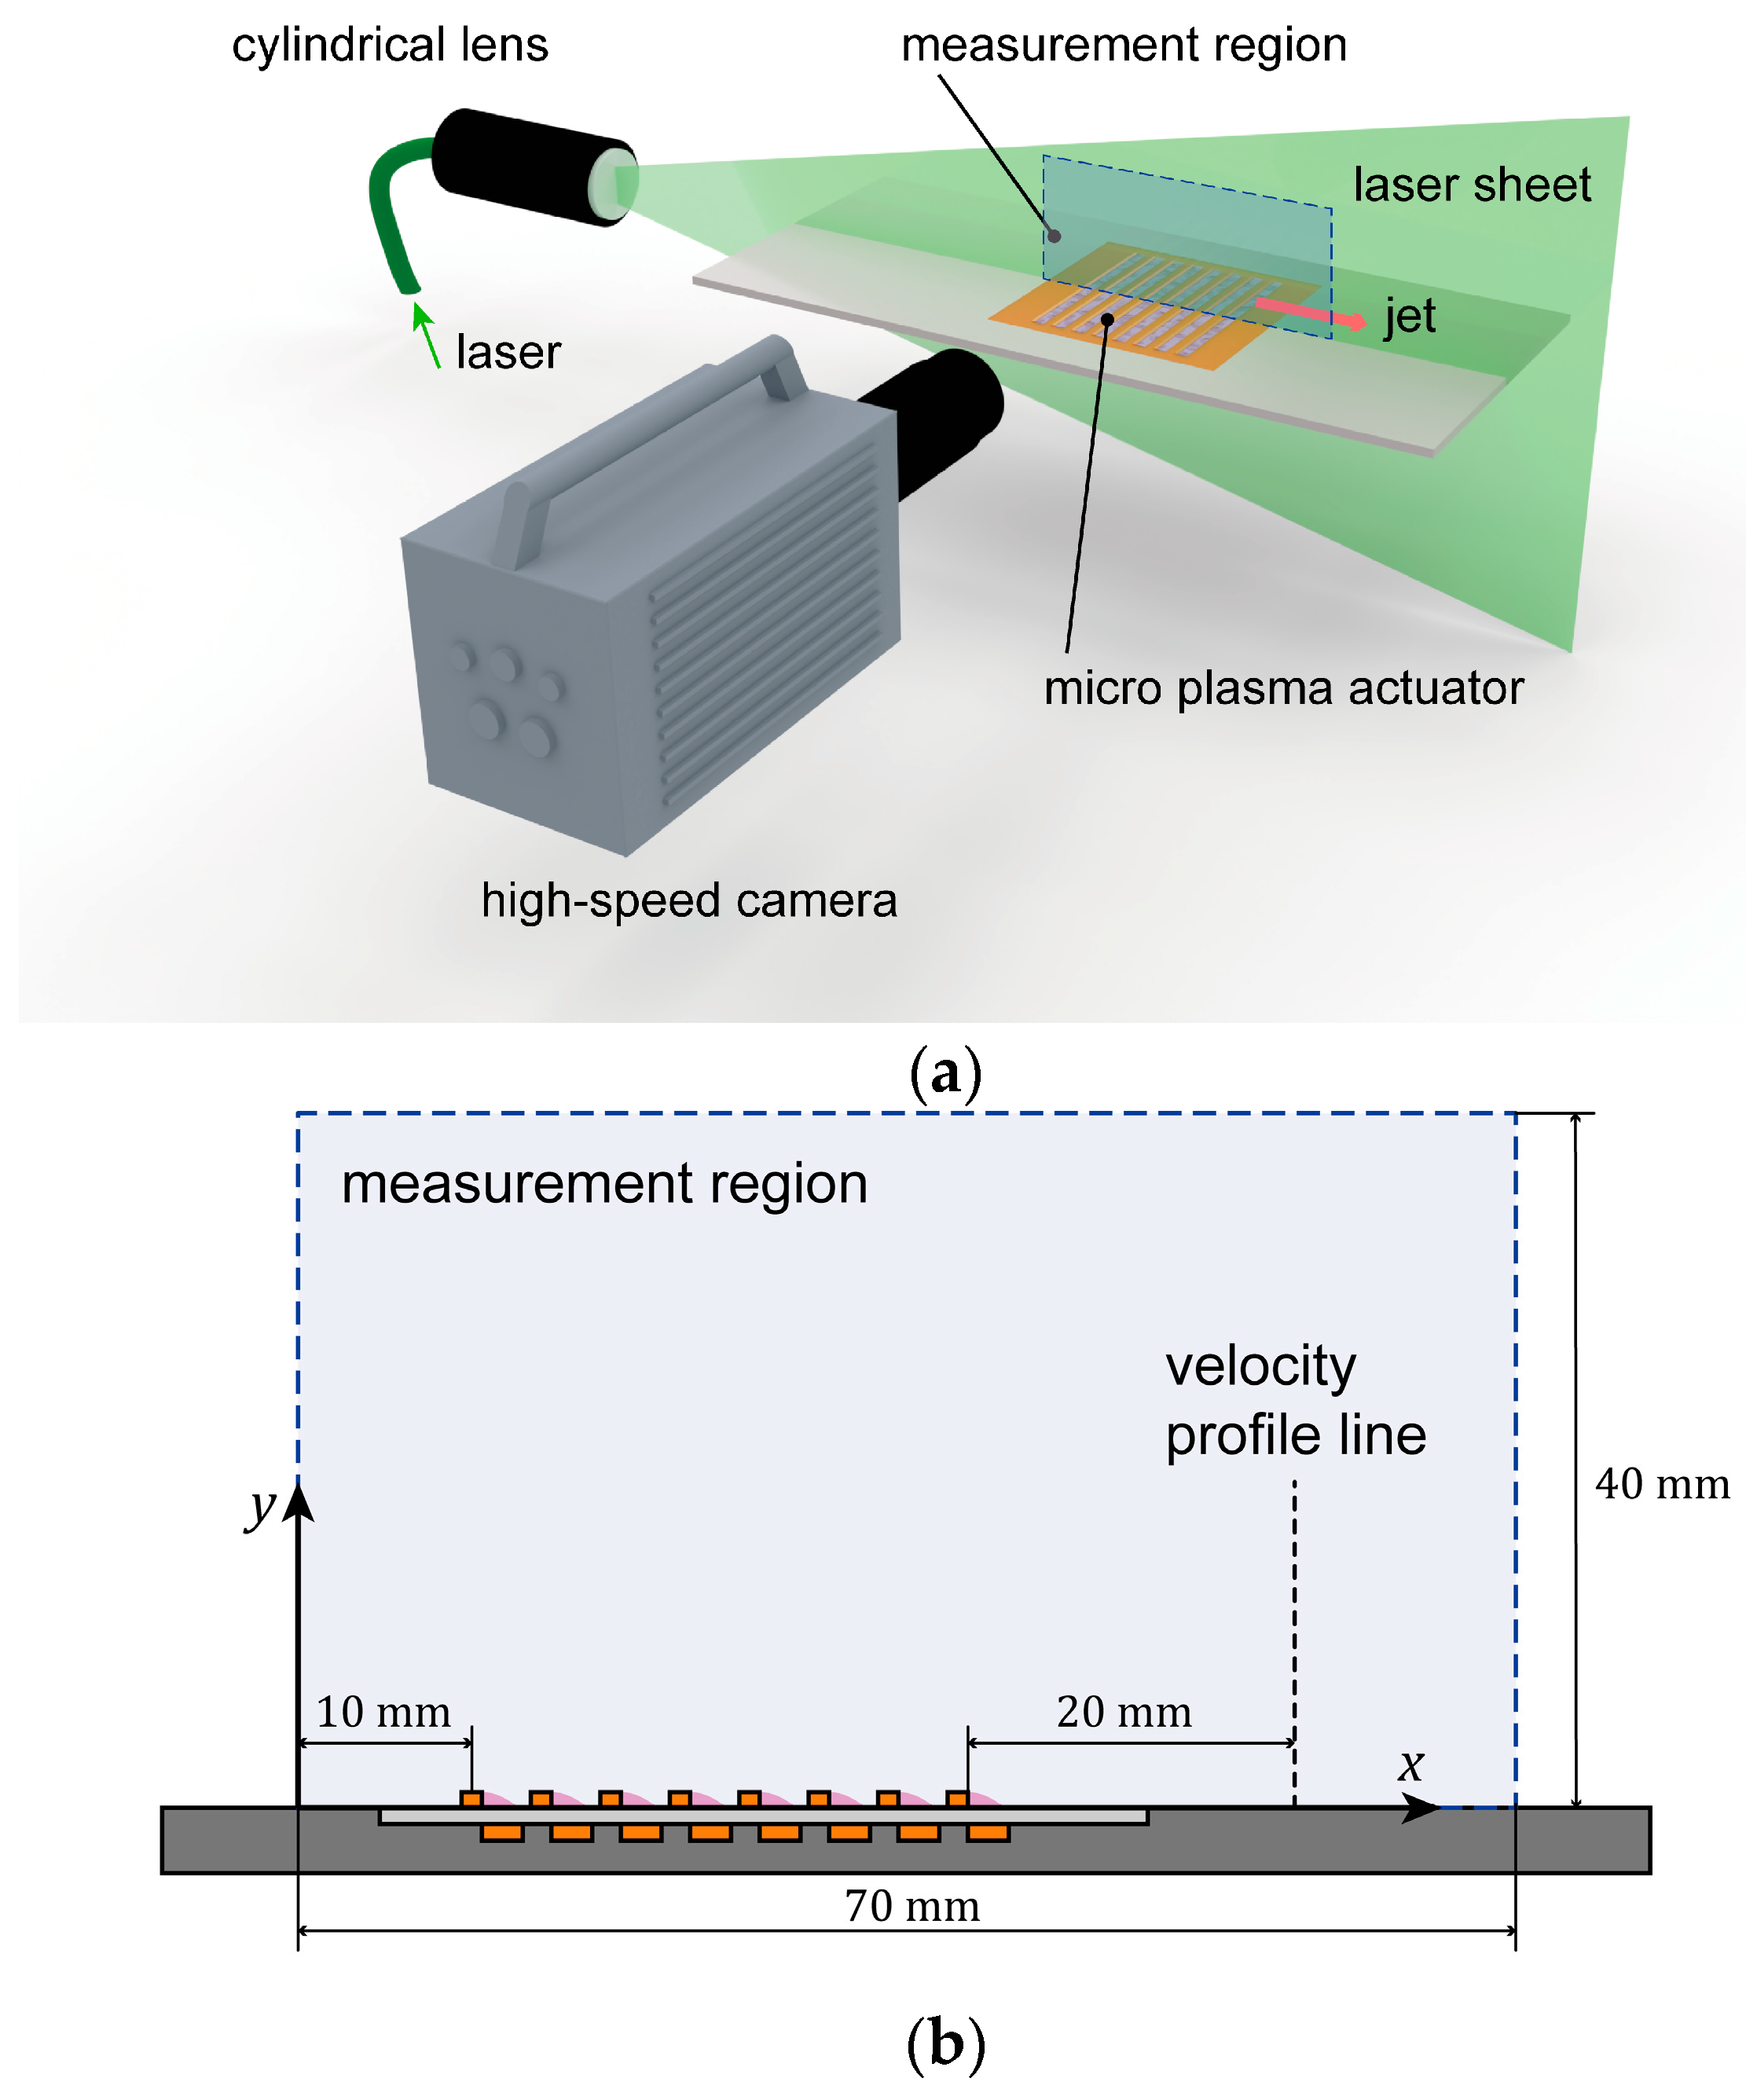
Figure 3 shows the PIV measurement setup, the coordinate system, and the evaluation locations. In
Figure 3a, the actuator, laser sheet, camera, measurement window, and extraction location of the wall-normal velocity profile are indicated. The measurement region and the arrangement of the plasma actuator are shown in
Figure 3b. In the present study, the acquired particle-image sequences were used not only for the evaluation of the mean velocity field but also for the single-pixel-based analysis described in a later section. As indicated in the figure, the wall-normal velocity profiles were extracted at a fixed location downstream of the actuator.
The measurement target was the velocity field in the discharge-direction cross-section above the plasma actuator. The laser sheet was introduced through the central cross-section of the actuator, and the particle images were recorded from the side. Incense smoke was used as tracer particles. A high-repetition Nd:YAG laser (LDP-100MQG, Lee Laser, Inc., Orlando, FL, USA) was used as the light source, a high-speed camera (FASTCAM SA-X2, Photron Ltd., Tokyo, Japan) was used for image acquisition, and the camera was equipped with a 150 mm macro lens. The imaging conditions were an image resolution of 1024 × 1024 pixels, a frame rate of 6000 Hz, and a laser pulse interval of 150 μs. The field of view was approximately 75 × 75 mm2, of which a region of approximately 70 × 40 mm2 including mainly the actuator and the downstream jet was used for evaluation. The reference point was taken as the tip of the upstream-most exposed electrode.
In the two-dimensional field plots, the wall-normal coordinate is denoted by , where 0 corresponds to the wall position defined from the actuator geometry and calibration images. In the extracted one-dimensional velocity profiles, the vertical axis is denoted as height because the plotted points correspond to the centers of retained PIV vectors rather than to the wall itself. In the immediate vicinity of the wall, particle-image reliability can be reduced by wall reflection, electrode reflection, halation from the actuator surface, and limited optical access. Although tracer particles were visible and advected even closer to the wall in the raw image sequences, these near-wall image regions were not used for the retained conventional-PIV profiles because optical contamination was more restrictive than tracer visibility. Therefore, vectors whose interrogation windows overlapped this wall-adjacent unreliable region were excluded. In the present conventional-PIV profiles, the lowest retained reliable vector center was approximately 0.31 mm from the wall. This value represents the first reliable measurement height in the extracted profiles, not the thickness of the optical blind region, and was determined primarily by near-wall optical limitations rather than by tracer-particle response.
All flow-field measurements in the present study were conducted in quiescent air and should therefore be interpreted as actuator-characterization data rather than as direct evidence of boundary-layer flow-control performance. In this characterization, near-wall confinement is quantified in terms of the absolute wall-normal distance from the actuator surface, primarily using the jet peak height in the velocity profiles and the positive peak location in the estimated body-force distribution.
After background removal via minimum intensity subtraction, the velocity-vector fields were calculated from interrogation-window-based correlations using multi-grid interrogation. The analysis conditions were an initial interrogation window size of 32 × 32 pixels, three-pass processing, a final interrogation window size of 8 × 8 pixels, 50% overlap, and a vector spacing of 4 pixels. The corresponding vector spacing was approximately 0.31 mm; this value represents the sampling interval of the velocity-vector field and not necessarily the effective spatial resolution. The vector fields were obtained using image deformation, and no explicit outlier replacement was applied to the retained data. A median filter of 5 × 5 vectors was applied as the post-processing step for the conventional-PIV analysis. The mean velocity fields were calculated from 5000 image pairs.
As a conservative estimate of the PIV displacement uncertainty, a representative value of 0.1 pixel was used. This value was selected considering that well-performed PIV measurements can achieve random displacement errors of approximately 0.05 pixel, whereas the present measurements include near-wall regions where particle-image quality is affected by optical limitations. Under the present magnification and inter-frame time, a 0.1-pixel displacement uncertainty corresponds to a velocity uncertainty of approximately 0.05 m/s. This velocity scale was used as a reference for interpreting the uncertainty in the extracted peak velocities.
For comparison of the mean velocity fields, the measurement window in the downstream vicinity of the actuator was used, and the jet peak location and wall-normal spread were evaluated from the wall-normal velocity profiles. The PIV results shown in the figures are representative runs obtained with representative devices for each actuator configuration. At least two repeated runs were performed for each condition, and up to six runs were acquired for selected conditions. When an actuator element was replaced after degradation, the new device was first tested under the same operating condition to confirm the reproducibility of the induced-flow characteristics. Therefore, the repeatability discussed here mainly represents run-to-run repeatability, while device-to-device consistency was checked by confirming similar induced-flow characteristics after device replacement. In the present study, the mean velocity fields and wall-normal velocity profiles of the micro and conventional actuators were compared primarily to evaluate the formation of jet structures confined near the wall.
2.6. Single-Pixel Particle-Image Velocimetry Procedure
To evaluate the flow structure near the electrodes in greater detail, single-pixel particle-image velocimetry (single-pixel PIV) was applied in addition to conventional PIV.
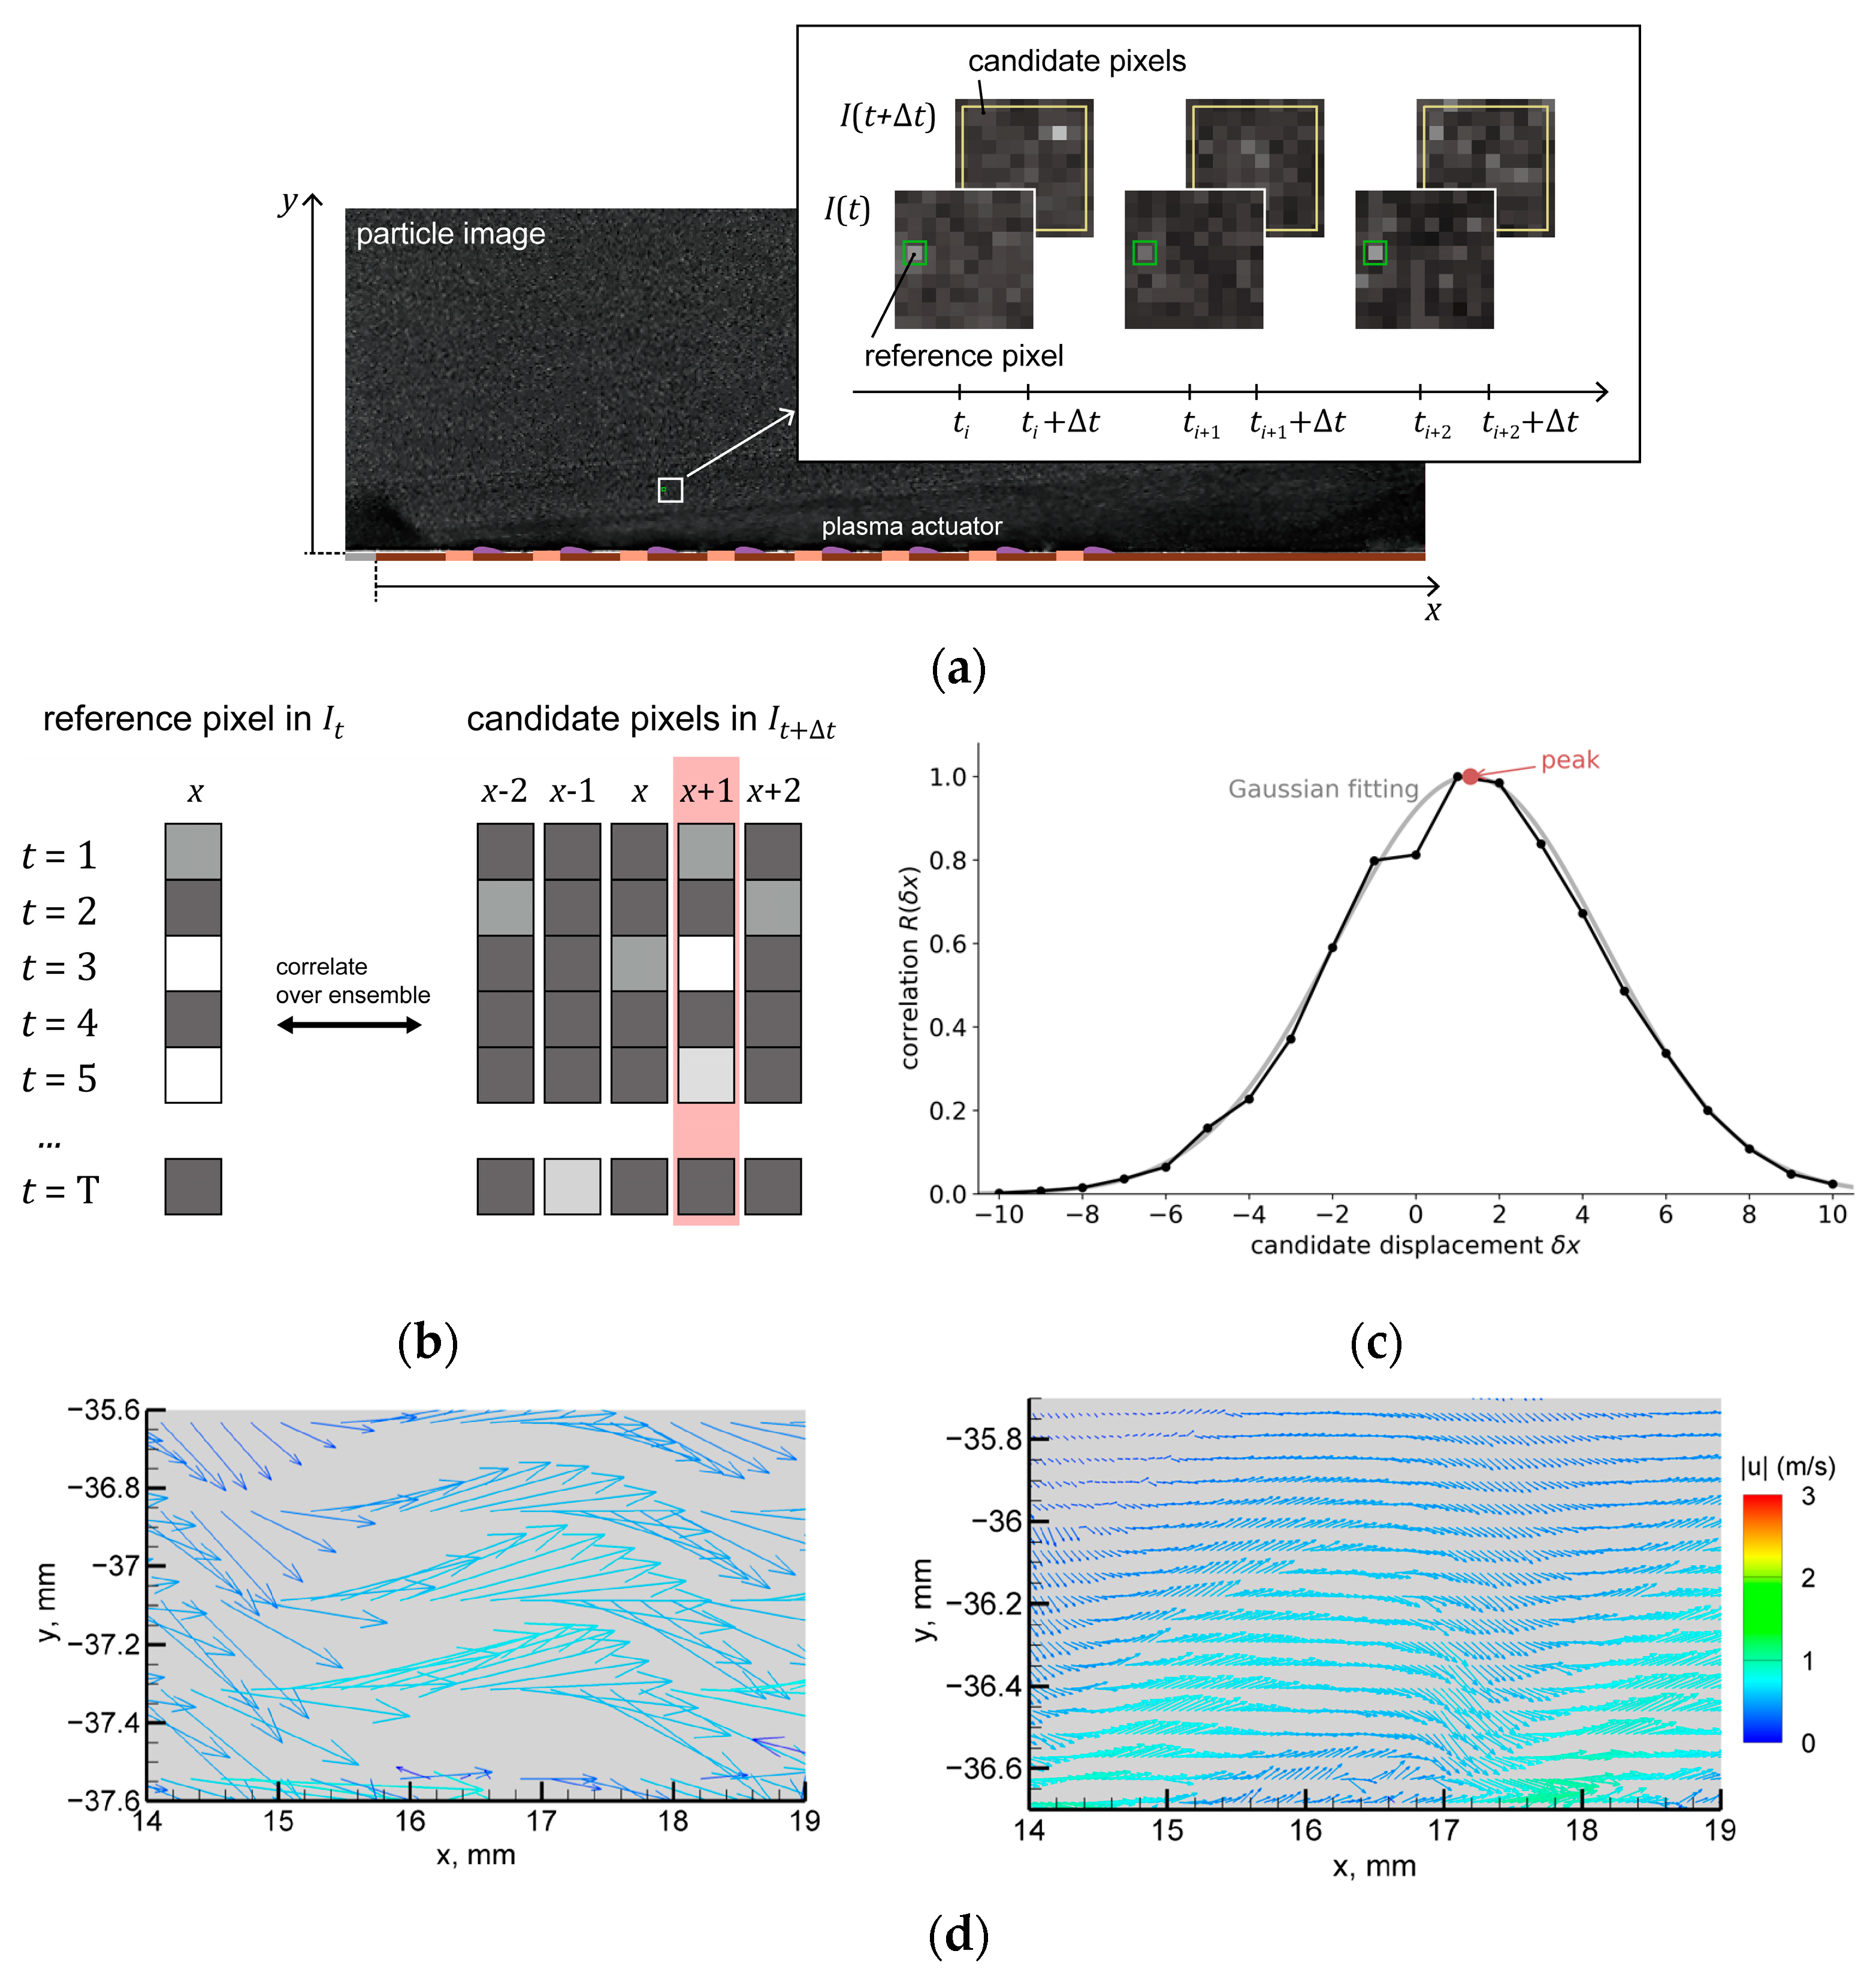
Figure 4 illustrates the single-pixel PIV procedure. The single-pixel PIV analysis was performed using the same particle-image sequences as those used for the conventional PIV analysis, with the aim of describing the near-electrode flow structure at a higher spatial resolution. The present procedure was developed with reference to the methods of Westerweel et al. [
44] and Nonomura et al. [
45].
In conventional PIV, an interrogation window is assigned to an image pair acquired with a short time interval , and the local displacement is estimated from image correlation in each window to obtain the velocity-vector field. In contrast, single-pixel PIV evaluates the displacement of each reference pixel by ensemble correlation over many image pairs within a prescribed search region, enabling velocity-field evaluation at one-pixel resolution. In the present study, each vector was obtained from the full set of 5000 image pairs.
Figure 4a shows an example of the particle image used in the analysis together with the concepts of the reference pixel and the search region.
Figure 4b illustrates the temporal intensity sequences at the reference pixel and at candidate pixels. More specifically, the intensity history at one reference pixel in
was extracted over the full image sequence, and its correlation was computed with the intensity histories of candidate pixels in
within the search region. The image scale was approximately 0.073 mm/pixel, so the single-pixel PIV field was sampled at approximately 0.073 mm intervals. The displacement corresponding to the maximum ensemble correlation was then taken as the mean particle displacement. While the schematic shows a one-dimensional displacement search for simplicity, the actual analysis evaluated the correlation distribution in a two-dimensional plane.
Figure 4c shows the correlation distribution with respect to displacement and the procedure used to estimate the mean displacement from the peak location. The location of the correlation peak was estimated with subpixel accuracy by Gaussian fitting. In the present analysis, grayscale normalization was applied to the particle images before correlation evaluation, the search range was set to ±20 pixels in both directions, and the correlation coefficient was evaluated using Pearson correlation. No explicit correlation–peak ratio or signal-to-noise threshold was applied. Before calculating vorticity and the estimated body-force distribution, no outlier replacement, missing-vector interpolation, or spatial smoothing was applied to the single-pixel PIV velocity fields, except for masking of invalid regions where necessary.
Figure 4d compares representative velocity-vector fields obtained by conventional PIV and single-pixel PIV, showing that single-pixel PIV provides a more densely sampled velocity-field representation than conventional PIV. This representation was used for the subsequent evaluation of near-electrode velocity gradients and the estimated body-force distribution.
2.7. Estimation of Streamwise Body-Force Distribution
In the present study, the streamwise body-force distribution in the vicinity of the plasma actuator was estimated from the two-dimensional velocity field obtained by single-pixel PIV. The resulting body-force maps are used as semi-quantitative indicators of the location and sign pattern of the effective forcing, not as precise maps of force magnitude. In particular, the analysis focuses on the arrangement of positive and reverse-sign regions, the dominant positive peak location, and the wall-normal extent of the positive estimated-force region.
The estimation was applied to the ensemble-averaged velocity field obtained from 5000 image pairs. Therefore, the reconstructed distribution is interpreted as an effective forcing pattern associated with the time-averaged hydrodynamic response of the flow, rather than as an instantaneous body-force distribution within each actuation cycle. This time-averaged treatment is consistent with the quasi-steady interpretation commonly used in plasma-actuator diagnostics, where the actuation cycle is much shorter than the hydrodynamic acceleration time scale of the induced flow [
50].
Under this time-averaged and semi-quantitative interpretation, the flow in the measurement plane was approximated as a steady, two-dimensional, incompressible field with constant density and kinematic viscosity. Serrated electrodes have been introduced to prescribe discharge-onset locations and improve the spanwise regularity of the discharge, which is expected to improve the spanwise regularity of the induced-flow response. However, the serrated geometry may still introduce local spanwise non-uniformity at the tooth scale near the electrode edge. Therefore, the present two-dimensional formulation is treated as a measurement-plane representation of the mean near-electrode response, while possible spanwise variations at the serration scale remain a limitation of the present analysis.
A vorticity-transport formulation was then used because it removes the pressure term from the momentum equation and relates the measured velocity field to the curl of the body-force field [
45]. The vorticity transport equation derived from the steady two-dimensional incompressible Navier–Stokes equations including a body-force term is written as follows:
where
is the velocity vector,
is the vorticity,
is the kinematic viscosity,
is the density, and
is the body-force vector. For a two-dimensional flow field, the curl of the body-force vector appearing in Equation (1) is given by
. The velocity field constrains this curl-related quantity, rather than the two force components independently. Following the vorticity-based approach used in previous PIV-based plasma-actuator diagnostics [
45], the streamwise forcing indicator used for comparison was obtained by neglecting the
contribution and integrating the remaining term in the wall-normal direction. This gives
This treatment does not imply that the wall-normal force component is physically absent. In the initial discharge region, especially near electrode edges, local wall-normal EHD forcing and the associated pressure redistribution may contribute to the development of the near-electrode velocity field. In the vorticity-based formulation, such contributions can enter the estimated streamwise pattern through the measured time-averaged velocity gradients. Therefore, the estimated distribution should be interpreted as an effective streamwise forcing indicator rather than as the true streamwise component of the complete force vector.
Accordingly, the following discussion focuses on the spatial diagnostic features of the estimated distributions: the arrangement of positive and reverse-sign regions, the wall-normal location of the dominant positive peak, and the wall-normal extent of the positive estimated-force region. The reverse-sign region is interpreted as an indicator of near-electrode interaction in the micro actuator arrays. Quantitative comparisons of the absolute force magnitude and local force-vector components are outside the scope of the present reconstruction.
2.8. Summary of Experimental Conditions
The plasma-actuator geometries and corresponding driving conditions are summarized in
Table 1. While several micro-SDBD parameters were varied during the preliminary thrust screening, the subsequent flow-field and body-force evaluations focus on the specific configurations listed in this table.
As summarized in
Table 1, the actuator configurations compared here differ not only in scale but also in dielectric thickness, electrode geometry, number of active elements, spanwise discharge length, driving waveform, and operating voltage. The comparisons between the conventional actuators and micro actuator arrays, and between SDBD and pulsed-DC operation, therefore reflect configuration-level differences under the present conditions rather than isolated effects of any single parameter. In particular, the dielectric-thickness difference between the micro and conventional actuators is regarded as a confounding factor that may affect capacitance, discharge onset, and attainable EHD forcing.
The representative cases were selected from the stable operating range of each actuator so that the peak induced velocity was approximately comparable among the configurations. They were not matched in terms of power, thrust, or momentum coefficient; because of differences in dielectric thickness and electrode configuration, no single common operating point based on these quantities was defined across all actuator types. Accordingly, the comparison focuses on the wall-normal structure of the induced flow at broadly similar jet-velocity levels, rather than on overall actuation strength.
3. Results and Discussion
3.1. Fabrication of Micro Actuator Arrays
The micro actuator arrays were fabricated by photolithography.
Figure 5 shows the fabricated micro actuator array together with representative examples of the fine structures.
Figure 5a shows the overall configuration of the micro-PDC actuator array,
Figure 5b shows a representative geometry of a fabricated micro-PDC element, and
Figure 5c shows an example of the serrated fine structure after photomask correction.
As shown in
Figure 5a,b, the overall actuator-array pattern and the local single-element geometry were formed as designed. In
Figure 5a, both the exposed and covered electrode patterns can be recognized through the thin dielectric substrate. In addition,
Figure 5c shows that the serrated fine structure was reproduced after photomask correction.
The relevant geometrical parameters were evaluated from digital microscope images of several representative fabricated array samples. These included the serration pitch, tooth height, and the relative position between the exposed and covered electrodes, which affect the discharge-onset location and local electric-field concentration. After photomask correction, the measured deviations in the serration pitch and tooth height were approximately within 1–2 μm relative to the nominal 200 μm design scale, corresponding to approximately 1% or less of the representative serration dimension. By contrast, the pre-correction deviation of the serrated features exceeded 20% at the nominal serration scale, confirming the importance of the photomask correction. The reported <1% value should be regarded as a representative measured dimensional deviation evaluated from multiple measurement points in microscope images of several array samples, rather than as a formal statistical tolerance obtained from all serrations or all fabricated devices.
The serration-tip radius was estimated to be approximately 3–4 μm from the microscope images. Although the tip radius may affect local electric-field concentration and discharge onset, it was much smaller than the serration pitch and tooth height of approximately 200 μm. Therefore, small tooth-to-tooth variations in the tip radius were considered unlikely to dominate the intended periodic discharge-onset pattern prescribed by the serrated geometry. The microscope observations did not indicate tip-shape variations large enough to produce multiple discharge roots at a tooth or disrupt the intended periodic discharge-onset pattern.
3.2. Preliminary Thrust-Based Screening
A preliminary thrust evaluation described in
Section 2.4 was conducted to select a representative micro-SDBD geometry for the subsequent flow-field measurements. This screening was used to identify a representative array geometry with stable thrust response and approximately additive element contributions, without obvious degradation due to inter-element interaction, rather than optimizing jet confinement directly. The results are shown in
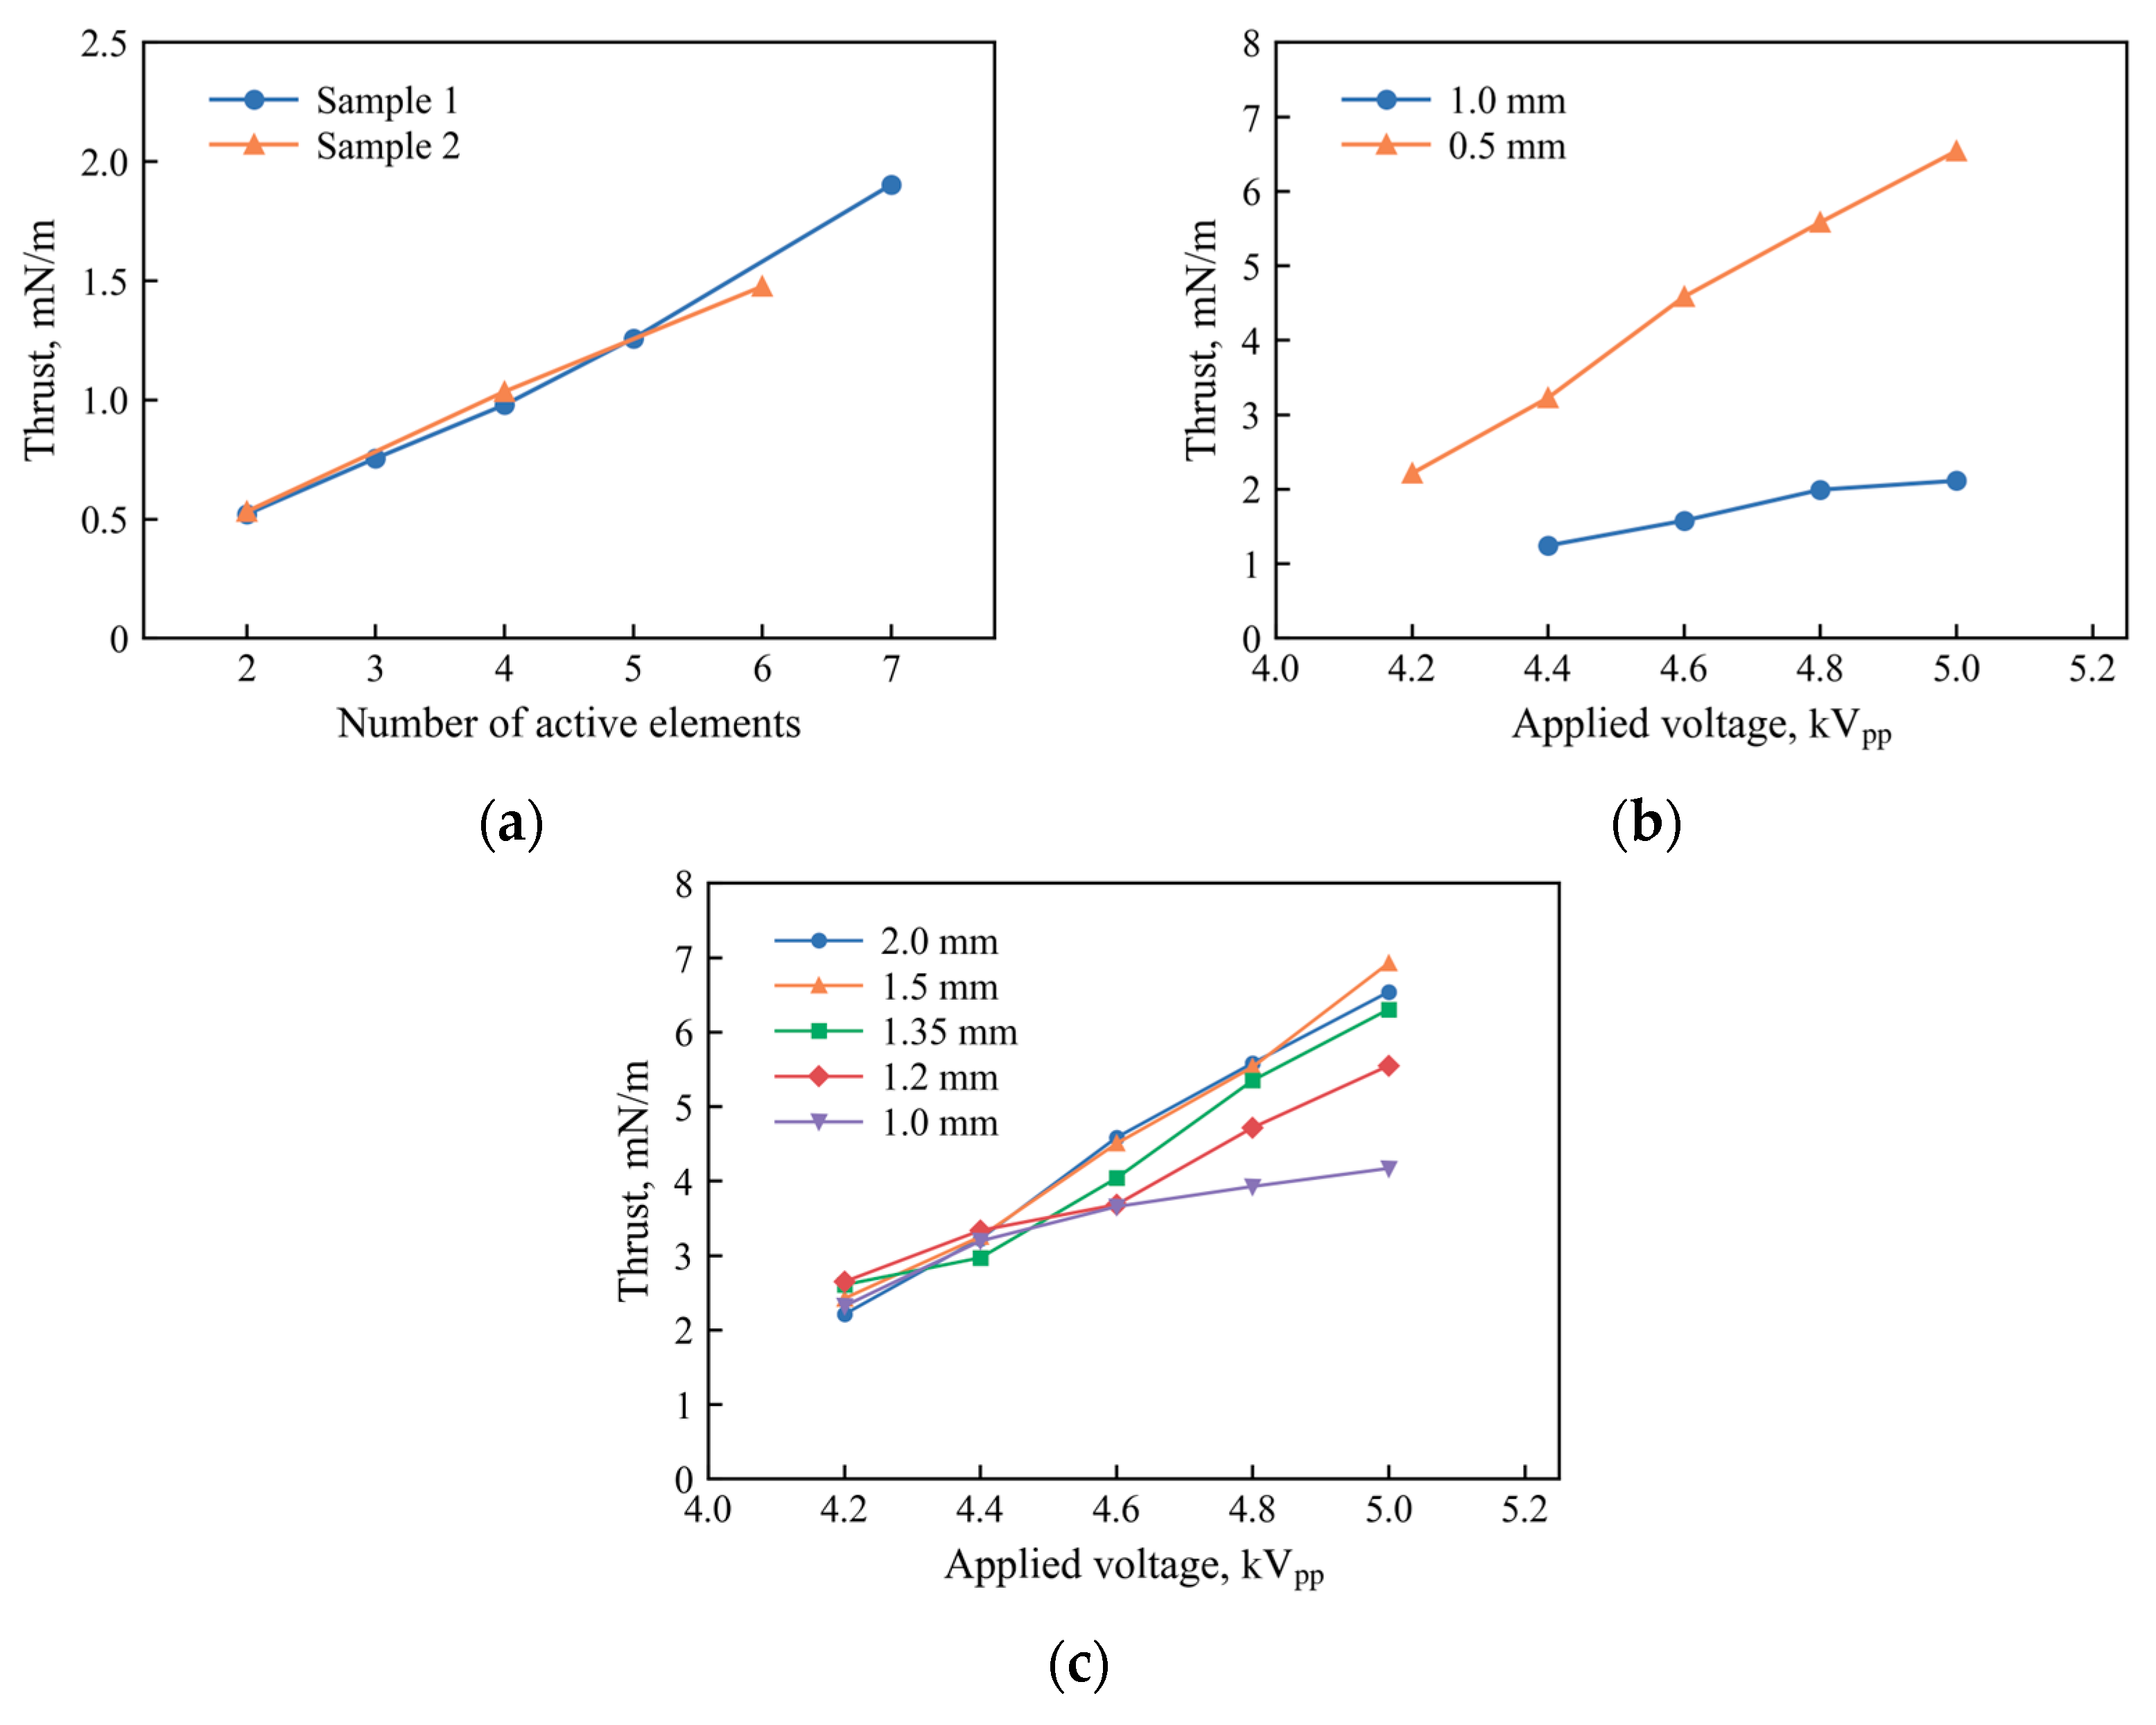
Figure 6.
Figure 6a shows a representative relationship between thrust and the number of elements in the micro actuator array,
Figure 6b shows the thrust characteristics for different exposed electrode widths, and
Figure 6c shows the thrust characteristics for different covered electrode widths.
As shown in
Figure 6a, the generated thrust increased approximately linearly with the number of active elements in the representative case. The exposed electrode width, covered electrode width, and element spacing were 1.0 mm, 2.0 mm, and 1.0 mm, respectively. This result indicates that the contributions of the individual elements were approximately additive, and that the micro actuator array functioned as an integrated actuator.
Figure 6b shows the thrust characteristics for different exposed electrode widths. Comparison of the cases with exposed electrode widths of 1.0 mm and 0.5 mm indicates that, within the range examined in the present study, the actuator with an exposed electrode width of 0.5 mm consistently produced higher thrust. Accordingly, the exposed electrode width of 0.5 mm, which showed the higher measured thrust response within the tested range, was adopted for the subsequent selection of the representative geometry.
Figure 6c shows the influence of the covered electrode width on the thrust characteristics. The thrust of the micro-SDBD actuator array increased with increasing applied voltage. In addition, actuators with larger covered electrode widths tended to produce higher thrust at the same applied voltage. Although the differences among the conditions were relatively small at lower voltages, the cases with covered electrode widths of 1.5 mm and 2.0 mm showed higher thrust than the other cases above 4.4 kV
pp. Among the tested conditions, the case with a covered electrode width of 2.0 mm was favored not only because it produced relatively high thrust, but also because the thrust continued to increase toward the higher-voltage side without obvious early saturation. This behavior was advantageous for selecting a representative geometry for the subsequent flow-field measurements.
When normalized by the number of electrode pairs, the micro-SDBD configuration with a covered electrode width of 2.0 mm showed the largest thrust per element within the tested covered-electrode-width range of 1.0 to 2.0 mm. The total generated thrust was also relatively large, supporting its selection as the representative geometry for the subsequent flow-field measurements. These results suggest that, although an increase in covered electrode width may reduce the number of discharge elements within a given streamwise length, when the covered electrode width is too small, interaction between adjacent discharge regions may occur, particularly at higher applied voltages. Such interaction may hinder the formation of a sufficient discharge for each element, leading to the observed early saturation of thrust. Therefore, within the screening range examined in this study, the covered electrode width of 2.0 mm was selected as a representative condition that provided relatively high thrust per element and total thrust while avoiding obvious early saturation associated with excessive inter-element interaction.
Based on these results, the representative micro-SDBD geometry used in the subsequent flow-field evaluation was selected as an exposed electrode width of 0.5 mm, a covered electrode width of 2.0 mm, and an element spacing of 1.0 mm.
3.3. PIV-Based Assessment of Jet Confinement
The mean velocity fields and wall-normal velocity profiles were compared by PIV to evaluate the jet structures formed by the micro actuator arrays in relation to the conventional actuators.
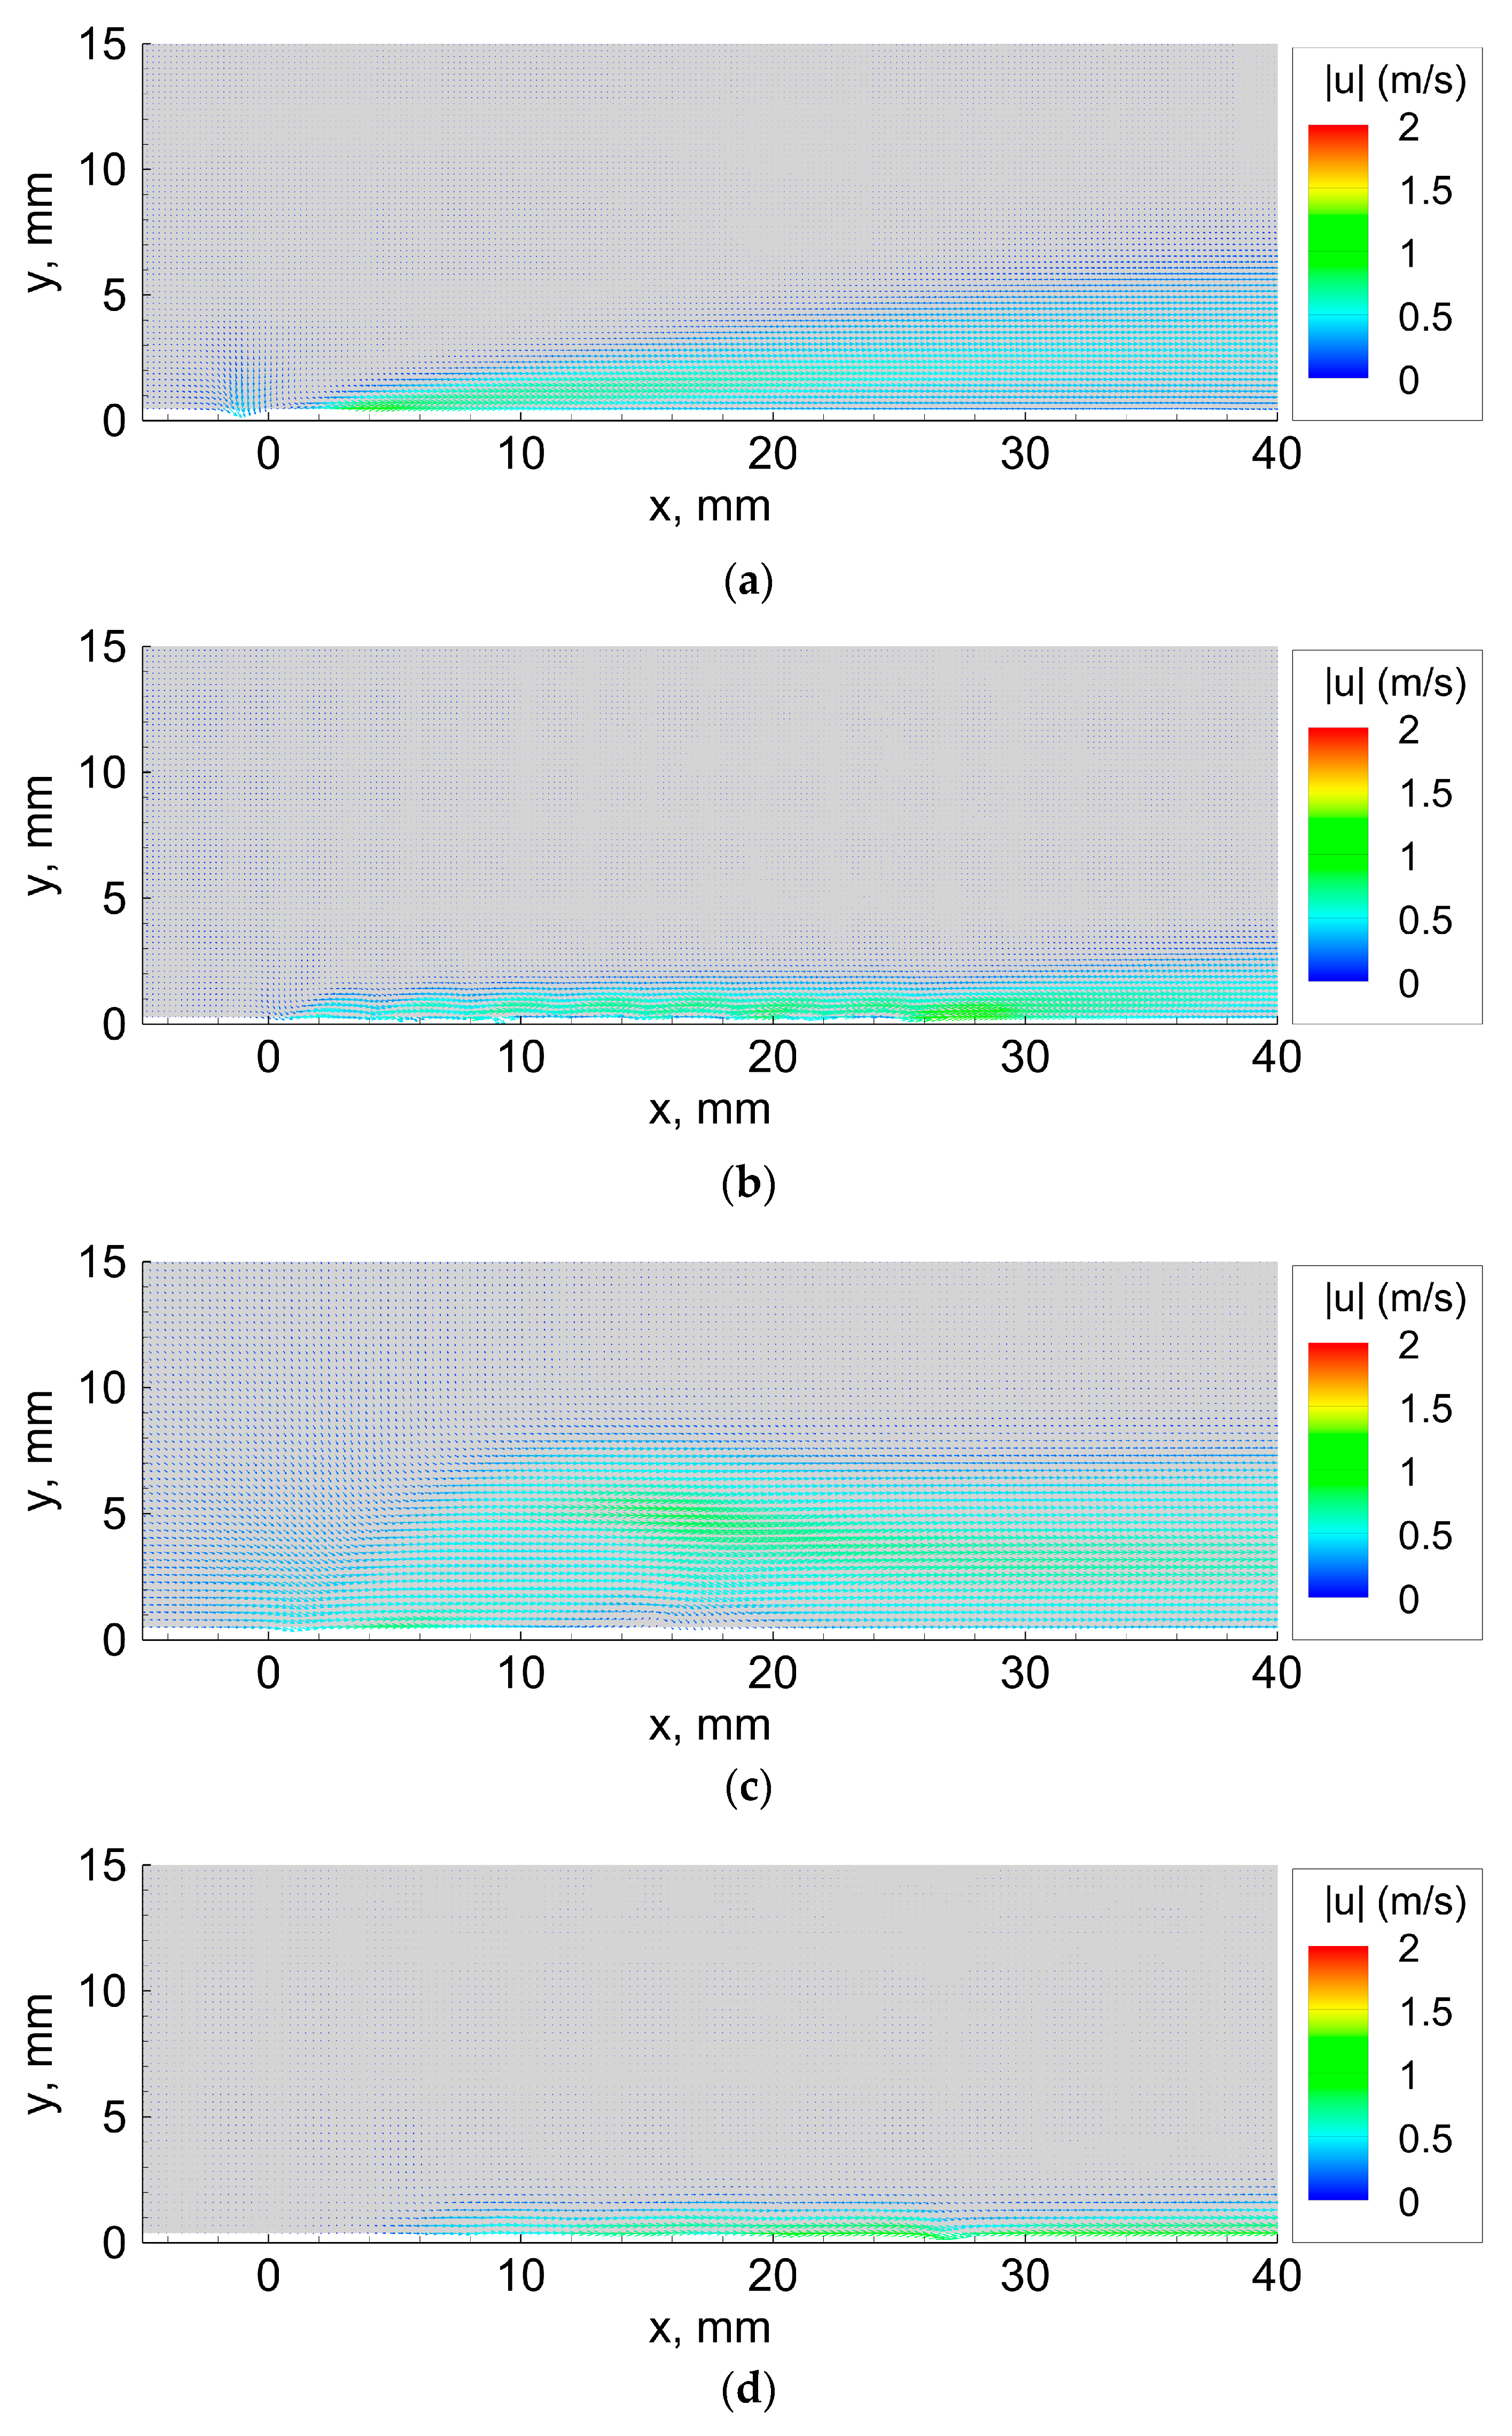
Figure 7 shows the mean velocity fields under representative conditions, and
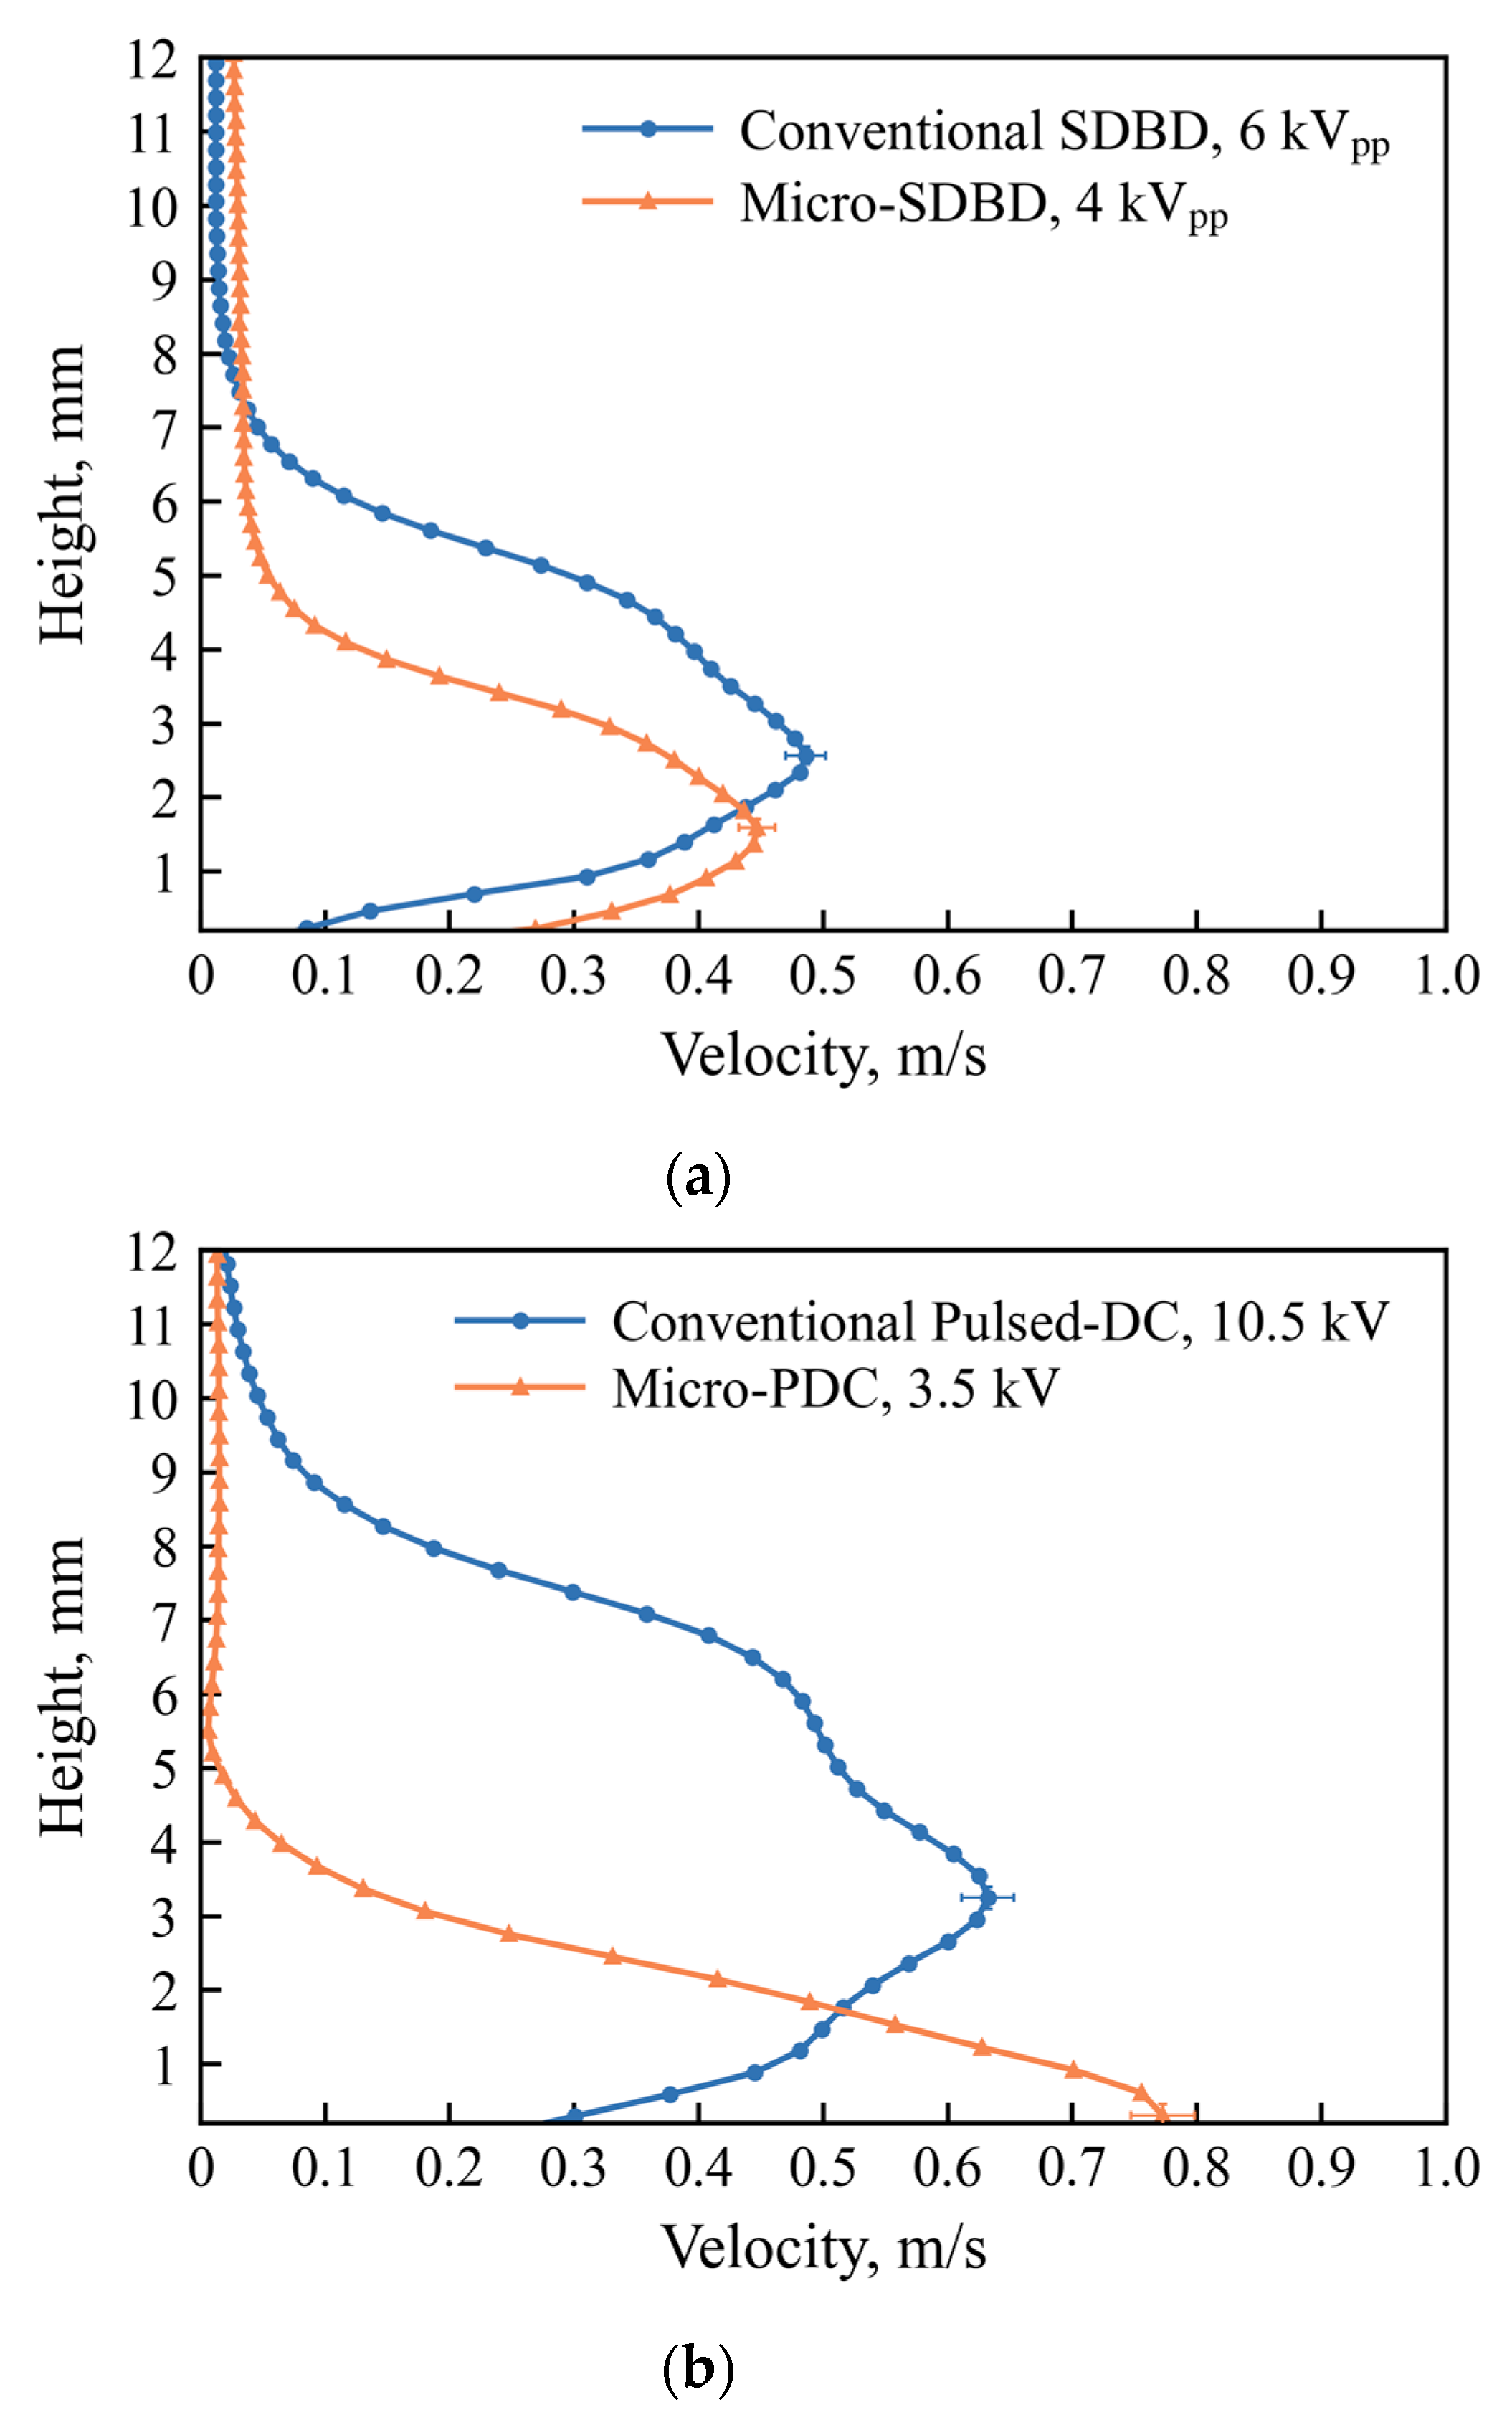
Figure 8 shows the wall-normal velocity profiles at a fixed downstream location. The wall-normal velocity profiles were extracted at a position 20 mm downstream of the tip of the downstream-most exposed electrode. This location was selected to compare the downstream jet structure after it had developed beyond the electrode region while remaining within the common measurement window for all cases. Based on the configuration-level comparison defined above, the following discussion focuses on the wall-normal distribution and near-wall confinement of the induced velocity, rather than on power-normalized performance.
The representative operating conditions were selected to provide comparable peak induced velocities within the available operating range. Here, denotes the applied AC voltage and denotes the DC bias voltage. The applied conditions were 6.0 kVpp for the conventional SDBD actuator, 4.0 kVpp for the micro-SDBD actuator array, 10.5 kV for the conventional PDC actuator, and 3.5 kV for the micro-PDC actuator array.
Comparison of the mean velocity fields in
Figure 7 shows that, in the conventional actuators, the jet accelerated near the electrodes diffuses as it develops downstream, resulting in a relatively large spread in the wall-normal direction. By contrast, in the micro actuator arrays, the wall-normal spread of the jet is suppressed, and a high-speed region confined closer to the wall is formed. In particular, in the micro-SDBD case, the flow accelerated near each electrode reaches the next electrode row before diffusing significantly and is then accelerated again. In the present conventional single-stage actuator, the momentum introduced near the electrode spreads downstream in a manner analogous to a free jet. In the micro actuator array, however, this downstream spreading is interrupted by repeated re-acceleration. As a result, the jet structure can be interpreted as maintaining a high-speed region near the wall throughout the region where the actuator elements are arranged.
A similar contrast is observed in the pulsed-DC cases. In the conventional PDC actuator, the jet exhibits a relatively diffuse pattern with a large wall-normal spread. In the micro-PDC actuator array, by contrast, the spread is substantially reduced and a jet confined closer to the wall within the resolved measurement region is formed.
The wall-normal velocity profiles in
Figure 8 confirm the same tendency. In the SDBD comparison, the jet peak in the micro-SDBD case is shifted closer to the wall than that in the conventional SDBD case, consistent with the near-wall confinement inferred from the mean velocity fields in
Figure 7. Under the representative conditions selected to provide comparable peak induced velocities, the peak height was 2.57 mm for the conventional SDBD and 1.59 mm for the micro-SDBD, corresponding to an approximately 1 mm lower peak location in the micro-SDBD case. In the pulsed-DC case, the conventional actuator showed a relatively diffuse profile with a peak height of 3.25 mm, whereas in the micro-PDC case the velocity peak was located at the lowest retained reliable conventional-PIV vector center, 0.31 mm from the wall. As described in
Section 2.5, this value should be interpreted as a resolved-profile peak location constrained by the near-wall measurement limit. Among the tested cases, the micro-PDC case showed the most wall-confined resolved velocity profile. A representative repeatability check using two fully processed repeated measurements showed that the extracted jet peak height remained at the same wall-normal grid point, while the peak velocity differed by 0.017 m/s, or approximately 3.3% relative to the mean value. Thus, the repeatability of the PIV-derived peak velocity was on the order of a few percent in this representative check.
Under the tested conditions, these results show that the micro actuator arrays formed jets confined closer to the wall than the conventional actuators. In particular, the results suggest that the tested micro-parallelized configurations formed a near-wall jet structure accompanied by repeated re-acceleration along the electrode array, rather than simple downstream spreading. The detailed forcing pattern and the influence of near-electrode interaction are examined in the following sections using the single-pixel PIV analysis and the estimated body-force distribution.
3.4. High-Spatial-Resolution PIV Validation
To evaluate the flow structure near the electrodes in greater detail, single-pixel PIV was applied in addition to conventional PIV. The procedure and schematic concept of the single-pixel PIV method were described in
Section 2.6. As a representative example,
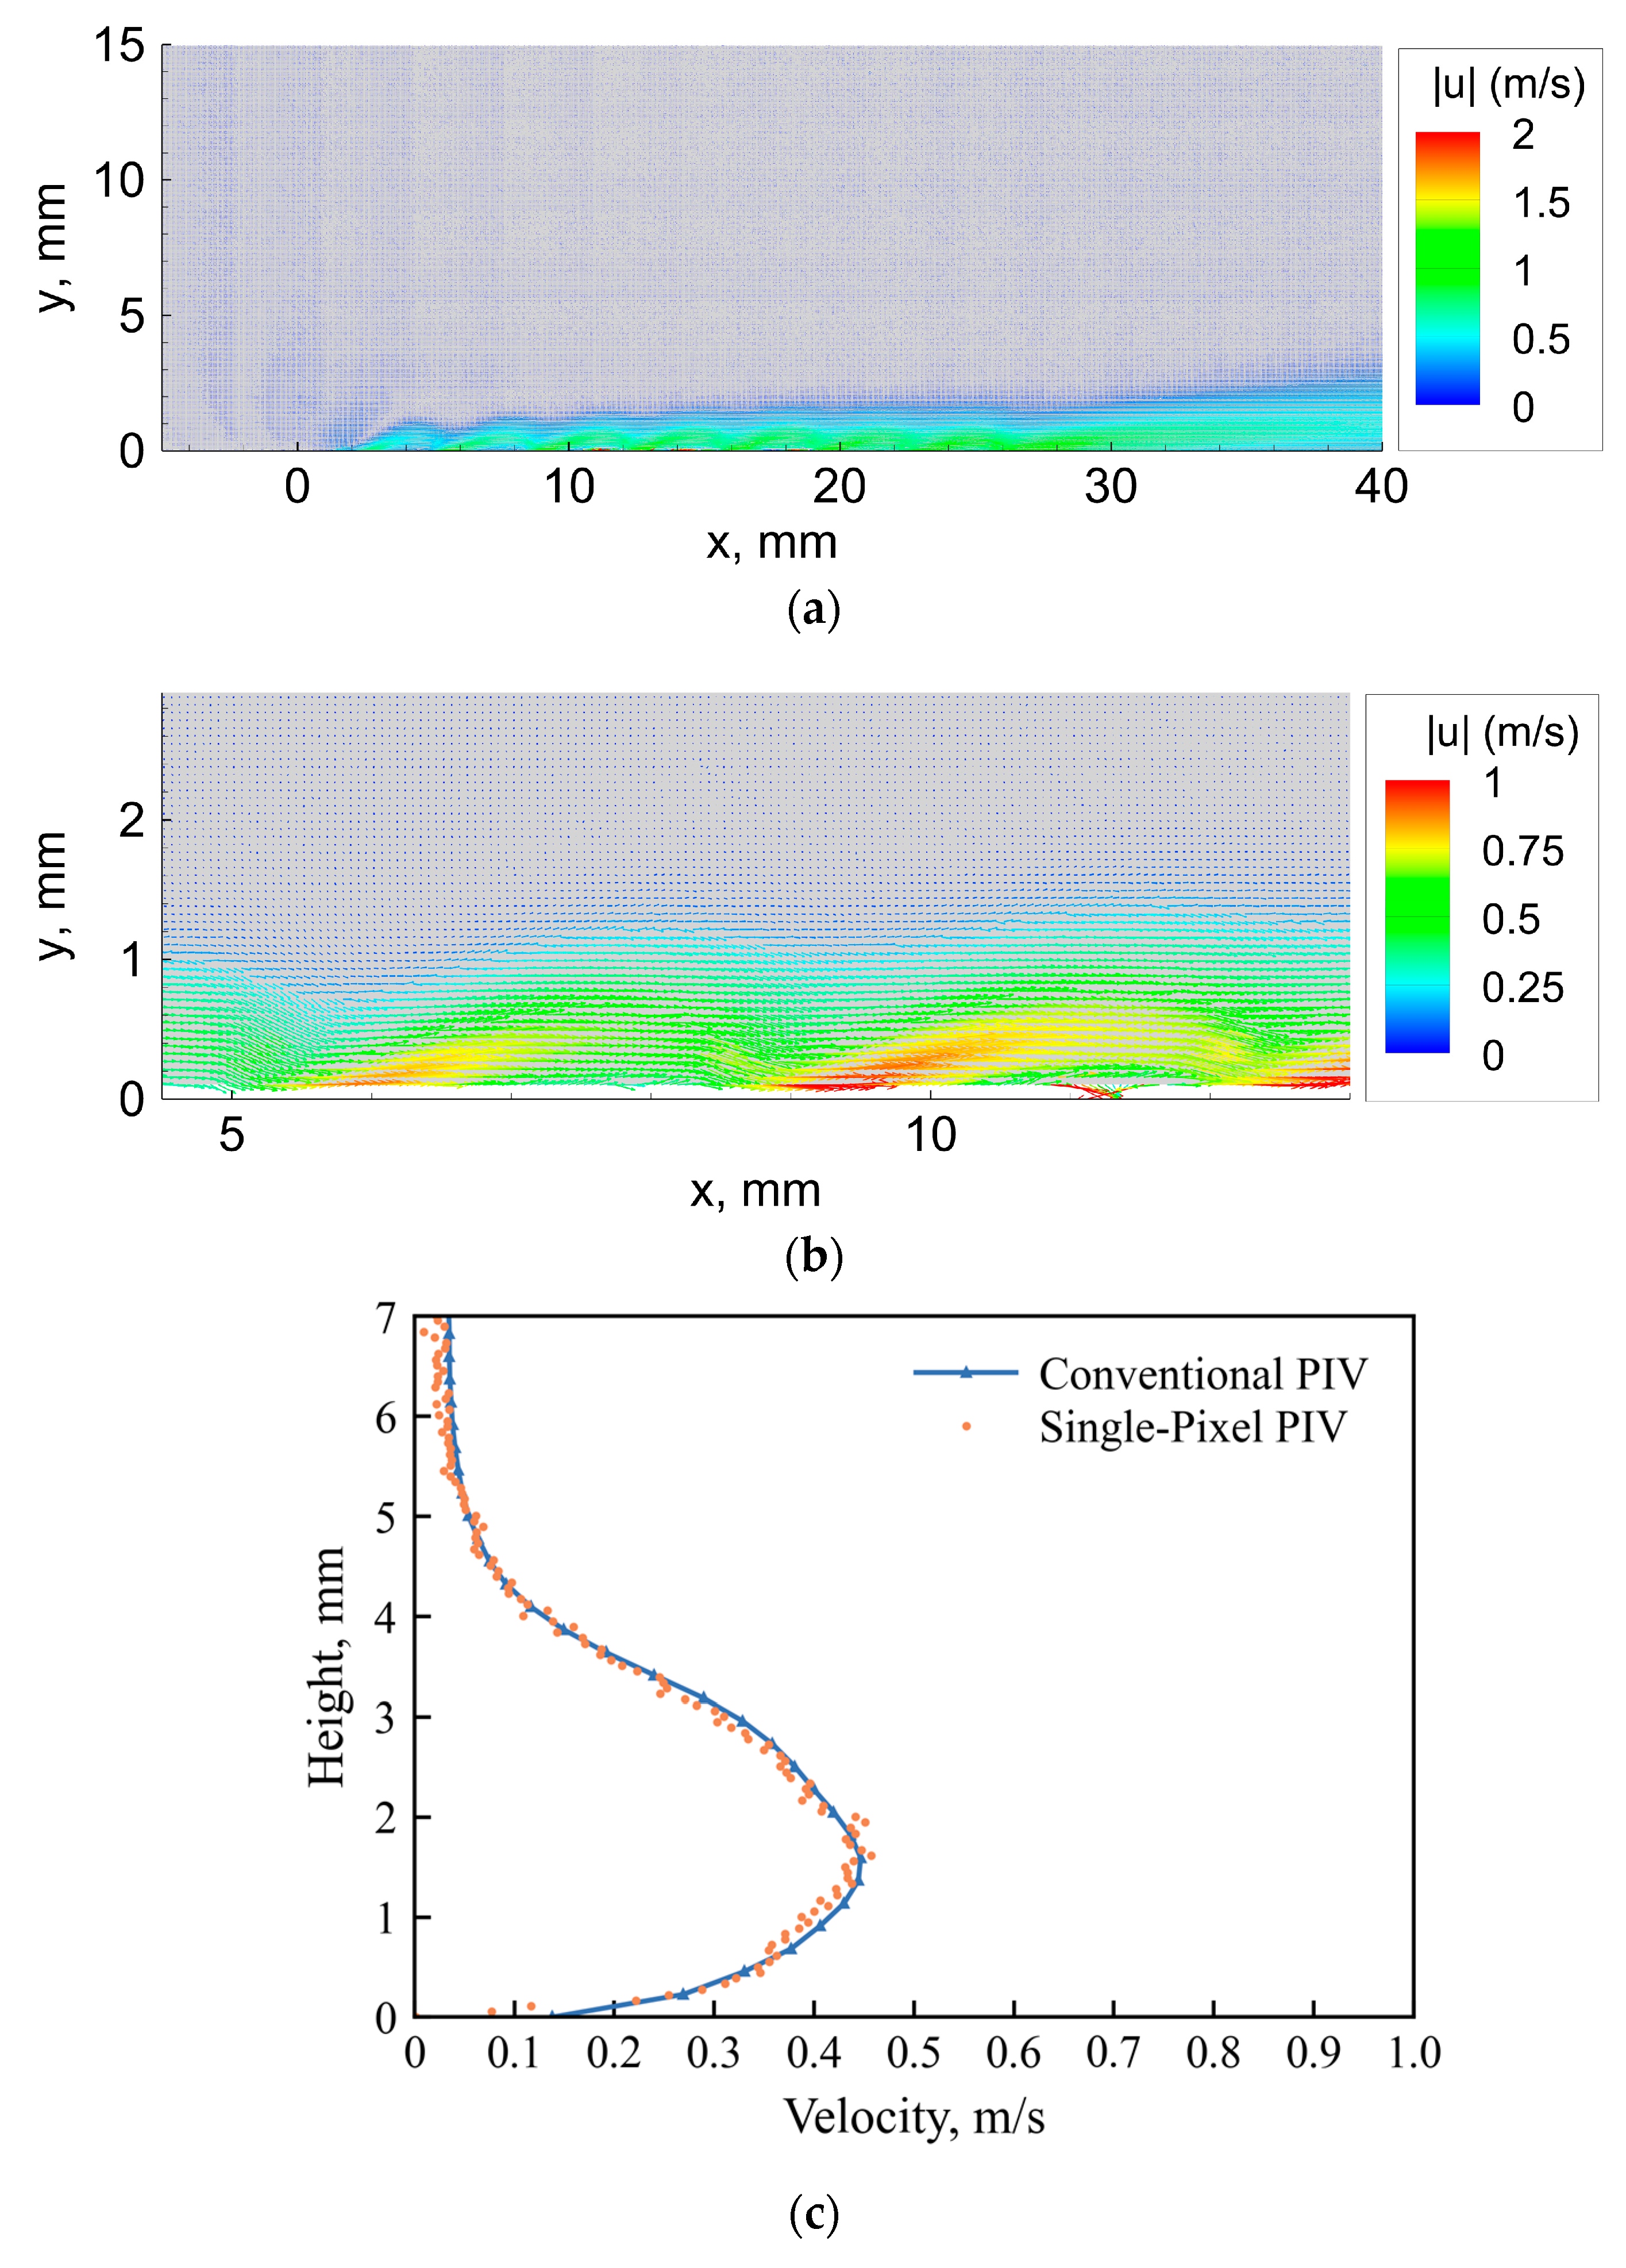
Figure 9 shows the result of applying single-pixel PIV to the same micro-SDBD case at 4.0 kV
pp as that shown in
Figure 7b.
The overall velocity field obtained via single-pixel PIV in
Figure 9a is generally consistent with the mean velocity field based on conventional PIV (
Figure 7b), indicating that the main features of the mean jet structure are captured by both methods. At the same time, the single-pixel PIV visualizes the local acceleration structures formed along the electrode array at a higher spatial resolution.
In the enlarged near-electrode view shown in
Figure 9b, the flow accelerates near the exposed electrode, rises in the wall-normal direction to a height of approximately
y = 0.4 mm above the actuator surface, and is then accelerated again near the subsequent electrode. Due to this repeated re-acceleration, the jet remains relatively confined to the near-wall region rather than simply diffusing downstream. The jet corresponding to the downstream electrode row shows a higher velocity, which is consistent with successive momentum addition along the electrode array. Such a near-electrode structure is difficult to visualize sufficiently by conventional PIV because of the limitation imposed by the interrogation window, whereas it is more clearly resolved by single-pixel PIV.
Furthermore, the comparison of the wall-normal velocity profiles shown in
Figure 9c indicates that the velocity profile obtained by single-pixel PIV is in good overall agreement with the conventional-PIV result. The agreement in both peak velocity and overall profile shape indicates that the single-pixel PIV result provides a mean velocity distribution comparable to that obtained by conventional PIV. In the shared wall-normal profile shown in
Figure 9c, the peak velocity was 0.447 m/s for conventional PIV and 0.457 m/s for single-pixel PIV, corresponding to a difference of approximately 2.3%. The peak heights were 1.59 mm and 1.61 mm, respectively; their difference of 0.021 mm was smaller than one conventional-PIV vector spacing. Although slight differences are observed in the low-velocity region, single-pixel PIV provides a much finer spatial description of the velocity distribution near the electrodes and near the wall.
These results support the use of single-pixel PIV for the subsequent diagnosis of the near-electrode flow structure and the estimated body-force distribution.
3.5. Estimated Streamwise Body-Force Distribution and Near-Electrode Interaction
Finally, to evaluate the near-electrode forcing pattern of the micro actuator arrays in greater detail, the streamwise body-force distribution was estimated from the velocity fields obtained by single-pixel PIV. Representative distributions are shown in
Figure 10.
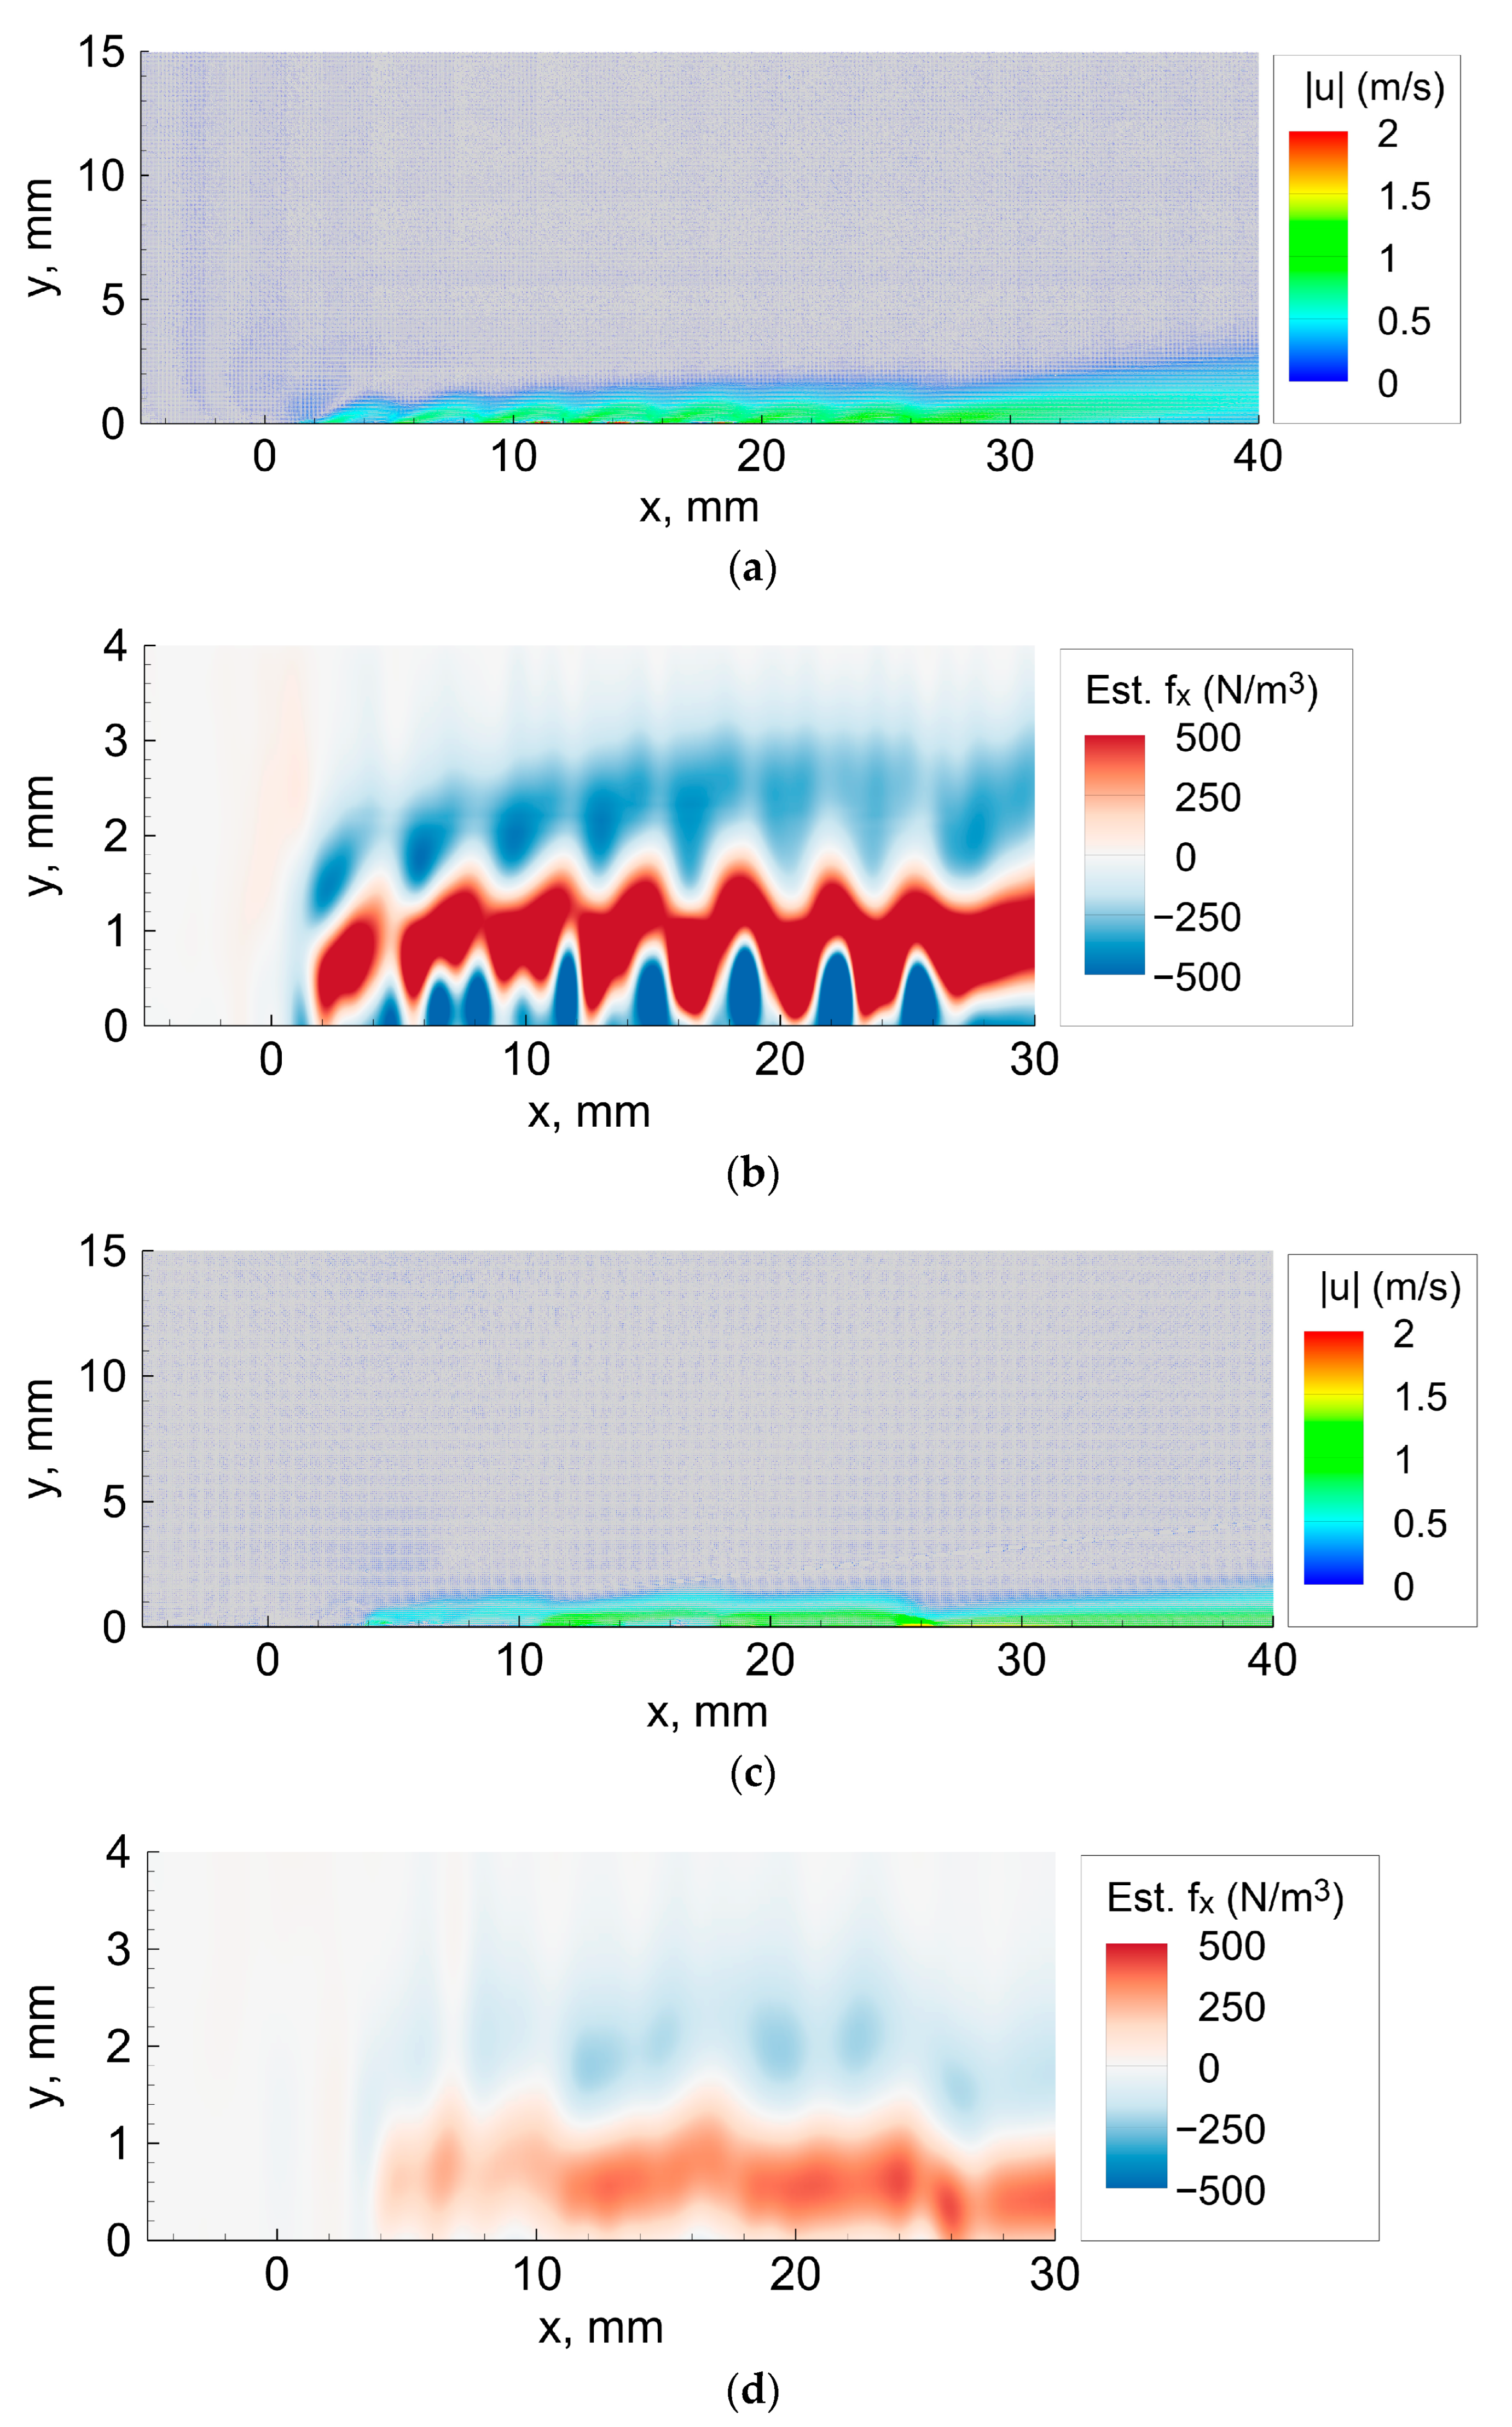
Figure 10 presents the corresponding velocity fields obtained by single-pixel PIV and estimated body-force distributions for the same micro-SDBD and micro-PDC conditions used in
Figure 7 (
4.0 kV
pp,
3.5 kV, respectively). For the micro-SDBD actuator array, the estimated body-force distribution exhibited an alternating pattern of positive and reverse-sign forcing near the electrodes. A reverse-sign forcing region appeared near the wall, while a positive downstream-forcing region was distributed above it. This distribution is consistent with the near-electrode flow structure, which involved wall-normal deviation of the jet together with suppression of simple downstream diffusion, and suggests the influence of crosstalk between adjacent electrodes. In other words, although the tested micro-SDBD configuration promoted near-wall confinement of the jet, it still retained a reverse-sign forcing pattern rather than forming a simple unidirectional near-wall forcing layer.
By contrast, the micro-PDC actuator array showed a positive estimated-forcing pattern concentrated closer to the wall and a relatively weaker reverse-sign pattern than the micro-SDBD actuator array. Because the applied conditions, driving waveforms, and actuator geometries differ, the absolute magnitude of the estimated force should not be compared directly. The comparison therefore focuses on the spatial arrangement of the estimated-forcing pattern. From this viewpoint, the micro-PDC actuator array exhibited a more concentrated near-wall positive estimated-forcing pattern, which is consistent with the more wall-confined velocity distribution observed in the velocity fields and wall-normal velocity profiles.
This difference may be related to the pulsed-DC multi-electrode mechanism reported by Sato et al. [
37]. They showed that an electrode arrangement designed to avoid unintended potential differences between a covered electrode and the adjacent exposed electrode can reduce counter ionic-wind generation and enhance downstream EHD forcing in pulsed-DC actuation. The weaker reverse-sign estimated-forcing region observed in the present micro-PDC case is qualitatively consistent with this mechanism. However, because the present measurements did not resolve the discharge structure, surface charge, or electric-field distribution, the detailed electrical mechanism remains outside the scope of this study.
As noted in
Section 2.7, the estimated
distribution is an effective streamwise forcing indicator and may include the influence of local wall-normal forcing through the measured time-averaged velocity gradients. Therefore, the positive and reverse-sign regions are interpreted primarily as indicators of effective forcing-pattern arrangement and near-electrode interaction. Although the ensemble correlation over 5000 image pairs reduces random fluctuations in the mean displacement field, the derivative-based body-force reconstruction can still be sensitive to local velocity-field fluctuations. A simple robustness check using a 3 × 3 post-smoothing filter applied to the reconstructed body-force map showed no change in the wall-normal peak location of the streamwise-integrated profile, indicating that the extracted peak location was not dominated by isolated grid-scale fluctuations.
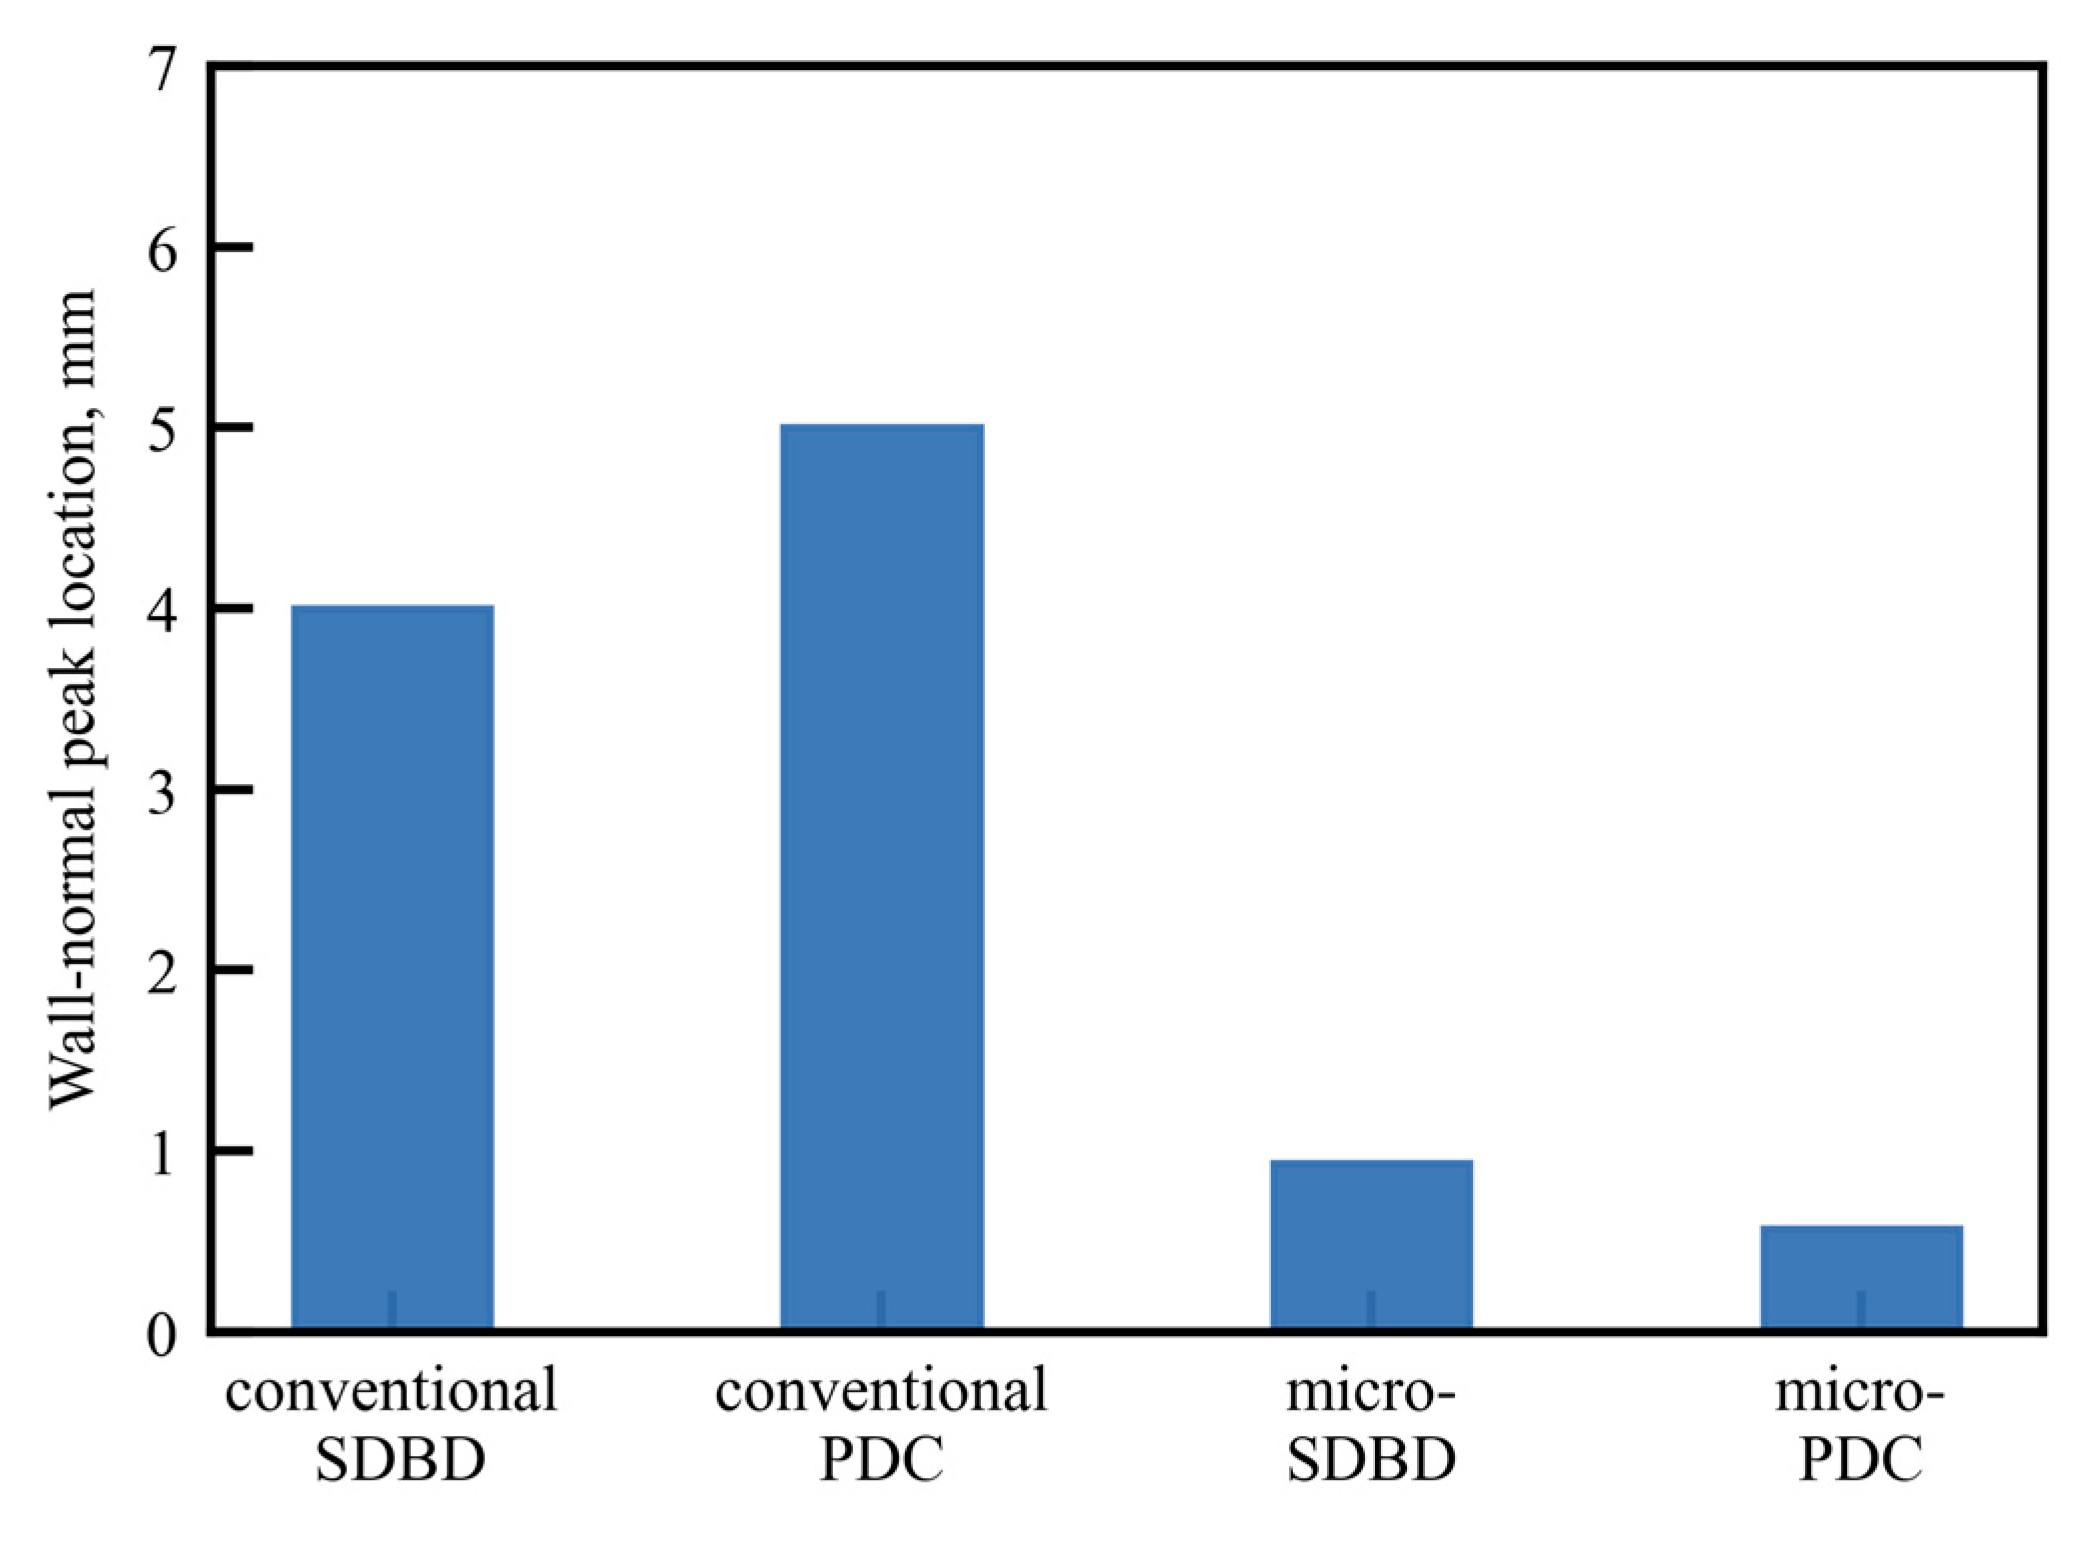
Figure 11 summarizes the wall-normal locations of the positive peaks in the streamwise-integrated estimated body-force distributions. These peak locations are treated as representative spatial diagnostic metrics, not as repeatability-based statistical estimates. They are therefore used primarily to compare the relative wall-normal arrangement of the positive estimated-forcing regions under the present operating conditions.
Relative to the conventional actuators, the positive peak locations are shifted closer to the wall in the micro actuator arrays, indicating that the effective positive forcing pattern is located closer to the wall under the present conditions. In comparison between the two micro actuator arrays, the micro-PDC case ( 0.54 mm) exhibited a lower positive peak location than the micro-SDBD case ( 1.38 mm). This result indicates that the micro-PDC configuration produced a more wall-confined positive estimated-forcing pattern under the present operating conditions.
The difference in estimated body-force peak location between the conventional actuators and micro actuator arrays is larger than the difference in jet peak location observed in the velocity profiles. This is likely because the jet diffuses as it develops downstream from the near-electrode forcing region, so the initial wall-normal difference in the forcing pattern is partially relaxed in the downstream velocity profile.
These results suggest that the tested micro-parallelized configurations can form an effective positive estimated-forcing region closer to the wall, but simple micro-parallelization alone does not eliminate the reverse-sign forcing pattern associated with near-electrode interaction. Under the present actuator-characterization conditions, the micro-PDC configuration produced the most wall-confined positive estimated-forcing pattern among the tested cases.
Finally, durability should also be considered for practical use of micro plasma actuator arrays. In the present short-duration thrust-screening and PIV measurement runs, rapid ablation of the thin copper electrodes was not observed. Device failure during preliminary operation was mainly associated with dielectric breakdown or insulation degradation rather than visible copper-electrode consumption, similar to failure modes often encountered in DBD plasma-actuator operation. Noticeable degradation of the third electrode in the micro-PDC configuration was also not observed under the present driving conditions. Long-term durability under higher-voltage, continuous-operation, and freestream/boundary-layer-flow conditions remains future work.
4. Conclusions
In this study, micro-SDBD and micro-PDC plasma actuator arrays were experimentally investigated to characterize near-wall-confined jets and forcing patterns. Photolithography was used to fabricate the micro actuator arrays, and their flow structures and forcing patterns were comparatively evaluated by thrust screening, conventional PIV, single-pixel PIV, and estimated streamwise body-force distributions. The main conclusions are as follows:
Micro actuator arrays were fabricated by photolithography, and the intended array, element, and serration-scale features were reproduced with representative dimensional deviations small enough for the subsequent flow-field evaluation. Preliminary thrust-based screening was then used to select a representative micro-SDBD geometry that provided stable thrust response and approximately additive element contributions for the detailed measurements.
Conventional PIV showed that, under the tested representative operating conditions, the micro actuator arrays formed jets confined closer to the wall than the conventional actuators. In particular, the micro actuator arrays produced a near-wall jet structure accompanied by repeated re-acceleration along the electrode array, rather than simple downstream spreading.
Single-pixel PIV provided velocity profiles broadly consistent with those obtained by conventional PIV while resolving the near-electrode flow structure at a higher spatial resolution. This made it possible to identify the successive acceleration structure along the electrode array more clearly and supported its use for subsequent near-electrode diagnostics.
The estimated streamwise body-force distribution showed that the micro-SDBD actuator array retained an alternating pattern of positive and reverse-sign estimated forcing near the electrodes, suggesting the influence of crosstalk between adjacent electrodes. By contrast, under the tested conditions, the micro-PDC actuator array produced a positive estimated-forcing pattern concentrated closer to the wall, with a relatively weaker reverse-sign region and a lower positive peak location of 0.54 mm compared with 1.38 mm for the micro-SDBD actuator array.
Overall, the present characterization results indicate that photolithographically fabricated micro actuator arrays can produce induced-flow and estimated-forcing patterns confined closer to the wall under quiescent-air conditions. However, simple micro-parallelization alone does not eliminate the reverse-sign forcing pattern associated with near-electrode interaction. Because the present comparison was not power-matched or thrust-matched, the results do not establish power-normalized or efficiency-based superiority. Further evaluation of efficiency, robustness, long-term durability, and control performance under freestream or boundary-layer conditions is required before practical actuator performance can be assessed.