1. Introduction
Battery electric vehicles (BEVs) have garnered widespread attention from both academia and industry owing to their considerable potential for reducing greenhouse gas emissions and improving the energy efficiency of transportation systems [
1,
2,
3]. Nevertheless, under complex real-world driving conditions, further enhancing the energy efficiency and dynamic performance of electric drive systems remains a key challenge in contemporary research on electric vehicle powertrains [
4,
5].
Currently, most electric vehicles are equipped with a single-speed final drive, primarily because electric motors possess a wide operating range in terms of speed and torque, allowing the vehicle to meet power demands over a broad spectrum of operating conditions [
6,
7]. However, with the continuous increase in vehicle performance requirements, single-speed transmission systems are unable to consistently maintain optimal efficiency throughout the full operating range [
8,
9]. At low vehicle speeds, a higher transmission ratio is advantageous for enhancing acceleration performance, whereas at high speeds, a lower transmission ratio helps reduce motor speed and improve overall system efficiency [
10]. Consequently, multi-speed electric drive systems, particularly two-speed transmissions, have gradually become an important technological route for enhancing the performance of electric drive systems [
11,
12]. As a key actuator within the electric drive system, the two-speed transmission can alter the transmission ratio to regulate the motor operating point, thereby affecting both vehicle dynamic performance and energy efficiency, and enabling the electric drive system to achieve optimal performance under varying operating conditions [
13,
14]. However, the incorporation of a two-speed transmission also introduces new challenges, among which shift strategy design is one of the most critical [
15,
16]. The shift strategy determines the gear shift timing and operating mode of the transmission, and a well-designed strategy can simultaneously enhance both vehicle energy efficiency and dynamic performance. Conversely, an improperly designed shift strategy may result in frequent unnecessary gear shifts and reduced overall system efficiency [
17,
18].
Conventional approaches typically employ rule-based shift strategies, in which the shift points are determined based on vehicle speed, pedal opening, or motor operating conditions. Owing to their structural simplicity and implementation reliability, such methods have been widely adopted in engineering applications [
19,
20,
21]. To enhance the adaptability of shift strategies under complex operating conditions, some studies have employed multi-objective optimization-based approaches, aiming to simultaneously balance dynamic performance and energy efficiency [
22,
23]. Reference [
24] proposed an online shift optimization method based on a receding-horizon strategy for two-speed EVs. By incorporating energy consumption, operating efficiency, and driving-condition adaptability into a unified optimization framework, the method determines the optimal shift timing in real time, thereby achieving greater flexibility and higher energy efficiency than conventional fixed shift schedules. Reference [
25] proposed a multi-objective method for the joint optimization of transmission ratios and shift strategy in multi-speed electric vehicle transmission systems. Considering the dynamic variation of transmission efficiency, the study achieved a better trade-off between energy consumption and acceleration performance under real-world operating conditions. Reference [
26] proposed a bi-objective optimization strategy based on driving-condition-aware weighting factors. Through driving condition recognition, the method jointly optimized energy consumption and shift smoothness, thereby improving both energy efficiency and shift quality under different driving cycles. Reference [
27] incorporated the efficiency characteristics of the inverter, motor, and transmission into the joint optimization of transmission ratios and shift schedules. With energy consumption and acceleration performance as the objectives, the study obtained a more comprehensive optimal shift strategy for electric vehicle transmissions. To reduce the reliance of shift strategies on heuristic rules and manual calibration, while enhancing their intelligence and flexibility, some studies have also proposed data-driven shift strategies [
28,
29]. References [
30,
31] proposed an intelligent shift decision-making method based on data mining. By using real-world shift data from skilled drivers to extract shift boundaries, the method established a data-driven shift strategy and demonstrated its energy-saving potential under both flat-road and uphill conditions. Reference [
32] proposed an intelligent shift strategy based on digital twin-driven reinforcement learning. By combining multi-source sensor data, digital twin modeling, and reinforcement learning, the method enabled shift decisions to adapt to changes in vehicle operating conditions. Reference [
33] proposed a cloud-based data-driven shift decision strategy for intelligent connected vehicles by integrating driving behavior and environmental information. Using vehicle operating data and a cloud-based update mechanism, the method enabled continuous learning and adaptive optimization, thereby improving the adaptability of shift decisions to different driving conditions. Although substantial progress has been made, rule-based shift strategies rely heavily on calibration and have limited adaptability to varying driving conditions. Optimization-based strategies can balance dynamic performance and energy efficiency, but still cannot fully exploit the potential of two-speed transmissions. Data-driven strategies depend strongly on data quality and sample coverage, and often lack interpretability. Moreover, their high computational cost limits their engineering applicability. Although existing rule-based, optimization-based, and data-driven shift strategies have improved the adaptability of two-speed electric drivetrains, most of them determine shift timing mainly according to vehicle-side variables, such as vehicle speed, accelerator pedal opening, motor efficiency, acceleration demand, or recognized driving conditions. These variables describe instantaneous driving demand or energy-efficiency objectives, but they do not explicitly characterize the recent operating behavior of the transmission. As a result, repeated upshifts and downshifts may occur near shift boundaries under transient speed fluctuations, leading to gear shift cycling, increased actuator workload, clutch wear, and degraded transmission stability.
To address this gap, this study introduces shift frequency and gear duty ratio as transmission operating-state indicators. Shift frequency reflects short-term transmission actuation intensity, while gear duty ratio characterizes gear usage distribution within a local time window. By incorporating these indicators into the upper layer decision-making process, the proposed method considers both driving demand and transmission behavior, thereby improving its ability to identify and suppress unnecessary gear shift cycling. The comparison of representative gear shift strategies and the proposed method is shown in
Table 1.
This study takes a self-developed two-speed dry dual-clutch transmission as the research object and introduces two indicators to characterize transmission operating behavior: shift frequency and gear duty ratio. Specifically, shift frequency is used to describe how frequently actuator actions occur within a given time window, whereas gear duty ratio is used to characterize the usage distribution of different gears during system operation. On this basis, this study proposes a hierarchical fuzzy evaluation and gear shift strategy matching method based on transmission operating states. The method comprises three stages: driving demand evaluation, transmission behavior evaluation, and strategy matching. Power demand is evaluated using pedal opening and vehicle acceleration. The transmission operating state is identified based on vehicle speed, shift frequency, and gear duty ratio. Based on the outputs of these two stages, the gear shift strategy that best matches the vehicle driving state and driving demand is selected. By incorporating both driving demand and transmission operating behavior into the decision-making process, the proposed method improves the adaptability of the shift strategy to complex driving conditions and aims to maximize the performance potential of the two-speed transmission. Furthermore, to reduce ineffective frequent shifting, a shift frequency correction strategy is proposed to mitigate the adverse effects of unnecessary shifts on the reliability and service life of the 2DCT. The main contributions of this study are as follows:
(1) Shift frequency and gear duty ratio are incorporated into the gear shift decision-making process, and a hierarchical framework integrating driving demand evaluation, transmission behavior evaluation, and gear shift strategy matching is established. This framework enables the selected strategy to account for both complex driving conditions and transmission behavior characteristics, thereby maximizing the vehicle performance benefits offered by the transmission.
(2) Through adaptive gear shift strategy matching and online fuzzy correction of shift thresholds, frequent and unnecessary shifts are effectively reduced, thereby enhancing the rationality of shift decisions and the operational stability of the transmission.
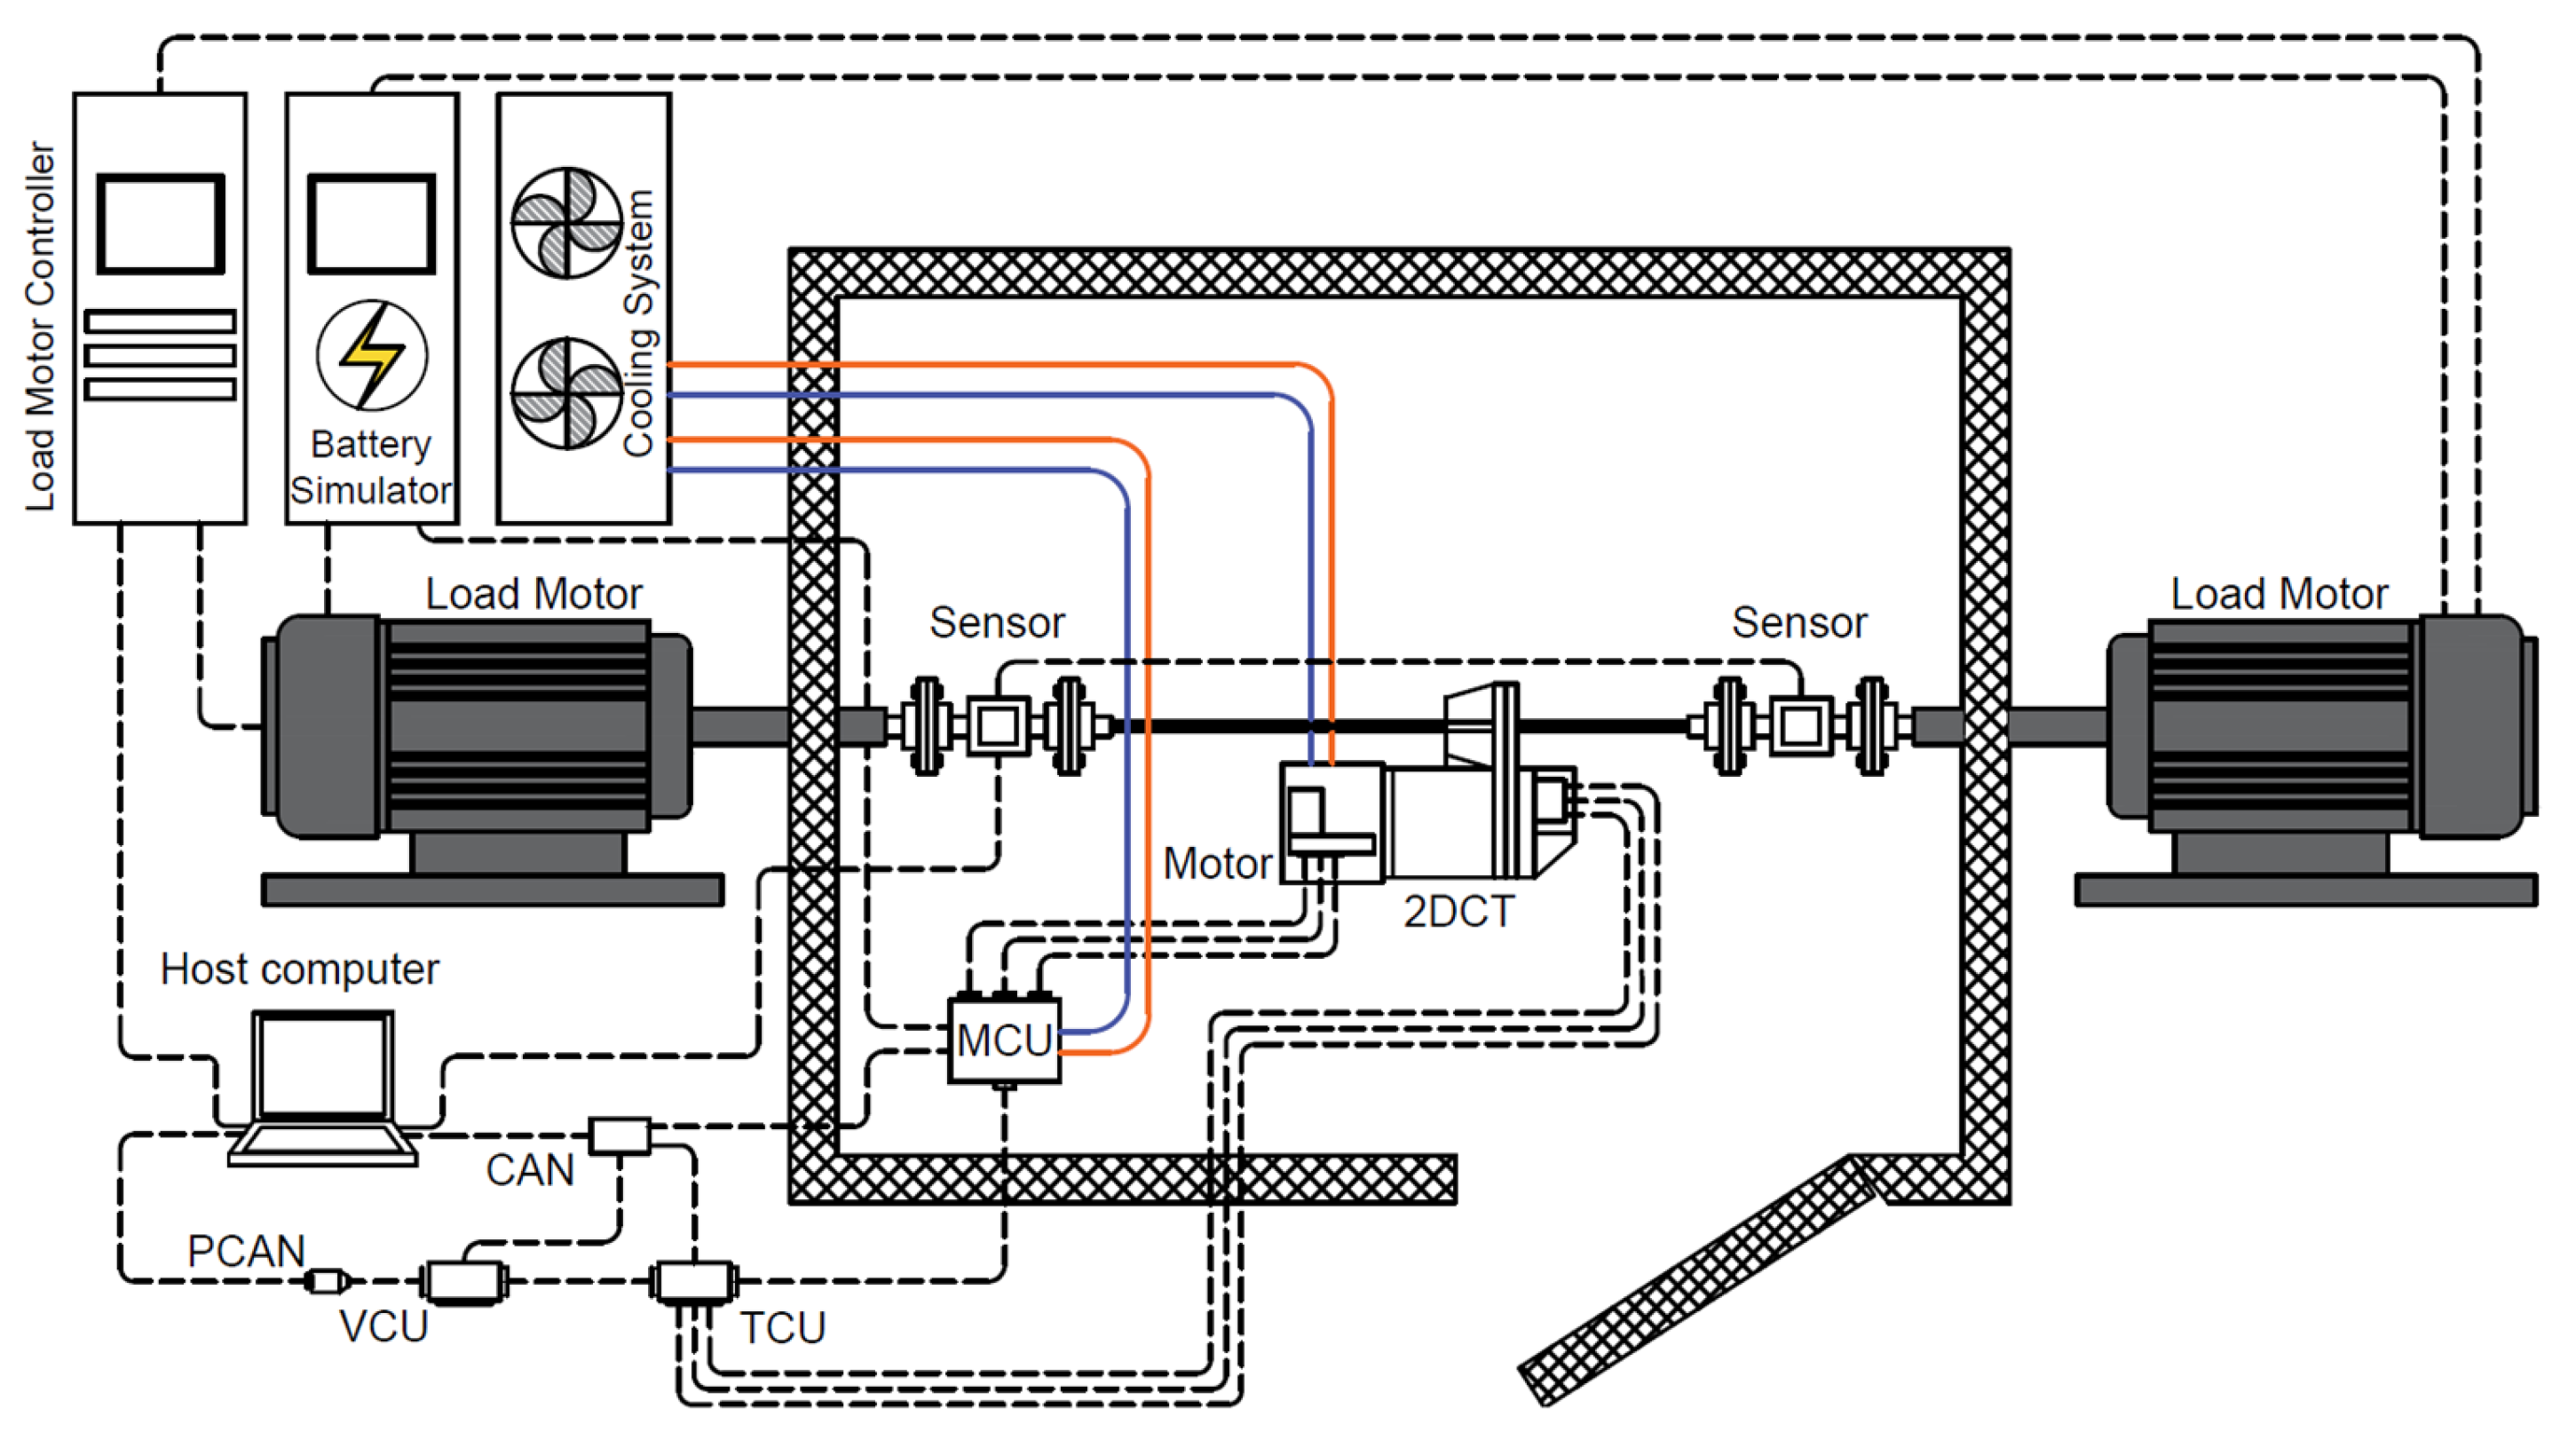
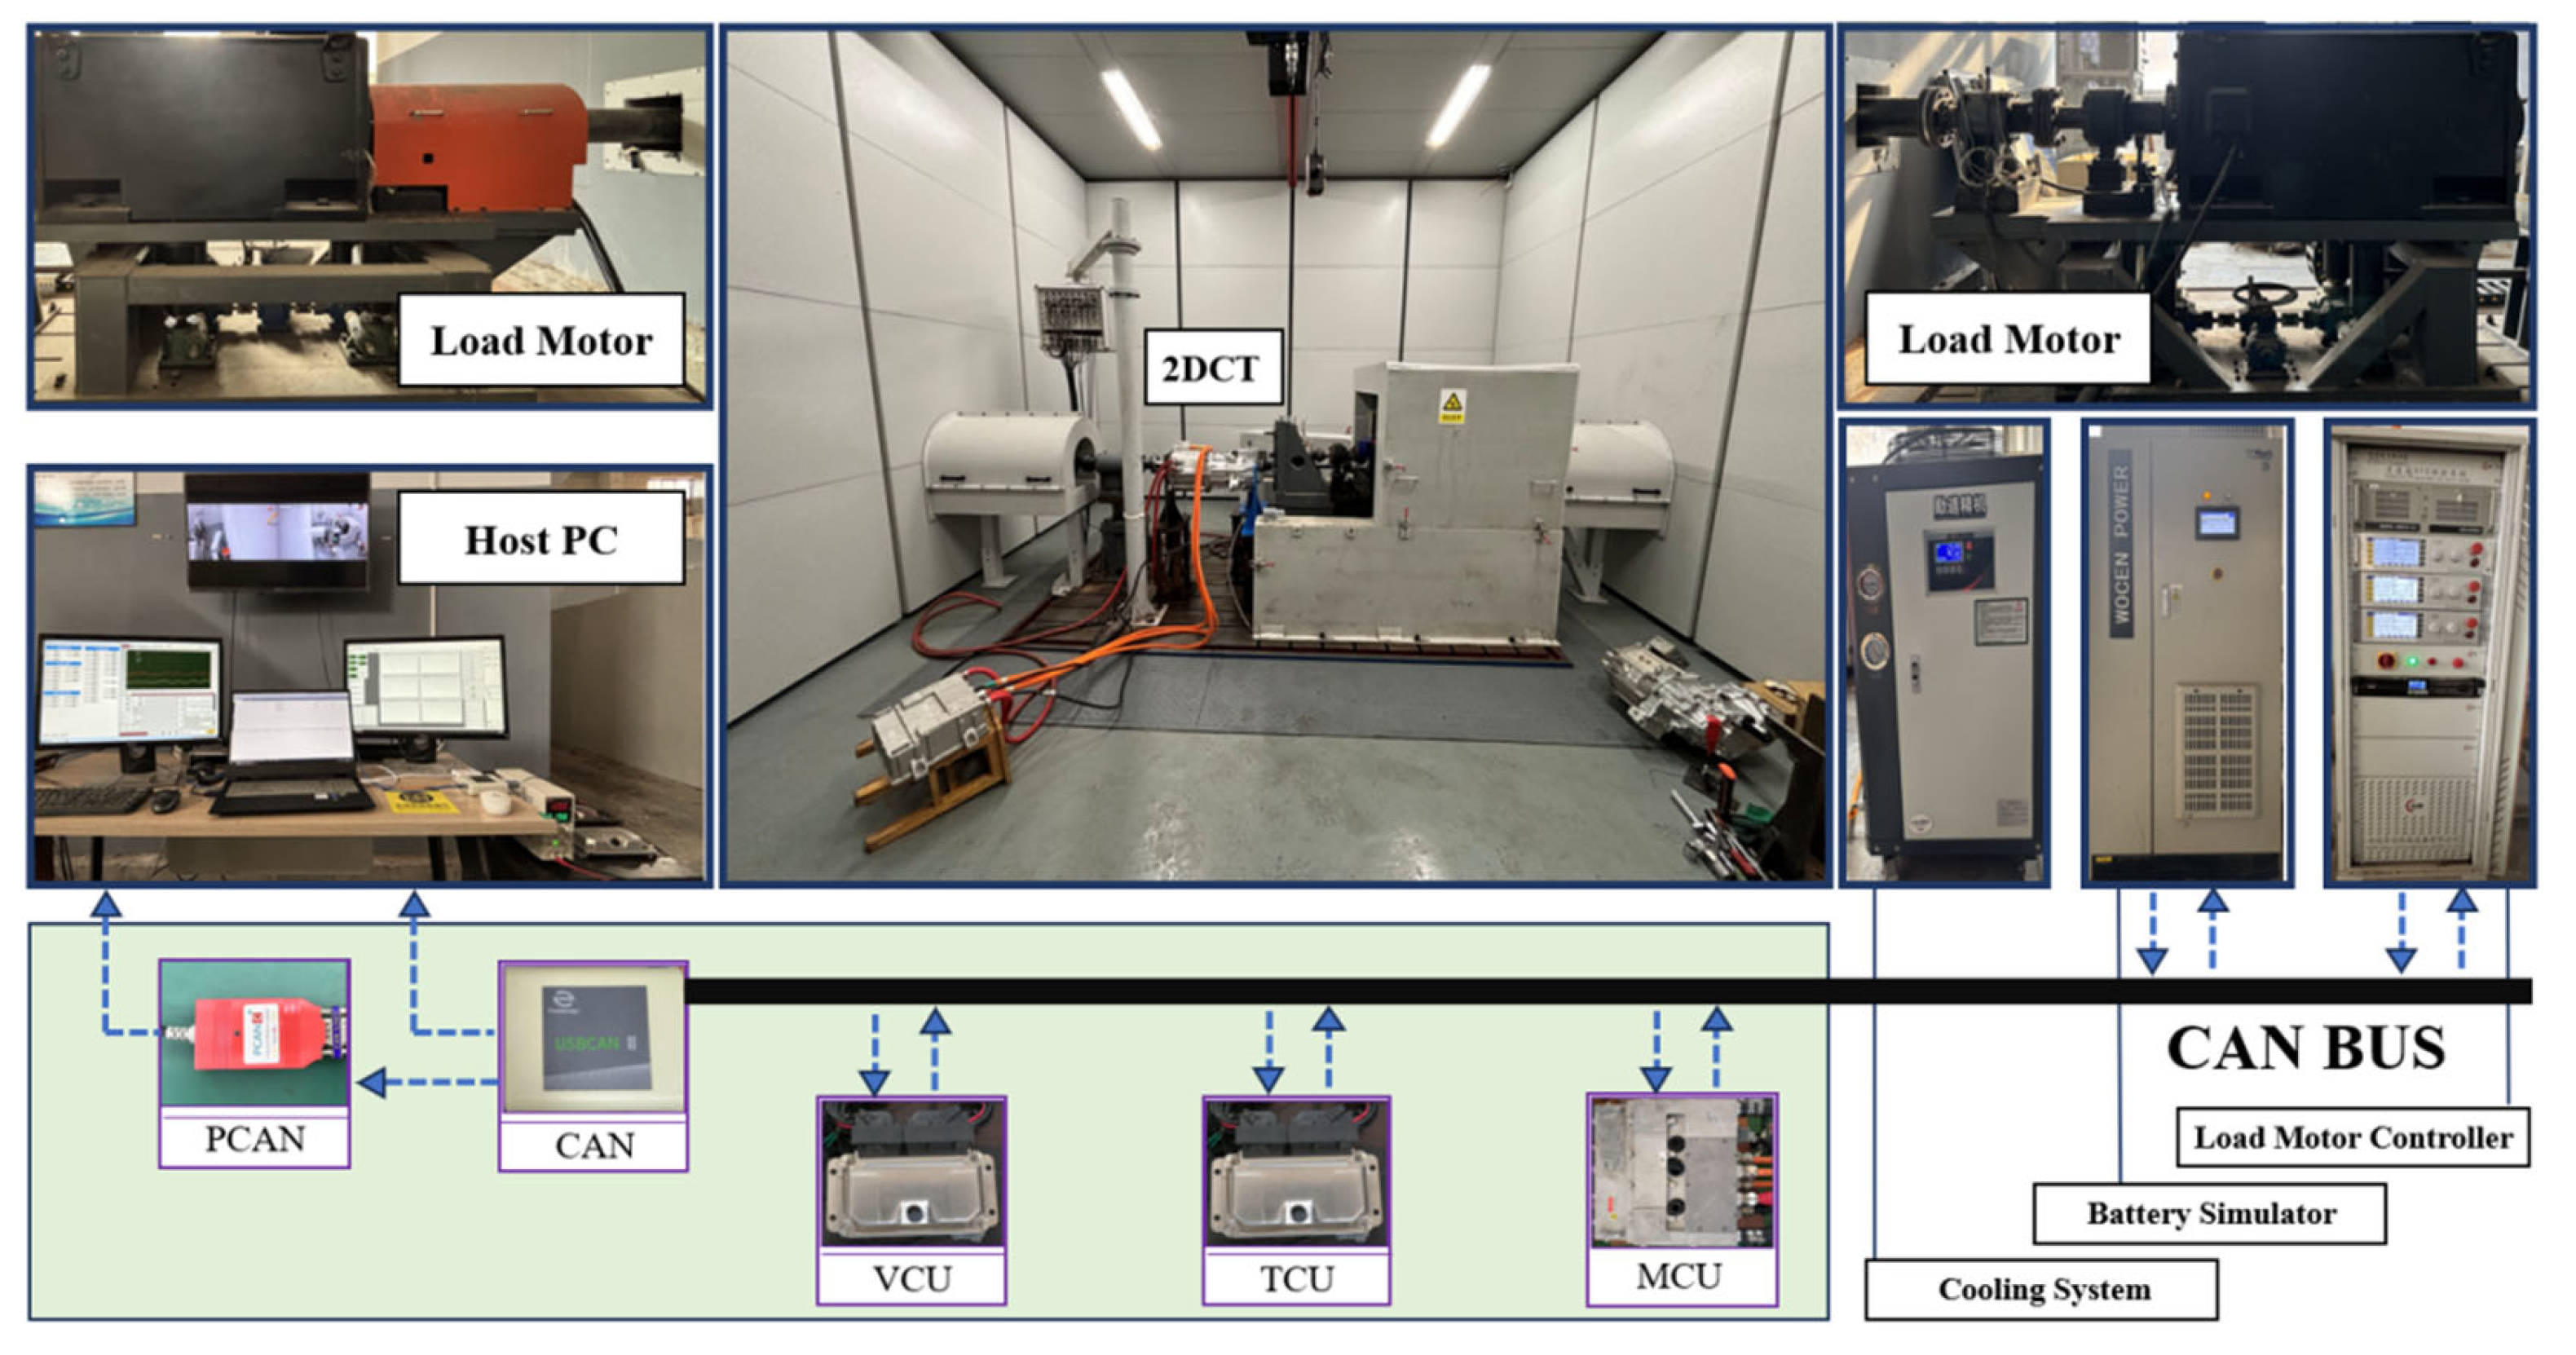
(3) The effectiveness of the proposed gear shift strategy was experimentally validated on a high-speed two-motor load test bench under multiple typical operating conditions.
The remainder of this paper is organized as follows.
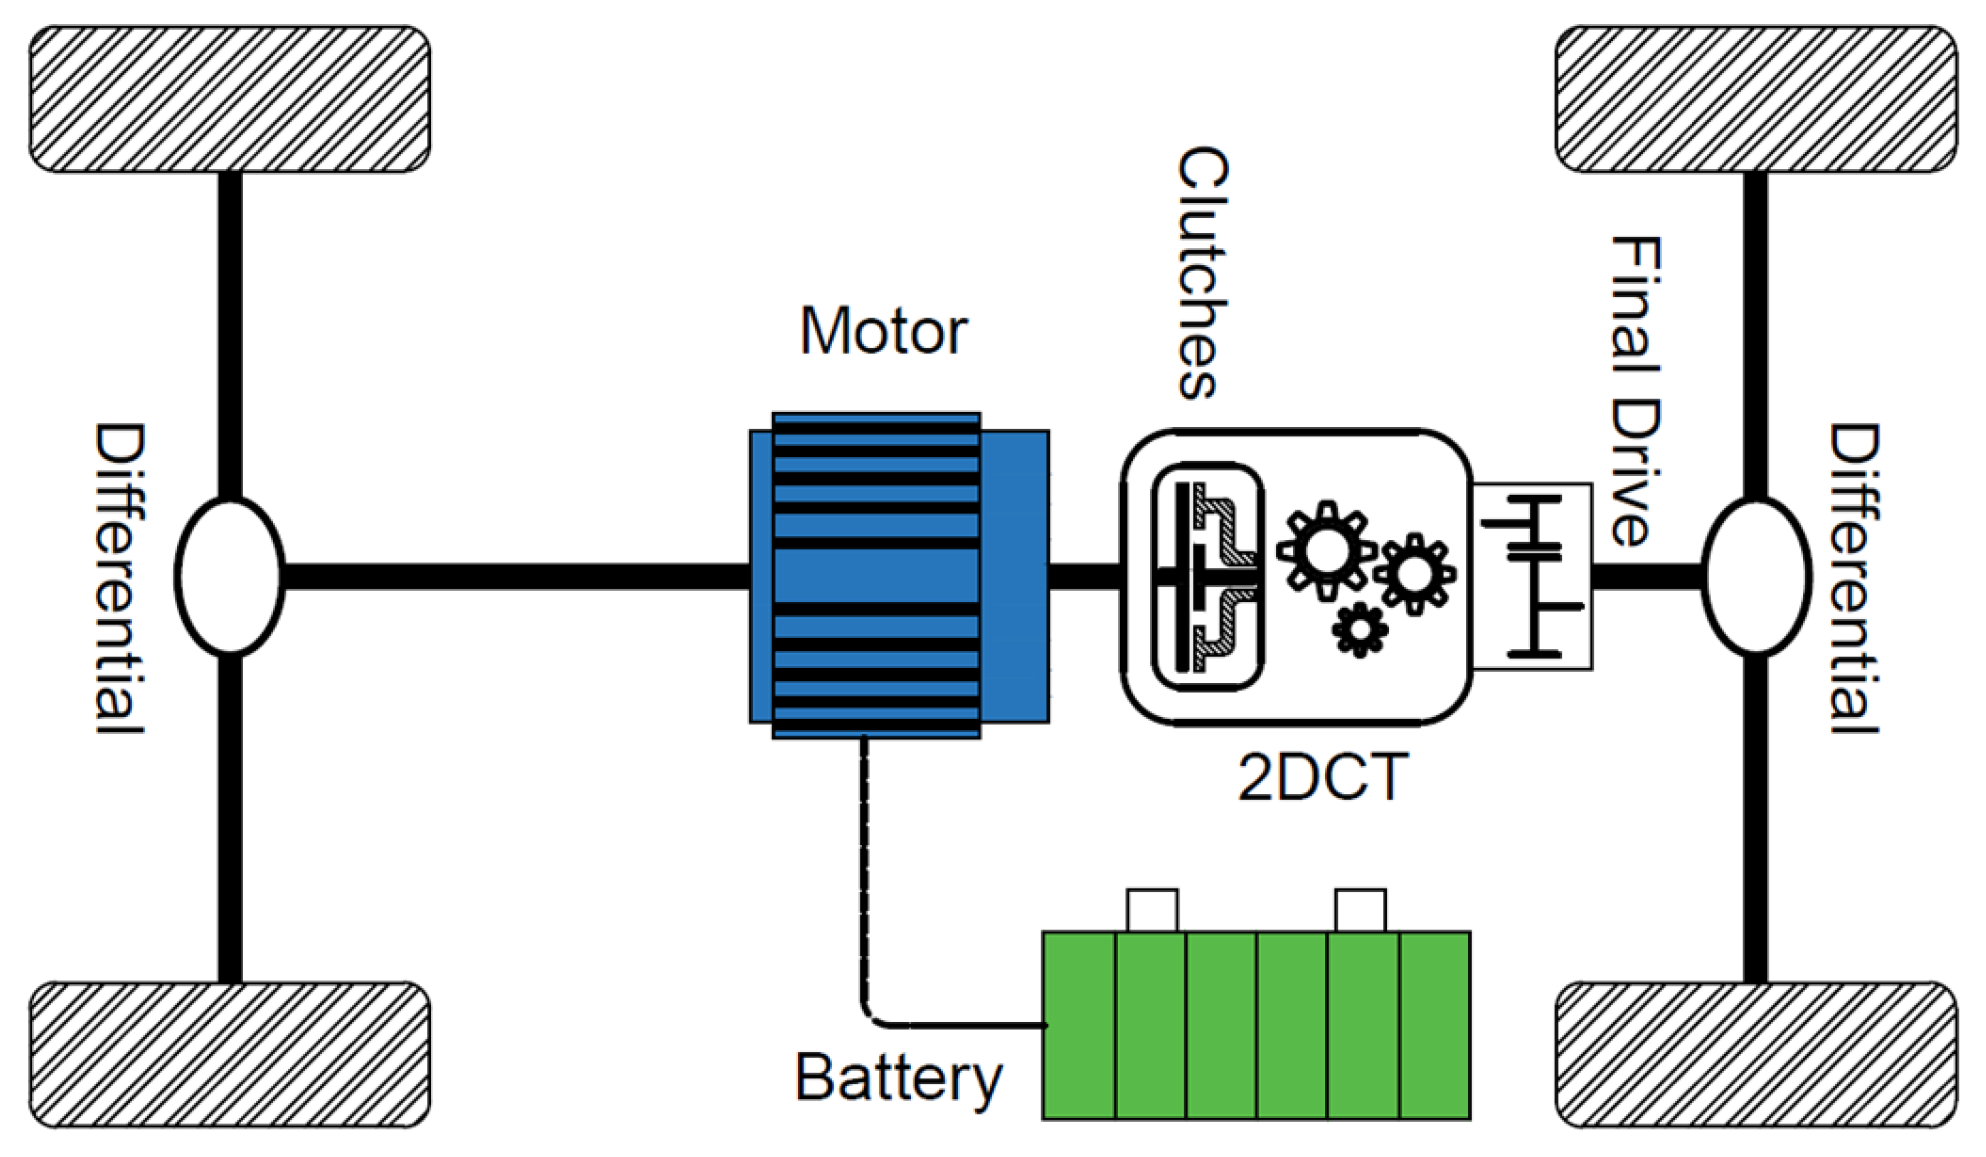
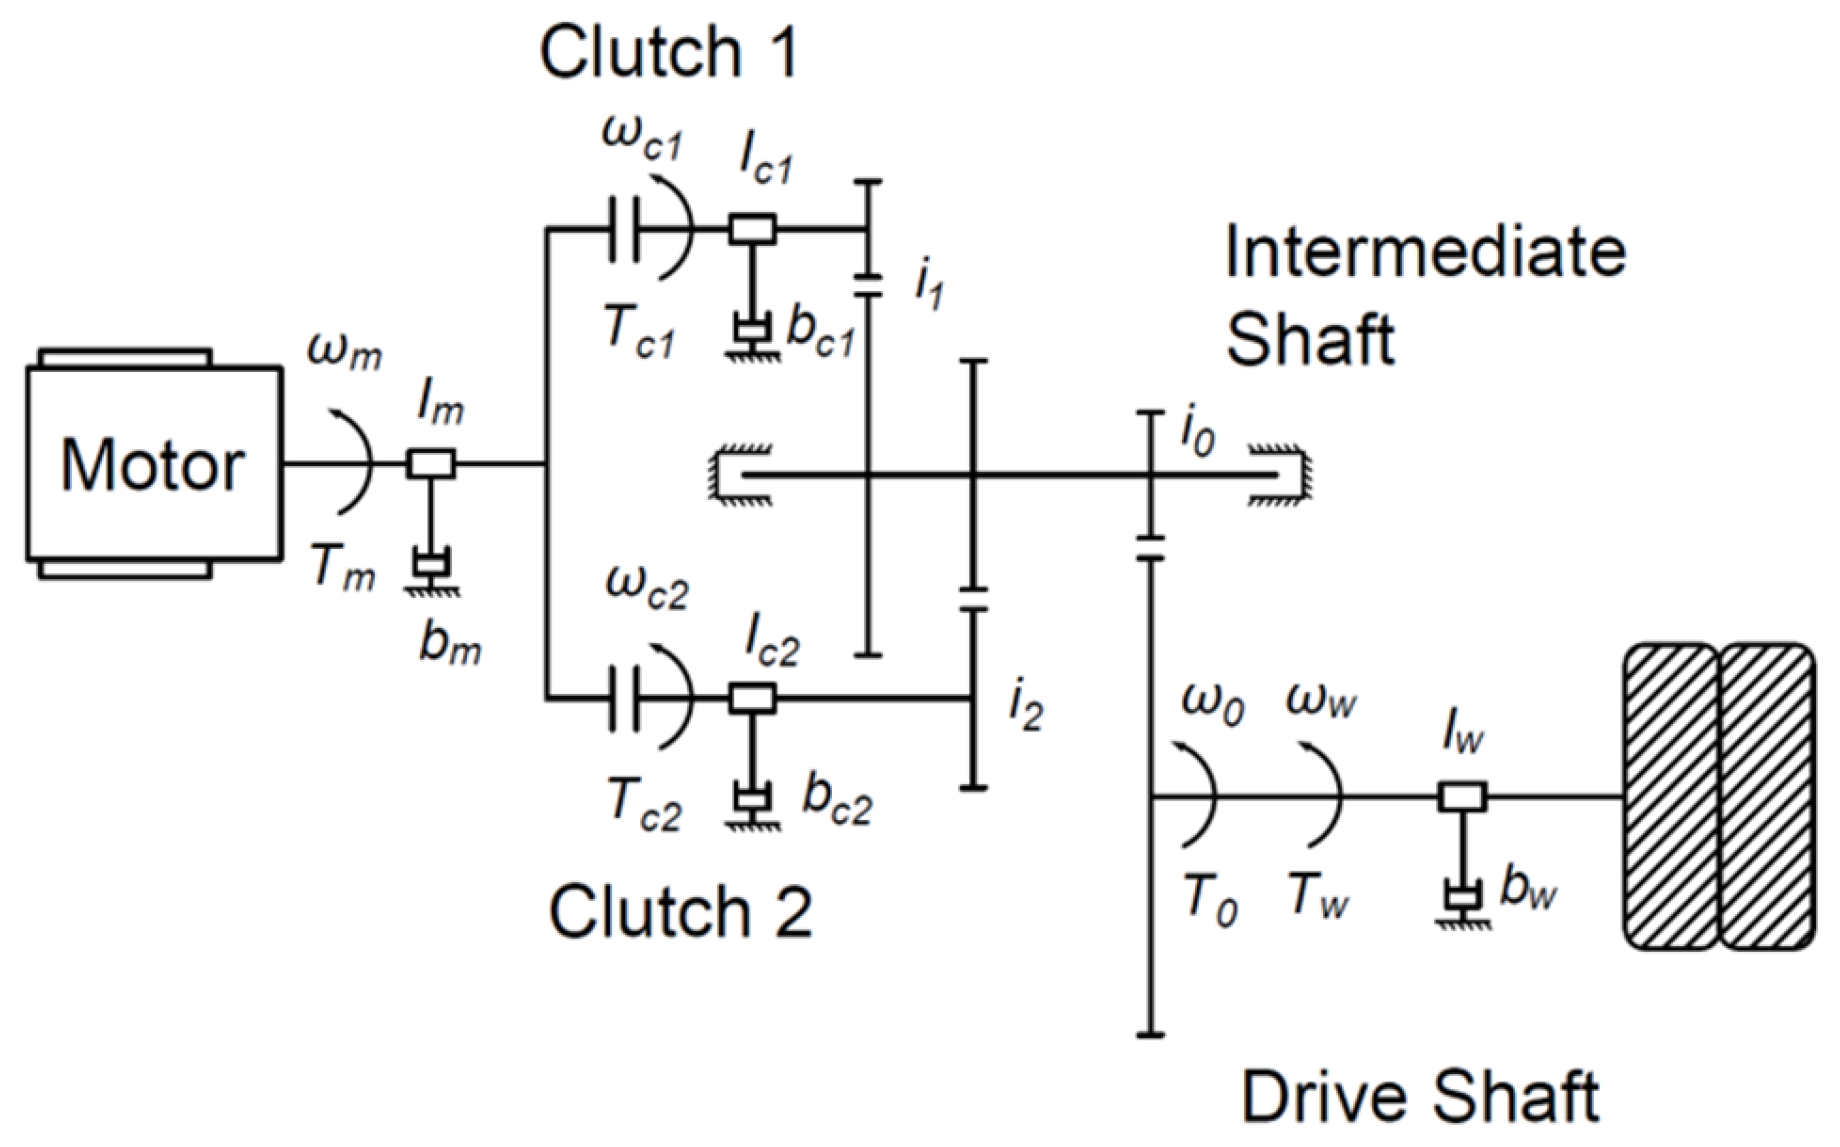
Section 2 establishes the models of the key components of the two-speed electric drive system and the longitudinal vehicle dynamics model.
Section 3 presents the rule-based and optimization-based gear shift strategies, together with the hierarchical fuzzy evaluation and gear shift strategy matching method based on transmission operating states and the shift frequency correction strategy.
Section 4 verifies the effectiveness of the proposed strategy under various operating conditions through simulation.
Section 5 further validates the proposed strategy through bench experiments.
Section 6 concludes the content presented in this paper.
3. Hierarchical Adaptive Gear Shift Strategy Matching Framework
3.1. Rule-Based Gear Shift Strategy
Rule-based gear shift strategies can be classified into economic strategies and dynamic strategies. The economic strategy selects the gear with higher motor efficiency, whereas the dynamic strategy selects the gear with higher output torque. Pedal opening and vehicle speed are used as shift parameters.
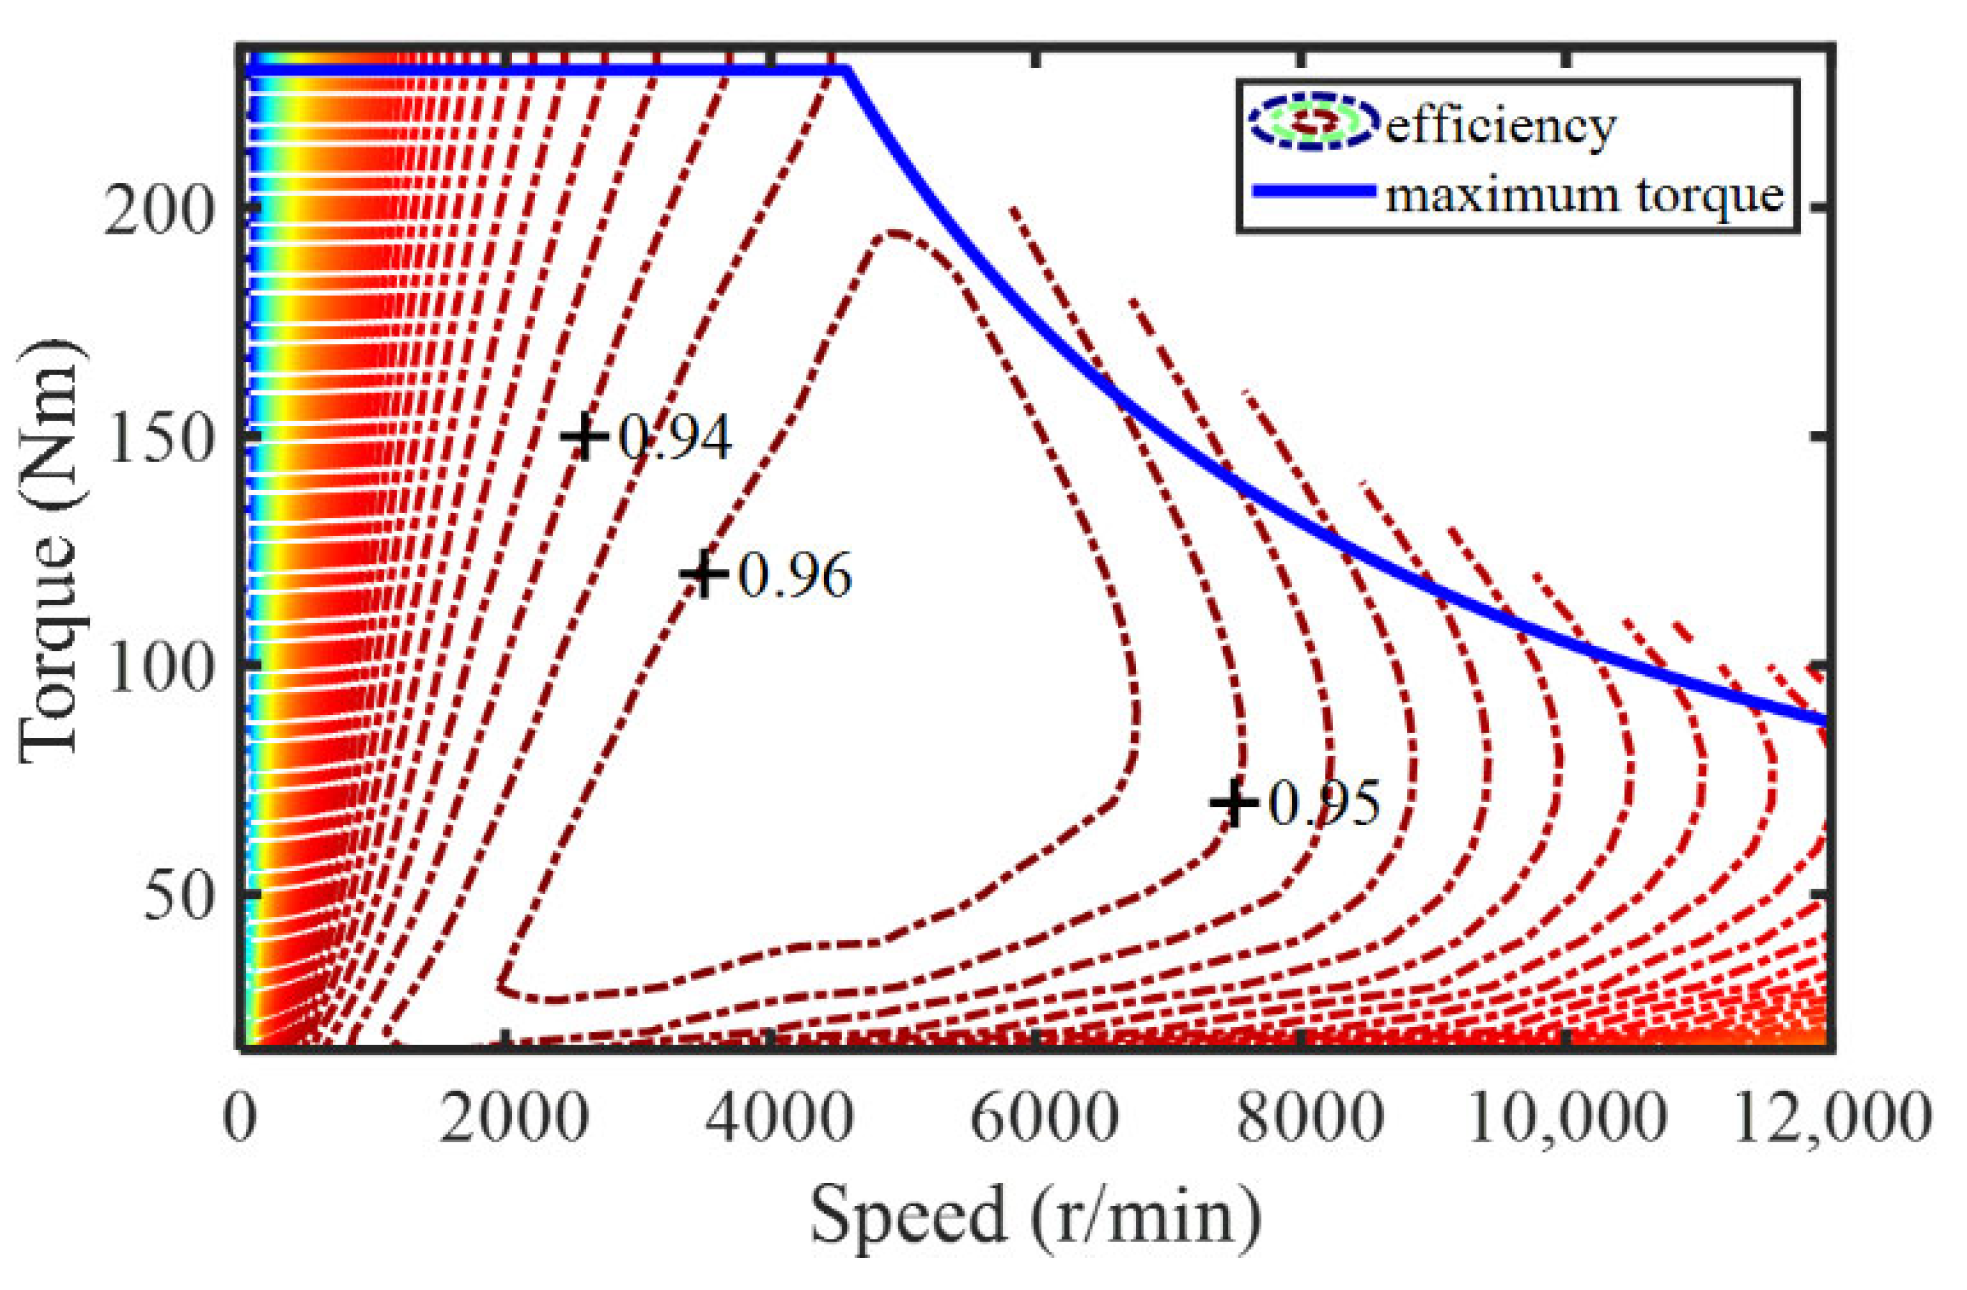
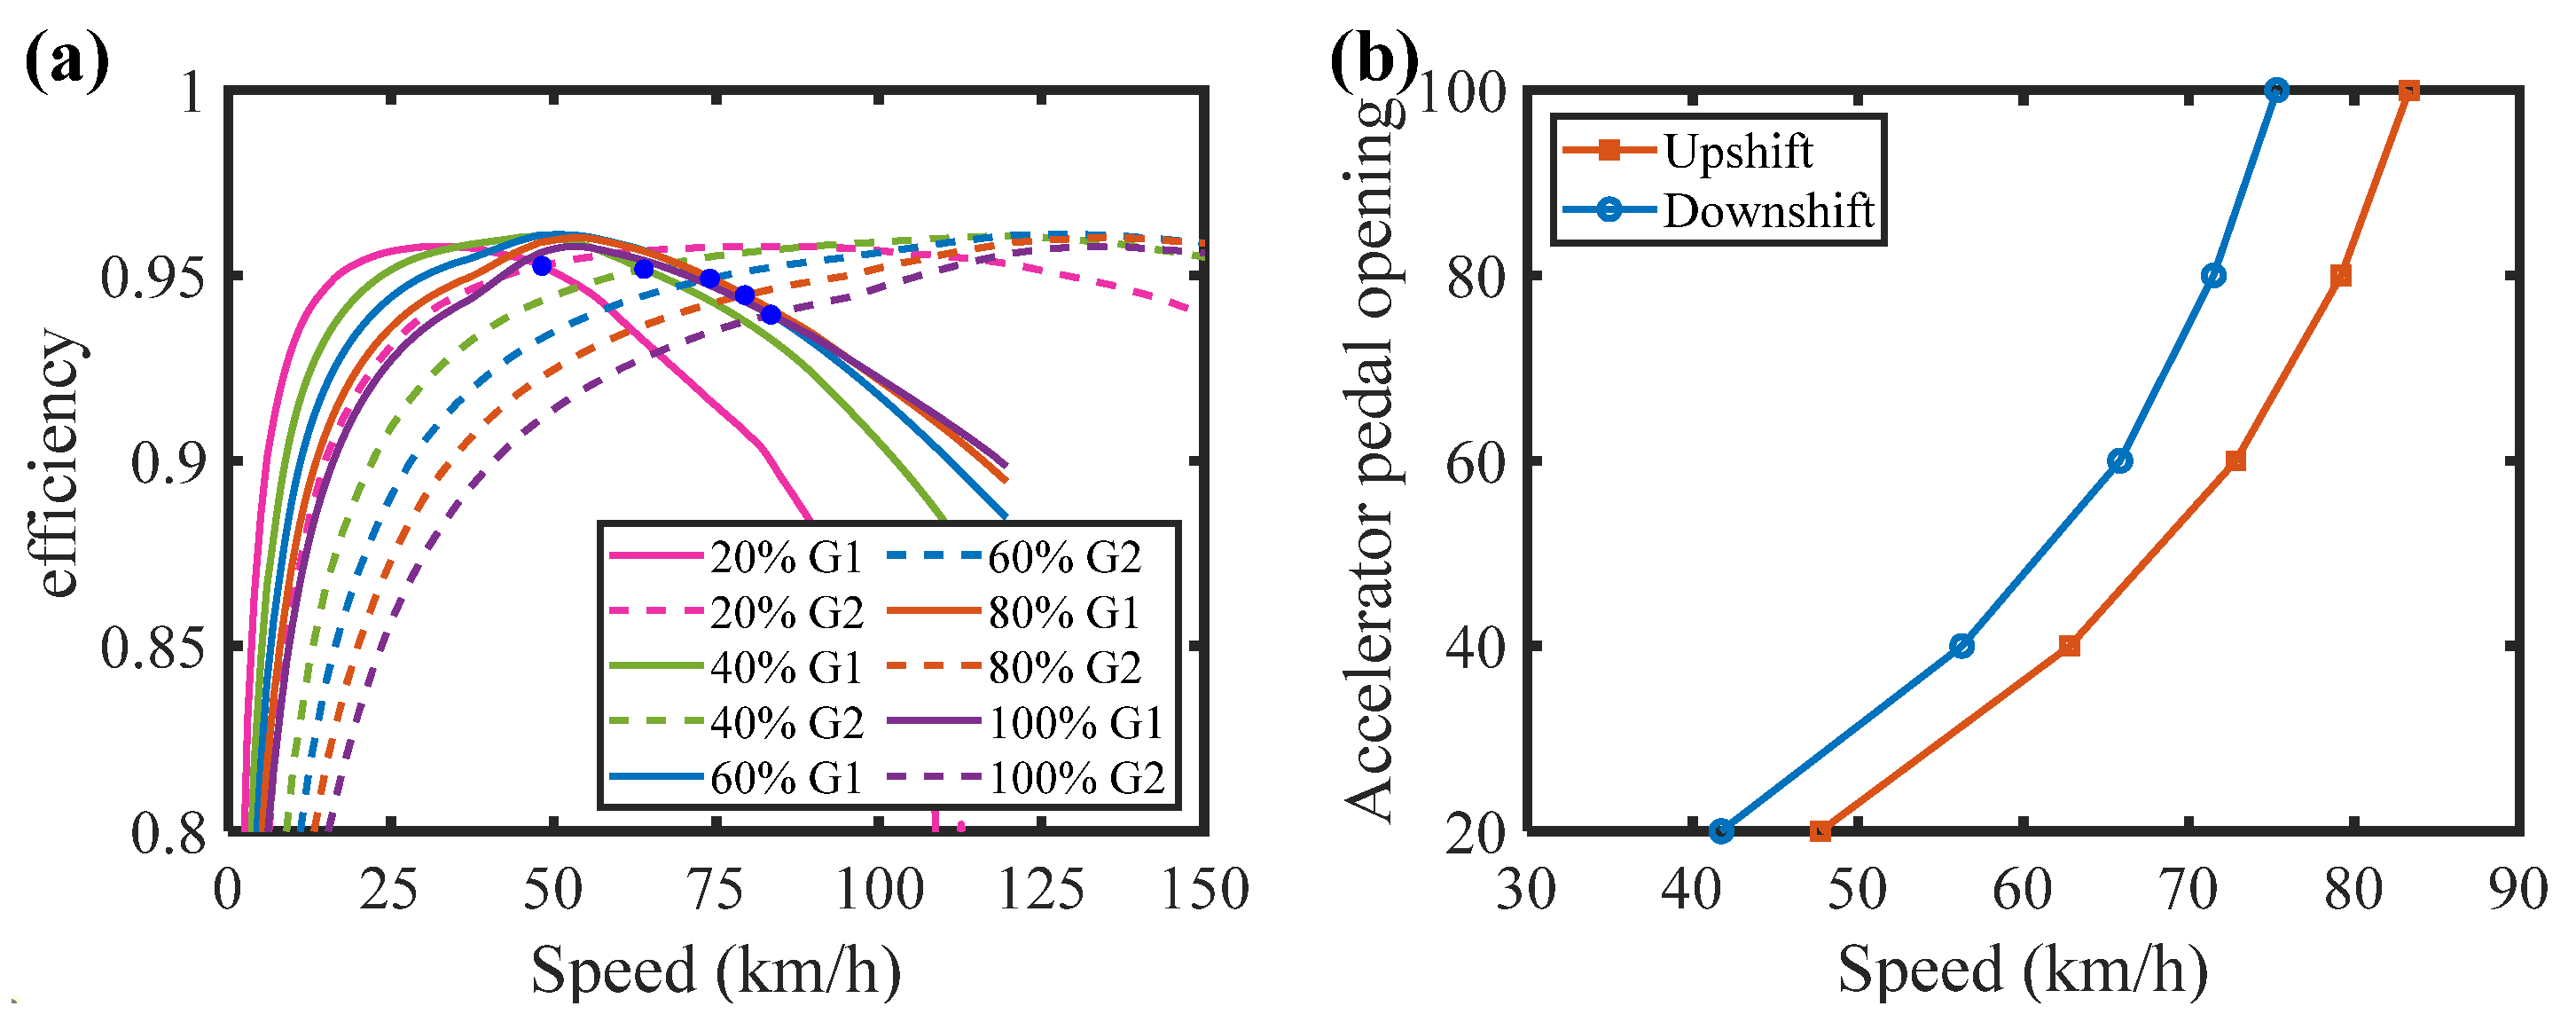
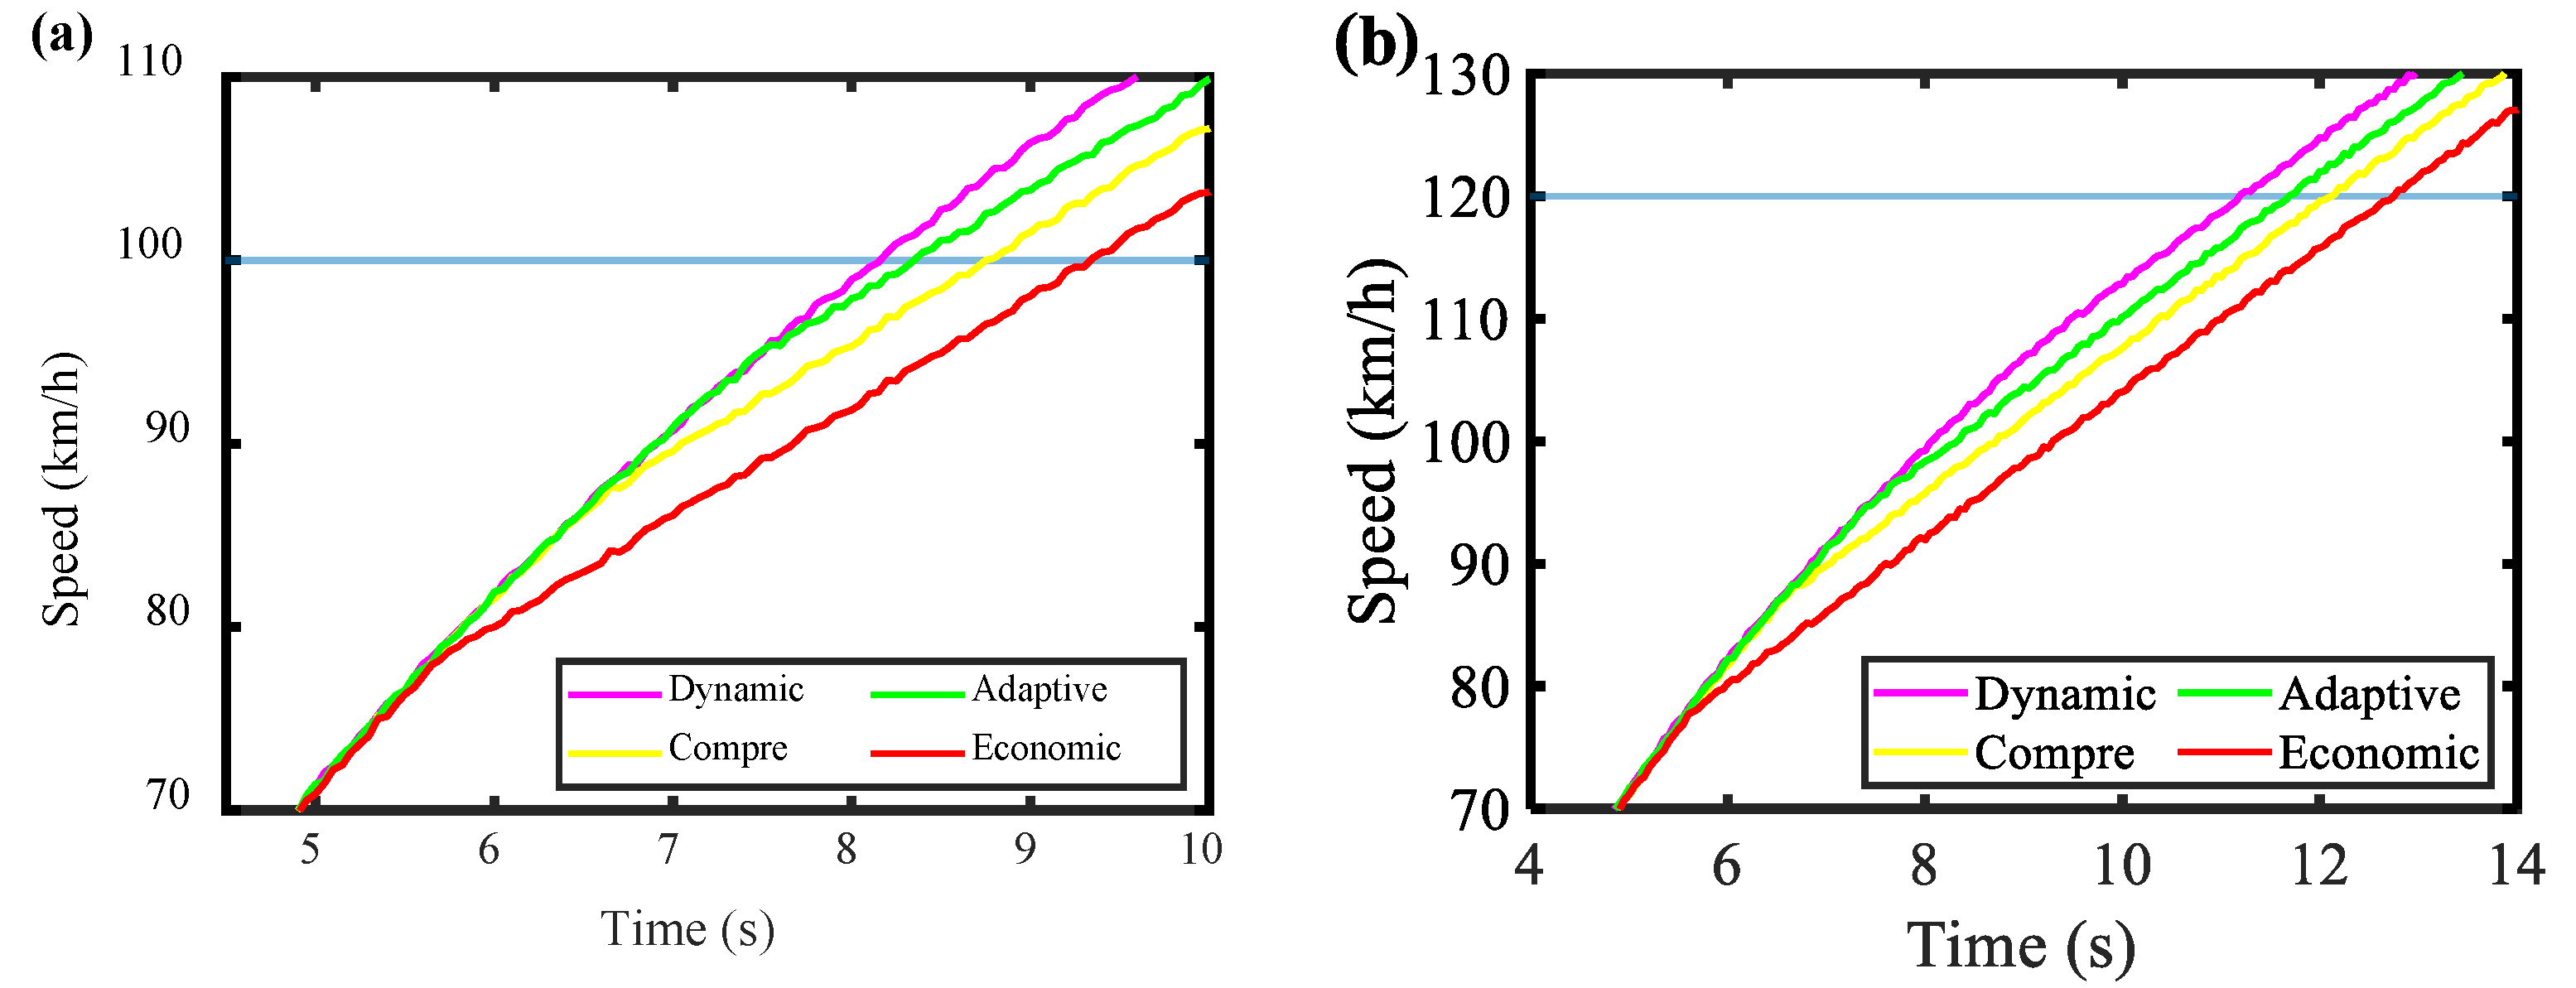
For the economic strategy, motor efficiencies of both gears are calculated as functions of vehicle speed under a given pedal opening, as described in Equation (16). Their intersection defines the optimal shift point. Repeating this process for multiple pedal openings yields the economic strategy for real-time lookup. Pedal openings of 20%, 40%, 60%, 80%, and 100% are selected, and the corresponding results are shown in
Figure 7a,b.
The obtained economic shift curve is the upshift curve, while the downshift curve is set at a lower vehicle speed. A delayed downshift strategy is adopted, in which the downshift speed delay increases with pedal opening, allowing the transmission to remain in the higher gear at larger pedal openings and better satisfy the requirements of the economic strategy.
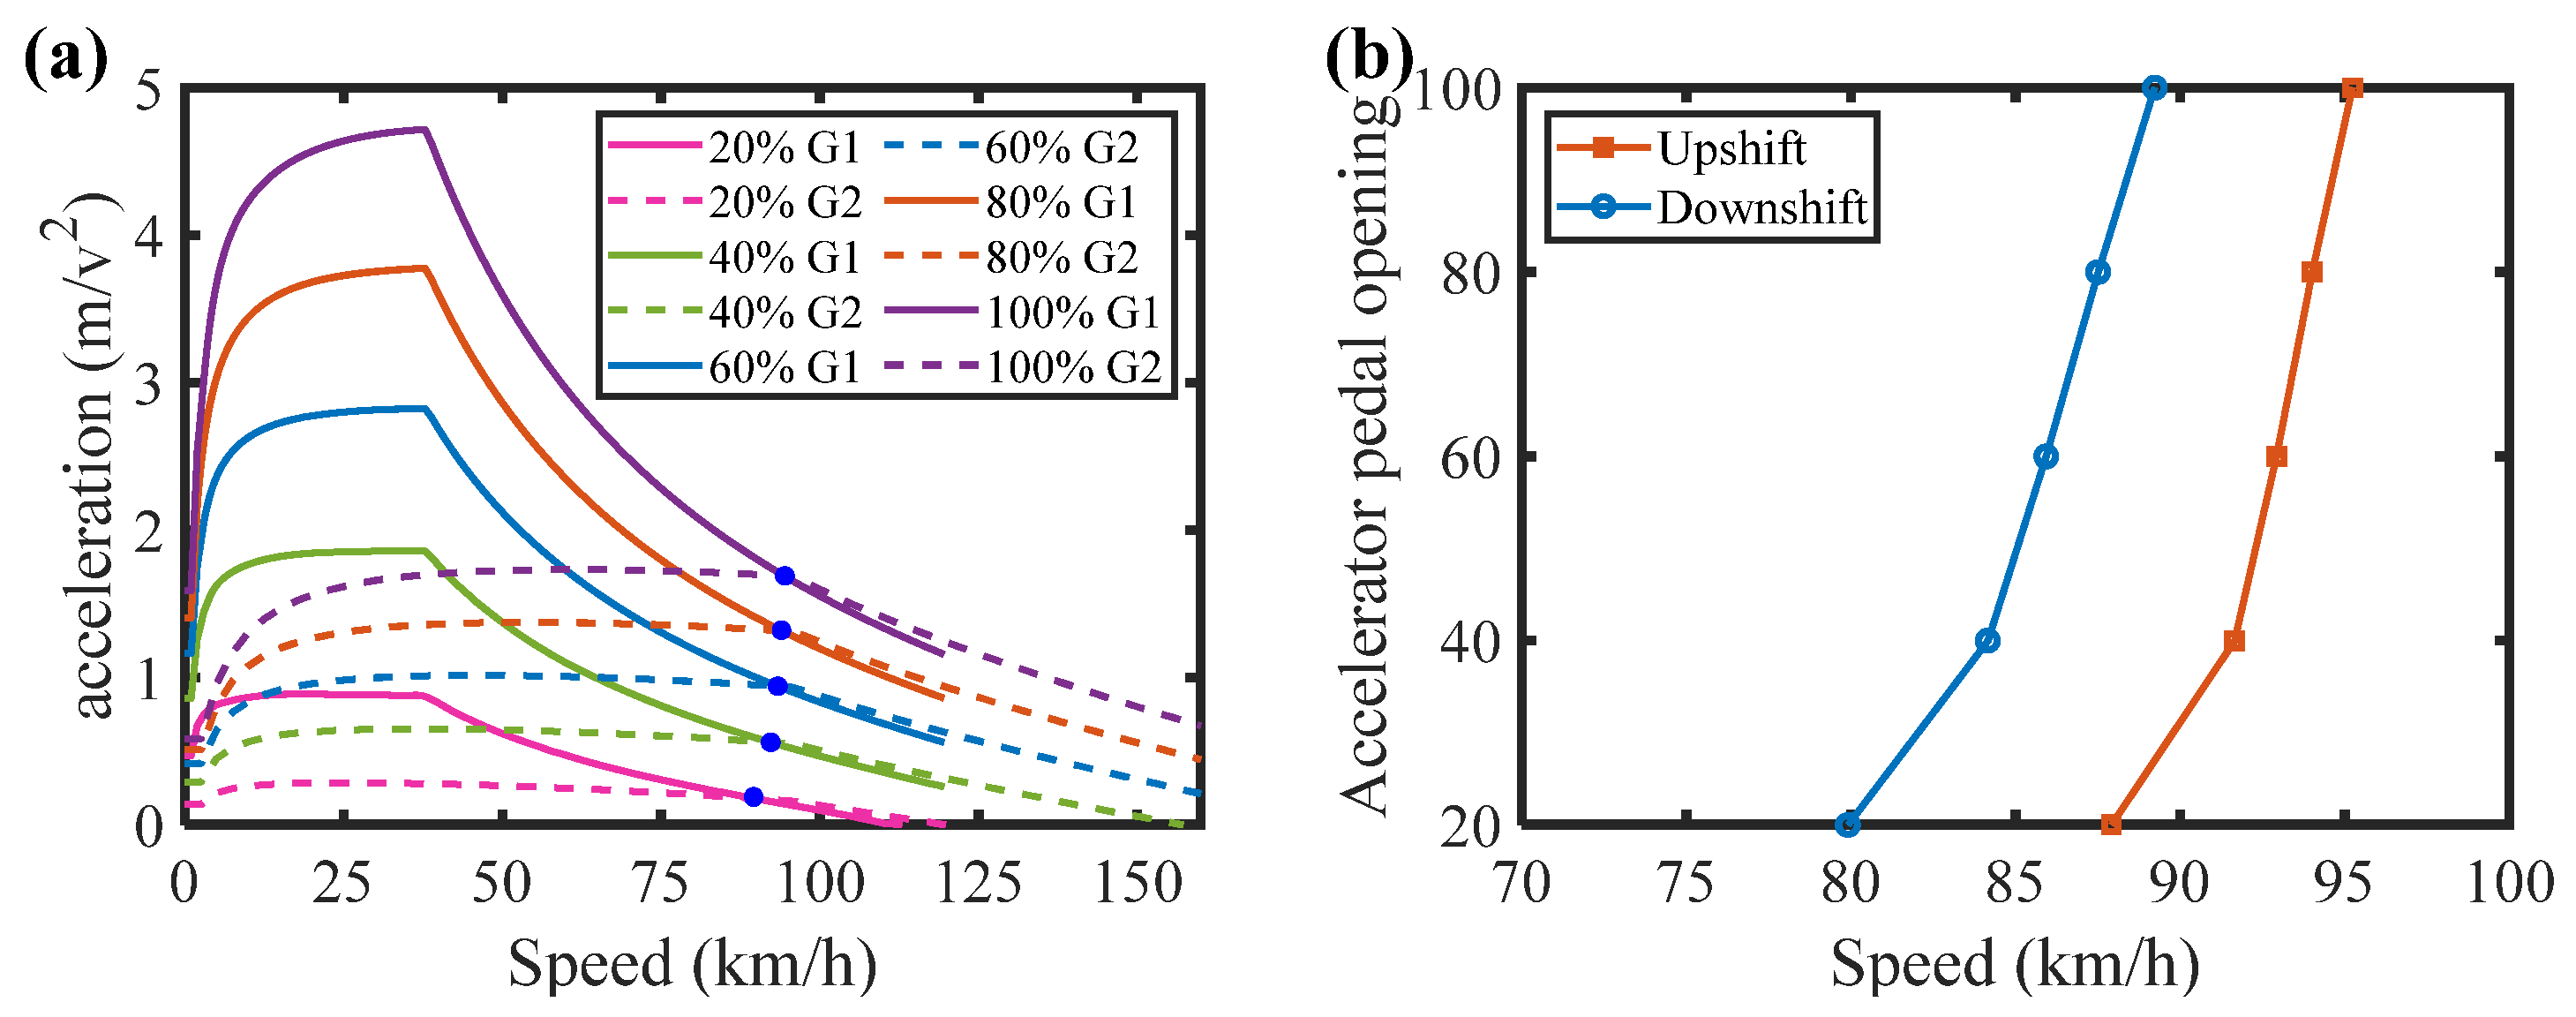
The design principle of the dynamic strategy is similar to that of the economic strategy. Under a given pedal opening, the maximum vehicle acceleration in both gears is calculated as a function of vehicle speed based on the motor output torque model, as described in Equation (17). Their intersection defines the optimal shift point. Repeating this process for multiple pedal openings yields the dynamic strategy for real-time lookup. Pedal openings of 20%, 40%, 60%, 80%, and 100% are selected, and the corresponding acceleration curves and shift strategy are shown in
Figure 8a,b.
The obtained dynamic shift curve is the upshift curve, while the downshift curve is set at a lower vehicle speed. A convergent downshift strategy is adopted, in which the downshift delay decreases with pedal opening. This facilitates downshifting at larger pedal openings to improve dynamic performance, while increasing the downshift delay at smaller pedal openings to reduce unnecessary shifts and shift cycling. Thus, the rule-based gear shift strategies are established.
3.2. Optimization-Based Comprehensive Gear Shift Strategy
To balance energy efficiency and dynamic performance, a multi-objective optimization method is adopted to design the comprehensive gear shift strategy. Pedal openings of 20%, 40%, 60%, 80%, and 100% are selected, with shift speed as the decision variable and acceleration time and energy consumption as the objectives. The non-dominated sorting genetic algorithm II (NSGA-II) is used to obtain the Pareto-optimal set, from which a compromise solution is selected by adjusting the weights of energy efficiency and dynamic performance with pedal opening. Repeating this process yields the comprehensive strategy for real-time lookup.
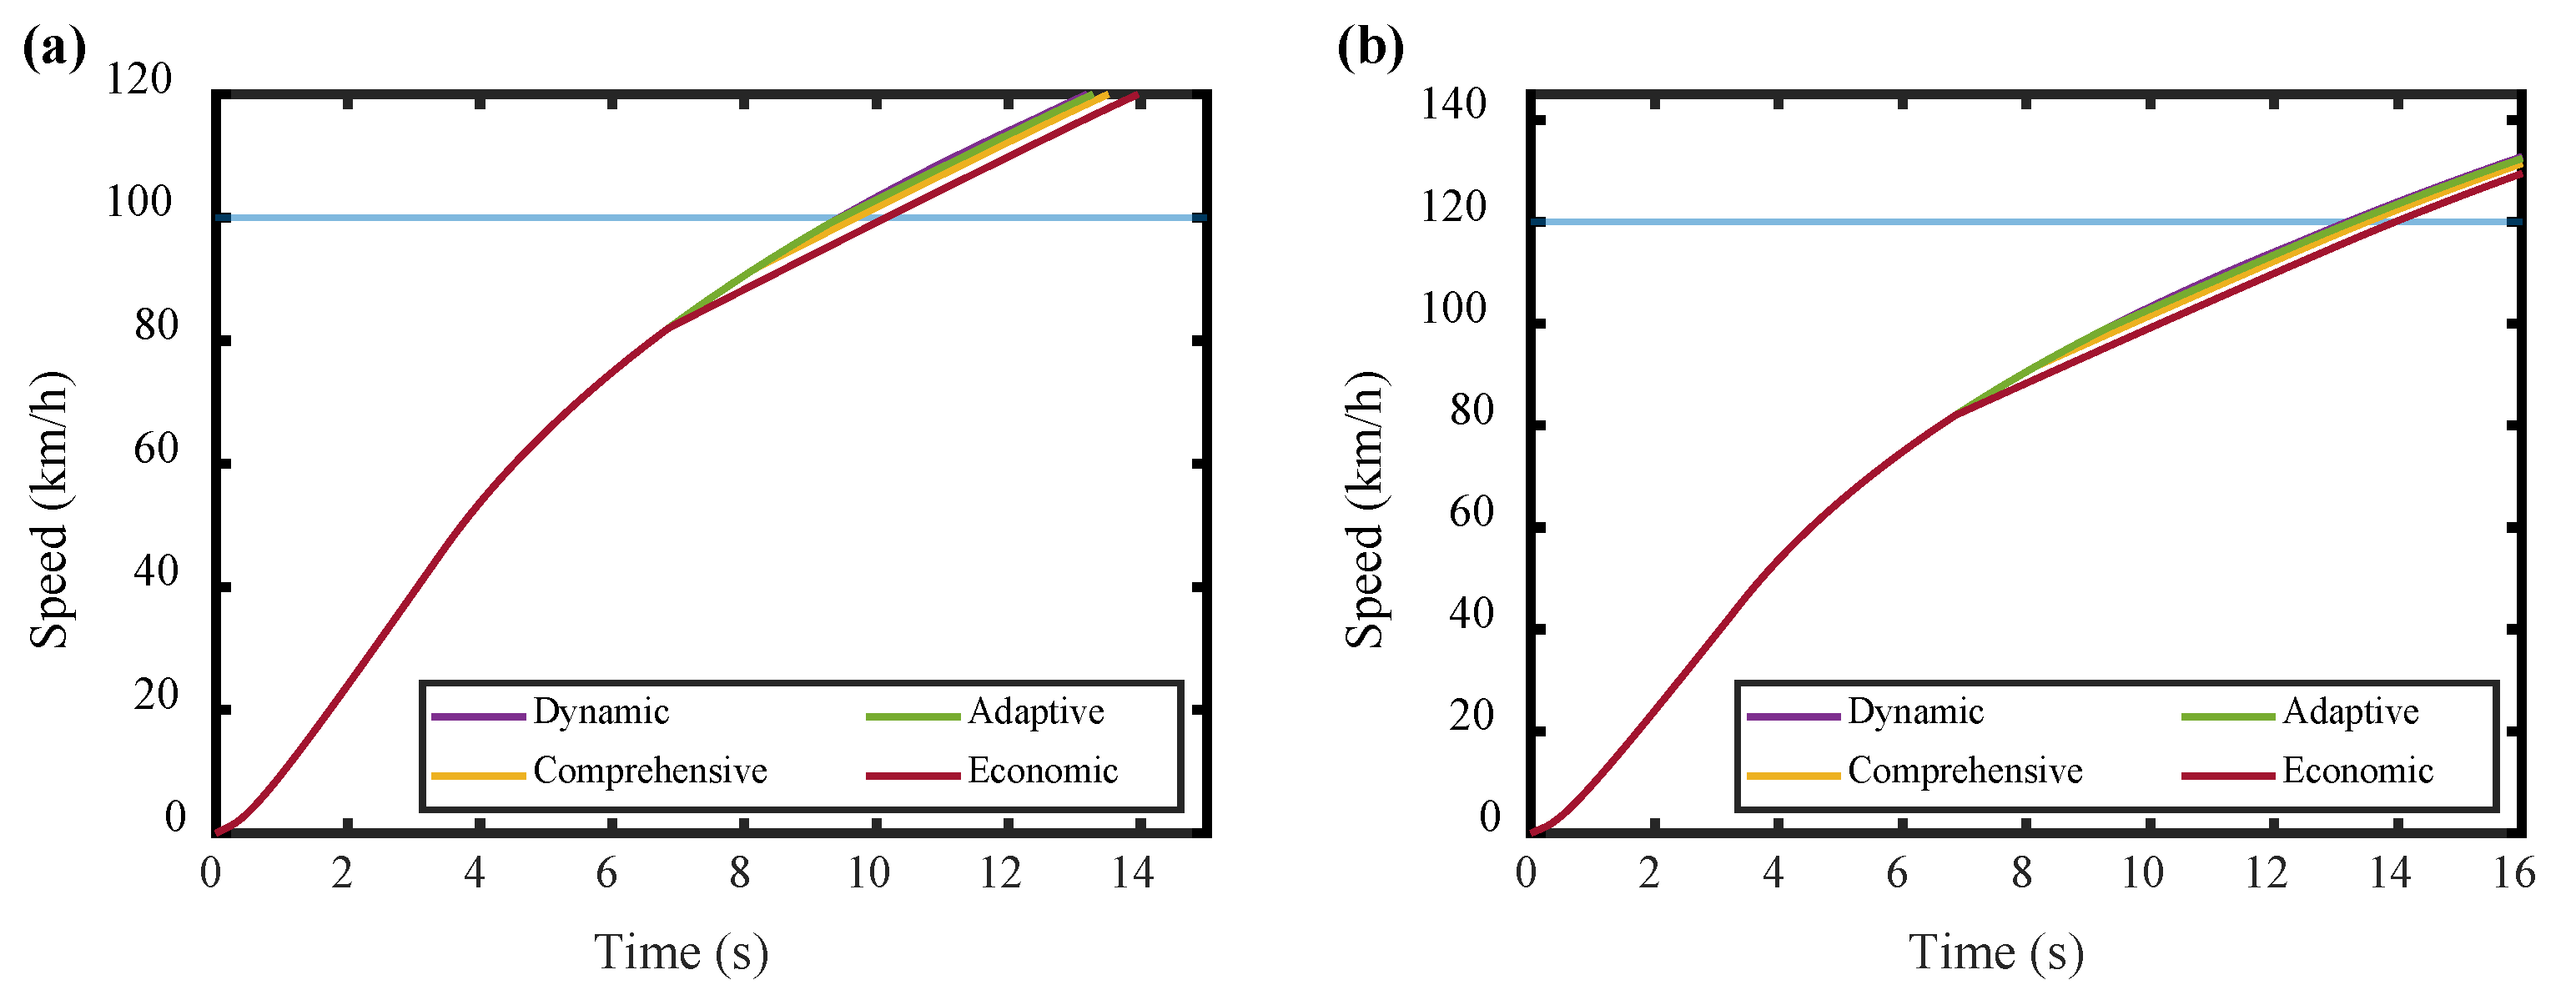
The dynamic objective is defined as the total time required for the vehicle to accelerate from 0 to 120 km/h, including the operating times in both gears, as given in Equations (18)–(20). The economic objective is defined as the total energy consumption over the same process, including the energy consumption in both gears, as given in Equations (21)–(23). In both cases, the acceleration process is divided into two stages: first gear operation from 0 to the shift speed
vs, and second gear operation from
vs to the target speed. In this study, the 0 to 120 km/h range is selected instead of the conventional 0 to 100 km/h range, because the advantages of the two-speed transmission are more evident under high-speed operating conditions.
Here,
t1 and
t2 denote the operating times in the first gear and second gears, respectively,
ηT is the transmission efficiency,
vs is the shift speed, and
fd is the dynamic objective function.
Here, E1 and E2 denote the energy consumption in the first and second gears, respectively, and fe is the economic objective function.
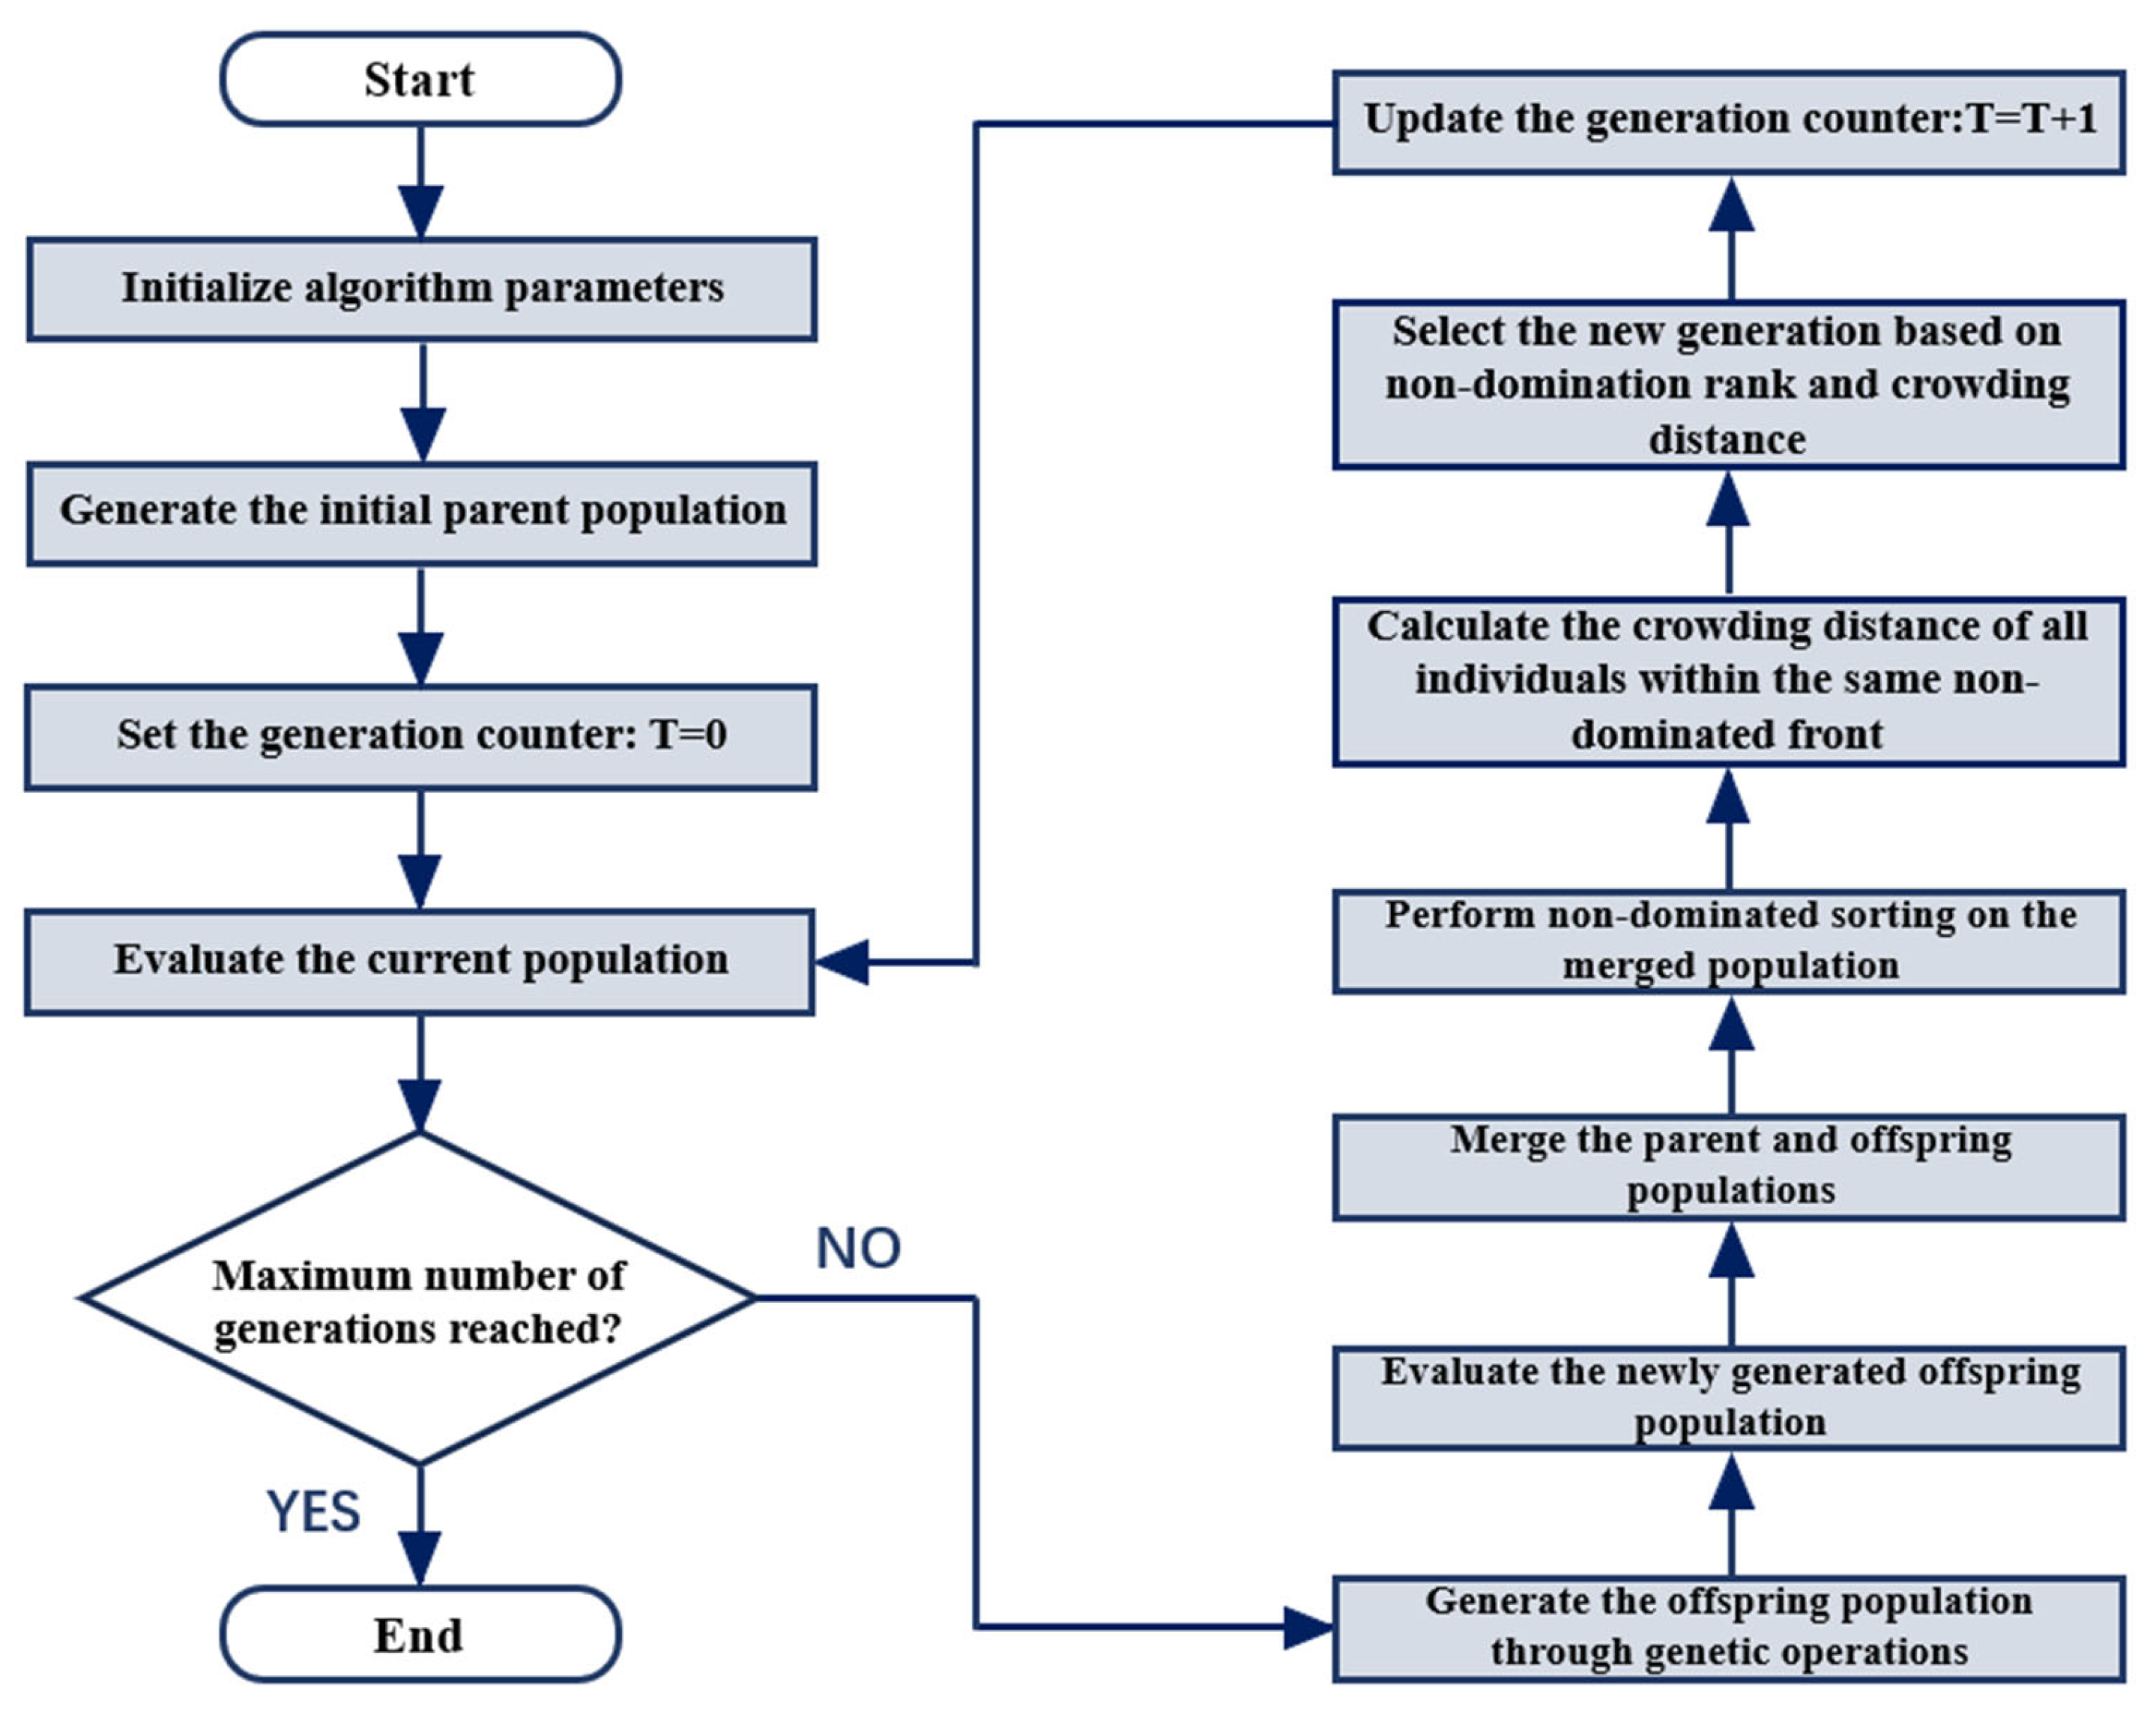
The performance of NSGA-II relies on three key mechanisms: fast non-dominated sorting, crowding distance evaluation, and an elitist strategy. Fast non-dominated sorting identifies non-dominated solutions based on dominance relationships. The crowding distance mechanism maintains the diversity of the solution set, while the elitist strategy improves convergence by retaining high-quality individuals during evolution. NSGA-II is well suited for the present problem, which involves the conflicting objectives of acceleration time and energy consumption. It can identify a set of trade-off solutions without relying on predefined weights, thereby avoiding the limitations of conventional weighted-sum methods. In addition, the diversity preservation mechanism enables the generation of well-distributed candidate strategies, providing flexibility for strategy selection under different operating conditions. The optimization procedure is illustrated in
Figure 9.
Since the two objective functions, acceleration time
fd and energy consumption
fe, differ in magnitude, normalization is required during the optimization process, as given in Equation (24)
where
fd_max and
fd_min denote the maximum and minimum values of the objective function
fd, respectively, while
fe_max and
fe_min denote the maximum and minimum values of the objective function
fe, respectively.
Finally, the linear weighted-sum method is employed to select the optimal solution, thereby determining the final comprehensive optimal shift speed. The normalized weighted total cost function is given in Equations (25) and (26).
Here,
kd and
ke denote the weights of dynamic performance and energy efficiency, respectively, both initialized at 0.5. As pedal opening increases,
kd is increased and
ke is decreased proportionally to reflect the higher demand for dynamic performance. Conversely, as pedal opening decreases,
kd is reduced and
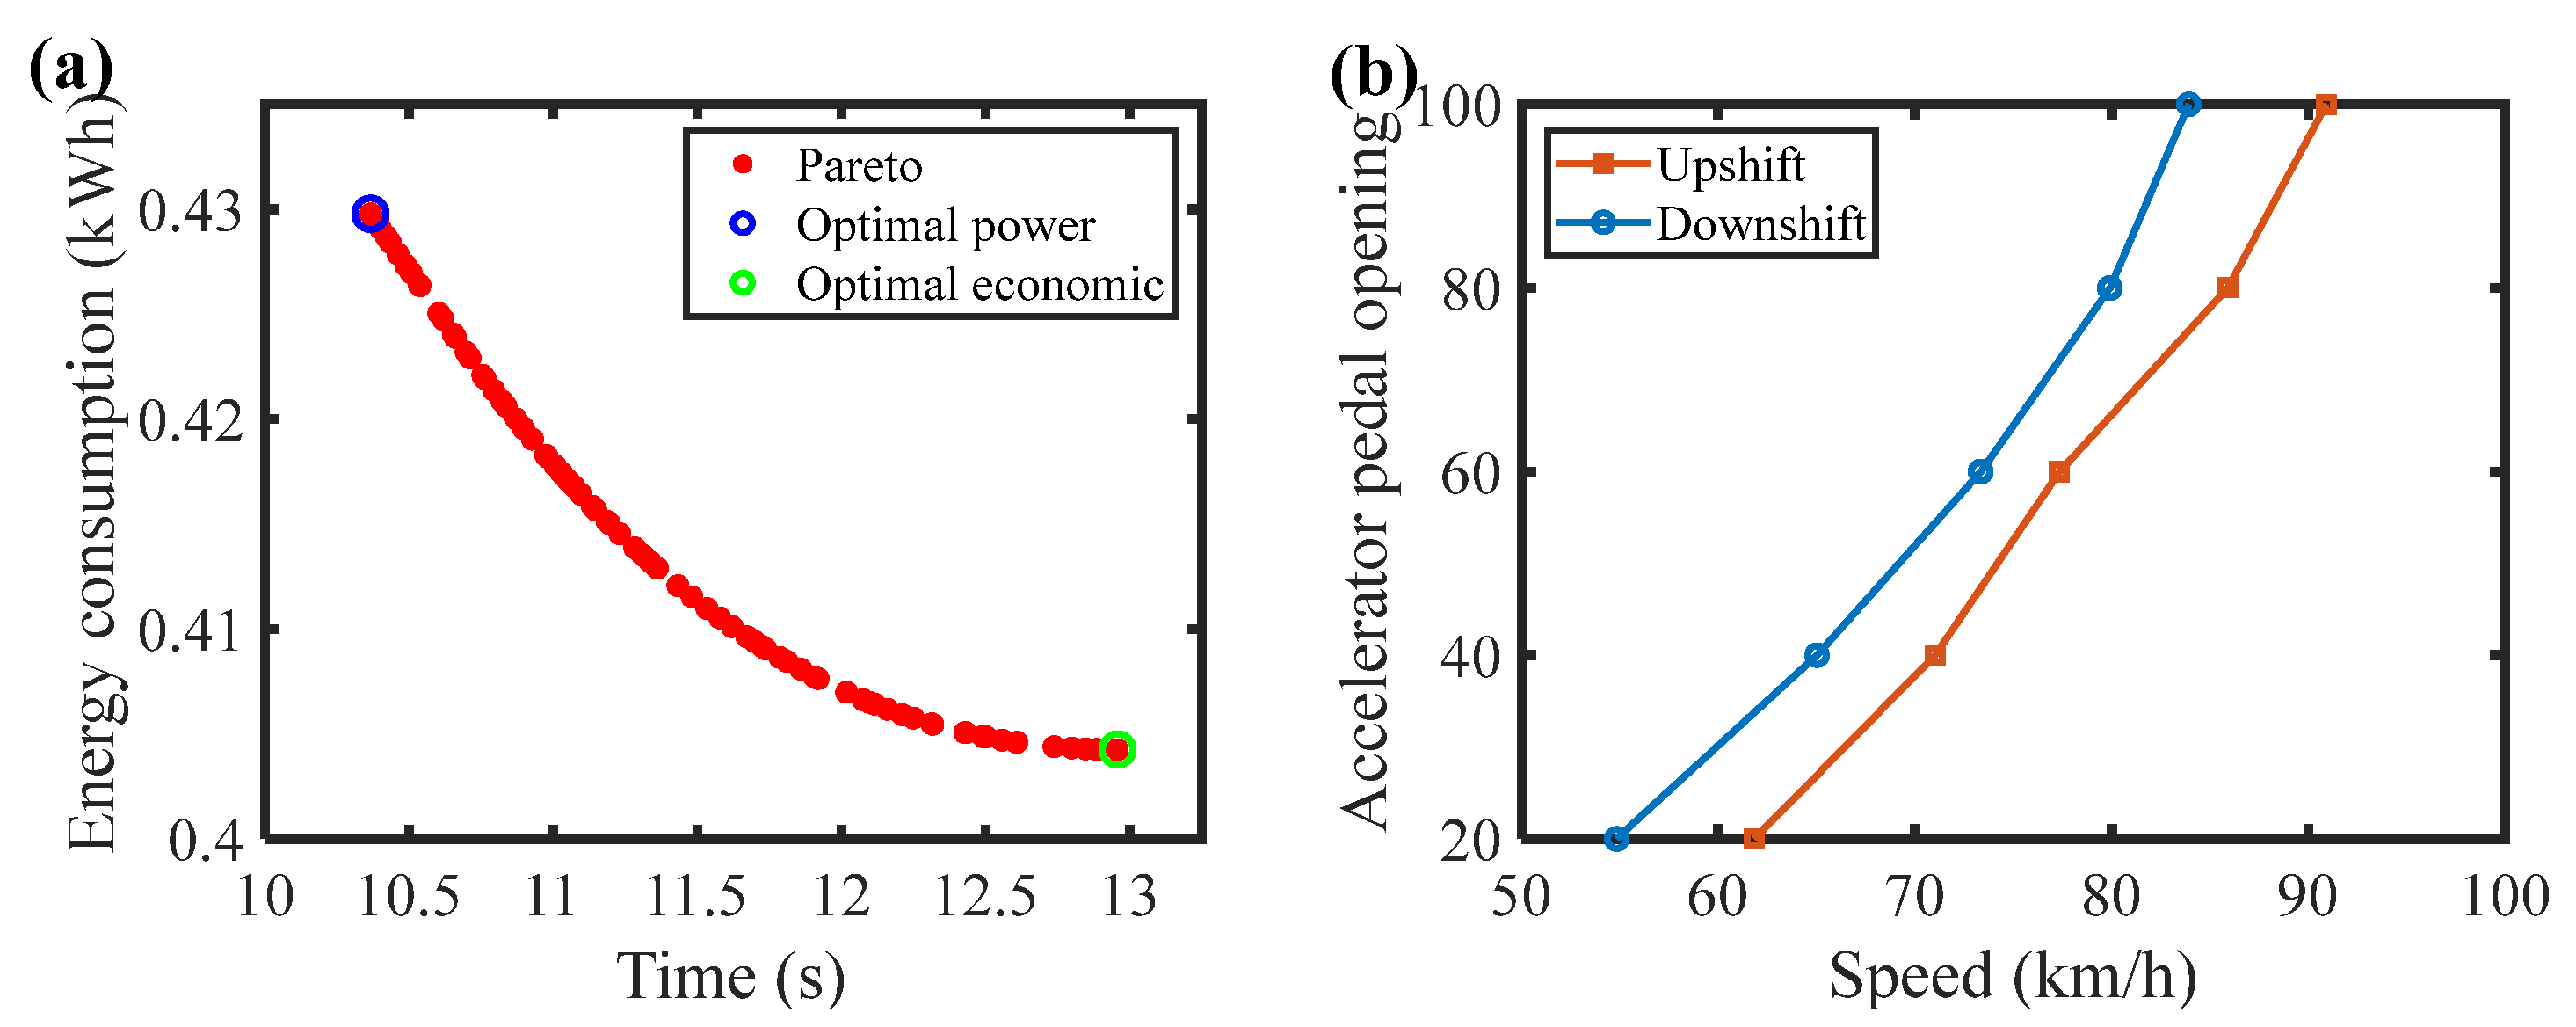
ke is increased proportionally. Taking the 80% pedal opening as an example, the Pareto front obtained by NSGA-II optimization is shown in
Figure 10a. The comprehensive shift curves obtained under five pedal openings are shown in
Figure 10b.
The obtained comprehensive shift curve is the upshift curve, while the downshift curve is set at a lower vehicle speed. At low pedal openings, a delayed downshift strategy is adopted, with downshift delay increasing with pedal opening. At high pedal openings, a convergent downshift strategy is adopted, with downshift delay decreasing with pedal opening, following the same principle as the rule-based strategy.
3.3. Hierarchical Fuzzy Adaptive Shift Strategy Matching
Single objective rule-based gear shift strategies cannot satisfy diverse performance requirements under varying driving conditions and driving styles, while comprehensive strategies cannot fully exploit the performance potential of the transmission. To improve the adaptability of shift strategies in two-speed electric drive systems under complex conditions, a hierarchical fuzzy evaluation and gear shift strategy matching approach based on transmission operating states is proposed.
The proposed method consists of three stages: driving demand evaluation, transmission behavior evaluation, and shift strategy matching. The driving demand evaluation layer assesses the current power demand based on pedal opening and vehicle acceleration. The transmission behavior evaluation layer identifies the transmission operating state based on vehicle speed, shift frequency, and gear duty ratio. Based on the outputs of these two layers, the strategy matching layer selects among C gear shift strategies. Unlike conventional strategies that rely only on vehicle speed and pedal opening, shift frequency and gear duty ratio are introduced to characterize transmission operating states. By jointly considering driving demand and transmission behavior, the proposed method improves the adaptability and rationality of shift strategy selection, enhances system stability, and maximizes the performance potential of the two-speed transmission.
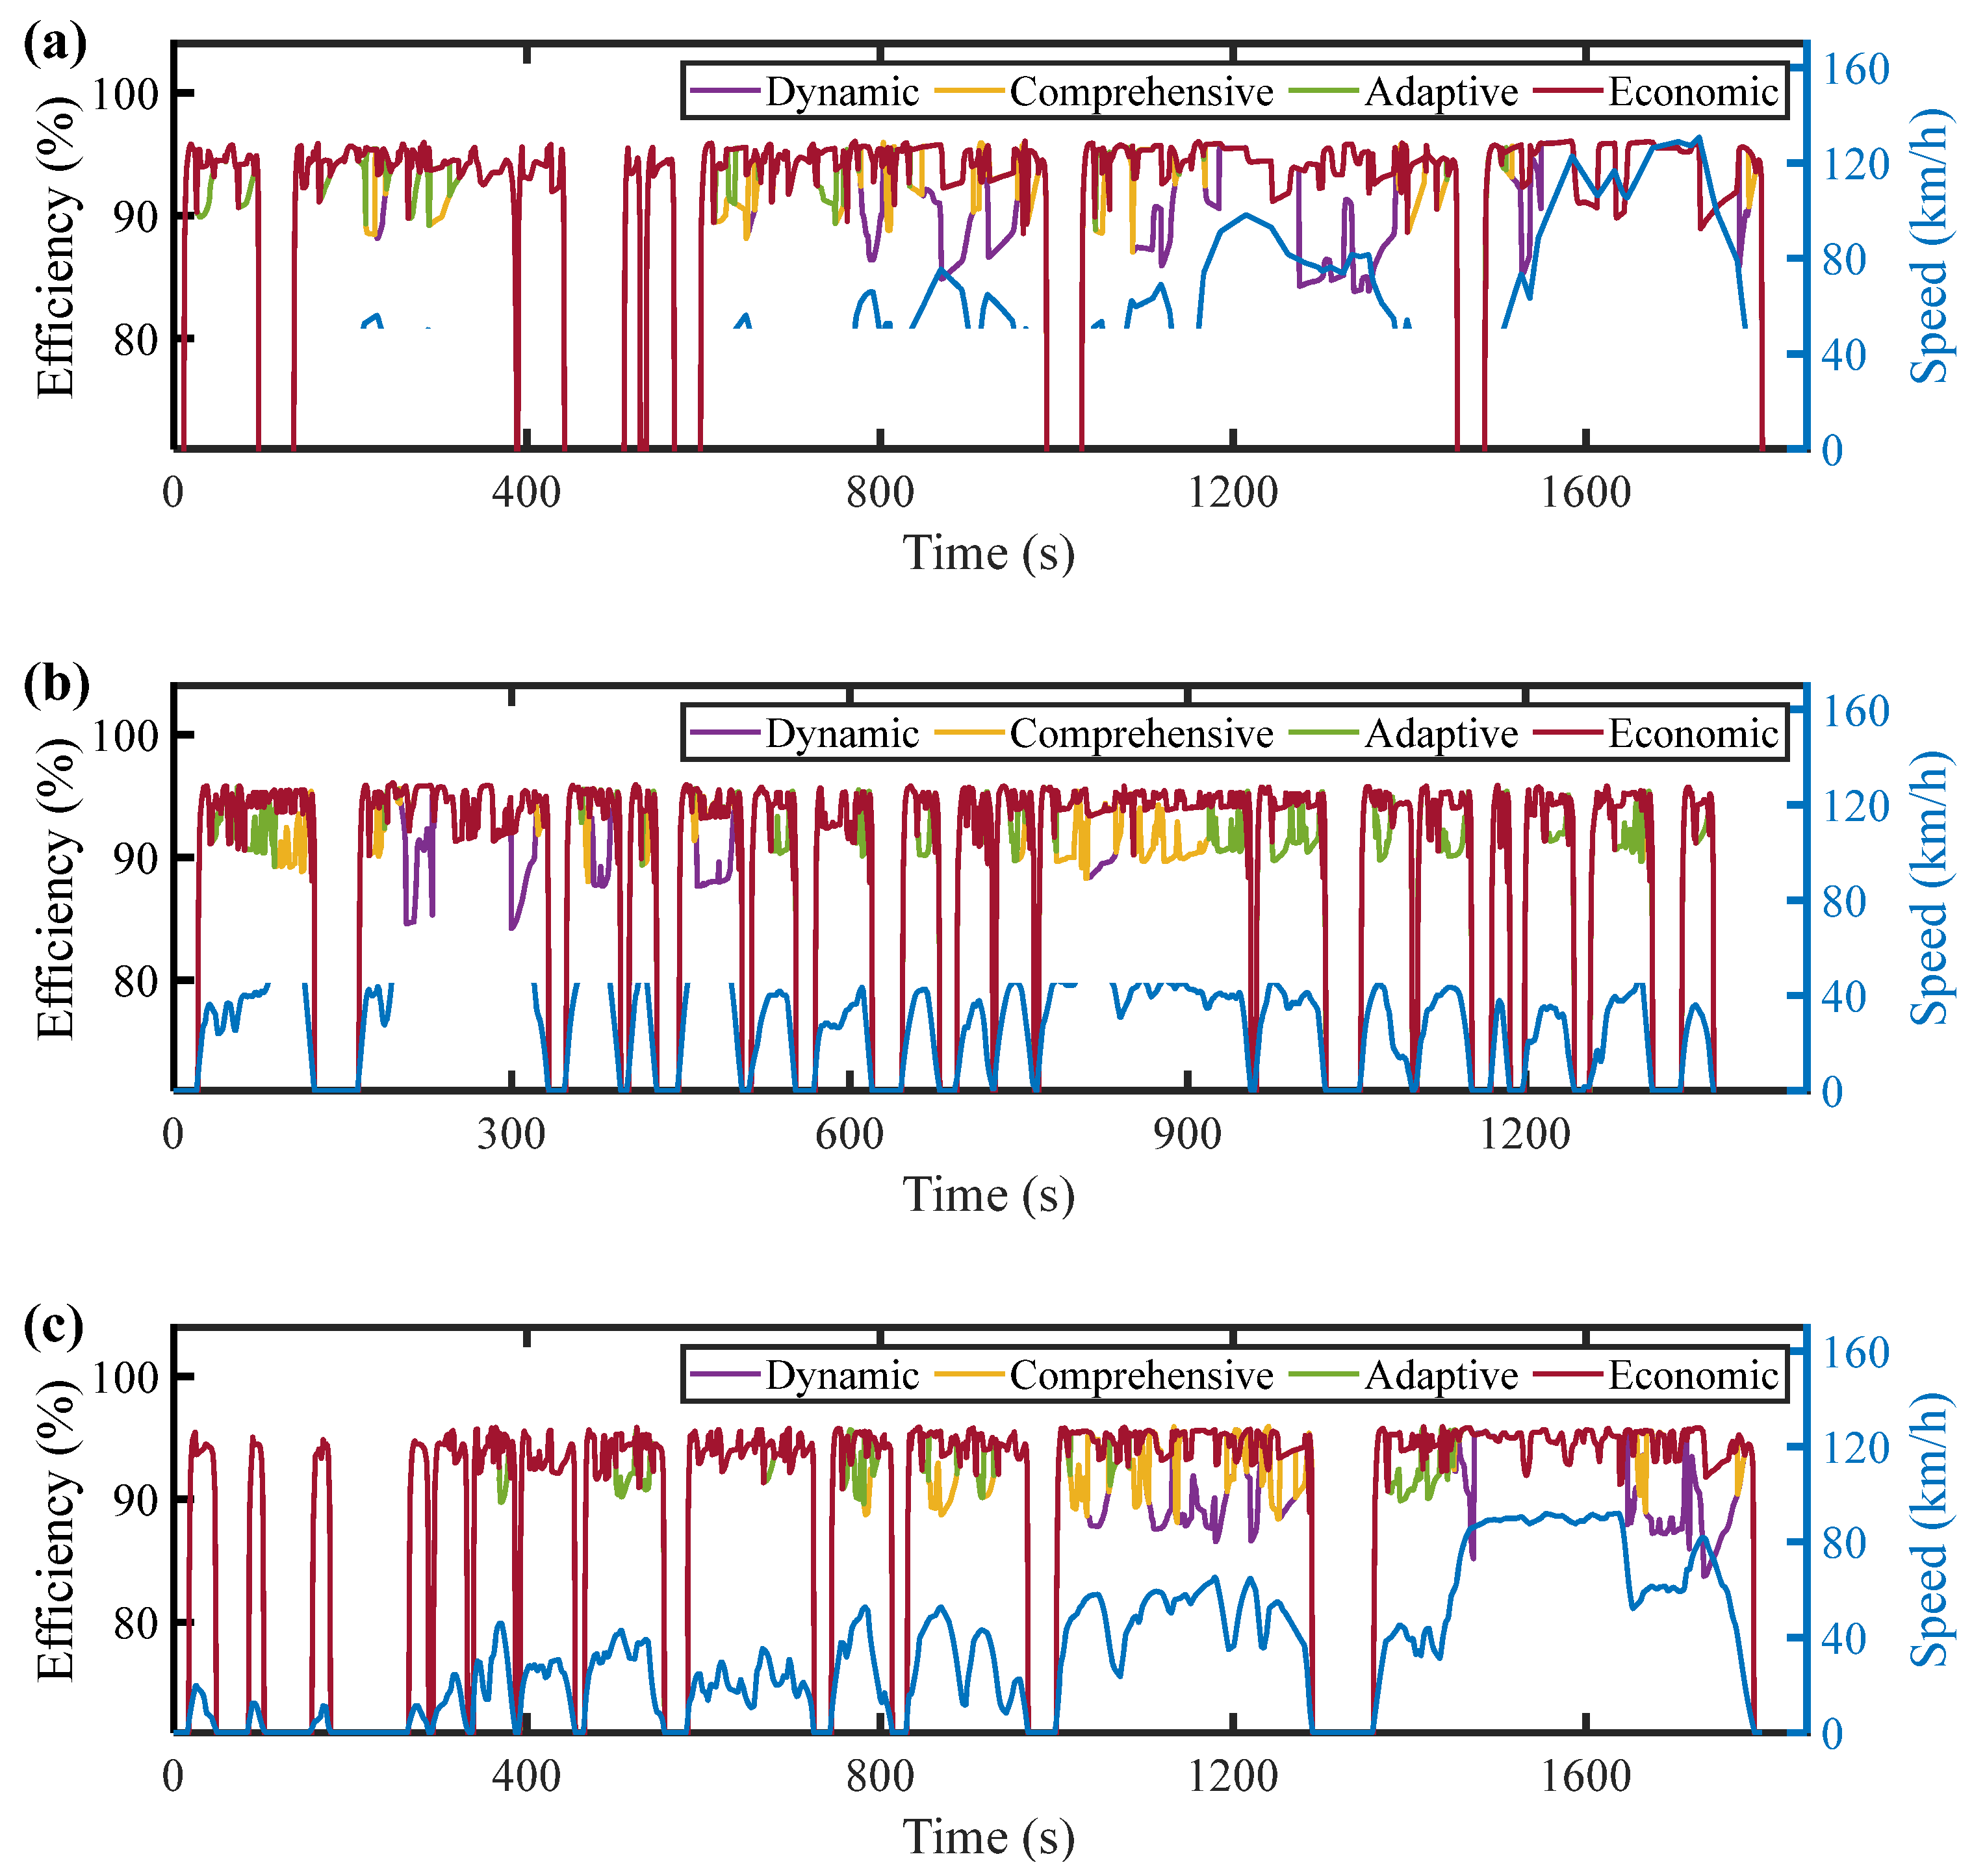
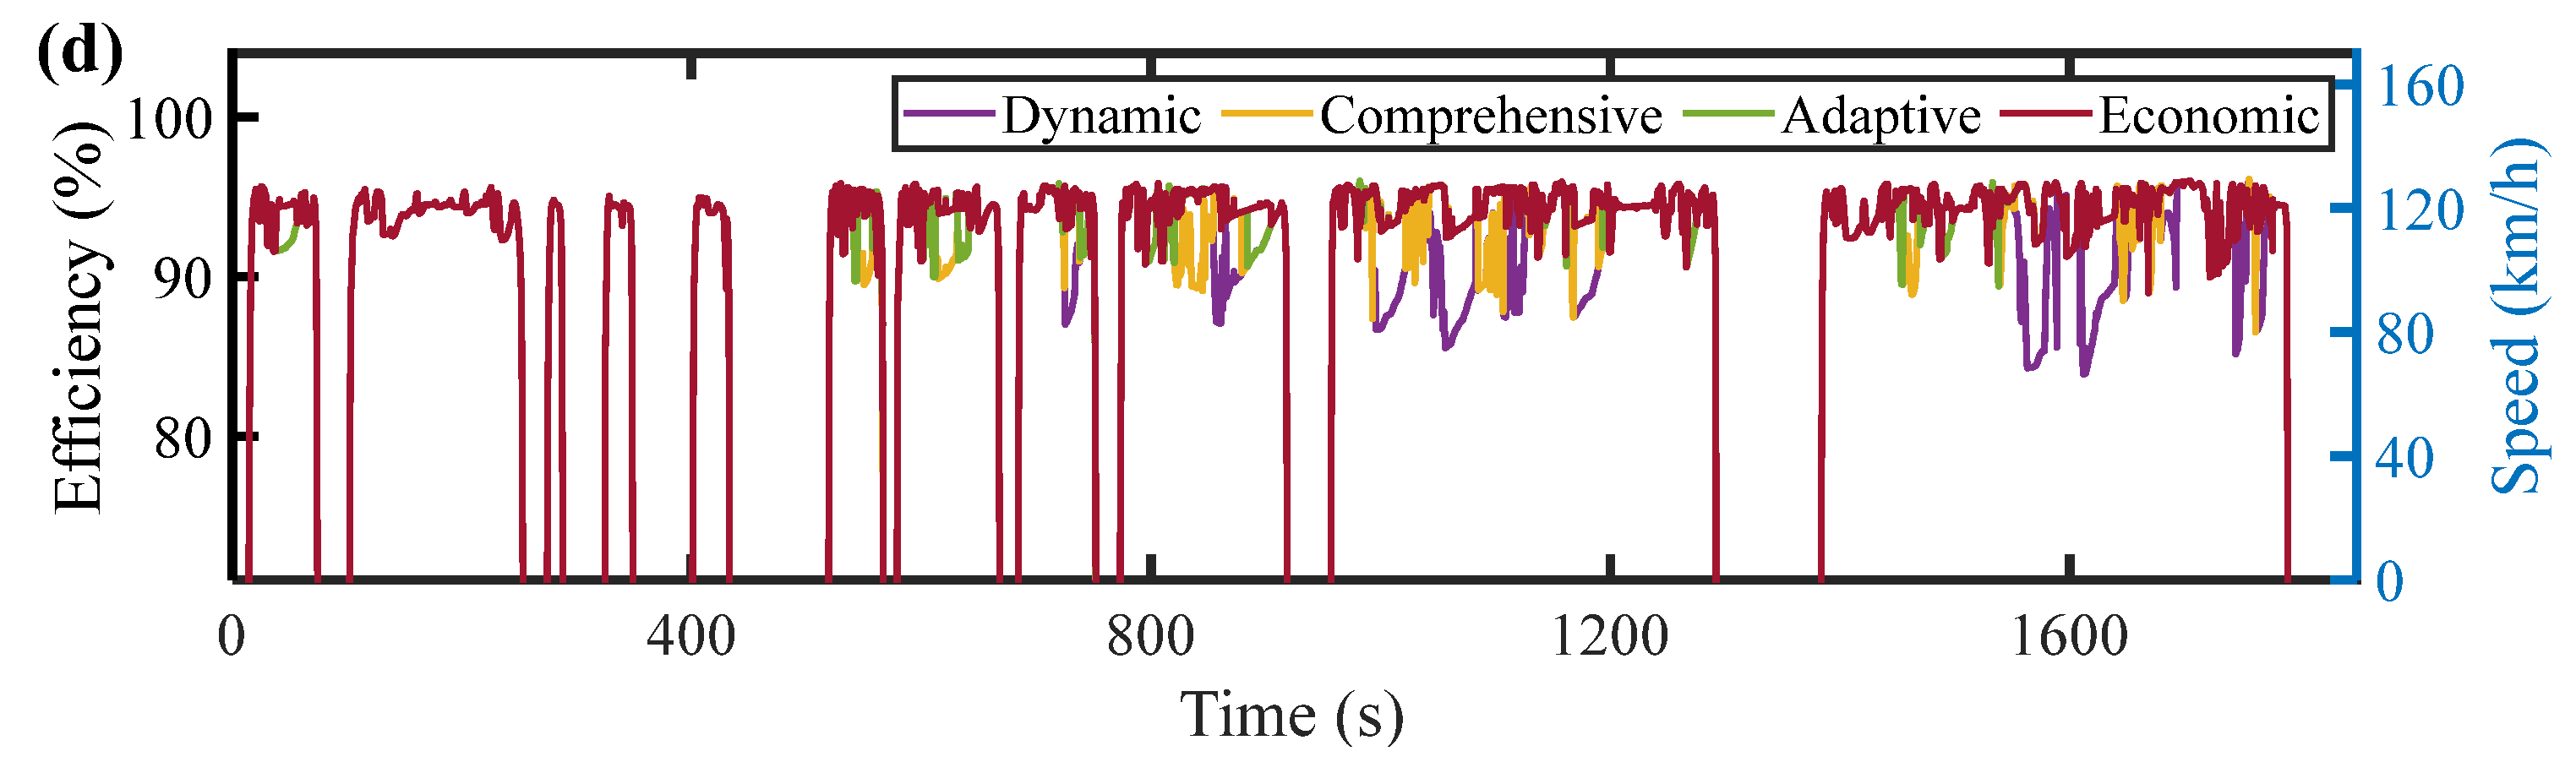
The total numbers of shifts under four standard driving cycles are evaluated for three different gear shift strategies, and the results are listed in
Table 5. As shown in
Table 5, the economic strategy results in the highest number of shifts under all driving cycles, whereas the dynamic strategy yields the fewest, with the comprehensive strategy lying in between. It should be noted that
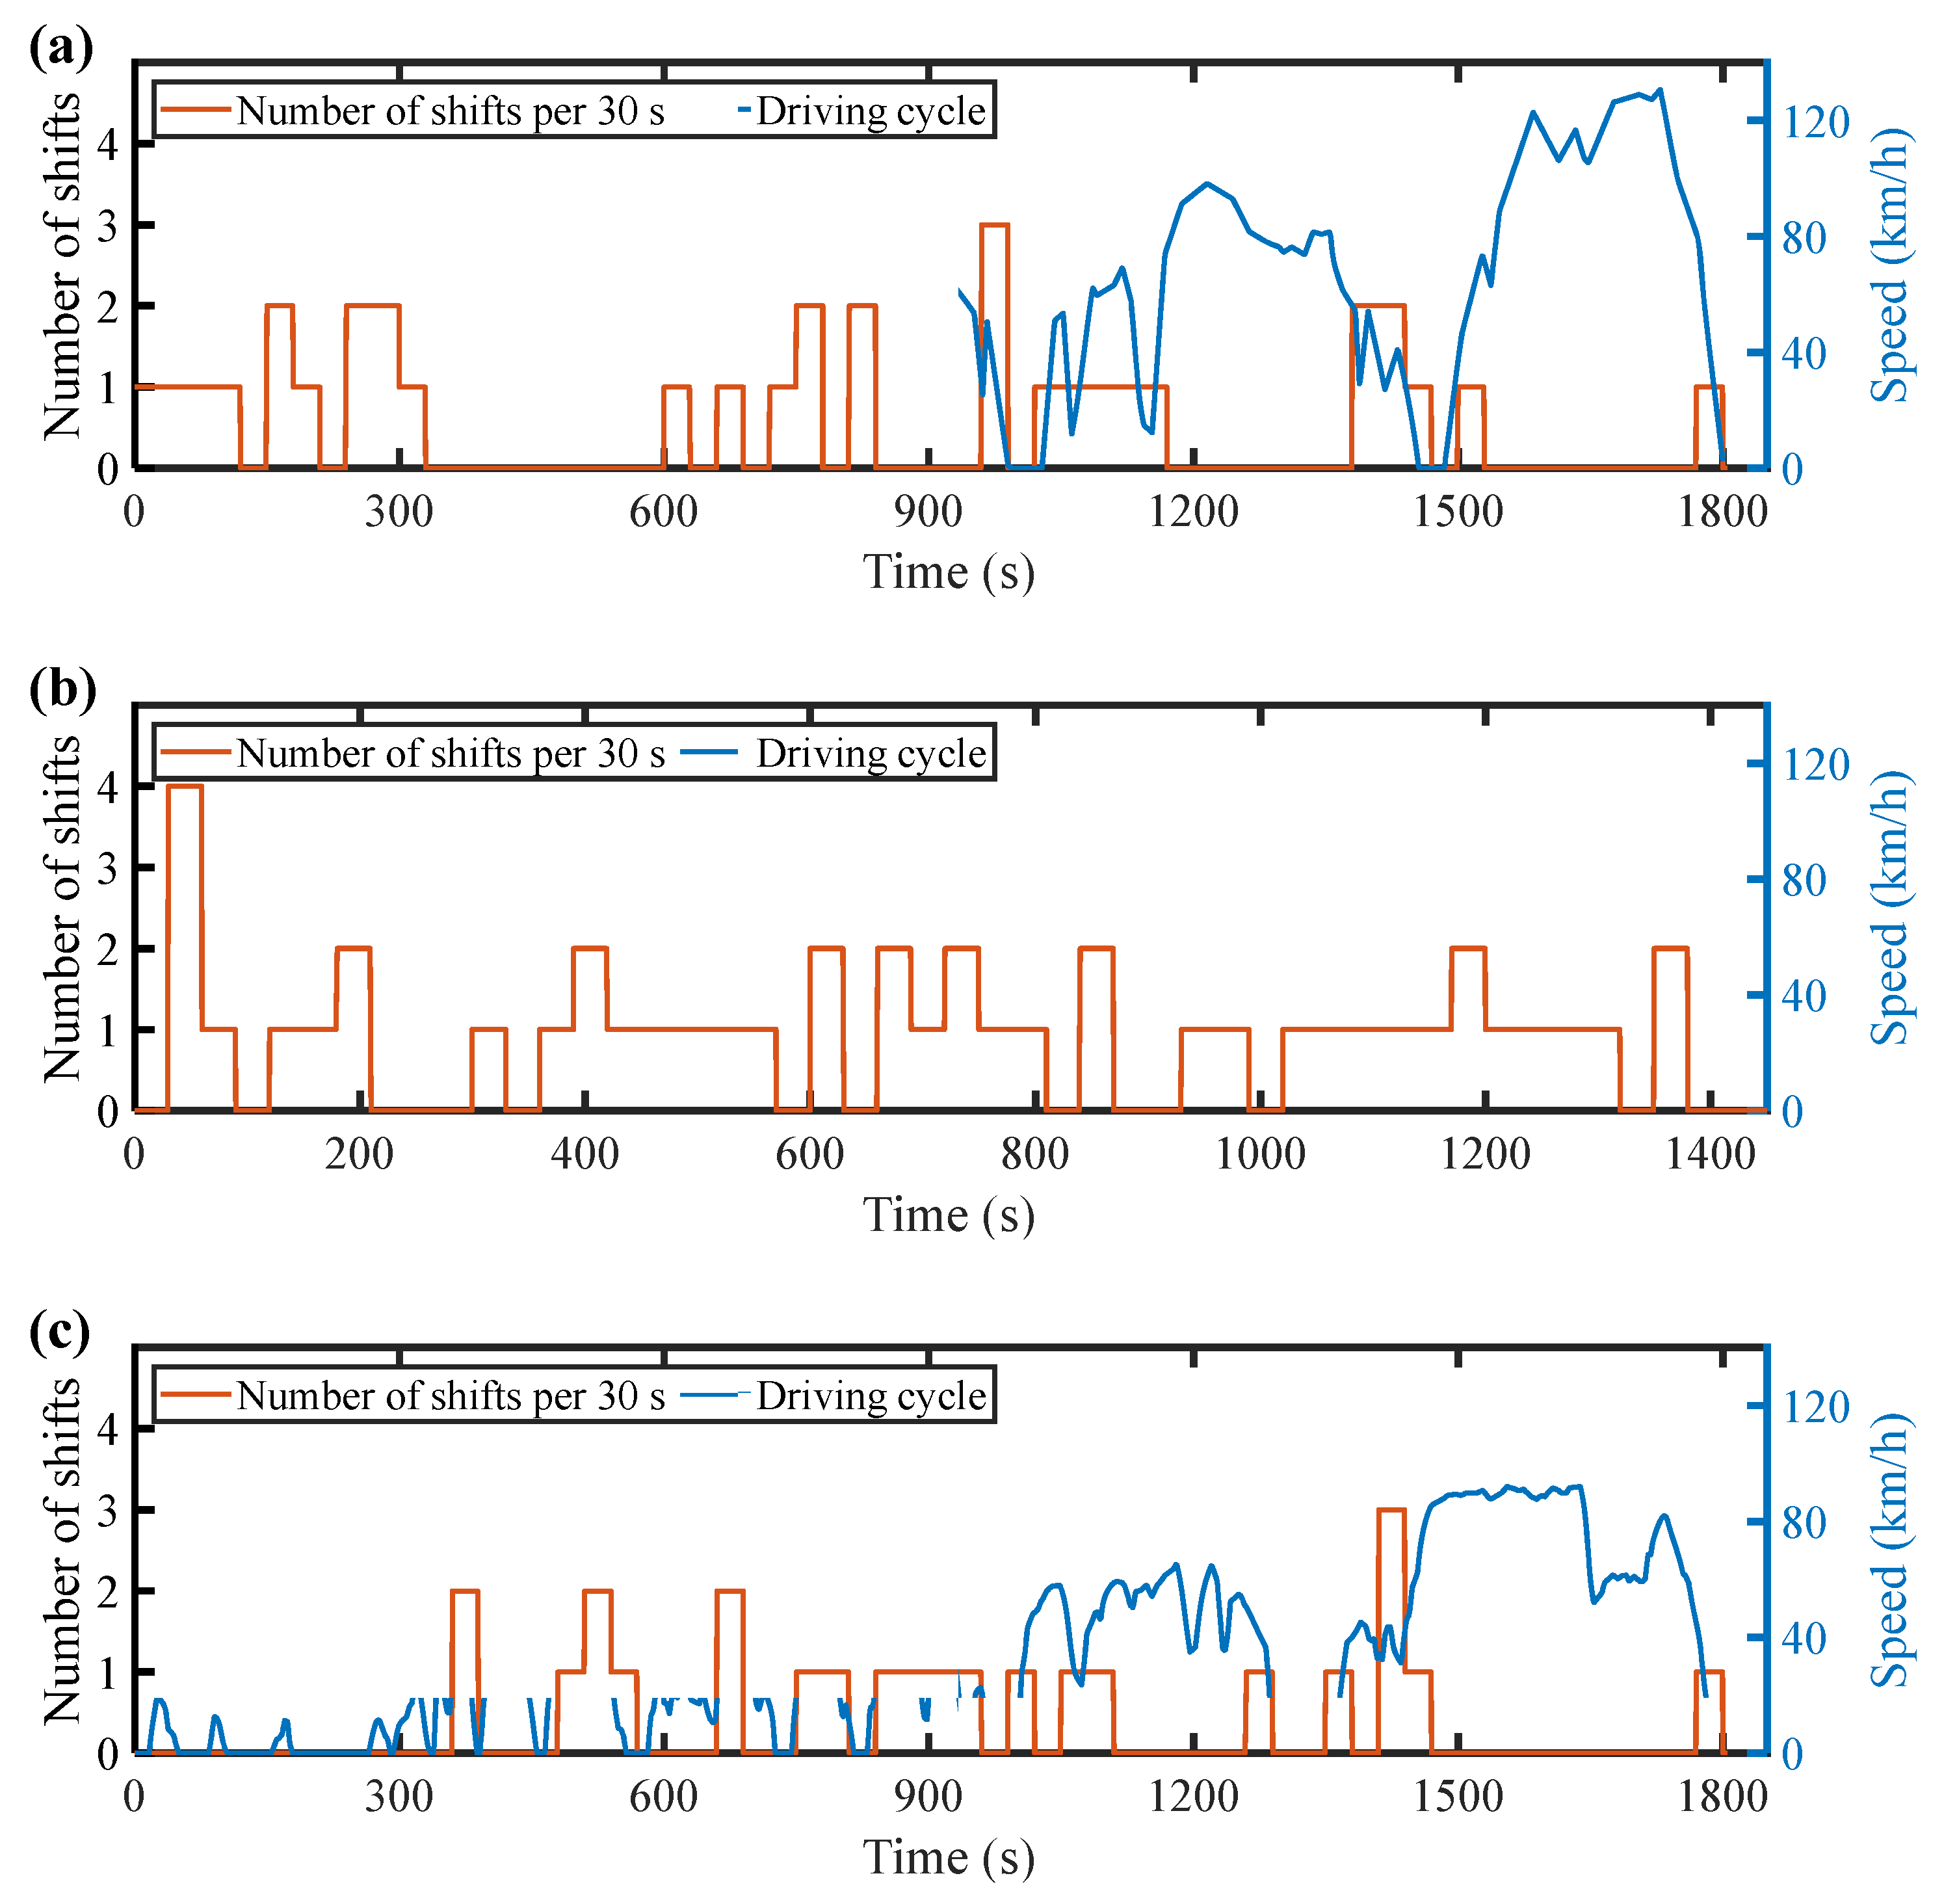
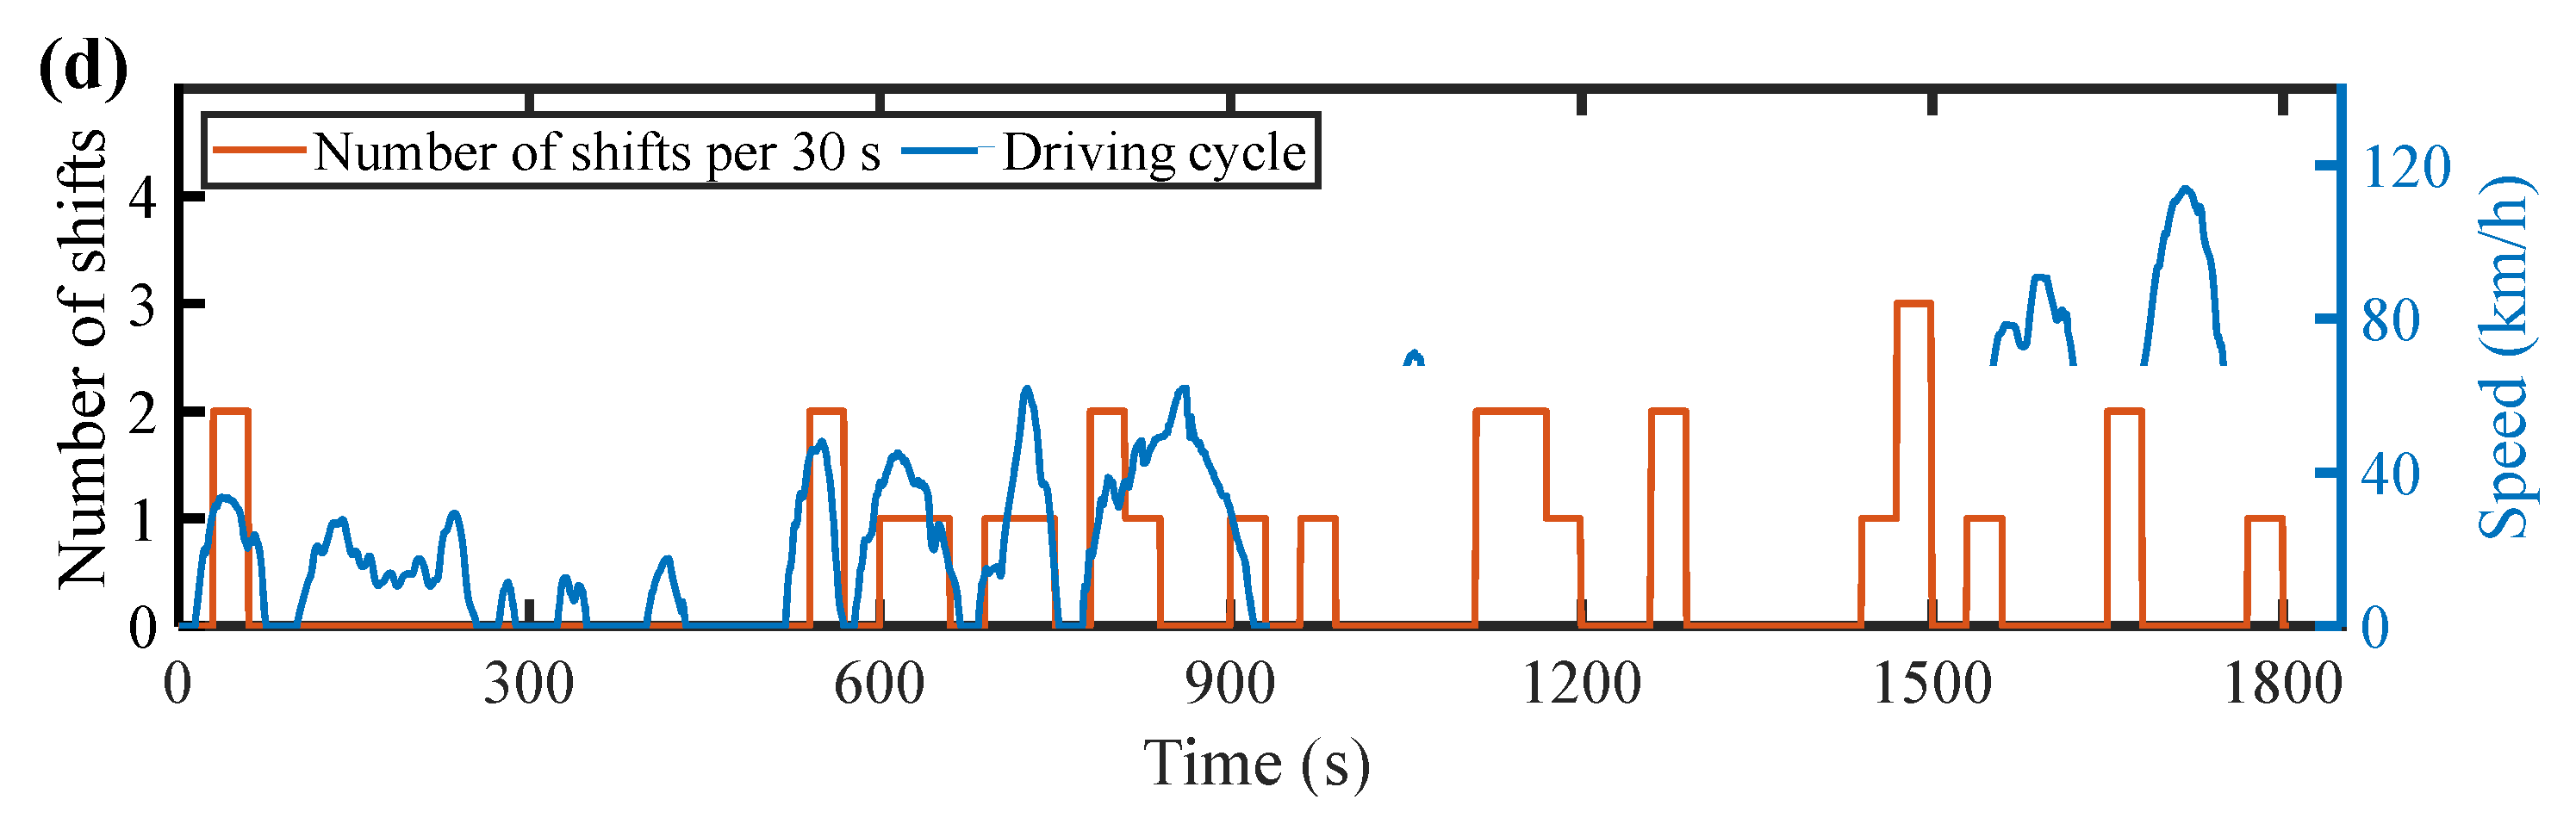
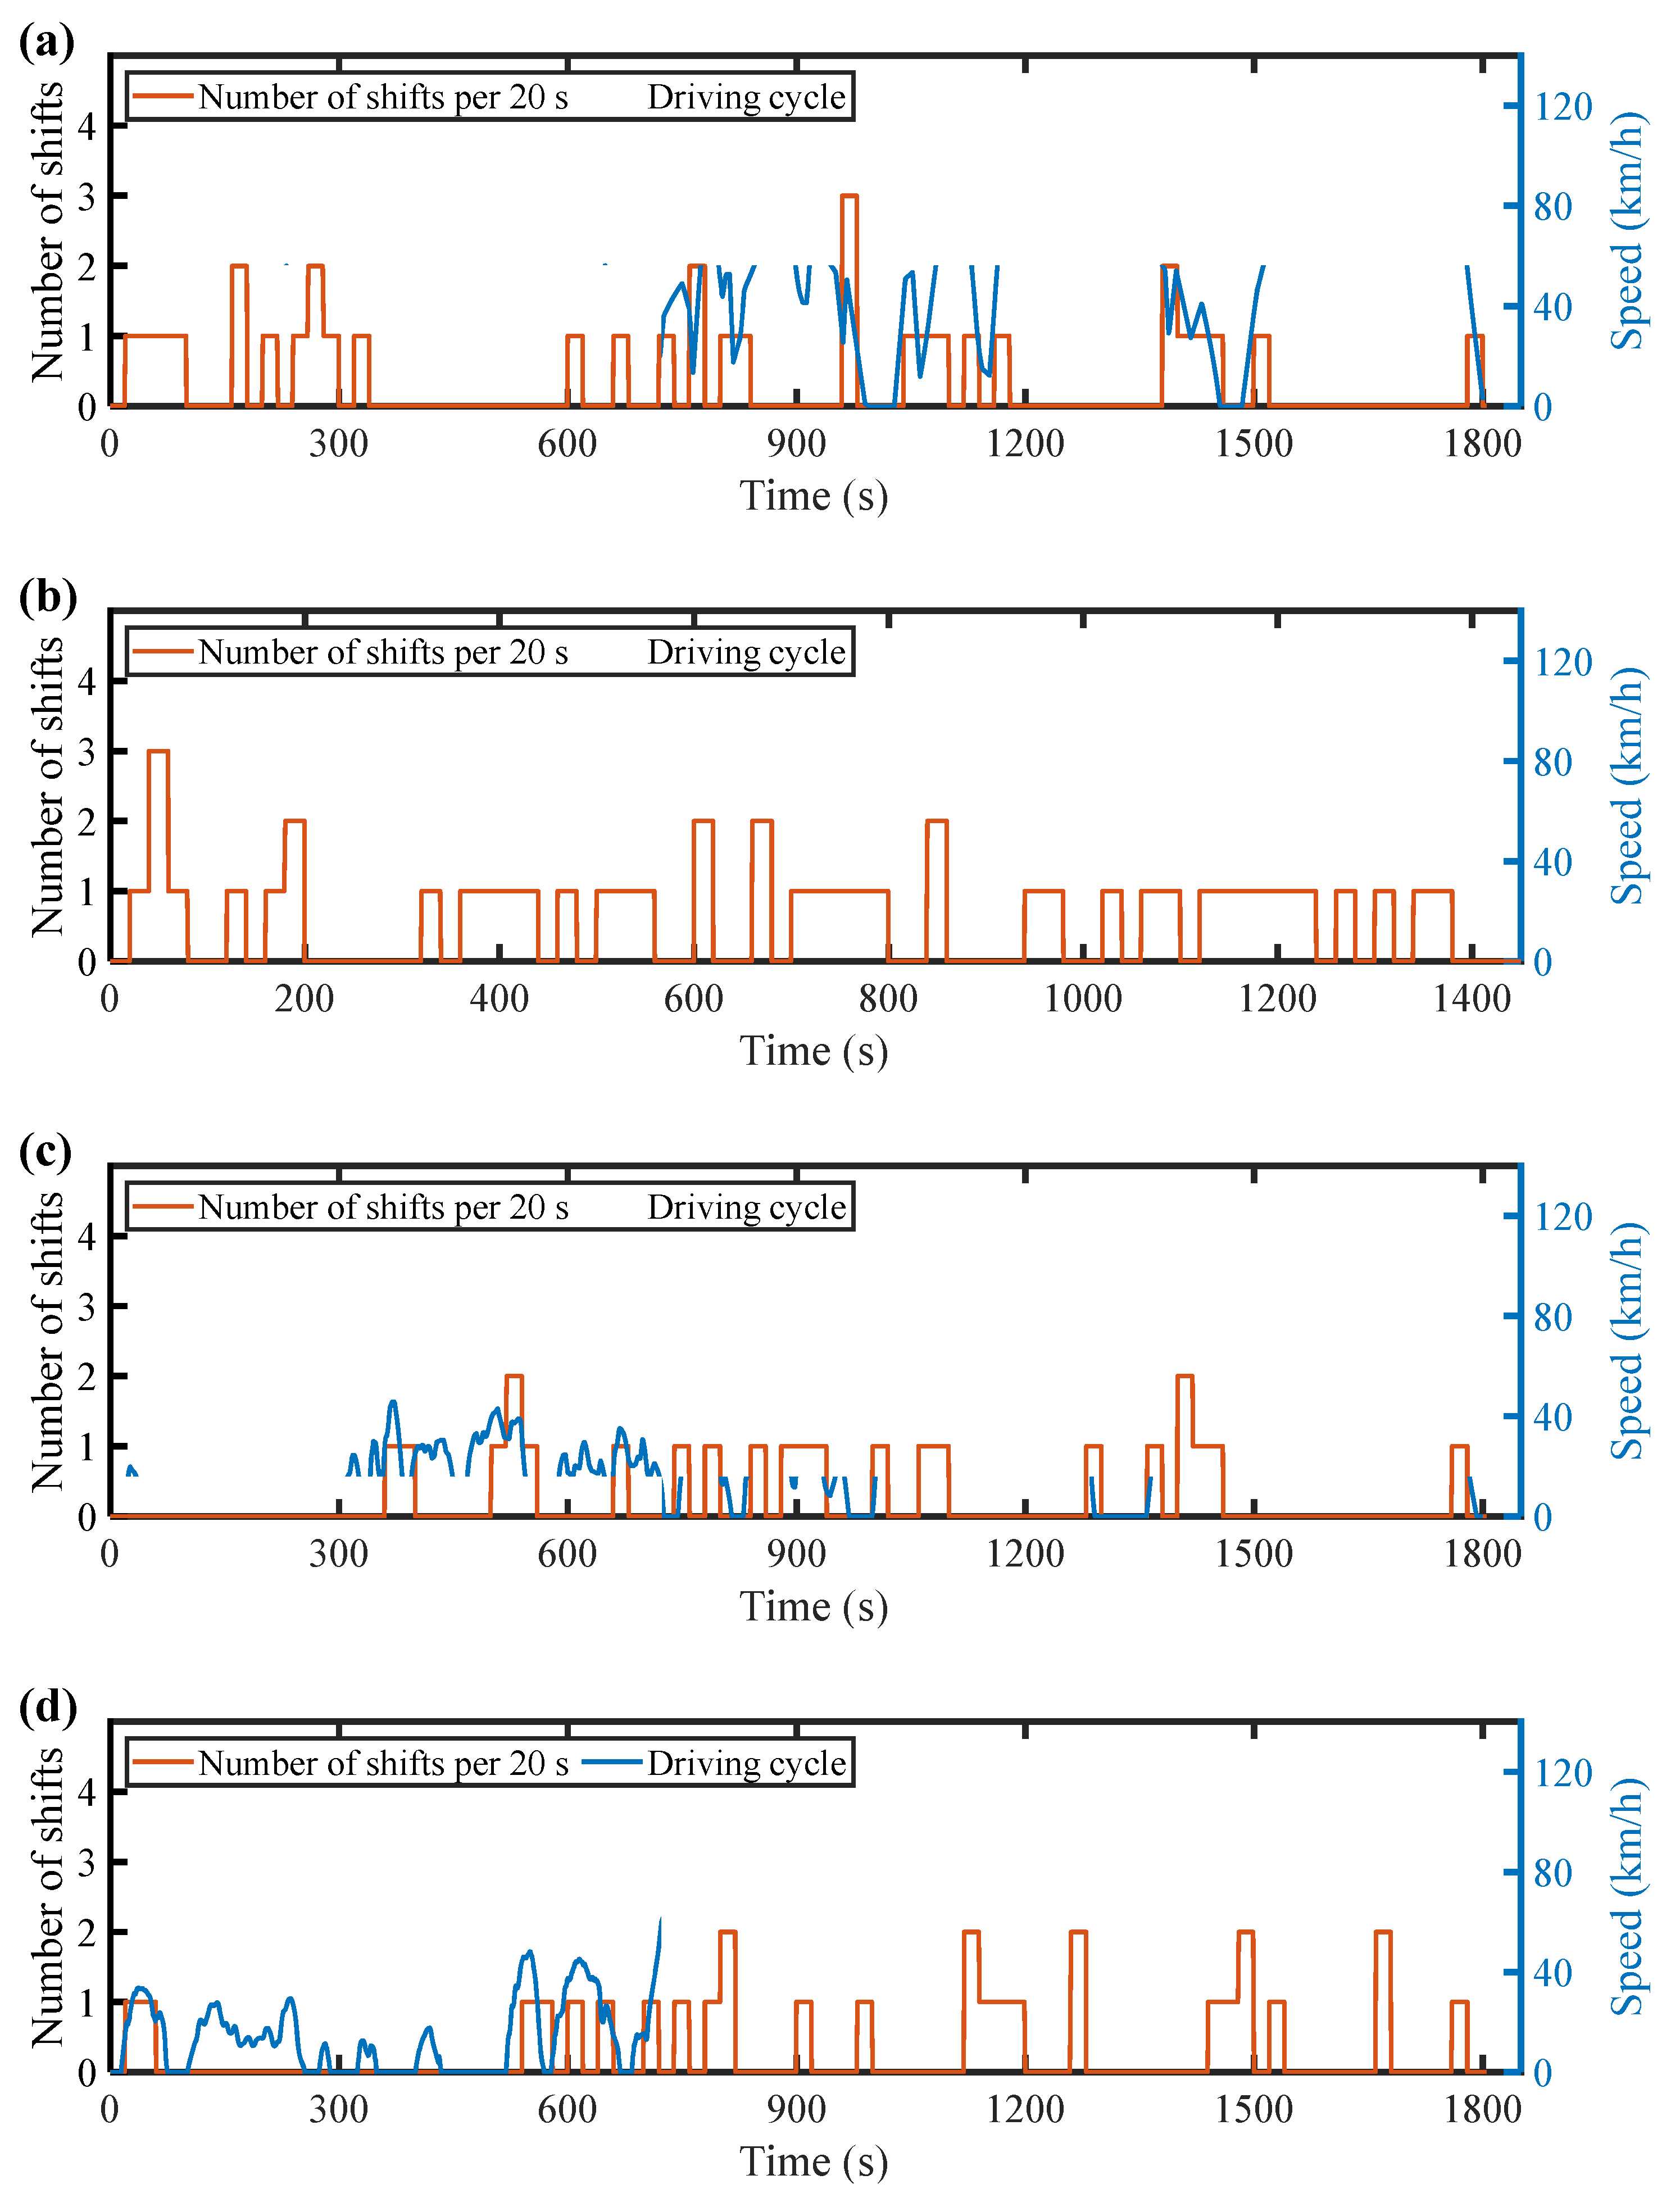
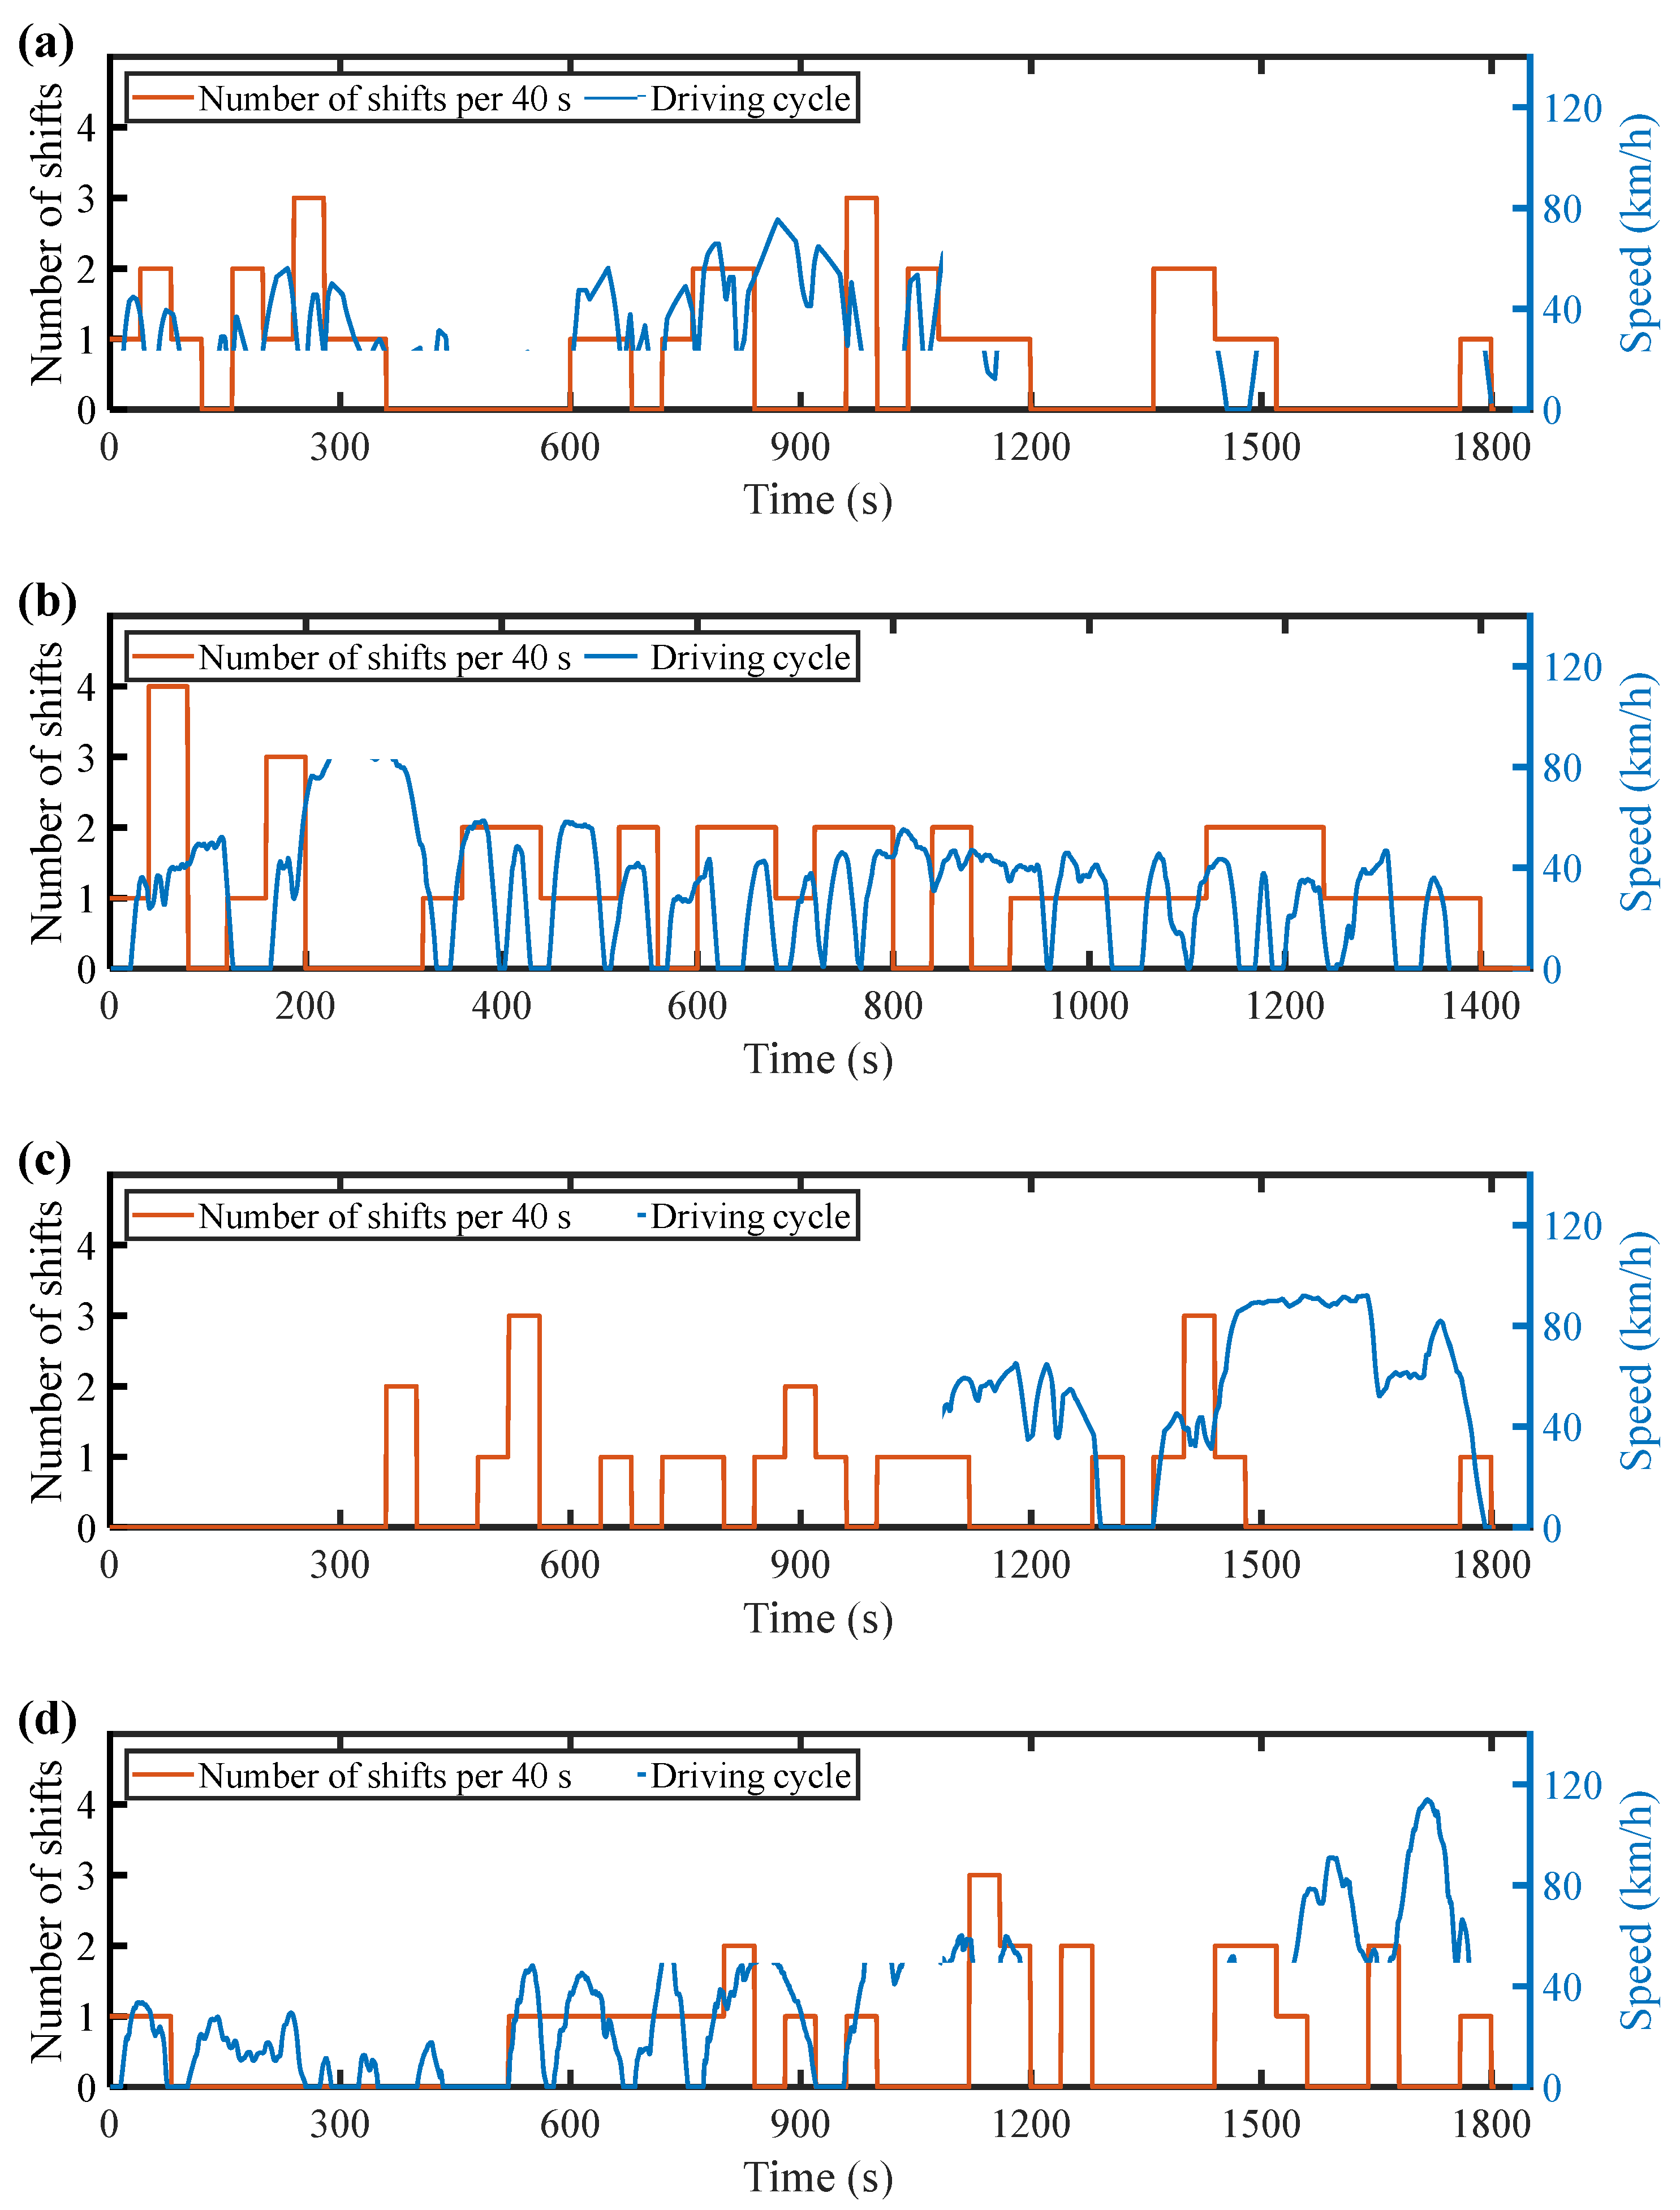
Table 5 reflects the average shift frequency over the entire driving cycle and is used to describe the overall difference in shifting behavior among different strategies. However, upper layer strategy selection requires a measure that can capture the real-time operating state of the system within a local time interval. Therefore, a local shift frequency within a rolling time window is introduced. In this study, the number of gear shifts within every 30 s is defined as the shift frequency
fz, and the proportion of first gear operating time within every 30 s is defined as the gear duty ratio
dz. The rolling window length is an important calibration parameter because it affects both the characterization resolution and real-time responsiveness of transmission behavior evaluation. To examine its influence, window sizes of 20 s, 30 s, and 40 s were compared, as shown in
Figure 11,
Figure 12 and
Figure 13. The 20 s window provides a shorter update interval, but the number of gear shift events within each window is relatively small, which limits the resolution of shift frequency evaluation and makes it difficult to characterize local shifting behavior in detail. When the window length is increased to 40 s, the shift frequency distribution is similar to that obtained with the 30 s window, indicating that further increasing the window length provides limited additional information for transmission behavior characterization. However, a longer window reduces the update sensitivity of the evaluated transmission state. Therefore, the 30 s window was selected as a compromise, because it contains sufficient shift events to characterize local transmission behavior while maintaining a relatively short update interval for real-time strategy matching.
The first layer is the driving demand evaluator, which assesses the vehicle power demand based on the current driving input. Pedal opening
pel and vehicle acceleration
a are selected as the inputs, where
pel serves as the primary indicator and
a as the auxiliary indicator to distinguish different driving conditions. The ranges of
pel and
a are set to 0 to 1 and 0 to 3 m/s
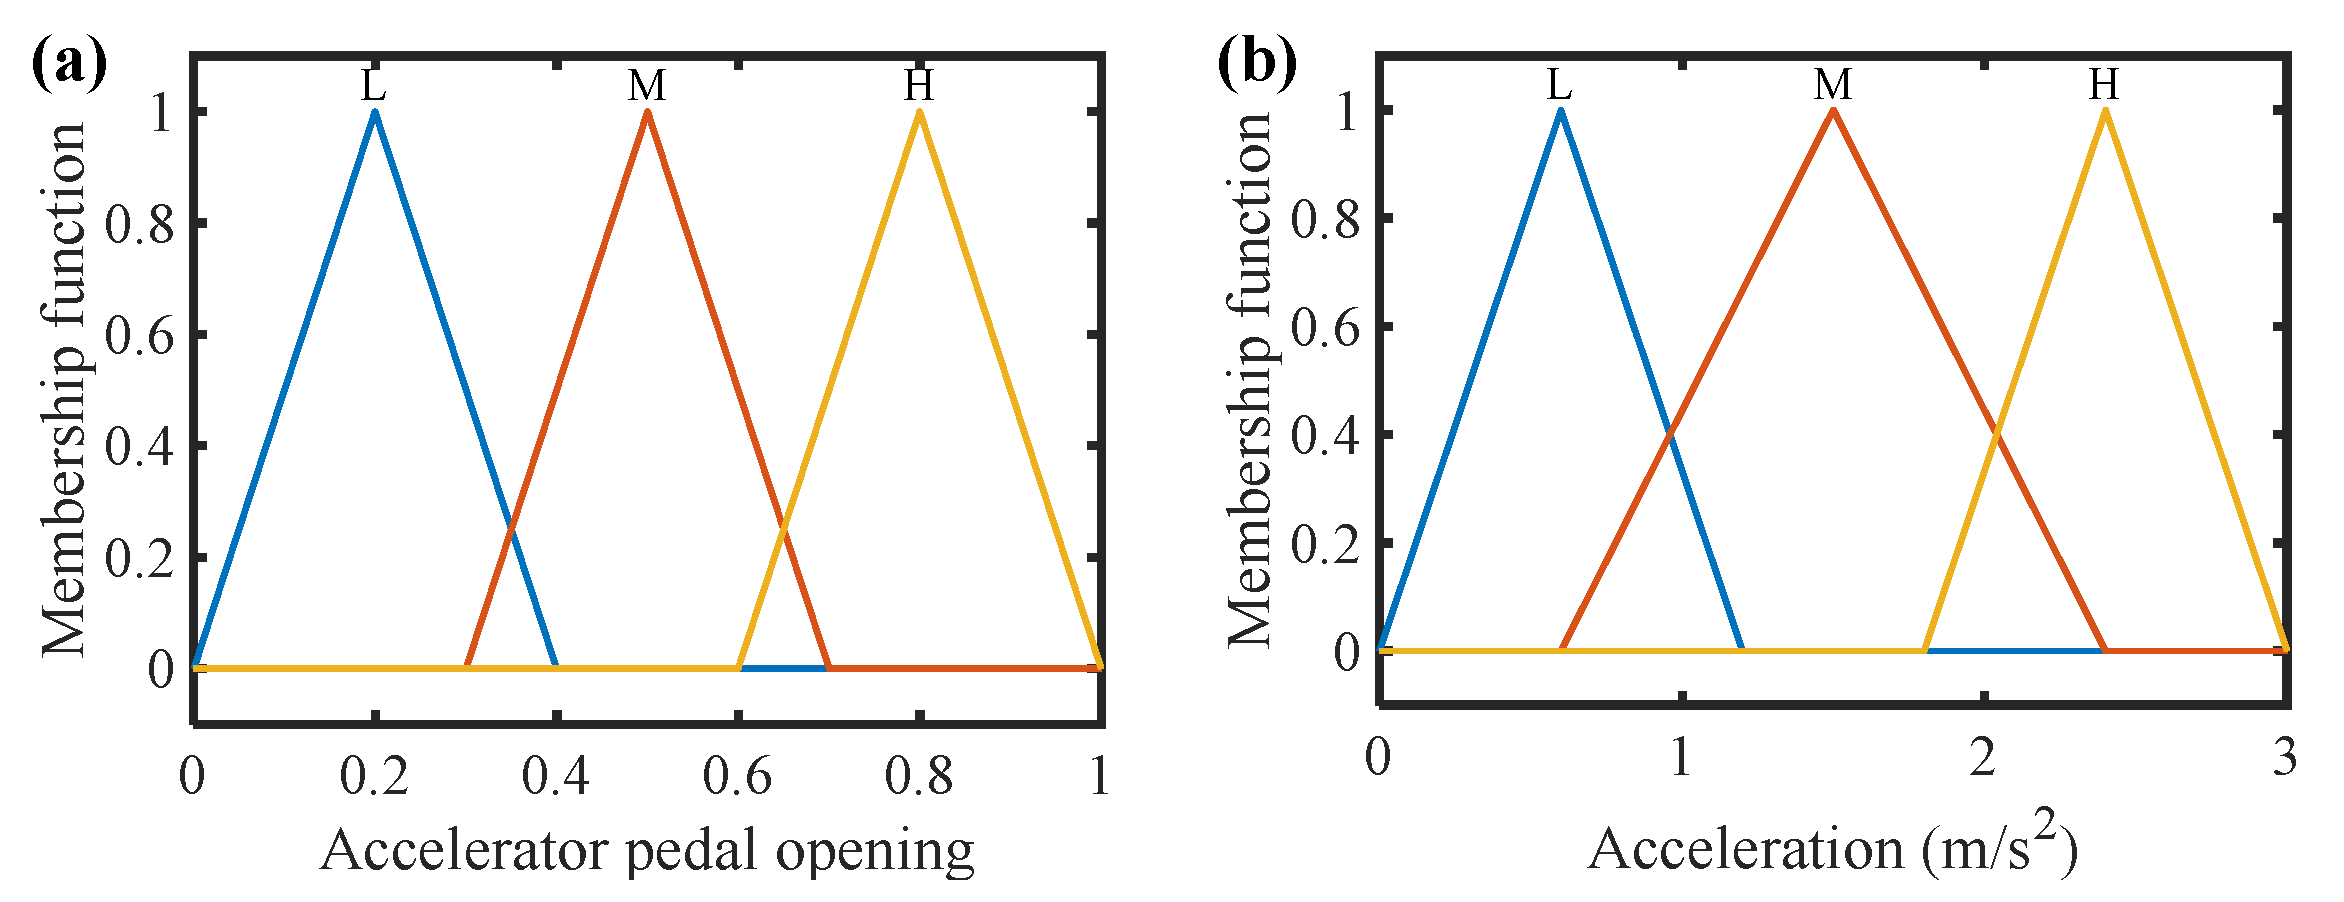
2, respectively, and both are divided into three fuzzy sets: low, medium, and high. Considering computational cost and real-time requirements, triangular membership functions are adopted because of their simple structure, low computational cost, and clear interpretability, as shown in
Figure 14. The breakpoints were determined based on the variable ranges observed in typical driving cycles and further adjusted through engineering calibration to ensure smooth transitions among low, medium, and high states. The output variable is
D, representing the power demand level, which is classified into three states: low, medium, and high. This layer converts continuous driving inputs into discrete demand states for subsequent strategy matching. The fuzzy logic rules are listed in
Table 6.
The second layer is the transmission behavior evaluator, which assesses the transmission operating state based on recent operating characteristics. Vehicle speed
v, shift frequency
fz, and gear duty ratio
dz are selected as inputs, where
fz and
dz are calculated over a 30 s rolling time window. As shown in
Figure 11, the shift frequency of the economic strategy is mostly within 1 or 2 shifts per 30 s and occasionally reaches 3 or 4. Accordingly, the ranges of
fz,
dz, and
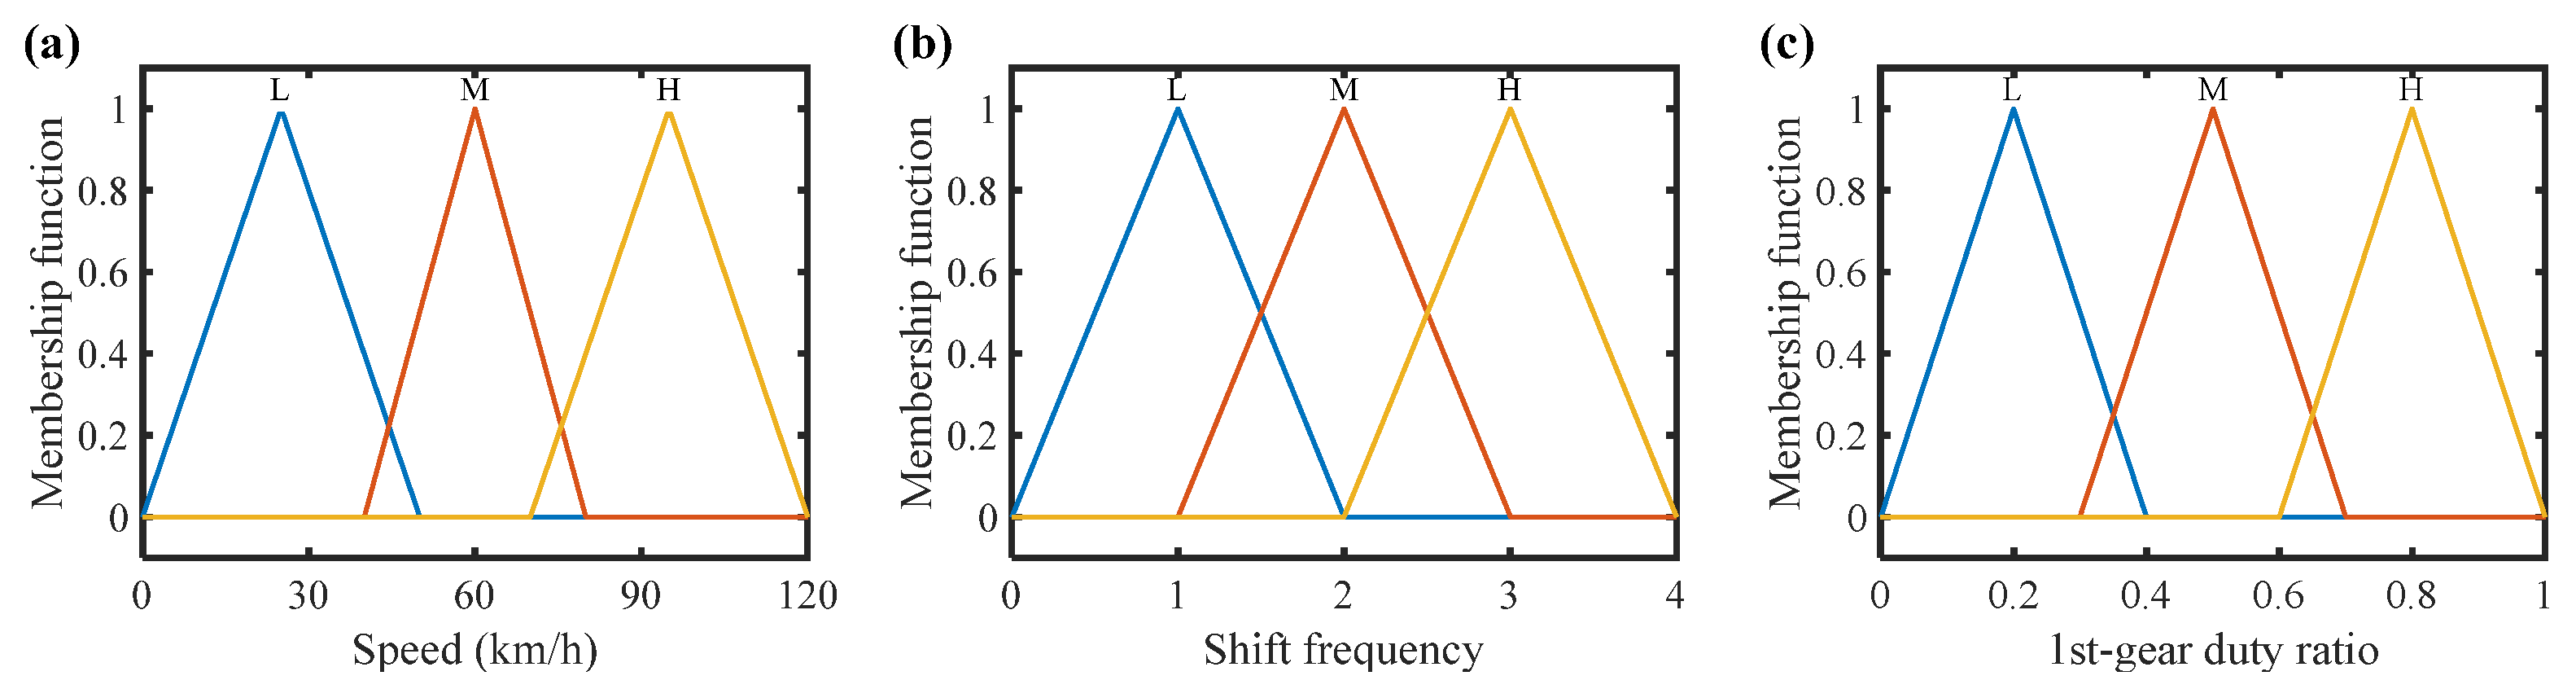
v are set to 0 to 4 shifts per 30 s, 0 to 1, and 0 to 120 km/h, respectively, and each variable is divided into three fuzzy sets (low, medium, and high) using triangular membership functions, as shown in
Figure 15.
A high shift frequency indicates instability in 2DCT operation, while a mismatch between gear usage and vehicle speed suggests abnormal gear utilization. In contrast, a low shift frequency together with generally matched gear usage indicates a stable 2DCT operating state. Based on these principles, the output variable of the transmission behavior evaluator is defined as
B, which represents the transmission behavior state and is classified into three states: Stable, Moderate, and Unstable. This layer converts continuous operating behavior information into discrete state evaluations for subsequent strategy matching. By considering vehicle speed, shift frequency, and gear duty ratio, it evaluates the rationality of shifting behavior based on transmission operating characteristics. The fuzzy logic rules are listed in
Table 7,
Table 8 and
Table 9.
When the shift frequency is high (H), the system tends to be unstable. When the shift frequency is medium (M), the transmission operating state is mainly determined by the consistency between vehicle speed and gear usage. When the shift frequency is low (L), the system tends to be stable, although the operating state still depends on the consistency between vehicle speed and gear usage. The fuzzy rules of the transmission behavior evaluator were formulated according to the physical meanings of shift frequency, vehicle speed, and gear duty ratio. Shift frequency was given priority because frequent gear changes within a short time window indicate repeated shift boundary crossing and potential gear shift cycling; therefore, a high shift frequency is directly classified as an unstable state. When the shift frequency is medium or low, the consistency between vehicle speed and gear duty ratio is considered. A high first gear duty ratio is reasonable at low speeds but may indicate delayed upshifting or inefficient gear usage at high speeds, whereas a low first gear duty ratio at low speeds may indicate premature upshifting. In the medium-speed region, both gears may be acceptable depending on driving demand.
The third layer is the gear shift strategy selector, which selects among the economic, comprehensive, and dynamic strategies based on the driving demand state
D and transmission behavior state
B. When the power demand is low and the transmission is stable, the economic strategy is selected; when the demand is high and the transmission is stable, the dynamic strategy is selected; when the transmission is unstable, the comprehensive strategy is adopted to reduce frequent shifting and improve stability. This layer configures the gear shift strategy rather than determining shift timing, providing a basis for subsequent shift threshold correction. The matching rules are listed in
Table 10.
3.4. Gear Shift Frequency Fuzzy Correction
Due to the large gear ratio difference between the two gears of a 2DCT in BEVs, significant clutch speed differences during shifting lead to severe clutch slip. Frequent and unnecessary shifting reduces transmission reliability and service life, and increases shift jerk, thereby degrading driving comfort. To address this issue, a fuzzy logic-based online shift speed correction strategy is proposed to regulate the shift frequency of the adaptive gear shift strategy.
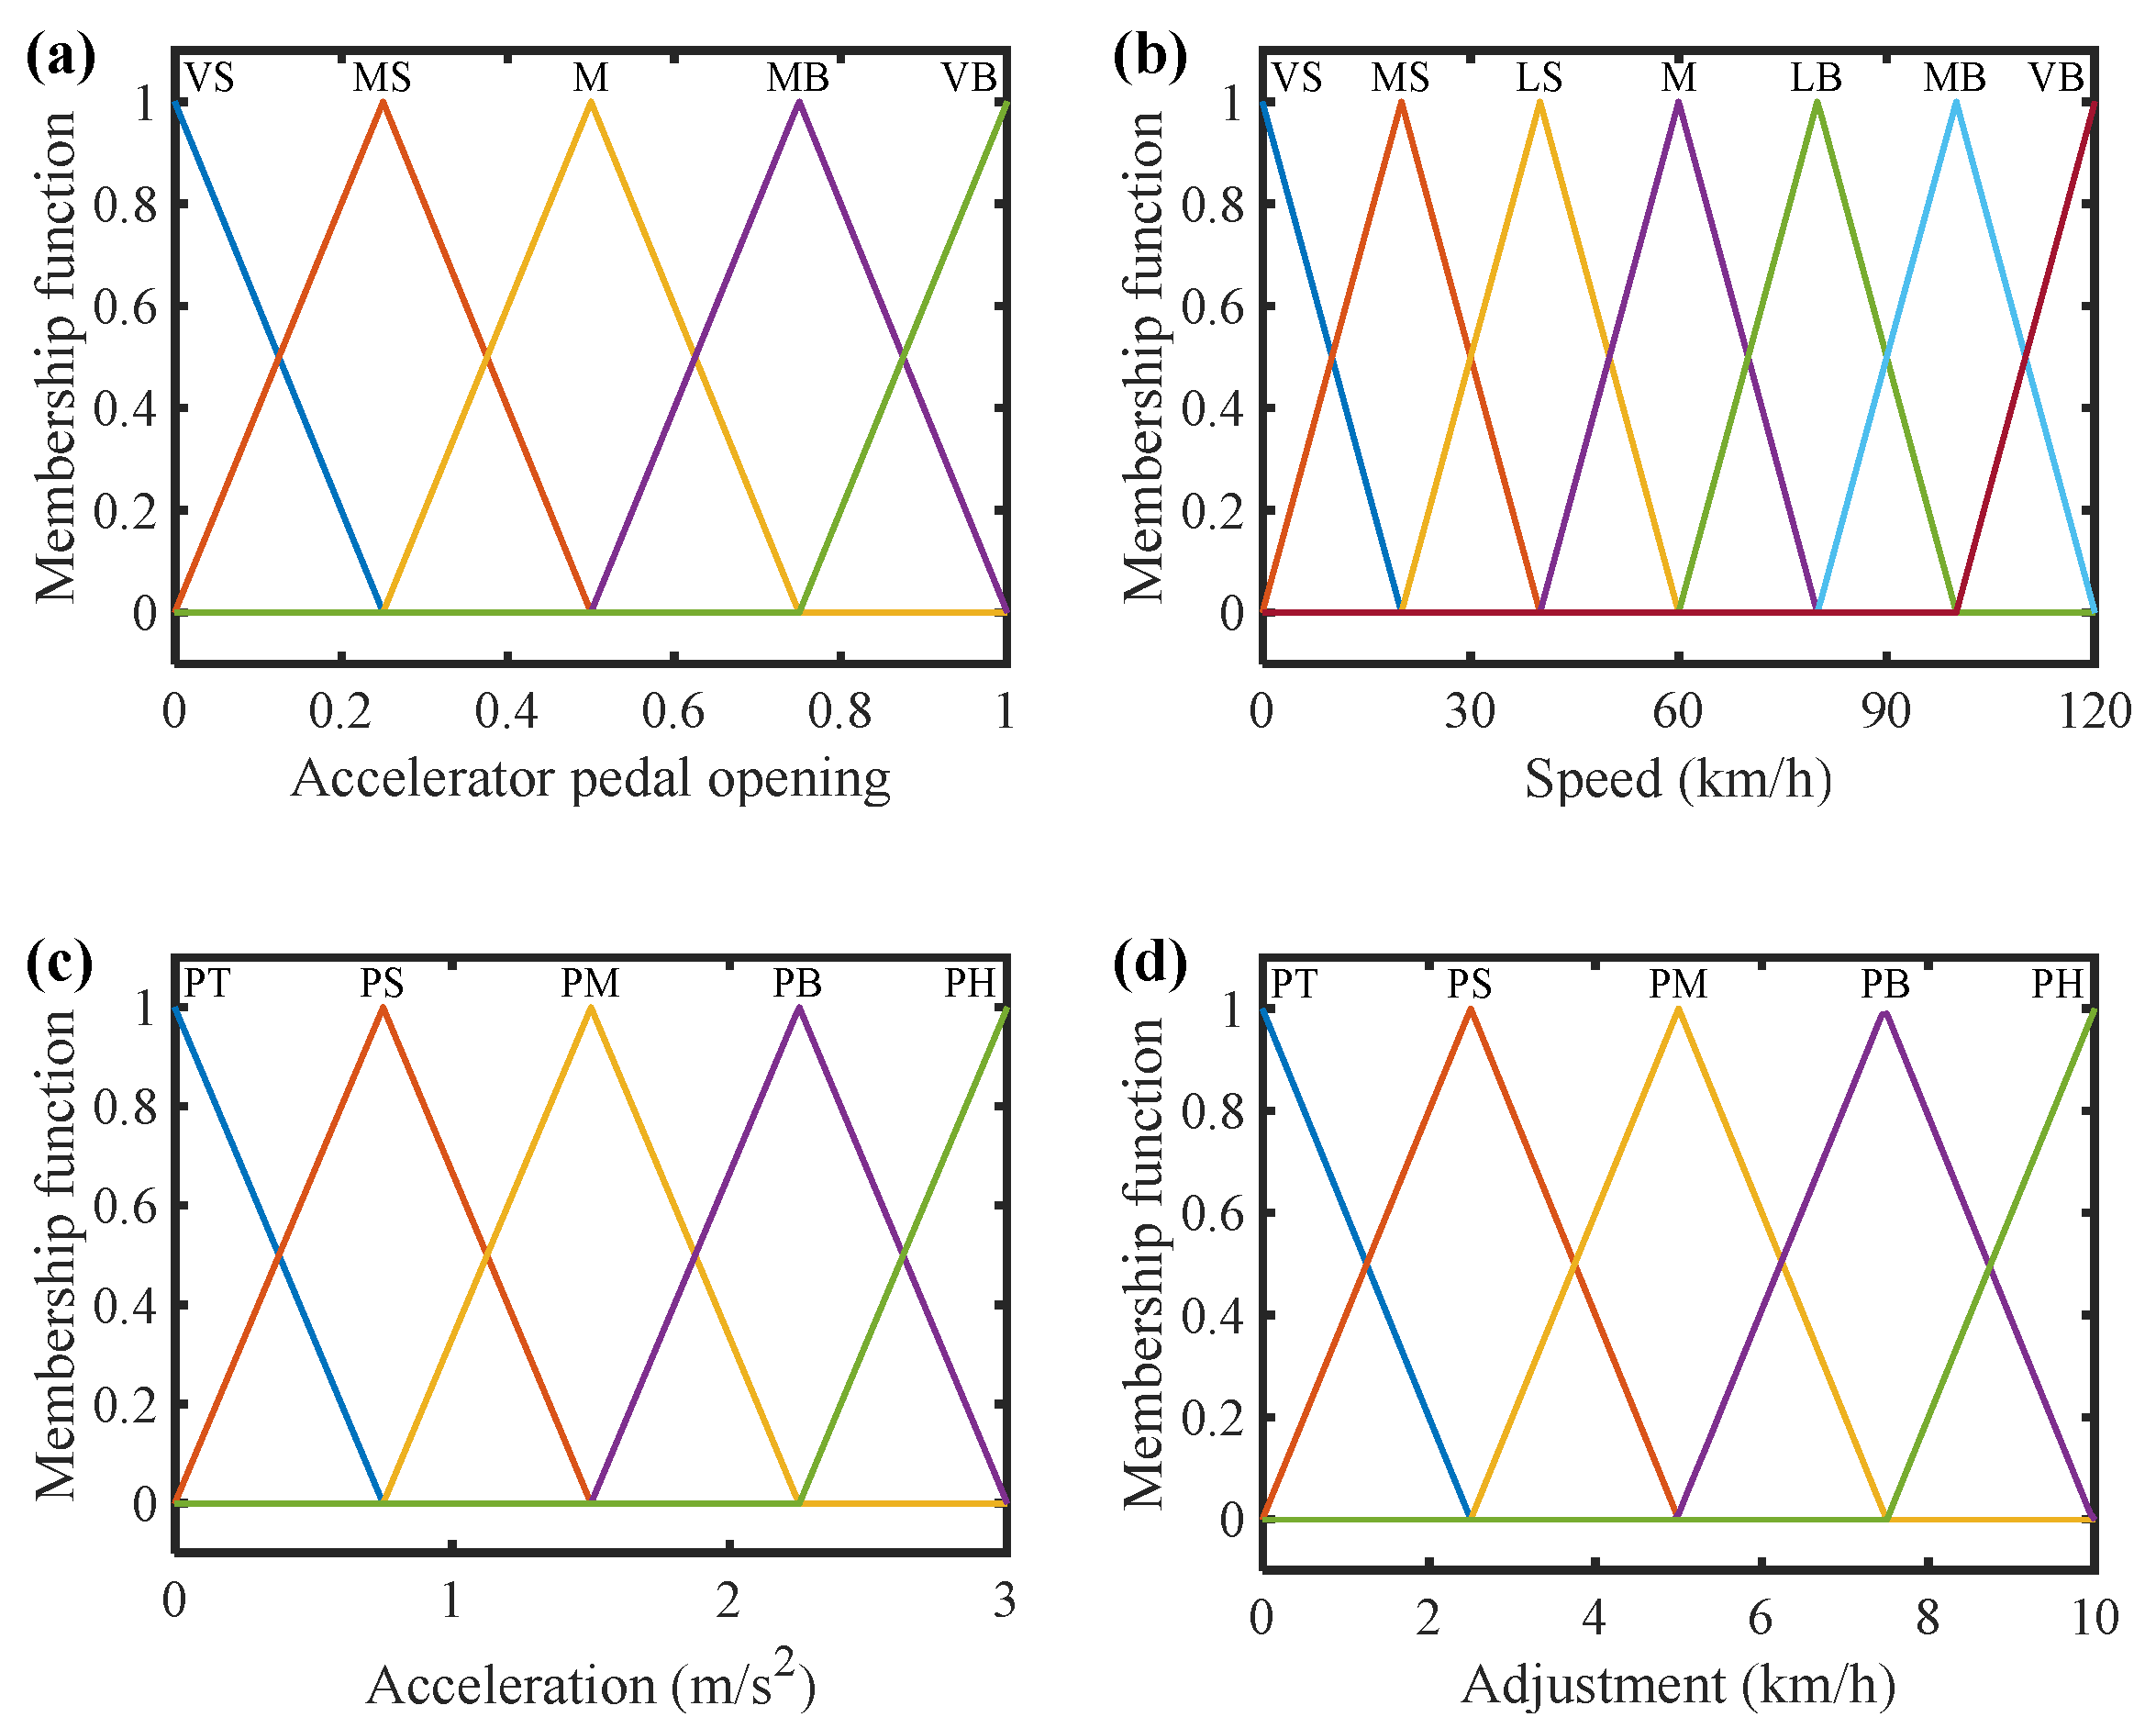
Vehicle acceleration is introduced as the correction variable and, together with vehicle speed and pedal opening, serves as the input to the fuzzy logic system. It is selected because it reflects both vehicle dynamic performance and changes in longitudinal power demand. The output variable is the shift curve adjustment, and the upshift and downshift curves are corrected separately rather than shifted as a whole. For upshift correction, the ranges of vehicle speed, pedal opening, and vehicle acceleration are set to 0 to 120 km/h, 0 to 1, and 0 to 3 m/s
2, respectively, while the output range is set to 0 to 10 km/h. The corresponding membership functions are shown in
Figure 16. Triangular membership functions are adopted for all variables.
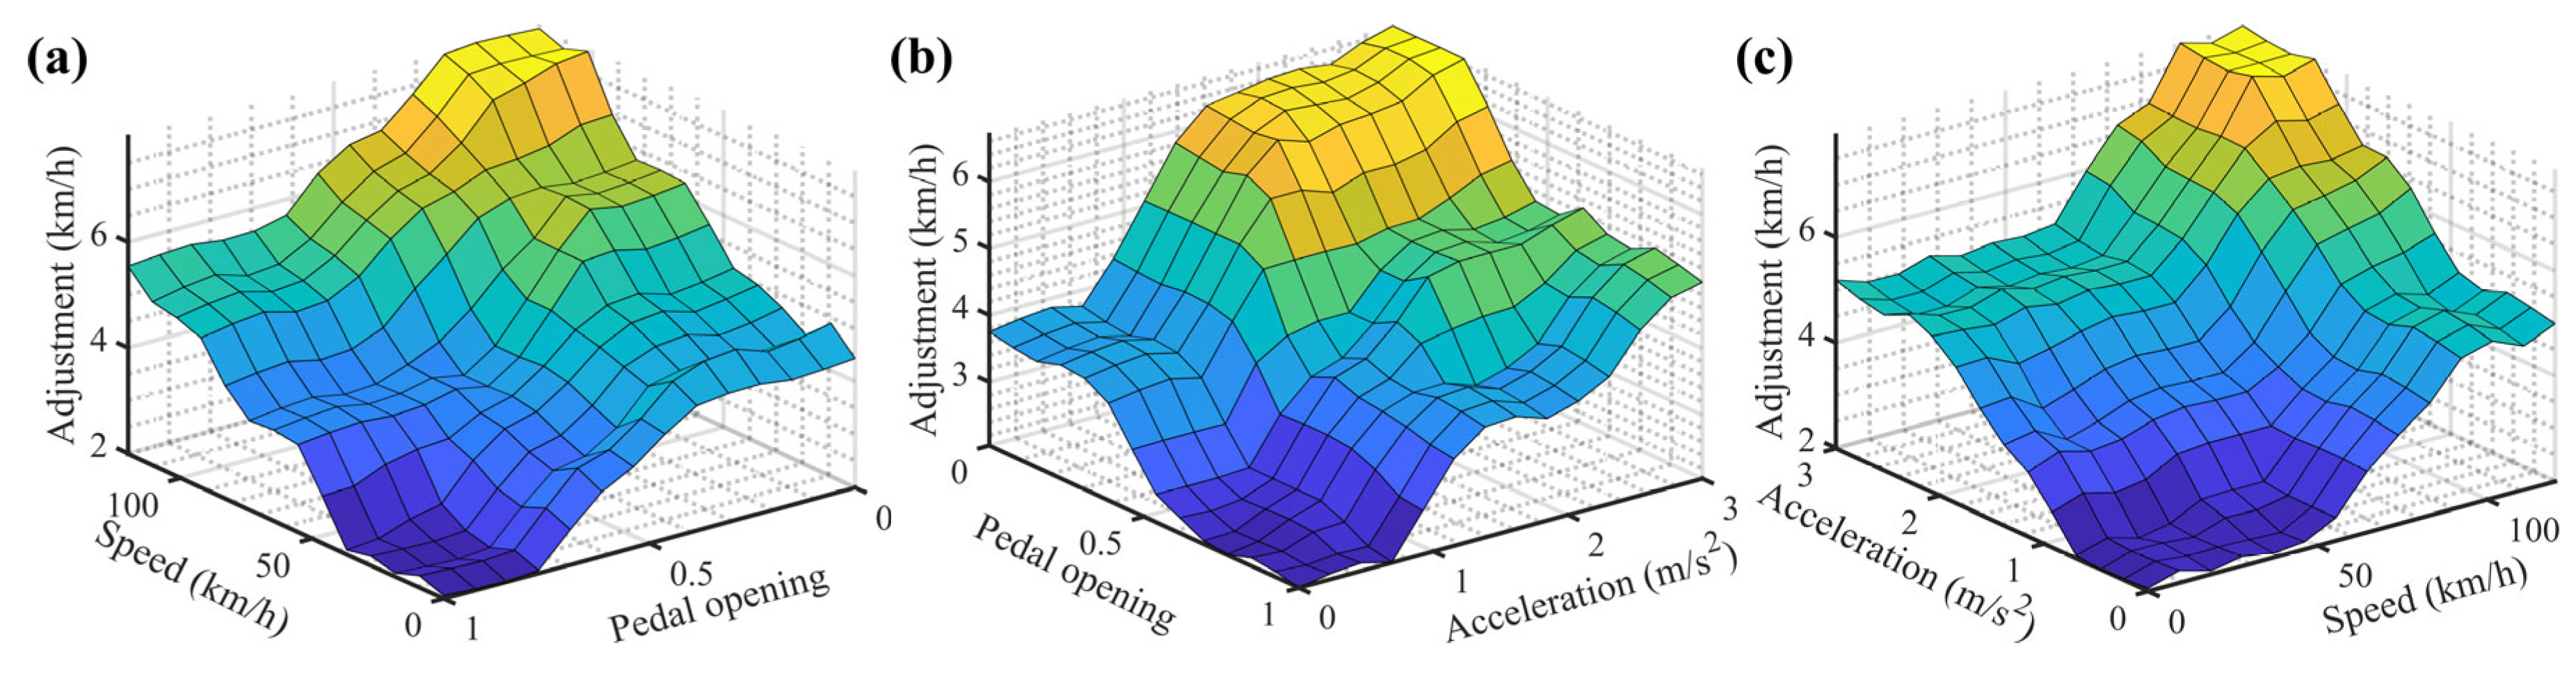
Based on the characteristics and physical meanings of the input and output variables, the fuzzy correction rules for the upshift curve are established according to the following principles. The fuzzy rules for upshift correction were designed to delay unnecessary upshifts under transient acceleration while avoiding excessive intervention under strong power demand. When vehicle acceleration is positive, a positive correction is added to the upshift threshold to keep the vehicle in first gear for a longer period and suppress short-duration upshifts caused by small speed fluctuations near the shift boundary. The correction increases with vehicle speed and acceleration magnitude because higher speed may lead to a larger clutch speed difference, while larger acceleration indicates stronger transient power demand or more unstable operating conditions. However, the correction is reduced at large pedal openings to avoid excessive interference with the calibrated dynamic shift strategy. When acceleration is negative, no positive upshift correction is applied because the vehicle is not in a traction acceleration state. The fuzzy correction characteristics of the upshift curve are shown in
Figure 17.
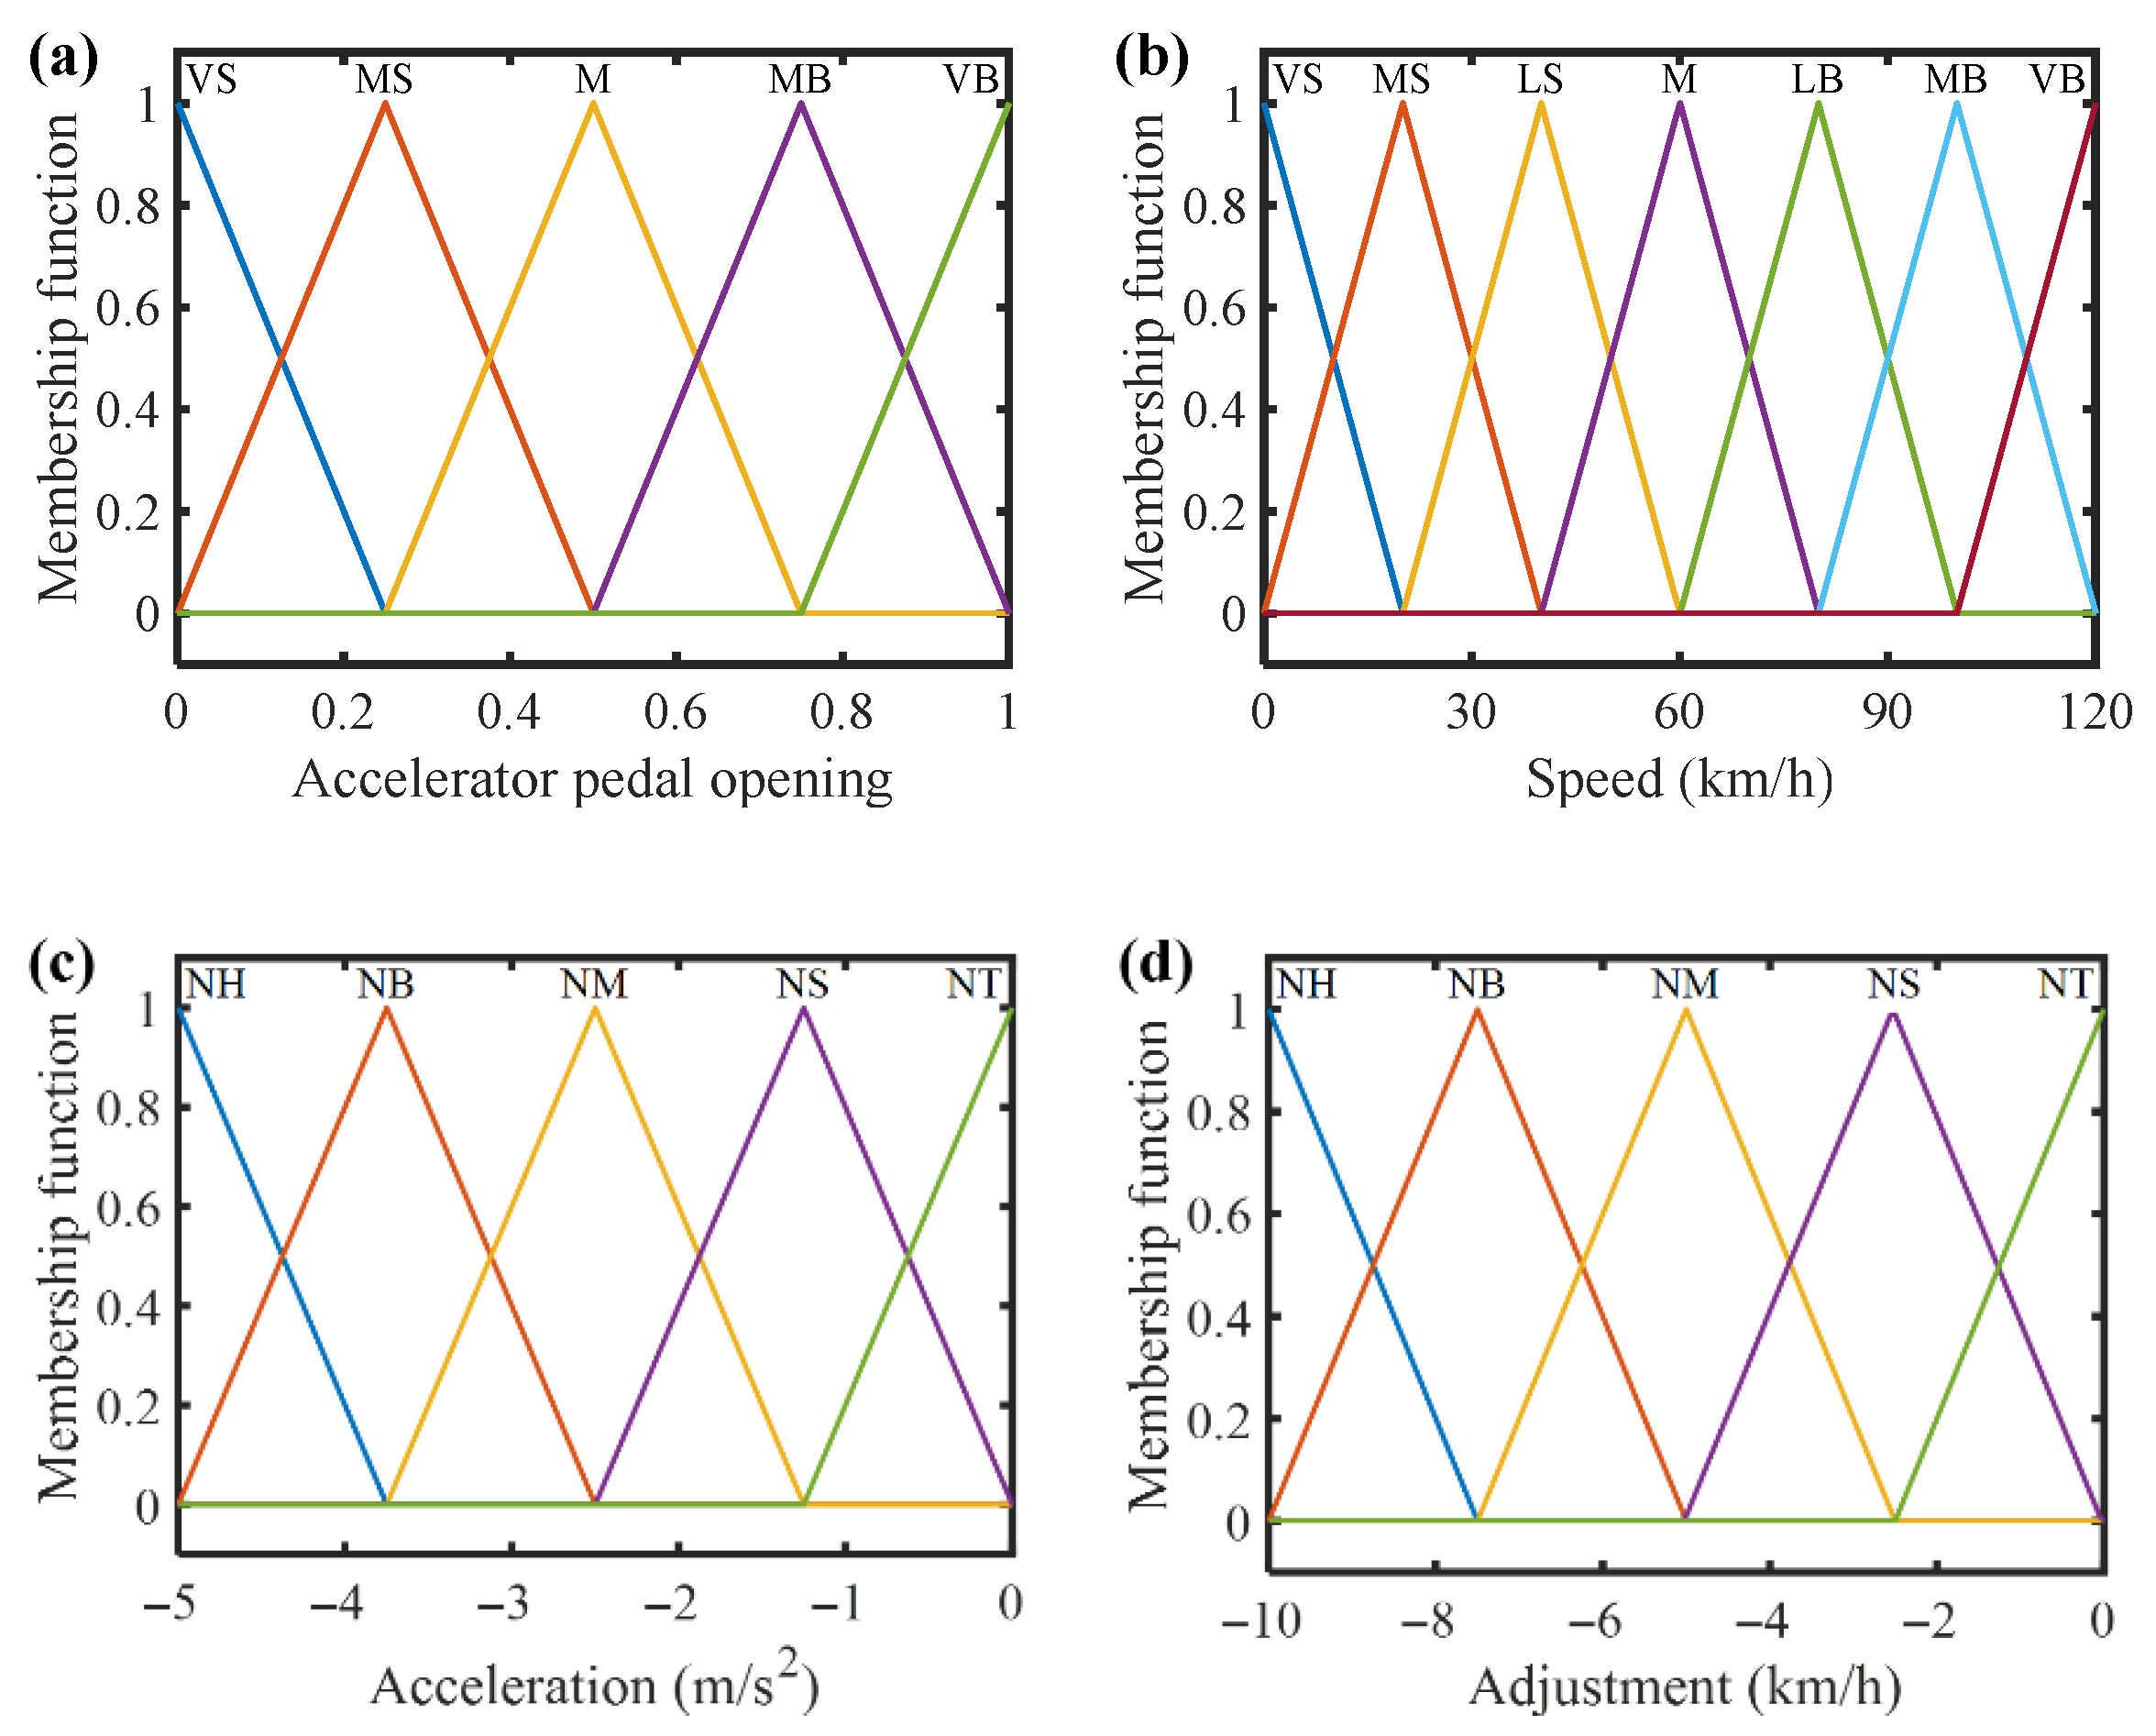
For downshift correction, the ranges of vehicle speed, pedal opening, and vehicle acceleration are set to 0 to 120 km/h, 0 to 1, and −5 to 0 m/s
2, respectively, while the output range is set to −10 to 0 km/h. The corresponding membership functions are shown in
Figure 18, and triangular membership functions are also adopted for all variables.
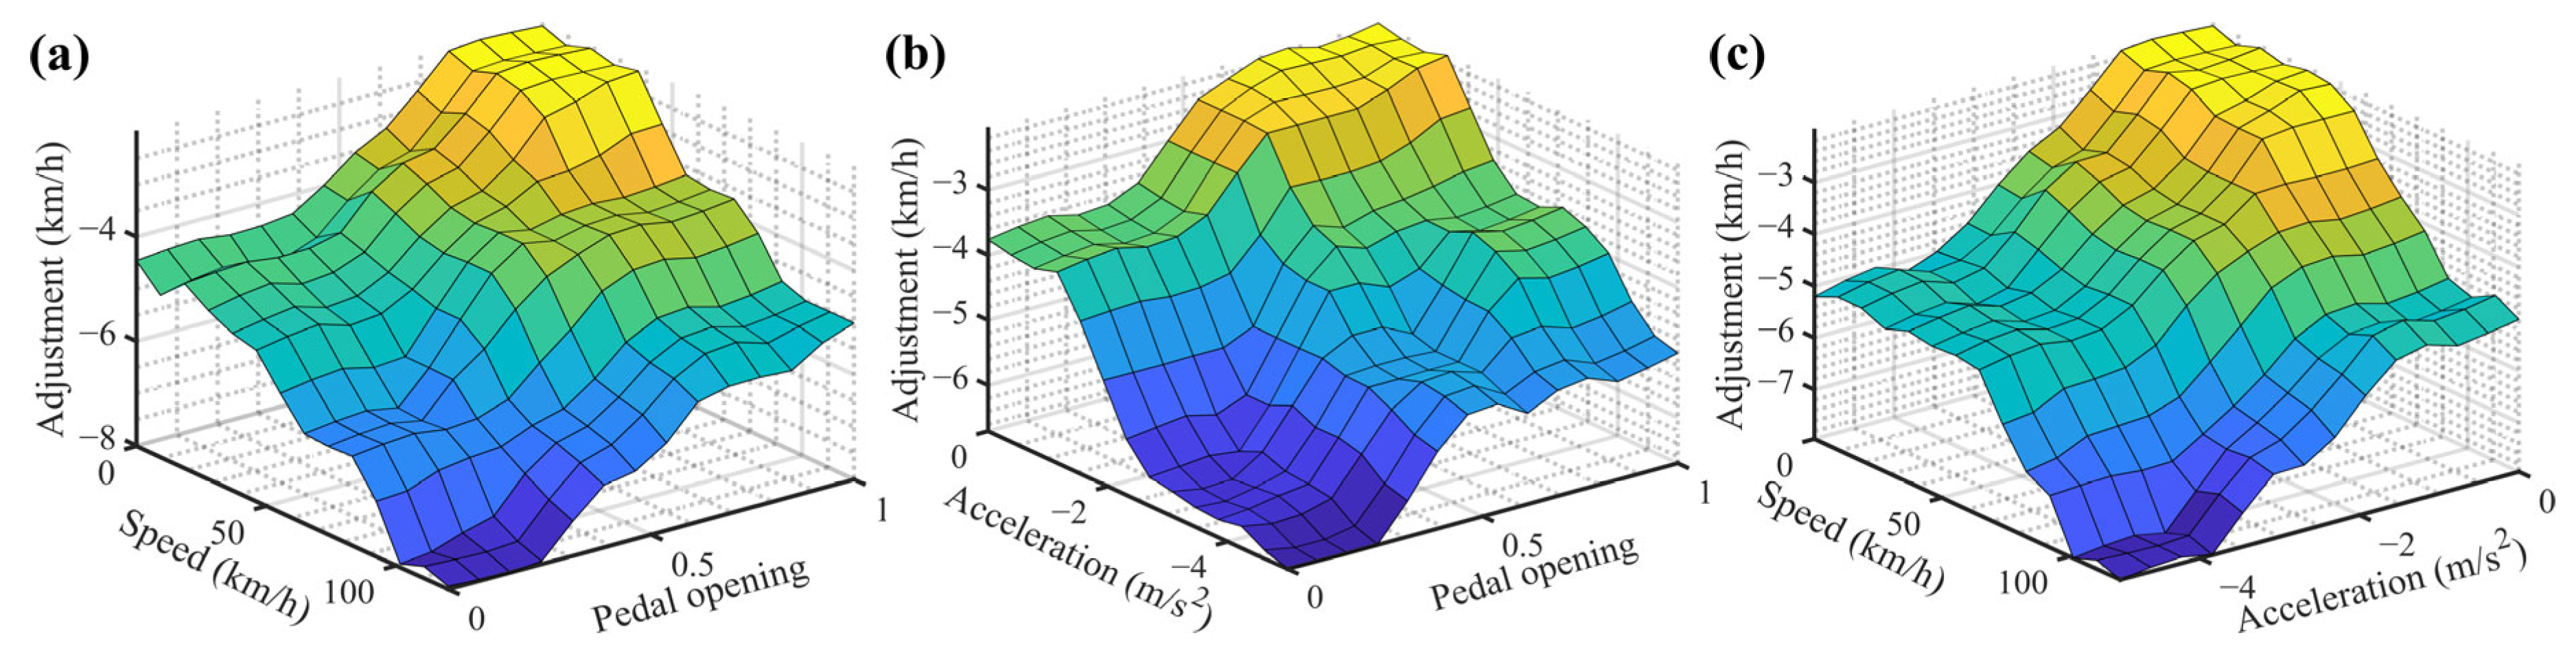
The fuzzy rules for downshift correction were designed to suppress unnecessary downshifts during transient deceleration and reduce the adverse effects of frequent shifting on clutch slip and shift comfort. When vehicle acceleration is negative, a negative correction is applied to the downshift threshold to delay downshifting and enlarge the hysteresis region, thereby avoiding short-duration downshifts caused by transient speed reductions near the shift boundary. The absolute correction value increases with vehicle speed and deceleration magnitude because higher speed may lead to a larger clutch speed difference, while stronger deceleration usually indicates unstable traffic conditions or braking intent. In contrast, the correction is weakened at large pedal openings to avoid excessively delaying downshifts when renewed traction demand is present. When acceleration is positive, no negative downshift correction is applied. The fuzzy correction characteristics of the downshift curve are shown in
Figure 19.
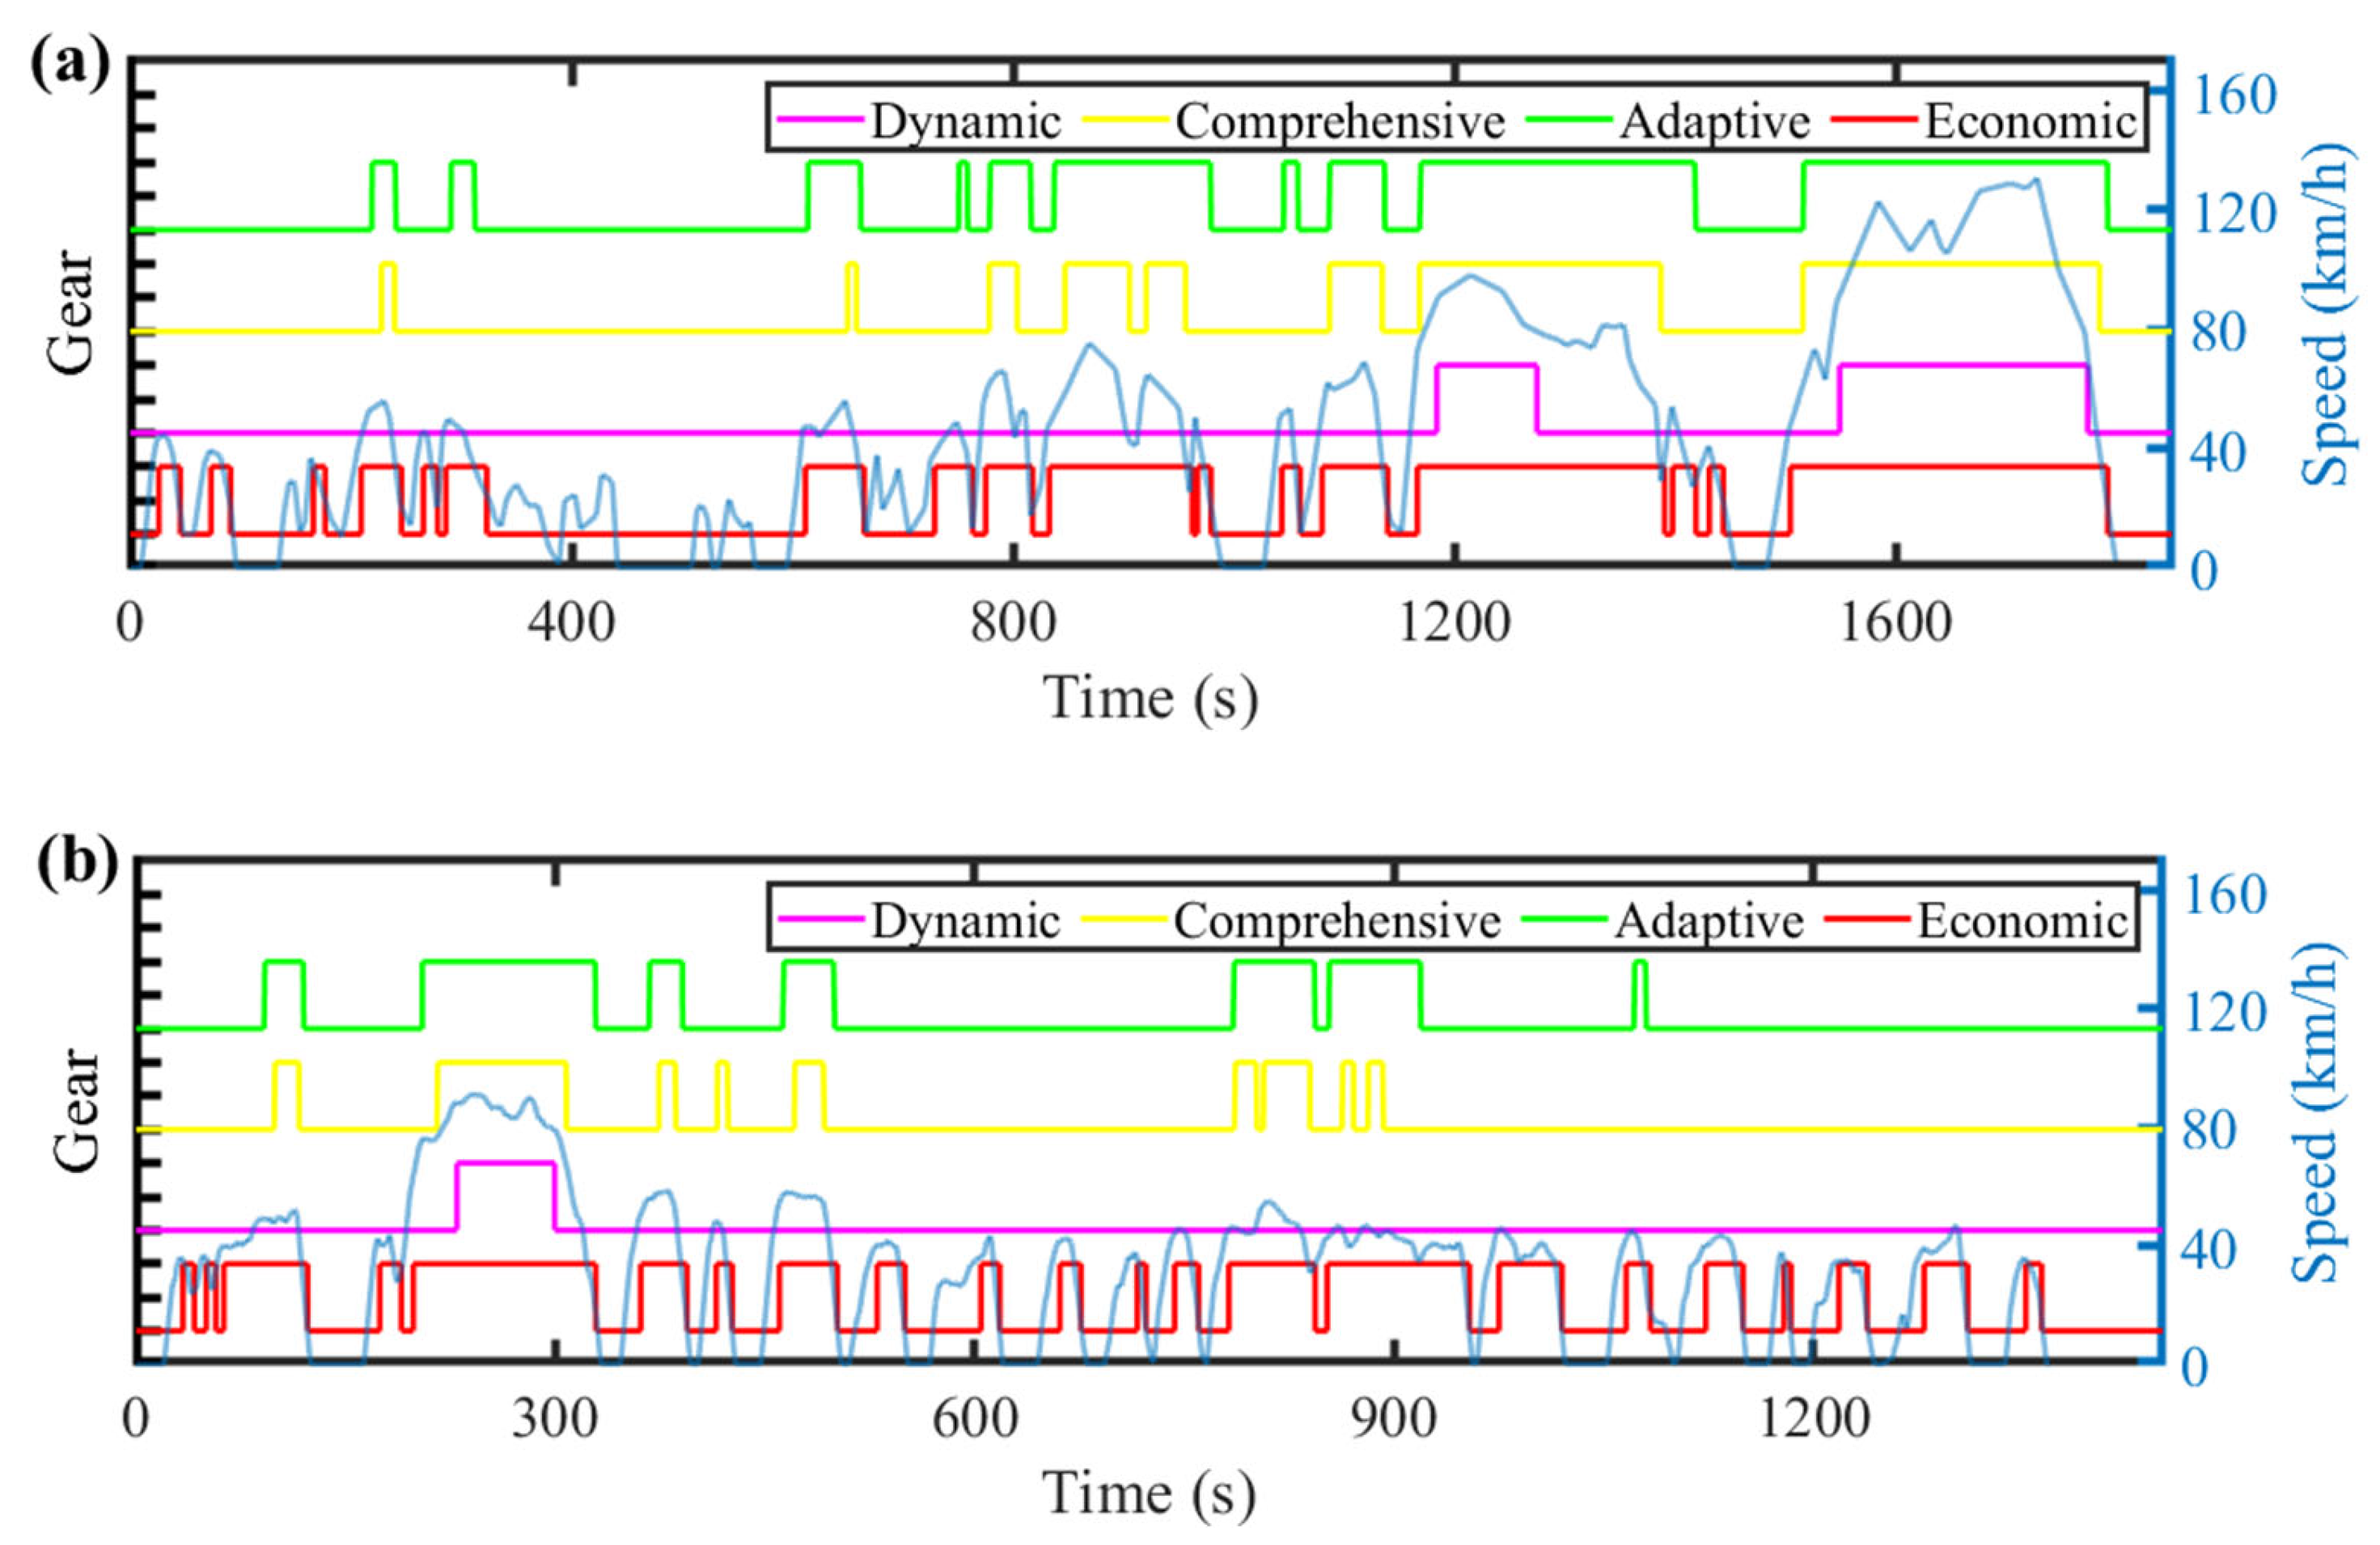
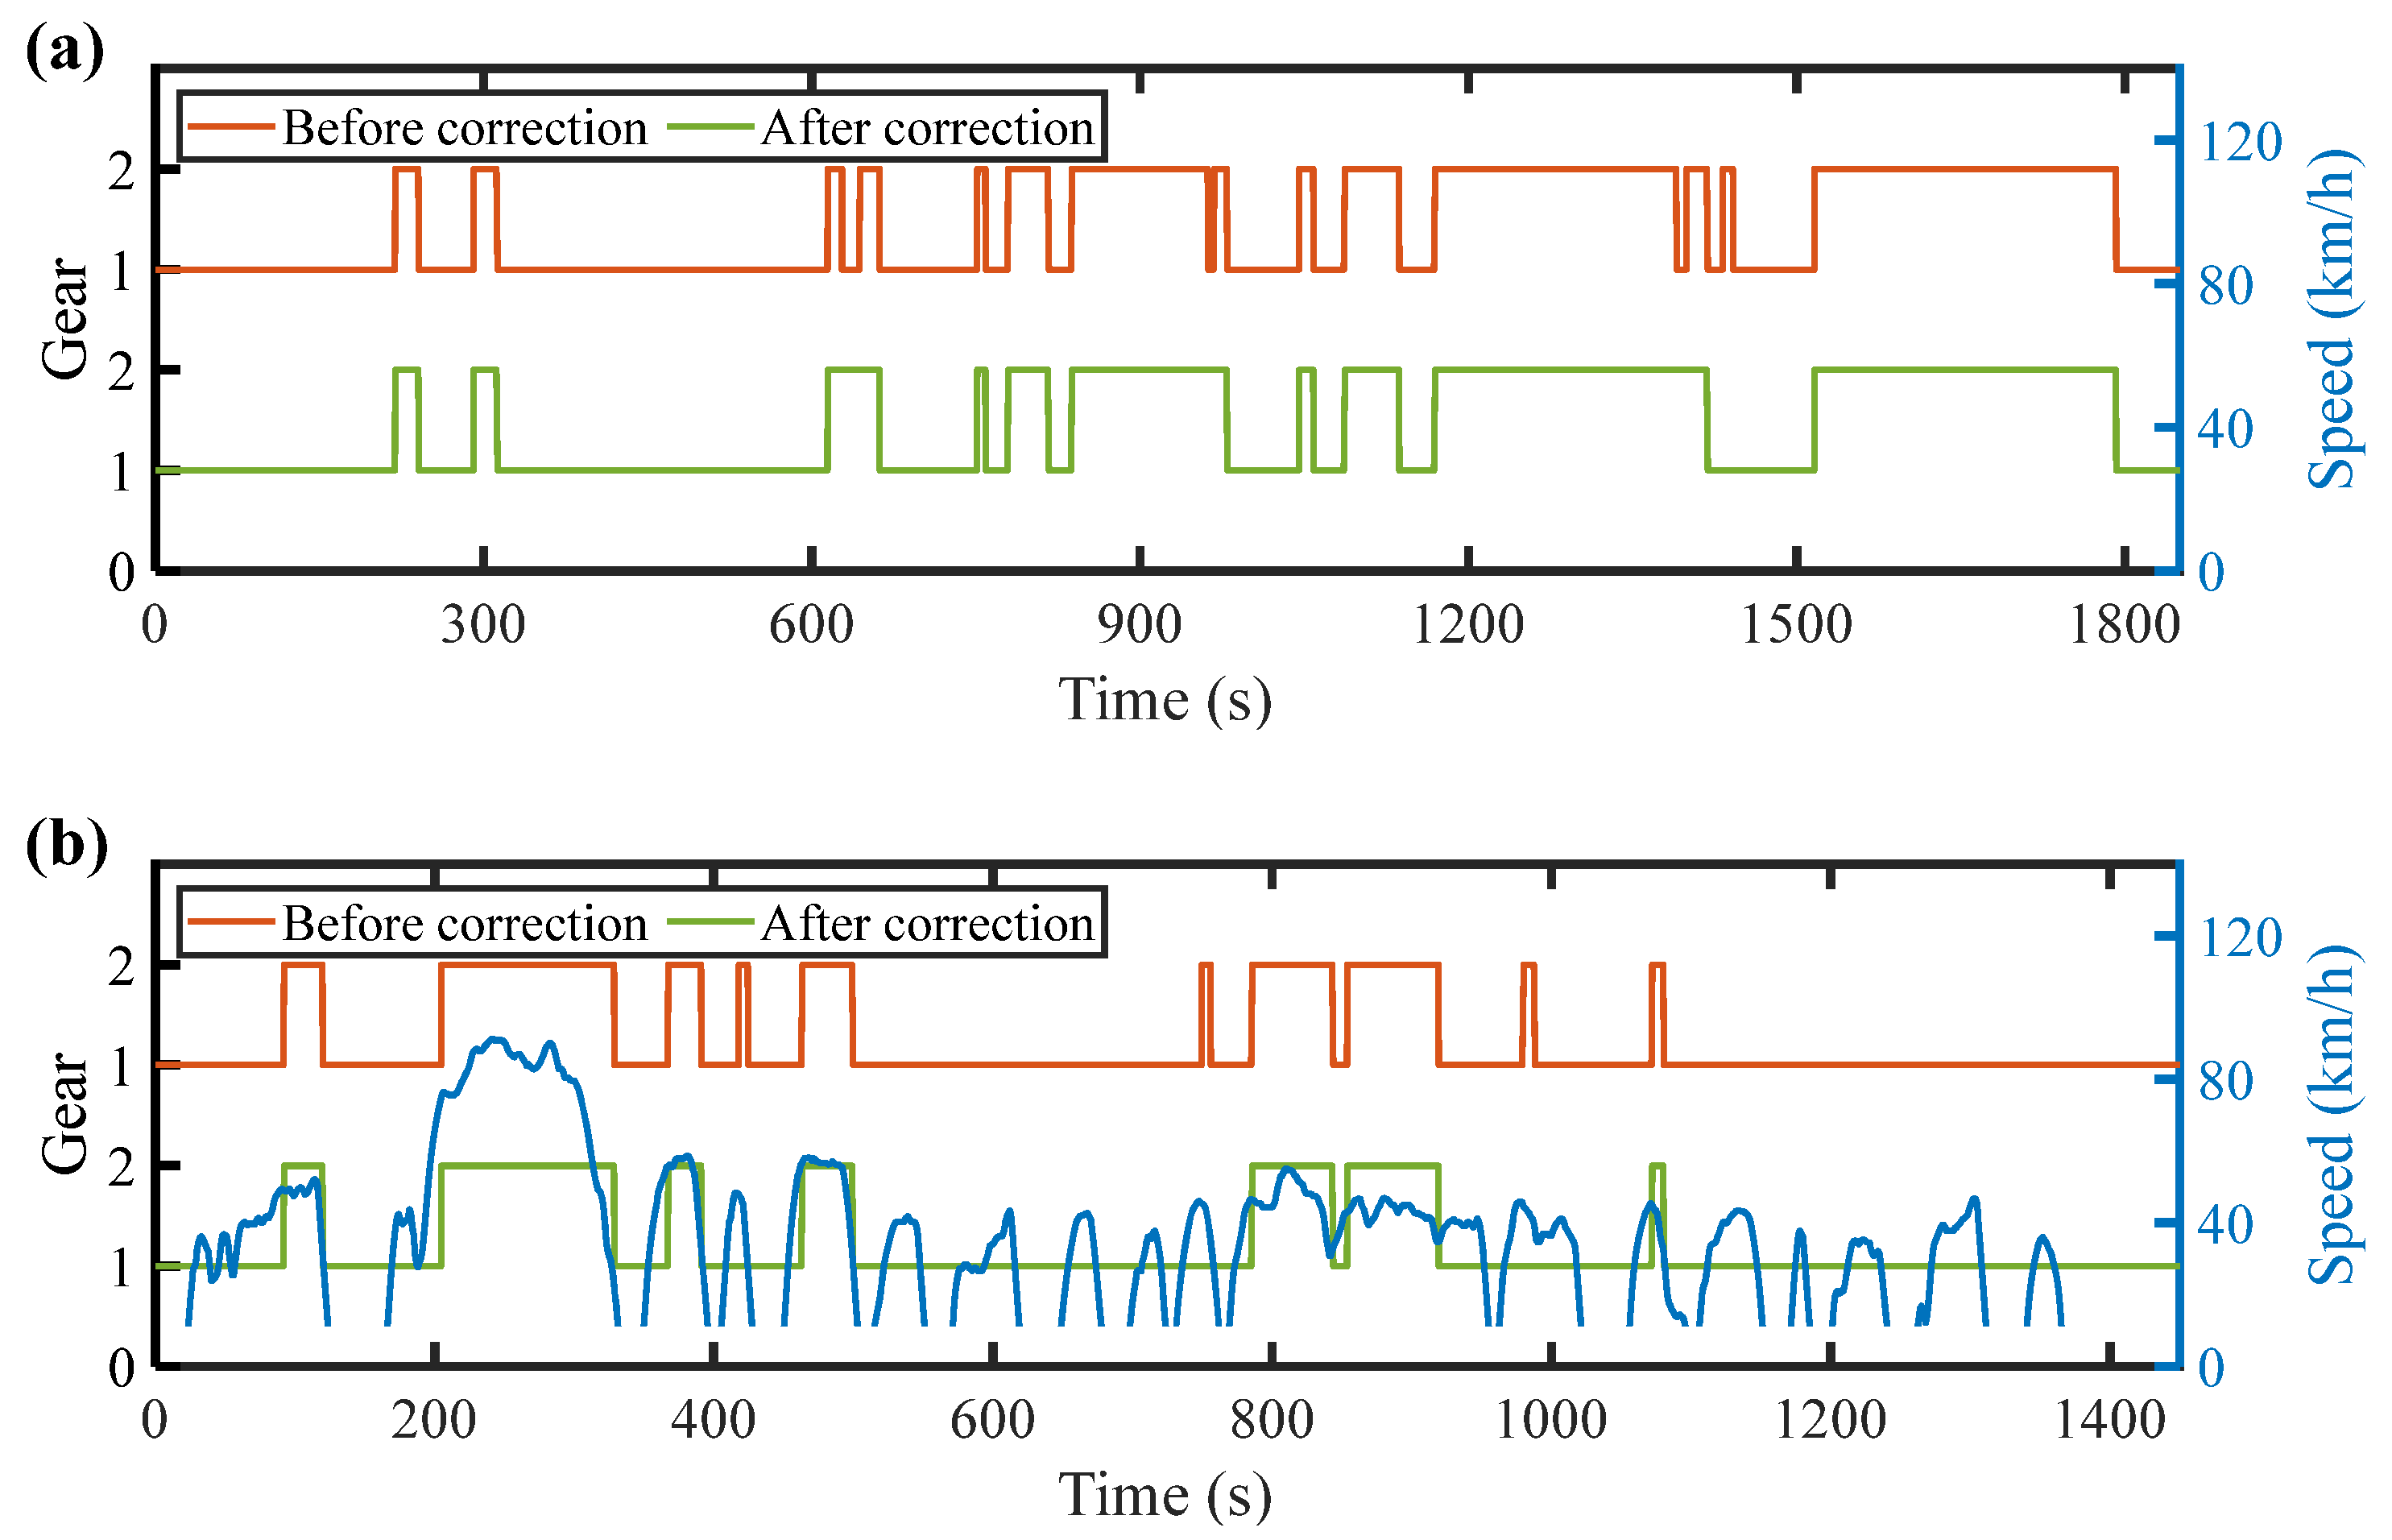
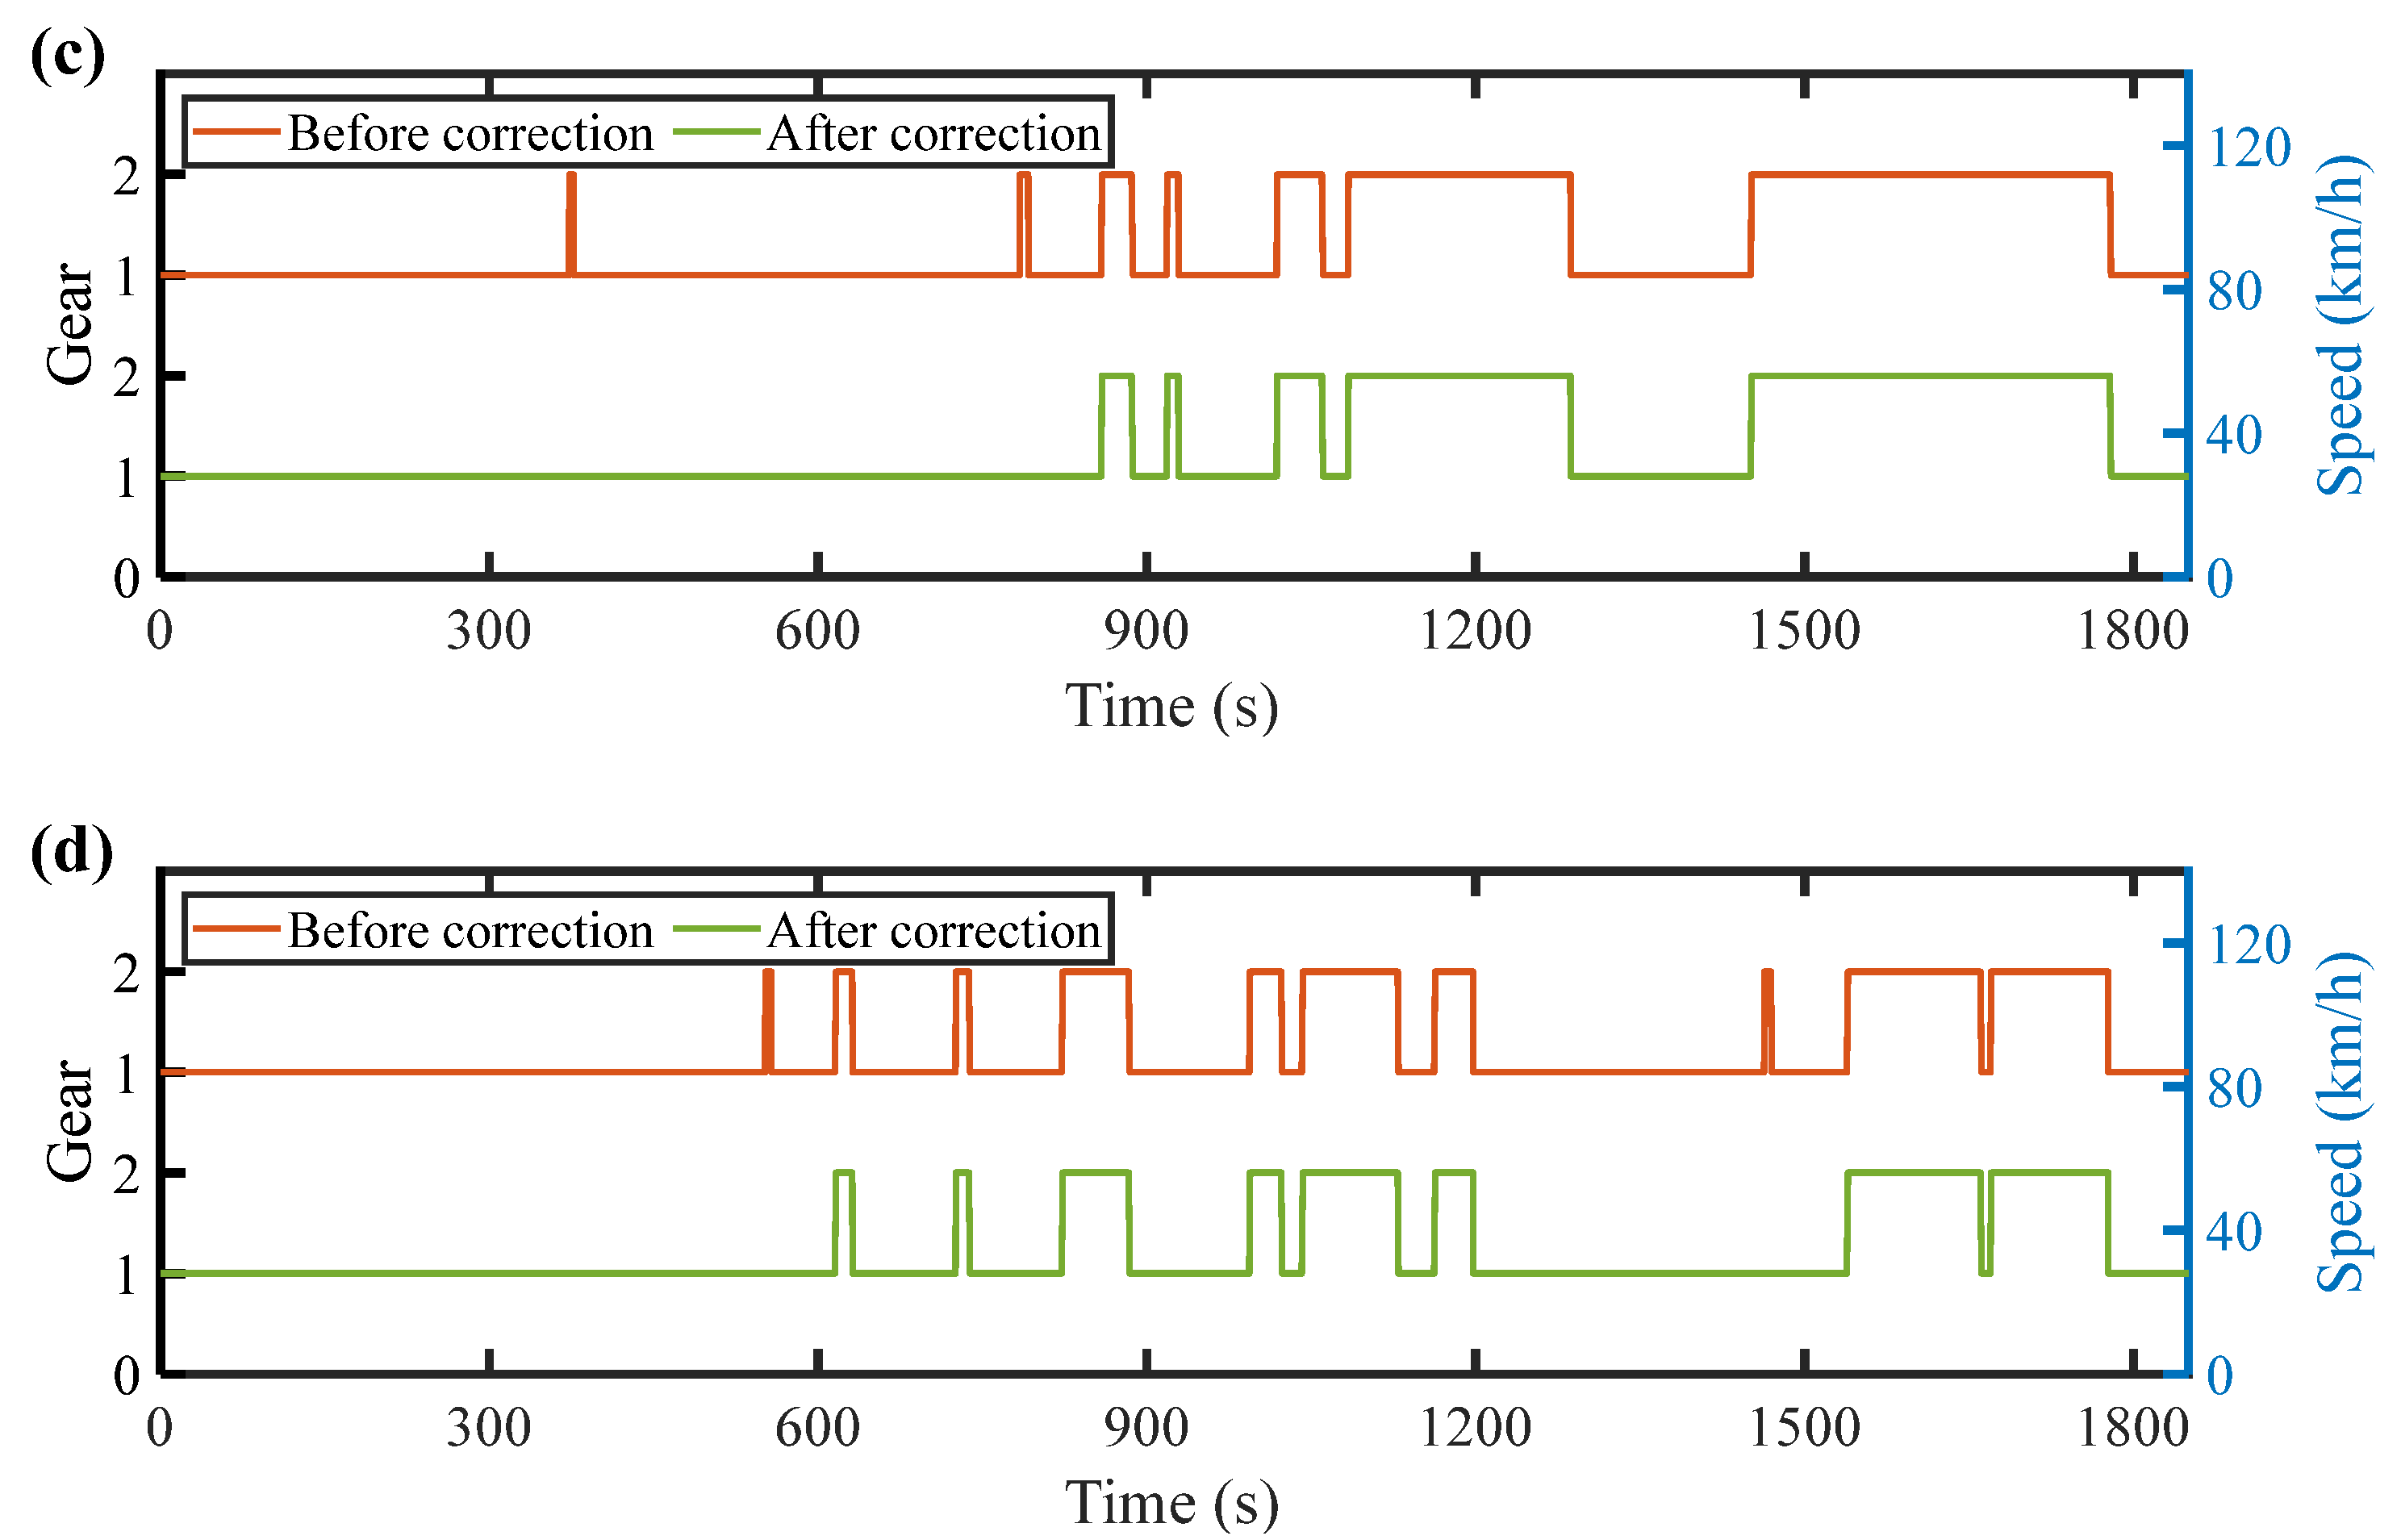
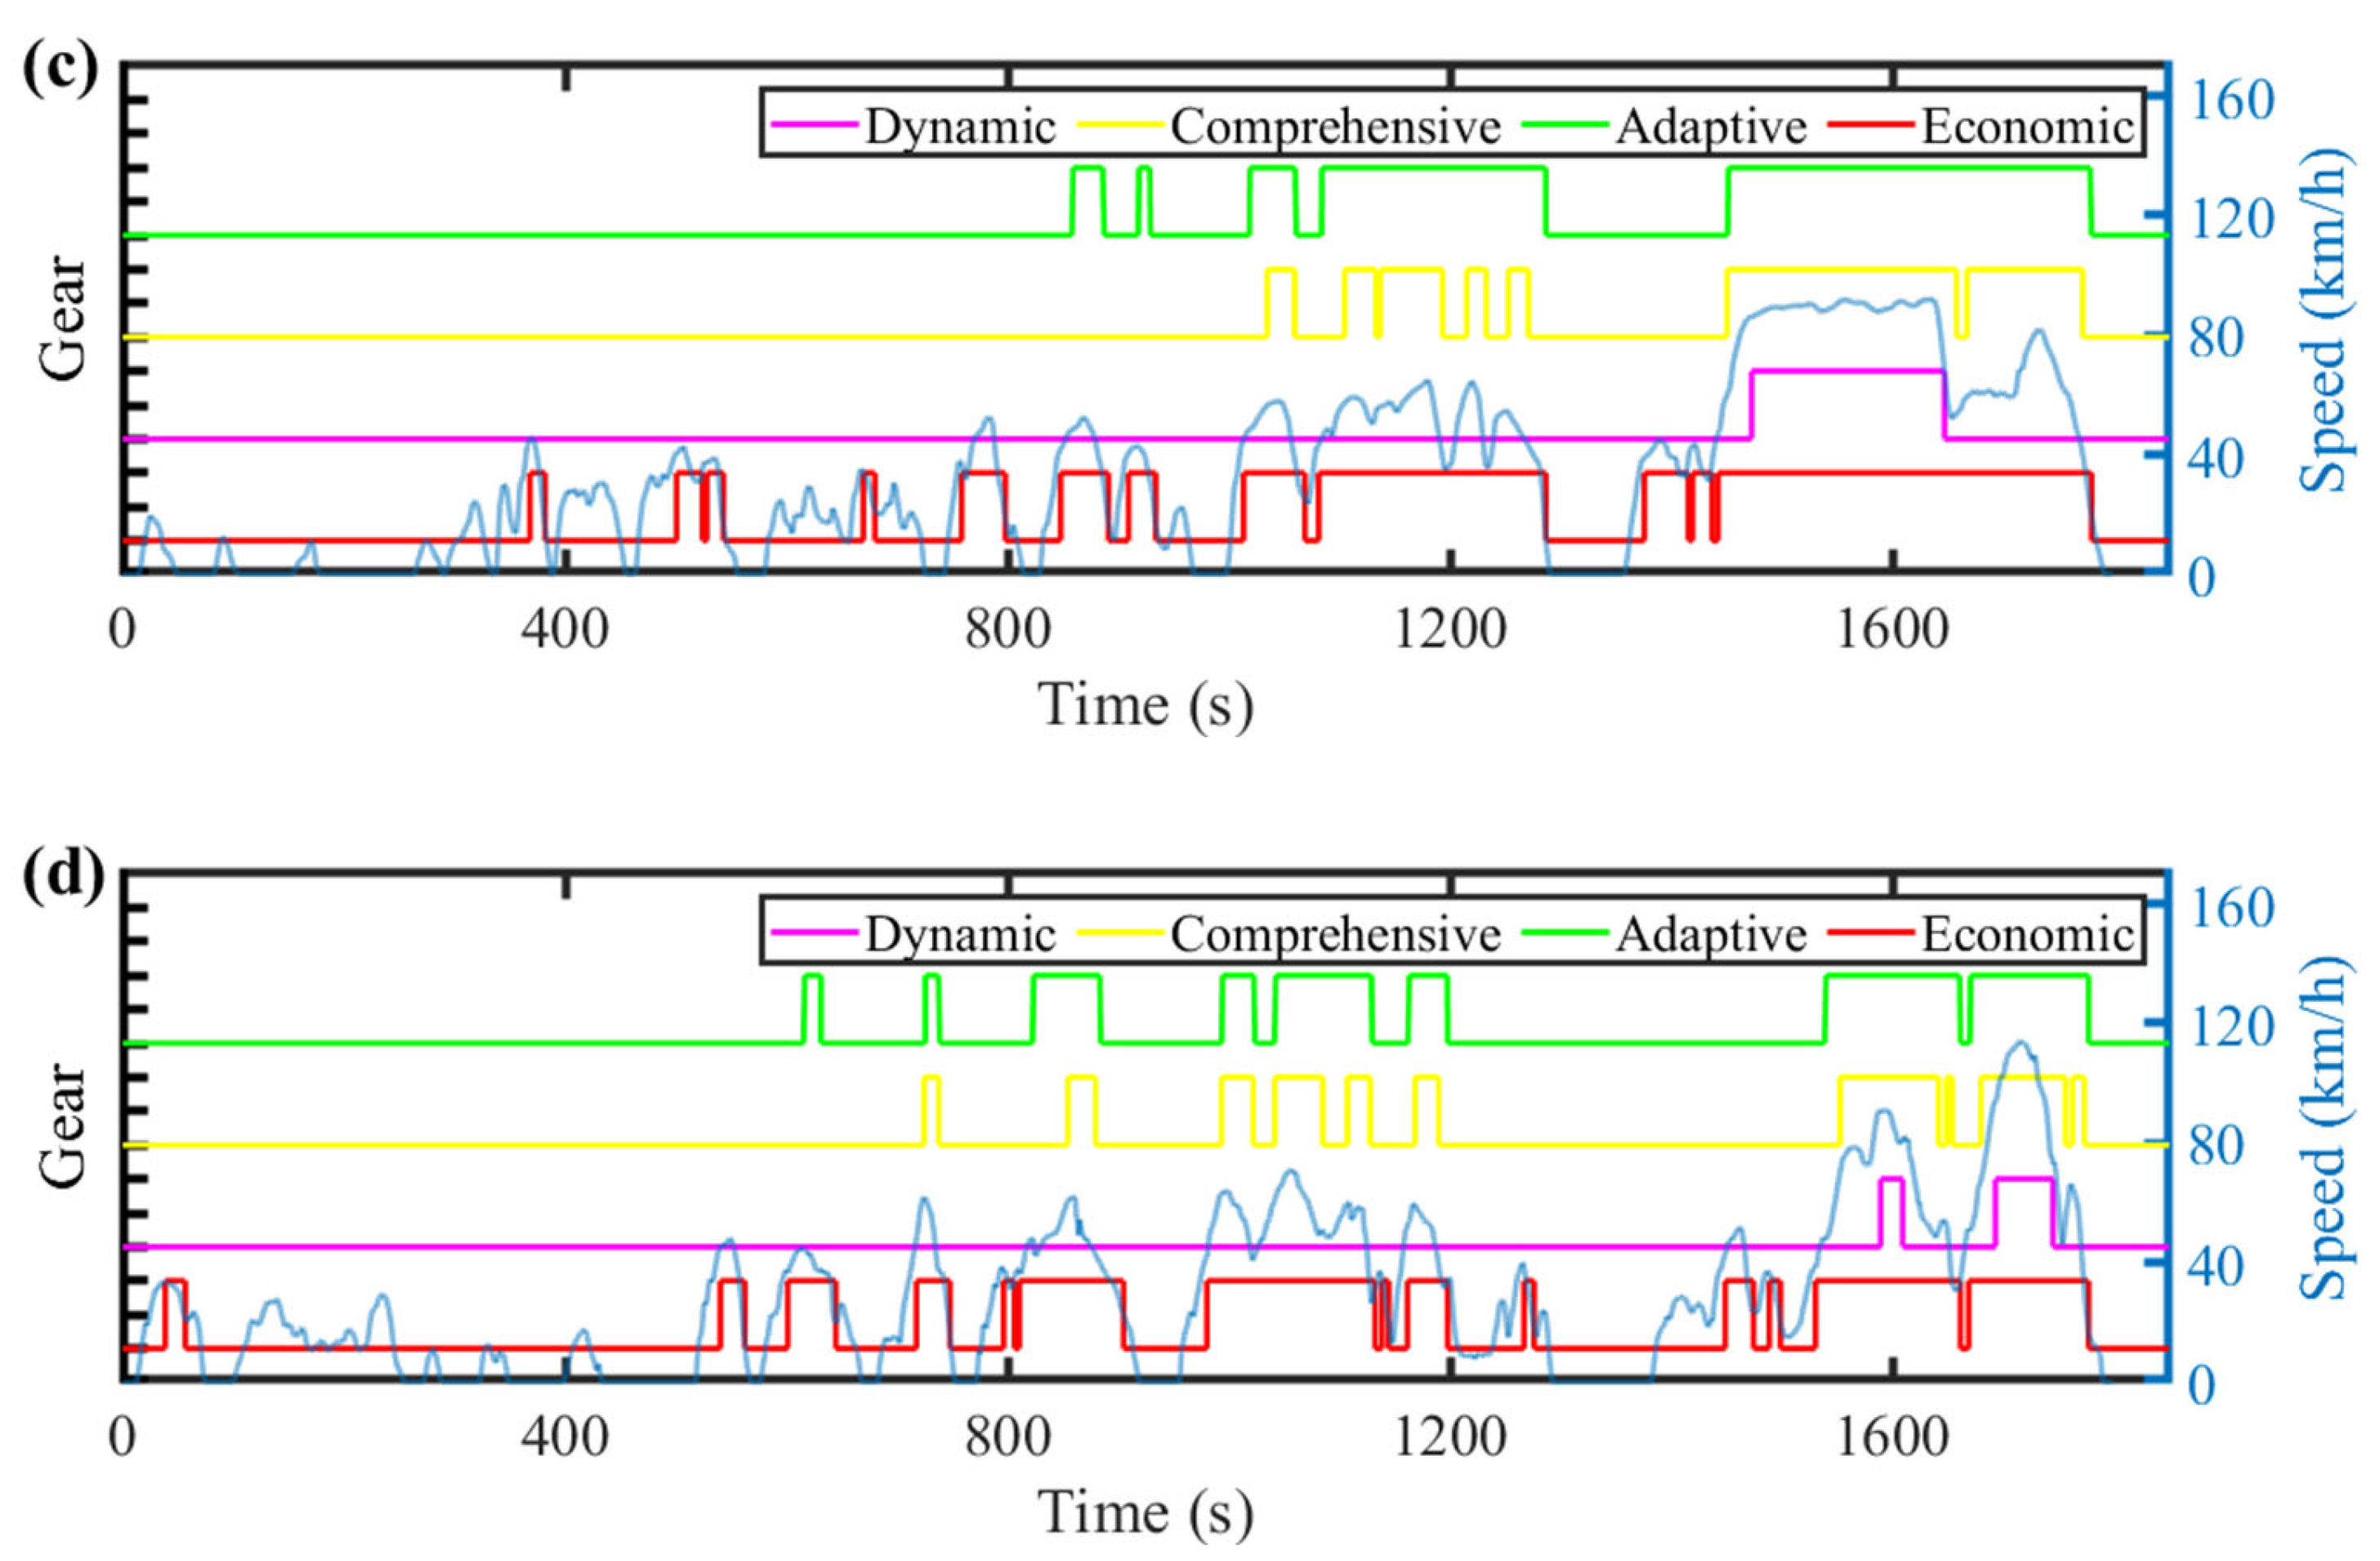
To evaluate the effectiveness of the proposed online fuzzy correction strategy for gear shifting, simulations are conducted under four standard driving cycles: WLTC, UDDS, CLTC-C, and CLTC-P. The adaptive gear shift strategy before and after fuzzy correction is compared, and the corresponding shifting behavior is shown in
Figure 20.
As shown in
Figure 20, the fuzzy correction strategy performs well under all driving cycles and eliminates multiple redundant shifts. The numbers of reduced shifts are 8, 6, 4, and 4 under WLTC, UDDS, CLTC-C, and CLTC-P, respectively. Examination of the corrected shift points shows that these shifts are caused by short-term vehicle speed fluctuations and have very short durations, making little contribution to energy saving. They can therefore be regarded as unnecessary shifts. The total numbers of shifts for different gear shift strategies under the four driving cycles are listed in
Table 11.
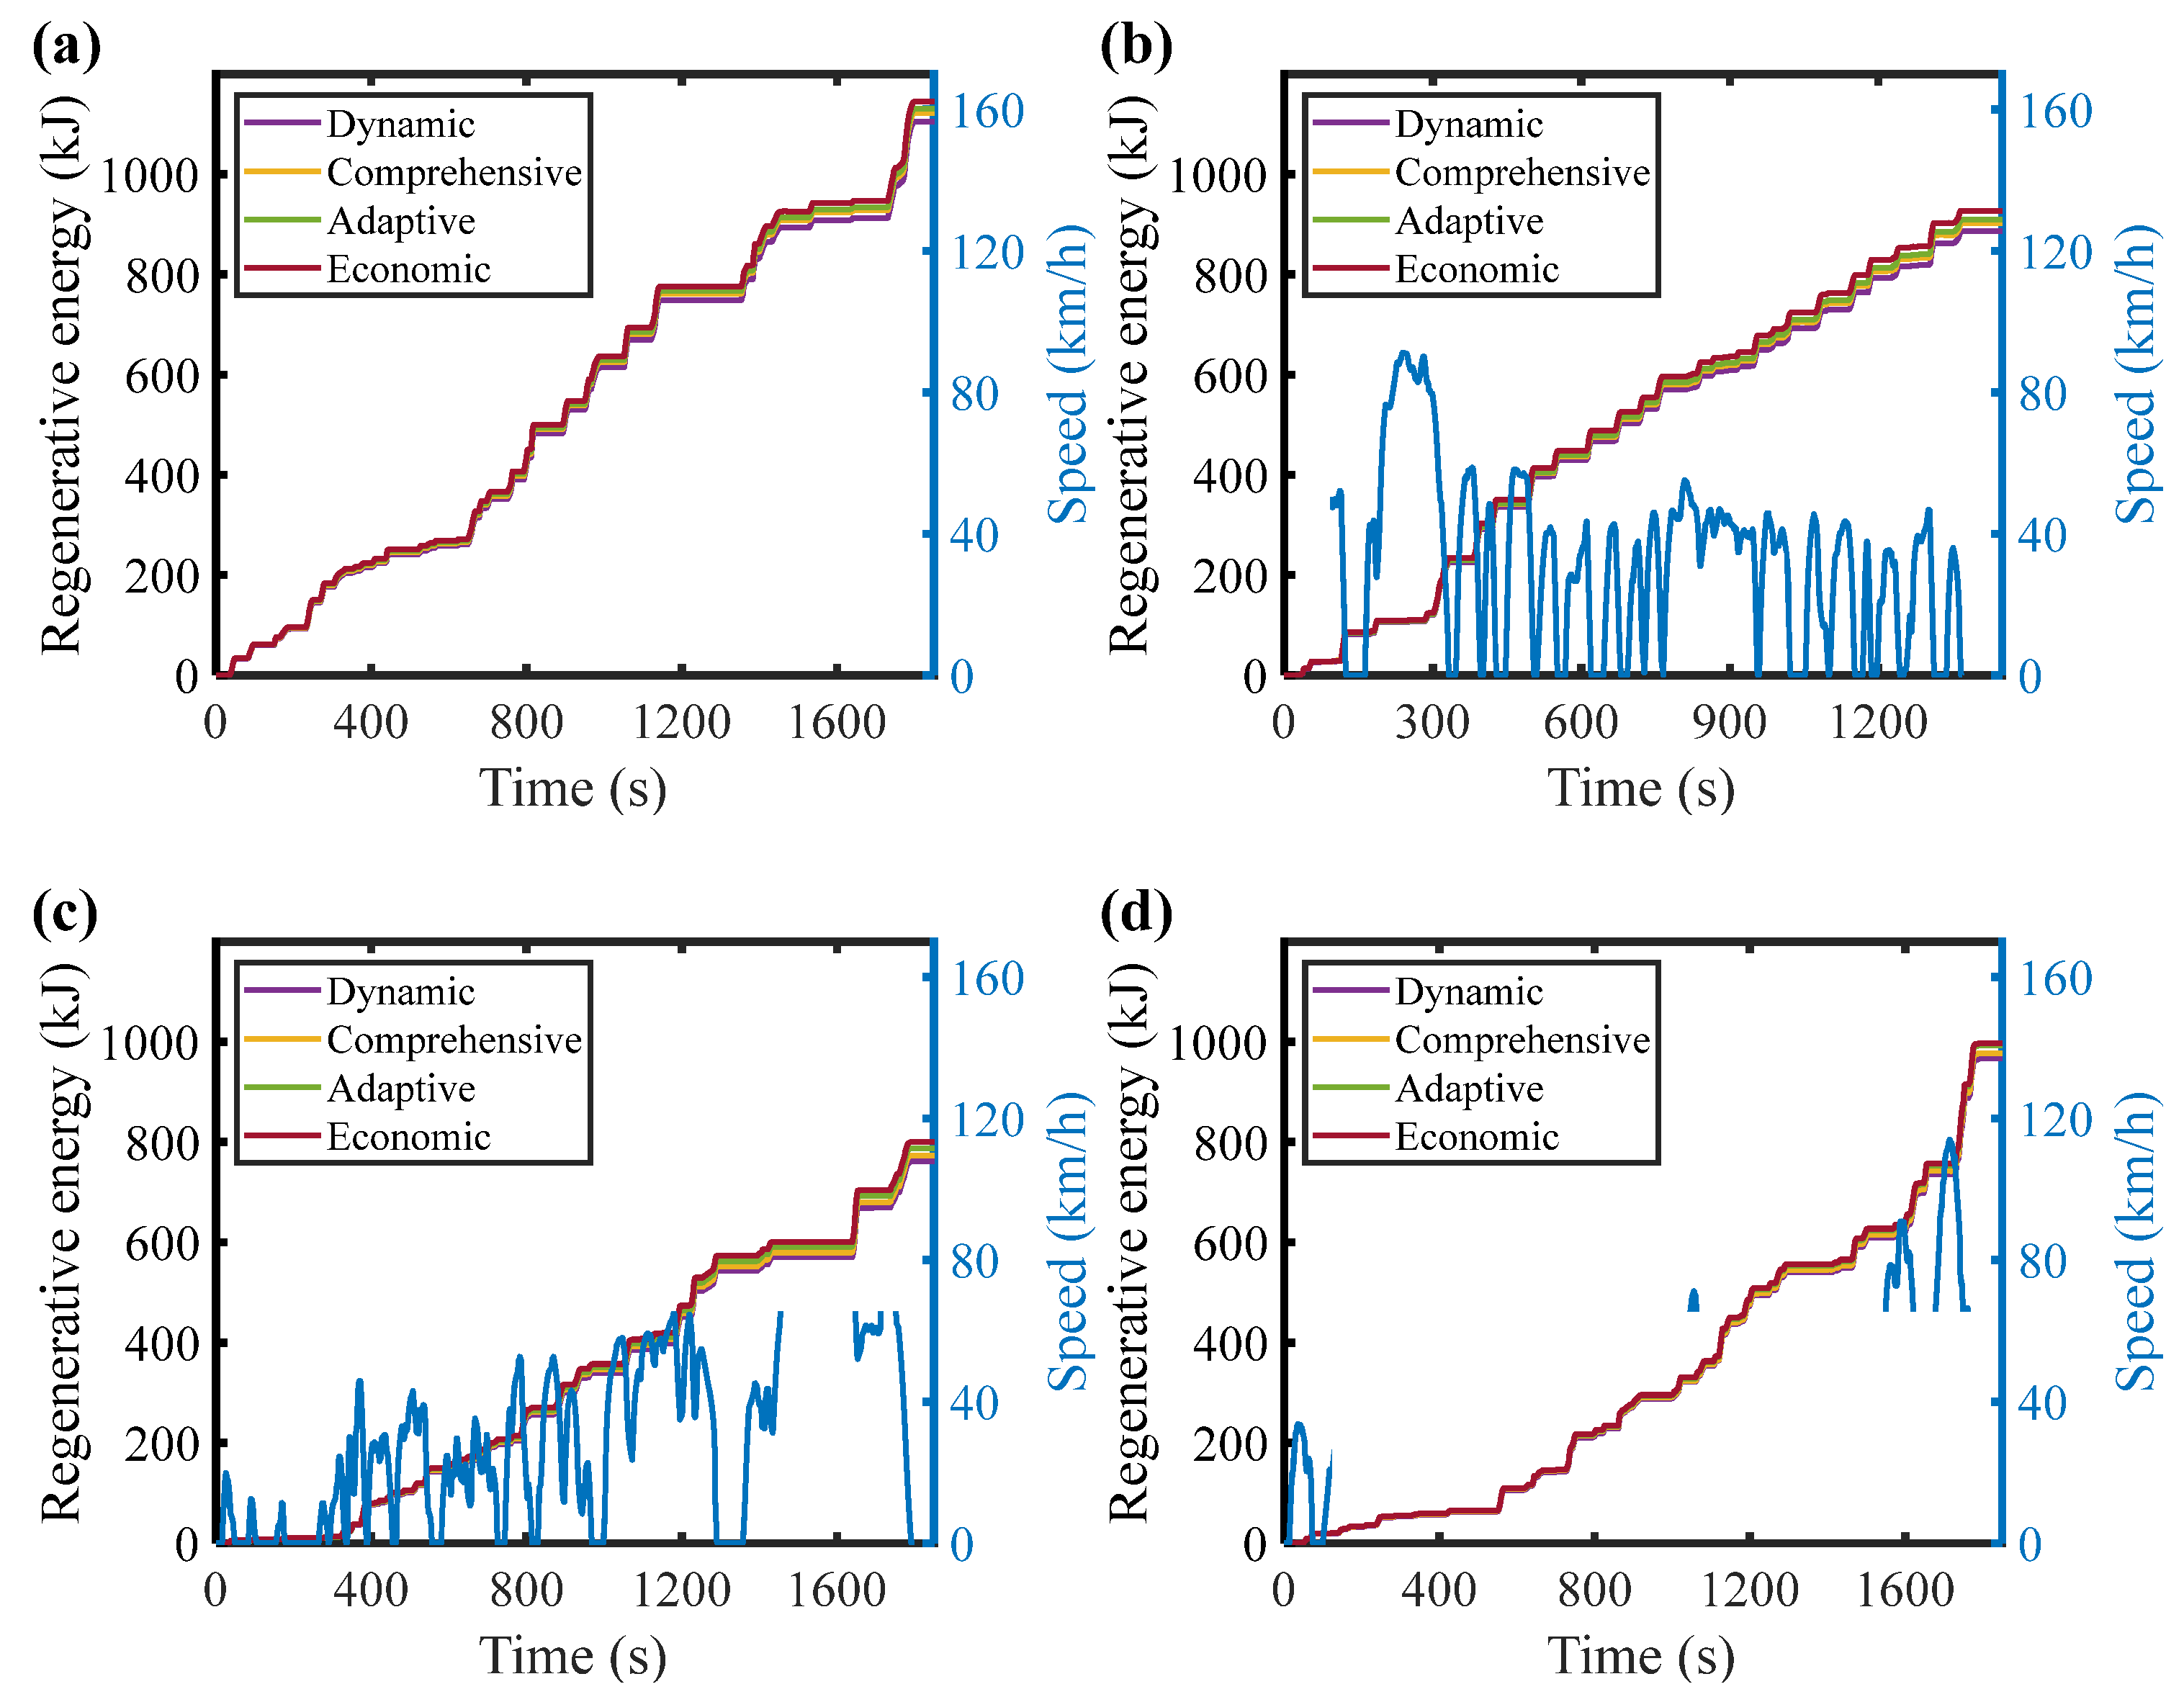
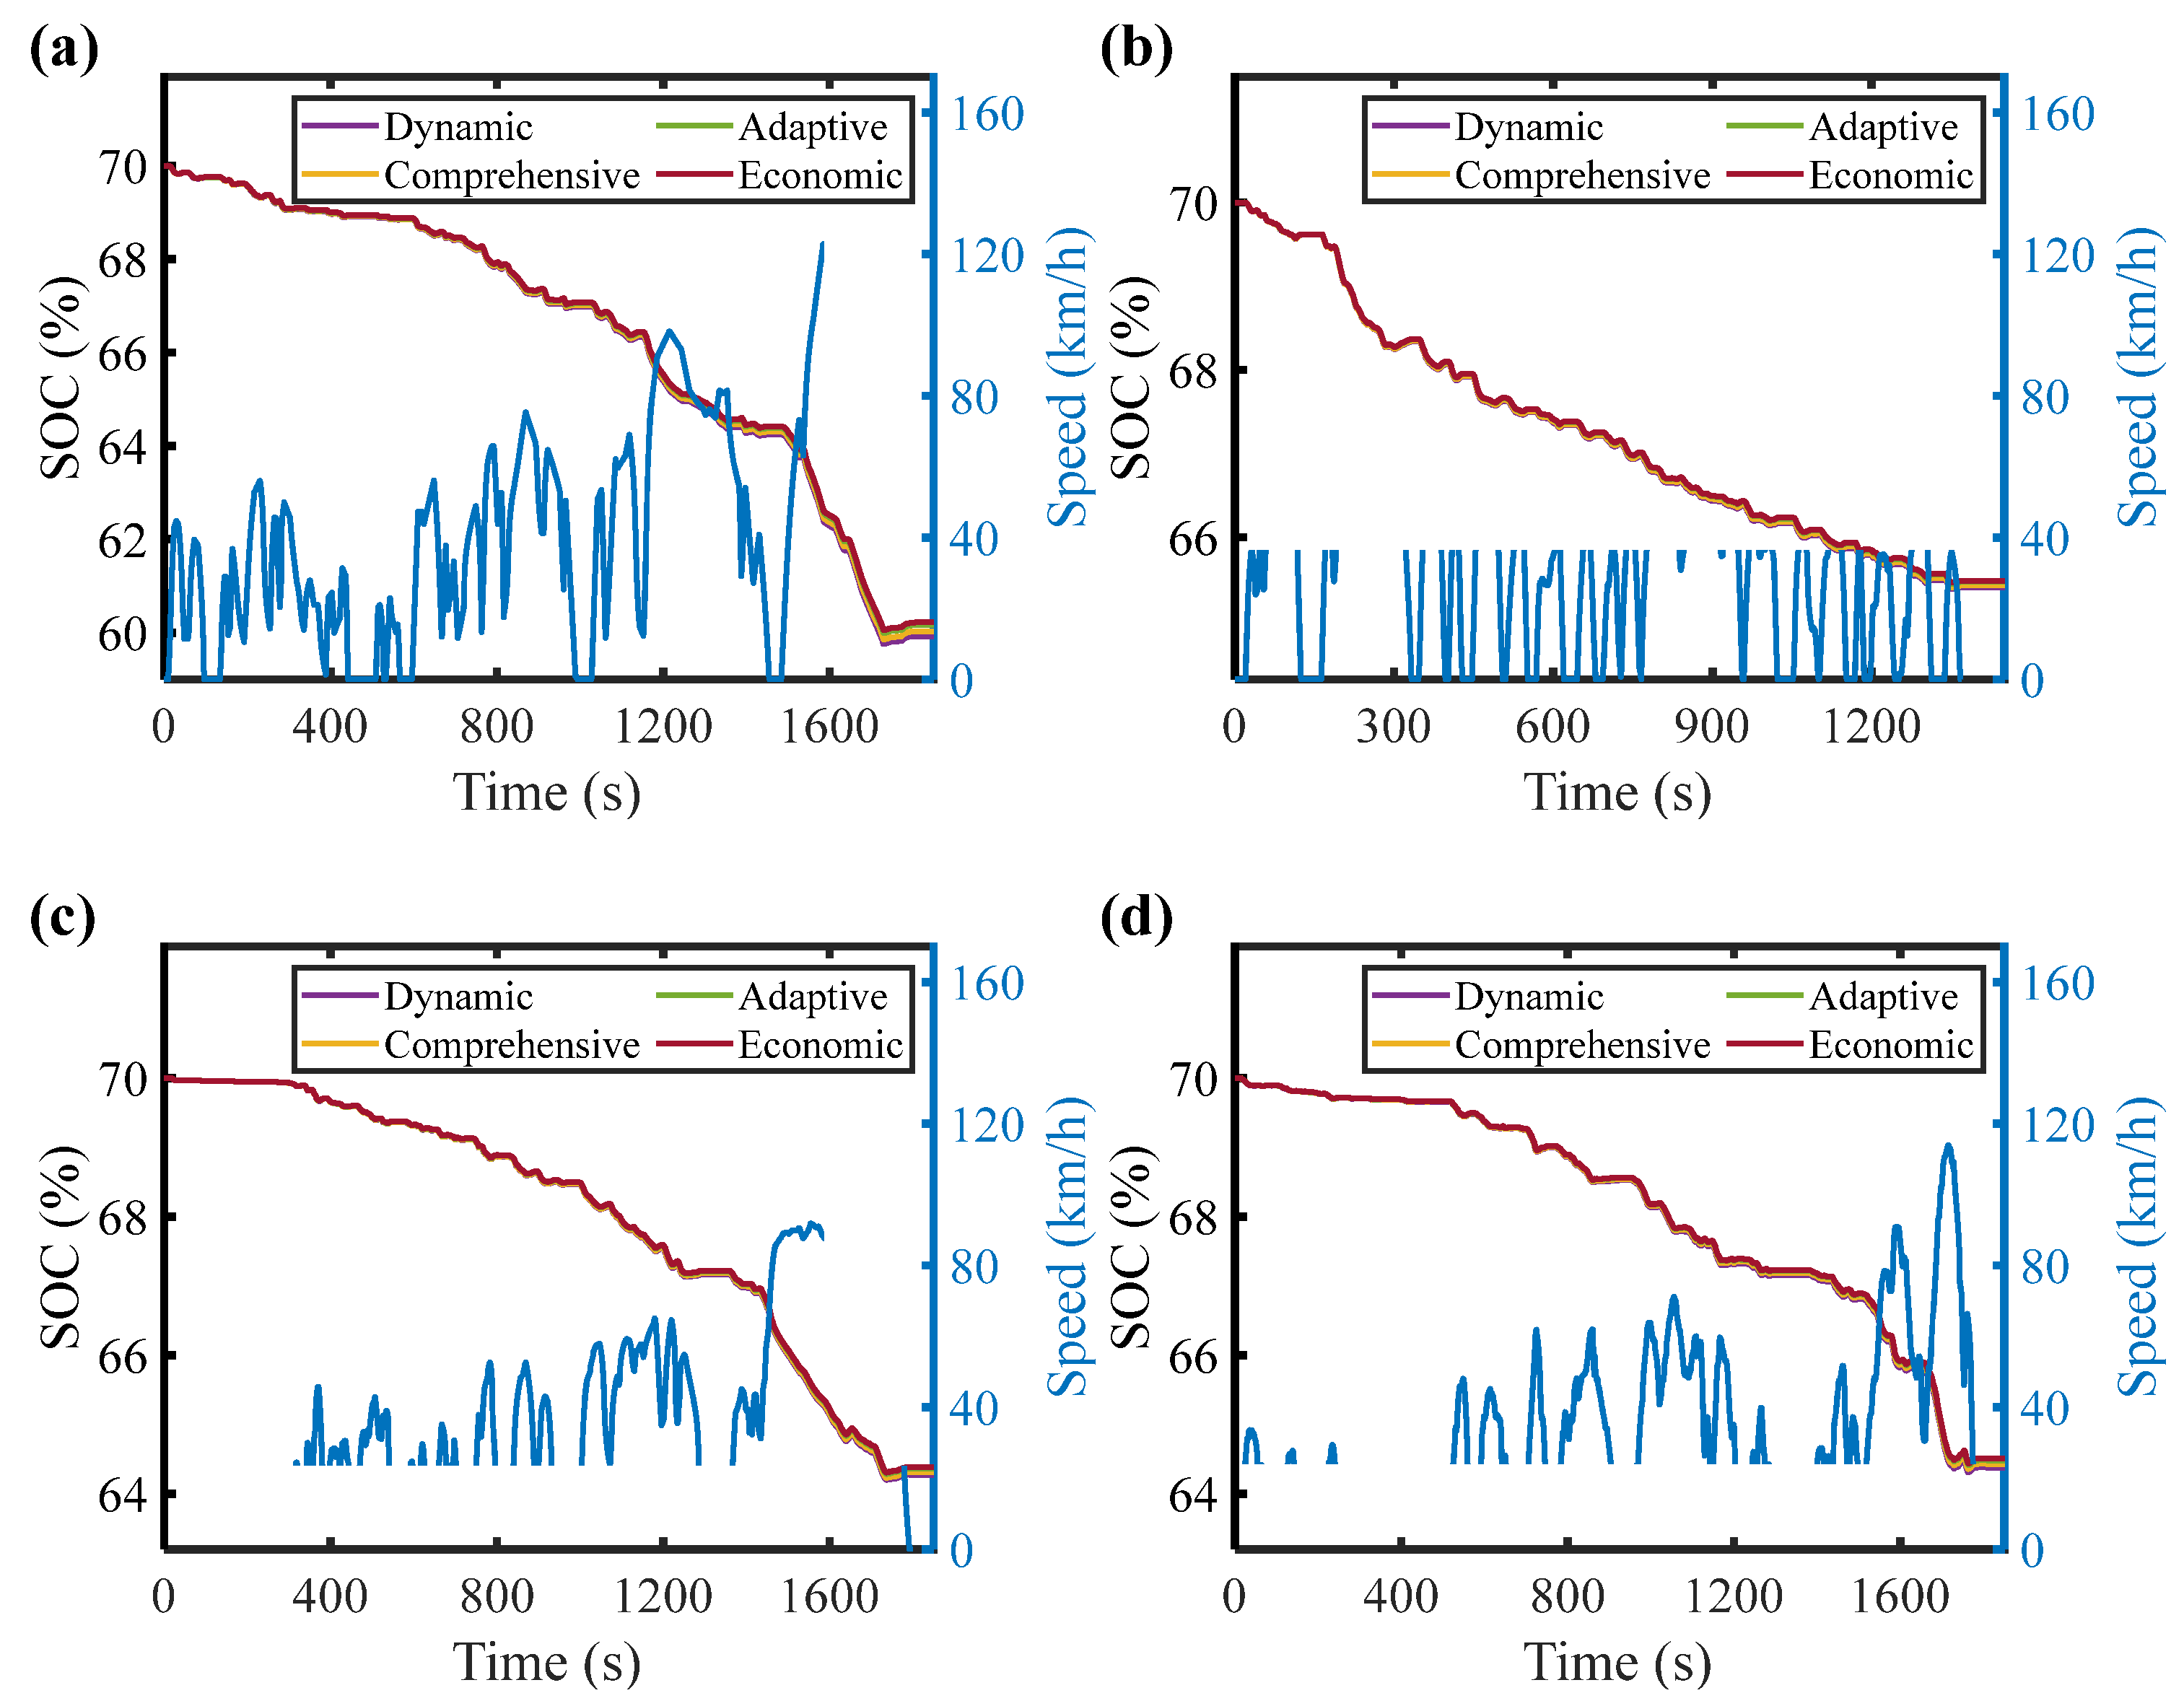
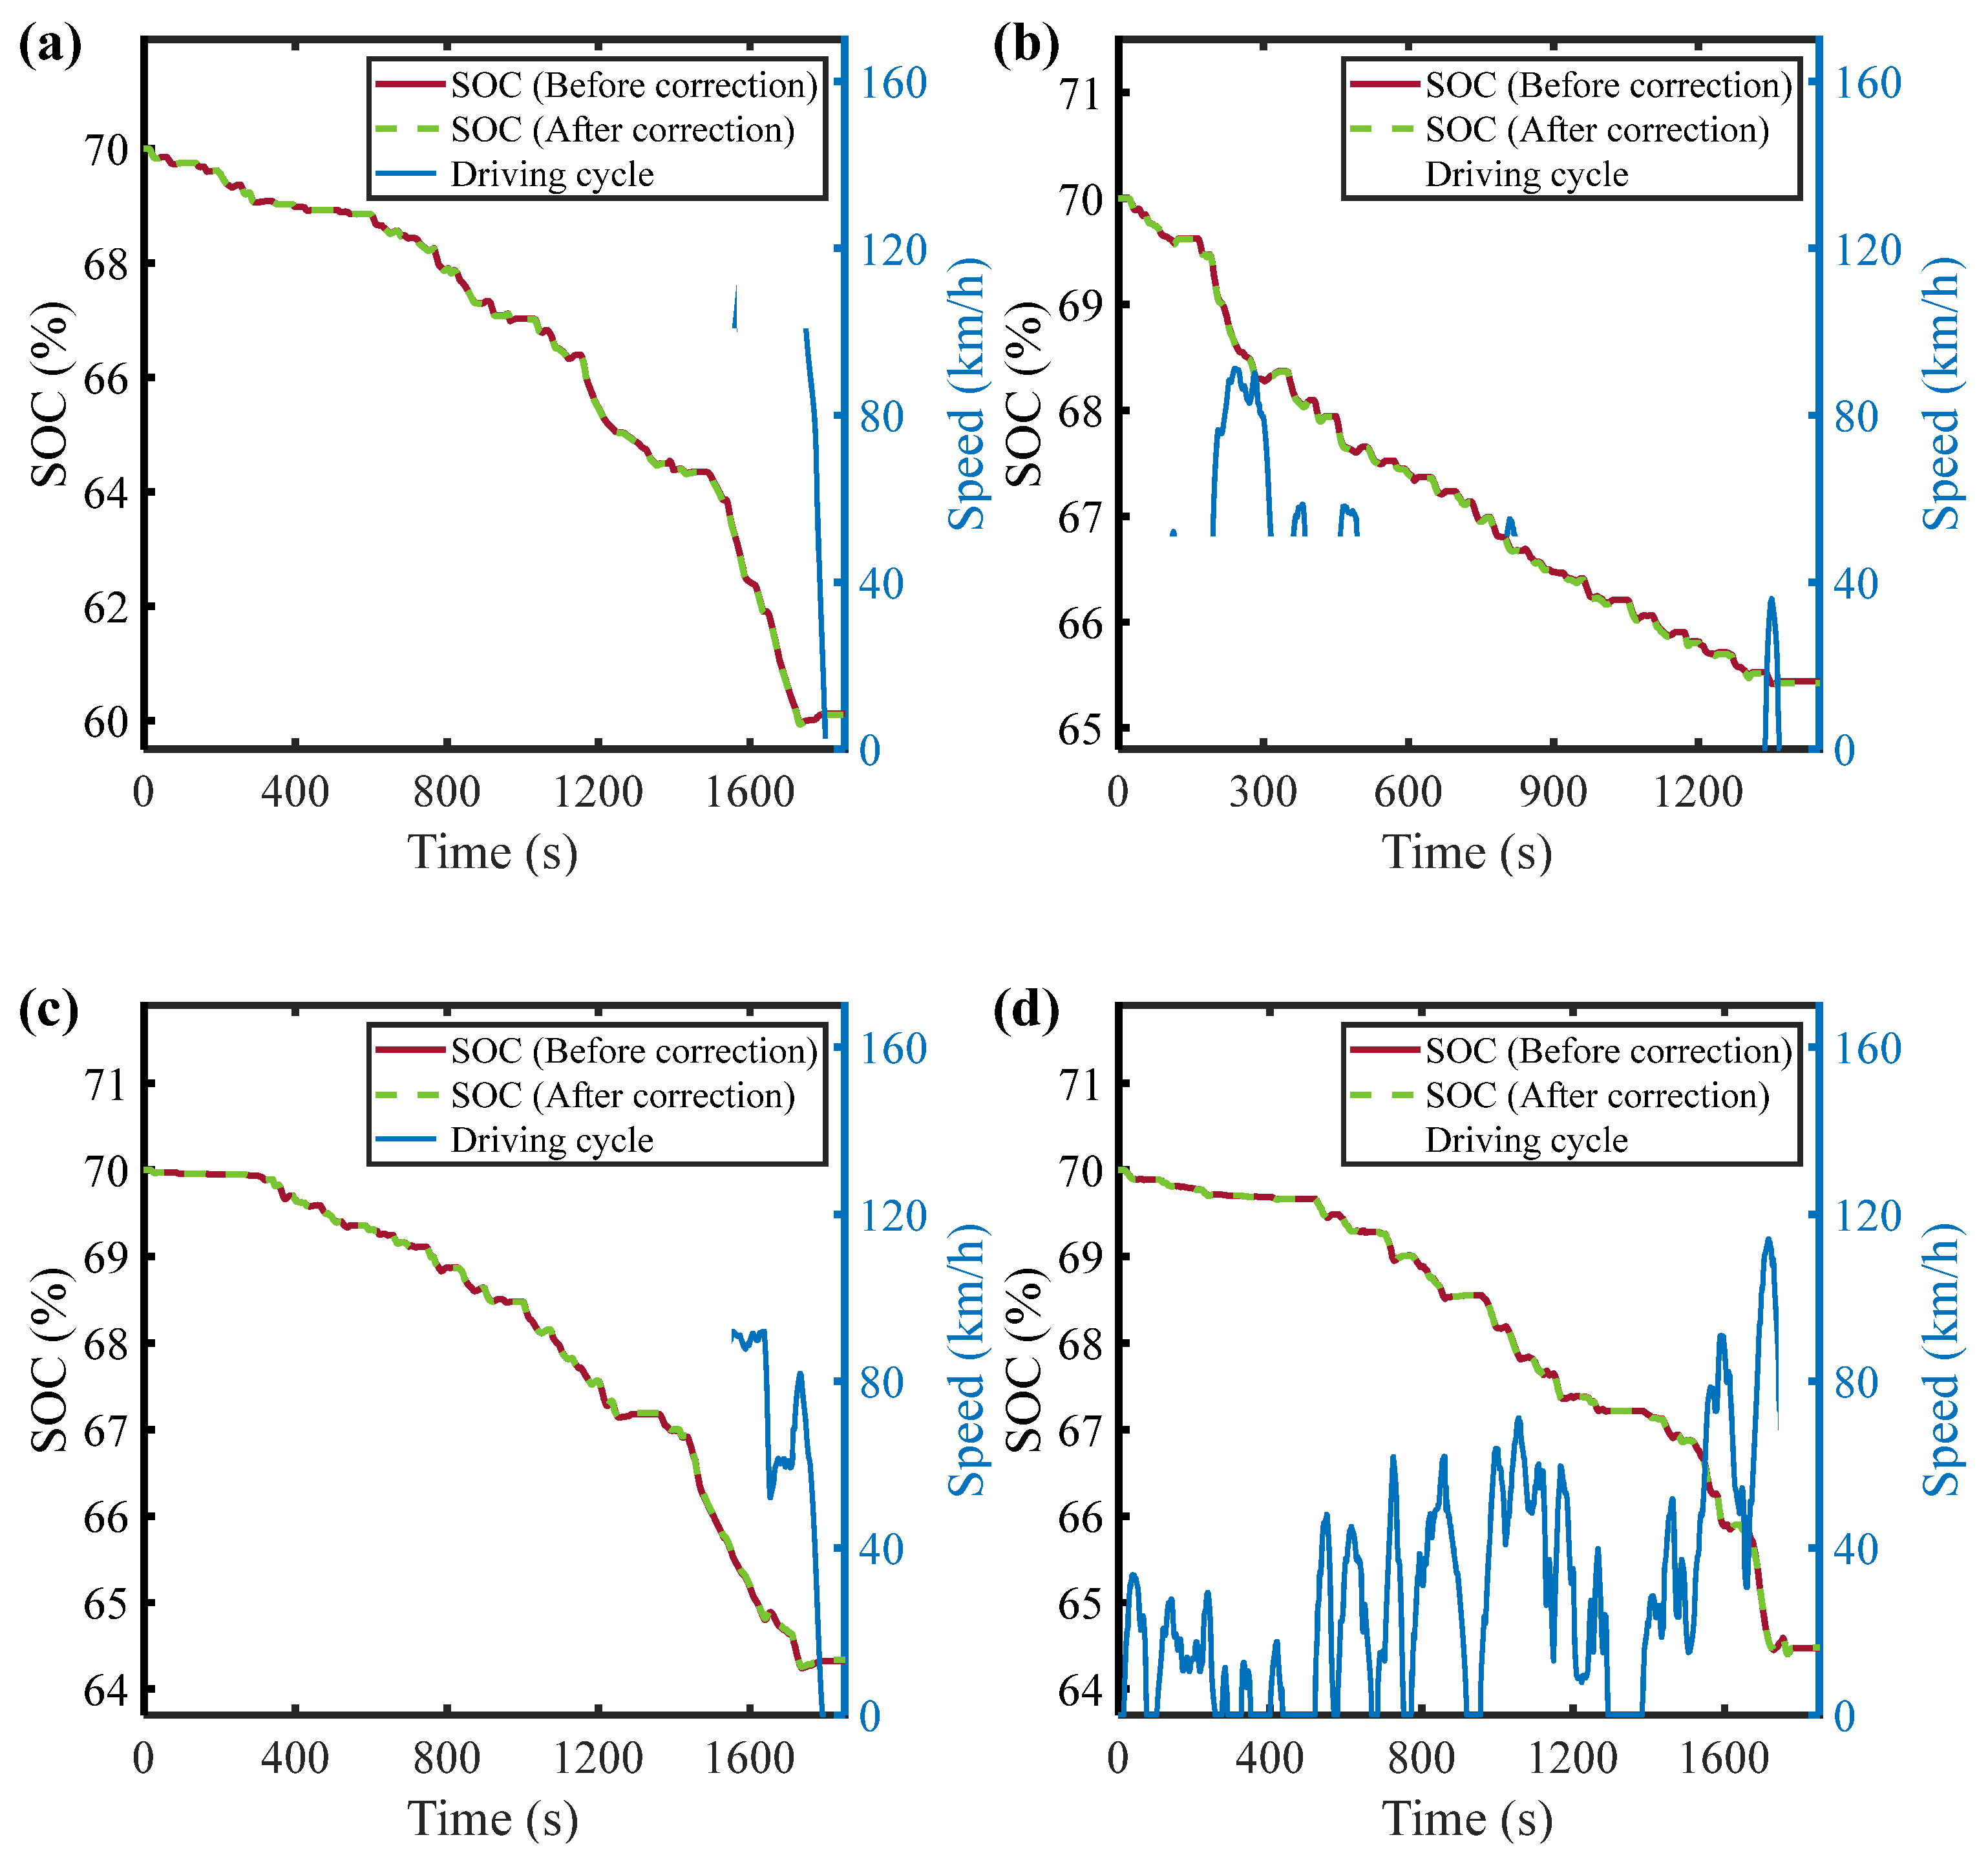
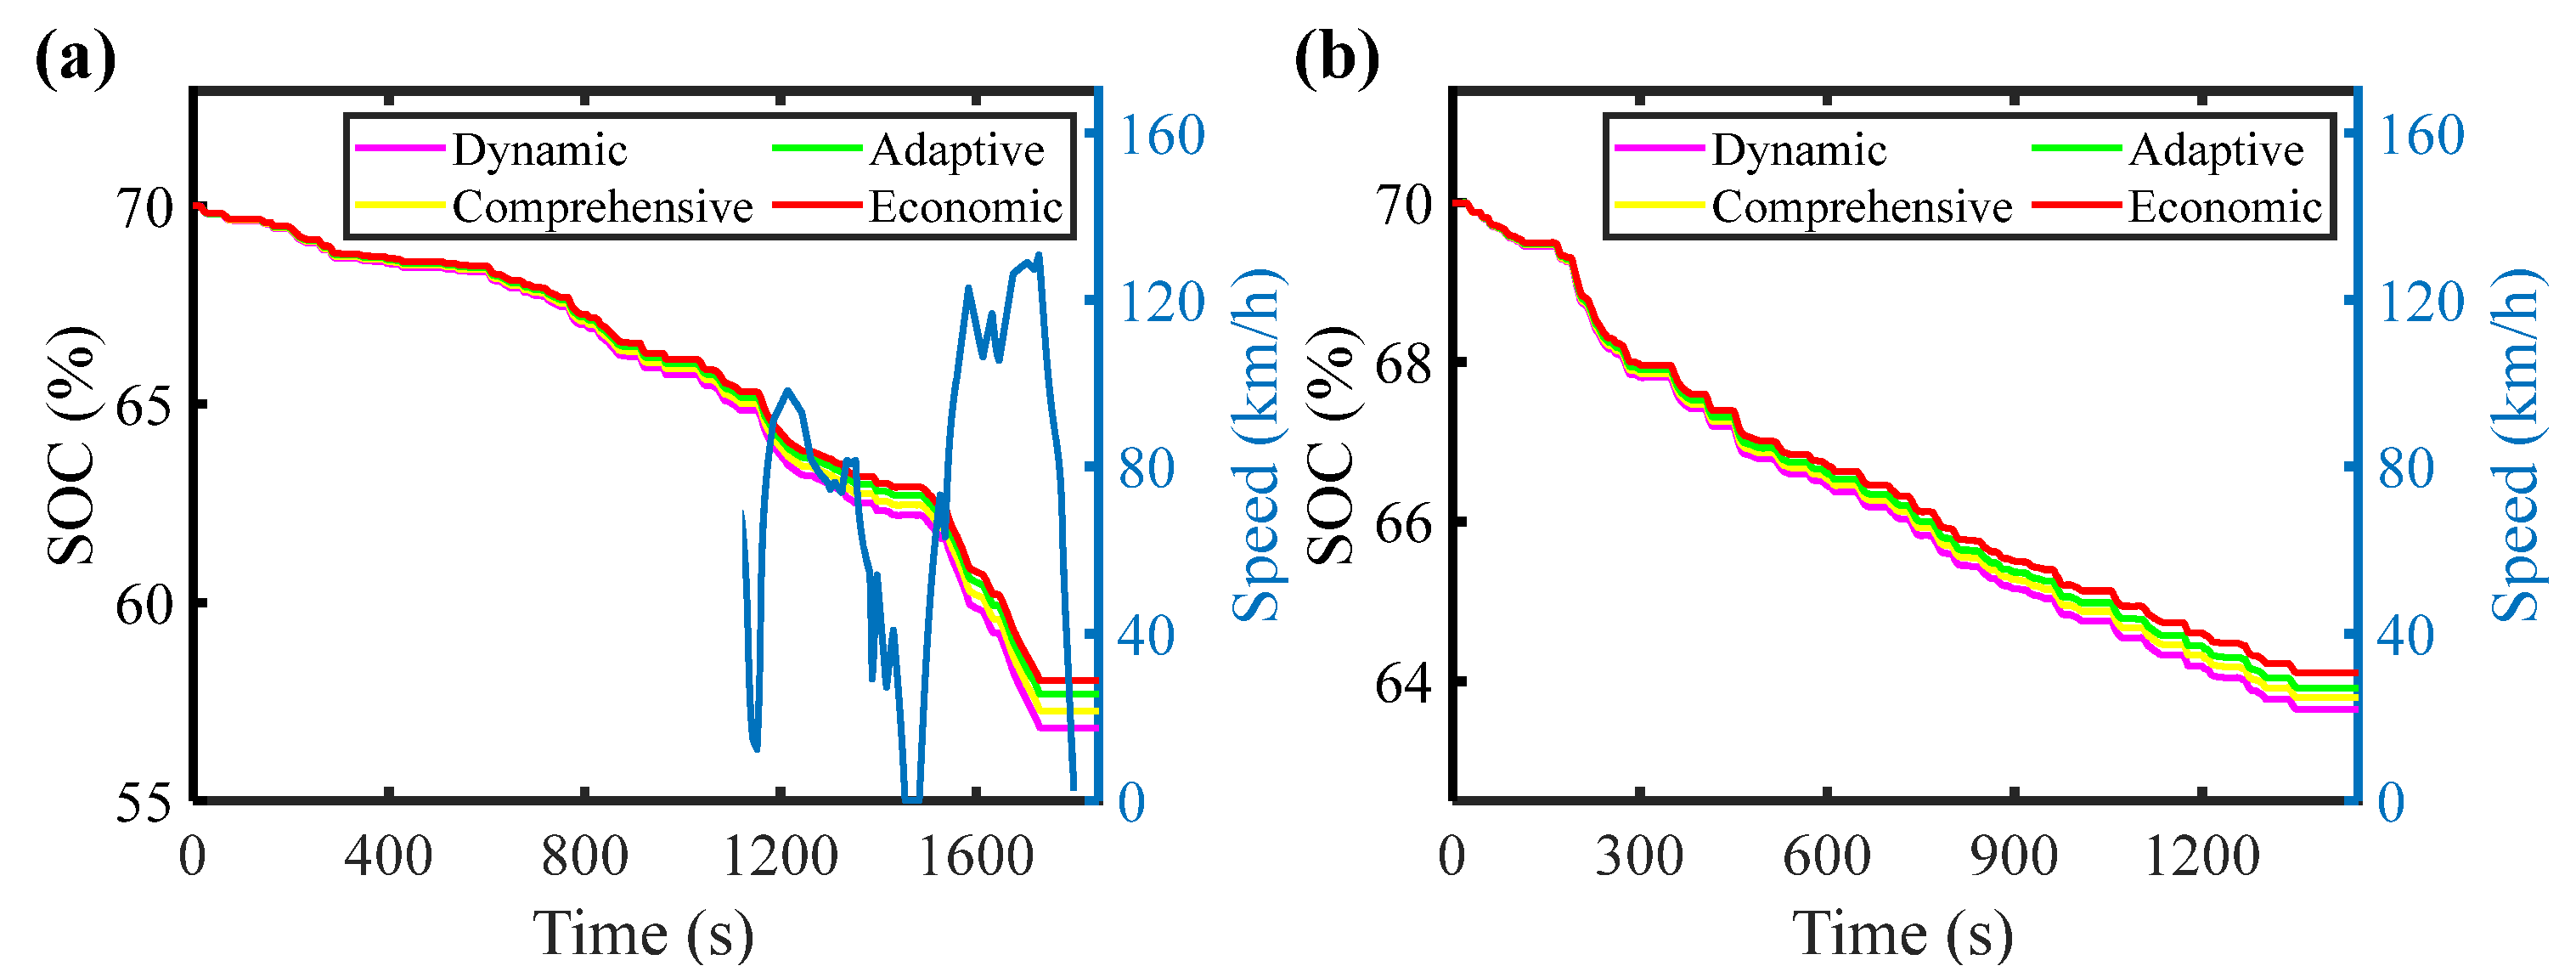
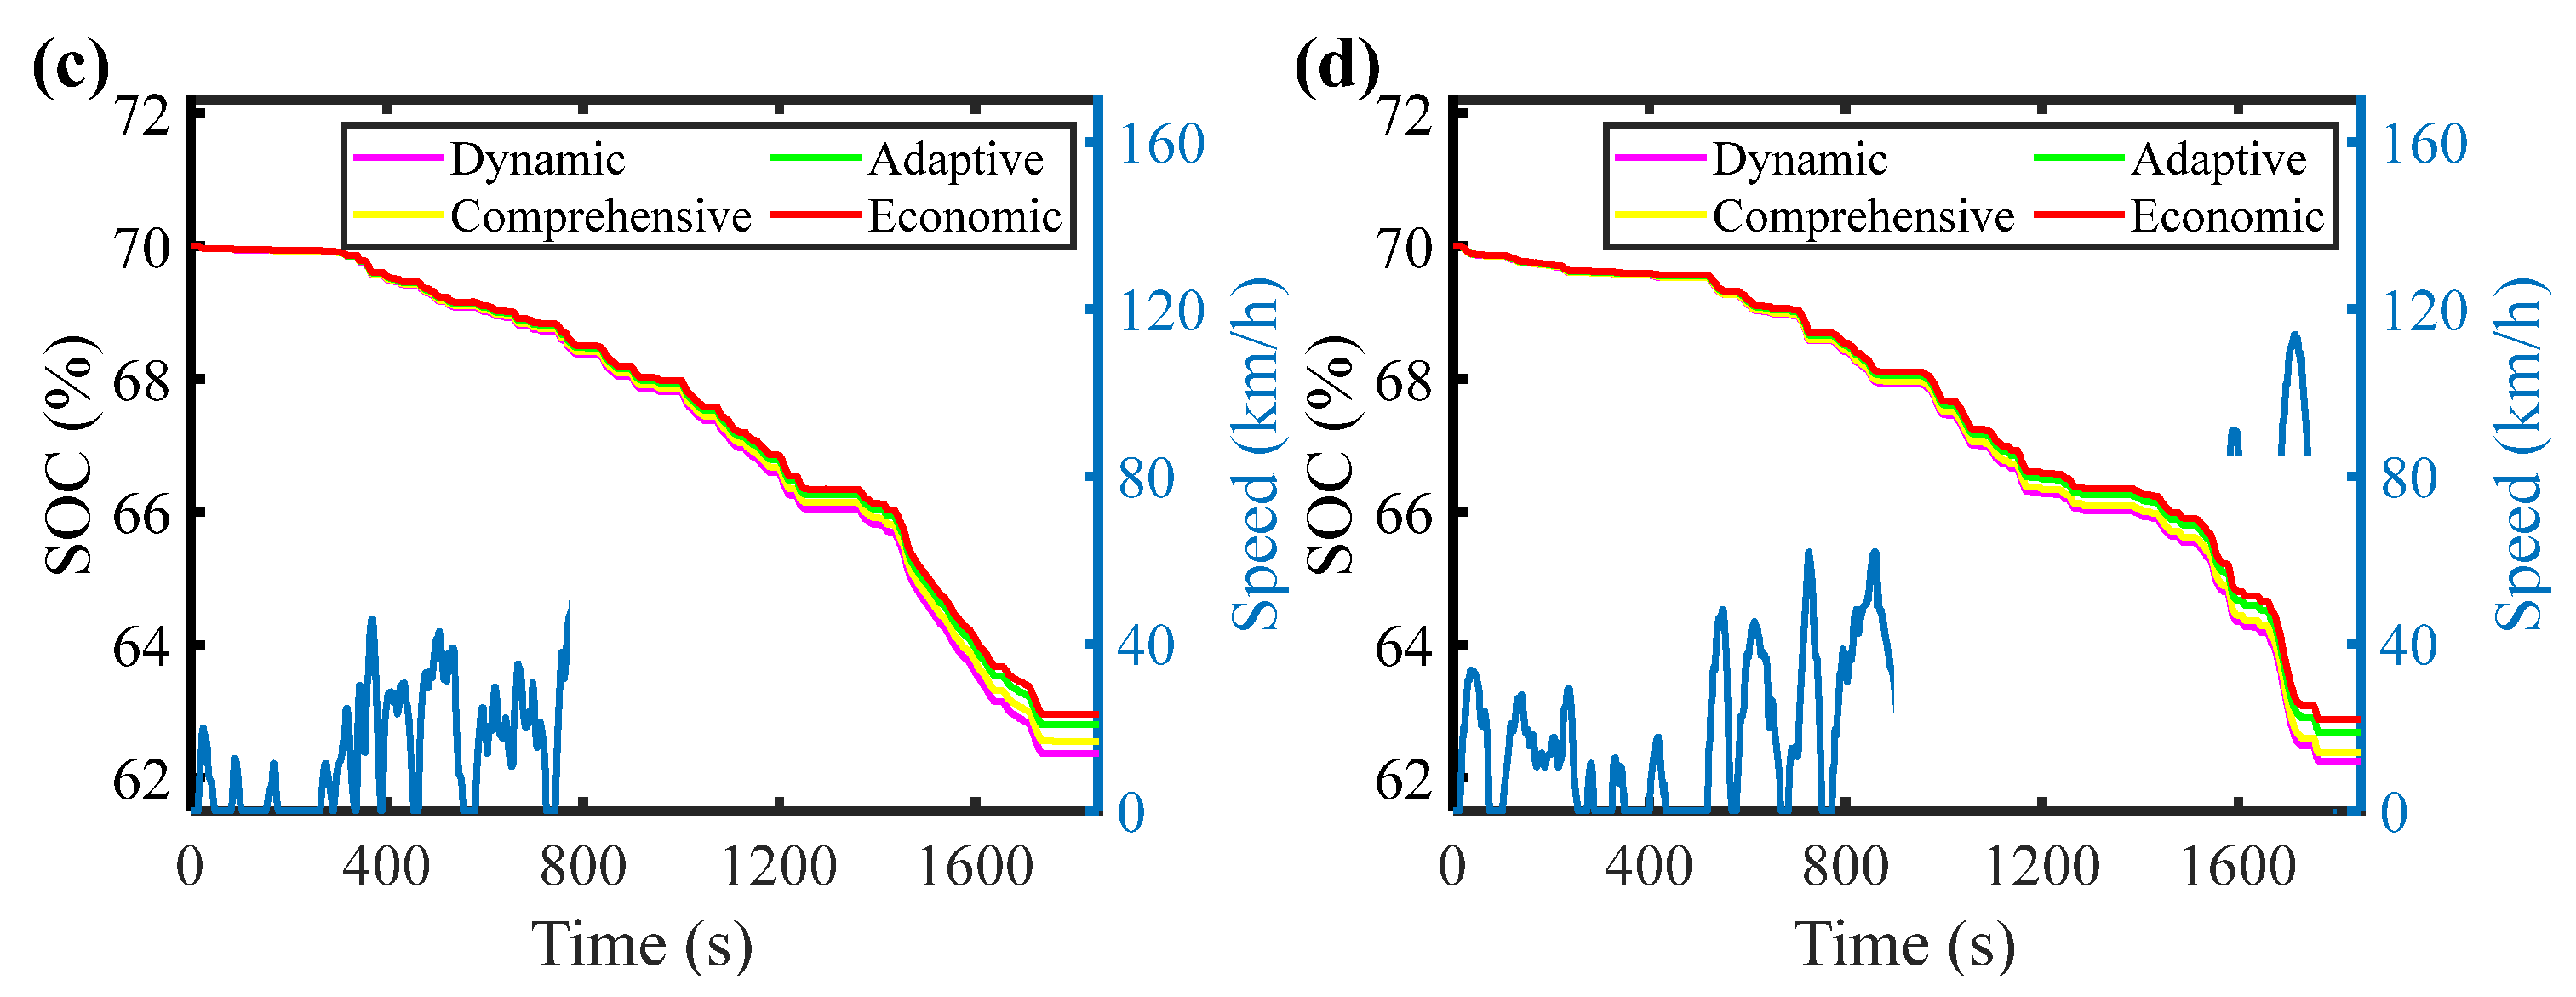
The variations in battery SOC before and after fuzzy correction under different driving cycles are shown in
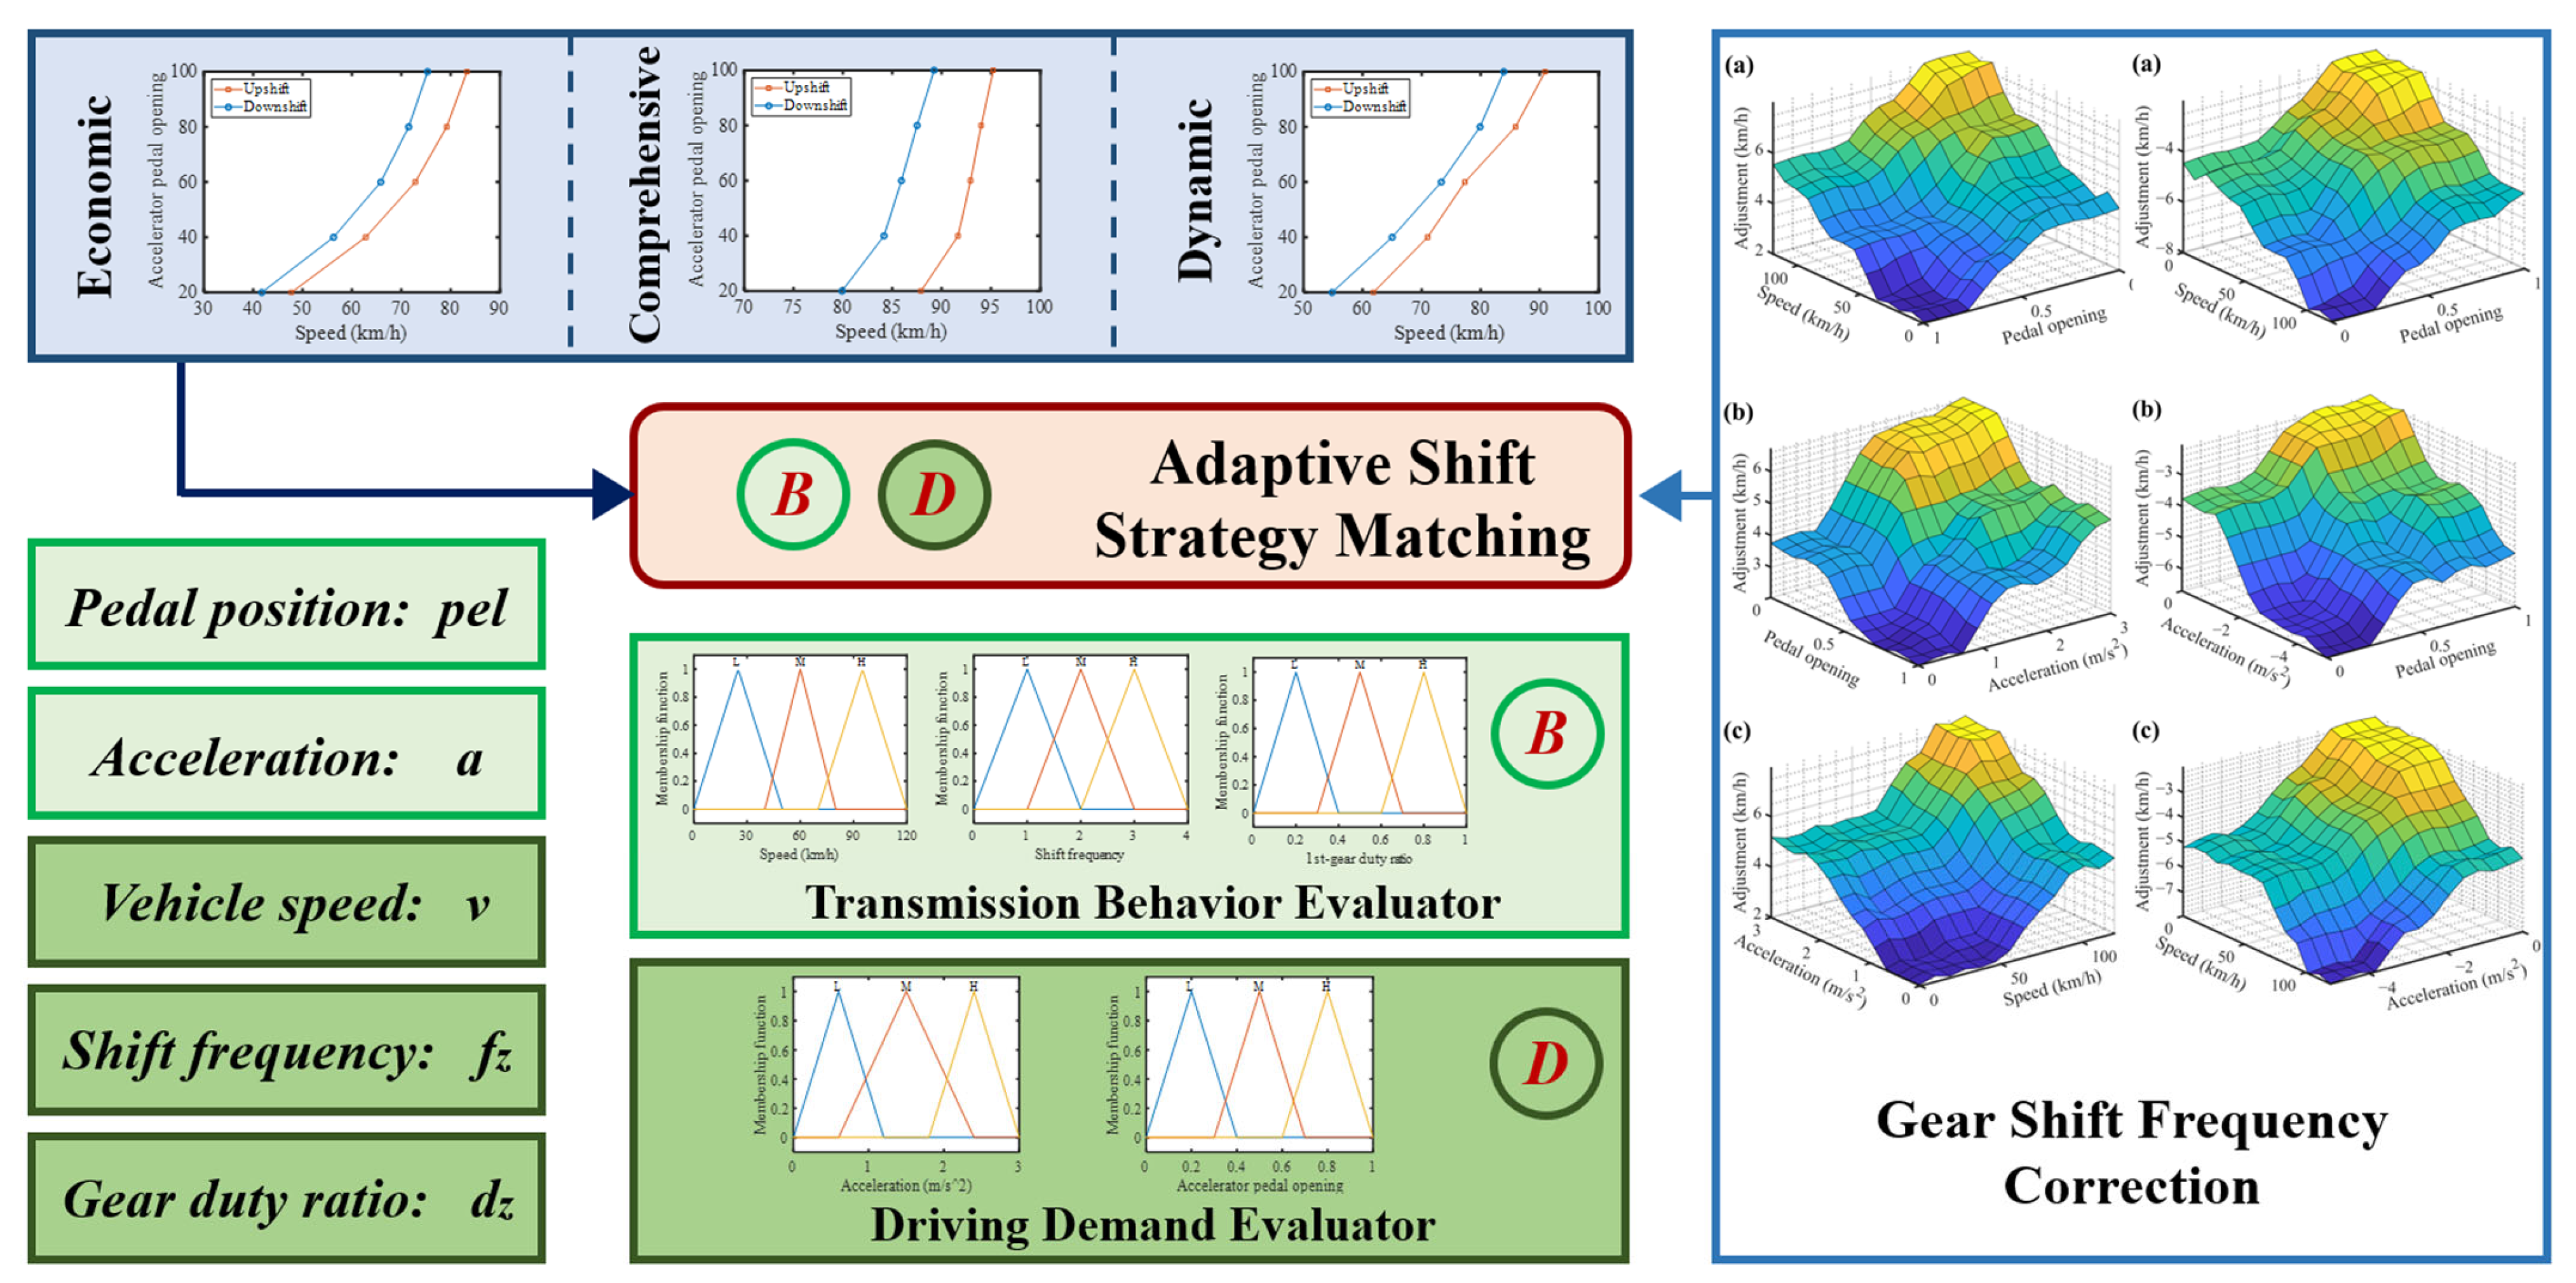
Figure 21. It can be seen that the energy consumption remains almost unchanged after shift frequency correction. Therefore, the proposed fuzzy correction strategy effectively suppresses redundant shifts without compromising the energy efficiency of the gear shift strategy. This not only improves the reliability and service life of the 2DCT, but also enhances driving comfort. The overall structure and implementation logic of the adaptive gear shift strategy is shown in
Figure 22.