5.1. Influence Analysis of Dual-Motor Compensation on Control Effect
The core objective of this study is to verify the suppression effect of the “dual-motor redundant compensation strategy” on unstable fluid loads, rather than directly reproducing the compressible characteristics of oil and gas media. Therefore, water can be selected as the medium for simulation experiments during the simulation process. Specifically, as a typical incompressible fluid, water has stable and easily obtainable physical property parameters such as density (approximately 980 kg/m3 at room temperature) and viscosity (approximately 0.001 Pa·s at room temperature). This can eliminate the interference of complex factors caused by pressure changes in compressible fluids (e.g., oil and gas), such as density fluctuations and pressure wave propagation delay, and avoid multi-variable coupling from masking the core effects of the load torque calculation model, compensation threshold triggering logic, and dual-motor coordinated control—thereby efficiently verifying the suppression effect of the compensation method on unstable fluid loads. Meanwhile, in the scenario of deep-sea oil and gas exploitation, the fluid inside the control valve mostly operates under a low Mach number (Ma < 0.3) flow state. Under this condition, the density change rate of the compressible fluid is less than 5%, and its flow laws (e.g., throttling effect, flow field distribution) are highly similar to those of water. In subsequent work, it is only necessary to replace the fluid physical property parameters in the simulation model to adapt to actual oil and gas media.
The settings of sensor bandwidth and accuracy in this study are as follows: the post-valve flow sensor is assumed to have a bandwidth of 100 Hz and an accuracy of ±0.5% full scale (FS); the valve inlet and outlet pressure sensors are assumed to have a bandwidth of 200 Hz and an accuracy of ±0.2% FS; the valve core displacement sensor is assumed to have a bandwidth of 500 Hz and an accuracy of ±0.01 mm. These assumptions are based on existing mature technologies and can meet the core requirement of “real-time monitoring-dynamic compensation” in this study.
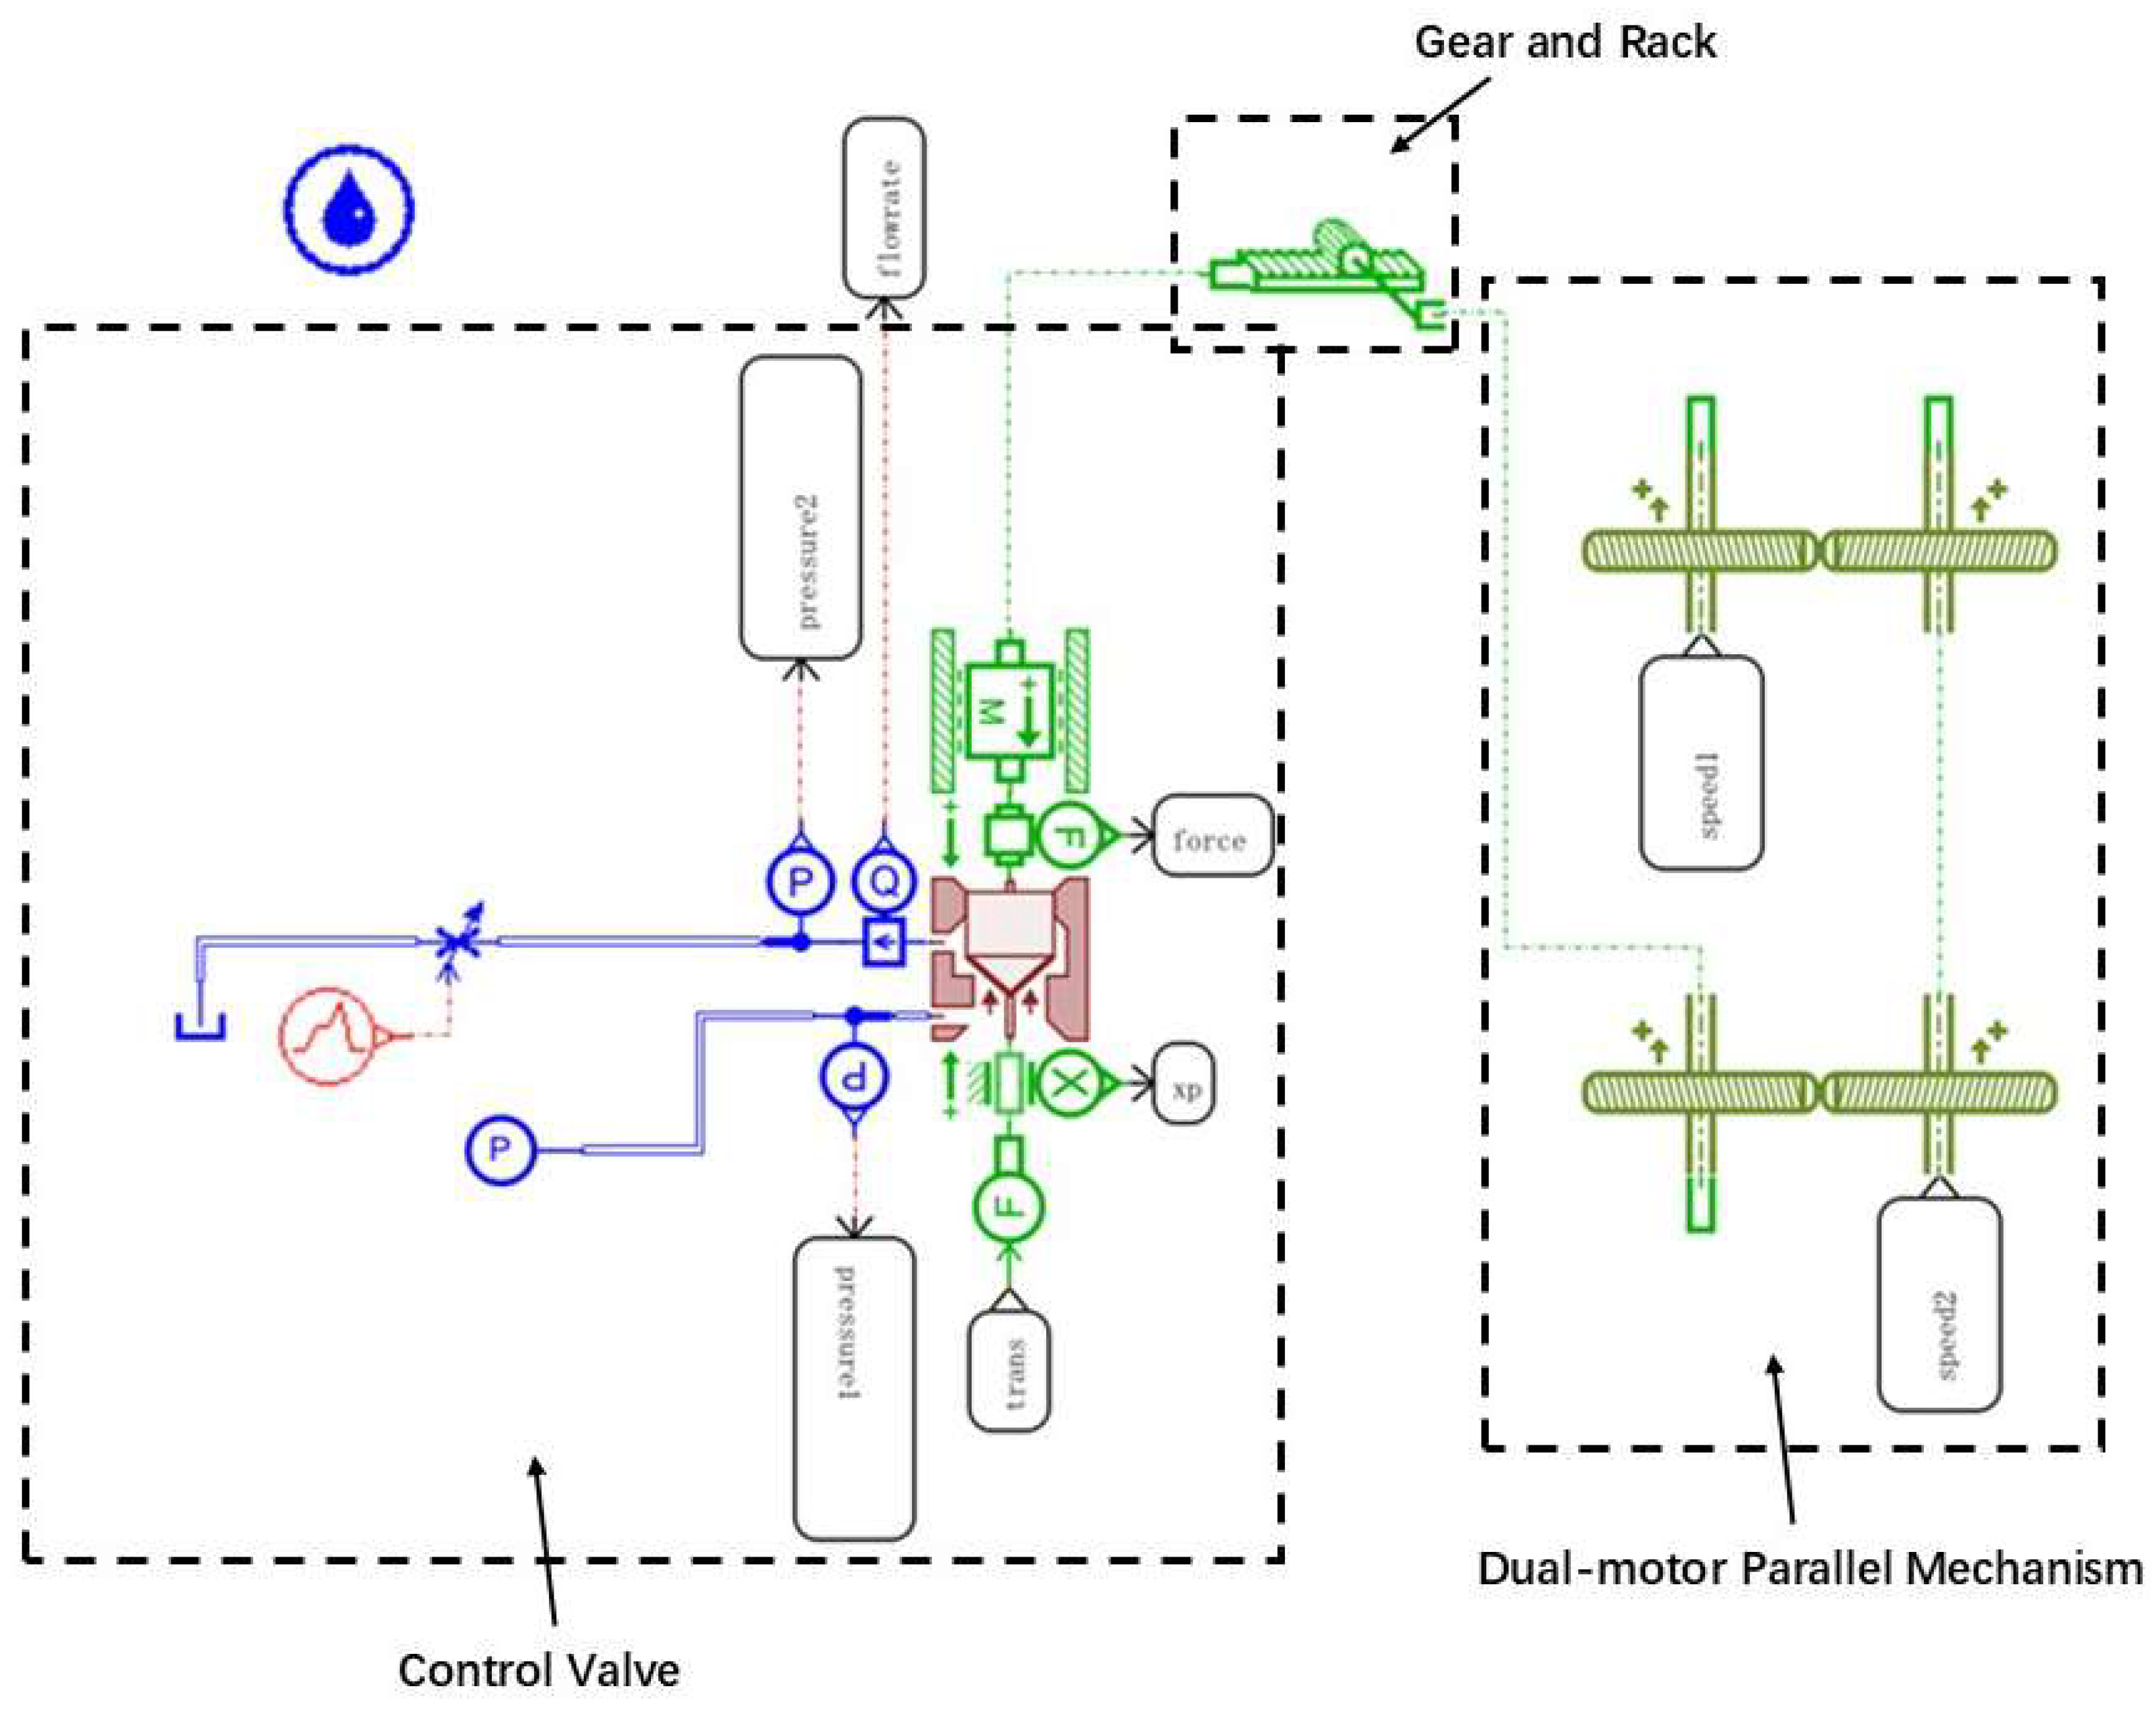
During the simulation, the post-valve flow is chosen as the regulated variable, with relevant parameters configured on the AMESim platform. The valve’s inlet pressure is set to 5 bar, the initial displacement of the valve core is configured as 0.005 m, the initial post-valve flow is set to 0 L/min, and the target post-valve flow is set to 5000 L/min. In this setup, the post-valve flow in each simulation scenario stabilizes within 1 s. Therefore, once the flow rate downstream of the valve stabilizes at the target value of 5000 L/min, an abrupt change is applied to the valve’s inlet pressure. To be specific, at the 1-s mark, the inlet pressure of the valve is increased to 15 bar. It is confirmed that each simulation scenario reaches the final outcome—either control failure or stable maintenance of the control target at the set value—within 1 s. As a result, the simulation length on the Simulink platform is set to 2 s. The control valve’s actuator dynamically adjusts the valve core’s displacement based on the signal output by the PID controller to adapt to the pressure surge. The diagram of the applied inlet pressure is shown in
Figure 12; as depicted, the valve’s inlet pressure remains at 5 bar from 0 to 1 s and shifts abruptly to 15 bar at 1 s. In the study, “pressure step changes at the inlet” is selected as a typical extreme operating condition. This choice is based on its characteristics of “high occurrence frequency in practical engineering (e.g., the impact of complex marine climates on upstream pipelines mentioned in
Section 1. Introduction) and clear disturbance characteristics”, which facilitates the quantitative verification of the proposed scheme’s effectiveness. In essence, the proposed scheme is a “general compensation solution centered on dynamic load response”. The core of the scheme is to calculate load torque in real time and quickly mobilize dual motors for coordinated compensation to respond to load changes; its universality lies in adapting to various extreme conditions (e.g., inlet pressure mutations, fluid property changes, multi-disturbance coupling) in nuclear power, deep-sea oil and gas fields, etc., without modifying the overall structure. Specific parameter settings are detailed in
Table 1 below:
Next, a comparison will be made of the system performance across three scenarios: single-motor drive without a compensation algorithm, single-motor drive with a compensation algorithm, and dual-motor drive with a compensation algorithm. This comparison will take place when the inlet fluid pressure of the valve undergoes an abrupt change from 5 bar to 15 bar at the 1-s mark. The comparison of the flow after the valve with single-motor non-compensation, single-motor compensation, and dual-motor compensation is shown in
Figure 13:
Where
Figure 13a is the flow diagram after the valve in the case of single-motor non-compensation algorithm,
Figure 13b is the flow diagram after the valve in the case of single-motor compensation algorithm, and
Figure 13c is the flow diagram after the valve in the case of dual-motor compensation algorithm.
Since no abrupt change occurs in the valve inlet pressure before the first second, the total load on the valve core is lower than the set compensation activation value at this time. Therefore, irrespective of whether the compensation algorithm is enabled, the changing pattern of the flow curve downstream of the valve stays the same, with both attaining the preset stable value of 5000 L/min at 0.77 s. At the beginning, the flow rises rapidly and overshoots, reaching the maximum value of 6750 L/min at 0.18 s, exceeding the target flow by 35%. Then, after PID adjustment, the flow gradually falls back and approaches the target value, and stabilizes at about 5000 L/min at 0.77 s.
At the 1-s timestamp, the inlet pressure of the control valve starts to increase, and this leads the downstream flow rate of the valve to surge abruptly to 10,000 L/min, which is twice the target flow rate. Under the action of PID, the flow rate starts to adjust back. At this point, the curve changes under three scenarios—single-motor without compensation, single-motor with compensation, and dual-motor with compensation—exhibit significant differences. In the scenario without compensation, the flow rate is difficult to adjust back, with a slow change in slope, and the servo motor struggles during the adjustment process. By the 2-s mark, the flow rate reaches roughly 13,600 L/min, which is 172% higher than the target flow rate and thus fails to meet the set target. In the case of single-motor compensation, although the servo motor can perform compensation adjustment, due to the excessive amplitude of pressure mutation, an overshoot phenomenon occurs. The single motor with the compensation algorithm fails to converge the overshoot; after 0.5 s of oscillation, the post-valve flow rate cannot stabilize at the target value. Eventually, at 1.5 s, the flow rate stagnates at 0 L/min, and the adjustment process fails to complete successfully. In the case of dual-motor compensation, after the load mutation, the flow rate drops rapidly, showing a significant change. Due to the excessive inlet pressure mutation, an overshoot phenomenon also occurs. After 0.7 s of oscillation, the post-valve flow rate reaches the target value at 1.7 s and remains basically stable thereafter.
In order to further reveal the reasons for the phenomenon in
Figure 13, the following analyzes the motor electromagnetic torque of single-motor non-compensation, single-motor compensation, and dual-motor compensation, as shown in
Figure 14:
Here,
Figure 14a shows the electromagnetic torque curve of the motor when using a single-motor without a compensation algorithm;
Figure 14b presents the electromagnetic torque curve of the motor under the scenario of a single-motor with a compensation algorithm;
Figure 14c displays the electromagnetic torque curve of the main motor in the case of a dual-motor compensation algorithm; and
Figure 14d illustrates the electromagnetic torque curve of the auxiliary motor under the dual-motor compensation algorithm.
Figure 14 compares the changes in motor electromagnetic torque under four scenarios: single-motor without compensation, single-motor with compensation, and dual-motor compensation (including the main motor and the auxiliary motor). During the phase from 0 to 1 s (when the valve inlet pressure does not mutate), the auxiliary motor in the dual-motor compensation scenario is not activated (
Figure 14d). The torque variation trends of the single-motor without compensation (
Figure 14a), single-motor with compensation (
Figure 14b), and the main motor in dual-motor compensation (
Figure 14c) are consistent: they first oscillate in the range of −100 to 125 N·m, then exhibit damped oscillation after 0.44 s, and stabilize at −12 N·m at 0.77 s. At this point, the post-valve flow rate reaches the target value.
During the phase after 1 s (when the valve inlet pressure mutates to 15 bar), the motor electromagnetic torque of the single-motor without compensation (
Figure 14a) oscillates significantly at high frequency in the range of −175 to 25 N·m, tends to stabilize after 1.65 s, and stabilizes at 10 N·m at 1.75 s. However, the post-valve flow rate exceeds the target value by 170%, resulting in control failure. For the single-motor with compensation (
Figure 14b), the motor electromagnetic torque fluctuates in the range of −148 to 60 N·m; the post-valve flow rate drops to 0 L/min at 1.5 s, and thereafter the motor still oscillates within this range but fails to adjust the flow rate, leading to compensation failure. For the dual-motor compensation (
Figure 14c,d), the electromagnetic torques of the main and auxiliary motors fluctuate in the range of −160 to 30 N·m; the torques of the main and auxiliary motors stabilize synchronously at 1.8 s, and the post-valve flow rate reaches the target value without any failure.
The comparison of the motor speed of single-motor non-compensation, single-motor compensation, and dual-motor compensation is shown in
Figure 15:
In this context,
Figure 15a depicts the motor speed profile for the scenario involving a single-motor without a compensation algorithm;
Figure 15b illustrates the motor speed profile when a single motor is used with a compensation algorithm;
Figure 15c shows the speed profile of the main motor under the dual-motor compensation algorithm; and
Figure 15d illustrates the rotational speed curve of the auxiliary motor when the dual-motor compensation algorithm is applied.
During the phase from 0 to 1 s (when the valve inlet pressure does not mutate), the auxiliary motor in the dual-motor compensation scenario is not activated (
Figure 15d). The speed variation trends of the single-motor without compensation (
Figure 15a), single-motor with compensation (
Figure 15b), and the main motor in dual-motor compensation (
Figure 15c) are consistent: all quickly reach a maximum value of 260 rad/s, then drop to 0 rad/s at 0.18 s (at this point, the valve core opening is maximum and the flow rate reaches its peak), rise to a maximum negative value of −250 rad/s (overshoot) at 0.25 s, exhibit damped oscillation after 0.44 s, and stabilize at 0 rad/s at 0.77 s—corresponding to the post-valve flow rate reaching the target value.
During the phase after 1 s (when the valve inlet pressure mutates to 15 bar), the motor speed of the single-motor without compensation (
Figure 15a) first rises rapidly to approximately 225 rad/s and oscillates around this value, drops sharply at 1.65 s, reaches 0 rad/s at 1.75 s and then reverses direction with the speed increasing continuously, and finally reaches a maximum negative value of −250 rad/s at 1.86 s. In this case, the post-valve flow rate exceeds the target value by 170%, failing to achieve regulation. For the single-motor with compensation (
Figure 15b), the motor rotates in the reverse direction, reaches a minimum negative value of −145 rad/s at 1.2 s, and drops to 0 rad/s at 1.6 s (overshoot); thereafter, it rotates forward and oscillates around 250 rad/s, but the post-valve flow rate drops to 0 L/min after 1.6 s, making regulation impossible. For the dual-motor compensation (
Figure 15c,d), the main and auxiliary motors rotate in the reverse direction, reach a minimum negative value of −148 rad/s at 1.3 s, drop to 0 rad/s at 1.16 s, and then rotate forward; after 0.7 s of oscillation, the speed stabilizes at 0 rad/s, and at this point, the post-valve flow rate also stabilizes at the target value of 5000 L/min.
Under extreme working conditions, the dual-motor compensation scheme can quickly respond to load changes, realize the cooperative adjustment of dual-motor torque in the form of positive feedback, and improve the dynamic response capability and operation stability of the valve. In general, the flow stabilization effect of dual-motor compensation is more significant than that of single-motor non-compensation and single-motor compensation, and it shows better regulation performance and stability in the face of pressure mutation scenarios. At the same time, the dual-motor redundant design can make the other motor immediately take over the work when one motor is damaged, significantly enhancing the system reliability, and providing a new idea for the reliability optimization of control valves for deep-sea oil and gas extraction.
5.2. Influence Analysis of Variable Transmission Ratio on Dual-Motor Compensation Control Effect
After studying the influence of dual-motor compensation on the control effect, we study the influence of the transmission ratio on the compensation effect by changing the transmission ratio between the gear connected to the motor and the gear on the output shaft in the AMESim model. When the dual motor is turned on for compensation, the flow change at the inlet of the valve is kept as shown in
Figure 12.
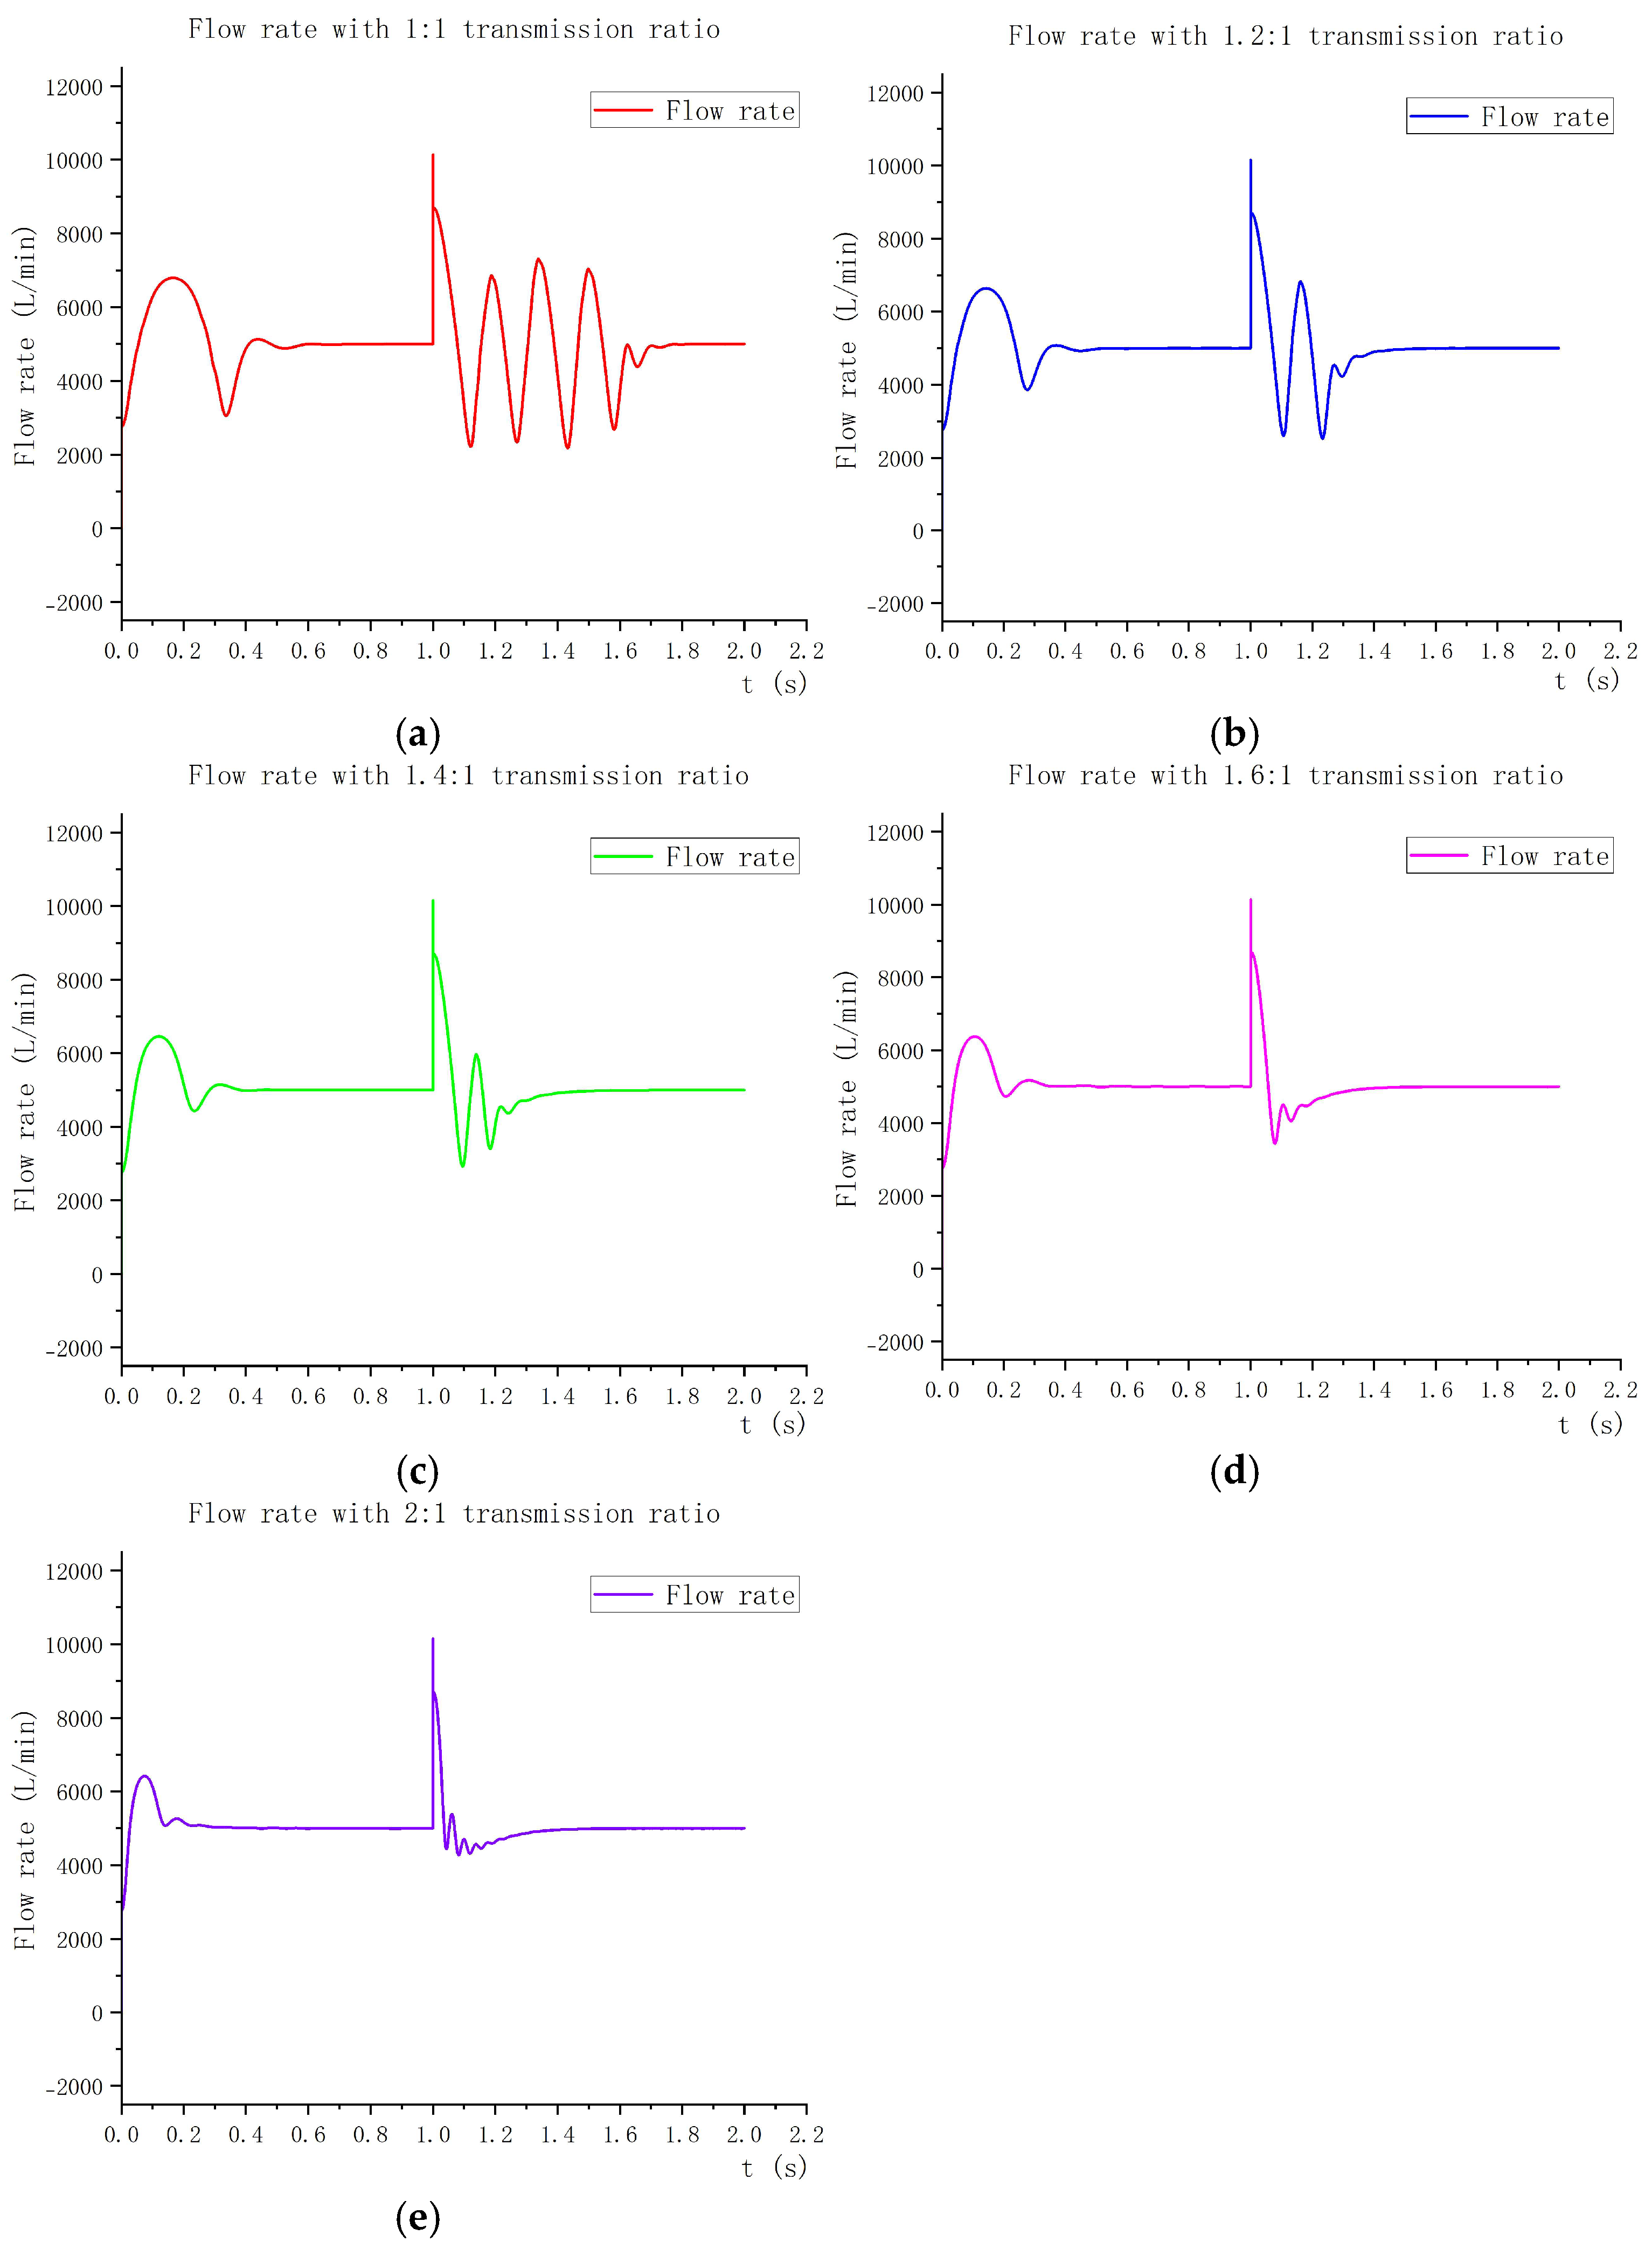
The comparison of the flow after the valve with the dual-motor compensation algorithm under different transmission ratios is shown in
Figure 16. It is found in the simulation that the influence on the control result is not significant when the transmission ratio exceeds 1.6:1, and the control result deteriorates with an excessively large transmission ratio. For instance, as shown in
Figure 16e, when the transmission ratio is set to 2:1, the control effect on the post-valve flow does not show obvious improvement, and the oscillation frequency and times even increase between 1 s and 1.3 s. Therefore, the transmission ratios are set to 1:1, 1.2:1, 1.4:1, and 1.6:1, respectively, to analyze the influence of variable transmission ratios.
In the 0–1 s initial phase, the valve inlet pressure is 5 bar. During this period, the servo motor’s load torque is lower than the actuator’s maximum output torque. The flow variation trends under different transmission ratios are roughly consistent, yet a larger transmission ratio means the motor supplies greater torque to the transmission system, allowing the post-valve flow to stabilize at the target flow rate more quickly. Specifically, when the transmission ratio is 1:1, the flow reaches stability at the target rate at 0.77 s; with a 1.2:1 ratio, it stabilizes at 0.65 s; at 1.4:1, stabilization occurs at 0.55 s; and at 1.6:1, it stabilizes at 0.5 s. Additionally, it can be observed that when adjusting the post-valve flow, the overshoot of the post-valve flow beyond the target flow will gradually diminish as the transmission ratio increases. This results in smaller flow fluctuations, enabling a more significant reduction in the impact of unstable flow.
At the 1-s instant, the inlet pressure of the control valve rises, bringing about an abrupt shift in load. Meanwhile, the flow rate surges to 10,000 L/min in an instant, which is 100% higher than the target flow rate. Under the action of PID, the flow begins to recover. At this time, the curve changes under different transmission ratios also show significant differences: for the 1:1 transmission ratio, the flow recovery is slow, the flow after the valve oscillates repeatedly, and after 0.7 s of multiple oscillations, the flow after the valve stabilizes at the target flow; for the 1.2:1 transmission ratio, the number of oscillations and overshoot of the flow after the valve are significantly reduced, and after 0.5 s of oscillation, at the 1.5 s moment, the flow after the valve stabilizes at the target flow; for the 1.4:1 transmission ratio, the number of oscillations and overshoot of the flow after the valve are even less, and after 0.4 s of oscillation, at the 1.4 s moment, the flow after the valve stabilizes at the target flow; for the 1.6:1 transmission ratio, the flow after the valve drops rapidly, and after a very short period of 0.35 s of oscillation, it stabilizes at the target flow. In general, within the given transmission ratio range, with the increase in the transmission ratio, the control effect of the motor on the flow after the valve is better. In addition to the faster adjustment speed, the fluctuation range of the flow after the valve in the adjustment process is also smaller.
The comparison of the motor speeds of the main motor and the auxiliary motor driven by dual-motor compensation under different transmission ratios is shown in
Figure 17 and
Figure 18:
Between 0 and 1 s, the compensation start standard is not reached, and the auxiliary motor is not started. At the 1:1 transmission ratio, the speed quickly reaches the maximum value of 260 rad/s. At this time, the flow after the valve is higher than the target value, so the motor speed begins to decrease under the PID adjustment. At the 0.18 s moment, the speed is 0 rad/s. At this point, both the valve opening and the flow rate hit their maximums. To bring the flow rate back down to the target value, the motor initiates reversal under the regulation of the PID controller, causing the valve opening to keep decreasing. By the 0.25-s mark, it reaches a maximum reverse speed of −250 rad/s. After many oscillation changes, the flow after the valve approaches the target flow continuously and finally stabilizes at 5000 L/min. At the 1 s moment, the inlet pressure of the valve rises to 15 bar. At this time, the valve opening needs to be reduced. Through PID adjustment, the motor reverses. At the 1.3 s moment, the motor speed reaches the reverse minimum of −148 rad/s, and then the motor speed decreases. At the 1.16 s moment, the motor speed decreases to 0 rad/s. The motor speed oscillates continuously, the rotation direction of the motor also changes continuously, and the flow after the valve also changes around the target flow value. After 0.7 s of oscillation, the motor speed stabilizes at 0 rad/s, and at this time, the flow after the valve also stabilizes at the target flow value of 5000 L/min.
It can be seen from
Figure 17 and
Figure 18 that in the adjustment process of the same working condition from 0 to 1 s, with the increase in the transmission ratio, the speed of the main motor decreases from the maximum of 260 rad/s at the 1:1 transmission ratio to the maximum of 242 rad/s at the 1.6:1 transmission ratio, and the maximum speed decreases by 6.9%. After the overshoot phenomenon occurs, the 1:1 transmission ratio can reach −255 rad/s, while the 1.6:1 transmission ratio is only −150 rad/s, and the speed change range of the motor is reduced by 23.9%. And with the increase in the transmission ratio, the speed of stabilizing to the target flow is faster, and the speed change in the motor is less fluctuated. After the disturbance of 15 bar occuring at the 1 s moment, with the increase in the transmission ratio, the speed fluctuations of the main and auxiliary motors are significantly reduced. In the case of 1:1 transmission ratio, it needs to go through 0.8 s of repeated oscillation and stabilize at the target value at the 1.8 s moment. But in the case of 1.6:1 transmission ratio, it only needs to go through 0.4 s of a small amount of oscillation and can stabilize at the target value at the 1.4 s moment. The oscillation time is reduced by 50%. The increase in the transmission ratio has a significant impact on the improvement of the performance of the motor control valve, which greatly reduces the speed change time and amplitude of the motor, can effectively reduce the probability of motor failure, and increase the service life of the motor.
The comparison of the gear torque under the dual-motor compensation drive with different transmission ratios is shown in
Figure 19:
It can be seen from
Figure 19 that at the 1 s moment, when the inlet pressure suddenly changes to 15 bar, due to the excessive change, the compensation algorithm is turned on, and the auxiliary motor begins to intervene. At this juncture, the torque between the motor and the main shaft’s transmission gear starts to shift, with such changes aligning with both the motor’s rotational speed and the flow rate variations downstream of the valve. At the 1:1 transmission ratio, the torque between the gears fluctuates violently and the size and positive and negative of the torque will change greatly, and it takes 0.9 s to reach stability. With the increase in the transmission ratio, the degree of fluctuation will gradually decrease. At the 1.6:1 transmission ratio, it can reach stability after 0.5 s of fluctuation, and the number of torque direction changes will be significantly reduced. Excessive torque fluctuation of the gear will cause the contact stress between the tooth surfaces to change frequently, which is easy to cause failure forms such as tooth surface fatigue wear and pitting. When the torque fluctuation decreases, the stress change on the tooth surface is relatively stable, which slows down the fatigue process of the tooth surface material, thus prolonging the service life of the gear. At the same time, the reduction in the number of torque direction changes makes the change frequency of the force direction of the gear teeth decrease, reduces the possibility of fatigue cracks in the root of the gear teeth due to repeatedly bearing alternating stress, and further prolongs the service cycle of the gear.
