1. Introduction
As a core technology of modern marine propulsion systems, pump-jet propulsion has been applied in various defense, military, and industrial fields, such as power output and control for marine engineering vessels [
1], low-noise and precise control for underwater robots and unmanned submersibles [
2], and stealth propulsion systems for modern warships [
3]. Therefore, advanced jet propulsion technologies are revolutionizing the landscape of marine development.
Countries around the world have made significant economic investments in the research and development of jet propulsion devices; however, the performance of these propulsion systems still falls short of expectations. Researchers in related fields have attempted to highlight the bottlenecks of pump-jet technology from the perspectives of flow mechanisms and structural innovations, conducting extensive studies through numerical simulations and experiments. For example, Donyavizadeh and Ghadimi [
4] performed a comprehensive analysis of thrust, torque, and efficiency for linear jet propulsion systems, calculating the pressure distribution on the high-pressure and low-pressure sides of the stator at different spans, concluding that the interaction between the rotor and stator generates fluctuations. Weng et al. [
5] coupled a cavitation flow channel with pump-jet computational models based on a blade tip leakage vortex model, further enhancing the accuracy of numerical methods in assessing the hydrodynamic performance and pressure distribution of pump-jet systems. Baltazar et al. [
6] compared results from panel codes and Reynolds-Averaged Navier–Stokes (RANS) codes to clarify the limitations of inviscid flow models, proposing the need for calibrated models to accurately predict the loads on propellers and ducts. Research by Yu et al. [
7] indicated that an increase in the stator pre-swirl angle leads to an increase in the circumferential inflow velocity at the rotor entrance, thereby enhancing total thrust and propulsion efficiency. Li Cong et al. [
8] investigated the flow field distribution and flow-induced noise spectrum characteristics of pump-jet propellers with different tip clearances based on a detached eddy simulation model. They found that an increase in tip clearance led to a decrease in the thrust coefficient and propulsive efficiency of the pump-jet propeller. Gan Gongchang [
9] studied the influence of hub ratio on the performance of high-speed pump-jet propellers for underwater vehicles. The results indicated that an increase in hub ratio reduced the head and efficiency of the propeller and worsened its cavitation performance. Yang Chun et al. [
10] investigated the scale effect of the clearance flow field in pump-jet propellers. The results showed that the efficiency of the full-scale model improved under all advance coefficients. Tan Minggao et al. [
11] studied the influence of the number of blades on the performance of a shaftless pump-jet propeller. The research results demonstrated that as the number of blades increased from 5 to 7, the head, efficiency, and thrust of the propeller showed a steady upward trend, and the pressure distribution on the blade surface became more uniform. In addition, researchers in some interdisciplinary fields have proposed a magnetic fluid sealing device for pump-jet propellers [
12,
13], attempting to enhance the performance of pump-jet propellers from the perspective of reliable sealing, as well as a novel magnetic fluid propeller [
14,
15,
16]. In particular, the dual-piston ferrofluid propulsion system developed by Li et al. [
17] exhibits significant advantages in low-noise operation. However, this technology is still not mature.
With the rapid development of computer technology and image processing techniques, numerical computation methods for revealing flow patterns within complex structures have gradually become a primary research approach [
18,
19,
20,
21,
22]. Through numerical calculations, the impact of pump cavity gaps on the flow performance of traditional hydraulic machines, such as centrifugal pumps, has been identified, including the regular relationship between the liquid leakage coefficient and pressure coefficient [
23], as well as the interaction between the internal flow characteristics of the pump cavity and external flow characteristics [
24,
25]. However, these related conclusions cannot be applied to pump-jet systems, and the potential impact of pump cavity gaps on internal flow performance in pump-jet systems has not been adequately addressed, creating a knowledge barrier for optimizing pump-jet systems based on flow mechanisms.
Therefore, this paper investigates the influence of pump cavity gaps on the performance of helical mixed-flow pumps. The study reveals the impact of pump clearance on thruster performance and internal flow patterns, providing valuable reference data for thruster design. With the inlet ring gap set at 0.2 mm, we systematically analyze the effects of pump cavity gap size on the internal flow state, efficiency, and head of the mixed-flow pump.
2. Spiral Mixed-Flow Pump Model Parameters and Theoretical Basis
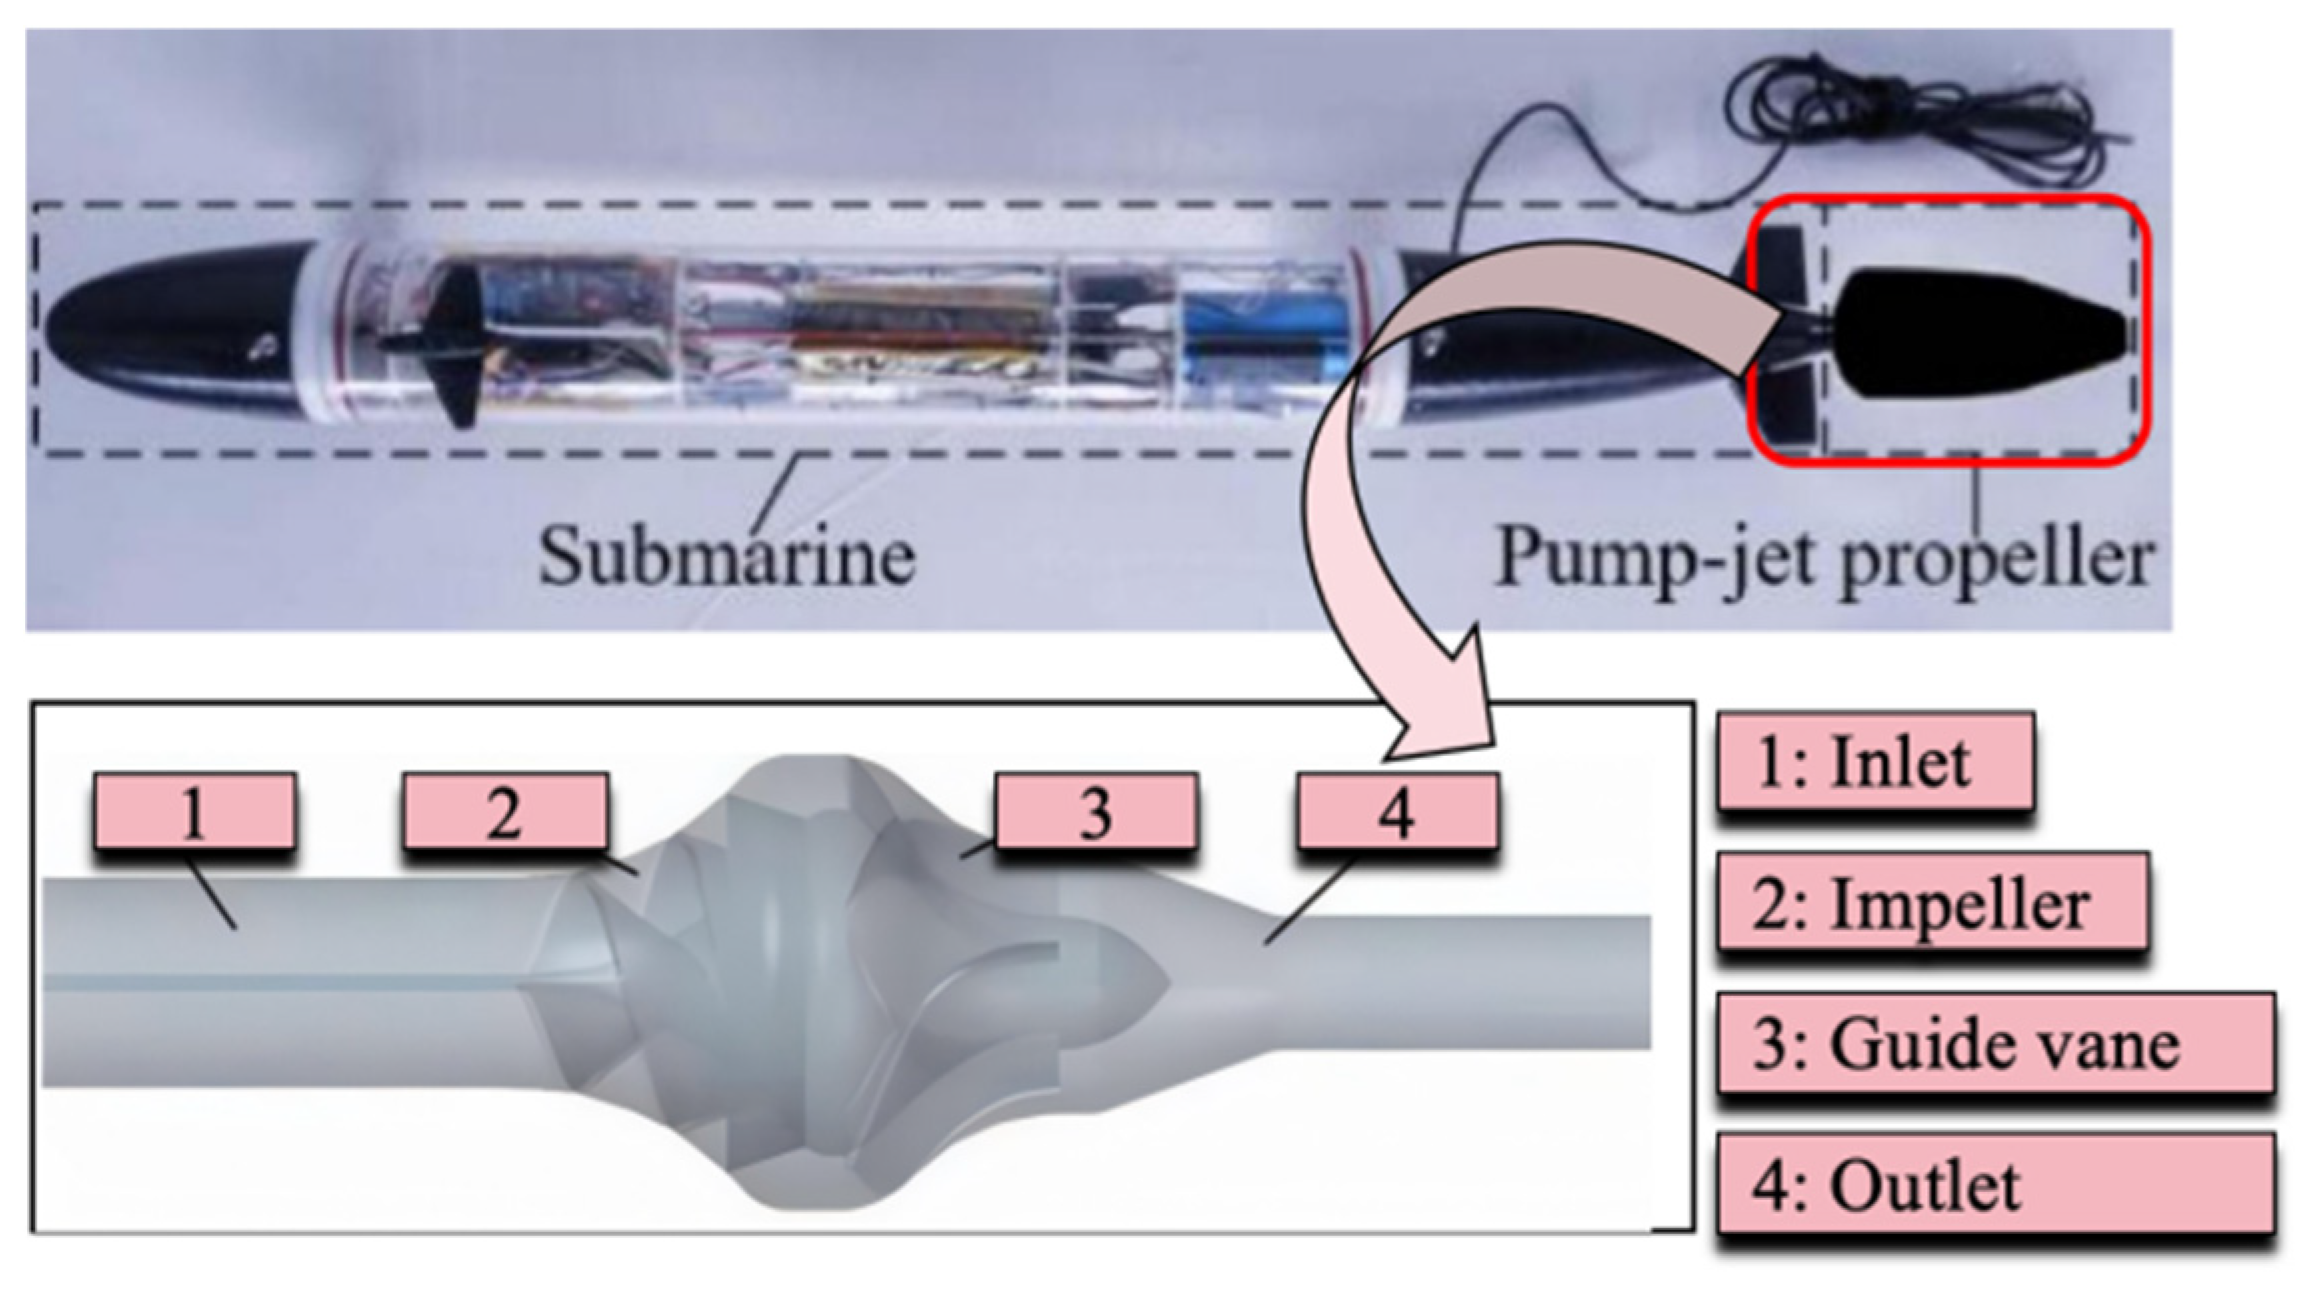
Hydraulic jet propulsion is a special mode of ship propulsion, where the basic principle involves using a propulsion pump to eject water at high speeds, with the generated reaction force driving the ship forward. This propulsion method exhibits significant advantages in specific scenarios, particularly suitable for vessel designs that demand high maneuverability and efficiency. Jet propulsion pumps typically adopt a mixed-flow pump structure, composed of essential components such as the inlet section, impeller, guide vanes, and nozzle, which work together to ensure efficient conversion and stable output of water flow during the propulsion process [
26,
27,
28].
Figure 1 illustrates a submarine equipped with a helical propulsion pump, where the number of guide vanes is 5, the number of blades is 2, the blade outlet angle
β2 is 17°, the blade wrap angle
φ is 360°, and the specific speed
ns is 277.9. Other design parameters are detailed in
Table 1. In the numerical calculation, Fluent 16.0 was used as the processing software.
Before applying the numerical model for calculations, the original continuous geometric model must first be discretized using mesh generation software. In this study, ICEM CFD 17.2 software is used to create the mesh for the helical propulsion pump. Considering that the impeller, guide vanes, and nozzle regions contain many high-curvature features, unstructured mesh is employed, while the inlet and outlet sections, which have regular shapes, utilize structured mesh. The meshes of each component are then assembled, as shown in
Figure 2. During the numerical calculation process, the pump inlet is set as a mass flow rate outlet 3.83 kg/s and the outlet is set as a free-flow exit. The impeller portion rotates as a whole at a rotational speed of 1500 r/min, with the mesh assembly interface configured as an interface.
In theory, increasing the number of meshes can significantly reduce the numerical errors caused by mesh discretization; however, excessively high mesh density may lead to a waste of computational resources. Therefore, the number of meshes must be controlled within a reasonable range to achieve optimal results. For the impeller region of the helical mixed-flow pump, five sets of different mesh quantities were designed, and numerical calculations were conducted under the design conditions. The impact of mesh quantity on head and efficiency was investigated to verify mesh independence, as shown in
Figure 2. The results indicate that when the number of cells reached 3,124,575, the variation in head and efficiency remained below 3%, meeting the numerical calculation requirements [
29,
30,
31,
32]. Thus, this mesh quantity was determined for the numerical calculations. The simulation employed the SST k-ω turbulence model. The flow within the pump is governed by the continuity equation and the momentum equations. The mass conservation equation is shown in Equation (1), and the momentum equation is given in Equation (2). In the equations,
ρ represents the medium density, which is 1000 kg/m
3;
v denotes the fluid velocity in m/s;
t is time in seconds;
p is the fluid pressure in Pa;
τij is the viscous force tensor, Pa; and
F represents the unit mass force acting on the fluid in N/kg.
The pump cavity gap (i.e., the clearance between the impeller end face and the pump casing or the front and rear cover plates) is typically influenced by factors such as the pump’s structural type, impeller size, working medium, and operating conditions. Generally speaking, a reasonable design for the pump cavity gap must strike a balance between reducing leakage losses, minimizing friction losses, and ensuring the stability of pump operation. According to engineering experience, the common range of values for pump cavity gaps is shown in
Table 2.
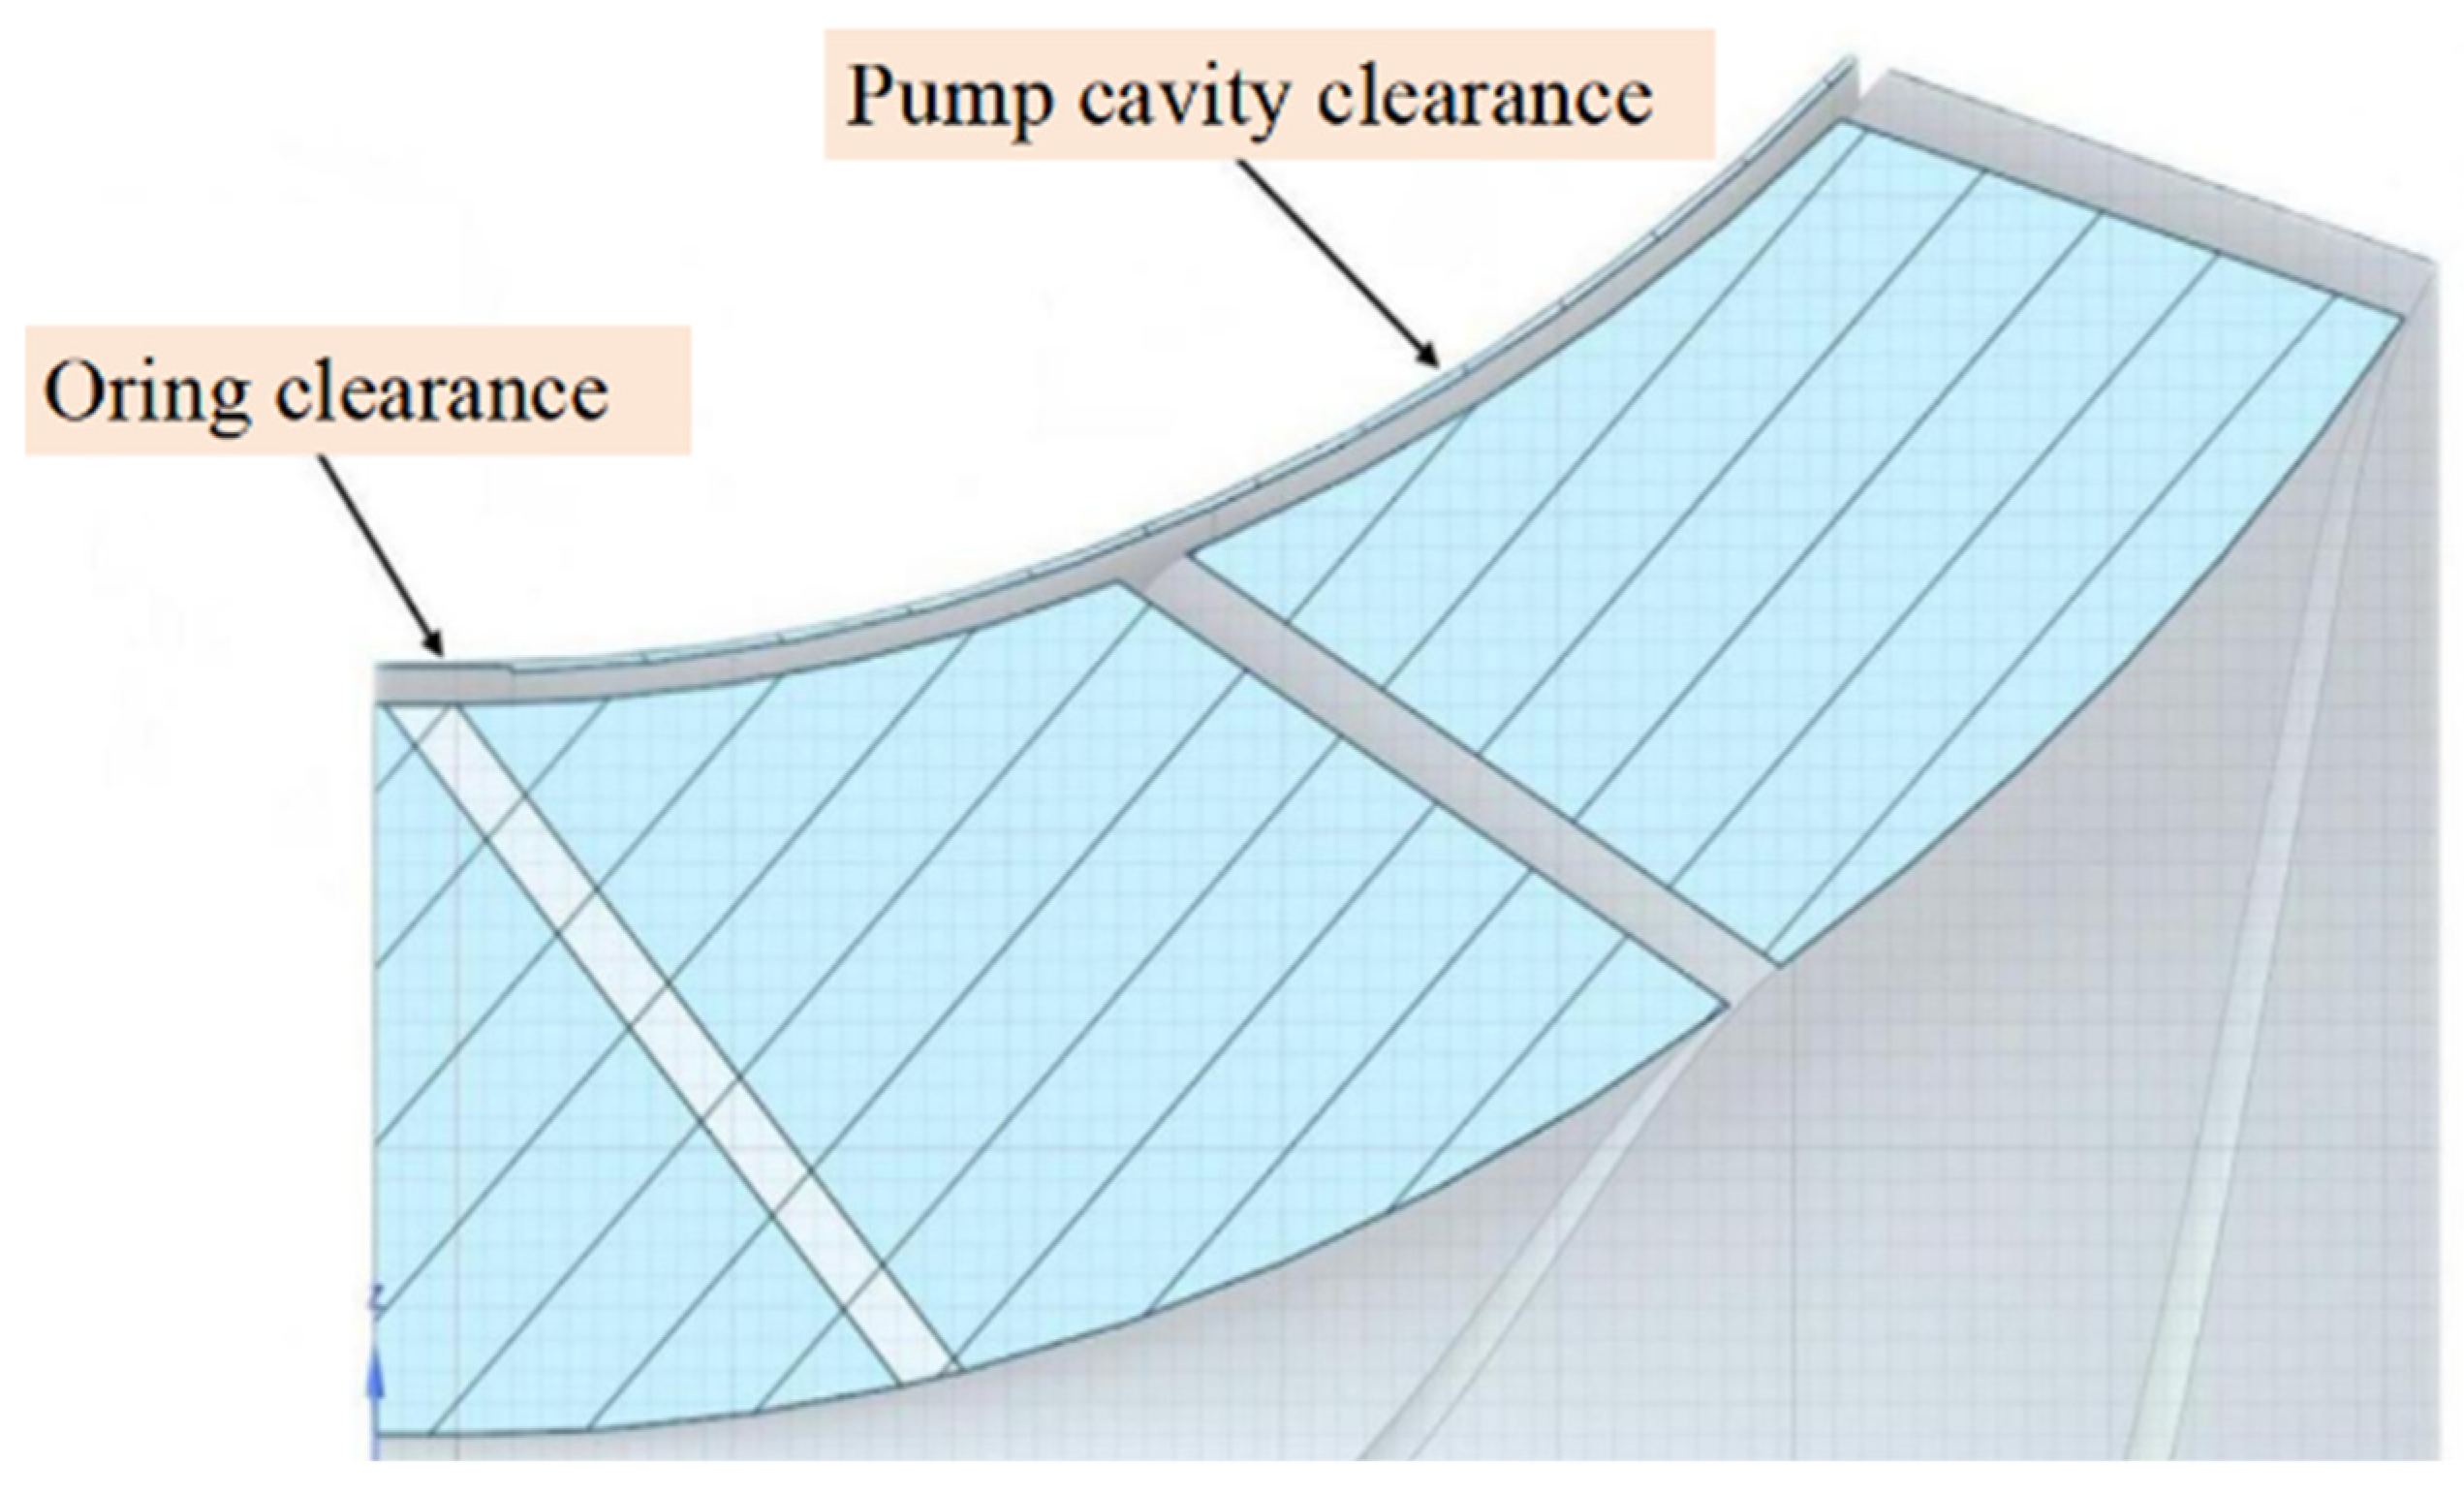
Figure 3 is a schematic diagram of the pump cavity gap structure. To further investigate the impact of the pump cavity gap on the hydraulic performance of the helical mixed-flow pump, the inlet ring gap is first set at 0.2 mm. Based on this, the pump cavity gap is varied, and a gap coefficient α is defined to derive universally applicable physical laws. The calculation method for α is shown in Equation (3).
In the equation,
k represents the pump cavity gap in mm, and
δ denotes the blade thickness (2 mm). The pump cavity gaps and gap coefficients set in this study are shown in
Table 3.
In numerical simulations, the pump head
H (m) of a helical mixed-flow pump is determined by the inlet pressure
pin (Pa), outlet pressure
pout (Pa), inlet velocity
vin (m/s), and outlet velocity
vout (m/s), as shown in Equation (4). The power
P (kW) is calculated using Equation (5), and the efficiency
η is expressed in Equation (6).
In the equations, g is the gravitational acceleration at 9.8 m/s2. M denotes the torque of the helical mixed-flow pump, N·m, and n is 1500 r/min. q represents the flow rate in m3/s.
3. Experimental Verification
To ensure the reliability of the numerical results of the helical mixed-flow pump, performance characteristic tests were conducted on the pump at the submarine cruise testing platform of Lanzhou University of Technology. The experiment utilized a closed-loop test rig, which included a water tank, variable frequency motor, flow meter, pressure sensors, torque gauge, data acquisition system, and other components. Additionally, good sealing of the piping was ensured to avoid leakage affecting measurement accuracy.
First, the helical mixed-flow pump was securely fixed to the test rig, and adjustments were made to the inlet and outlet flange connections to ensure proper alignment. The coupling between the motor and the pump was then checked to confirm that there were no eccentricities or vibration interferences. Finally, the pressure sensors (inlet and outlet), flow meter, and torque gauge were calibrated to ensure that the measurement error remained within ±0.5%. For this test, the pump inlet ring gap was set at 0.2 mm and the pump cavity gap at 0.3 mm, with all other parameters consistent with those used in the numerical calculation model.
During the experiment, the motor speed was adjusted to the rated value (1500 r/min) using the variable frequency motor, and flow was controlled via valves, covering the range from 0.4 q0 to 1.2 q0. (q0 represents the flow) The inlet velocity of the pump was measured using an electromagnetic flowmeter, while the pressure sensors obtained the pressures at the pump inlet and outlet. Torque was measured using a non-contact torque gauge. The head and efficiency obtained from the experiments were calculated using Equations (4) and (6).
Figure 4 shows the comparison of numerical head and efficiency with experimental head and efficiency at different flow rates, as well as the test platform. The numerical results exhibited a significantly similar trend to the experimental results, with minor discrepancies attributable to the ideal assumptions of the numerical model, such as no-slip conditions, smooth walls, and absence of vibration interference. However, these errors were within an acceptable range, thus validating the correctness of the numerical method (Total flow coefficient
λ =
q/
q0).
4. The Impact of Pump Cavity Dimensions on Pump Efficiency and Head
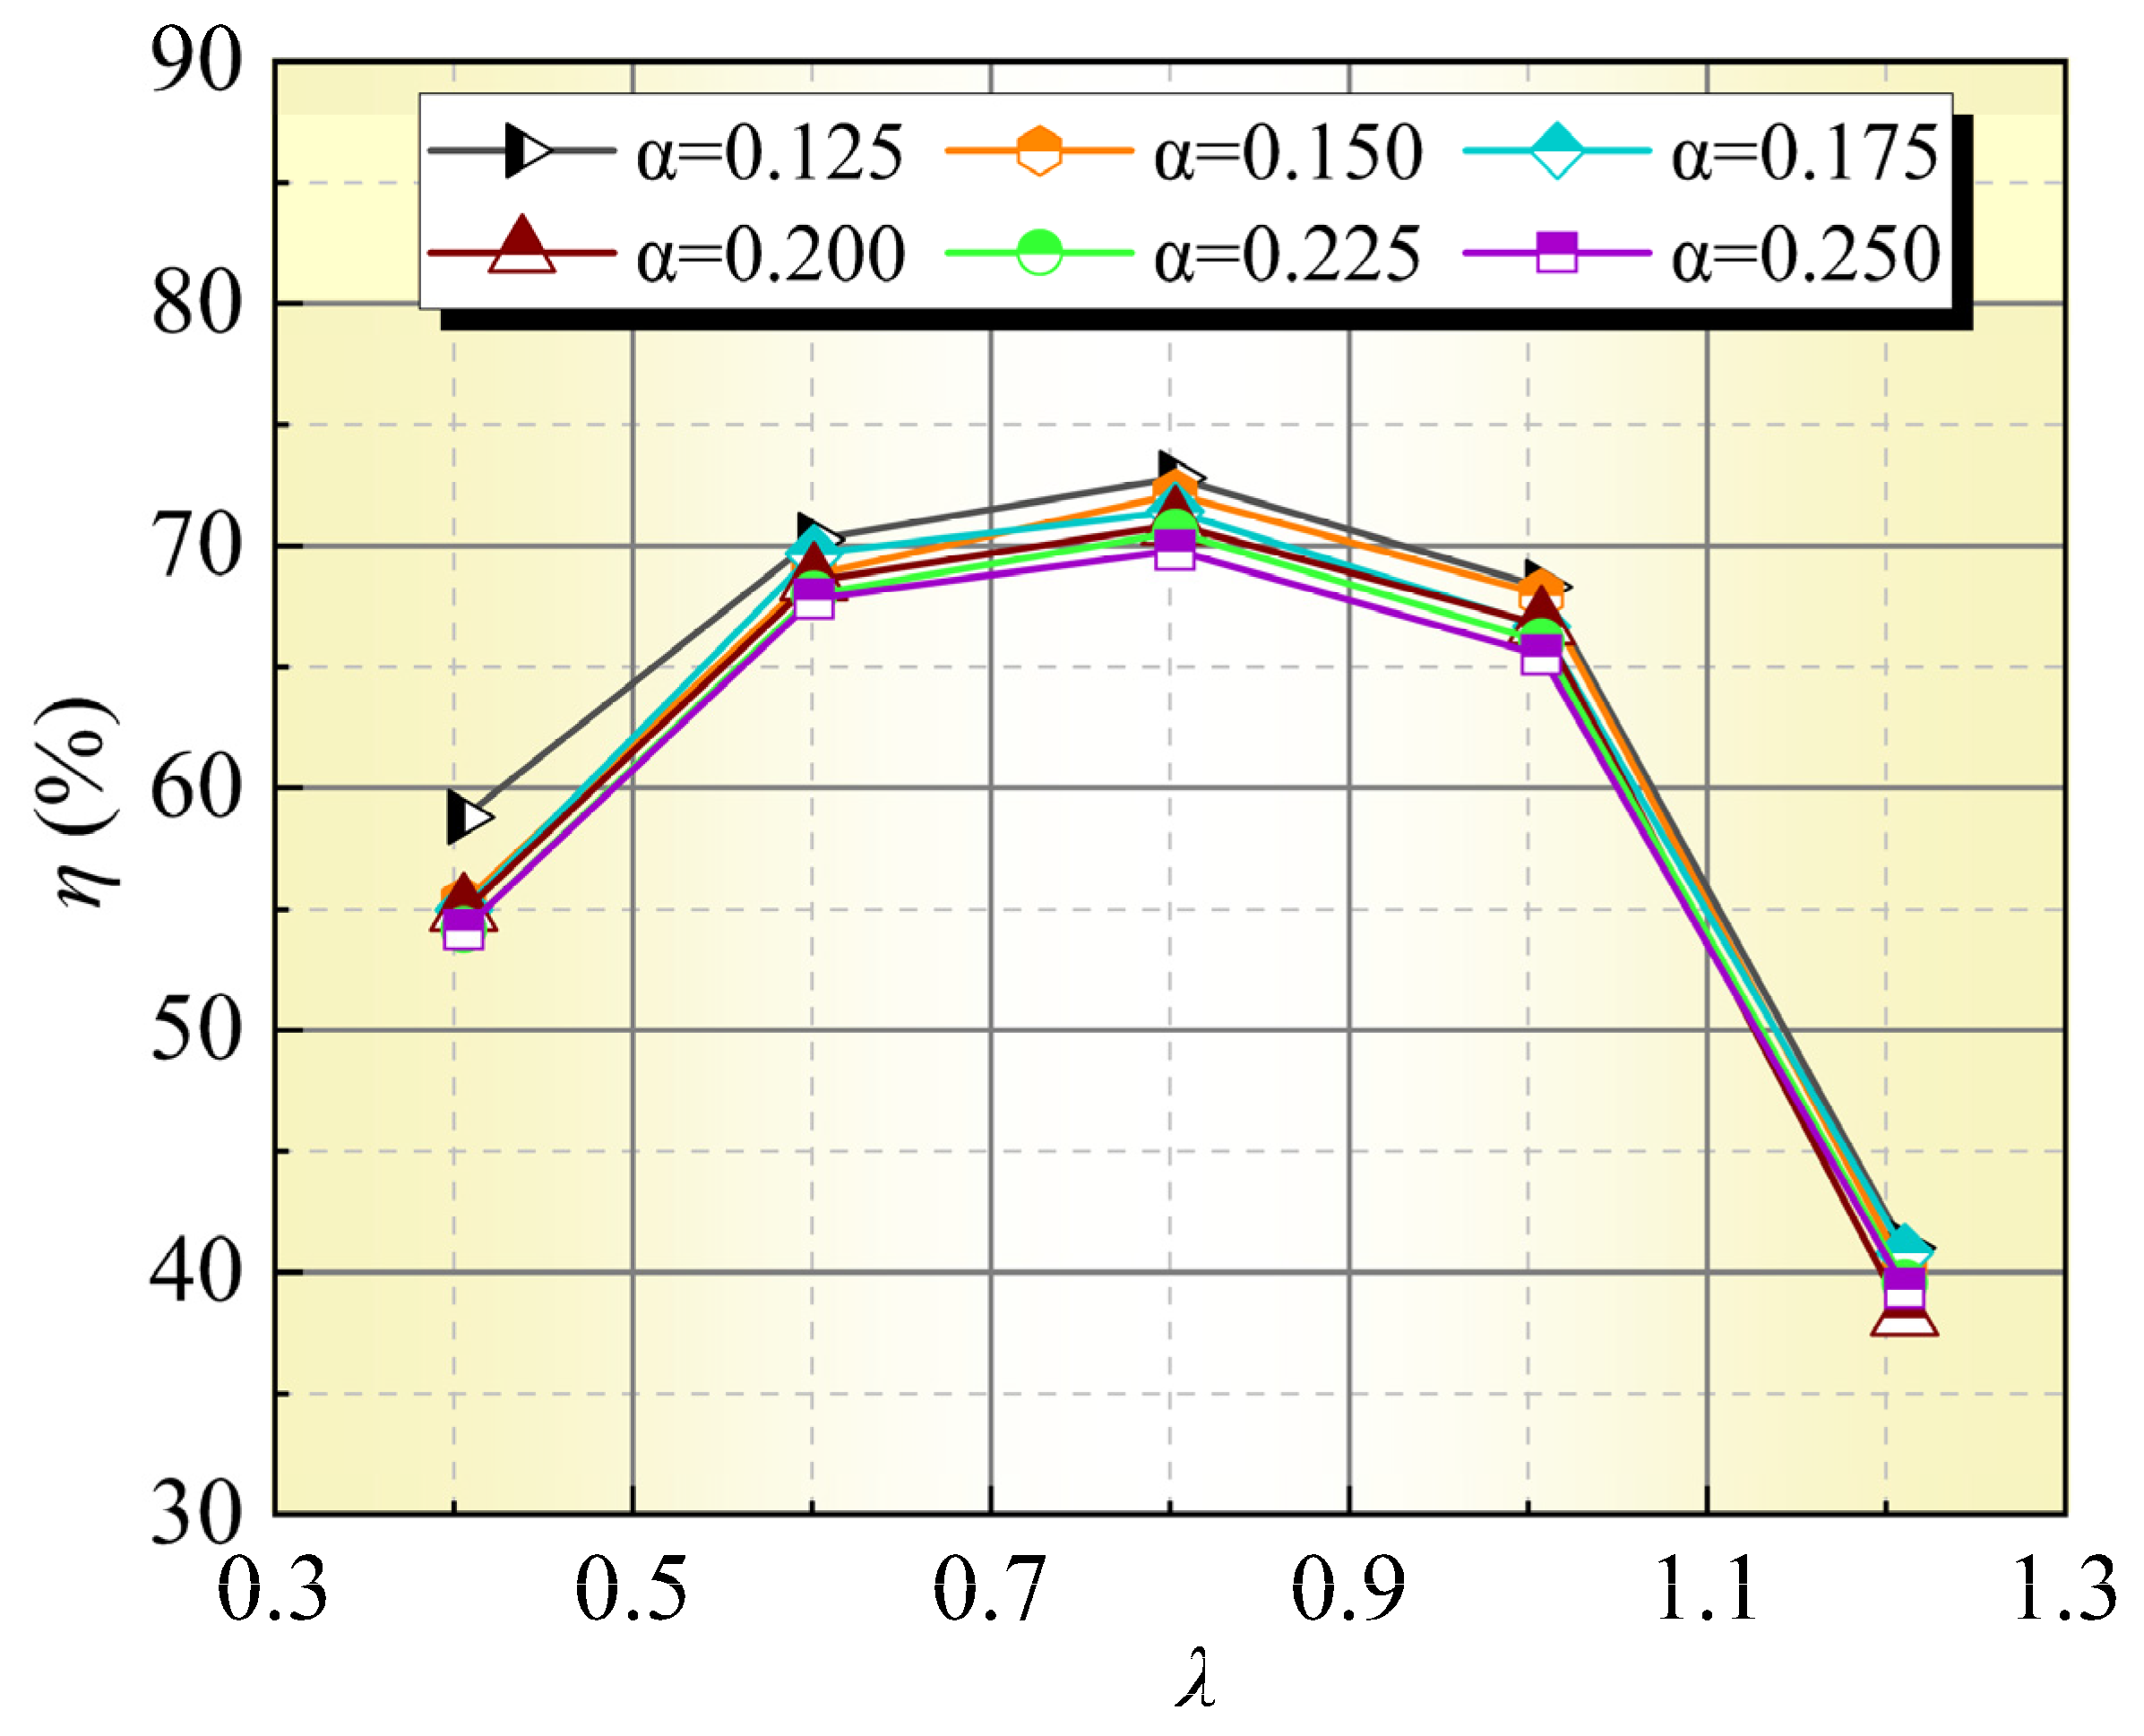
Figure 5 illustrates the impact of pump cavity dimensions on pump efficiency at different flow rates. To ensure the results are universally applicable, the flow coefficient
λ is used as the horizontal axis. From
Figure 5, it can be observed that efficiency exhibits a trend of initially increasing and then decreasing with the increase in the flow coefficient
λ across all gap coefficients, with a peak value occurring around
λ = 0.9. As
λ increases from 0.4 to 1.2, efficiency rises from approximately 55% to about 75%, before falling back to around 40%. The influence of different gap coefficients on efficiency is quite pronounced; smaller gap coefficients of α = 0.125 and 0.15 reach peak efficiencies close to 75% at around
λ = 0.9 but show a rapid decline in efficiency to about 40% under high-flow conditions (
λ > 0.9). In contrast, larger gap coefficients of α = 0.225 and 0.25 yield an efficiency of around 70% at approximately
λ = 0.9.
The smaller gap coefficients enhance hydraulic efficiency at low-flow conditions by reducing leakage within the pump cavity and minimizing turbulent and leakage losses. However, under high-flow conditions, excessively small gaps can lead to flow field instability, such as increased turbulence and fluid separation, which accelerates the decline in efficiency. Conversely, larger gap coefficients reduce efficiency at low-flow conditions due to increased leakage; however, they result in less disturbance to the flow field under high-flow conditions, leading to a more gradual decrease in efficiency.
Figure 6 shows the effect of pump cavity dimensions on pump head at different flow rates. As seen in the figure, the head exhibits a monotonically decreasing trend with an increase in flow coefficient
λ, decreasing from 1.9 m at
λ = 0.4 to 0.5 m at
λ = 1.2. The influence of different gap coefficients on head is relatively consistent, although some differences exist. Smaller gap coefficients (α = 0.125–0.15) result in slightly higher heads at low-flow conditions (approximately 1.9 m), while at high-flow conditions, the head drops to about 0.4 m. In contrast, larger gap coefficients (e.g., α = 0.225–0.25) produce slightly lower heads overall, ranging from about 1.8 m to approximately 0.4 m.
The differences in head can be attributed to the smaller gap coefficients reducing leakage, which enhances pressure accumulation and available power in low-flow conditions. Conversely, larger gap coefficients lead to increased leakage, resulting in greater energy losses and a slight reduction in head; however, they maintain better flow field stability under high-flow conditions, resulting in a more gradual decrease in head.
These performance metrics are superior to those reported in previous studies on similar mixed-flow pumps. For instance, Zhou et al. [
2] reported a maximum efficiency of approximately 72% in their study on pump-jet propulsors, while Hu et al. [
27] achieved a head of around 1.7 m under comparable conditions. The improvement observed in this study can be attributed to the optimized pump cavity gap, which effectively reduces leakage losses and suppresses vortex generation.
5. The Impact of Pump Cavity Dimensions on the Flow Characteristics Inside the Helical Mixed-Flow Pump
5.1. The Influence of Pump Cavity Dimensions on the Flow Conditions Inside the Pump
Figure 7 presents the velocity streamlines of the impeller cross-section in a helical mixed-flow pump under different pump cavity gap sizes. The annotated vortex regions highlight key flow characteristics. The vortices are primarily located near the trailing edge of the impeller blades and at the impeller inlet, mainly due to the variation in pump cavity gap size, which exacerbates boundary layer separation. Altering the pump cavity gap size changes the flow domain constraints, leading to an adverse pressure gradient along the blade surface. Additionally, the variation in dimensions affects the interaction between the impeller and the casing, which can either intensify or mitigate flow separation, depending on the size of the pump cavity gap.
At lower α values (α= 0.125), the reduced velocity relative to modified geometries of the other casing sizes leads to larger and more diffuse vortices. In contrast, at higher α values (α= 0.25), the increase in relative velocity results in enhanced shear and turbulent fluctuations, leading to intensified vortex shedding. The interactions caused by geometric constraints from the pump casing, pressure gradients, and mismatched velocities control the spatial distribution, scale, and intensity of the vortices, ultimately affecting the hydraulic efficiency and operational stability of the impeller.
At α= 0.125, the flow exhibits sparse streamlines with low speeds and near-laminar conditions. As α increases to 0.15 and 0.175, the streamlines become denser, vortex size decreases, and flow uniformity improves. However, at α= 0.2, 0.225 and 0.25, the flow intensifies due to increased shear and flow separation caused by the constricted casing geometry, leading to greater turbulence and complexity of the vortices.
The pump cavity gap at α = 0.15 displays optimal performance characteristics compared to other testing conditions. This state shows a highly uniform streamline distribution with minimal vortex size and intensity, evidenced by concentrated small-scale vortices. Relative to α = 0.125, where large and diffuse vortices with low speed contribute to decreased hydraulic efficiency, α = 0.15 achieves better fluid attachment and momentum transfer, minimizing stagnation and enhancing the output power of the impeller. In comparison to higher α values (α = 0.175–0.25), α = 0.15 avoids excessive turbulence, losses caused by shear, and large-scale vortex shedding, all of which can reduce flow stability and increase pressure losses, especially under narrow casing conditions. This efficiently maximizes energy transfer while maintaining flow stability, providing outstanding performance in reducing hydraulic losses, enhancing flow uniformity, and minimizing vibration excitation, which is crucial for efficient impeller operation in engineering applications involving changes in pump casing dimensions.
When the pump operates under off-design conditions (particularly at low flow rates), the actual inflow velocity magnitude and direction deviate from the design values. This causes the fluid to impact the blades at an inappropriate angle of attack. Such angle of attack mismatch induces flow separation near the leading edge of the blade’s suction side or pressure side, resulting in the formation of one or more intense vortices, commonly referred to as separated flow vortices.
5.2. The Influence of Pump Chamber Size on the Pressure Distribution Pattern of the Impeller
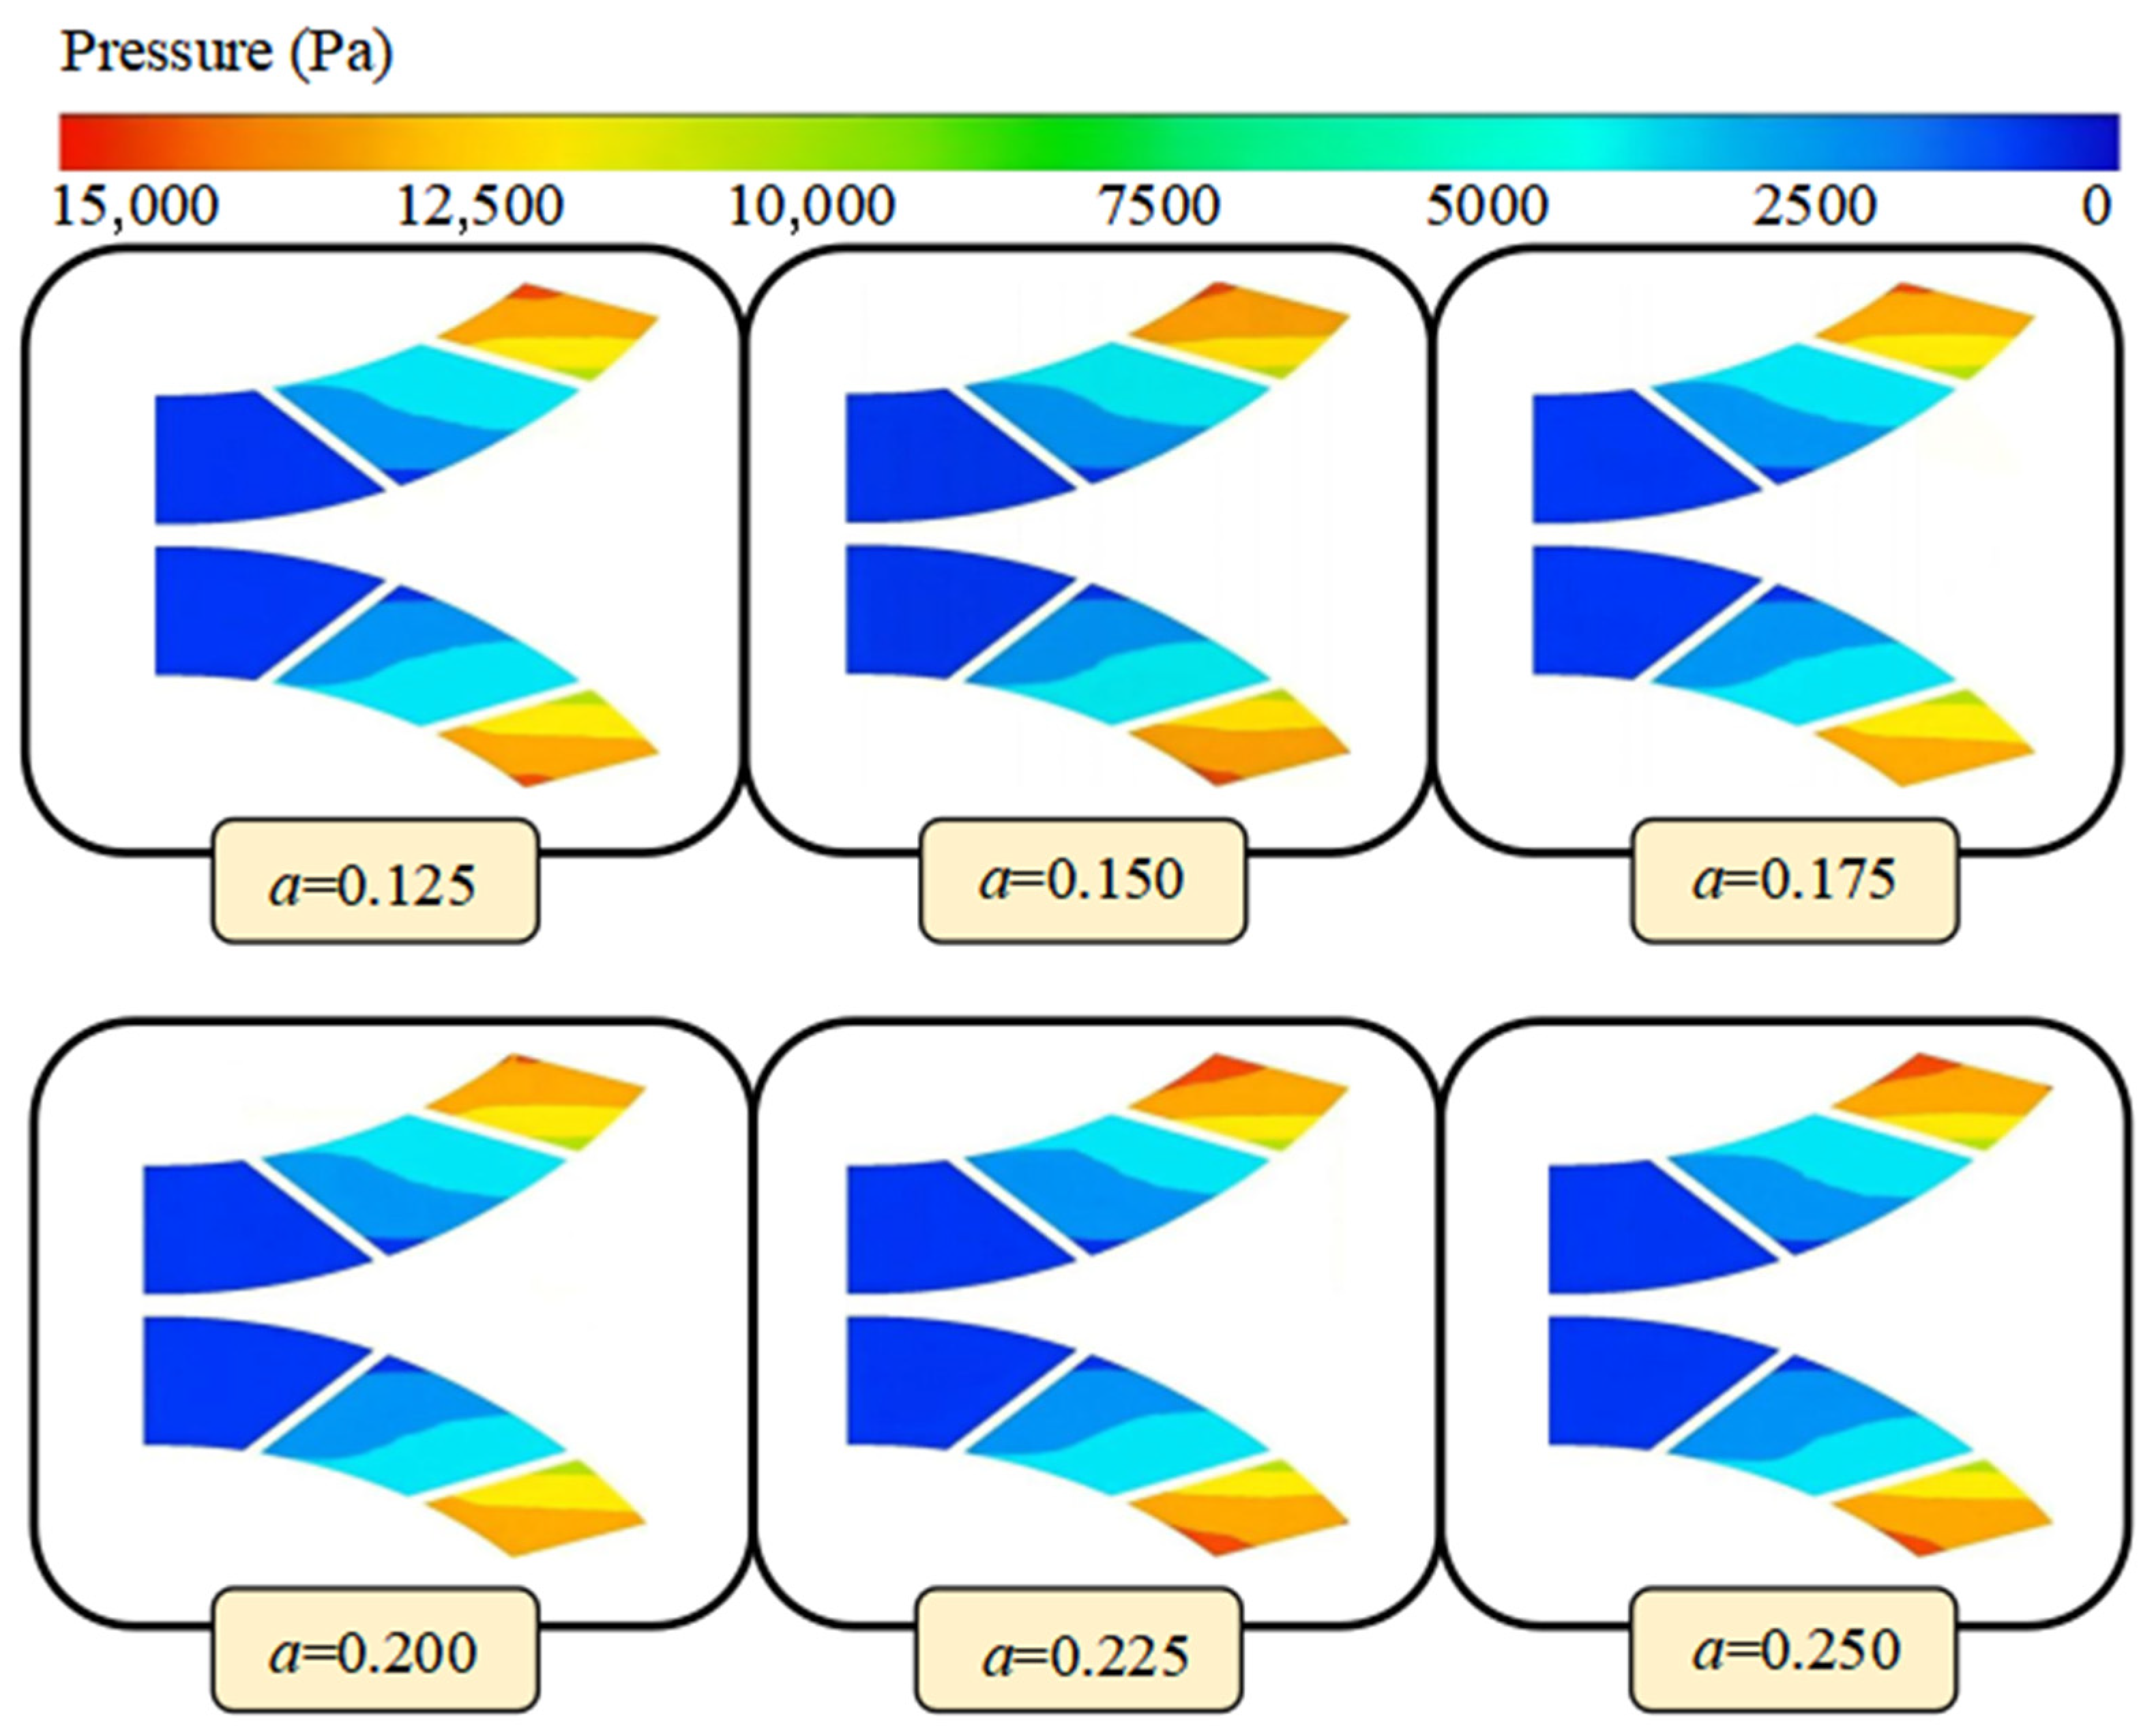
Figure 8 presents the impact of different α values on the static pressure distribution on the impeller’s shaft surface in a helical mixed-flow pump. Under the condition of α = 0.225, the static pressure distribution on the impeller shaft surface exhibits significant non-uniformity, particularly in the impeller outlet area, where a large static pressure gradient may lead to flow separation and vortex formation, consequently increasing energy losses and affecting the pump’s efficiency. Moreover, the larger static pressure gradient may also induce vibrations and noise during the pump’s operation, reducing its reliability and lifespan.
As the α value decreases to 0.15, the static pressure distribution on the impeller shaft surface becomes more uniform, with a reduced static pressure gradient, indicating a significant improvement in flow stability. A uniform static pressure distribution helps to minimize flow separation and the formation of vortices, thereby lowering energy losses and enhancing the pump’s efficiency. Additionally, a consistent static pressure distribution contributes to reducing vibrations, noise, and stress concentrations during the pump’s operation, improving reliability and lifespan while decreasing maintenance costs. Therefore, the structural design at α = 0.15 aids in optimizing the overall performance of the pump.
5.3. The Influence of Pump Cavity Dimensions on the Overall Vorticity of the Impeller
Figure 9 illustrates the axial vorticity distribution at the impeller outlet for different α values, quantified using the
Q criterion. Since a smaller
Q value indicates a higher degree of vortex identification, the
Q value is set to 0.01, utilizing Velocity Invariant
Q as a scale for vorticity. In fluid dynamics, the
Q criterion is a commonly used method for identifying and quantifying vortices, based on the second invariant of the velocity gradient tensor, effectively distinguishing vortex structures within the flow.
Under the condition of α = 0.125, the vorticity distribution at the impeller outlet exhibits a complex structure, particularly in the region near the impeller edge, where strong vortex activity is present, leading to flow instability and adversely affecting the pump’s performance. As the α value increases to 0.15, the vorticity distribution becomes more uniform, with a reduction in the intensity of the vortex structures. This helps minimize flow separation and vortex generation, thereby improving flow stability.
However, when the α value further increases to 0.175, the non-uniformity of the vorticity distribution increases again, especially in the edge region of the impeller outlet, which may exacerbate flow separation and increase energy losses. A uniform vorticity distribution can enhance the pump’s flow rate and head, thus improving its overall efficiency. Therefore, the structural design at α = 0.15 contributes to optimizing the overall performance of the pump.
5.4. The Influence of Pump Cavity Dimensions on Turbulent Kinetic Energy Within the Pump Cavity
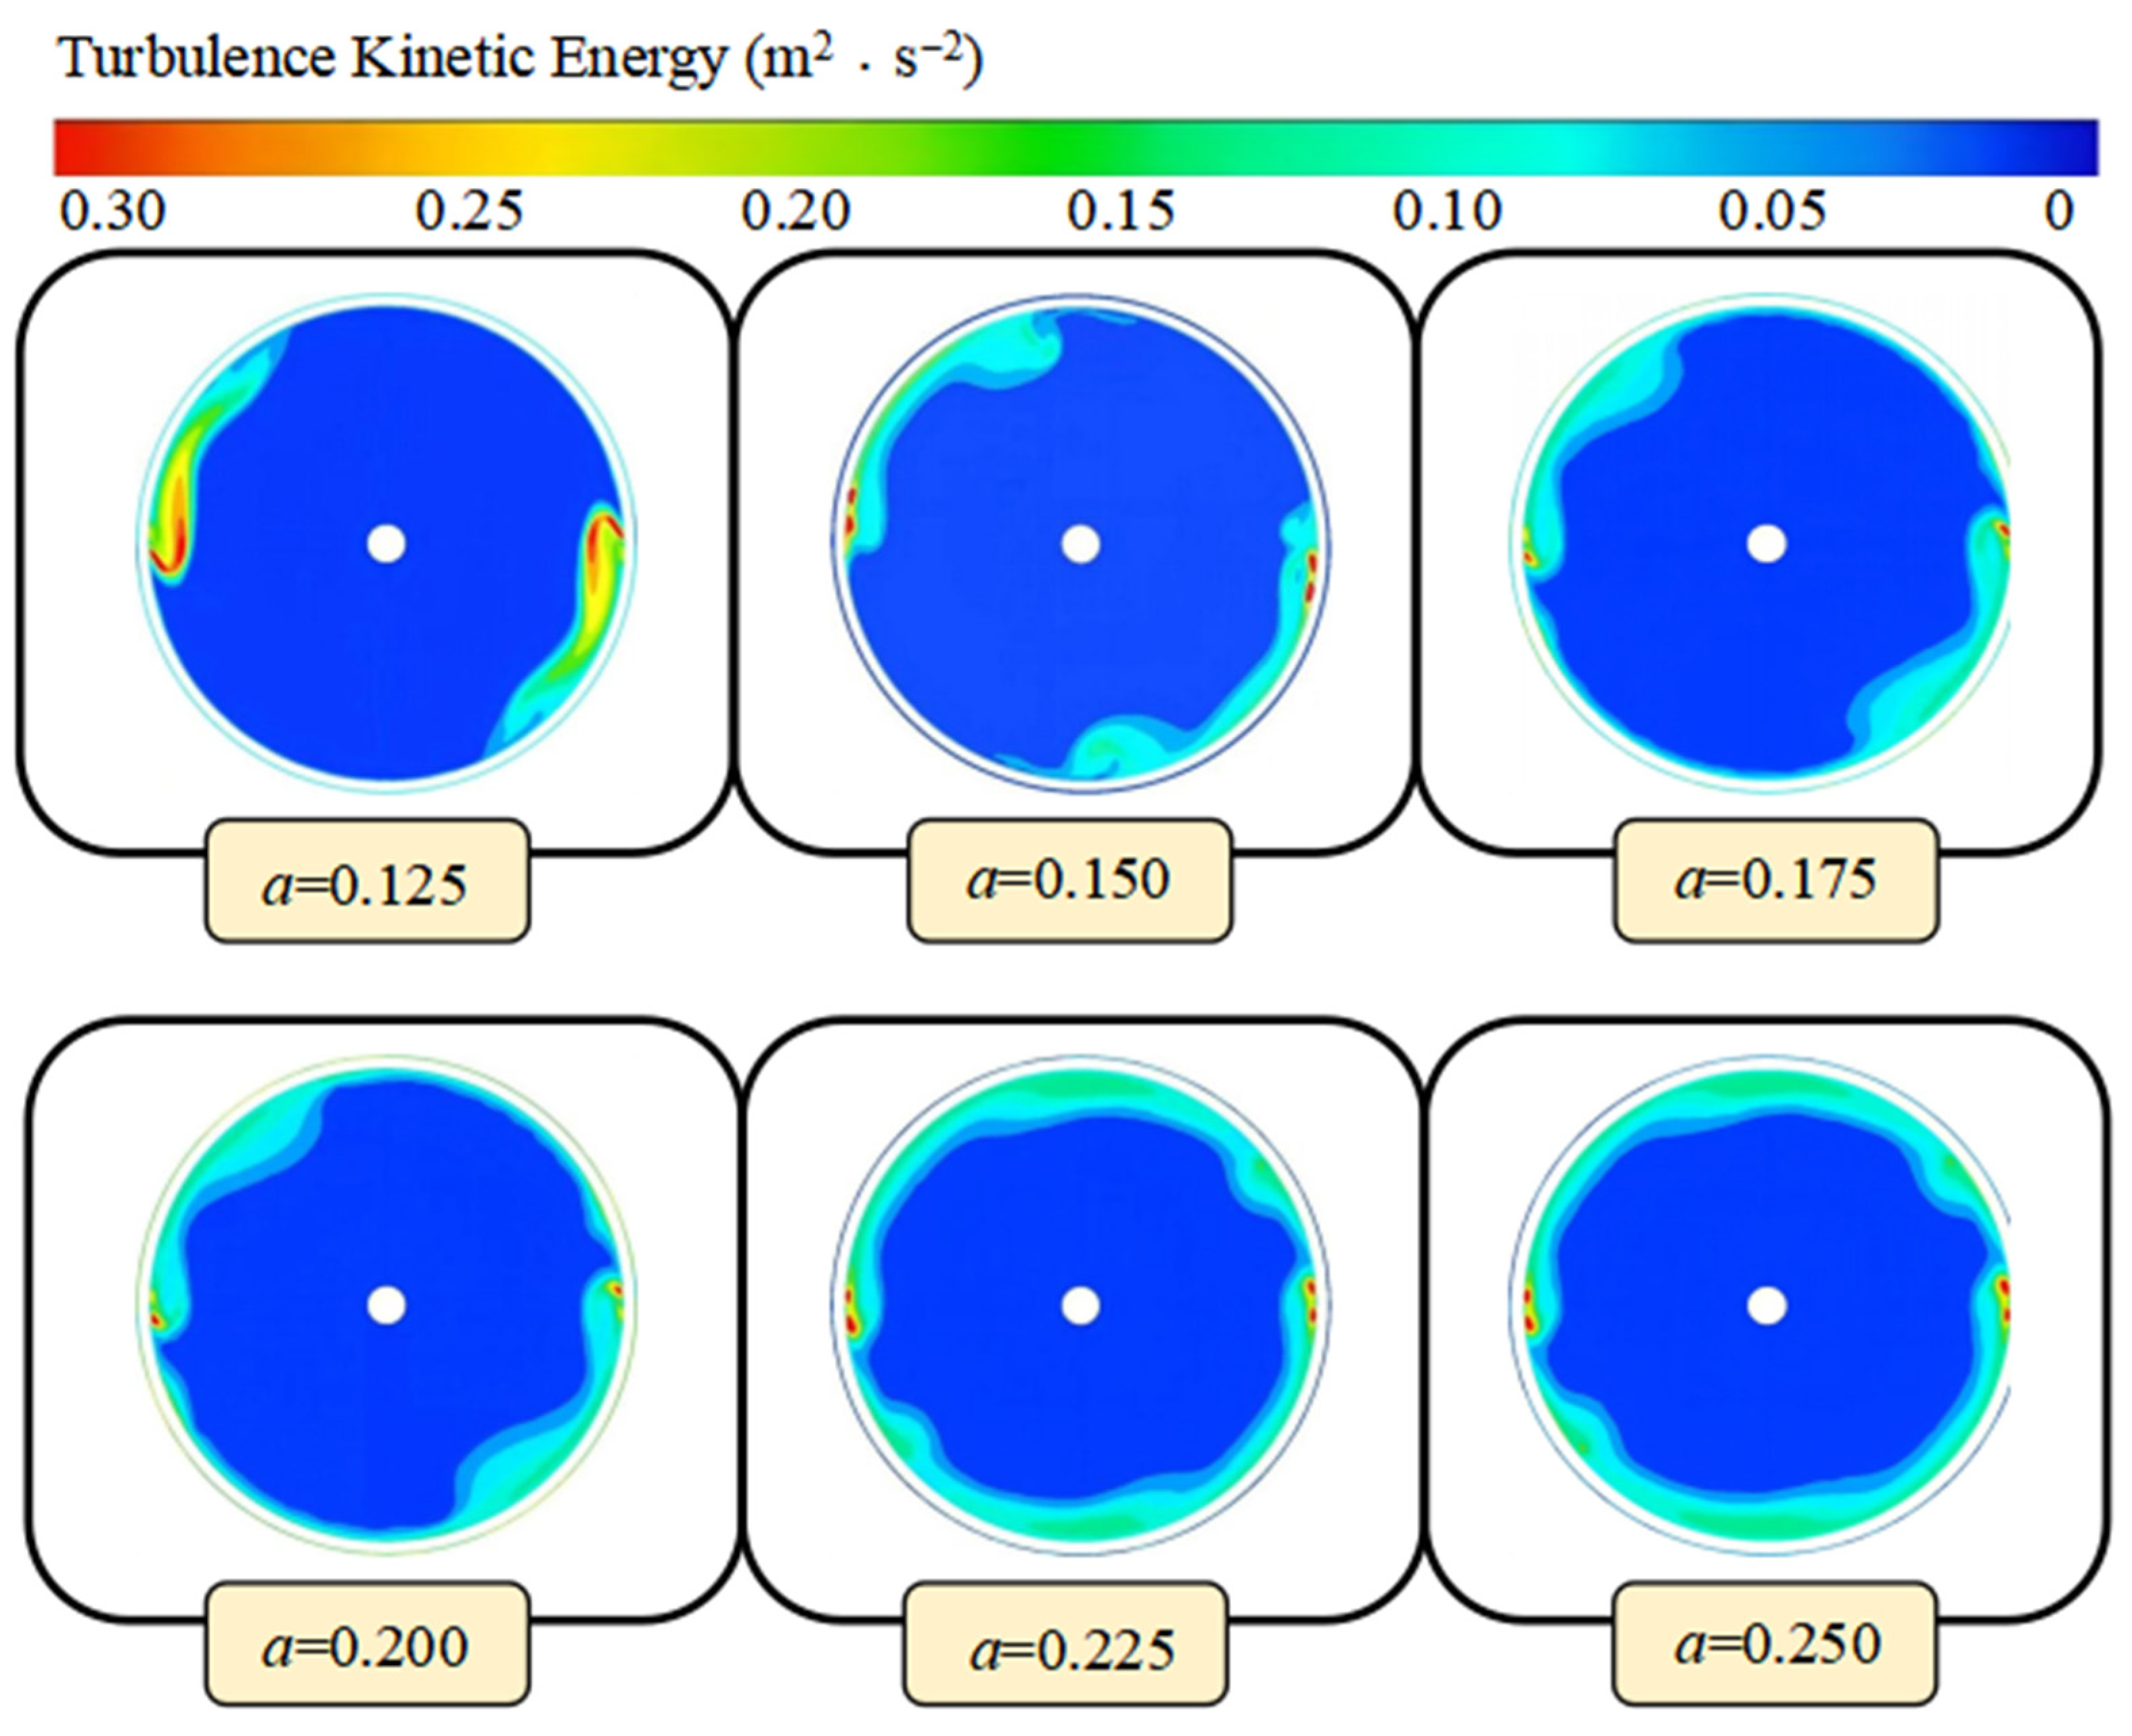
Figure 10 provides a detailed depiction of the turbulent kinetic energy distribution in the inlet region of the impeller for different α values. With the addition of a front cover plate to the semi-open impeller, the gap coefficient between the impeller inlet and the pump cavity significantly influences the turbulent kinetic energy distribution. High turbulent kinetic energy regions are primarily concentrated at the interface between the pump cavity gap and the impeller inlet, which aligns with the phenomenon of shear stress and turbulence enhancement occurring as fluid passes through a narrow gap.
At the setting of α = 0.125, the turbulent kinetic energy distribution at the impeller inlet shows marked non-uniformity, particularly in areas close to the pump cavity gap, where the increase in turbulent kinetic energy is especially pronounced, reflecting the occurrence of flow separation and vortex formation. As the α value increases to 0.15, the turbulent kinetic energy distribution tends toward uniformity, with a decrease in turbulent kinetic energy at the impeller inlet, resulting in improved flow stability.
However, when the α value continues to rise to 0.175, the non-uniformity of the turbulent kinetic energy distribution increases again, particularly in the vicinity of the pump cavity gap, leading to exacerbated flow separation and increased energy losses. In the range from α = 0.2 to 0.25, the turbulent kinetic energy distribution gradually rises with increasing α, especially in the edge region of the impeller inlet, which adversely affects the pump’s performance.
By conducting a comparative analysis of the specific impacts of different α values on the turbulent kinetic energy distribution at the inlet of the helical mixed-flow pump impeller, it can be concluded that at α = 0.15, the flow characteristics exhibit significant superiority compared to other α values, effectively suppressing boundary layer turbulence disturbances, thereby reducing energy losses and improving pump efficiency. Therefore, the structural design at α = 0.15 plays a positive role in enhancing the overall performance and reliability of the entire pump system.
