Article

AI-Enhanced Model for Integrated Performance Prediction and Classification of Vibration-Reducing Gloves for Hand-Transmitted Vibration Control

1
School of Mechanical Engineering, University of Shanghai for Science and Technology, Shanghai 200093, China
2
Department of Mechanical, Industrial and Aerospace Engineering, Concordia University, Montreal, QC H3G 1M8, Canada
3
School of Electronic and Information, Shanghai Dianji University, Shanghai 201306, China
4
Department of Mechanical Engineering, Politecnico di Milano, 20156 Milano, Italy
*
Author to whom correspondence should be addressed.
Actuators 2025, 14(9), 436; https://doi.org/10.3390/act14090436
Submission received: 6 August 2025 / Revised: 27 August 2025 / Accepted: 1 September 2025 / Published: 3 September 2025

Abstract

This study presents a human-centric, data-driven modeling framework for the intelligent evaluation and classification of vibration-reducing (VR) gloves used in hand-transmitted vibration environments. Recognizing the trade-offs between protection and functionality, the integrated performance assessment incorporates three critical and often conflicting metrics: manual dexterity, grip strength, and distributed vibration transmissibility at the palm and fingers. Three independent experiments involving fifteen participants were conducted to evaluate the individual performance of ten commercially available VR gloves fabricated from air bladders, polymers, and viscoelastic gels. The effects of VR gloves on manual dexterity, grip strength, and distributed vibration transmission were investigated. The resulting experimental data were used to train and tune seven different machine learning models. The results suggested that the AdaBoost model demonstrated superior predictive performance, achieving 92% accuracy in efficiently evaluating the integrated performance of VR gloves. It is further shown that the proposed data-driven model could be effectively applied to classify the performances of VR gloves in three workplace conditions based on the dominant vibration frequencies (low-, medium-, and high-frequency). The proposed framework demonstrates the potential of AI-enhanced intelligent actuation systems to support personalized selection of wearable protective equipment, thereby enhancing occupational safety, usability, and task efficiency in vibration-intensive environments.

1. Introduction

Prolonged occupational exposure to the vibration generated by powered hand-held tools, such as rock drills, chipping hammers, bucking bars, and riveters, has been associated with an array of health disorders, including hand–arm vibration syndrome (HAVS), vascular and neurological disorders, and musculoskeletal injuries [1]. Vibration-reducing (VR) gloves, made of air bladders, polymers, or viscoelastic gels, have been developed as a form of wearable protective equipment designed to attenuate the transmission of vibration from the tool handle to the operator’s hand–arm system. Despite their vibration mitigation potential, VR gloves often impair manual performance by reducing grip strength and manual dexterity due to their bulk and stiffness. These trade-offs significantly hinder the adoption of VR gloves in real-world environments, particularly for tasks requiring precision or frequent hand manipulation [2,3]. Prior research has suggested that the preservation of functional performance, including dexterity and grip strength, is critical to enhancing user compliance and ultimately improving long-term occupational health outcomes.
The performance of VR gloves is, invariably, assessed through laboratory measurements in accordance with the method described in ISO 10819 [4]. The method requires measurement of the transmission of handle vibration to the palm and hand, while grasping the vibrating handle with predefined grip (30 N) and push (50 N) forces. Moreover, five subjects are required for the measurements and evaluation in terms of vibration transmissibility, the ratio of frequency-weighted RMS acceleration at the palm to that of the handle. A glove is considered an anti-vibration (AV) glove when the vibration transmission ratio is below 0.9 and 0.6 under vibration in the ranges of medium- (25–200 Hz) and high- (200–1250 Hz) frequency ranges, respectively. This method does not consider vibration transmitted to the fingers of the hand or the manual dexterity and grip strength. The standardized experimental method also lacks consideration of the material properties of the gloves, and, therefore, does not provide any guidance for the design and assessment of human-centric VR gloves. Gloves employing thick and soft vibration-reducing materials in the palm region can meet ISO vibration isolation thresholds at the expense of impaired manual dexterity and reduced grip strength [5,6].
Manual dexterity, characterized by the motion ranges of the gloved hand and fingers, has been extensively studied using a variety of methods. The dexterity performance of VR gloves, to the best of our knowledge, has been attempted in a single study [2] using the well-established ASTM F2010 standard test [7] and the Two-Hand Turning and Placing Minnesota test [8]. The results showed that manual dexterity is significantly impaired by the VR gloves, irrespective of the glove materials. Furthermore, a negative correlation between glove material thickness and manual dexterity has been reported, emphasizing that improved vibration isolation often comes at the cost of reduced functional performance [9,10]. Furthermore, grip strength is commonly diminished when wearing VR gloves, as confirmed by both direct measurements of total contact force at the hand–handle interface via an instrumented handle and indirect assessments of muscles’ activities using electromyography (EMG) [11,12,13,14]. Increased hand fatigue is a likely consequence of the additional effort required to maintain grip when using gloves.
Although several studies have evaluated VR gloves based on palm-transmitted vibration [15], only a few have examined finger-transmitted vibration, despite evidence that finger-transmitted vibration differs substantially from that of the palm and often exhibits notable amplification, specifically within the 100–400 Hz frequency range [15,16,17]. Studies have also shown that palm and finger regions respond differently to vibration, necessitating region-specific glove design and a more comprehensive approach to glove evaluation. Furthermore, conventional glove designs, typically uniform in material, fail to address these regional differences. While hybrid gloves using distinct materials in the palm and finger regions have been proposed, these are not recognized in existing standards and lack comprehensive biomechanical validation.
Efforts to model the mechanical response of the hand–arm system have primarily focused on lumped-parameter or multibody dynamics models aimed at predicting biodynamic responses, such as driving-point mechanical impedance (DPMI) and flow of handle vibration to the elbow and upper arm [18]. Such models can help establish a good understanding of the mechanical properties of the human hand–arm system, but they do not yield design guidance for VR gloves or the injury mechanisms. Some studies have extended modeling to include palm and finger interfaces [19], yet the glove materials are typically modeled using simplified linear approaches (e.g., Kelvin–Voigt models), which do not incorporate complex, real-time interactions between glove design, grip force variation, and vibration input across different frequencies.
Although several works have assessed the individual performance of VR gloves, only one has attempted to analyze the integration characteristics of VR gloves via the analytical hierarchy process (AHP) method, which combined ergonomic and vibration-related metrics through subjective weighting [20]. While the approach recognized the conflicting nature of these metrics, it relied on linear weighting schemes and subjective judgments, without accounting for the nonlinear relationships inherent in glove materials and human biomechanics.
To address these limitations, this study proposes a data-driven, AI-enhanced modeling approach for evaluating the integrated performance of VR gloves, taking into account three key and often conflicting factors: vibration transmissibility at both the palm and fingers, manual dexterity, and grip strength [21,22]. By training machine learning models, including AdaBoost, SVM, random forest, and others [23,24,25,26,27,28,29,30,31], on experimentally acquired data from ten commercially available VR gloves tested, this study aims to capture the complex nonlinear interdependencies among glove material behavior, ergonomic functionality, and vibration mitigation effectiveness.
The proposed intelligent soft-sensing model enables efficient prediction and classification of glove performance under different operational vibration profiles. This framework not only advances the development of wearable, human-centric actuation systems but also facilitates informed selection of tool-specific VR gloves tailored to users’ biomechanical needs and workplace conditions, supporting improved occupational safety, performance, and long-term health outcomes.

2. Experimental Designs and Methods

Three different experiments were designed to characterize the individual performance measures of a total of ten different VR gloves. The methods used for characterizing the vibration transmission, manual dexterity, and grip strength performance of gloves have been described in [6], [2], and [32], respectively. The brief descriptions of the methods are also presented below for the sake of completeness.

2.1. Subjects

A total of 15 male subjects participated in each experiment who did not have any past injuries to their upper limbs and did not possess professional experience with hand-held power tools. Each study protocol had been approved by the human research ethics committee of Concordia University in Montreal, Canada. Prior to the experiments, each participant was informed about the purpose of the study, the experimental methods, and the participants’ rights and obligations. The basic anthropometric data of the participants in terms of age, height, body weight, and their dominant hand dimensions were measured, which are summarized in Table 1.

2.2. Glove Selection

In order to evaluate the individual performance of VR gloves, nine different VR gloves were selected, which included five gel gloves with different material properties, denoted as Gel1,…, Gel5, and two air gloves made of air pocket material, named Air1 and Air2. One rubber glove was also selected, denoted as rubber. In addition, a hybrid glove was chosen, which consisted of different materials distributed in the palm (air pocket) and in the finger regions (gel), denoted as Hybrid. A conventional fabric glove, named Fabric, was also selected as a reference group. All the selected gloves are pictorially shown in Figure 1. All the available glove sizes were ordered, ranging from small to extra-large, as reported in [2]. Subjects were asked to attempt to try several sizes of the gloves and choose the best fit so as to allow adequate fingers and sufficient hand movement.

2.3. Experimental Methods of VR Gloves

To establish the methodology for evaluating the integrated performance of the ten gloves, fifteen adult male subjects performed specific experiments designed to quantify (i) manual dexterity; (ii) grip strength performance of gloves; and (iii) vibration responses distributed over the palm and fingers. The hand manual dexterity was assessed using the Two-Hand Turning and Placing Minnesota method (Figure 2a). The detailed experimental procedures of the manual dexterity test are reported in [2]. The manual dexterity data of ten gloves are used in this study to develop the data-driven model. The effect of VR gloves on hand grip strength was indirectly investigated via the electromyography (EMG) method, as shown in Figure 2b. Surface electromyography (EMG) was used to measure the contractions of four distinct forearm muscles under varying grip forces applied by the gloved and bare hands. More details can be found in [32]. The grip strength data were investigated via different combinations of flexor carpi radialis (FCR) and extensor carpi radialis longus (ECR) under different magnitudes of hand grip forces. The data obtained for 50N grip force and integrated activities of ECR and FCR, however, are used for developing a data-driven model of VR gloves.
The index and middle fingers contribute the primary load path with the thumb, yielding stable, representative transmissibility while minimizing sensor intrusion. The transmission of vibration to the palm and middle phalanges of the index and middle fingers with and without gloves was measured using the finger and palm adapters, separately, as shown in Figure 2c. The experimental procedures and data collection were described in ref. [6]. Briefly, the palm vibration transmissibility with and without a glove was measured using the standardized palm adapter with a three-axis accelerometer. The vibration transmitted to the mid phalanges of the index and middle fingers with and without a glove was measured using the Velcro finger adapters with a three-axis accelerometer. The instrumented handle was excited by a broadband random vibration spectrum (25–1600 Hz). The subjects grasped the handle with a 30 ± 5 N grip and a 50 ± 8 N push force with the bare hand or wearing an AV glove, while maintaining the posture in accordance with ISO 10819 (2013). The palm vibration transmissibility (TR_palm) and index finger vibration transmissibility (TR_finger) were collected by ratios of measured RMS acceleration at the palm and fingers with that of handle RMS acceleration, respectively. The wh-weighted palm vibration transmissibility and the wp-weighted finger vibration transmissibility of each glove were subsequently normalized with respect to those obtained for the bare hand. In this study, the data collected from the abovementioned experiments are used to develop a data-driven model based on a soft-sensing technique. The experimental data were partitioned at the subject level into 80% training (12 subjects) and 20% testing (3 subjects) with stratification by glove label and frequency class. All preprocessing and hyperparameter tuning were performed on the training set only, and held-out test subjects were never used during model development.

3. Performance Assessment of Data-Driven Models

Several data-driven modeling approaches have been extensively reported in the literature, each employing distinct mechanisms for classification and regression tasks. The support vector machine (SVM) model [24] is a supervised learning algorithm that employs a Kernel function to map the input features to the multi-dimensional feature space, effectively handling nonlinear relationships [25]. In contrast, the decision tree (DT) model [26] constructs a hierarchical tree structure through recursive binary divisions of the datasets, where internal nodes represent feature-based tests and leaf nodes denote class labels. The random forest (RF) [27] model integrates multiple decision trees via ensemble methods, such as voting or averaging, thereby enhancing predictive performance and robustness, while logistic regression (LR) [28] is a generalized linear model that utilizes logical functions to model the probability of class membership, making it suitable for multi-dimensional sparse data.
Differently, the K-nearest neighbor (KNN) model [29] is a non-parametric algorithm that determines the class of a new, unlabeled sample based on the majority class among its nearest neighbors in the training set. This approach requires no assumptions about the underlying data distribution and offers flexibility in handling nonlinear data. The Naïve Bayes (NB) model [30] establishes probability distributions for features using the training data and applies Bayes’ theorem to predict the most probable class for new samples. Adaptive Boosting (AdaBoost) [31] combines multiple weak learners through iterative training, focusing on misclassified samples to progressively improve overall model accuracy.
In this study, seven different data-driven modeling techniques, SVM, DT, RF, LR, KNN, NB, and AdaBoost, are systematically evaluated for assessing their suitability for VR glove performance classification. The predictive performance of each model was quantified using standard metrics, including accuracy (ACC), sensitivity (SN), positive predictive value (PPV), and F-score. The mathematical definitions of these metrics are provided in Equations (1)–(4), c respectively.
A C C = T P + T N T P + T N + F P + F N
S N = T P T P + F N
P P V = T P T P + F P
F-score = 2 × T P 2 × T P + F P + F N
where TP and TN represent true positive and true negative predictions, respectively, whereas FP and FN denote false positive and false negative predictions, respectively. Additionally, the area under the receiver operating characteristic curve (AUC) was considered as a supplementary metric to evaluate model discrimination capability. To mitigate the risk of overfitting and enhance the generalizability of the results, all data-driven models were validated using a five-fold cross-validation procedure.
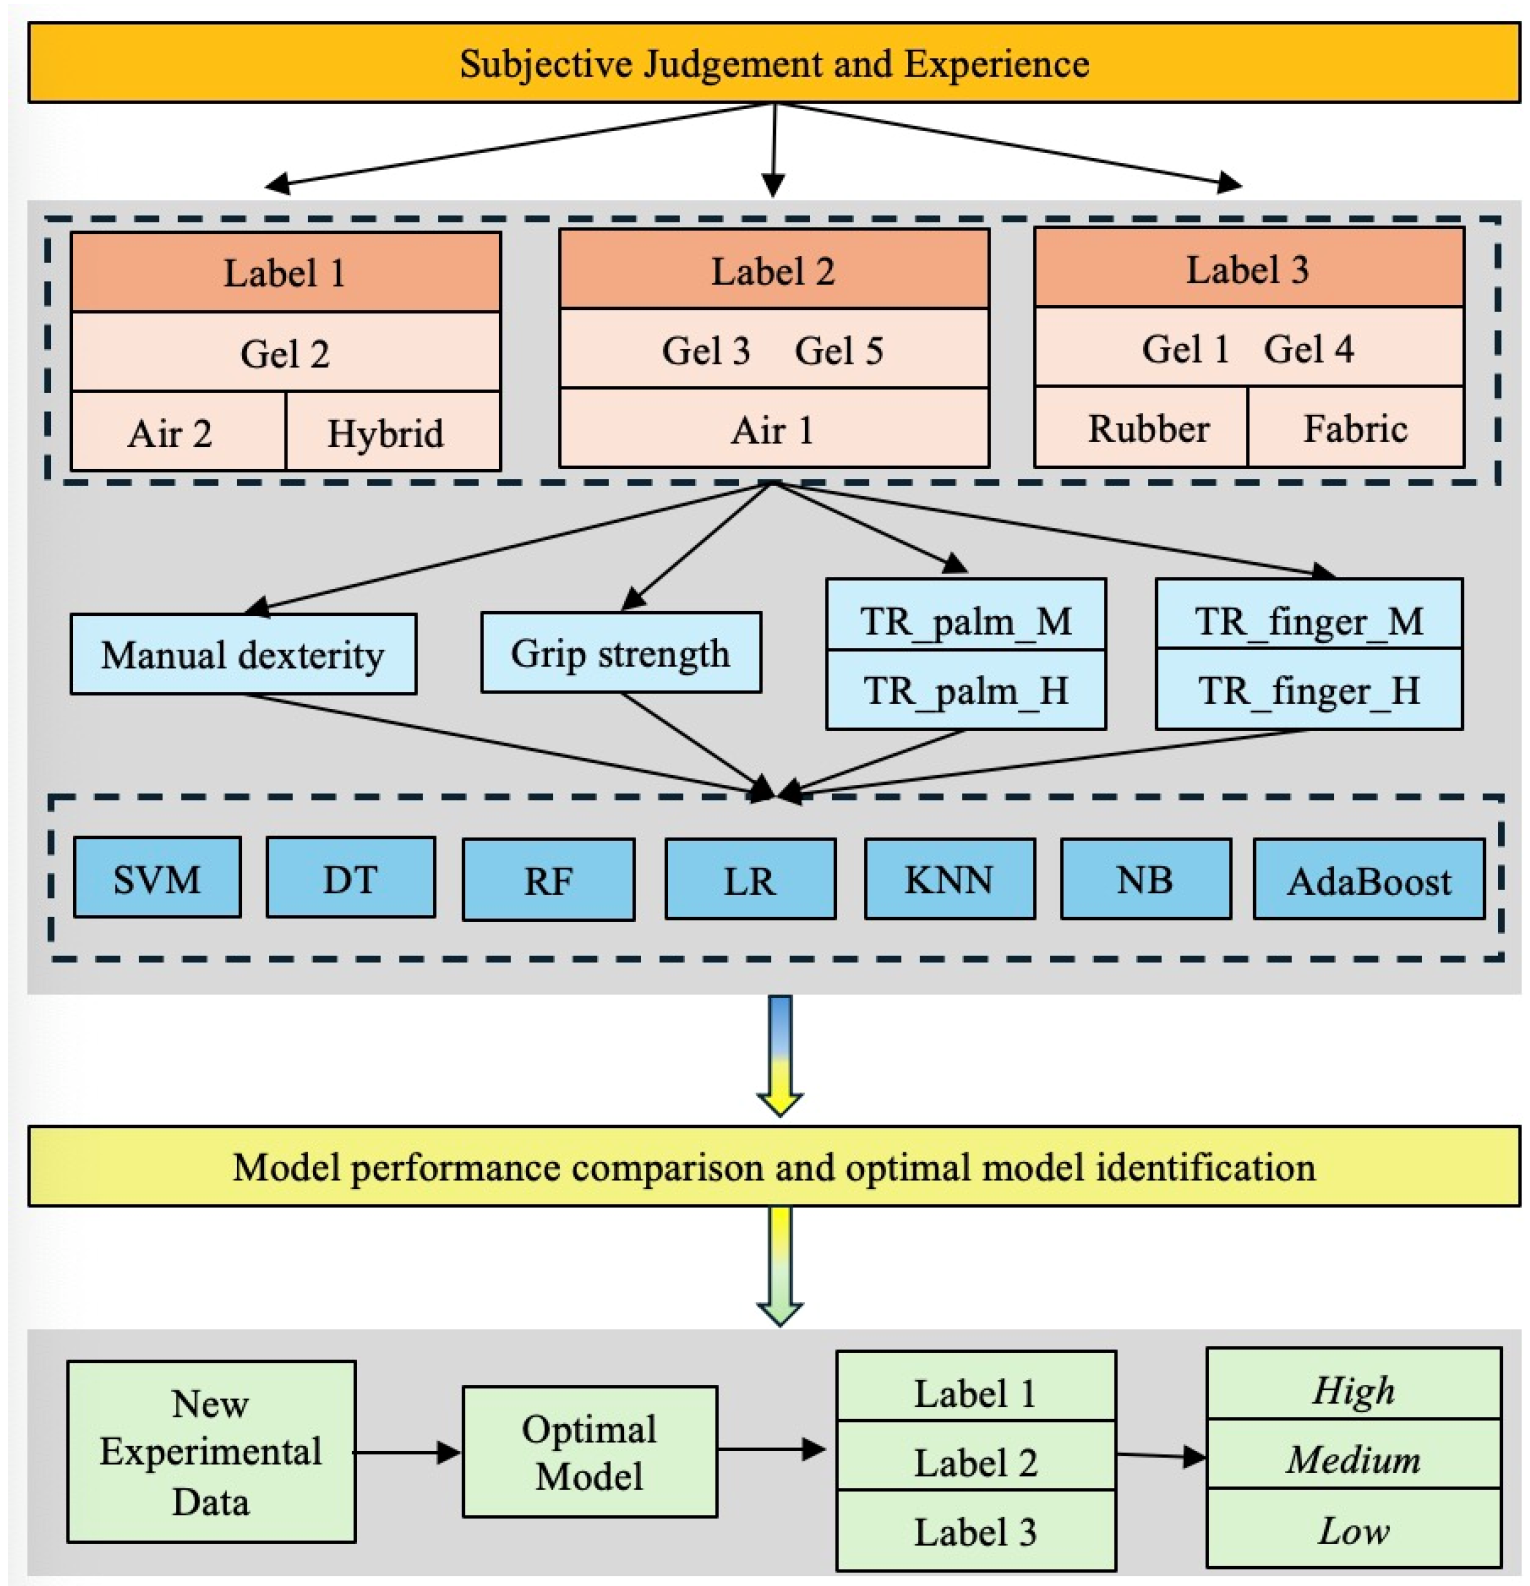
Figure 3 illustrates the overall workflow of the data-driven modeling approach and performance-based classification of VR gloves. Given that the vibration isolation performance of VR gloves is highly sensitive to the dominant frequency range of handle vibration, the vibration spectra of tool handles were categorized into three dominant frequency ranges: low (<25 Hz), medium (25–100 Hz), and high (>100 Hz). Each data-driven model was constructed to incorporate these three frequency classes for improving classification accuracy and relevance. In addition, the selected gloves were classified into three groups based on subjective judgments and experts’ experiences. These groups, denoted as Label1, Label2, and Label3, represent different levels of integrated glove performance. Specifically, the Label1 group included Gel2, Air2, and hybrid gloves, which were judged to have superior overall performance. Label2 comprised Gel3, Gel5, and Air1 gloves, which demonstrated intermediate performance. The remaining gloves, namely, Gel1, Gel4, fabric, and rubber, were assigned to Label3, which represents relatively lower integrated performance.
Verifications of the above-mentioned models were conducted using the data relevant to the three classes of individual measures, and the optimal data-driven model was subsequently identified on the basis of effectiveness for assessing the comprehensive performance comprising vibration isolation characteristics and ergonomic aspects. The identified optimal model was then used to evaluate the overall performance of VR gloves and to classify VR gloves into three defined performance levels based on subjective judgments, thereby providing evidence-based, scientific guidance to operators for selecting the most desirable VR gloves.

4. Results and Discussions

4.1. Features Analysis

The overall effectiveness of vibration-reducing gloves depends on individual measures, defined by six features of the model, as described above and illustrated in Figure 3. These six features include vibration isolation performance at the palm and fingers in the middle- and high-frequency ranges, as well as ergonomic factors in terms of manual dexterity and grip strength. To better understand the influence of each feature on the comprehensive performance of VR gloves, the distributions of these six features were analyzed. Table 2 summarizes the results of individual experiments in terms of the minimum, maximum, and mean values of each feature for the middle-(M) and high-(H) frequency ranges. In this Table, the manual dexterity score is defined as the ratio of completion time glove hand, normalized relative to that with the bare hand. Grip strength measure describes the combined muscle activities of the gloved hand–arm, normalized with respect to that of the bare hand–arm. The vibration transmissibility measures defined the proportion of handle vibration transmitted to either the palm or the index finger.
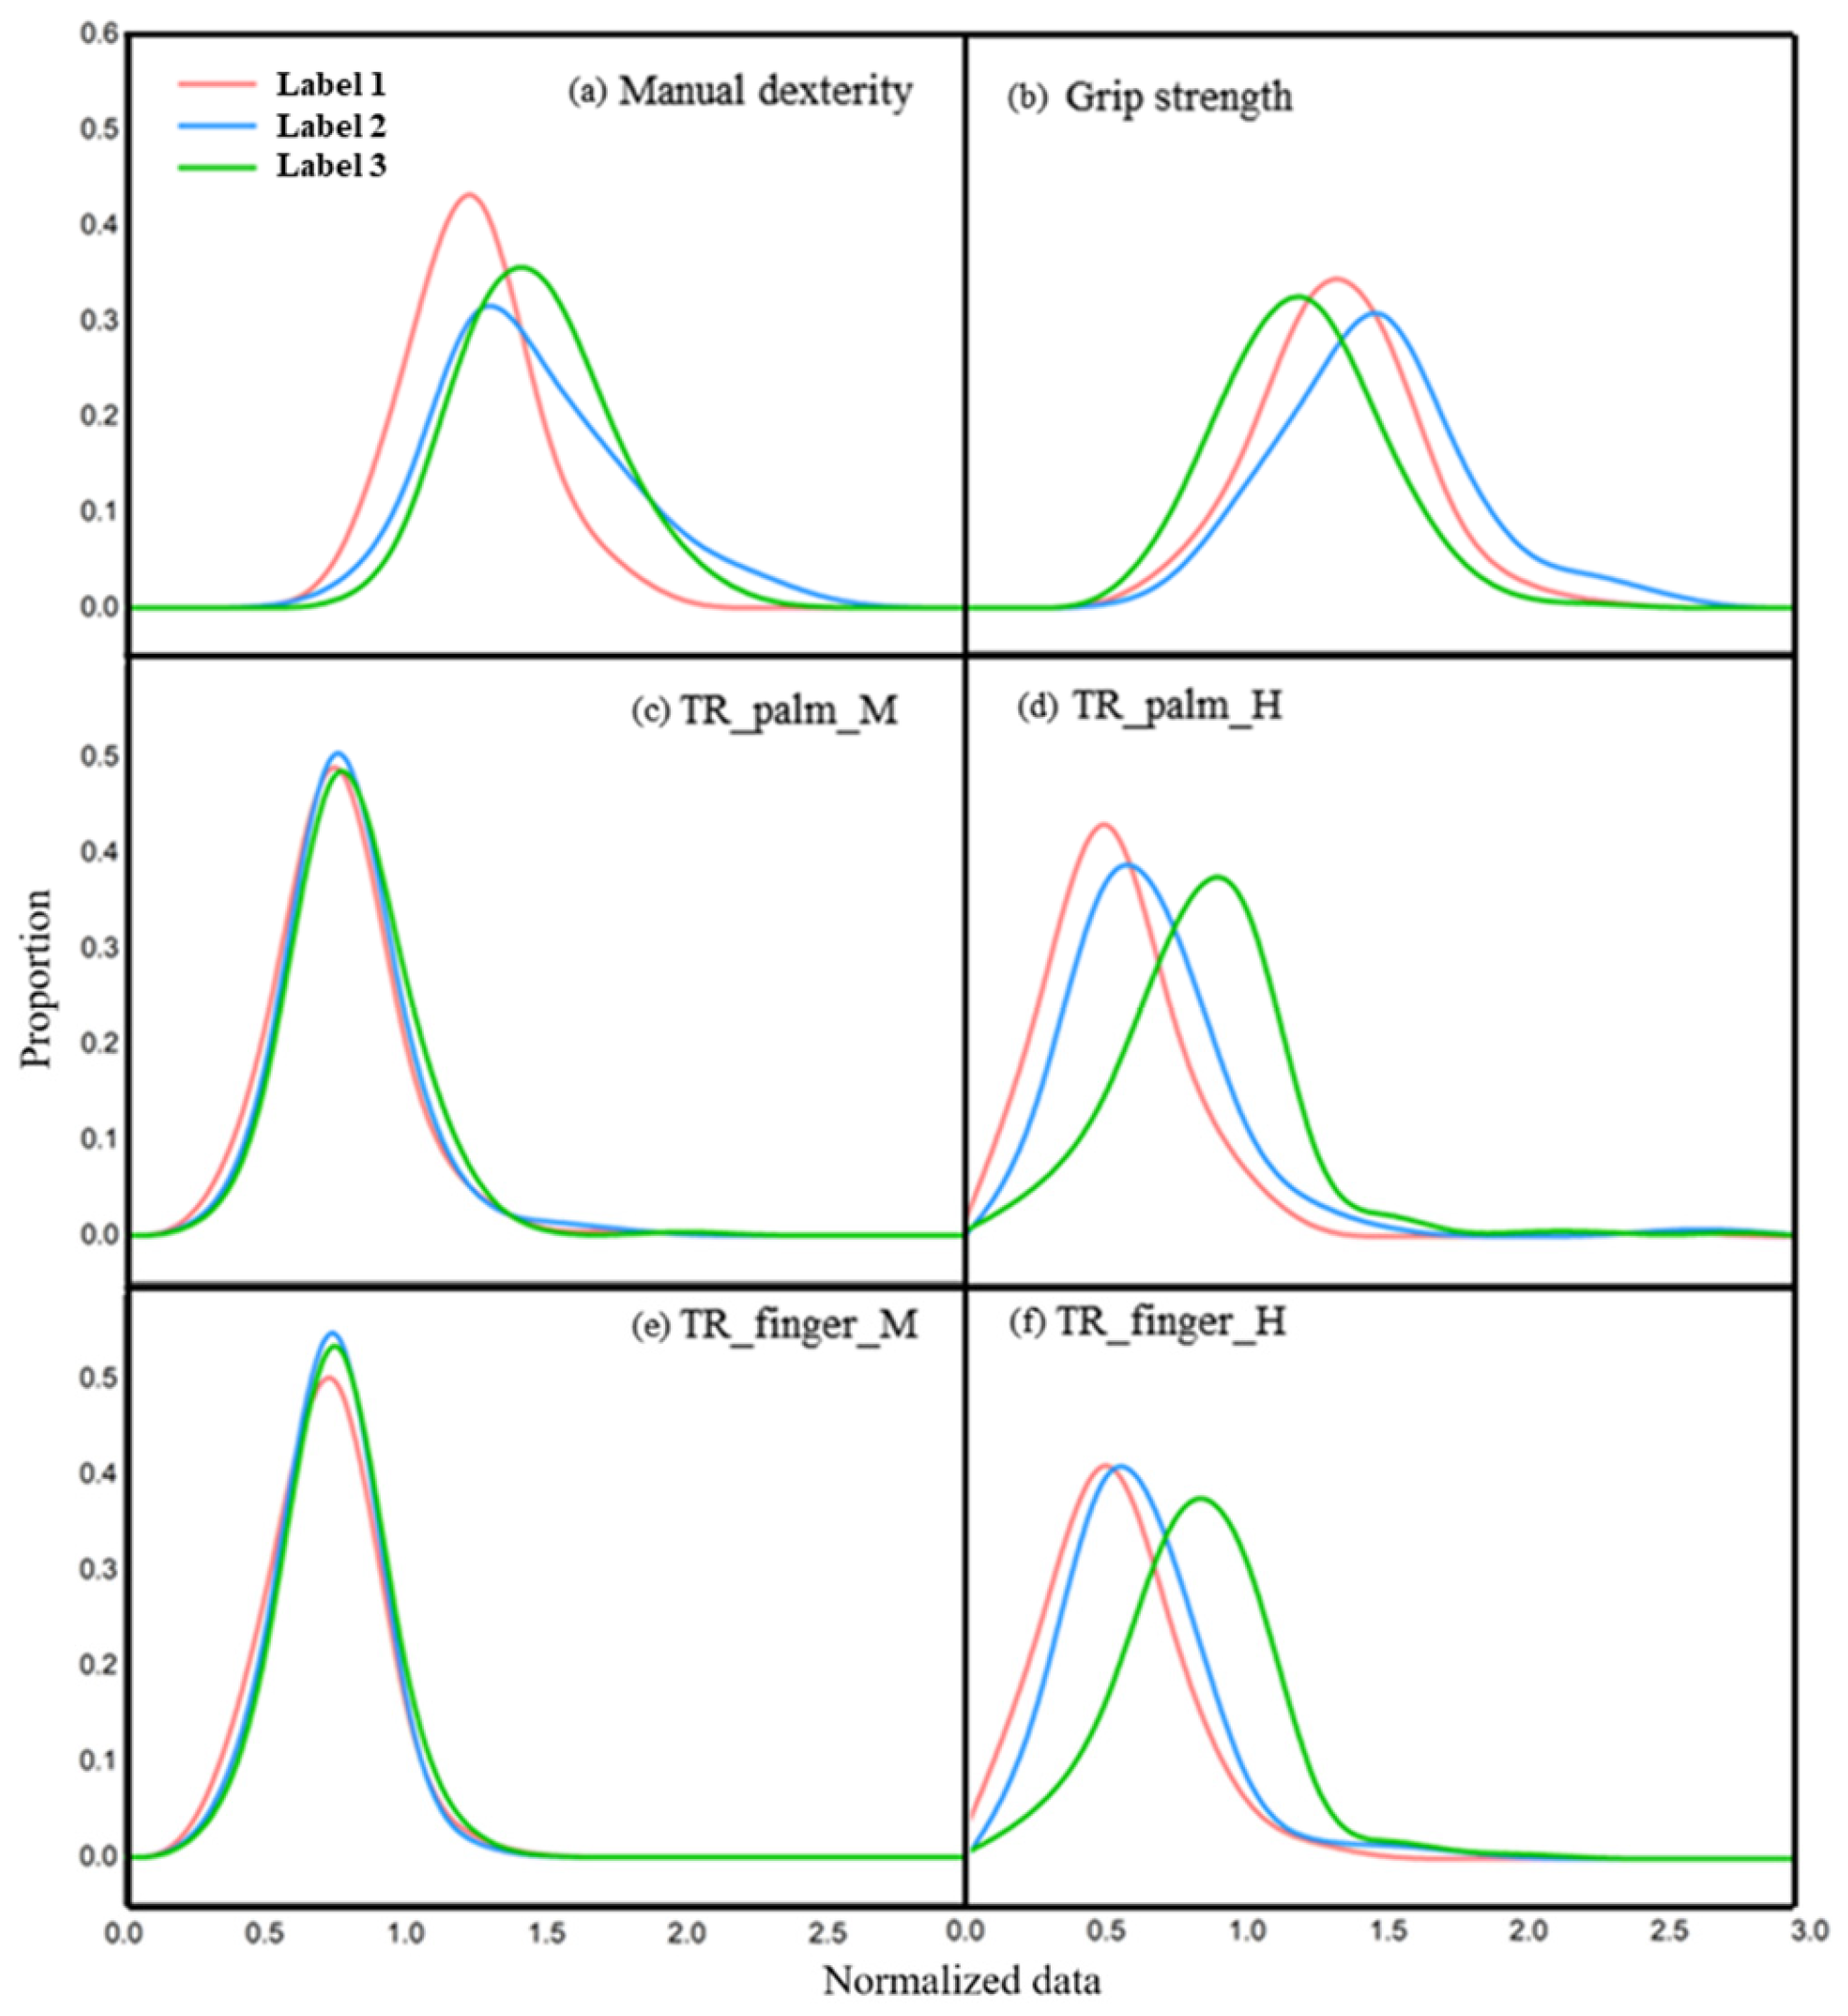
The distributions of each feature are presented in Figure 4. As can be seen from Figure 4a, the peak value of the manual dexterity distribution for gloves in Label 2 is slightly lower than that of the other two labels, indicating that gloves in Label 2 are more suitable for handling conditions requiring higher hand dexterity. The grip strength distribution, shown in Figure 4b, reveals comparable grip strength performance across all three categories of VR gloves. The results suggest that the chosen gloves cannot be well distinguished using the grip strength preservation criterion. Similarly, the distributions of vibration transmissibility at the palm and finger in the middle frequency range, across all VR gloves, are shown in Figure 4c,e, respectively. The results exhibit significant overlap in the medium-frequency range, and their modes (i.e., the most proportion occurring values) generally fall between 0.5 and 1.0. This is due to the fact that these gloves have consistent vibration isolation performance when holding relatively low-frequency vibration tools, irrespective of the palm and fingers. In contrast, for the high-frequency range (Figure 4d,f), the distributions of TR_palm_H and TR_finger_H of gloves within Label 3 are notably lower than those of the others, indicating that gloves within Label 3 may not be effective for tools causing high-frequency handle vibration, such as grinders, chainsaws, and impact hammers.

4.2. Model Comparison and Verification

The performance of seven data-driven models was evaluated using an optimal feature combination for glove identification, and the results are summarized in Table 3. Furthermore, all the prediction models were trained and tested using a five-fold cross-validation to mitigate the risk of overfitting. Five-fold cross-validation was performed using a stratification strategy to maintain balanced distributions of glove types and performance metrics across folds. Specifically, the dataset was divided into five subsets, with each fold used once as the test set while the remaining four served as the training set. Model performance was evaluated on each test fold, and accuracy and mean squared error were recorded. The mean and standard deviation of these results were then reported as a robust estimate of the final model performance. A fixed random seed was also applied during partitioning to ensure reproducibility.
Table 3 shows the performance of seven models across multiple evaluation criteria. Among them, the AdaBoost model outperformed all other models in four (i.e., ACC, SN, F-score, and AUC) out of five criteria, achieving the highest average performance score of 0.90. These results indicate that the AdaBoost model can effectively distinguish between the three levels of VR gloves when used with hand-held vibration tools. The random forest (RF) model achieved the highest positive predictive value (PPV), which was closely followed by AdaBoost. Nonetheless, due to its consistently superior performance across the majority of evaluation metrics, AdaBoost was selected as the optimal prediction model for analyzing the integrated performance of VR gloves for three different workplace conditions.
The performance of the seven selected models was further validated using the test dataset, as summarized in Table 4. Among all models, AdaBoost consistently exhibited superior performance across all evaluation metrics, confirming its effectiveness in accurately classifying the three categories of gloves. This highlights its potential to support operators in selecting the most suitable gloves based on specific working conditions. The full AdaBoost configuration used is AdaBoostClassifier(DecisionTreeClassifier(max_depth = 1), n_estimators = 100, learning_rate = 0.5, algorithm = ‘SAMME.R’, random_state = 0). These settings were fixed across all folds to ensure exact replicability. Overall, the proposed model effectively integrates multiple performance features, offering a reliable and precise strategy for VR glove selection.

5. Conclusions

This study presents a systematic, analytical, and experimental framework for evaluating the integrated performance of vibration-reducing (VR) gloves, incorporating three critical performance metrics: distributed vibration isolation, manual dexterity, and grip strength. By leveraging a data-driven approach, multiple machine learning models were trained and validated using experimentally collected data. Among the models assessed, the AdaBoost algorithm exhibited superior predictive capability, achieving a classification accuracy of 92% and demonstrating its robustness in capturing the complex, nonlinear interdependencies among glove design features and functional outcomes. The proposed AI-enhanced modeling framework provides a valuable decision-support tool for classifying and selecting VR gloves based on integrated performance, tailored to distinct vibration exposure conditions. This contributes to the development of intelligent, human-centric wearable actuation systems that prioritize both safety and usability in vibration-intensive occupational settings. Promoting informed glove selection through such intelligent tools is key to improving compliance and reducing the incidence of vibration-induced injuries in the workplace. Nonetheless, the applicability of the model is currently limited to the range of tool types and vibration conditions investigated, particularly low- and high-frequency excitation scenarios. Precision-intensive tasks involving complex manipulation were not included and represent an important avenue for future exploration. Further studies should expand the experimental design to incorporate a broader range of operational contexts and refine the model’s generalizability. Additionally, integration with real-time sensing and adaptive glove technologies may enhance the responsiveness and personalization of vibration mitigation strategies in next-generation wearable systems.

Author Contributions

Conceptualization, Y.Y. and S.R.; methodology, Y.Y. and W.X.; software, W.X.; validation, A.M.; formal analysis, Y.Y.; investigation, Y.Y.; resources, Y.Y.; data curation, W.X.; writing—original draft preparation, Y.Y.; writing—review and editing, M.T. and P.S.; visualization, W.X.; supervision, S.R.; project administration, Y.Y.; funding acquisition, Y.Y. All authors have read and agreed to the published version of the manuscript.

Funding

This research was funded by the National Natural Science Foundation of China, grant number 52105114, and the National Foreign Expert Program, grant number G2023013015.

Informed Consent Statement

Informed consent was obtained from all subjects involved in the study.

Data Availability Statement

The datasets generated and analyzed during the current study are available from the lead author upon reasonable request.

Conflicts of Interest

The authors declare that they have no competing interests that influenced the work reported in this paper.

References

  1. Weir, E.; Lander, L. Hand–arm vibration syndrome. Can. Med. Assoc. J. 2005, 172, 1001–1002. [Google Scholar] [CrossRef]
  2. Yao, Y.; Rakheja, S.; Gauvin, C.; Marcotte, P.; Hamouda, K. Evaluation of effects of anti-vibration gloves on manual dexterity. Ergonomics 2018, 61, 1530–1544. [Google Scholar] [CrossRef]
  3. Hamouda, K.; Rakheja, S.; Dewangan, K.N.; Marcotte, P. Fingers’ vibration transmission and grip strength preservation performance of vibration reducing gloves. Appl. Ergon. 2018, 66, 121–138. [Google Scholar] [CrossRef]
  4. ISO 10819:2013; Mechanical Vibration and Shock-Hand-Arm Vibration—Measurement and Evaluation of the Vibration Transmissibility of Gloves at the Palm of the Hand. International Organization for Standardization (ISO): Geneva, Switzerland, 2013.
  5. Md Rezali, K.A.; Griffin, M.J. The transmission of vibration through gloves to the hand and to the fingers: Effects of material dynamic stiffness. Appl. Mech. Mater. 2014, 564, 149–154. [Google Scholar] [CrossRef]
  6. Yao, Y.; Rakheja, S.; Marcotte, P. Distributed vibration isolation and manual dexterity of anti-vibration gloves: Is there a correlation? Ergonomics 2020, 63, 735–755. [Google Scholar] [CrossRef] [PubMed]
  7. Ervin, C.A. A Standardized Dexterity Test Battery. In Performance of Protective Clothing, Proceedings of the Second International Symposium on Performance of Protective Clothing, Tampa, FL, USA, 19–21 January 1987; ASTM International: West Conshohocken, PA, USA, 1988. [Google Scholar]
  8. Jurgensen, C.E. Extension of the Minnesota Rate of Manipulation Test. J. Appl. Psychol. 1943, 27, 164. [Google Scholar] [CrossRef]
  9. Dianat, I.; Haslegrave, C.M.; Stedmon, A.W. Methodology for evaluating gloves in relation to the effects on hand performance capabilities: A literature review. Ergonomics 2012, 55, 1429–1451. [Google Scholar] [CrossRef]
  10. Dianat, I.; Haslegrave, C.M.; Stedmon, A.W. Short and longer duration effects of protective gloves on hand performance capabilities and subjective assessments in a screw-driving task. Ergonomics 2010, 53, 1468–1483. [Google Scholar] [CrossRef]
  11. Yao, Y.; Rakheja, S.; Marcotte, P. Relationship among hand forces imparted on a viscoelastic hand-handle interface. Measurement 2019, 145, 525–534. [Google Scholar] [CrossRef]
  12. Larivière, C.; Plamondon, A.; Lara, J.; Tellier, C.; Boutin, J.; Dagenais, A. Biomechanical assessment of gloves. A study of the sensitivity and reliability of electromyographic parameters used to measure the activation and fatigue of different forearm muscles. Int. J. Ind. Ergon. 2004, 34, 101–116. [Google Scholar] [CrossRef]
  13. Wimer, B.; Dong, R.G.; Welcome, D.E.; Warren, C.; McDowell, T.W. Development of a new dynamometer for measuring grip strength applied on a cylindrical handle. Med. Eng. Phys. 2009, 31, 695–704. [Google Scholar] [CrossRef]
  14. Lemerle, P.; Klinger, A.; Cristalli, A.; Geuder, M. Application of pressure mapping techniques to measure push and gripping forces with precision. Ergonomics 2008, 51, 168–191. [Google Scholar] [CrossRef] [PubMed]
  15. McDowell, T.W.; Dong, R.G.; Welcome, D.E.; Xu, X.S.; Warren, C. Vibration-reducing gloves: Transmissibility at the palm of the hand in three orthogonal directions. Ergonomics 2013, 56, 1823–1840. [Google Scholar] [CrossRef] [PubMed]
  16. Welcome, D.E.; Dong, R.G.; Xu, X.S.; Warren, C.; McDowell, T.W. The effects of vibration-reducing gloves on finger vibration. Int. J. Ind. Ergon. 2014, 44, 45–59. [Google Scholar] [CrossRef] [PubMed]
  17. Dong, R.G.; Welcome, D.E.; Wu, J.Z. Frequency weightings based on biodynamics of fingers-hand-arm system. Ind. Health 2005, 43, 516–526. [Google Scholar] [CrossRef]
  18. Rakheja, S.; Wu, J.Z.; Dong, R.G.; Schopper, A.W.; Boileau, P.-É. A comparison of biodynamic models of the human hand–arm system for applications to hand-held power tools. J. Sound Vib. 2002, 249, 55–82. [Google Scholar] [CrossRef]
  19. Dong, R.G.; Dong, J.H.; Wu, J.Z.; Rakheja, S. Modeling of biodynamic responses distributed at the fingers and the palm of the human hand–arm system. J. Biomech. 2007, 40, 2335–2340. [Google Scholar] [CrossRef]
  20. Yao, Y.; Rakheja, S.; Marcotte, P. A methodology for integrated performance analyses of vibration reducing gloves. Int. J. Ind. Ergon. 2021, 85, 103174. [Google Scholar] [CrossRef]
  21. Ntoutsi, E.; Fafalios, P.; Gadiraju, U.; Iosifidis, V.; Nejdl, W.; Vidal, M.-E.; Ruggieri, S.; Turini, F.; Papadopoulos, S.; Krasanakis, E. Bias in data-driven artificial intelligence systems—An introductory survey. Wiley Interdiscip. Rev. Data Min. Knowl. Discov. 2020, 10, e1356. [Google Scholar] [CrossRef]
  22. Baier, L.; Jöhren, F.; Seebacher, S. Challenges in the deployment and operation of machine learning in practice. In Proceedings of the ECIS, Stockholm, Sweden, 8–14 June 2019; pp. 1–15. [Google Scholar]
  23. Habib, M.K.; Ayankoso, S.A.; Nagata, F. Data-driven modeling: Concept, techniques, challenges and a case study. In Proceedings of the 2021 IEEE International Conference on Mechatronics and Automation (ICMA), Takamatsu, Japan, 8–11 August 2021; pp. 1000–1007. [Google Scholar]
  24. Sain, S.R. The Nature of Statistical Learning Theory; Taylor & Francis: Oxfordshire, UK, 1996. [Google Scholar]
  25. Li, W.; Zhuo, Y.; Bao, J.; Shen, Y. A data-based soft-sensor approach to estimating raceway depth in ironmaking blast furnaces. Powder Technol. 2021, 390, 529–538. [Google Scholar] [CrossRef]
  26. Quinlan, J.R. Induction of decision trees. Mach. Learn. 1986, 1, 81–106. [Google Scholar] [CrossRef]
  27. Breiman, L. Random forests. Mach. Learn. 2001, 45, 5–32. [Google Scholar] [CrossRef]
  28. Mousavi, S.Z.; Kavian, A.; Soleimani, K.; Mousavi, S.R.; Shirzadi, A. GIS-based spatial prediction of landslide susceptibility using logistic regression model. Geomat. Nat. Hazards Risk 2011, 2, 33–50. [Google Scholar] [CrossRef]
  29. Raymer, M.L.; Sanschagrin, P.C.; Punch, W.F.; Venkataraman, S.; Goodman, E.D.; Kuhn, L.A. Predicting conserved water-mediated and polar ligand interactions in proteins using a K-nearest-neighbors genetic algorithm. J. Mol. Biol. 1997, 265, 445–464. [Google Scholar] [CrossRef]
  30. Rish, I. An empirical study of the naive Bayes classifier. In Proceedings of the IJCAI 2001 Workshop on Empirical Methods in Artificial Intelligence, Seattle, WA, USA, 4–6 August 2001; pp. 41–46. [Google Scholar]
  31. Zhang, C.; Ma, Y. Ensemble Machine Learning; Springer: Berlin/Heidelberg, Germany, 2012; Volume 144. [Google Scholar]
  32. Yao, Y.; Rakheja, S.; Larivière, C.; Marcotte, P. Assessing increased activities of the forearm muscles due to anti-vibration gloves: Construct validity of a refined methodology. Hum. Factors 2022, 64, 466–481. [Google Scholar] [CrossRef]
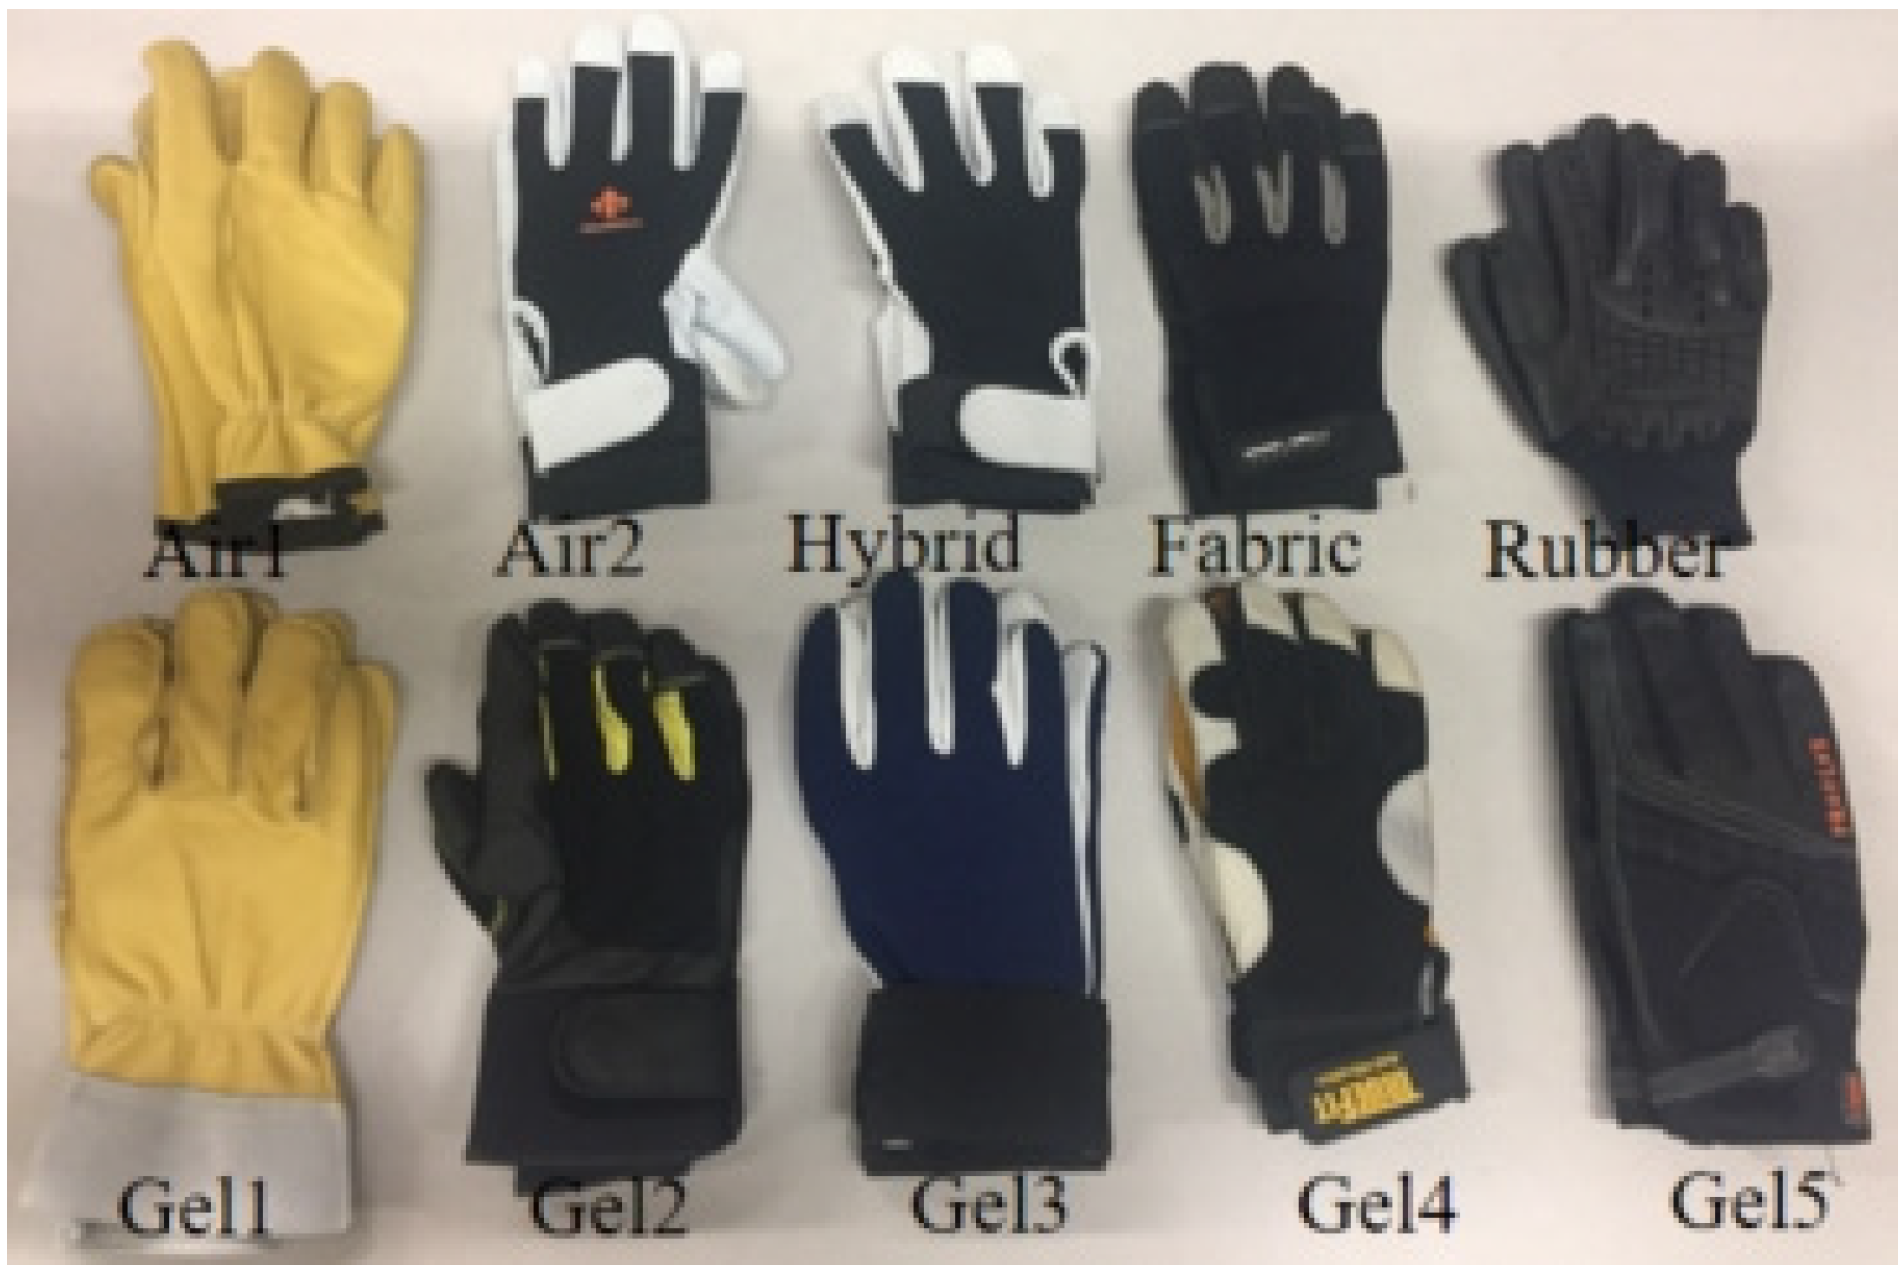
Figure 1. Selection of the vibration-reducing gloves.
Actuators 14 00436 g001
Figure 2. Experimental setups used for characterizing individual performance measures of selected gloves: (a) manual dexterity test; (b) grip strength test; (c) fingers and palm vibration transmission tests.
Actuators 14 00436 g002
Figure 3. Workflow of data-driven model development and performance-based classification of VR gloves.
Actuators 14 00436 g003
Figure 4. Distributions of six features across three categories of VR gloves.
Actuators 14 00436 g004
Table 1. Anthropometric dimensions of selected subjects.
ParameterMaximumMinimumMeanStandard Deviation
Age (years)352227.543.71
Height (cm)181169174.815.51
Body weight (kg)796070.276.33
Hand length (mm)205180188.737.24
Palm circumference (mm)220185197.6710.59
Table 2. The minimum, maximum, and mean values of the features.
LabelsValuesFeatures
Manual DexterityTR_palm_MTR_palm_HTR_finger_MTR_finger_HGrip Strength
1Min0.890.550.180.590.050.92
Max1.981.902.531.321.622.69
Mean1.580.880.670.830.651.47
2Min0.960.570.310.620.280.86
Max2.641.832.891.381.762.59
Mean1.370.930.790.860.751.59
3Min0.850.600.290.590.230.87
Max2.322.012.291.261.732.38
Mean1.500.960.950.890.901.39
Table 3. Performance comparison of seven data-driven models for glove classification based on training data.
Prediction ModelsACCSNPPVF-ScoreAUCAverage
Performance
SVM0.810.880.710.790.820.80
KNN0.830.810.780.790.830.81
LR0.790.850.710.770.800.78
NB0.790.810.720.760.800.78
RF0.840.690.900.780.820.81
DT0.780.690.750.720.770.74
AdaBoost0.900.920.860.890.910.90
Table 4. Performance comparison of seven data-driven models for glove identification based on test data.
Prediction ModelsACCSNPPVF-ScoreAUCAverage
Performance
SVM0.830.800.810.810.820.83
KNN0.780.730.750.740.760.78
LR0.810.830.760.790.800.81
NB0.810.820.770.790.800.81
RF0.820.770.810.790.800.82
DT0.850.850.800.830.830.85
AdaBoost0.920.900.920.910.910.92
Disclaimer/Publisher’s Note: The statements, opinions and data contained in all publications are solely those of the individual author(s) and contributor(s) and not of MDPI and/or the editor(s). MDPI and/or the editor(s) disclaim responsibility for any injury to people or property resulting from any ideas, methods, instructions or products referred to in the content.