1. Introduction
Electro-hydraulic servos are widely used actuators consisting of a servovalve, piston and feedback loop. The combination of a high bandwidth, large force capability and mechanical robustness mean they can be found in many industrial applications, including material testing machines [
1,
2,
3], aircraft primary flight controls [
4,
5], flight simulators [
6], robotics [
4], the dynamic testing of components in hardware-in-the-loop systems [
7] and earthquake-simulating shaker tables [
8].
The use of hydraulics in mobile robotics is quite appealing due to the dynamic performance and power density achievable compared with electromagnetic actuation. However, it comes with reduced efficiency due to the flow throttling and leakage within the servovalve and challenges with control design due to nonlinearities in the pressure–flow relationship, friction, parameter uncertainties, including the temperature-dependent fluid properties, low damping and high order dynamics, particularly when the valve response cannot be neglected.
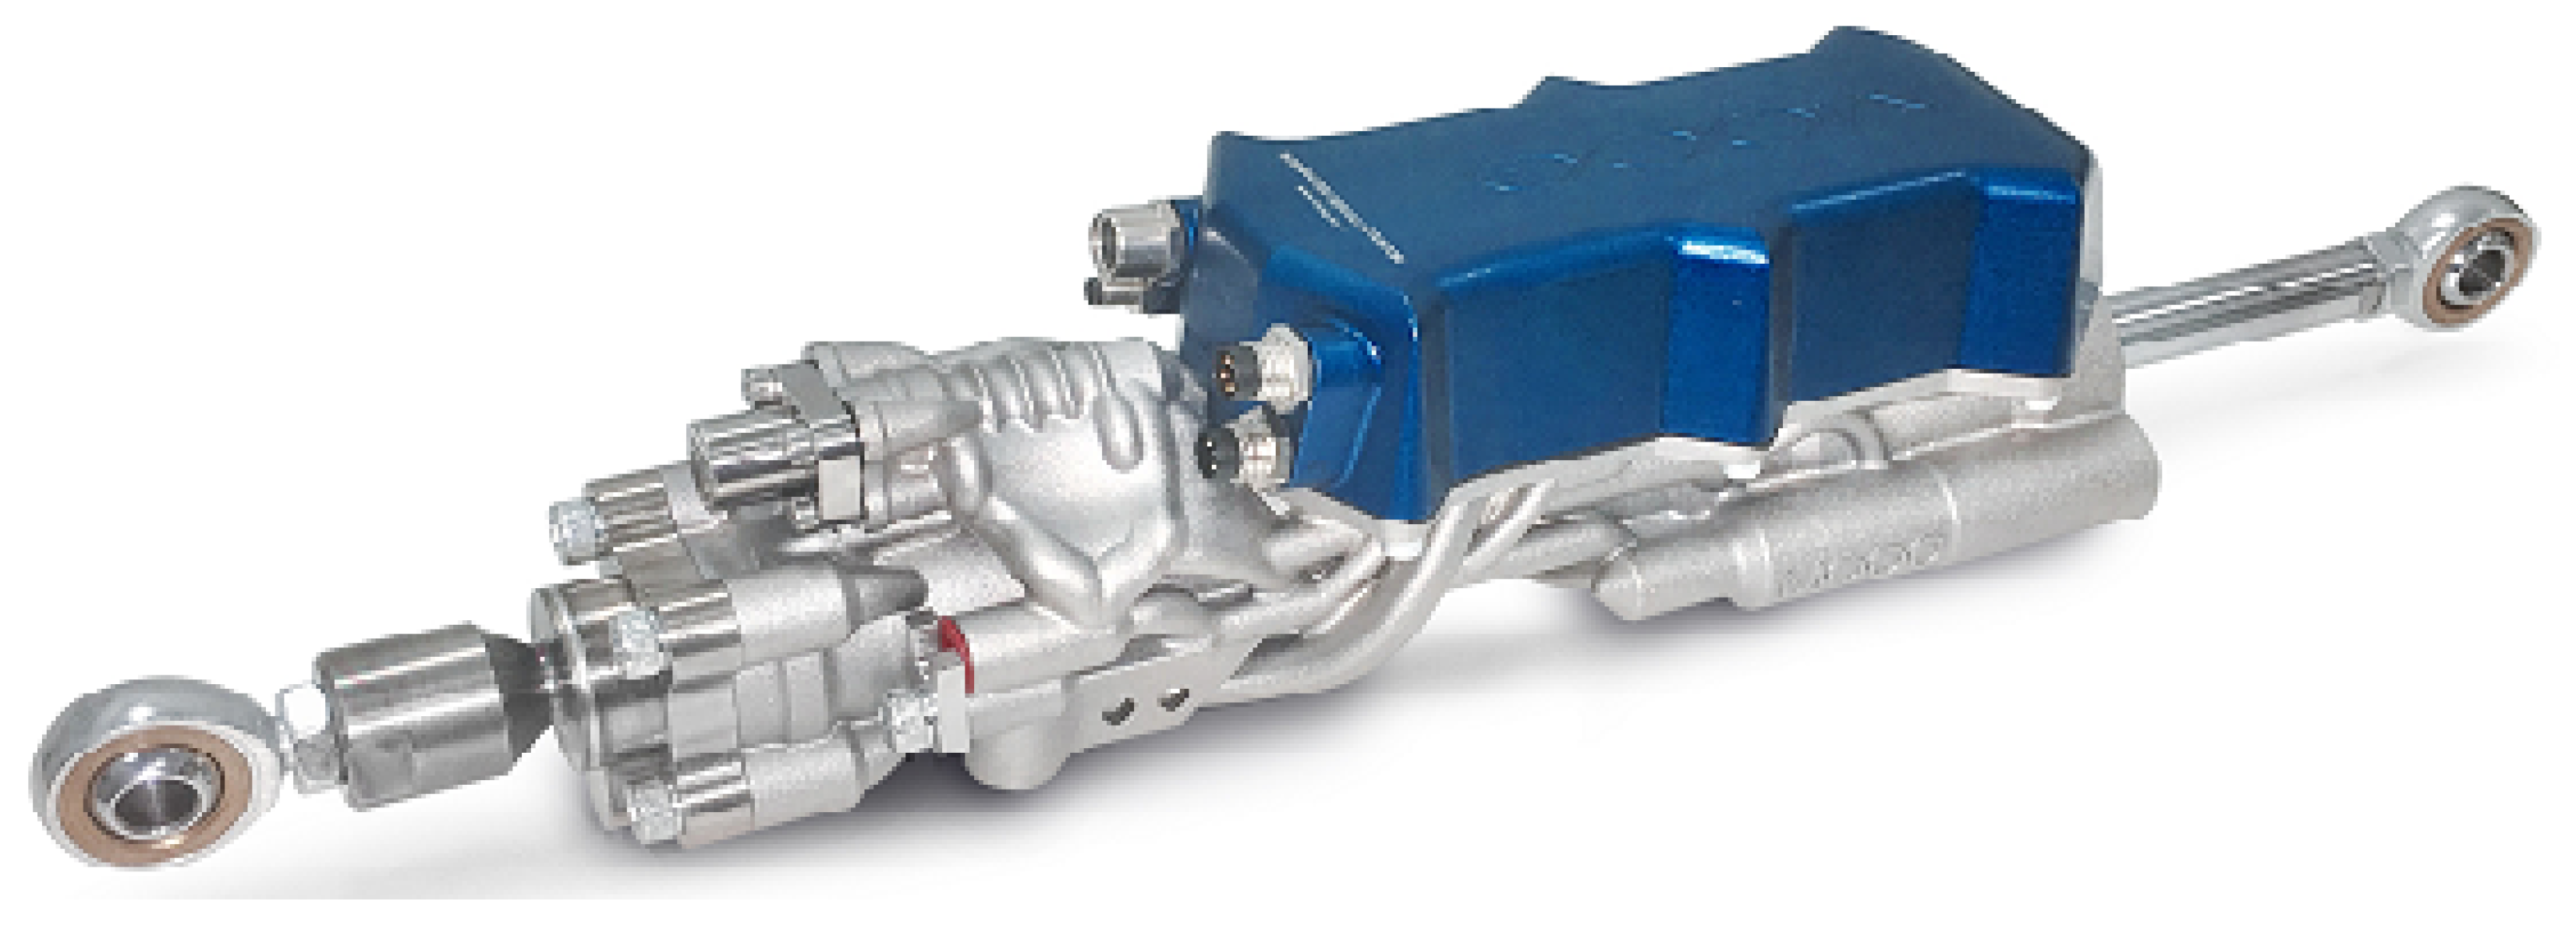
The Integrated Smart Actuator (ISA), developed by Moog [
9] and shown in
Figure 1, is a single actuation component consisting of a servovalve, actuator, sensors and control electronics in an additively manufactured titanium body. It is specifically designed for mobile robotics, with a compact and lightweight design for easy mechanical integration into a system. It also aims to address energy losses with a low-leakage nozzle-flapper pilot stage valve design. A detailed description can be found in [
10]. The specifications are presented in
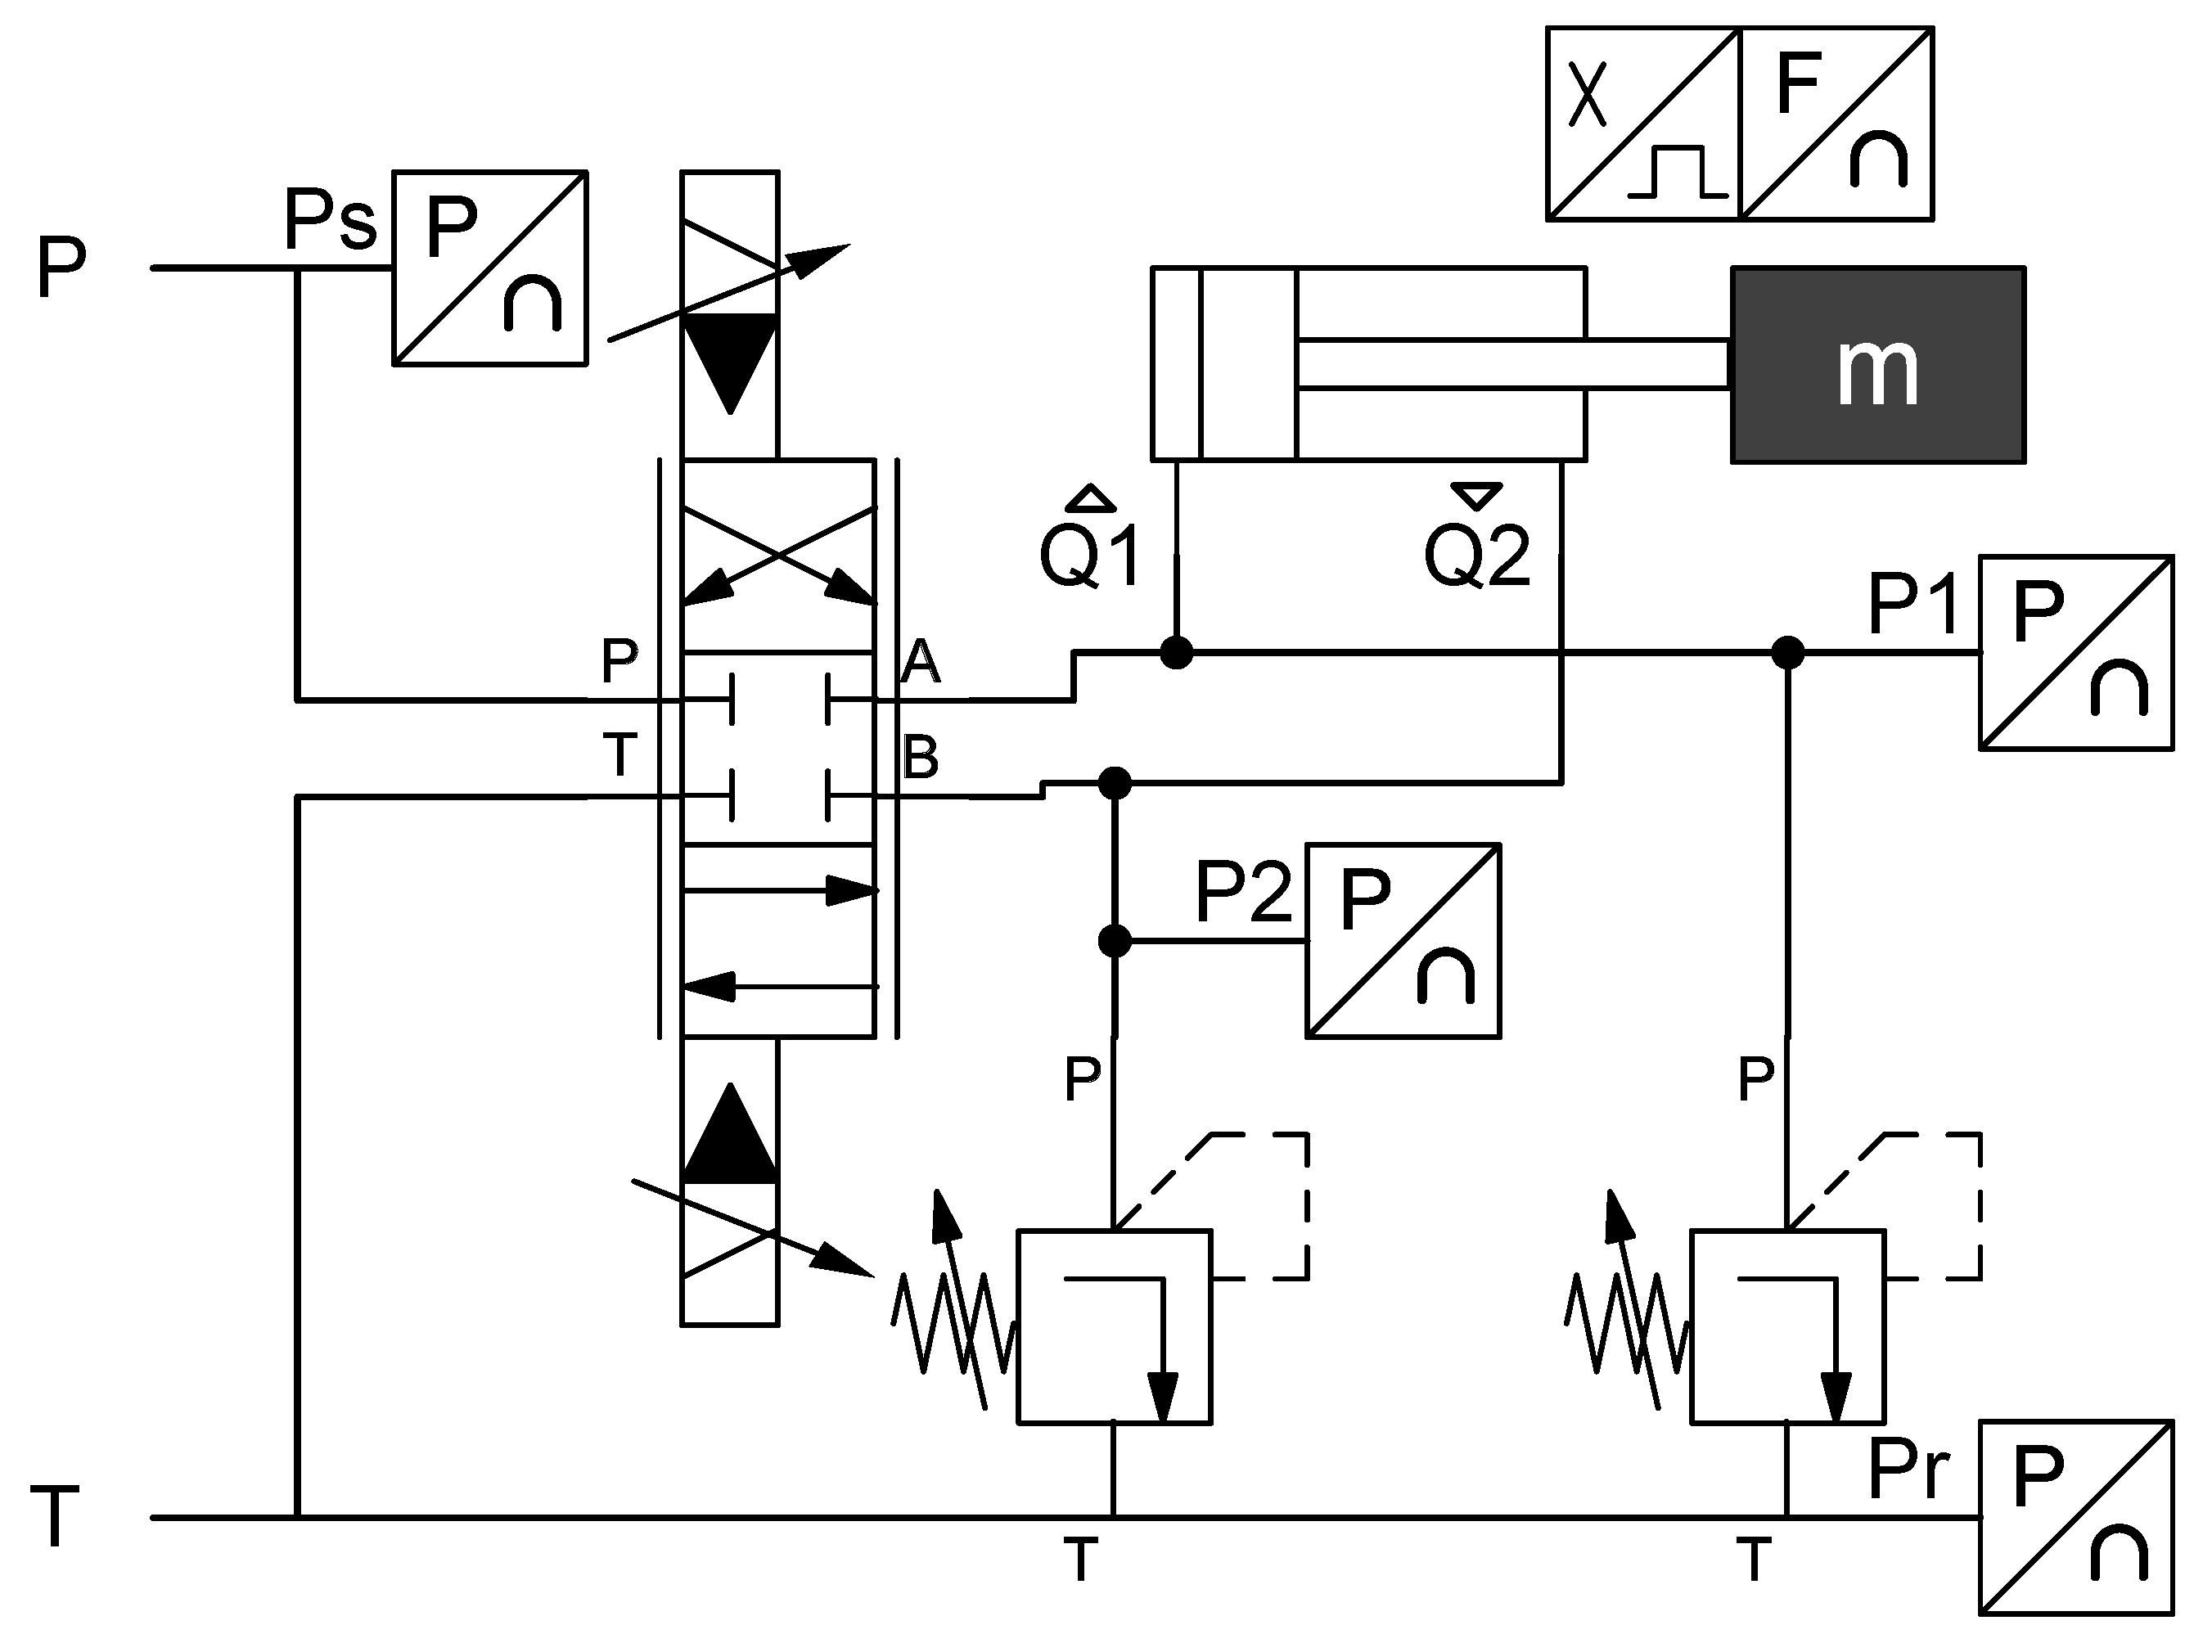
Table 1 and the hydraulic schematic in
Figure 2.
The aim of this work is to develop a control algorithm that can use the known characteristics of the ISA and the integrated sensors (position, force, spool position, torque motor current and supply and return and chamber pressures) to deal with the unknown or uncertain parts of the system, like the load it is attached to. With a suitable controller, the ISA could be a ‘plug-and-play’ device that requires minimal tuning to set up within a system.
The control method used in this work is based on sliding mode control, which has been applied a number of times to electro-hydraulic servos. The key differentiator is the method of dealing with the chattering effect caused by unmodelled delays and discrete sampling. Ghazali et al. [
11] used a hyperbolic tangent sigmoid function for the boundary layer. The approach in [
12] switched between two fixed magnitude boundary layers, depending on the absolute value of the tracking error, and it was able to both improve tracking and reduce chattering compared with a conventional SMC. More advanced approaches include using a time-varying gain combined with either a fixed [
13] or varying boundary layer [
14]. Gdoura et al. [
15] used an adaptive surface and an adaptive gain. Fung [
16] proposed a two-phase controller to improve the transient reaching phase when the system is approaching the sliding surface which, combined with a boundary layer, was able to remove chatter. Feng et al. [
17] added disturbance and model uncertainty compensation using an adaptive radial basis function-based neural network, which was demonstrated to outperform both PID and conventional sliding mode control in tracking and disturbance rejection on an excavator.
In other applications of sliding mode control to hydraulic actuators, the authors of [
18] demonstrated insensitivity to a load disturbance force for a slow-moving system. In [
19], an SMC was applied to a hydraulic press test bed, but the focus was on demand input shaping to reduce vibration rather than investigating robustness. An SMC was demonstrated for hydraulic actuators in a robot leg in [
20], showing acceptable performance across both stance and swing phases.
Other methods applied to electro-hydraulic actuators to deal with parametric uncertainty include gain scheduling [
21], H-Infinity [
22] and combining adaptive control with pole placement [
23] and backstepping [
24,
25].
A common challenge when implementing these methods is tuning the control parameters, which can be numerous and unintuitive. The approach in this work aims to keep control parameters to a minimum, with a simple tuning process to deliver robust motion control performance.
2. System Modelling
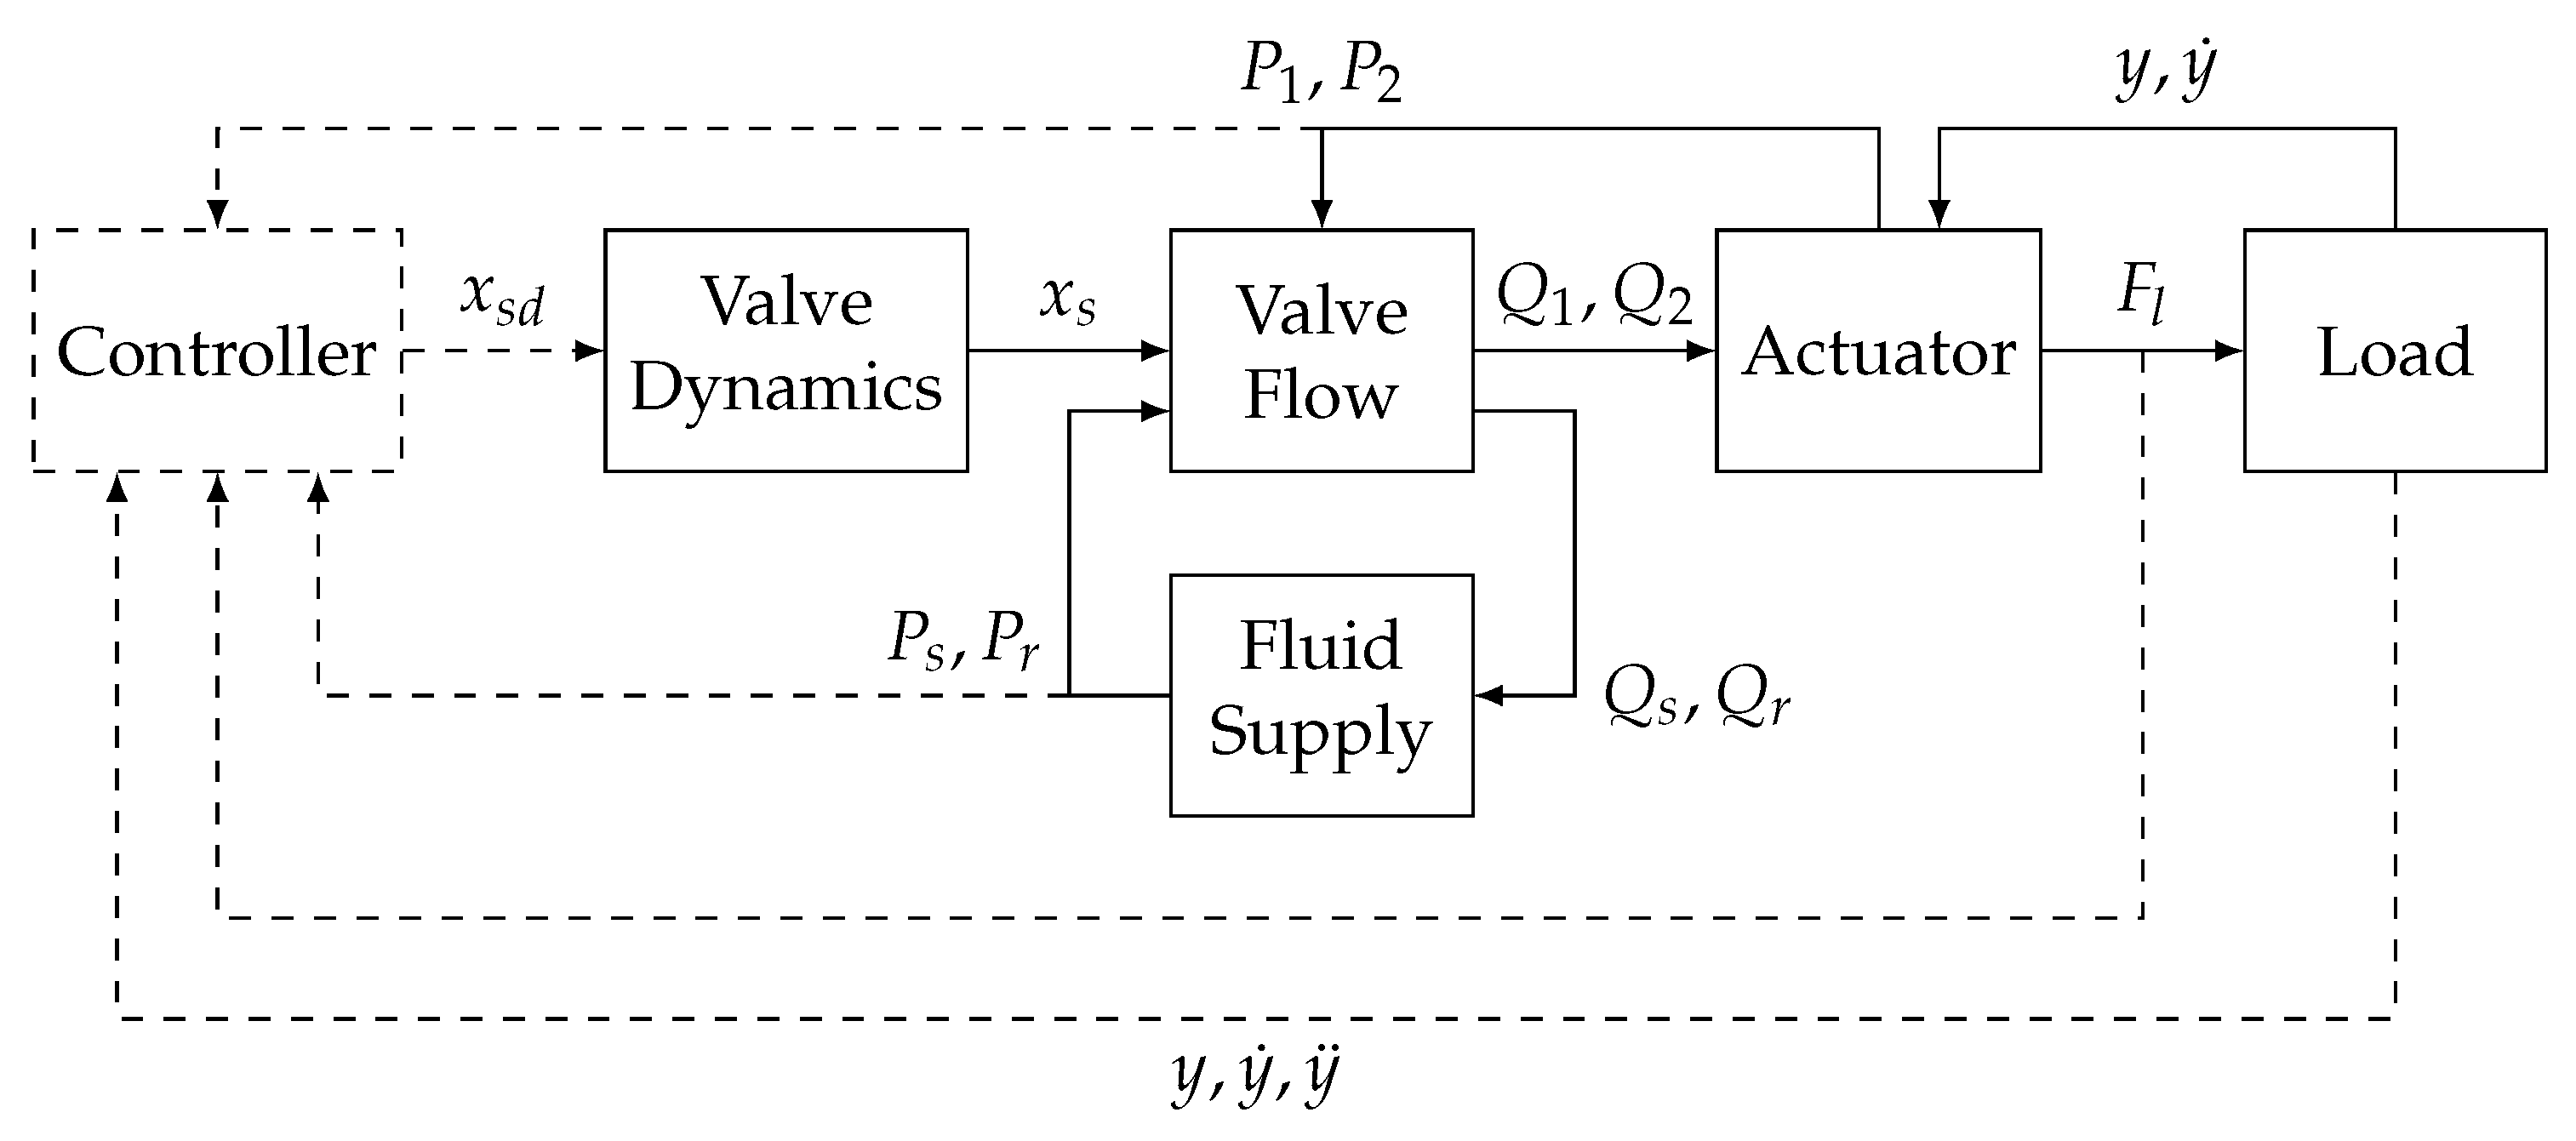
A summary of the system modelling is presented here. For a more detailed discussion, see [
26]. An overview of each component of the model and the interaction between them is shown in
Figure 3.
2.1. Servovalve
The servovalve dynamic model maps the spool position demand
to the spool position
. A second-order transfer function with a rate limit
to represent saturation of the torque motor current and a time delay
to encompass unmodelled torque motor dynamics is used. The model is shown in Equation (
1), where
is the natural frequency and
is the damping ratio:
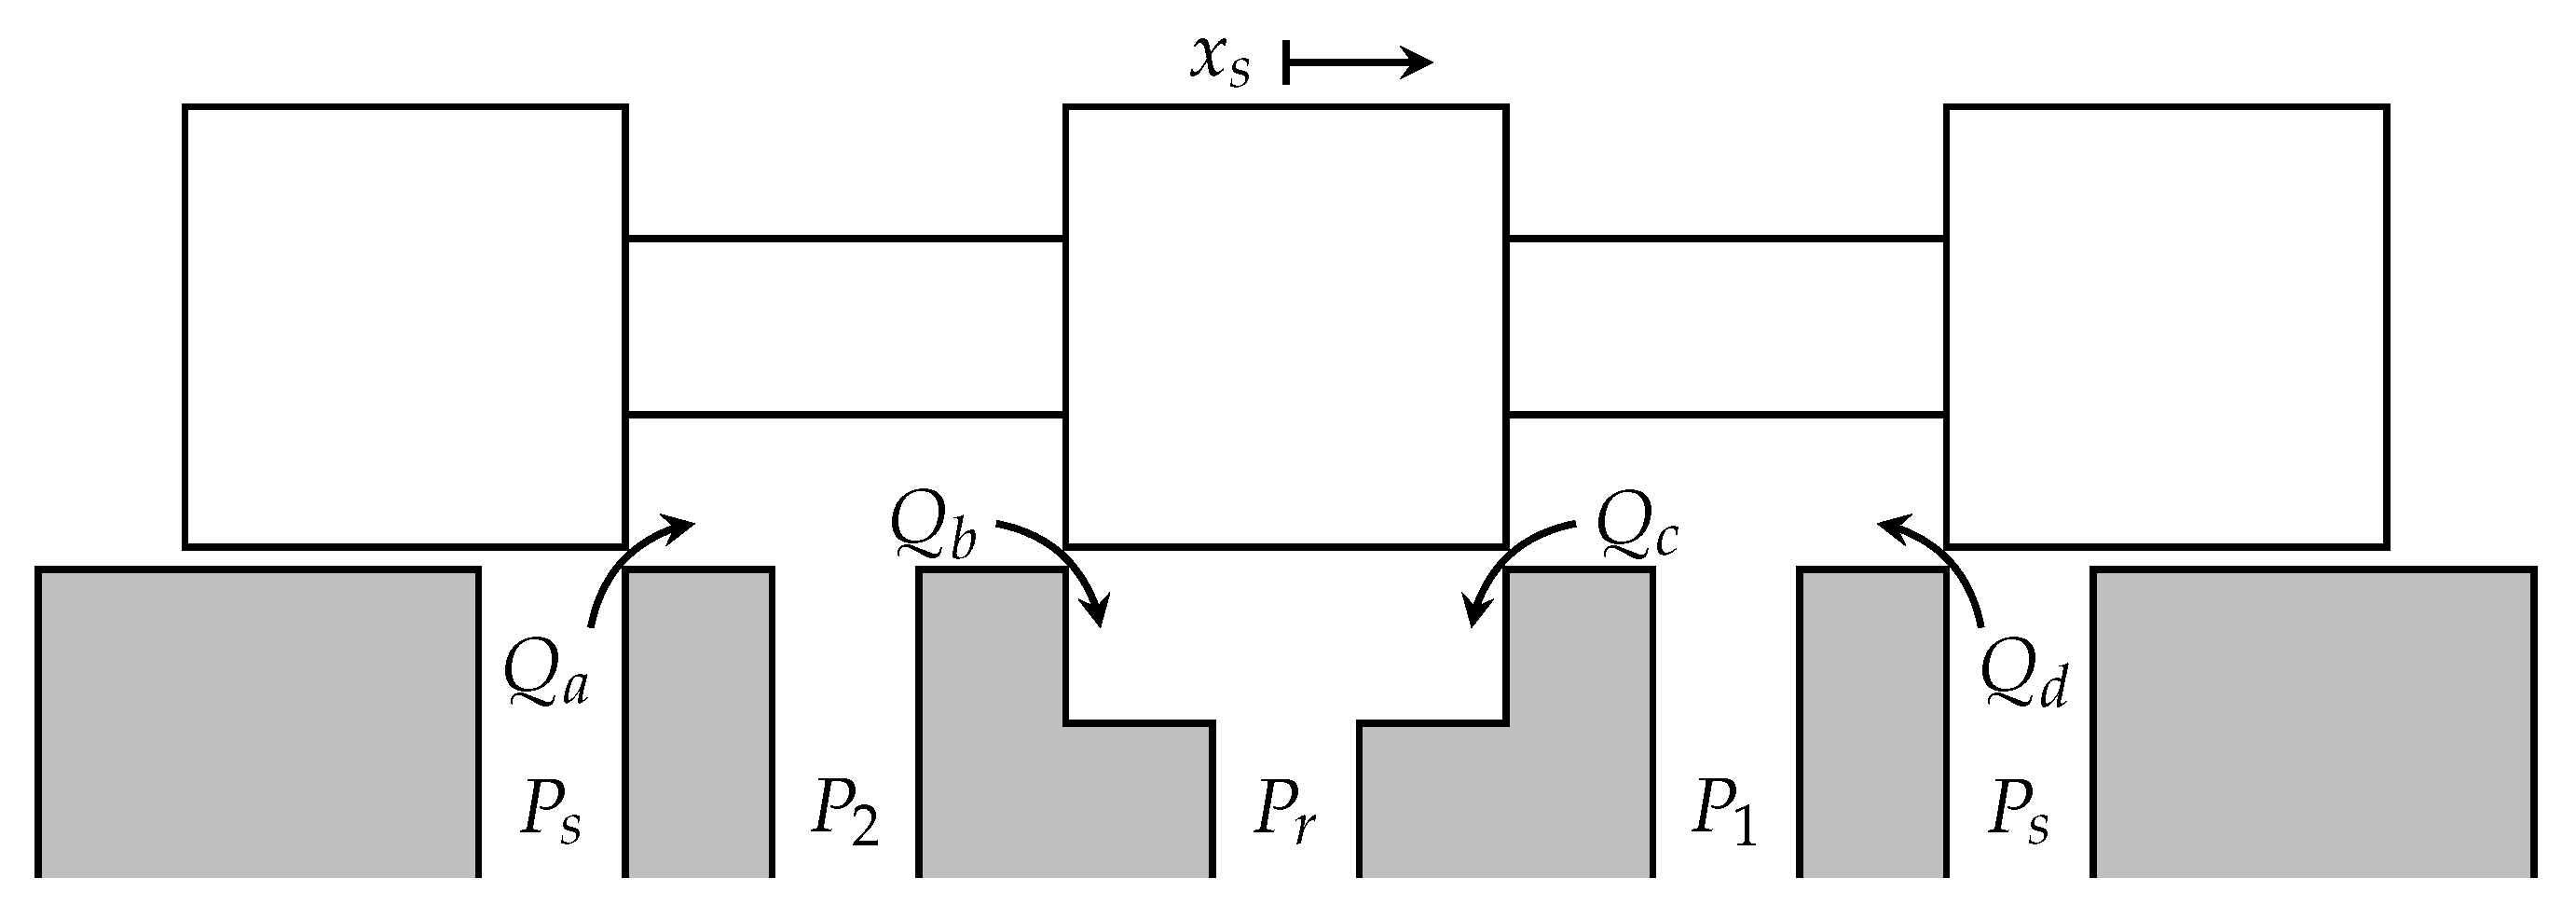
The servovalve spool is cut such that for a given spool displacement from the centre position, the velocity of the piston in each direction matches, as opposed to the typical configuration of the same area for each land. Each land also has a 2.5 times larger cross-section after 25% spool displacement and an overlap at the centre. Due to the asymmetric nature of the lands and some slight differences during manufacturing, each land is modelled individually based on experimental data, with the land area split into three piece-wise equations, as shown for land
d in Equation (
2). A diagram of the spool pressure ports and flows is shown in
Figure 4. Each flow
corresponds to the land area
.
The piece-wise model consists of three regions split at spool breakpoints
and
. These are (1) the leakage region where the land is effectively closed, but some leakage occurs (Equation (
2a)), modelled as an exponential characterised by
and
k; (2) the linear region where the area increases linearly with the spool position, proportional to
(Equation (
2b)) and offset by
to account for leakage; and (3) the saturation region where the area increases linearly but the flow tapers off due to pressure drops in the valve body (Equation (
2c)). The body saturation losses are modelled as a fixed orifice
in series with the linearly varying area
.
With equivalent models for each land area, the flow across each of the lands for a given pressure drop, and therefore the flows in the actuator chambers
and
, are therefore
where
is the pressure drop,
is the effective area across land
x and
is the flow constant given by
where
C is the orifice coefficient and
is the fluid density.
2.2. Actuator and Load
The equations relating the pressures
and
to the flows to and from the actuator and its motion are shown in Equation (
5):
where
and
are the chamber areas and volumes, respectively,
y is the piston position and
is the effective fluid bulk modulus.
The friction acting between the piston and the actuator body is modelled as Stribeck friction, as shown in Equation (
6), where
is the viscous coefficient,
is the Coulomb friction,
is the static friction and
is the exponential coefficient. The equation of motion of the piston and load is then given by Equation (
7), where
m is the combined mass of the piston and the load and
is the disturbance force:
2.3. Full Model
The state space model representing the full system is shown in Equation (
8), where the states
and the control input
:
where
3. Control Law Derivation
3.1. Controller Model
The proposed control method uses a sliding mode controller (SMC) with a varying boundary layer [
27]. The controller is designed using a simplified model of the system that assumes the servovalve dynamics are significantly faster than the rest of the system and thus can be ignored, and the input to the system becomes
. The system states are
:
where
For the design of the sliding mode controller, it is required that the system model is input-affine, i.e., the input is linear. This requires changing it from the current form of to , where is the new linear control term.
This implies that
and therefore
The
and
terms are assumed to be uncertain but with known error bounds, with the estimates of each being
and
, respectively. The error associated with the actuator velocity feedback term
is additive and bounded by G (Equation (
14)). The error associated with the control gain
is multiplicative and bounded by B (Equation (
15)).
represents the combined friction and force disturbance, with a derivative bounded by
F, as per Equation (
16):
3.2. Derivation
The following derivation of the sliding mode controller is based on [
27,
28].
The position demand is
, and the tracking error
e is given by
The sliding surface
s represents the desired error dynamics of the system, chosen with critically damped poles:
where
defines the location of the poles.
For the system to achieve the desired asymptotic error dynamics behaviour, it needs to remain on the surface s. The control objective transforms into a stabilisation of s.
The first step in approaching this stabilisation problem is to construct a Lyapunov function
V of
s that is positive for all
, in which
and choose a control law that ensures that the time derivative of the Lyapunov function is always negative:
where
is a positive constant.
The control law that satisfies this will always drive the system towards .
From Equations (
18) and (
19), the derivative of
V is given by
Substituting in
from Equation (
10) yields
The control law for
u contains an estimate of the control signal required to achieve
,
and a robust switching component
:
, also known as the equivalent control, is given by
To satisfy the condition in Equation (
22), the gain
K needs to be chosen by considering the uncertainties presented in Equations (
14) and (
15).
Substituting in the control law from Equation (
23) into Equation (
22) leads to
It can be shown that ([
26])
The above states a clear requirement for stability of the system in terms of the bounded modelling uncertainties and external disturbances.
3.3. Varying Boundary Layer
The chattering effect of the standard sliding mode controller caused by the switching control signal is often countered by using a boundary layer. The proposed controller uses a varying boundary layer such that the switching part of the control law becomes
where
is the boundary layer thickness. The saturation function is defined as follows:
The varying boundary layer can take advantage of situations with reduced uncertainty whilst maintaining stability guarantees. The stability condition from Equation (
20) is adjusted such that the distance to the boundary layer always decreases when
s is outside:
This change to the stability criterion requires modification of the switching gain
. According to Equation (
30), the new gain
must satisfy
The boundary layer dynamics are set to match those of
such that no further parameters are required for tuning. It can be shown [
27] that with these constraints, the switching gain
is
and the evolution on the boundary layer
is given by
3.4. Linearising the Control Gain
The control law presented in Equation (
33) is based on the assumption that
and therefore
are independent of
u. In Equation (
13), this can be seen to be false.
In (
33), the control law can be rearranged as follows:
where
,
and
s can all be calculated without knowledge of the control input estimate
. Therefore, it is required to find the inverse of
for a value of
u that satisfies (
34). Thus,
is equal to
which, for a particular piston position and system pressures across each land (land pressure drops), varies nonlinearly with
u.
In order to cancel
u from Equation (
35), the land area equations are estimated with a piecewise linear model, which gives six linear regions for
:
The gradients of each region, from
to
, are based on the linearised land areas, the constants in Equation (
35) and the instantaneous pressure and piston position measurements. The breakpoints in the piecewise linear model are zero and from
to
.
The process for calculating u is as follows:
- 1.
Calculate the value of .
- 2.
Calculate the gradients of the piecewise linear model from to .
- 3.
Calculate the value of at each breakpoint from to .
- 4.
Determine the correct region based on the value of X and from to .
- 5.
Calculate
u in this region based on Equation (
36) and
X.
The following is a pseudocode implementation of the algorithm to calculate the control signal
u based on a set of measurements:
| ▹ Calculate the desired value of |
| ▹ Calculate the gradients of |
| ▹ Calculate at the breakpoints |
| | ▹ Find the correct region and assign the value of u |
| if then |
| if then |
| |
| else if then |
| |
| else |
| |
| end if |
| else |
| if then |
| |
| else if then |
| |
| else |
| |
| end if |
| end if |
4. Simulation Results
The model described by the block diagram in
Figure 5 and Equations (
8) and (
9) was implemented in Simulink to test the controller. The controller was compared against a standard high-performance linear control design in both the time and frequency domains and for robustness to parametric uncertainty.
The linear controller was designed around a linearised version of Equation (
10), shown in Equations (
37)–(
39), where
c is the viscous friction coefficient,
and
are the chamber volumes at midstroke and
is the steady state velocity at spool position
. The linear model is based on a spool position below the dual-gain breakpoint, with control outputs greater than the dual-gain breakpoint adjusted before being applied to the plant to compensate for this nonlinearity:
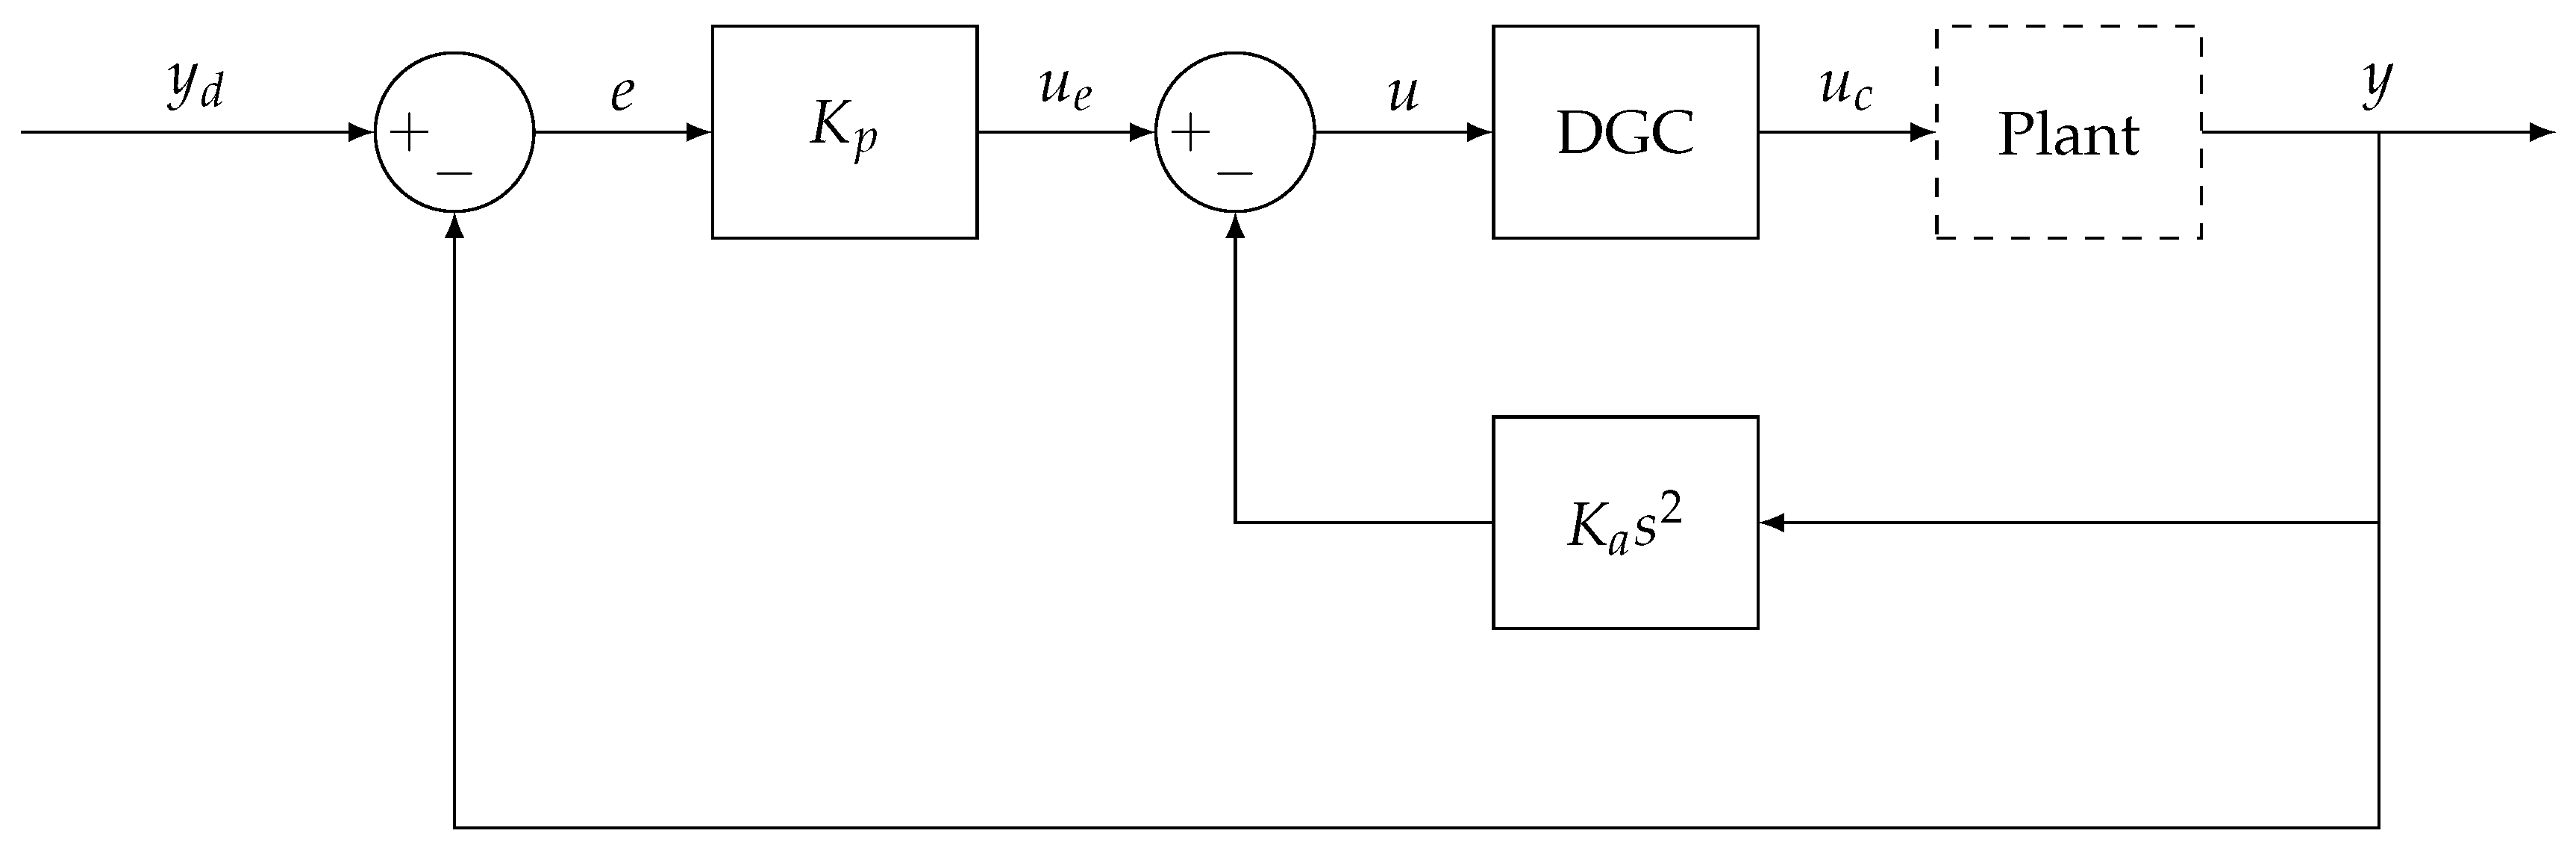
The linear controller consisted of an acceleration feedback term
added to increase the open loop damping to 0.7 and a proportional feedback term
tuned for a phase margin of 60 ° [
4].
4.1. SMC Controller Tuning
The proposed controller has four variable terms that can be tuned to impact the response: the uncertainty terms
B and
G, the error dynamics
and
.
B represents the multiplicative uncertainty in the gain
and is a combination of parametric uncertainties in the bulk modulus, spool area and load mass and the measurement uncertainty in the pressures, as shown in
Table 2. The total uncertainty was 48%, and thus the value of
B was fixed at 1.48.
G represents the uncertainty in the velocity feedback term
, shown in Equation (
40) (neglecting the leakage term). Uncertainty in the load mass and bulk modulus were considered, for a total of 32%. However,
G is an additive error such that it changes with the state
according to Equation (
41):
The
term is combined with the unknown force disturbance
F such that its purpose is to both attract the system to boundary layer when it is outside and compensate for any unmodelled disturbance. It is important that
is not too large; otherwise, the robustness properties of the controller are lost [
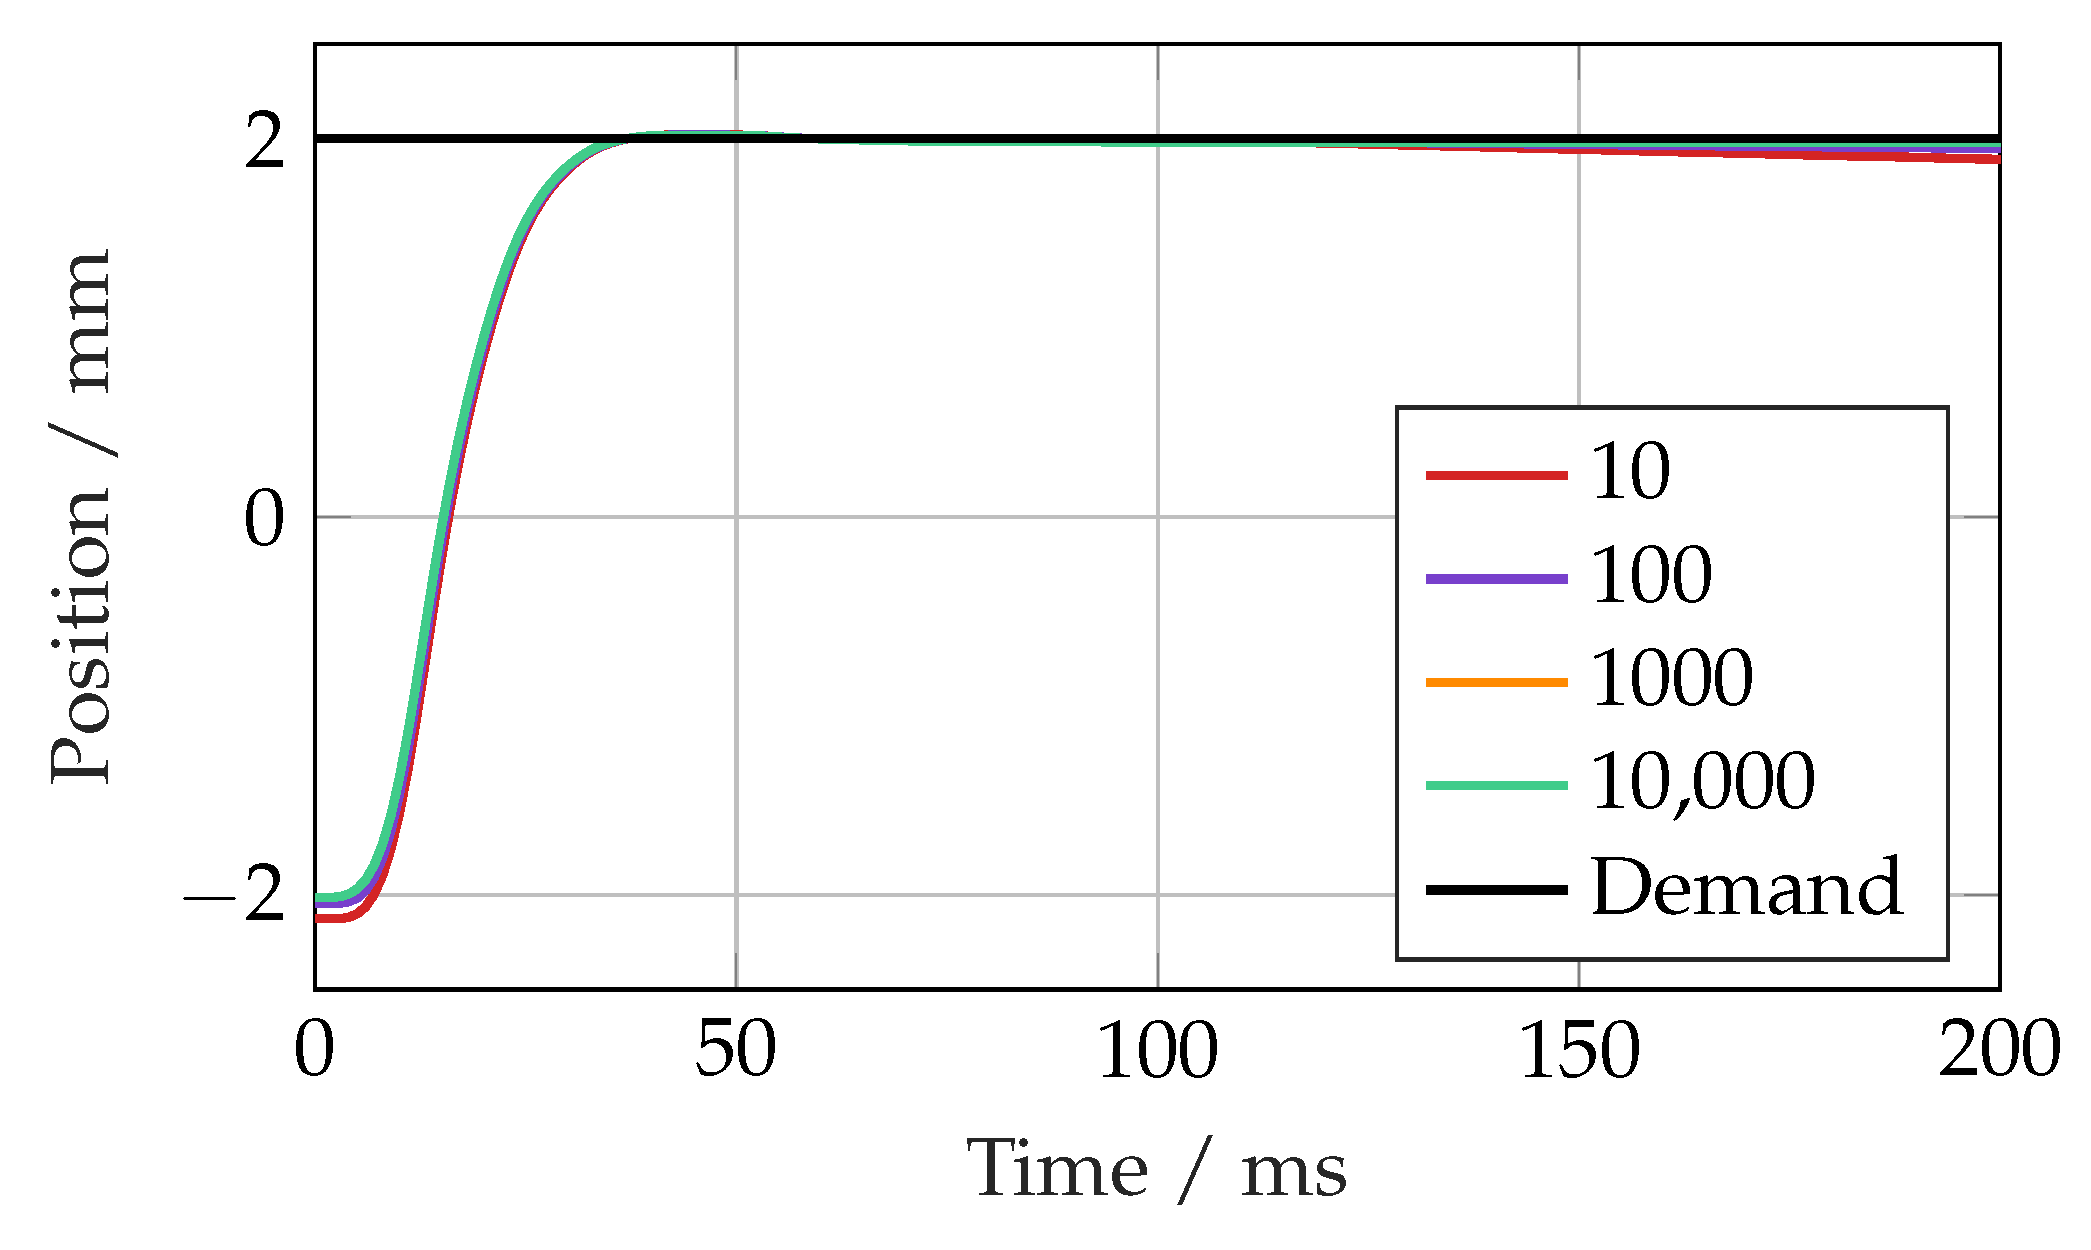
27]. Shown in
Figure 6 is the simulated step response of the system with different order of magnitude values for
. This was found to have a small impact on the response time and steady-state error. A value of
was chosen as larger values had a diminishing impact on the response.
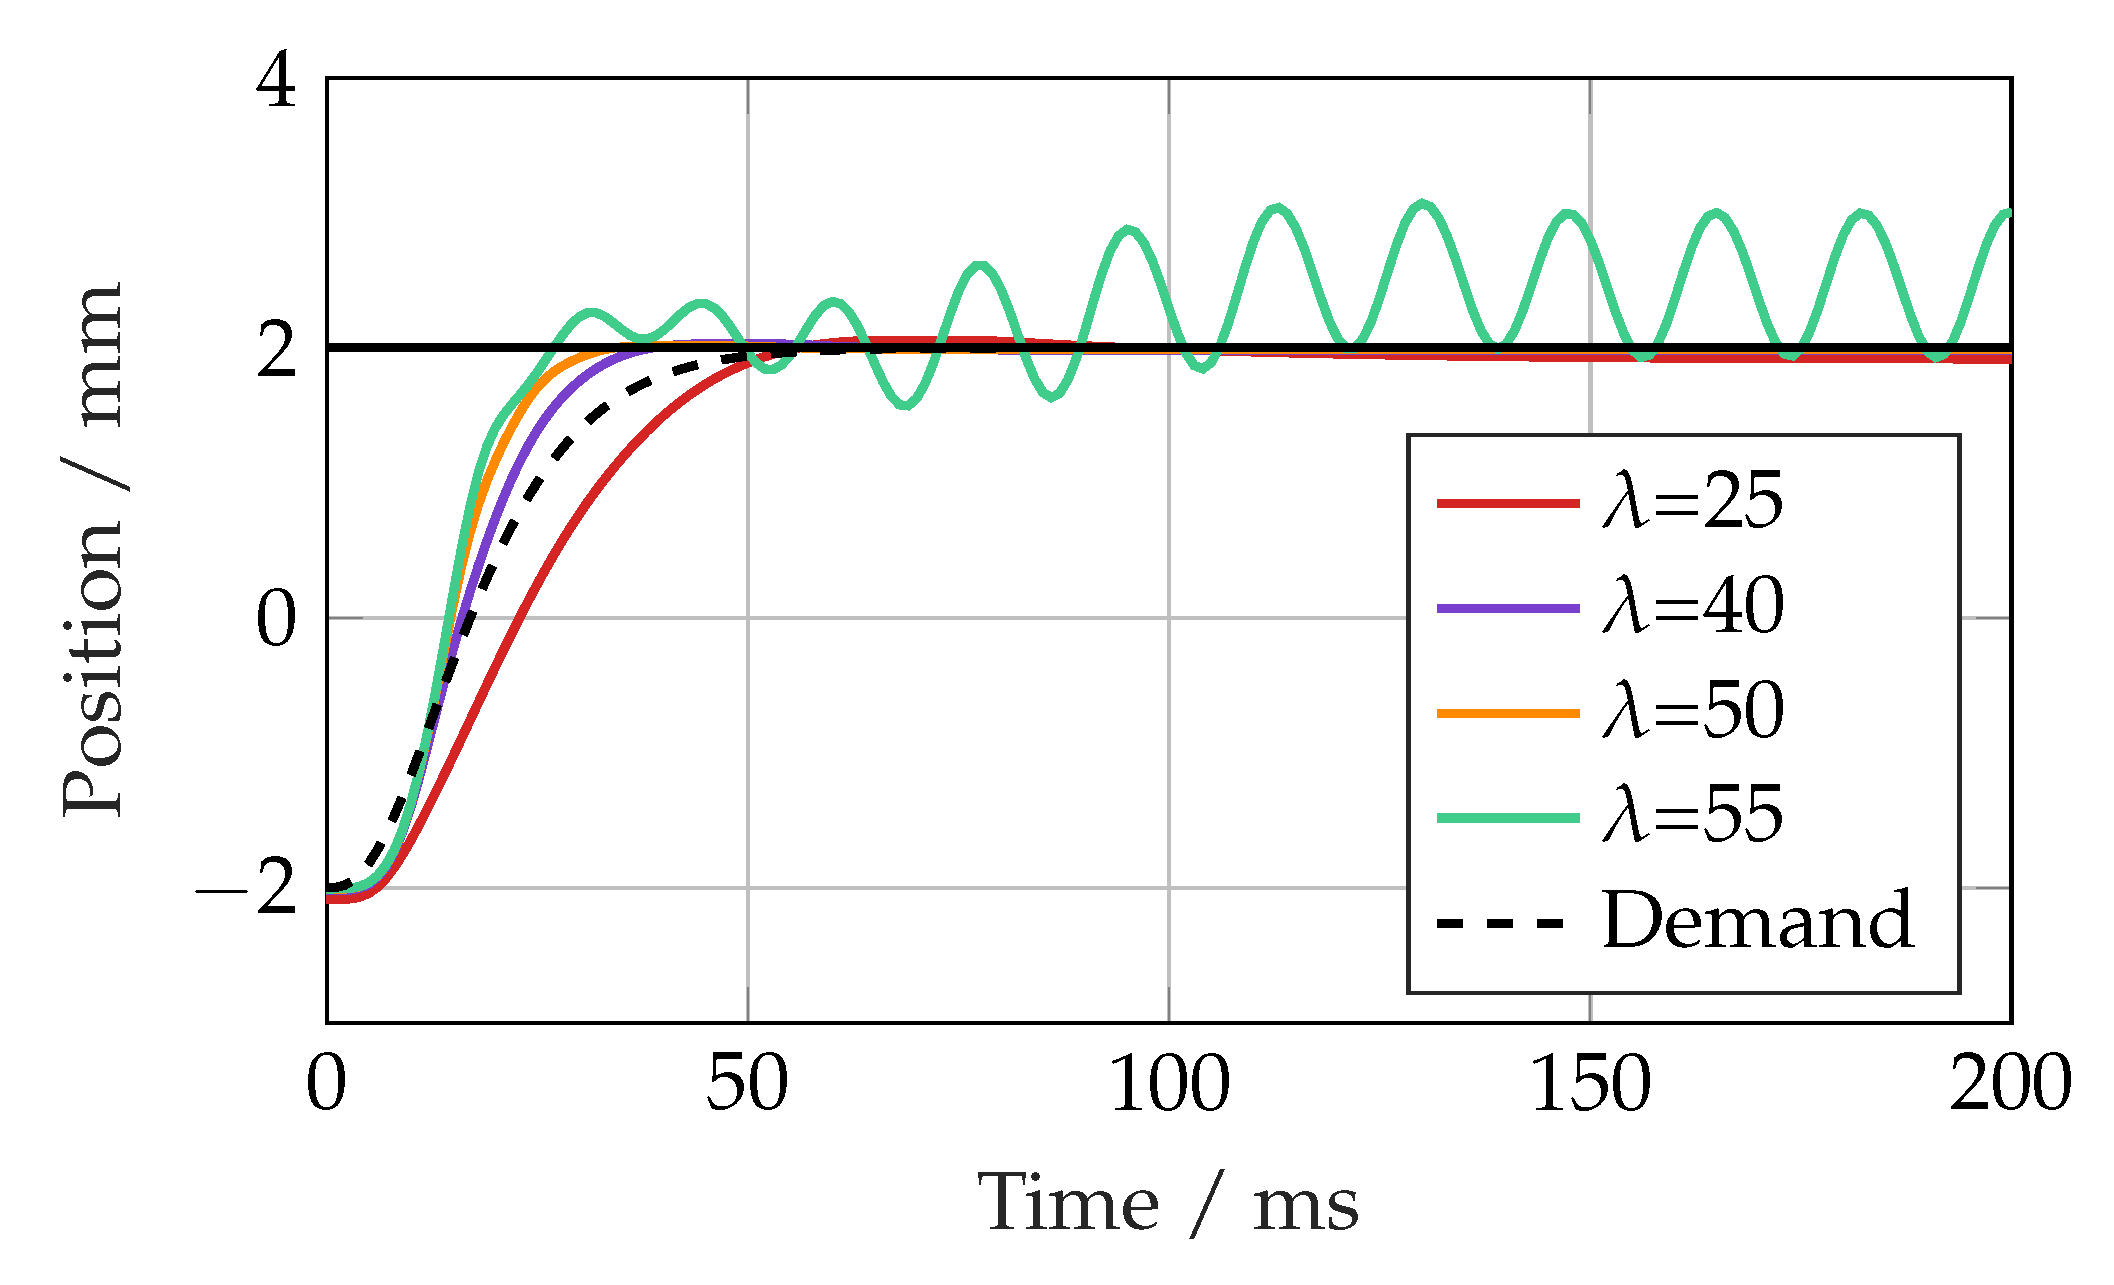
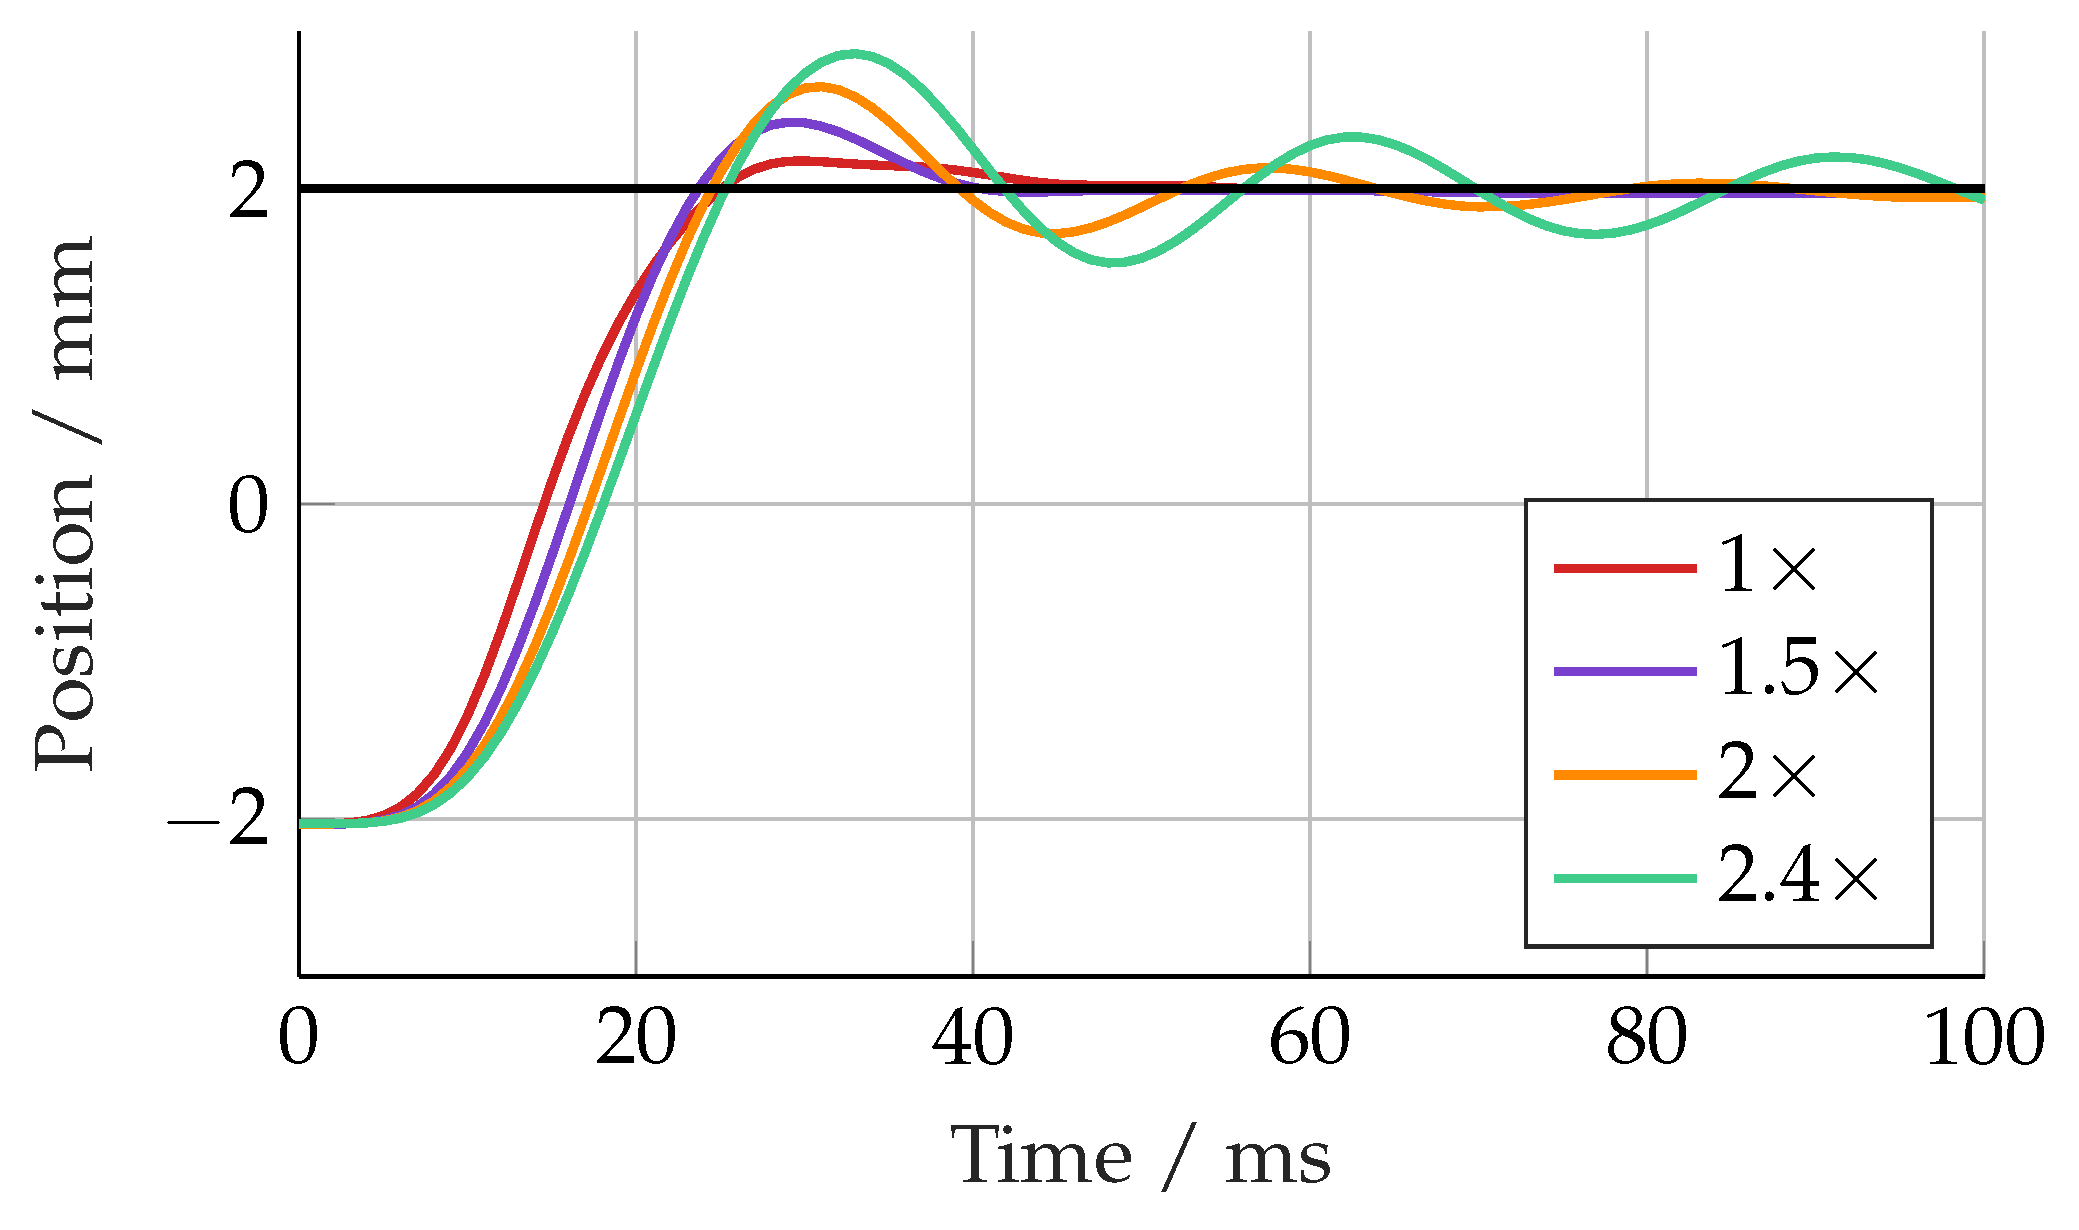
The final parameter is , which has the most significant impact on the control performance as it defines the characteristics of the error dynamics. The main limitations on the selection of are the unmodelled dynamics, time-delays and the sample rate of the controller. The sample-rate in this case was 10 kHz, which was sufficiently fast to have no impact, leaving just the servovalve dynamics as the critical limitation.
Figure 7 shows how the step response changed with
. As would be expected, the response was faster as
increased up to a point at which it became too aggressive. The performance deteriorated between
and
to the point where it was on the limit of stability.
From these results, a value of 45 Hz was chosen for , giving a fast response with no overshoot, and it was also found to work well for the experimental set-up. The response also closely matched that of the linear controller, which allowed comparisons to be made between the robustness of the linear controller and SMC with similar tuning.
4.2. Performance Comparison
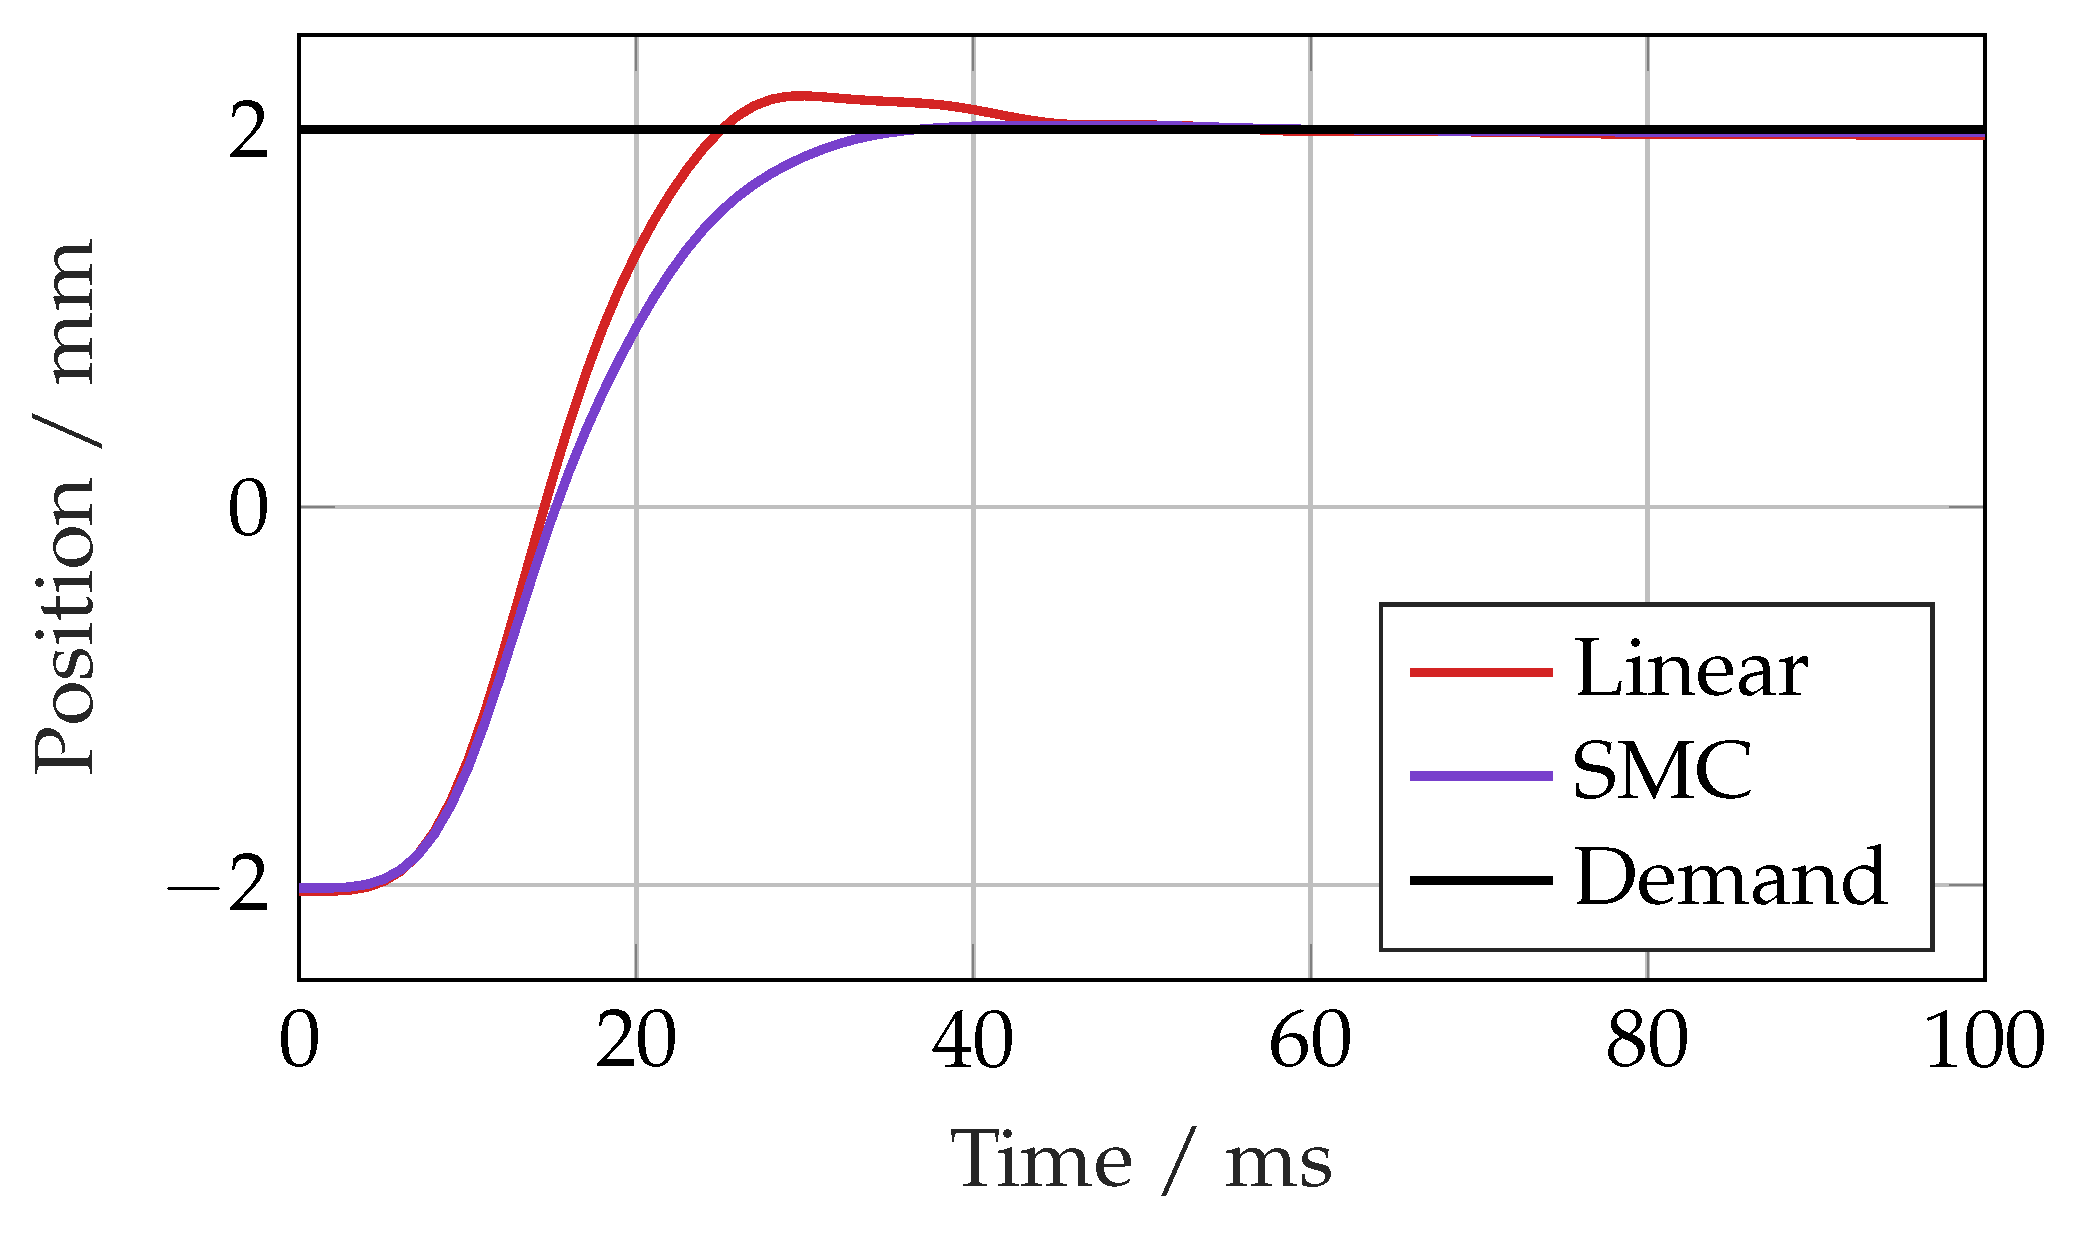
To test the performance of the sliding mode controller, it was compared to the linear controller in both the time and frequency domains. The simulated step response of each controller is shown in
Figure 8. The responses were broadly similar, although the linear controller exhibited a small overshoot due to the tuning method used. The time domain results are summarised in
Table 3.
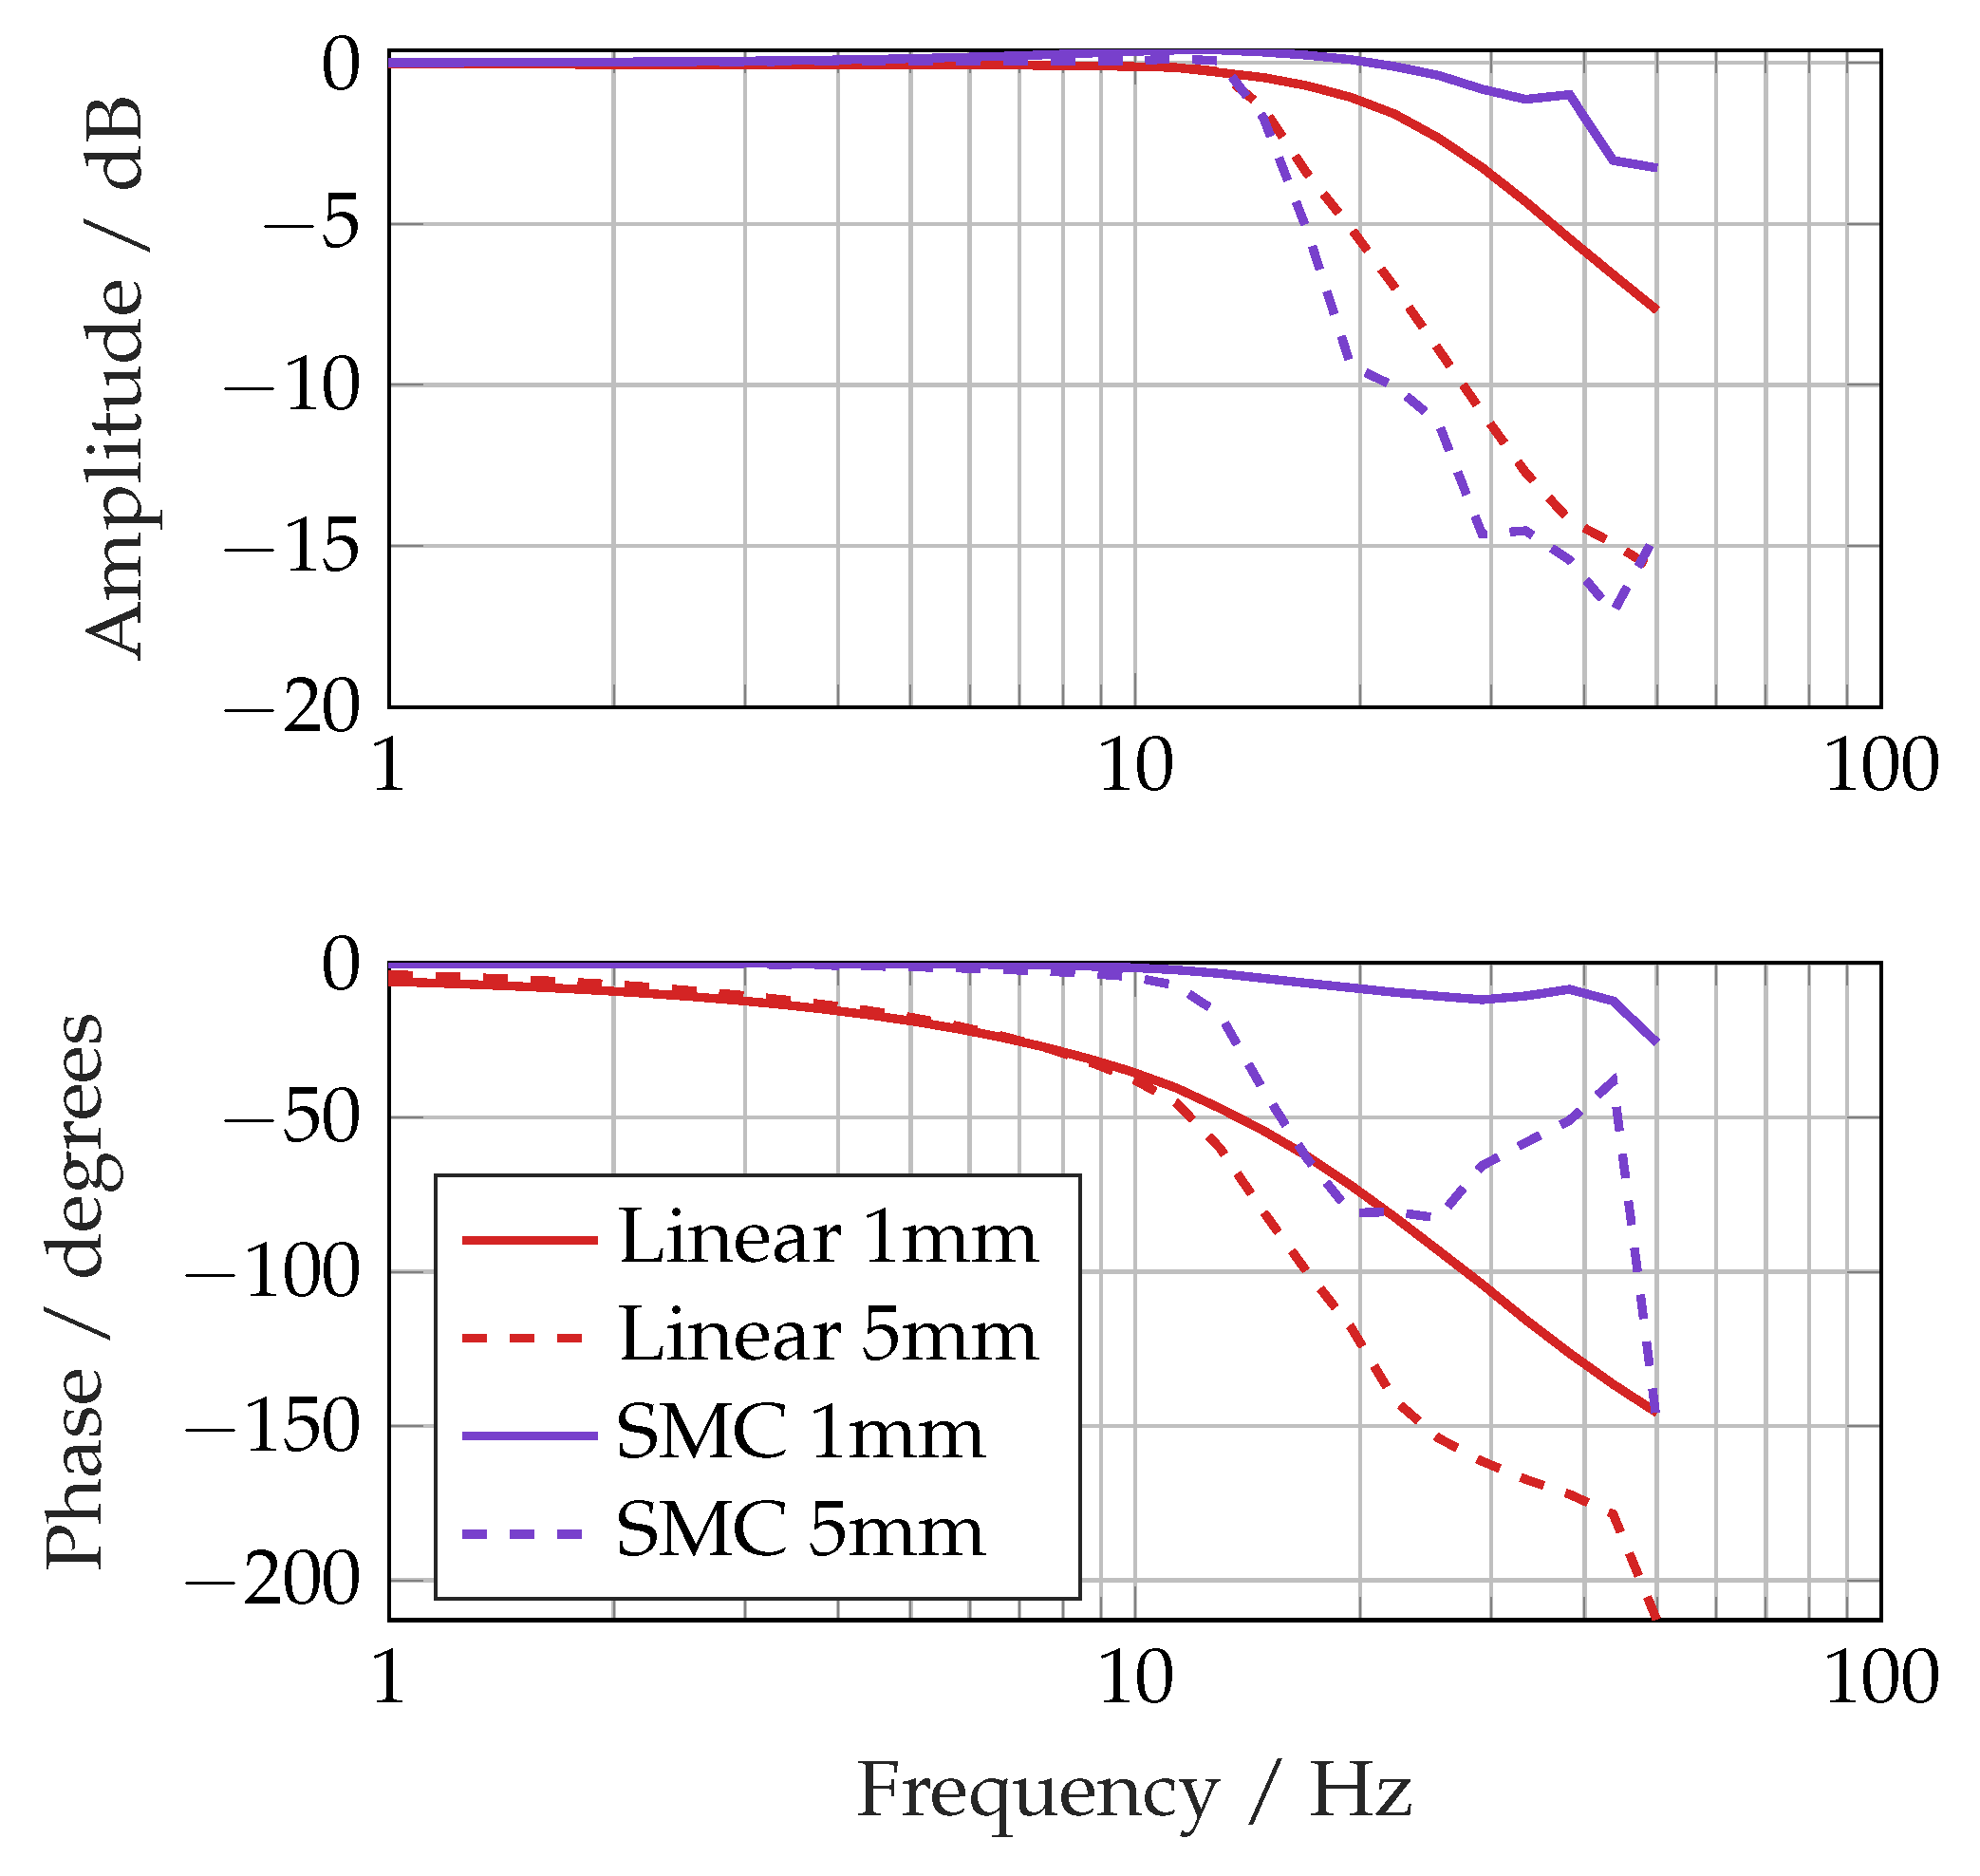
The frequency responses in
Figure 9 demonstrate the performance advantage of the sliding mode controller, which had a bandwidth (−3 dB) of 44 Hz against 28 Hz with a 1 mm demand signal. The phase lag at a 1 mm amplitude was also far better, only reaching 25 ° at 50 Hz compared with 150 ° for the linear controller. The main reason for this is probably the nonlinear model-based feedforward terms in the control signal.
4.3. Robustness Comparison
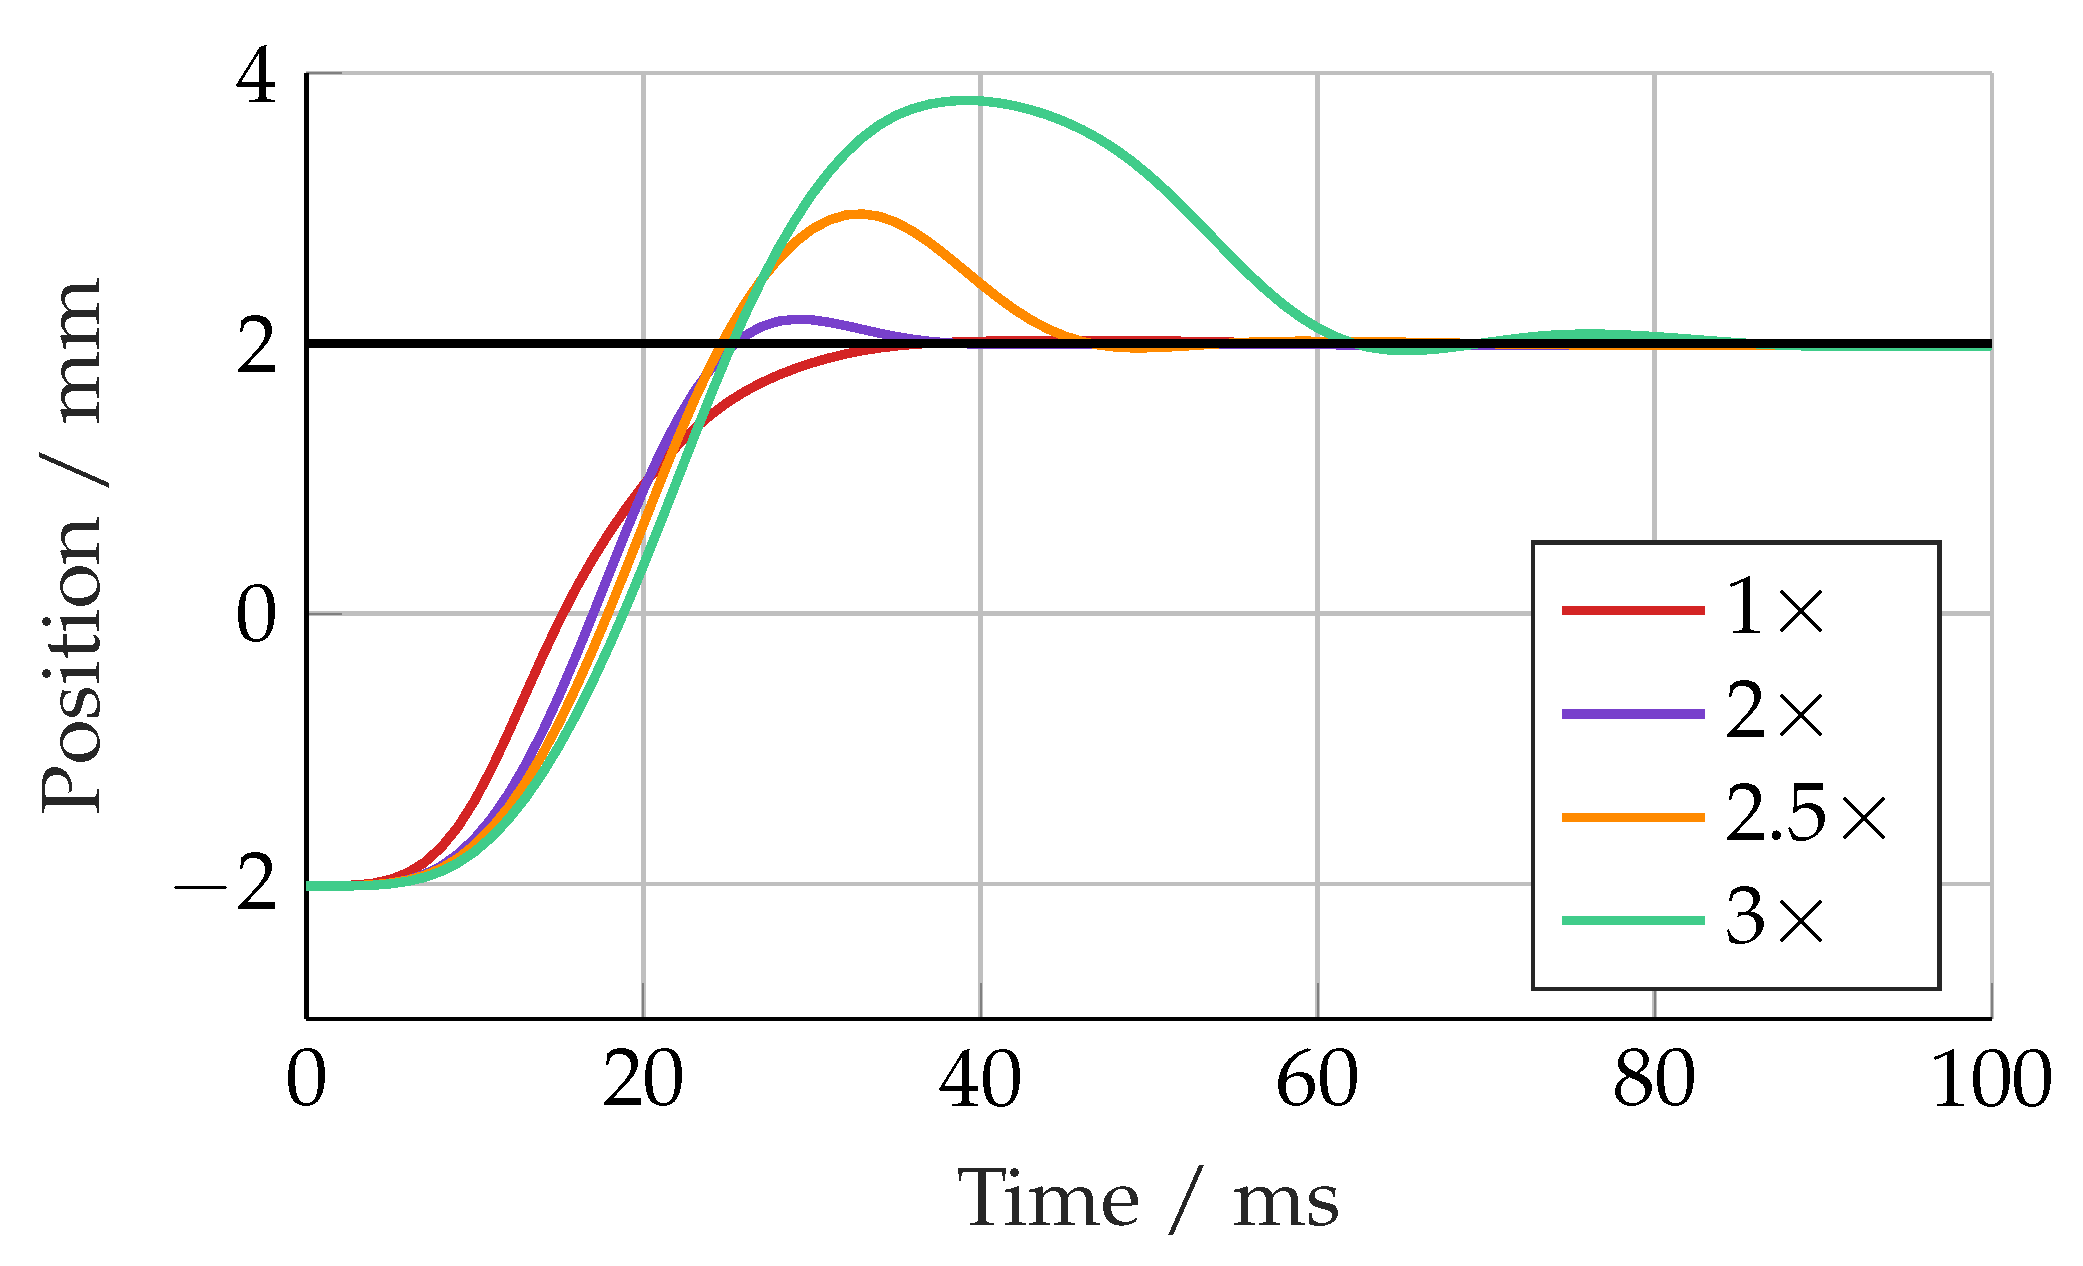
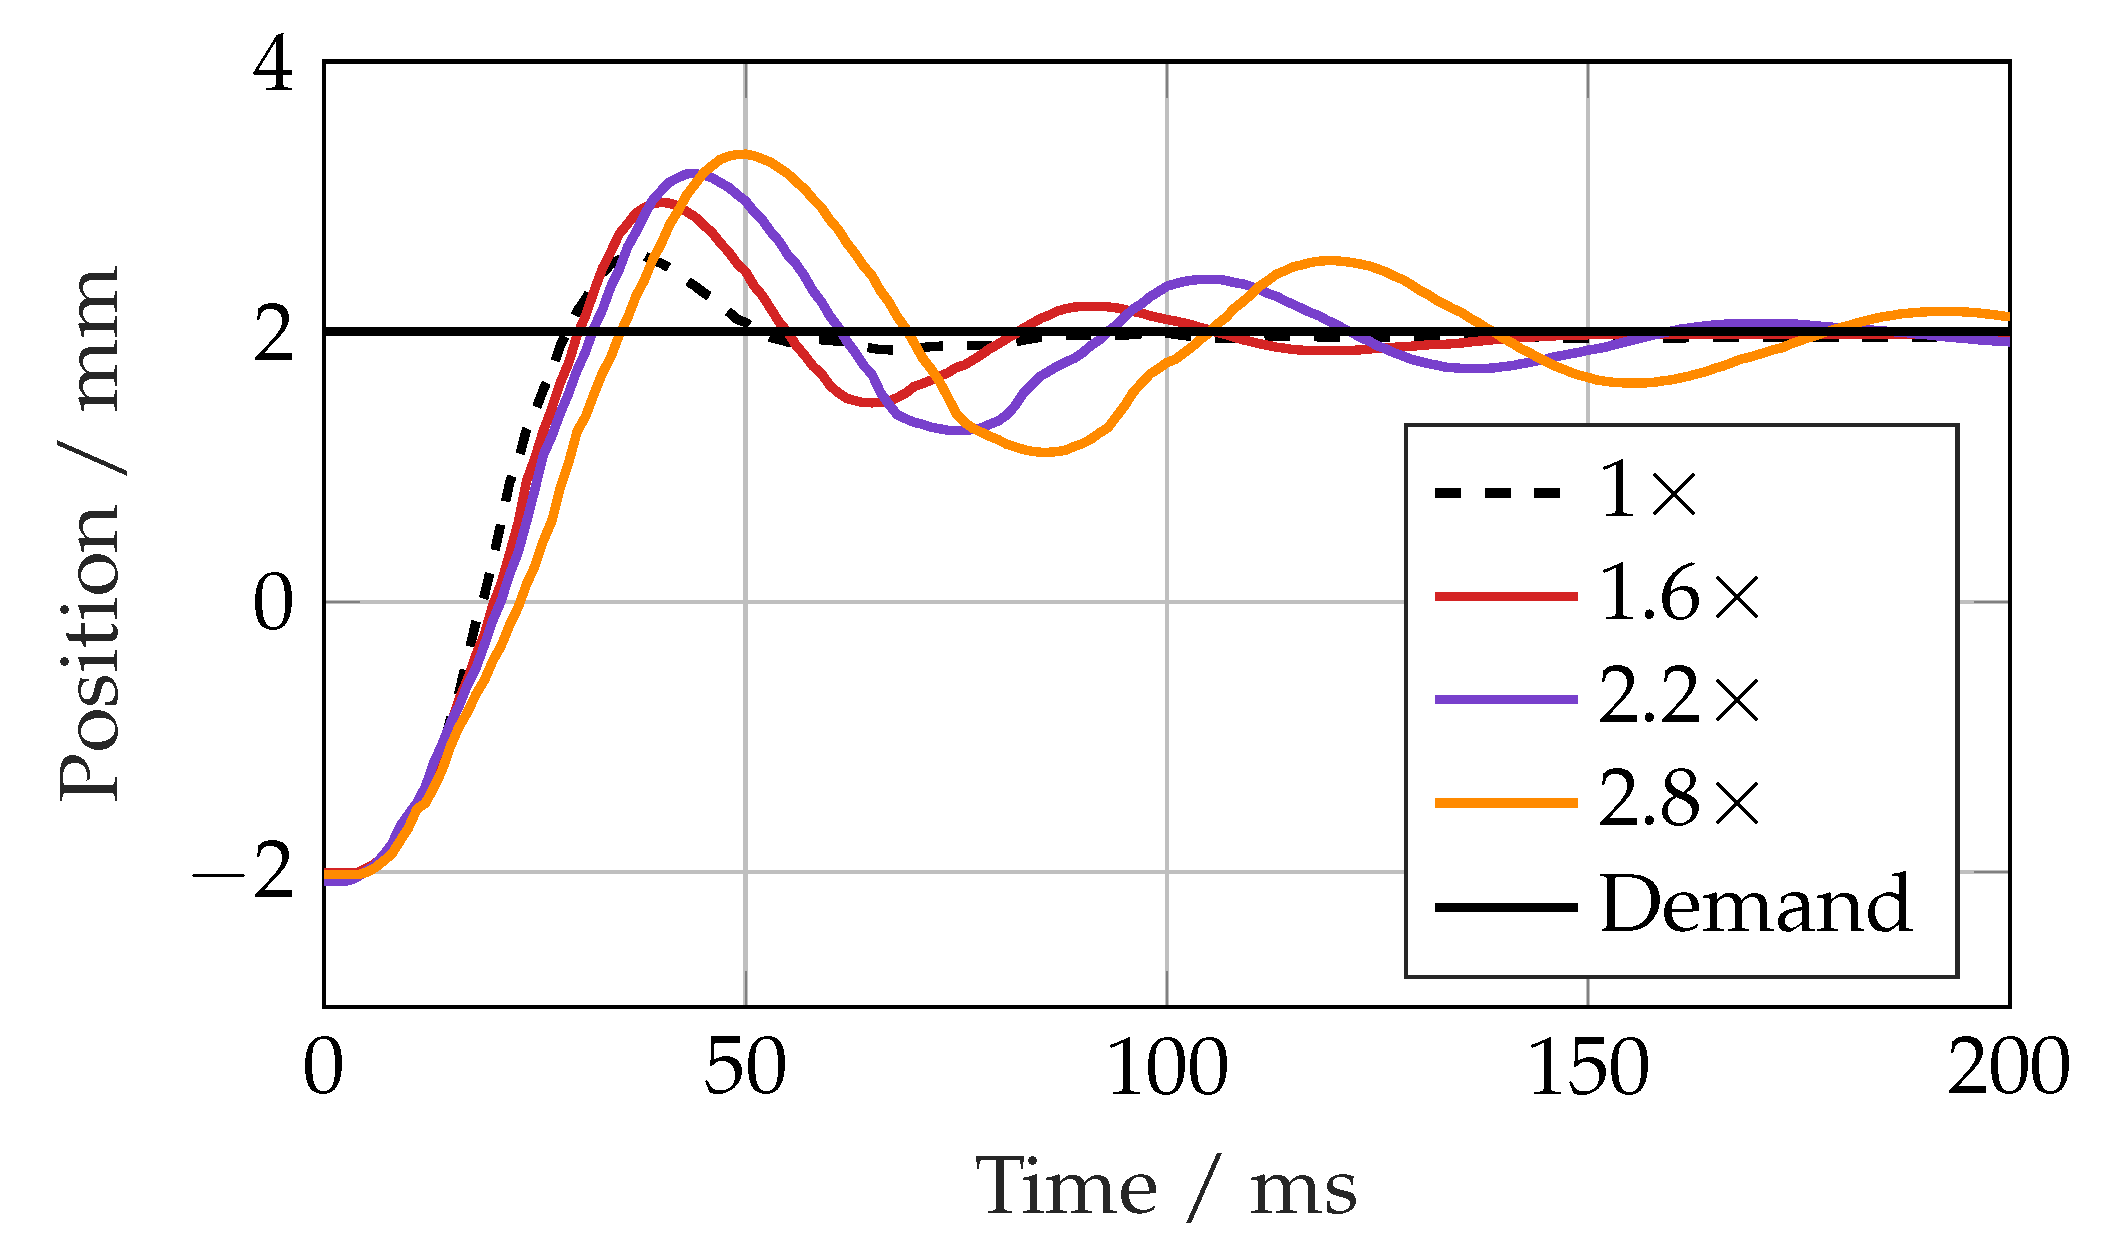
To test the robustness of the controllers, the bulk modulus and load mass were varied from their nominal values used during the control design. The step response of each controller with increasing mass is shown in
Figure 10 and
Figure 11. The linear controller response became more oscillatory with an increasing mass up to 2.5× (192 kg), at which point it became unstable. The SMC response was quite different, with increasing overshoot with an increasing load mass. Up to 3× the nominal load (231 kg), there was no sign of instability, but the overshoot was 1.8 mm, equivalent to 45%.
At smaller masses, both controllers were limited by the bandwidth of the valve. As the mass decreased, the actuator natural frequency approached that of the valve, making high-performance control extremely challenging. The linear controller and SMC were found to become unstable at 46 and 31 kg, respectively.
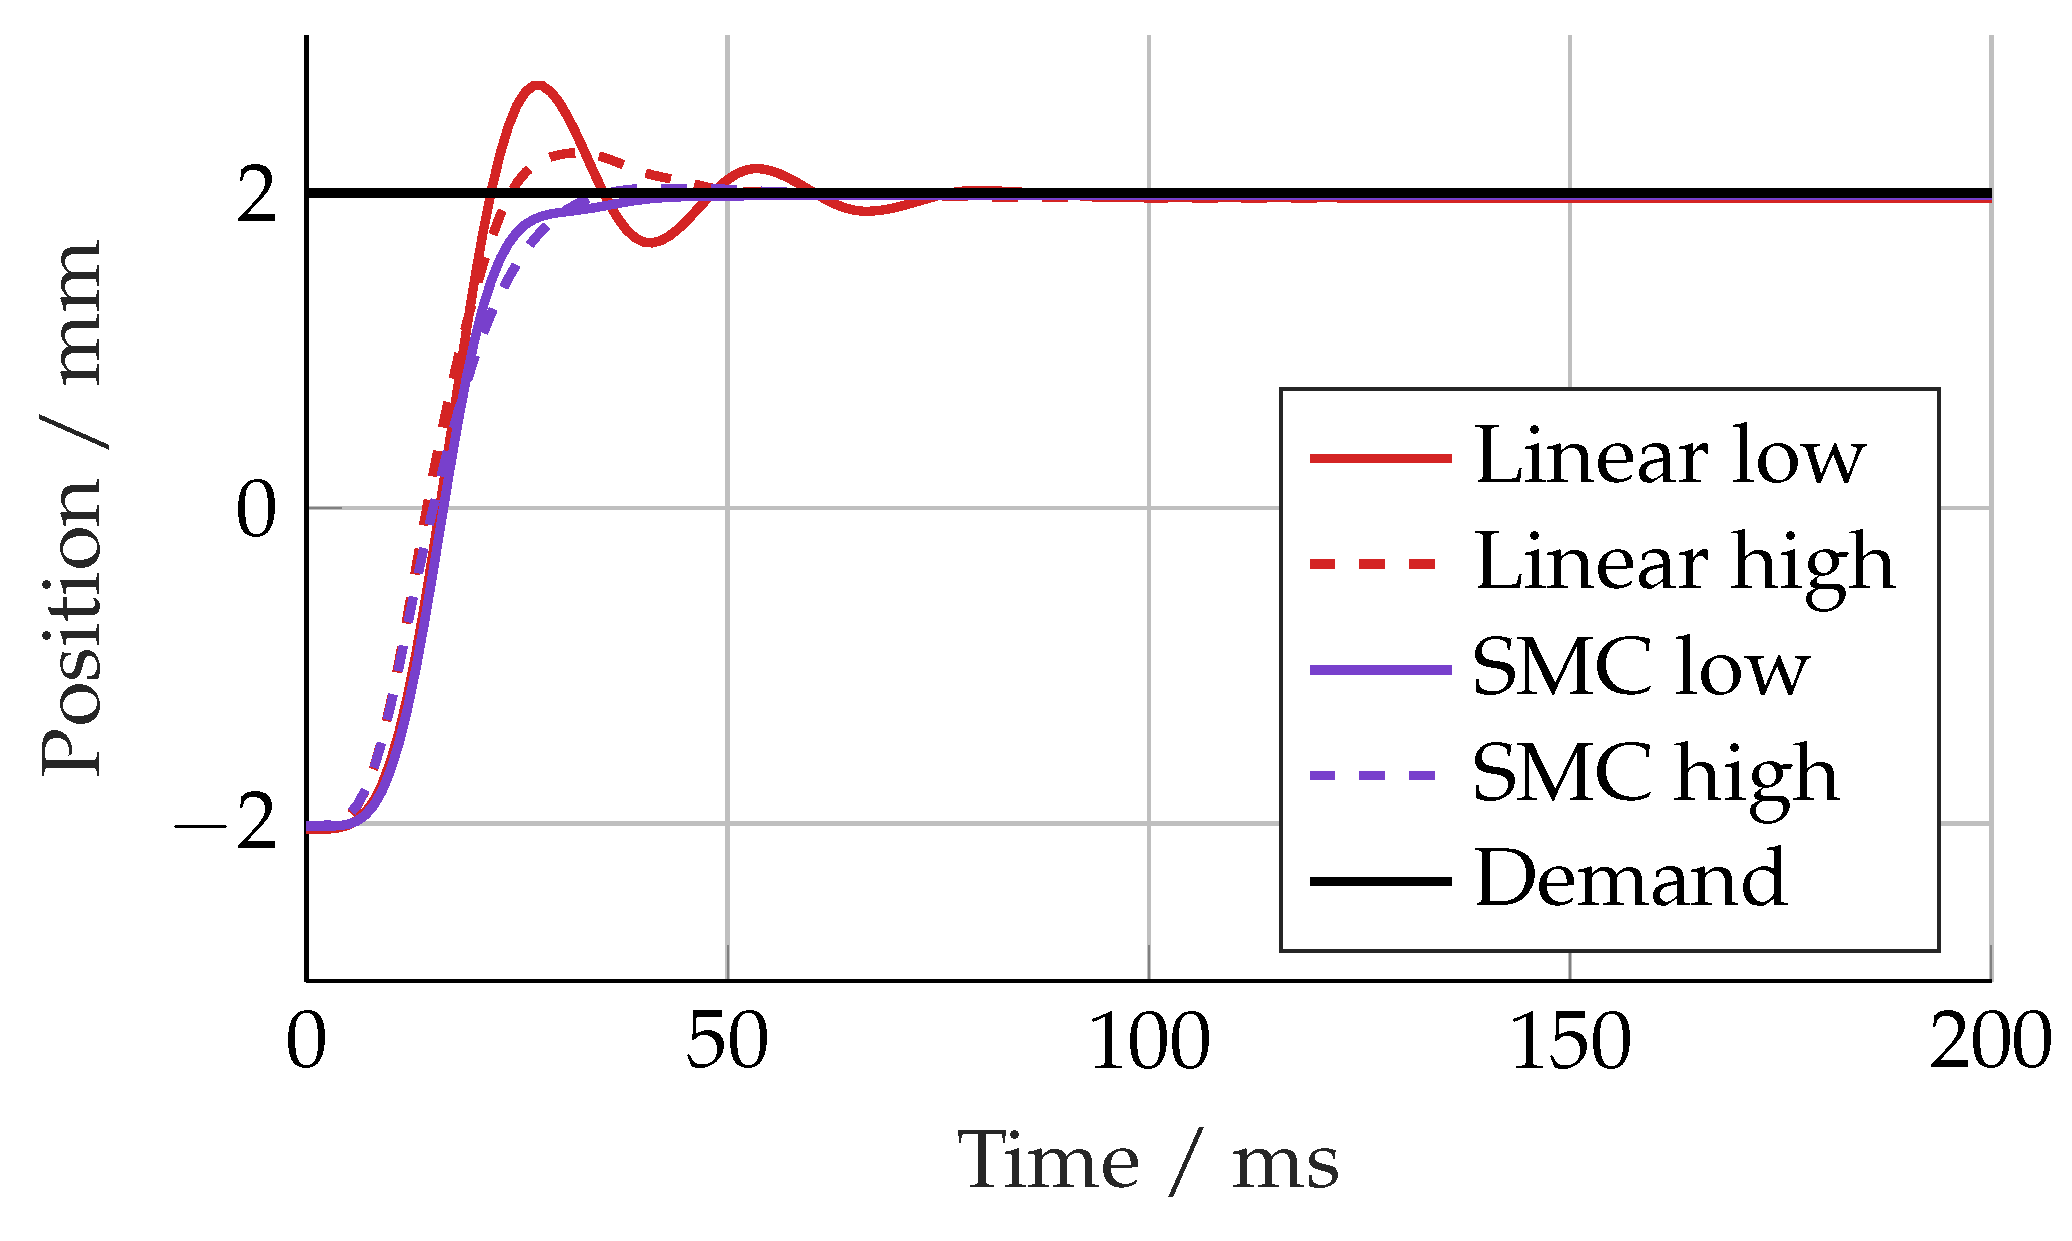
Altering the bulk modulus changed the stiffness of the actuator and therefore the natural frequency.
Figure 12 shows the step response of each controller with 50% and 150% of the nominal bulk modulus value. The linear controller showed more deviation from the nominal response, particularly with a lower bulk modulus, causing some oscillations.
5. Experimental Set-Up
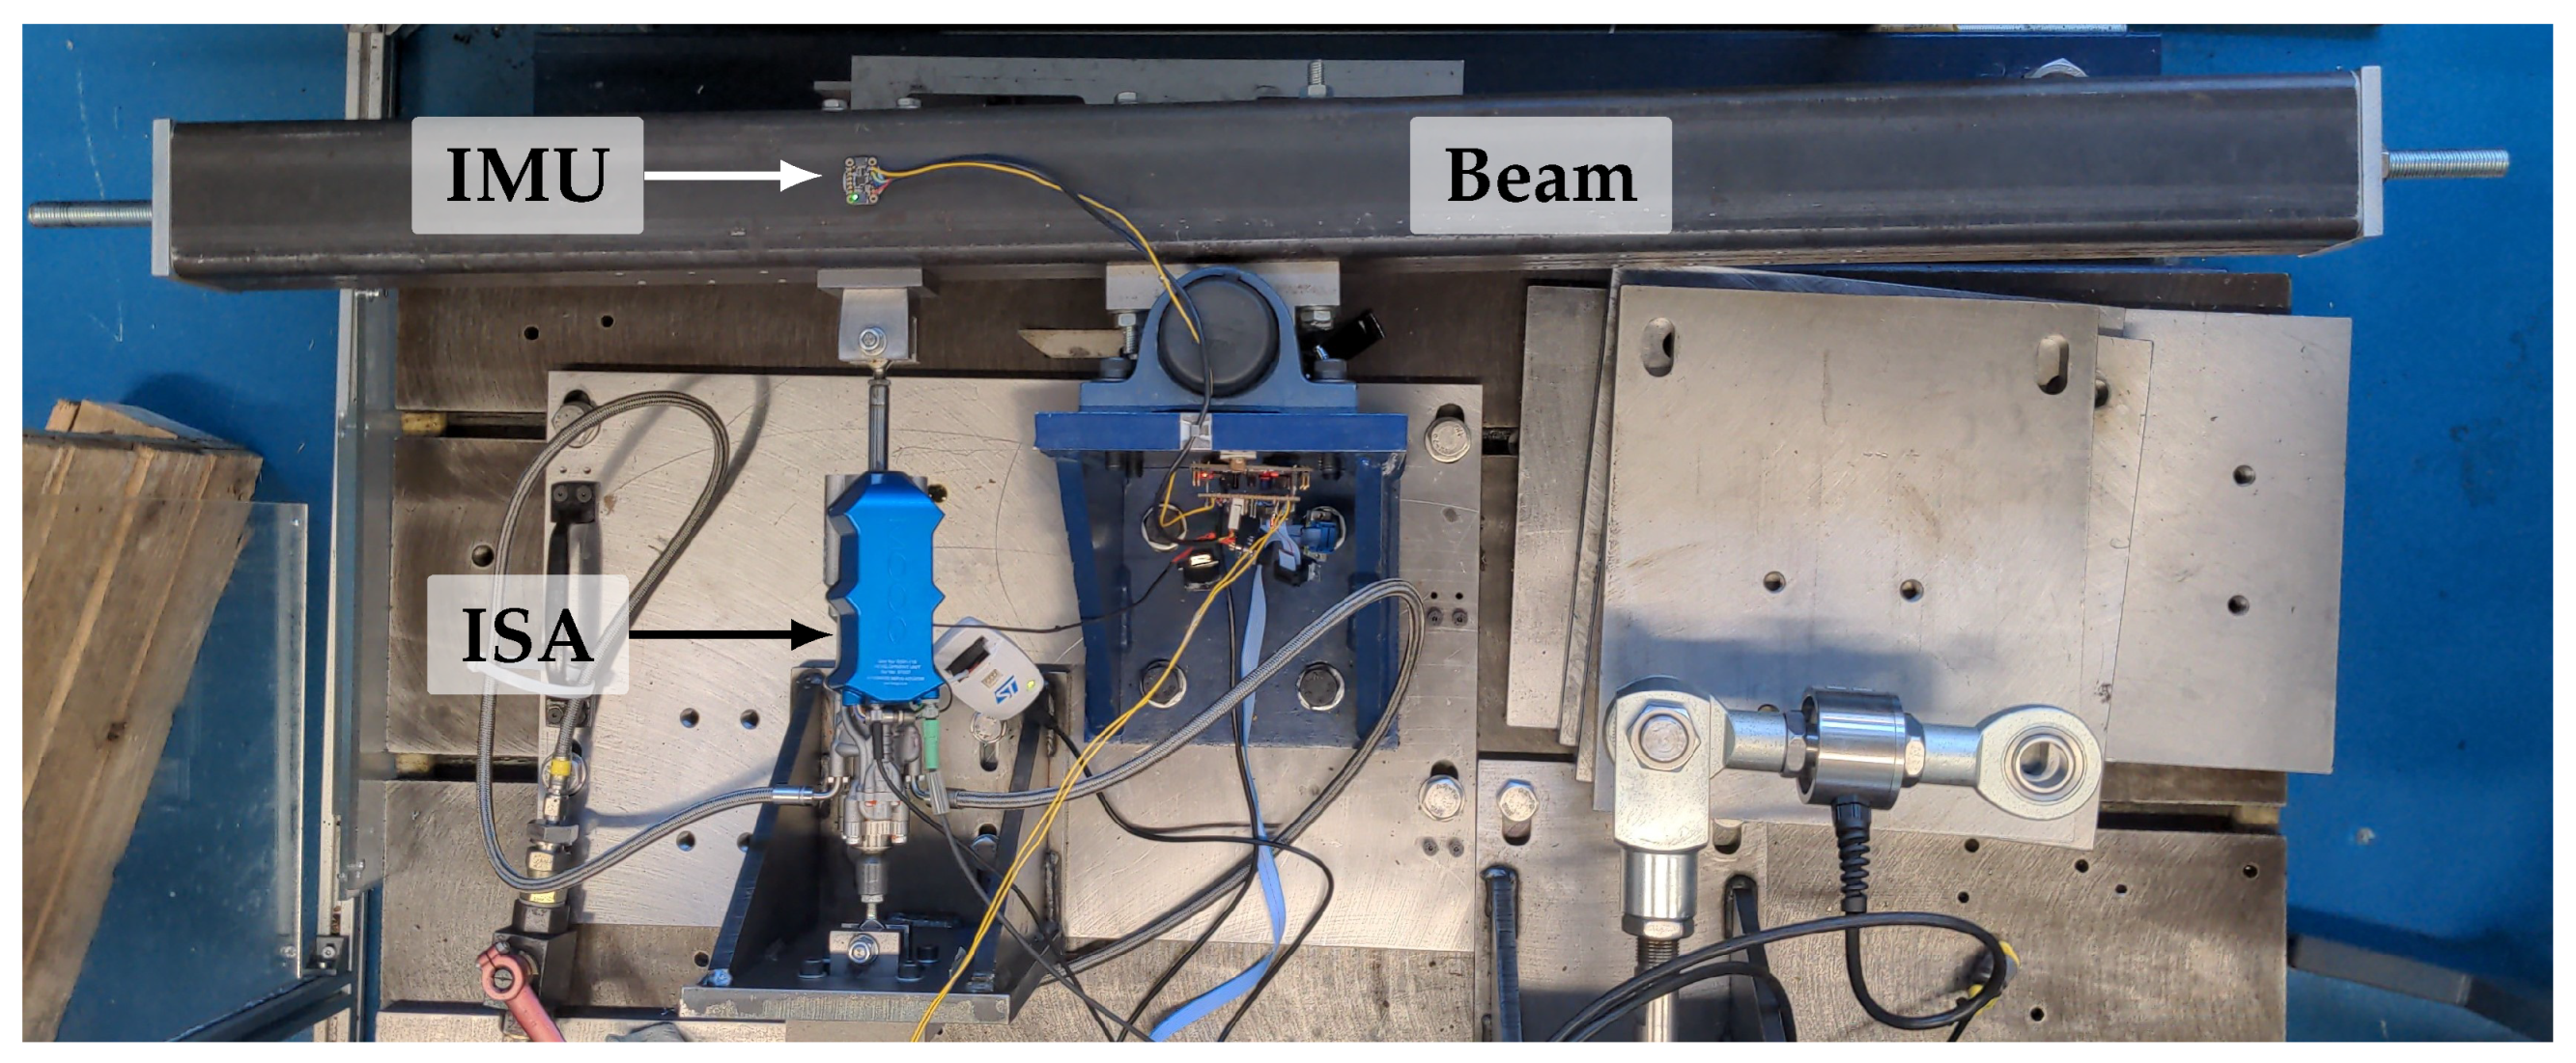
The ISA was mounted horizontally on a test bed attached to a pivoting beam which acted as the inertial load, as shown in
Figure 13. The equivalent mass acting on the actuator due to the rotational inertia of the beam was 77 kg, which could be increased by adding mass to the end of the beam.
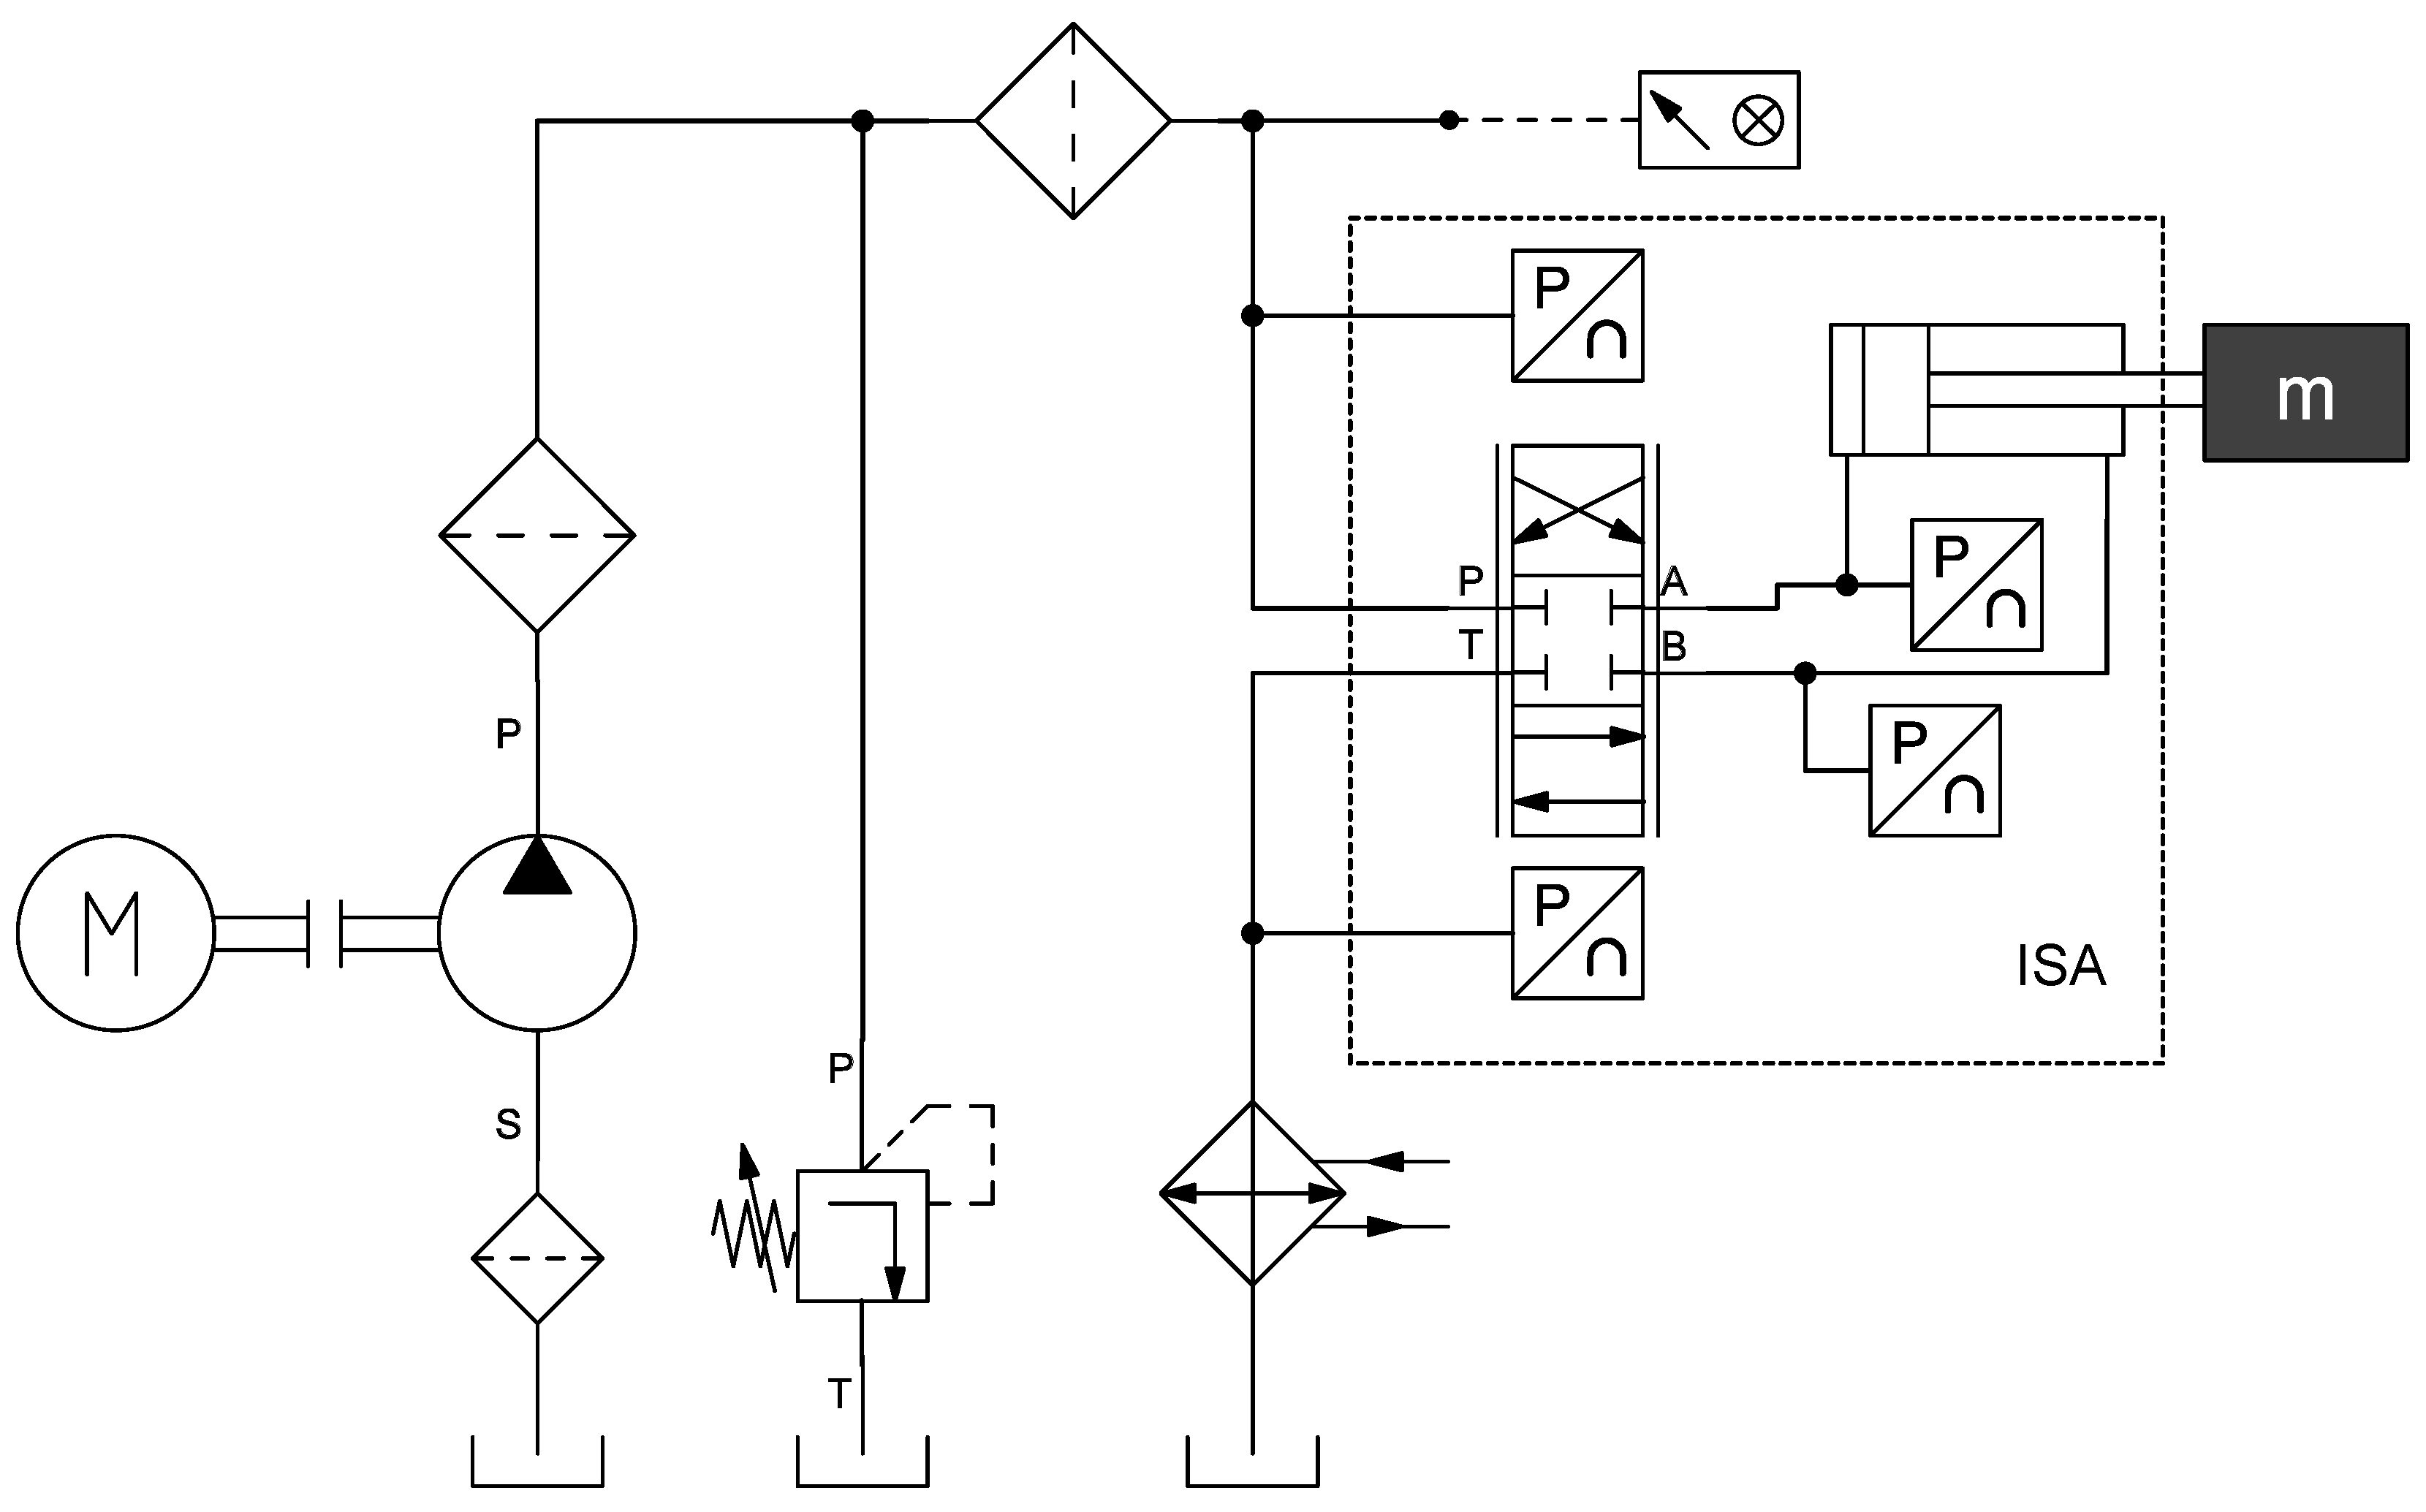
The hydraulic supply was a 24 lpm pump at a fixed supply pressure of 200 bar. The full circuit is shown in
Figure 14.
The nested loop control architecture for the ISA onboard STM32F7 microcontroller-based controller is shown in
Figure 15. Each of the current, spool and position loops operate at 10 kHz. Sensor data and other signals are streamed back to a host PC at 1 kHz for logging. An overview of the sensors is shown in
Table 4. The analog sensors were sampled using the microcontroller’s 12 bit ADC.
6. Experimental Results
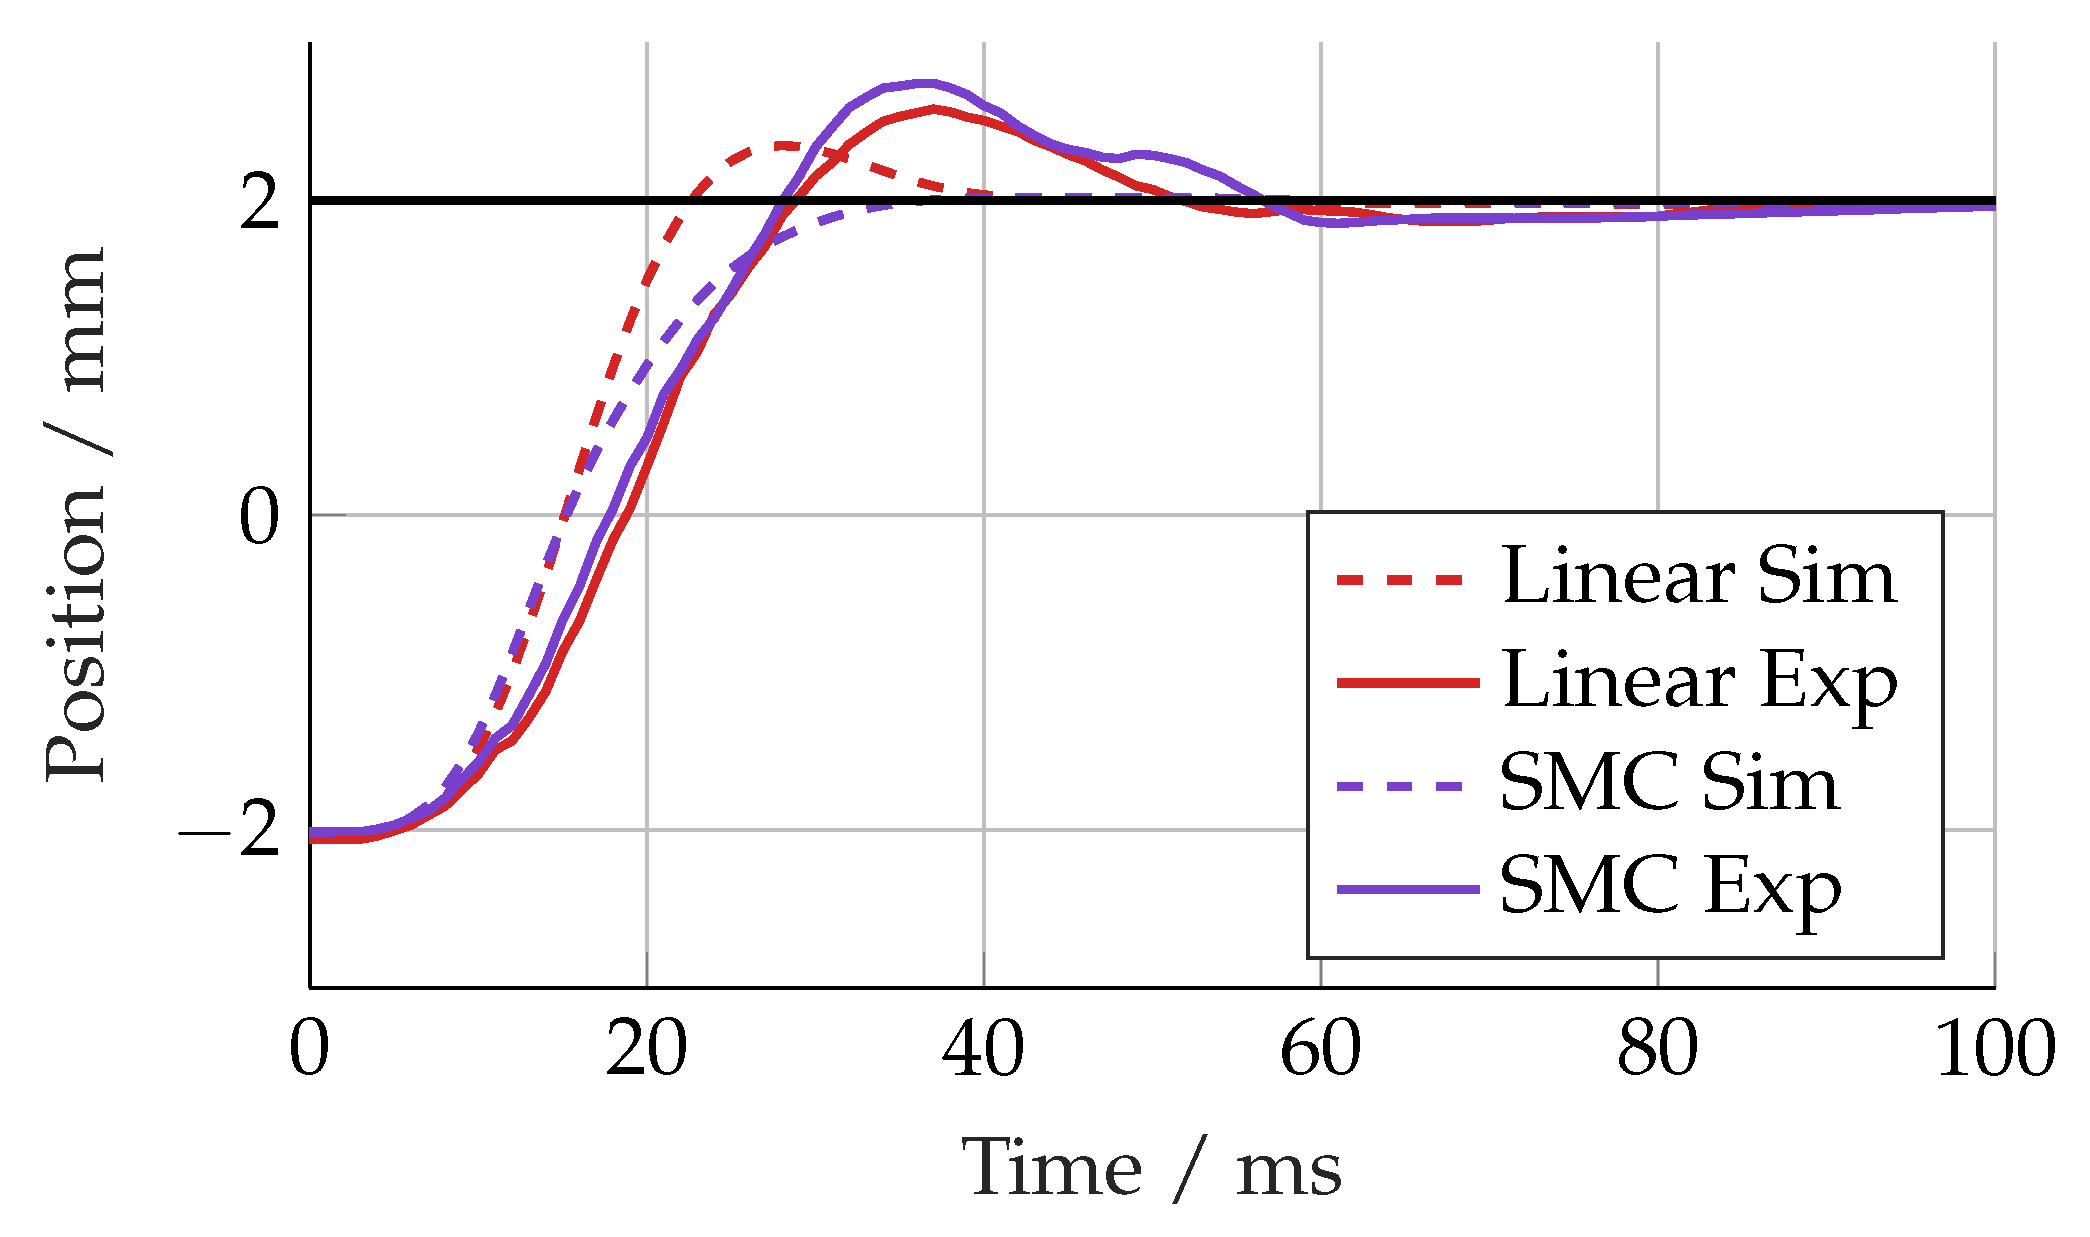
For the experimental testing, the same control parameters were used as for the simulations. The step response of each controller compared to the simulation results is shown in
Figure 16. Each controller responded more slowly with a larger overshoot, suggesting either a parametric error or unmodelled dynamics in the simulation model.
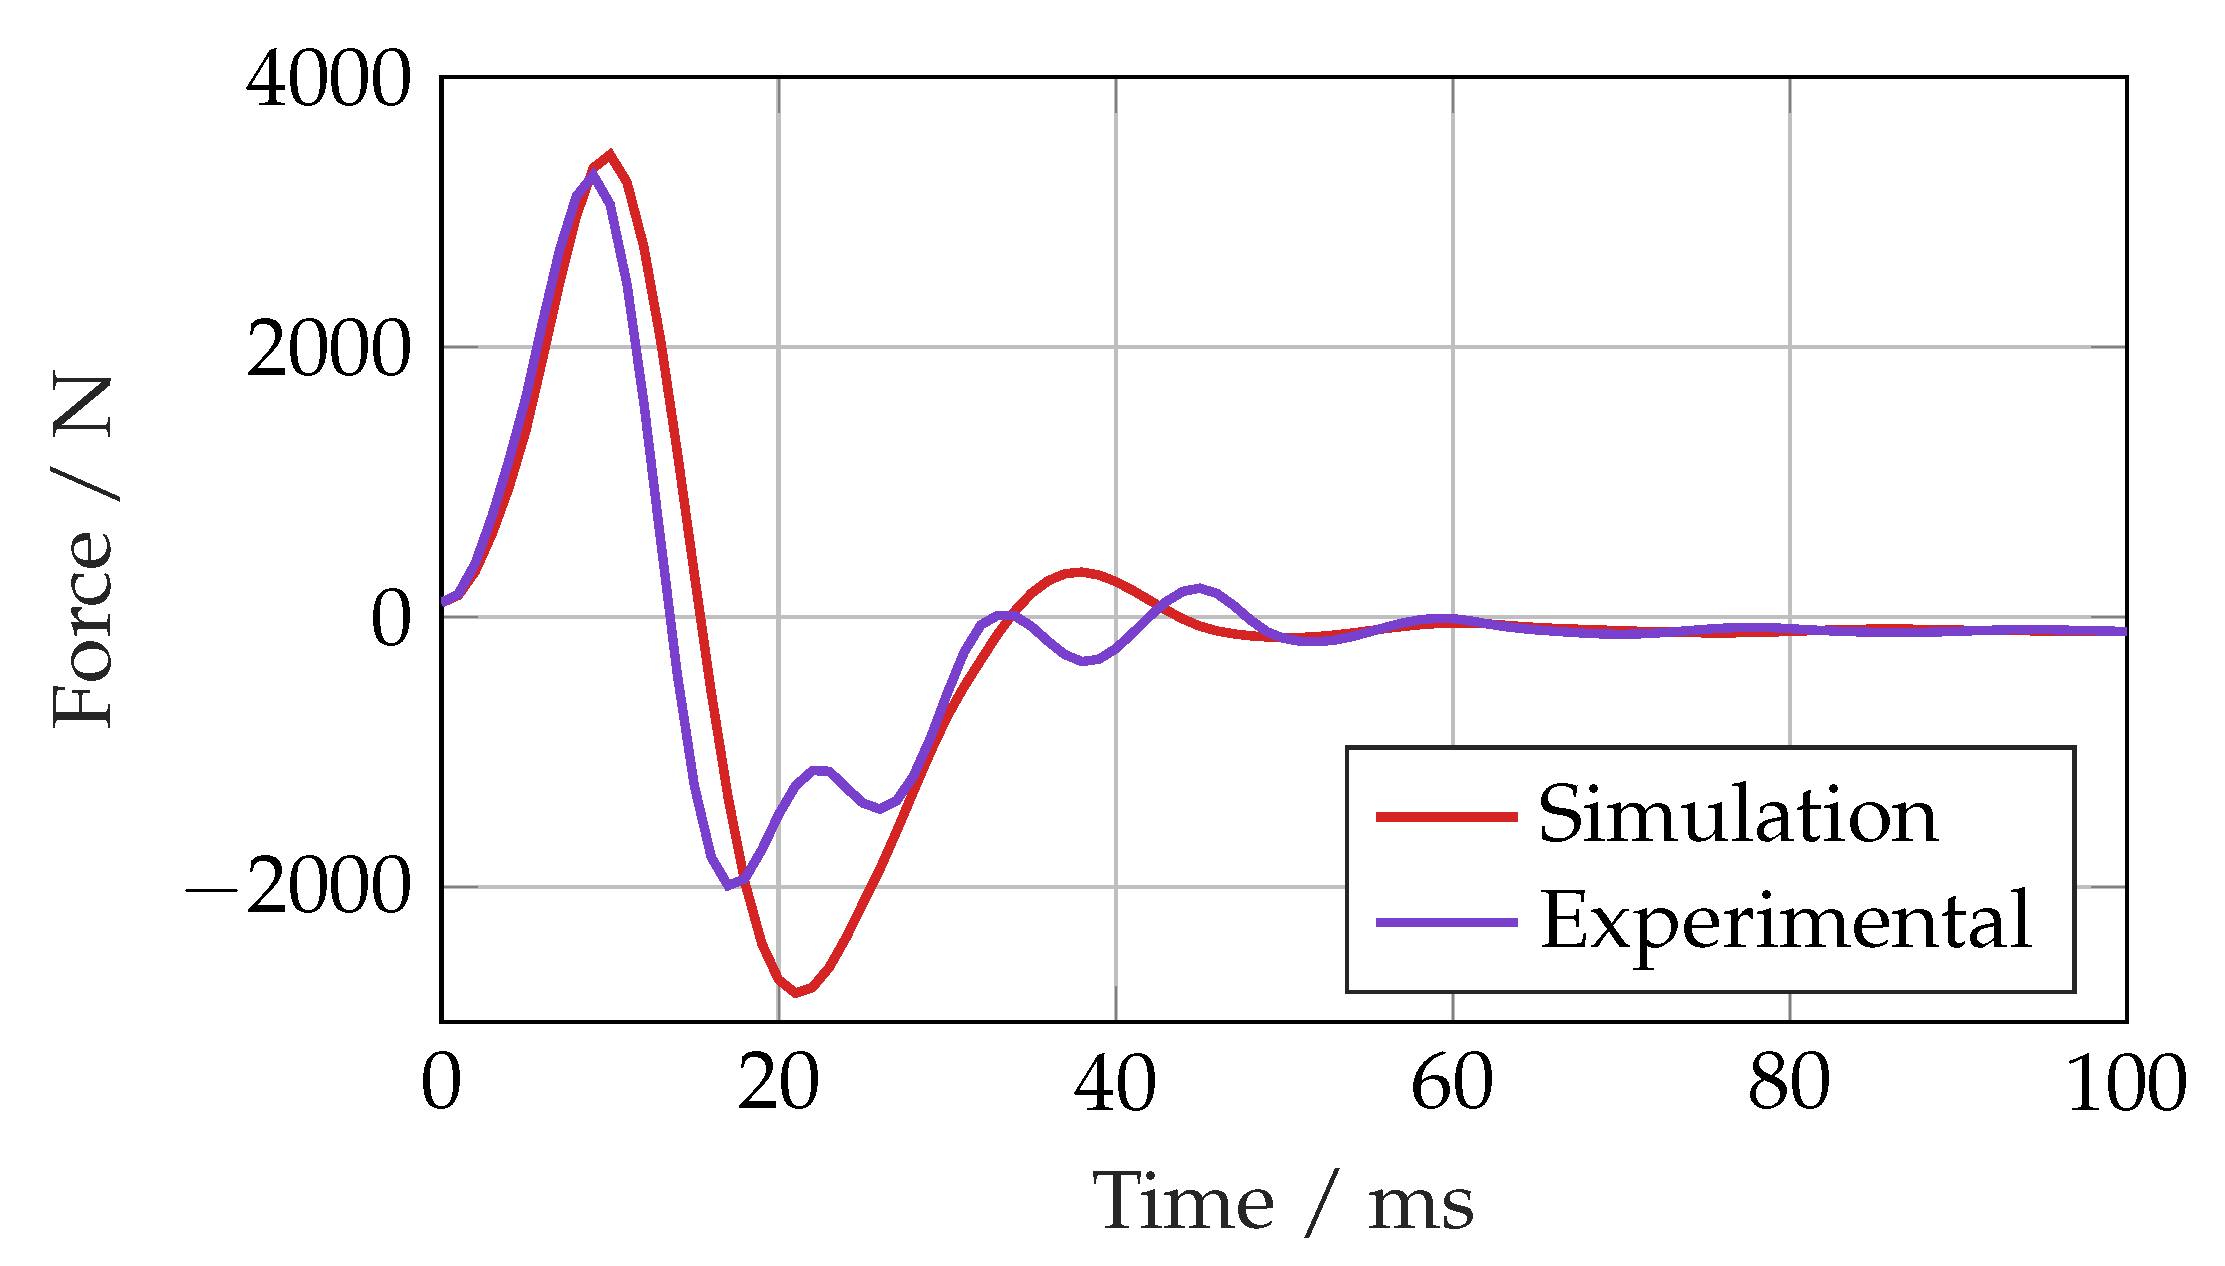
When observing the actuator force measurement during a step position demand for both the simulation and experiment with the SMC, shown in
Figure 17, the responses were broadly similar, but there was clearly a higher frequency component to the experimental data. This would suggest that there is compliance between either the ISA and the test bed or the ISA and the load.
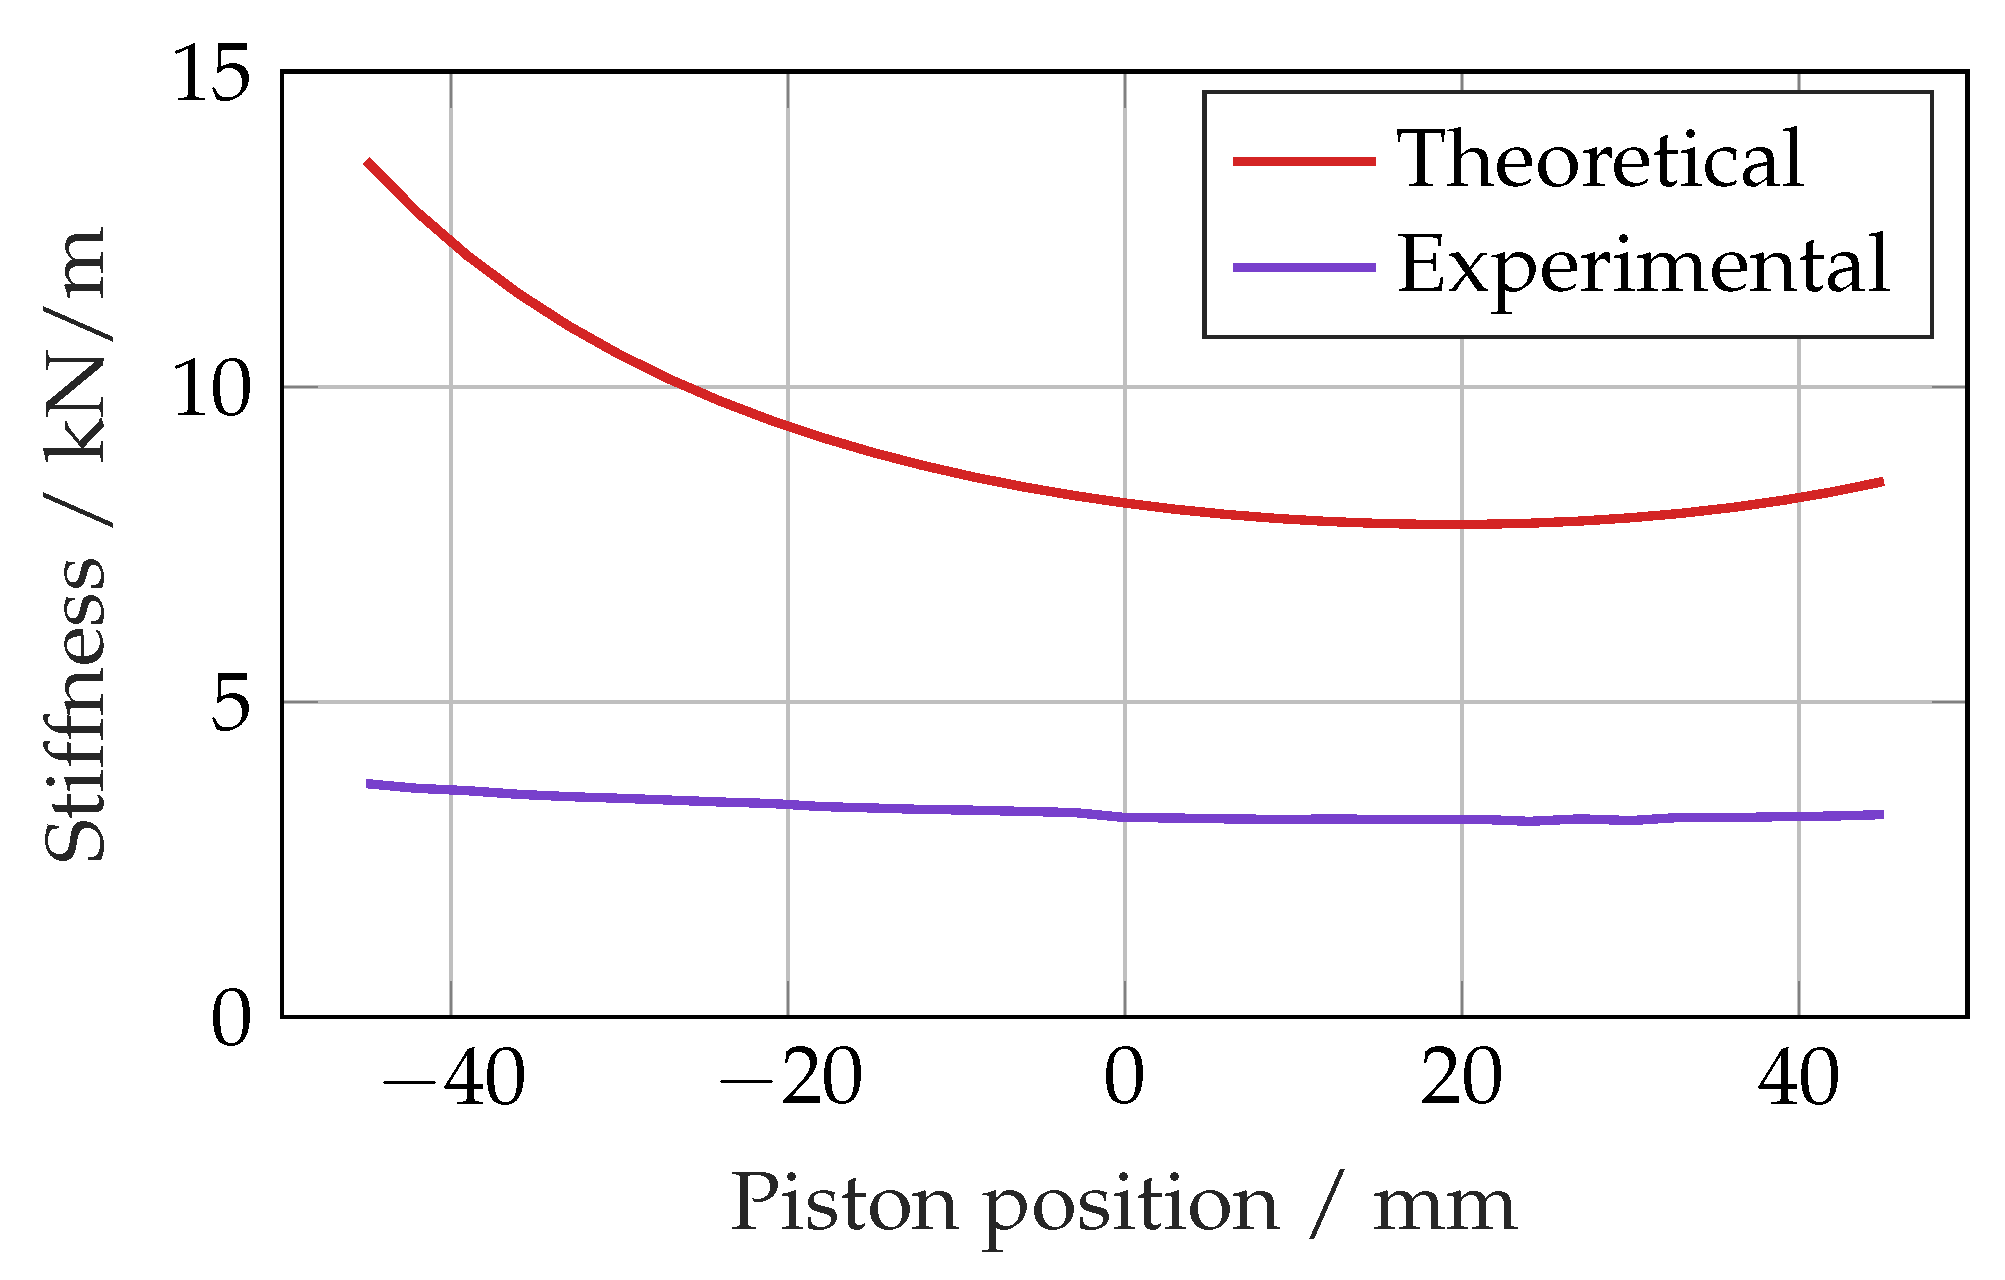
To determine the stiffness of the experimental set-up, the actuator was accelerated to a steady velocity and then suddenly stopped at a range of piston positions. The frequency of the resulting oscillation along with the load mass was used to determine the stiffness, shown in
Figure 18, alongside the theoretical value. The experimentally determined stiffness was clearly much lower and approximately equivalent to a 4.65 kN/mm spring in series with the fluid in the actuator, likely due to compliance in the couplings between the ISA and the mounts.
The extra compliance explains the slower response compared with the simulation and may also explain the similar experimental response of each controller, with both limited by the reduced stiffness.
6.1. Performance Comparison
Figure 16 shows that the step responses of each controller were quite similar, as confirmed by the rise time, settling time and overshoot in
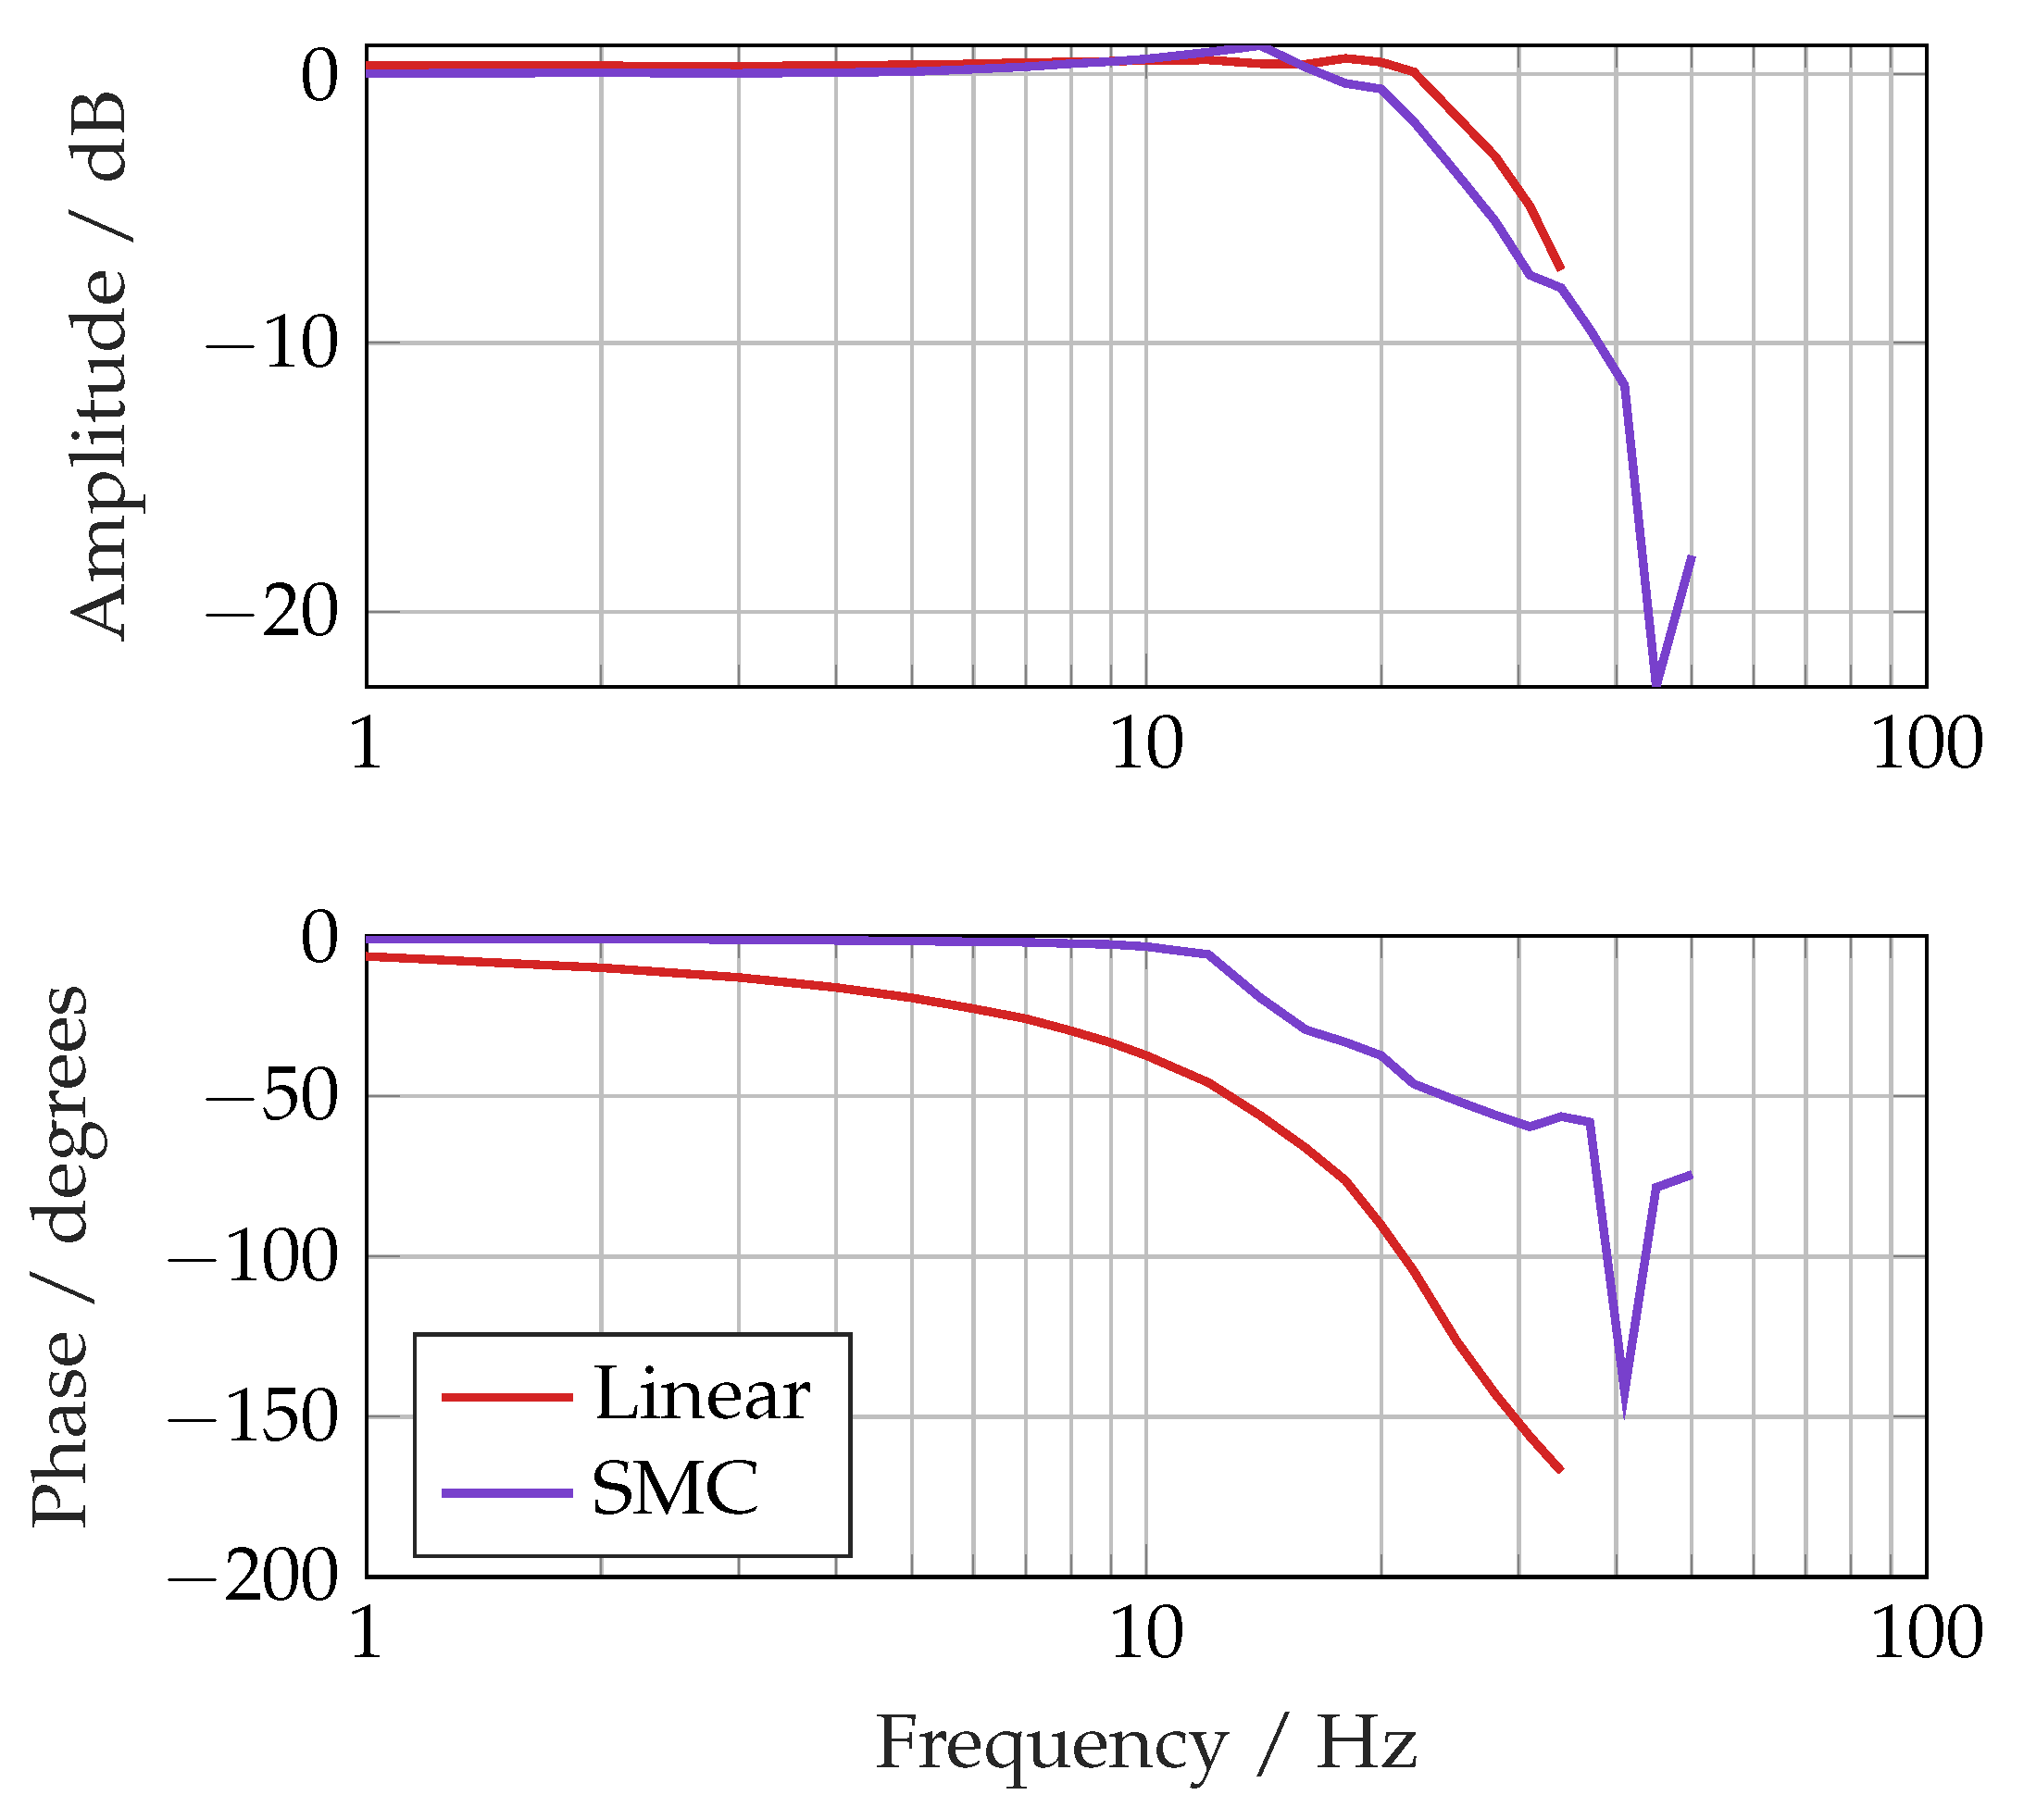
Table 5. However, in the frequency domain, the SMC demonstrated better performance, with a
bandwidth of 38 Hz against 19 Hz for the linear controller with a 1 mm amplitude demand, shown in
Figure 19. The good phase response can also be seen in the tracking performance at 10 Hz in
Figure 20.
6.2. Robustness
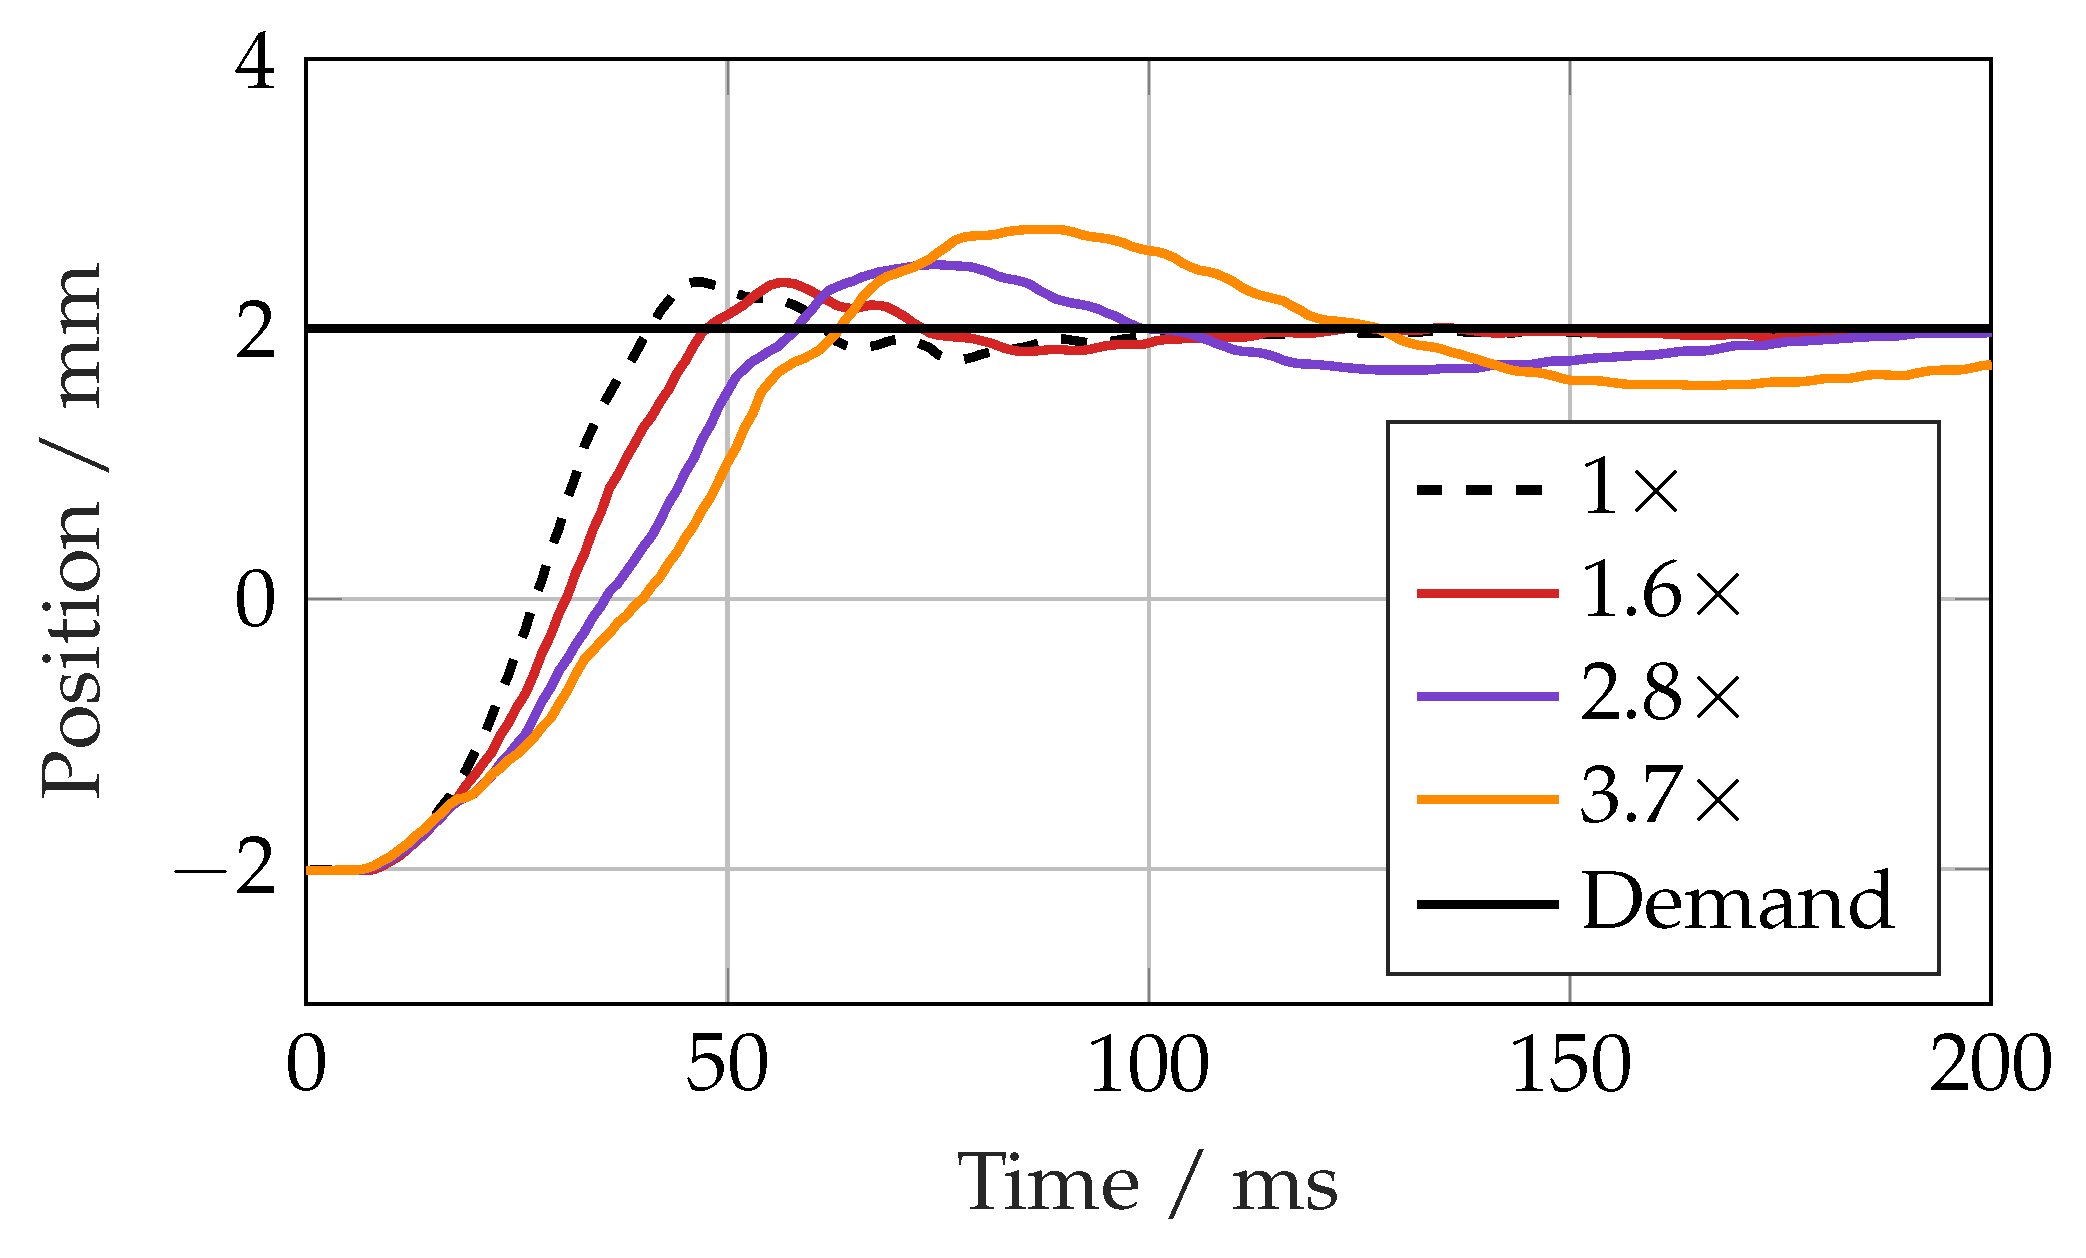
To test the robustness of each controller, extra mass was added to the beam to increase it from the nominal value of 77 kg. Similar to the simulation results, the linear controller
Figure 21 showed increasing oscillations, whilst the SMC showed gradually increasing overshoot but no instability (
Figure 22). At a 285 kg load mass (3.7 times the nominal amount), the linear controller became unstable, but the SMC response remained reasonable, albeit with an overshoot of 0.8 mm (20%).
7. Trajectory Filtering for SMC
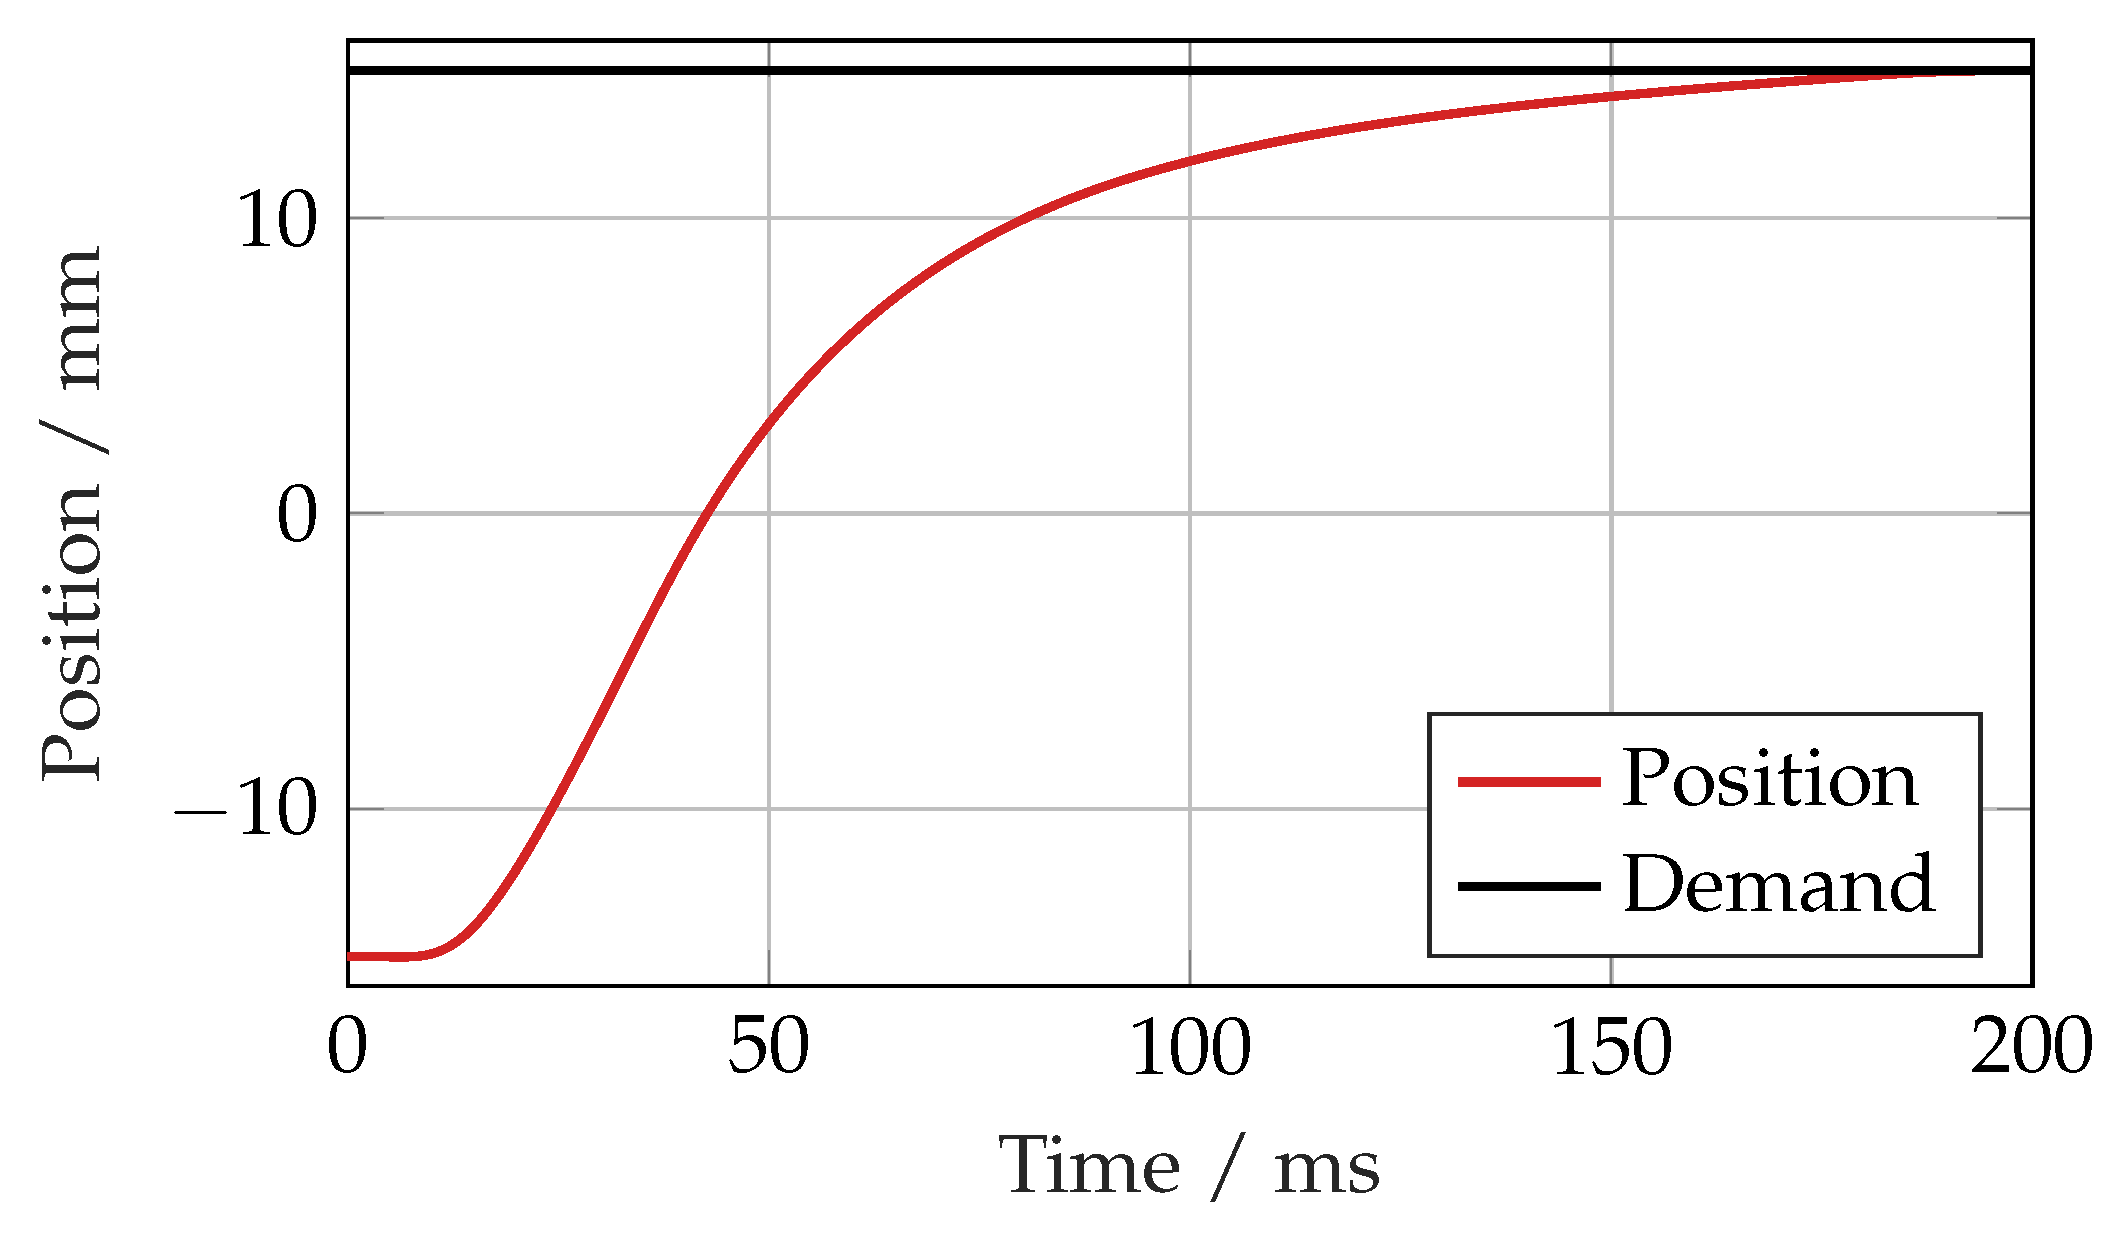
Whilst the SMC responded well to the demand signals presented thus far, it was found that particular unachievable demand signal trajectories such as a large step caused a rather slow response, as shown in the simulation results in
Figure 23. This is likely to be due to a windup effect in the control signal caused by a sustained error between the position, velocity and acceleration and their desired values.
It is common in robotic systems to use a trajectory generator to create smooth and achievable demand signals for a robot joint to move from one position to another. Since the controller can take arbitrary input demands, a filter is placed before the controller to shape the demand such that it is within the capabilities of the actuator. A fourth-order linear filter is sufficient to create smooth position, velocity, acceleration and jerk signals required by the controller and implicitly contain these signals, as implemented in
Figure 24.
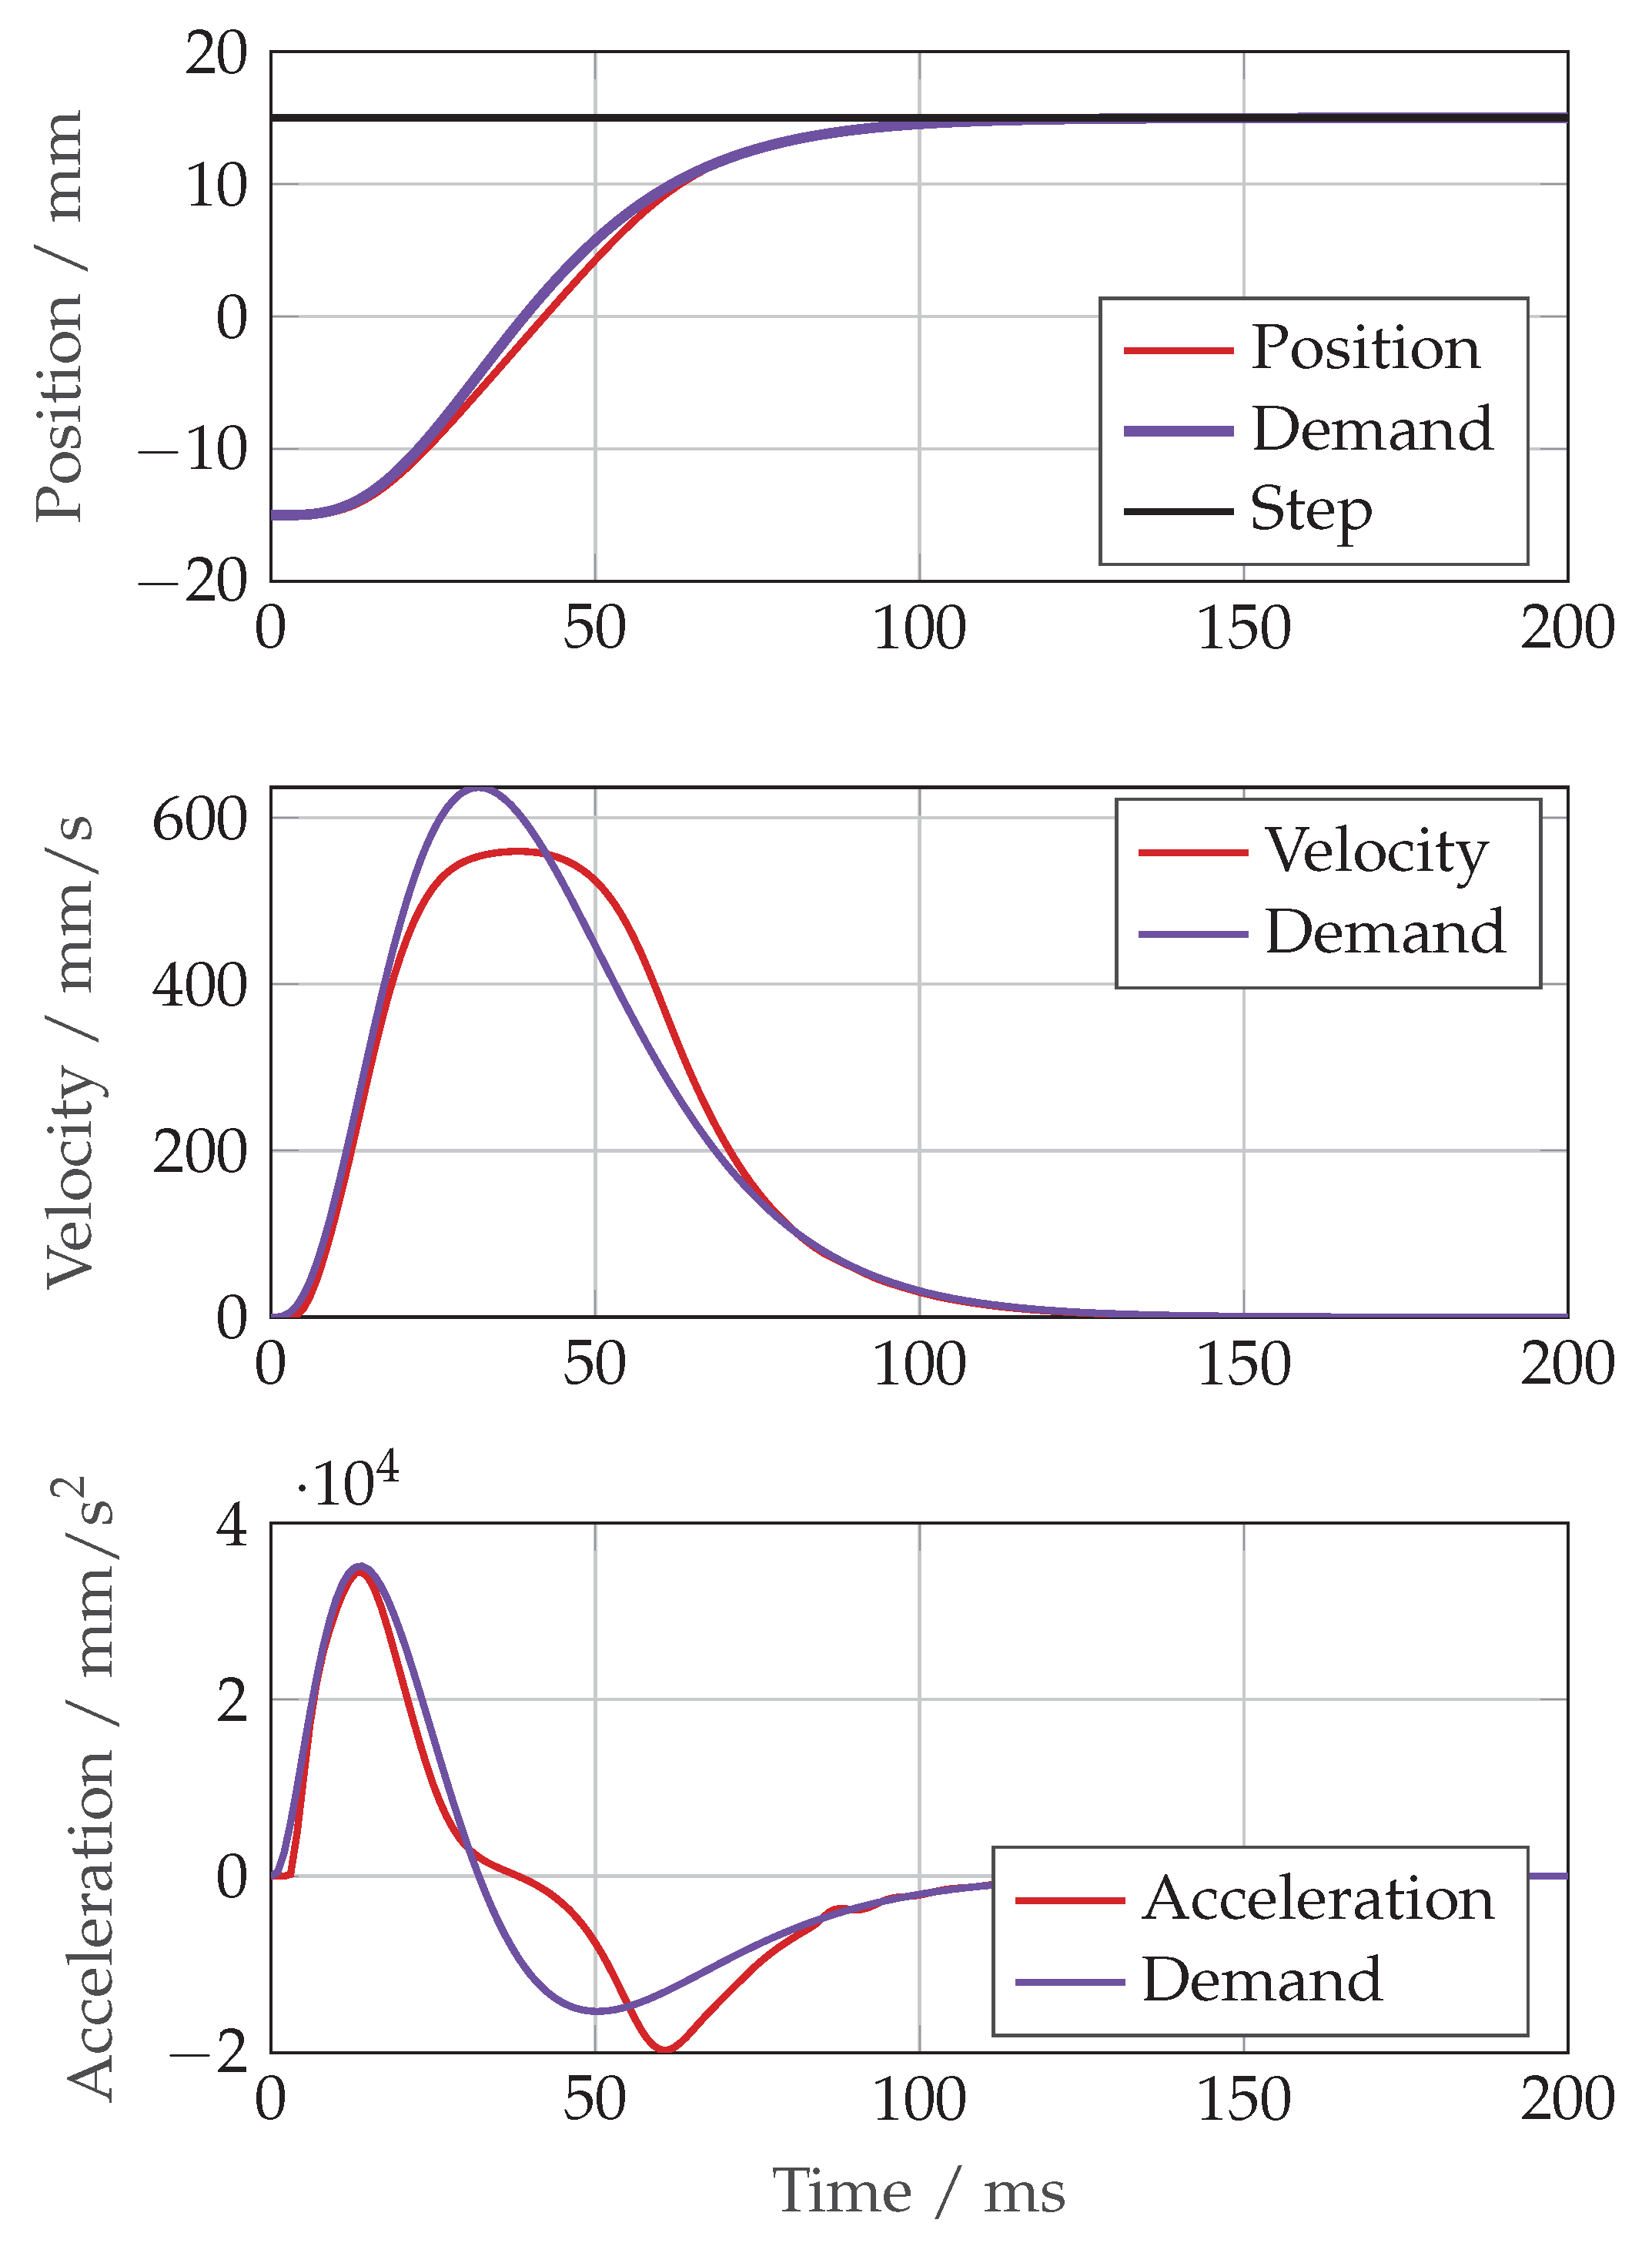
With the filter configured as four matching poles at 10 Hz, the simulation response to a large step change then closely followed the trajectory sent to the controller, shown in
Figure 25. However, this severely limited the performance of the controller to the chosen bandwidth of the filter. A better solution is to constrain the trajectory according the limits of the actuator.
The approach to constrained trajectory generation proposed in [
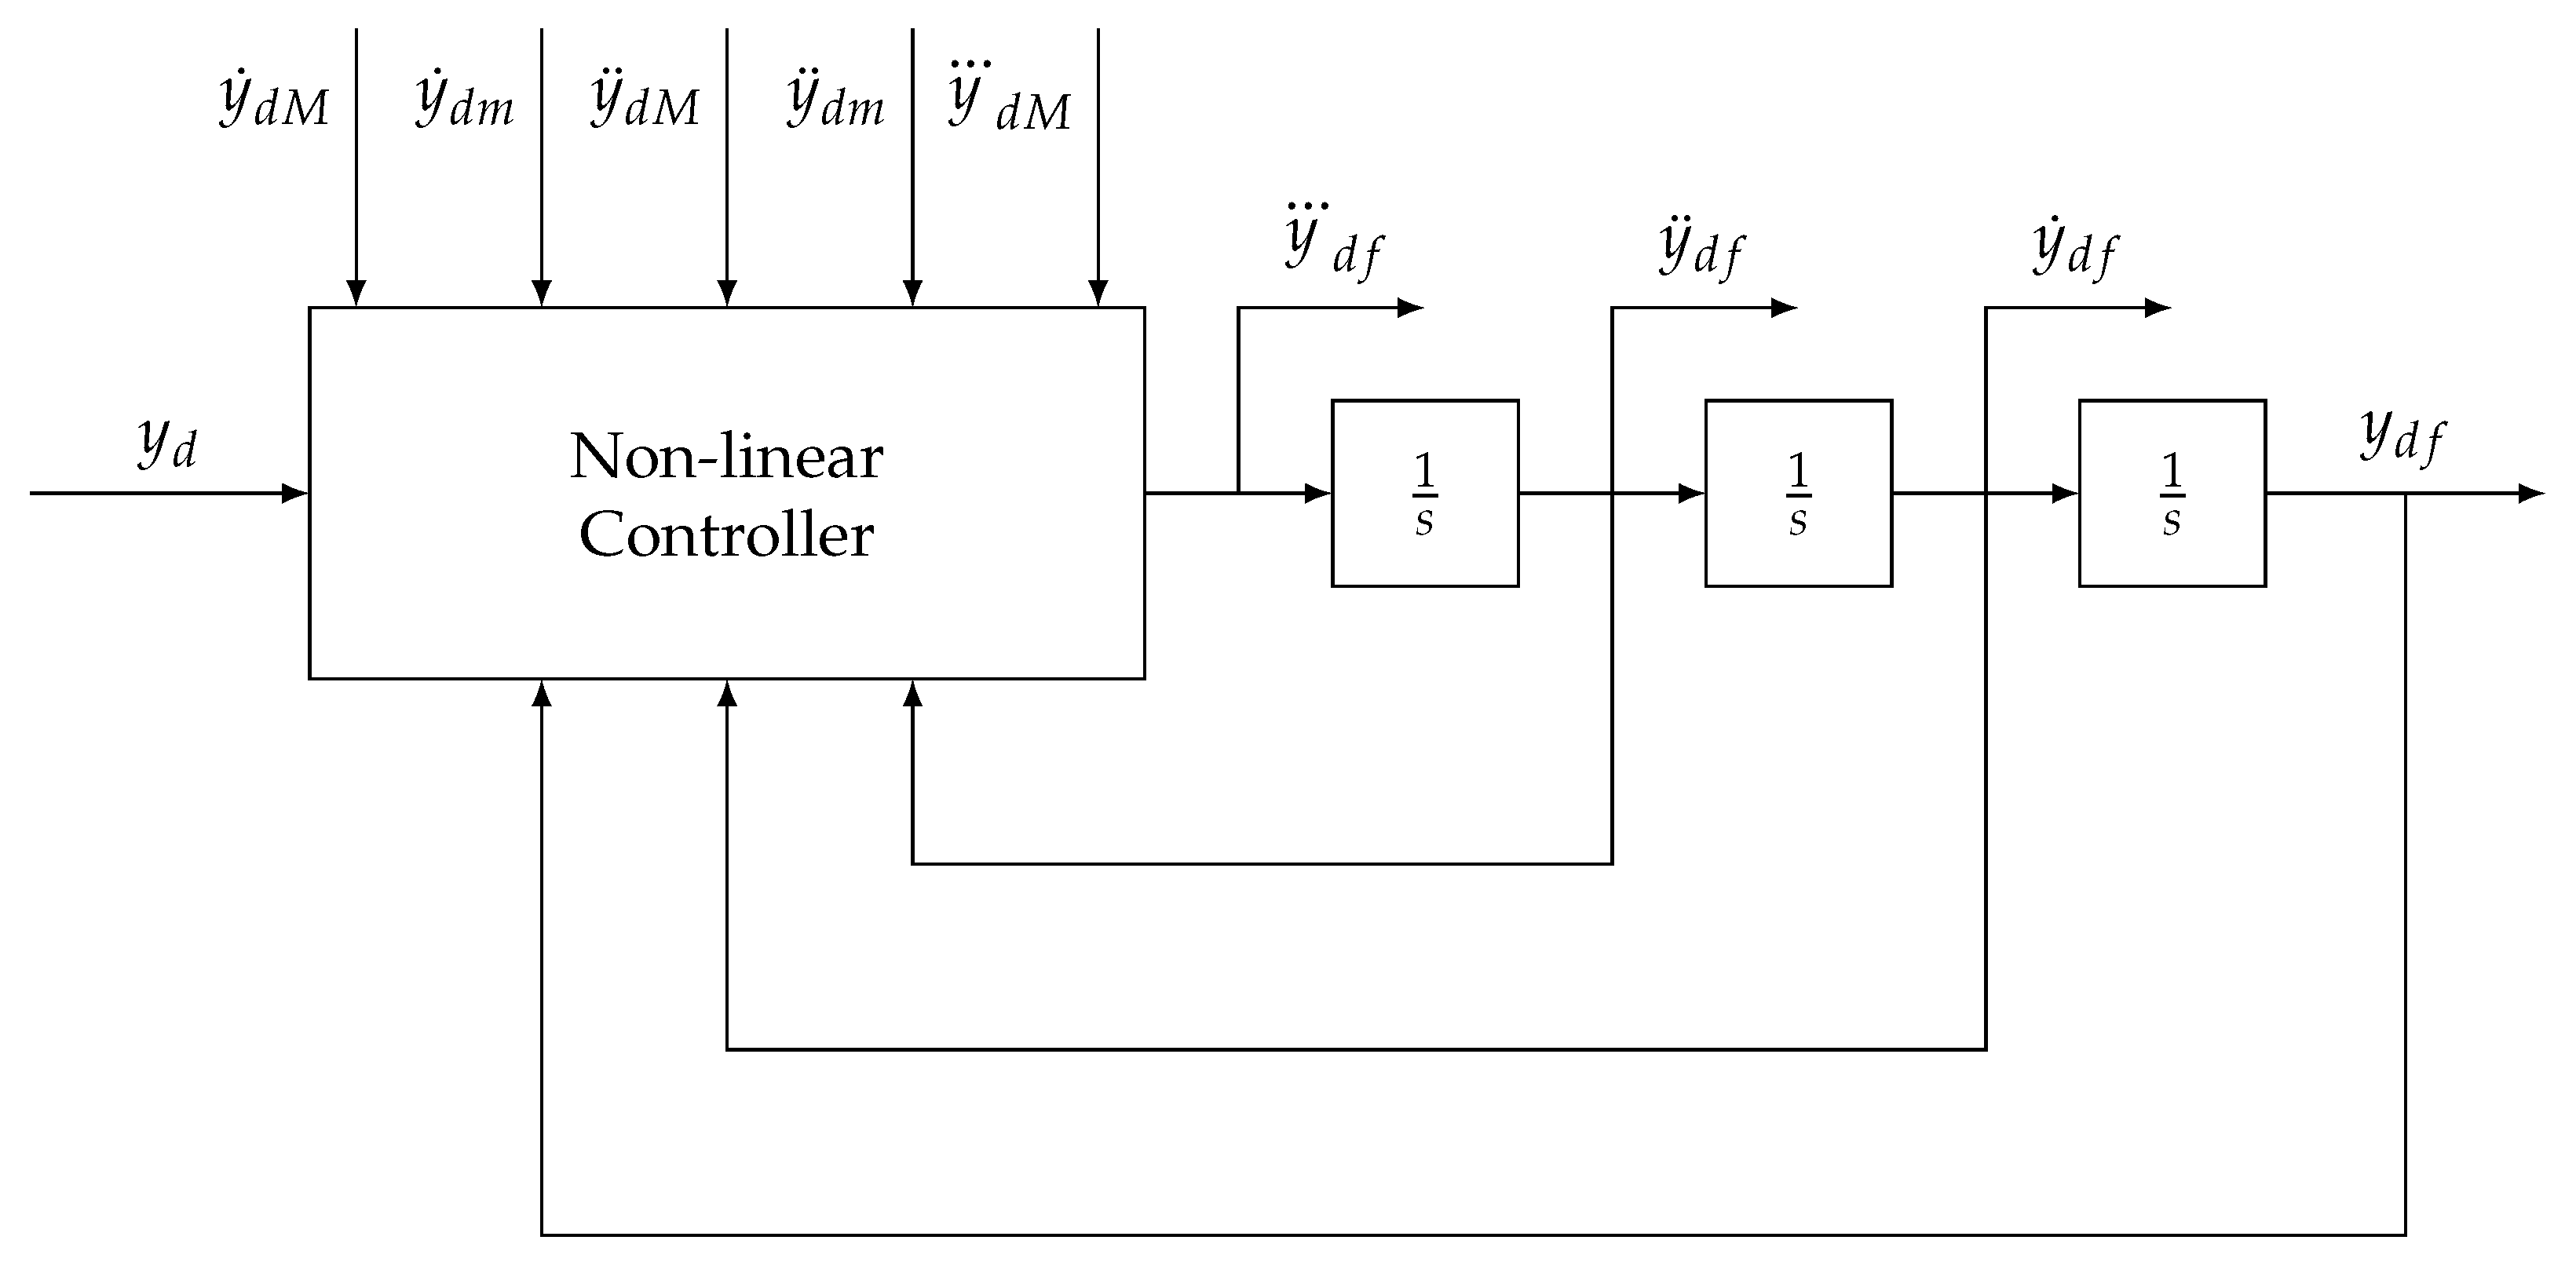
29] is able to consider asymmetric constraints to velocity and acceleration, as well as a jerk limit to filter an input demand and produce a position demand and its derivatives. The premise of the filter is a triple integrator system controlled by a nonlinear switching controller, shown in the block diagram in
Figure 26.
The velocity and acceleration limits were chosen based on the known characteristics of the system. The velocity limit was set to 450 mm/s based on the maximum velocity of the actuator, which was found experimentally. The acceleration constraints were based on the minimum and maximum values that the piston pressures could take to supply the flow required to match the demand velocity. For example, if the filtered velocity demand is positive (
), then the flow into the piston side chamber is
Assuming that the valve is open fully such that the flow area is
, the maximum piston pressure
is given by
Similarly, the minimum pressure on the annulus side
is given by
The maximum acceleration
that the actuator can apply on the load mass is then
If the demand velocity is negative, then the pressure drops across the spool lands are assumed to take their maximum values such that
and
. The maximum acceleration is therefore given by
The minimum accelerations can be found in a similar manner, as summarised in
Table 6.
The final limit, the maximum jerk, is symmetrical and fixed. There is a trade-off between a fast reponse and a chattering effect due to the switching nature of the filter, which can be tuned by the jerk limit. This is performed heuristically, with a value of 2 × 10⁶ (mm/s3) found to work well.
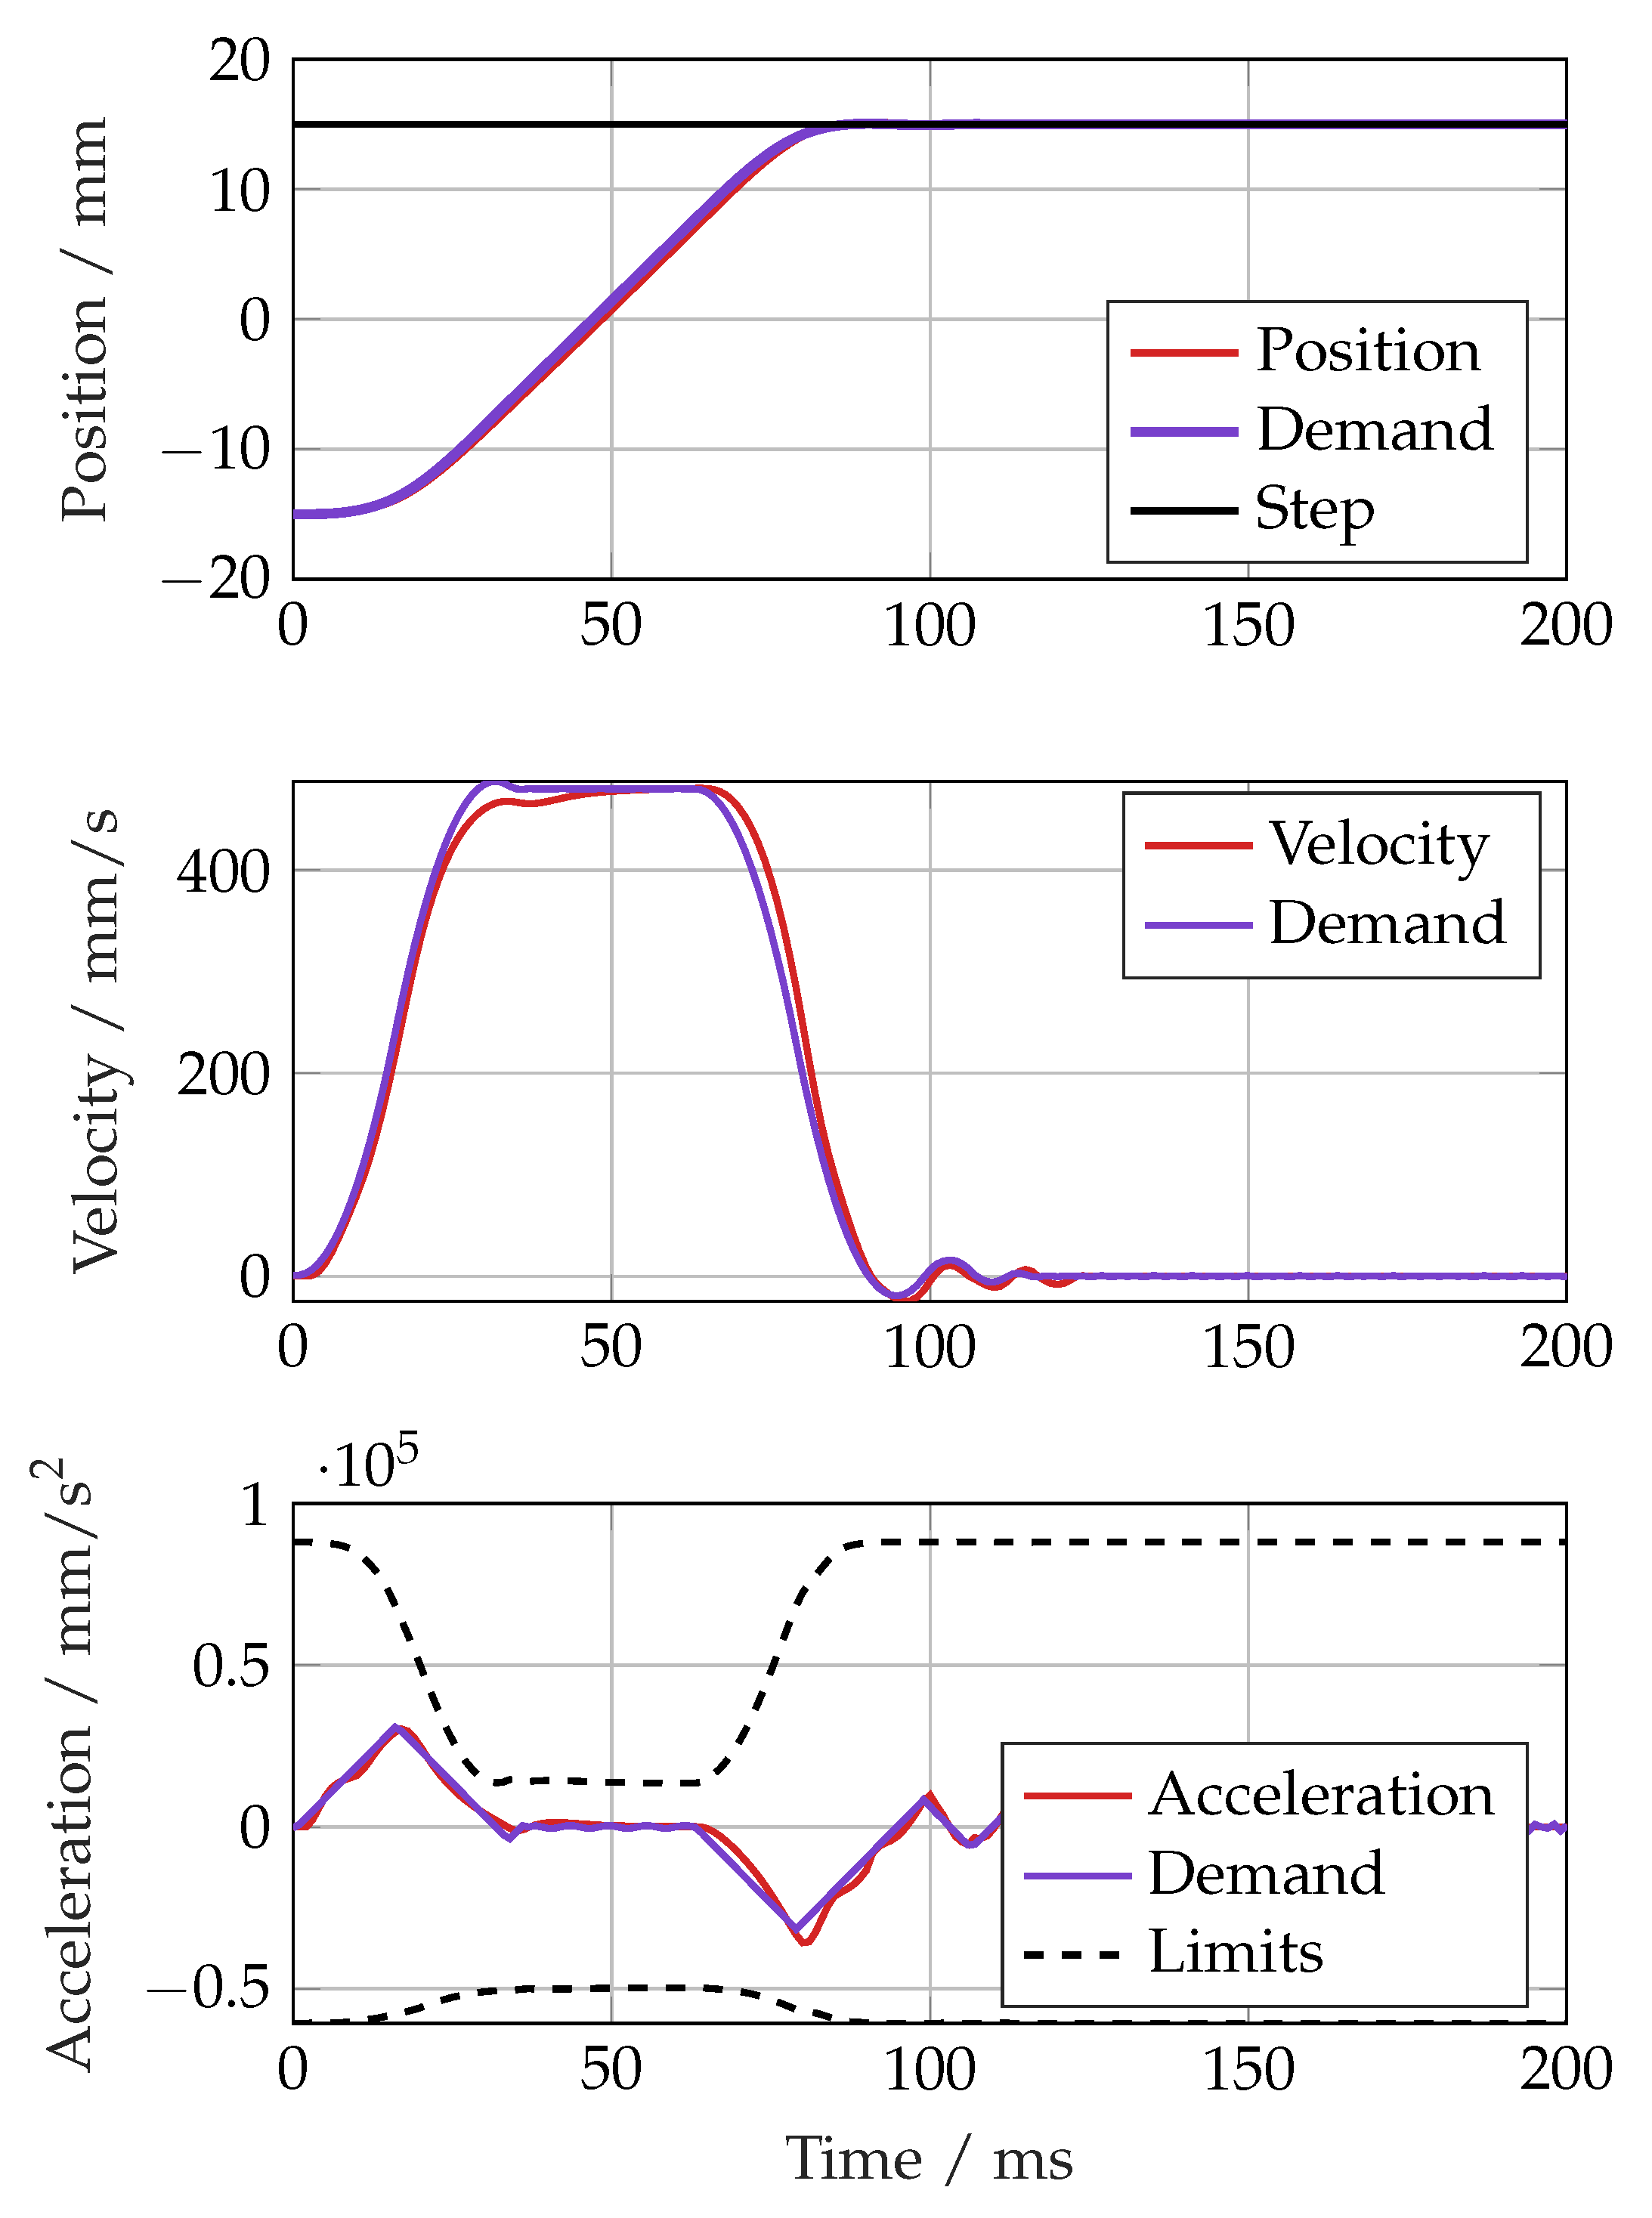
The same large step demand using the constrained trajectory generator is shown in
Figure 27. The controller was able to effectively track the filtered trajectory and reached the position demand in 80 ms instead of 100 ms.
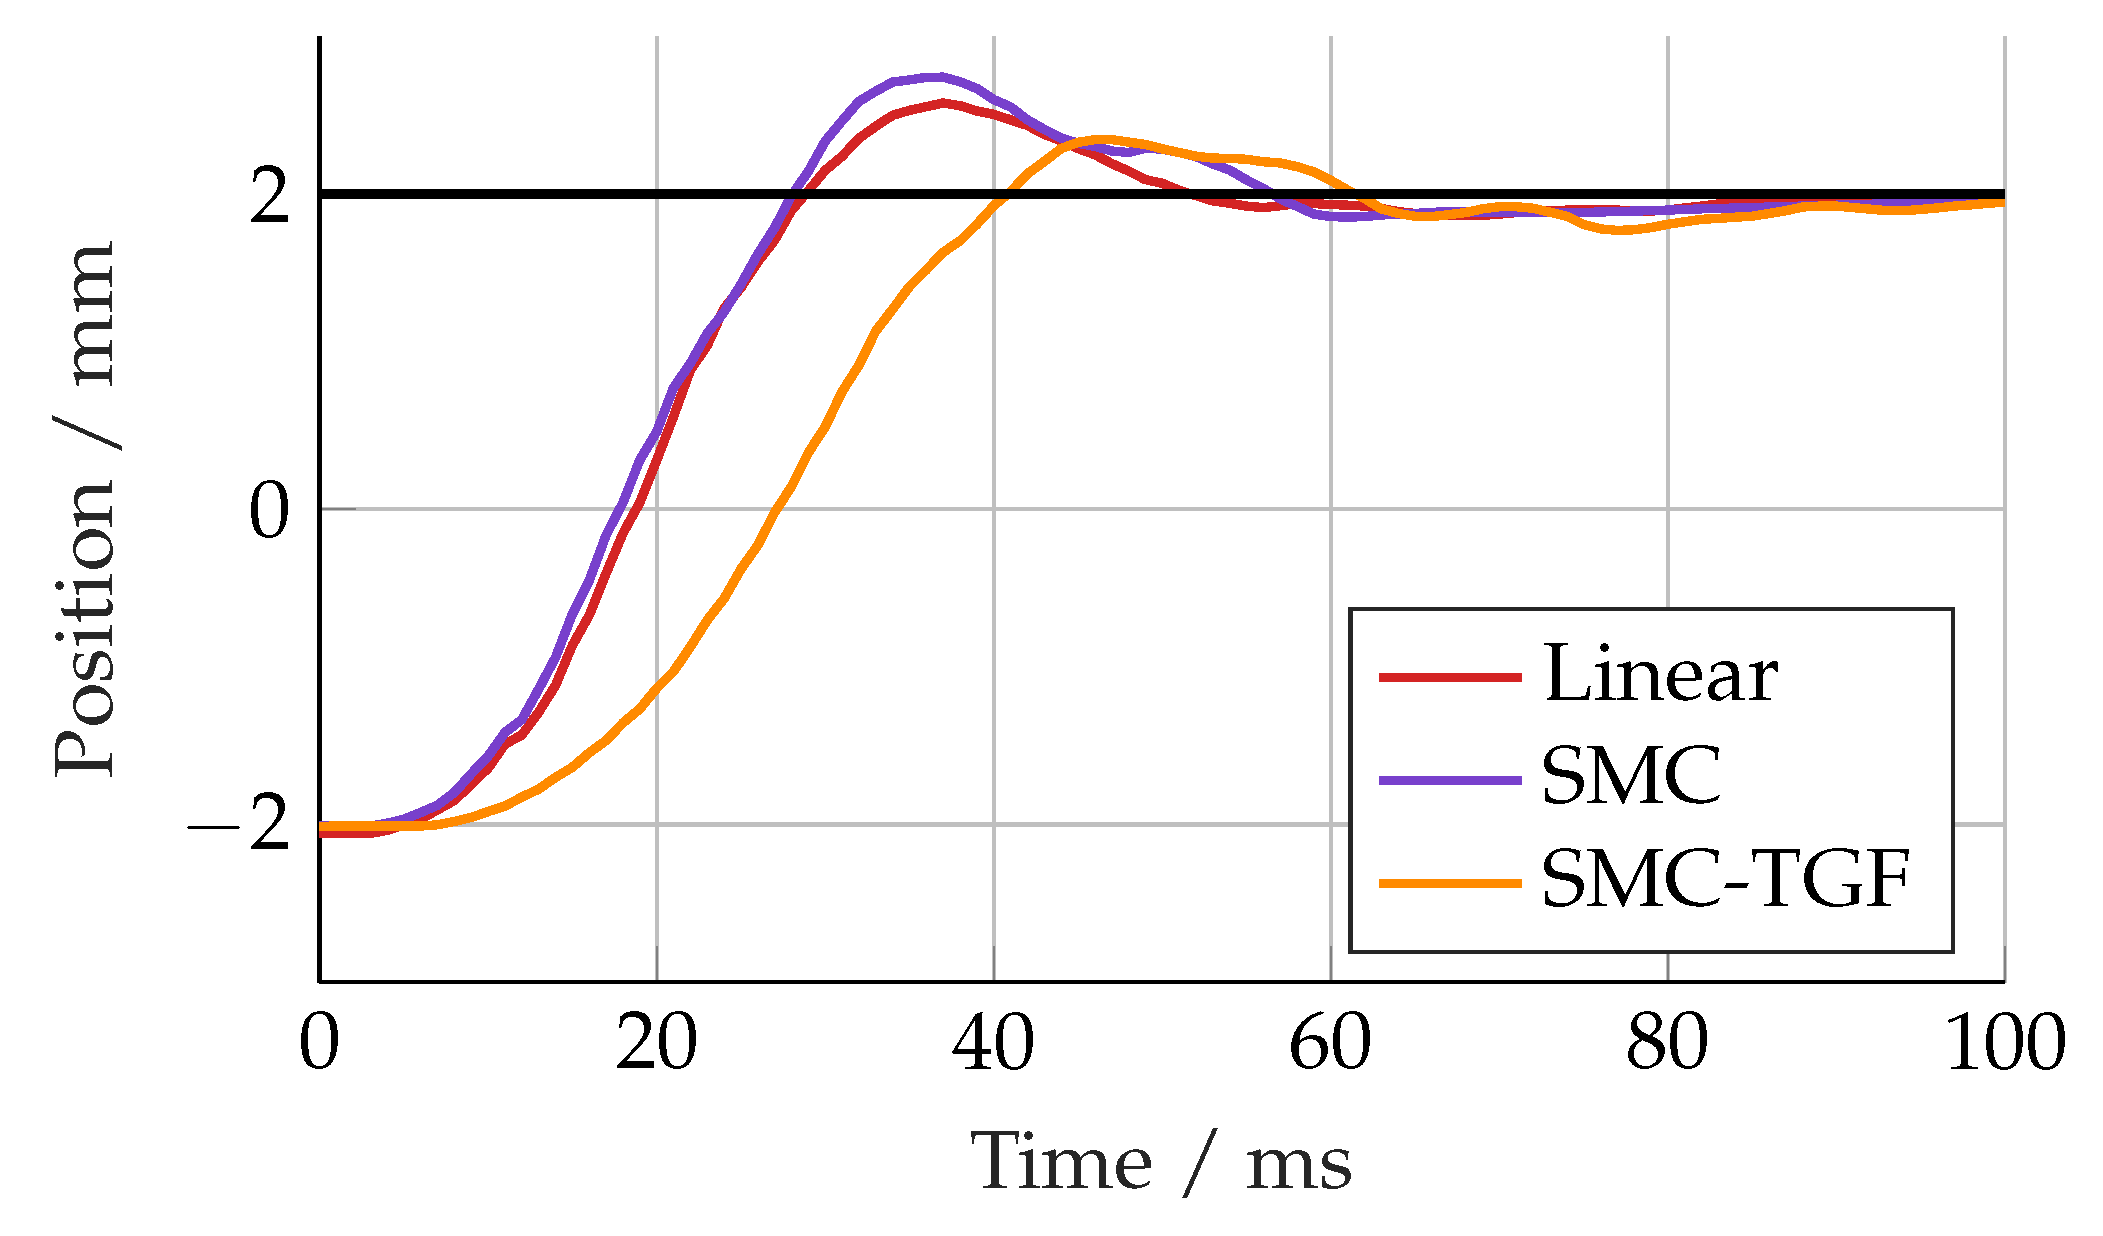
It was found experimentally that the switching component of the filter produced significant chattering in the response of the system. To rectify this, a linear filter with a cutoff frequency of 200 Hz was placed in series with the trajectory filter. This effectively removed the chattering, but the response was slower than the controller without any trajectory filtering, as shown in
Figure 28.
8. Conclusions
This paper presented the application of a varying boundary layer sliding mode controller to a novel integrated hydraulic actuator known as the ISA. The controller was chosen for its robustness to parametric uncertainty and disturbances and its varying boundary layer for dealing with the typical issue of chattering without adding any extra tuning parameters. It has been shown to have a relatively simple tuning process, with variables B and G based on parametric uncertainty that can be determined based on engineering judgment, based on experimental trials, though its value is not at all critical, and a single dominant tuning parameter that can be chosen to give a trade-off between performance and robustness.
The controller was shown to outperform a high-performance linear proportional plus acceleration feedback controller, particularly in terms of tracking performance, with low phase lag at high frequencies. The SMC also exhibited superior robustness to variations in the load mass and fluid bulk modulus.
The controller was found to exhibit undesirable behaviour for some unachievable trajectories. A velocity-, acceleration- and jerk-constrained trajectory filter was shown to effectively remove this behaviour, at the cost of a slightly slower response and some chattering for other types of trajectories. Experimentally, a linear filter was also required to remove the chattering effect.
The plant model developed includes both actuator and valve dynamics and a nonlinear spool flow characteristic. The experimental response of the system exhibited additional unmodelled dynamics due to compliance in the connections between the actuator and the load or test rig. Nevertheless, the model proved adequate for controller development.
The ISA has a novel low-leakage servovalve pilot stage, a consequence of which is that the valve has a relatively low bandwidth. Valve dynamics were neglected during the control design. This was found to limit performance at higher actuator-load natural frequencies, and exploring methods for including valve response in the design may help mitigate this issue.
The key objective of this work was to develop and investigate an actuator motion control method which is insensitive to load characteristics. Thus, it was not simply about designing a controller which gave a good closed-loop position response with known, fixed-load dynamics. As has been shown, a linear proportional controller with acceleration feedback can be tuned to give quite good performance when the load dynamics are fixed. It is critical that an actuator can be used in a new system with unmodelled or varying load characteristics without requiring significant time and expertise to retune or redesign the controller. This is usually achieved with electrical actuation using auto-tuning algorithms, but such algorithms have not been successfully developed for electrohydraulic actuators. Hence, despite their superior power density, application of electrohydraulic actuation to (for example) new robotic systems requires significant control design effort. The ISA used in this research, through its hardware integration of cylinder, valve, sensors and electronics, overcomes some of the challenges in applying electrohydraulic actuation. With the actuator and sensor characteristics well defined, it is only the load which is unknown, and the development of load-insensitive control becomes tractable. With just one major tuning parameter and good robustness to load variations demonstrated, the developed SMC is a promising step towards enabling ‘plug-and-play’ motion control for integrated high-performance electrohydraulic actuators, such as the ISA used in this work.
Author Contributions
Conceptualization, D.W., I.G. and A.P.; methodology, D.W., I.G. and A.P.; software, D.W.; validation, D.W. and A.P.; formal analysis, D.W. and A.P.; investigation, D.W.; resources, D.W., I.G. and A.P.; data curation, D.W.; writing—original draft preparation, D.W., I.G. and A.P.; writing—review and editing, A.P.; visualization, D.W.; supervision, I.G. and A.P.; project administration, D.W., I.G. and A.P.; funding acquisition, A.P. All authors have read and agreed to the published version of the manuscript.
Funding
This research was funded by the Engineering and Physical Sciences Research Council (EP/R513155/1), with in-kind support from Moog Controls Ltd which is gratefully acknowledged.
Data Availability Statement
The dataset is available on request from the authors.
Conflicts of Interest
The authors declare no conflicts of interest.
Abbreviations
The following abbreviations are used in this manuscript:
| ADC | Analog-to-digital converter |
| IMU | Inertial measurement unit |
| ISA | Integrated Smart Actuator |
| SMC | Sliding mode control |
References
- Clarke, D.; Hinton, C. Adaptive Control of Materials-testing Machines. Automatica 1997, 33, 1119–1131. [Google Scholar] [CrossRef]
- Lee, S.J.; Tsao, T.C. Nonlinear backstepping control of an electrohydraulic material testing system. Proc. Am. Control Conf. 2002, 6, 4825–4830. [Google Scholar] [CrossRef]
- Axelson, S.; Kumar, K.S. Dynamic feedback linearization of a hydraulic valve-actuator combination. In Proceedings of the American Control Conference, Atlanta, GA, USA, 15–17 June 1988; Volume 88, pp. 2202–2203. [Google Scholar] [CrossRef]
- Jelali, M.; Kroll, A. Hydraulic Servo-Systems; Advances in Industrial Control; Springer: London, UK, 2003; p. 355. [Google Scholar] [CrossRef]
- Ursu, I.; Ursu, F.; Popescu, F. Backstepping design for controlling electrohydraulic servos. J. Frankl. Inst. 2006, 343, 94–110. [Google Scholar] [CrossRef]
- Van Schothorst, G. Modelling of Long-Stroke Hydraulic Servo-Systems. Ph.D. Thesis, Delft University of Technology, Delft, The Netherlands, 1997. [Google Scholar]
- Kock, F.; Ferrari, C. Flatness-Based High Frequency Control of a Hydraulic Actuator. J. Dyn. Syst. Meas. Control 2012, 134, 021003. [Google Scholar] [CrossRef]
- Plummer, A.R. A Detailed Dynamic Model of a Six-Axis Shaking Table. J. Earthq. Eng. 2008, 12, 1–42. [Google Scholar] [CrossRef]
- Moog. Integrated Smart Actuator High Dynamic Performance and Compact Design for Mobile Robotic Hydraulic Applications Integrated Smart Actuator. 2017. Available online: https://www.moog.com/content/dam/moog/literature/ICD/Moog-Microhydraulics-Integrated-Smart-Actuator-Datsheet-en.pdf (accessed on 17 August 2025).
- Barasuol, V.; Morgan, R.; Sangiah, D.; Caldwell, D.G.; Frigerio, M.; Medrano-Cerda, G.A.; Villarreal-Magaña, O.A.; Semini, C.; Baker, M. Highly-Integrated Hydraulic Smart Actuators and Smart Manifolds for High-Bandwidth Force Control. Front. Robot. AI 2018, 5, 51. [Google Scholar] [CrossRef] [PubMed]
- Ghazali, R.; Sam, Y.M.; Rahmat, M.F.; Hashim, A.W.I.M.; Zulfatman. Position tracking control of an electro-hydraulic servo system using sliding mode control. In Proceedings of the Proceeding, 2010 IEEE Student Conference on Research and Development-Engineering: Innovation and Beyond, SCOReD 2010, Kuala Lumpur, Malaysia, 13–14 December 2010; pp. 240–245. [Google Scholar] [CrossRef]
- Chen, H.M.; Renn, J.C.; Su, J.P. Sliding mode control with varying boundary layers for an electro-hydraulic position servo system. Int. J. Adv. Manuf. Technol. 2005, 26, 117–123. [Google Scholar] [CrossRef]
- Hwang, C.L.; Lan, C.H. The position control of electrohydraulic servomechanism via a novel variable structure control. Mechatronics 1994, 4, 369–391. [Google Scholar] [CrossRef]
- Hwang, C.L. Sliding mode control using time-varying switching gain and boundary layer for electrohydraulic position and differential pressure control. IEEE Proc. Control. Theory Appl. 1996, 143, 325–332. [Google Scholar] [CrossRef]
- Kolsi Gdoura, E.; Feki, M.; Derbel, N. Sliding mode control of a hydraulic servo system position using adaptive sliding surface and adaptive gain. Int. J. Model. Identif. Control 2015, 23, 248–259. [Google Scholar] [CrossRef]
- Fung, R.F.; Yang, R.T. Application of VSC in position control of a nonlinear electrohydraulic servo system. Comput. Struct. 1998, 66, 365–372. [Google Scholar] [CrossRef]
- Feng, H.; Song, Q.; Ma, S.; Ma, W.; Yin, C.; Cao, D.; Yu, H. A new adaptive sliding mode controller based on the RBF neural network for an electro-hydraulic servo system. ISA Trans. 2022, 129, 472–484. [Google Scholar] [CrossRef] [PubMed]
- Estrada, M.A.; Ruderman, M.; Texis-Loaiza, O.; Fridman, L. Hydraulic actuator control based on continuous higher order sliding modes. Control Eng. Pract. 2025, 156, 106218. [Google Scholar] [CrossRef]
- Liu, Q.; Yang, C.; Yan, J.; Zuo, Q.; Cheng, Y.; Li, G. Optimization strategies for impact reduction in large-scale high-speed forming equipment. Adv. Mech. Eng. 2025, 17, 16878132251346303. [Google Scholar] [CrossRef]
- Zhu, R.; Yang, Q.; Liu, Y.; Dong, R.; Jiang, C.; Song, J. Sliding mode robust control of hydraulic drive unit of hydraulic quadruped robot. Int. J. Control Autom. Syst. 2022, 20, 1336–1350. [Google Scholar] [CrossRef]
- Cunha, T.B.; Semini, C.; Guglielmino, E.; De Negri, V.J.; Yang, Y.; Caldwell, D.G. Gain Scheduling Control for the Hydraulic Actuation of the HyQ Robot Leg. ABCM Symp. Ser. Mechatronics 2010, 4, 673–682. [Google Scholar]
- Piché, R.; Pohjolainen, S.; Virvalo, T. Design of Robust Controllers for Position Servos Using H -Infinity Theory. Proc. Inst. Mech. Eng. Part I J. Syst. Control Eng. 1991, 205, 299–306. [Google Scholar] [CrossRef]
- Plummer, A.R.; Vaughan, N.D. Robust adaptive control for hydraulic servosystems. ASME J. Dynam. Syst. Meas. Contr. 1996, 118, 237–244. [Google Scholar] [CrossRef]
- Choux, M.; Hovland, G. Adaptive Backstepping Control of Nonlinear Hydraulic-Mechanical System Including Valve Dynamics. Identif. Control 2010, 31, 35–44. [Google Scholar] [CrossRef]
- Yang, G.; Yao, J. Nonlinear adaptive output feedback robust control of hydraulic actuators with largely unknown modeling uncertainties. Appl. Math. Model. 2020, 79, 824–842. [Google Scholar] [CrossRef]
- Wilson, D. Robust Control of and Integrated Hydraulic Actuator. Ph.D. Thesis, Centre for Power Transmission and Motion Control, Bath, UK, 2024. [Google Scholar]
- Slotine, J.; Li, W. Applied Nonlinear Control; Prentice Hall: Hoboken, NJ, USA, 1991; p. 459. [Google Scholar]
- Shtessel, Y.; Edwards, C.; Fridman, L. Sliding Mode Control and Observation, Series: Control Engineering; Springer: Berlin/Heidelberg, Germany, 2016; Volume 10, p. 356. [Google Scholar] [CrossRef]
- Zanasi, R.; Morselli, R. Third order trajectory generator satisfying velocity, acceleration and jerk constraints. In Proceedings of the IEEE Conference on Control Applications-Proceedings, Glasgow, UK, 18–20 September 2002; Volume 2, pp. 1165–1170. [Google Scholar] [CrossRef]
Figure 1.
Integrated smart actuator [
9].
Figure 1.
Integrated smart actuator [
9].
Figure 2.
ISA hydraulic schematic showing the pilot-operated valve, actuator, load mass and 220 bar chamber relief valves. P and T are the external pressure and return ports, respectively. The 4 pressure sensors, load cell and encoder are also shown.
Figure 2.
ISA hydraulic schematic showing the pilot-operated valve, actuator, load mass and 220 bar chamber relief valves. P and T are the external pressure and return ports, respectively. The 4 pressure sensors, load cell and encoder are also shown.
Figure 3.
Block diagram of full model. Solid lines are physical quantities, and dashed lines are measured signals.
Figure 3.
Block diagram of full model. Solid lines are physical quantities, and dashed lines are measured signals.
Figure 4.
Cross-section of valve spool, showing the supply, return and control ports and the land flows between them.
Figure 4.
Cross-section of valve spool, showing the supply, return and control ports and the land flows between them.
Figure 5.
Proportional feedback controller plus acceleration. DGC is the dual gain compensation.
Figure 5.
Proportional feedback controller plus acceleration. DGC is the dual gain compensation.
Figure 6.
Simulated step response for varying values.
Figure 6.
Simulated step response for varying values.
Figure 7.
Sliding mode controller step response with varying lambda values.
Figure 7.
Sliding mode controller step response with varying lambda values.
Figure 8.
Simulated step response for linear controller and SMC.
Figure 8.
Simulated step response for linear controller and SMC.
Figure 9.
Simulated frequency responses using stepped sine wave tests.
Figure 9.
Simulated frequency responses using stepped sine wave tests.
Figure 10.
Linear controller, with mass increased from nominal by given factor.
Figure 10.
Linear controller, with mass increased from nominal by given factor.
Figure 11.
SMC, with mass increased from nominal by given factor.
Figure 11.
SMC, with mass increased from nominal by given factor.
Figure 12.
Step response with changing bulk modulus. Low = 50% of nominal; high = 150%.
Figure 12.
Step response with changing bulk modulus. Low = 50% of nominal; high = 150%.
Figure 13.
Overhead view of the test rig, excluding the hydraulic powerpack.
Figure 13.
Overhead view of the test rig, excluding the hydraulic powerpack.
Figure 14.
Hydraulic circuit schematic diagram. The ISA valve is a simplified representation showing only the flow control component (the spool) and not the first stage.
Figure 14.
Hydraulic circuit schematic diagram. The ISA valve is a simplified representation showing only the flow control component (the spool) and not the first stage.
Figure 15.
ISA control architecture.
Figure 15.
ISA control architecture.
Figure 16.
Linear controller and SMC simulation and experimental step responses.
Figure 16.
Linear controller and SMC simulation and experimental step responses.
Figure 17.
Force response to position step demand in simulation and experiment (SMC).
Figure 17.
Force response to position step demand in simulation and experiment (SMC).
Figure 18.
Theoretical and experimentally calculated actuator stiffness versus piston position.
Figure 18.
Theoretical and experimentally calculated actuator stiffness versus piston position.
Figure 19.
Experimental frequency responses, 1 mm amplitude.
Figure 19.
Experimental frequency responses, 1 mm amplitude.
Figure 20.
Highlight of 1 mm, 10 Hz sine wave demand.
Figure 20.
Highlight of 1 mm, 10 Hz sine wave demand.
Figure 21.
Linear step responses with increasing load mass from nominal 77 kg.
Figure 21.
Linear step responses with increasing load mass from nominal 77 kg.
Figure 22.
SMC step responses with increasing load mass from nominal 77 kg.
Figure 22.
SMC step responses with increasing load mass from nominal 77 kg.
Figure 23.
SMC’s simulated 30 mm amplitude step response.
Figure 23.
SMC’s simulated 30 mm amplitude step response.
Figure 24.
Block diagram of the linear filter that allows direct calculation of the position demand and its derivatives.
Figure 24.
Block diagram of the linear filter that allows direct calculation of the position demand and its derivatives.
Figure 25.
Simulated position, velocity and acceleration tracking with 10 Hz linear demand filter.
Figure 25.
Simulated position, velocity and acceleration tracking with 10 Hz linear demand filter.
Figure 26.
Third-order constrained trajectory generator proposed by Zanasi and Morselli [
29].
and
are the maximum and minimum velocity, respectively.
and
are the maximum and minimum acceleration, respectively.
is the maximum absolute jerk.
Figure 26.
Third-order constrained trajectory generator proposed by Zanasi and Morselli [
29].
and
are the maximum and minimum velocity, respectively.
and
are the maximum and minimum acceleration, respectively.
is the maximum absolute jerk.
Figure 27.
Simulated position, velocity and acceleration tracking with constrained trajectory filter.
Figure 27.
Simulated position, velocity and acceleration tracking with constrained trajectory filter.
Figure 28.
Experimental step response of linear controller and SMC with constrained trajectory filter and series linear filter.
Figure 28.
Experimental step response of linear controller and SMC with constrained trajectory filter and series linear filter.
Table 1.
ISA specifications.
Table 1.
ISA specifications.
| Property | Value | Units |
|---|
| Stroke | 100 | mm |
| Closed length (between rod ends) | 295 | mm |
| Piston diameter | 21.5 | mm |
| Rod diameter | 12 | mm |
| Supply pressure | 200 | bar |
| Maximum force extension | 7260 | N |
| Maximum force retraction | 5000 | N |
| Nominal spool flow rate | 7 | lpm |
| Dry weight | 1.6 | kg |
Table 2.
Uncertainty components of B.
Table 2.
Uncertainty components of B.
| Property | Error/% |
|---|
| Bulk Modulus | 20 |
| Spool Areas | 10 |
| Load Mass | 10 |
| Pressure Measurement | 2 |
| Total (B) | 48 |
Table 3.
Simulation performance metrics.
Table 3.
Simulation performance metrics.
| Metric | Linear | SMC |
|---|
| Rise Time (ms) | 13 | 16 |
| Settling Time (ms) | 43 | 31 |
| Overshoot (%) | 5 | 1 |
| Bandwidth (1 mm) (Hz) | 28 | 44 |
Table 4.
ISA sensors.
| Quantity | Sensor | Range | Resolution | Sample Rate |
|---|
| Piston Position | Absolute Encoder | 100 mm | 1 m | 1 kHz |
| Spool position | Hall effect | mm | 12-bit | 10 kHz |
| Force | Strain Gauge | −5000 to 7260 N | 12-bit | 10 kHz |
| Pressures | Strain Gauge | 0 to 200 bar | 12-bit | 10 kHz |
| Torque Motor Current | Current | mA | 12-bit | 10 kHz |
Table 5.
Experimental performance metrics.
Table 5.
Experimental performance metrics.
| Metric | Linear | SMC |
|---|
| Rise Time (ms) | 16 | 16 |
| Settling Time (ms) | 80 | 75 |
| Overshoot (%) | 14 | 19 |
| Bandwidth (1 mm) (Hz) | 19 | 38 |
Table 6.
Trajectory generation acceleration limits.
Table 6.
Trajectory generation acceleration limits.
| Direction | Minimum | Maximum |
|---|
| Extension | | |
| Retraction | | |
| Disclaimer/Publisher’s Note: The statements, opinions and data contained in all publications are solely those of the individual author(s) and contributor(s) and not of MDPI and/or the editor(s). MDPI and/or the editor(s) disclaim responsibility for any injury to people or property resulting from any ideas, methods, instructions or products referred to in the content. |
© 2025 by the authors. Licensee MDPI, Basel, Switzerland. This article is an open access article distributed under the terms and conditions of the Creative Commons Attribution (CC BY) license (https://creativecommons.org/licenses/by/4.0/).
