1. Introduction
Research into biomimetic robots, especially soft robots made from flexible materials, has gained significant momentum in recent years [
1]. In wearable robotics, reconfigurable exomuscle systems with adjustable parameters have been developed to assist with movements such as hip flexion and ankle plantarflexion [
2]. These systems draw from multiple disciplines, including bionics, materials science, mechanical and electronic engineering, and control theory, positioning this field of mechanical bionics and biomanufacturing. The continuous advancement of these disciplines has made the field one of the fastest-growing areas of research [
3].
Flexible robots, with their highly deformable materials and structural characteristics [
4], offer near-infinite compared to rigid robots. This adaptability forms a more reliable foundation for them to interact with and adapt to dynamic natural environments.
Soft robots, as a subclass of flexible robots [
5], are particularly well-suited for specific applications due to their variable pose structures [
6]. For example, flexible robots designed for underwater operations can mimic the movement characteristics of marine organisms more effectively, enabling them to perform more complex underwater tasks. In factory settings, flexible grippers are better equipped to handle fragile objects, reducing the risk of damage during the gripping process.
Compared to mechanical, electrical, and hydraulic systems, pneumatic technology offers advantages including easy accessibility, cleanliness, safety, stability, and rapid response times [
7]. Pneumatic systems have significant potential for underwater applications, particularly in flexible robotic arms and grippers [
8].
In flexible robotic arm design, Gong et al. [
9] developed a soft robot arm and introduced a kinematic model with angular corrections to accurately predict three-dimensional motion. Their experiments showed that the soft robot arm has excellent hydrodynamic performance, with minimal force and torque generated during underwater motion, reducing the effects of inertia. Similarly, Kurumaya et al. [
10] designed a cylindrical flexible wrist joint for precision manipulation in deep-sea environments, using pneumatics under normal atmospheric conditions and hydraulics for testing under high hydrostatic pressures.
In the realm of flexible gripper design, Sun et al. [
11] created a classic corrugated fluid-driven soft bending finger. Their studies showed that external water pressure causes greater bending of the actuator under varying pressures (1 atm to 15 MPa). Similarly, Bhat et al. [
12] developed a human finger-inspired soft pneumatic actuator for gripping applications, demonstrating excellent structural compliance and adaptability. The bending angle increased in proportion to the environmental pressure. Jiang et al. [
13] drew inspiration from the claw shape of the Boston lobster, designing seven types of finger surface structures fabricated from soft silicone. Their experiments, which involved over 14,000 grasping attempts on land (71.4%) and underwater (28.6%), confirmed that the bio-inspired design could increase grasping success rates by up to 18.2%.
A common challenge in single flexible mechanisms is insufficient rigidity. Combining rigidity with flexibility helps preserve the deformable properties of the mechanism while adding structural support. Capalbo et al. [
14] proposed a soft robotic gripper with a neutrally buoyant particle gripping pad, which integrates a neutrally buoyant interference pad and a passive flexible support structure to enable safe gripping without damaging fragile objects. Gong et al. [
15,
16,
17] designed a three-degree-of-freedom (3-DoF) soft robotic arm for fine grasping in shallow water, allowing three-dimensional spatial motion through reverse bending and extension. This robot can perform dexterous grasping in shallow water (0–50 m), replacing human divers in seafood harvesting without causing damage. Wu et al. [
18] designed a soft claw inspired by the luminous sucker octopus, which is capable of grasping irregular or moving objects. Licht et al. [
19,
20] explored a cage grasp, where the wrist is rigid, but the fingers consist of latex balloons filled with a mixture of freshwater and ~200 µm glass beads. Galloway et al. [
21] designed a gripper with a rigid claw wrist, hydraulically actuated flexible interlaced claw fingers, and sponge-covered surfaces, tested for sampling specimens such as corals. Sinatra et al. [
22] developed an ultra-flexible soft robotic actuator with a rigid claw wrist and hydraulically actuated interlaced claws, covered with nanomaterials. However, these designs are complex and difficult to manufacture.
The control methods for flexible mechanisms are also crucial. Shen et al. [
23] developed a wrist with actuation and sensing functions, controlled by fluids, inspired by the origami process. This design allows for excellent load output and robust, accurate sensing without the need for external cladding, simplifying the fabrication process for complex tasks in harsh environments. Xavier et al. [
24] proposed a method for selecting pneumatic soft robot system parameters, considering the required closed-loop pressure response, and evaluated PI and switching controllers with hysteresis. Joshi et al. [
25] introduced a normalized model for pressure dynamics in soft actuators, quantifying the relationship between design parameters and dynamic performance metrics such as rise time, fall time, and actuation frequency. However, these control methods often face challenges, including high control complexity and poor adaptability, and further research is required to develop more accurate, faster, and universally applicable control methods.
Currently, many researchers use fluid-driven methods to actuate soft robots, with pneumatic technology being a major branch of this field. Many scholars focus on the structural design, actuation mechanisms, and control strategies for pneumatic flexible robots. Pneumatic soft actuators are no longer limited to silicone elastomers; fabric-reinforced composites, hydrogels, and shape-memory polymers (SMPs) have become increasingly important. Each material class has prompted the development of its own preferred control schemes. For instance, fabric-reinforced actuators often rely on sliding-mode or adaptive controllers due to their highly nonlinear and anisotropic behavior [
26]. Hydrogels exhibit pronounced viscoelasticity and slow response times, requiring classical PID or fractional-order PID control for steady-state accuracy [
27,
28]. SMP actuators, known for large hysteresis and slow shape recovery, are typically controlled using open-loop heating or low-frequency PID regulation to achieve repeatable but not high-speed morphing [
29].
While these material-specific strategies are effective, they can be complex to implement or offer limited dynamic performance. In this study, we adopt a fuzzy PID controller embedded within a conventional PID framework. This approach dynamically adjusts the control gains, enhancing both responsiveness and accuracy, without the modeling burden or computational overhead of advanced nonlinear controllers. The resulting system is well-suited to embedded, real-time pneumatic systems.
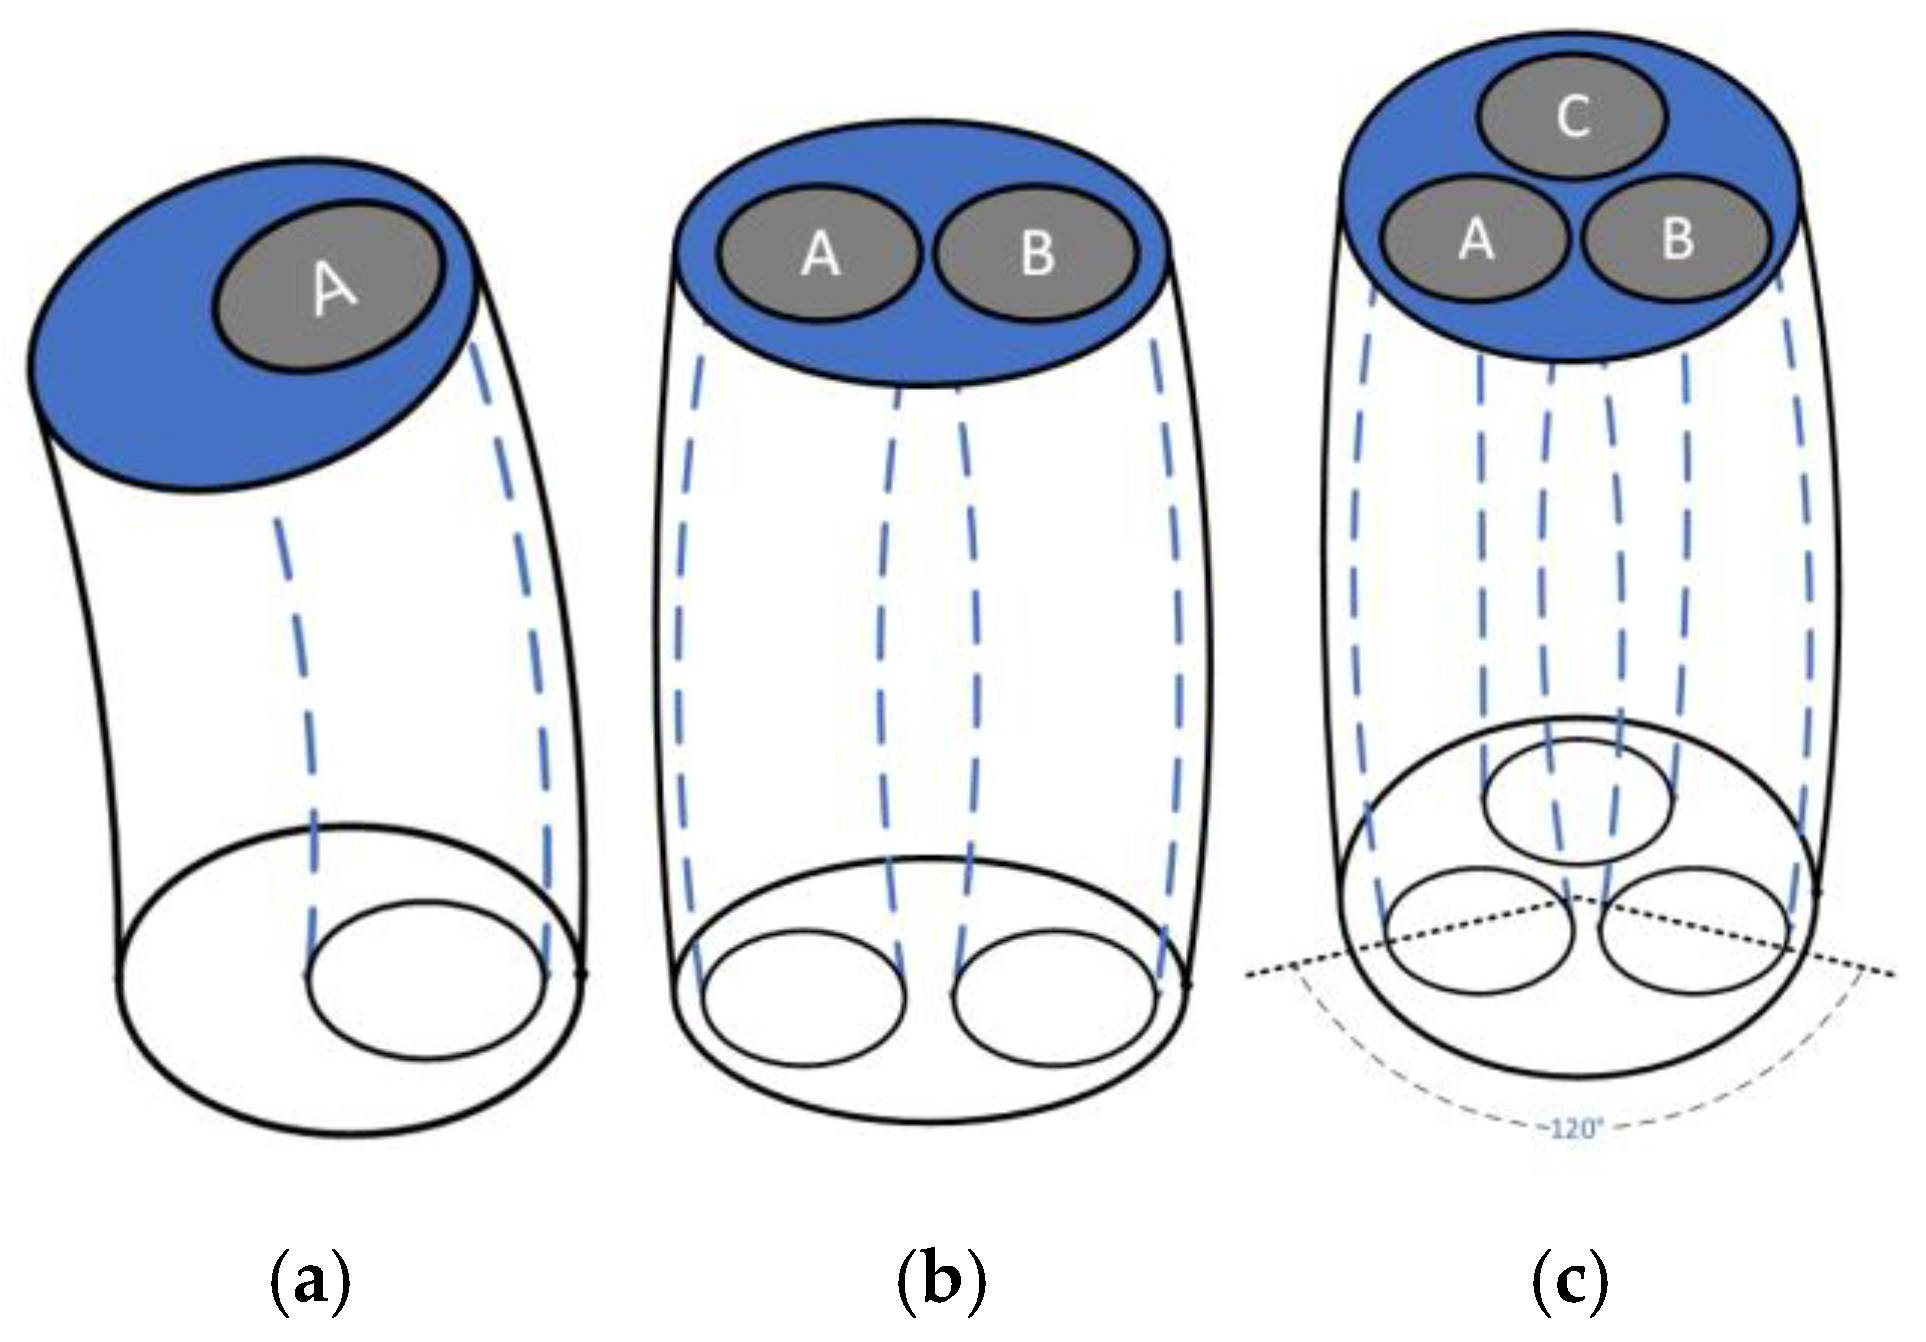
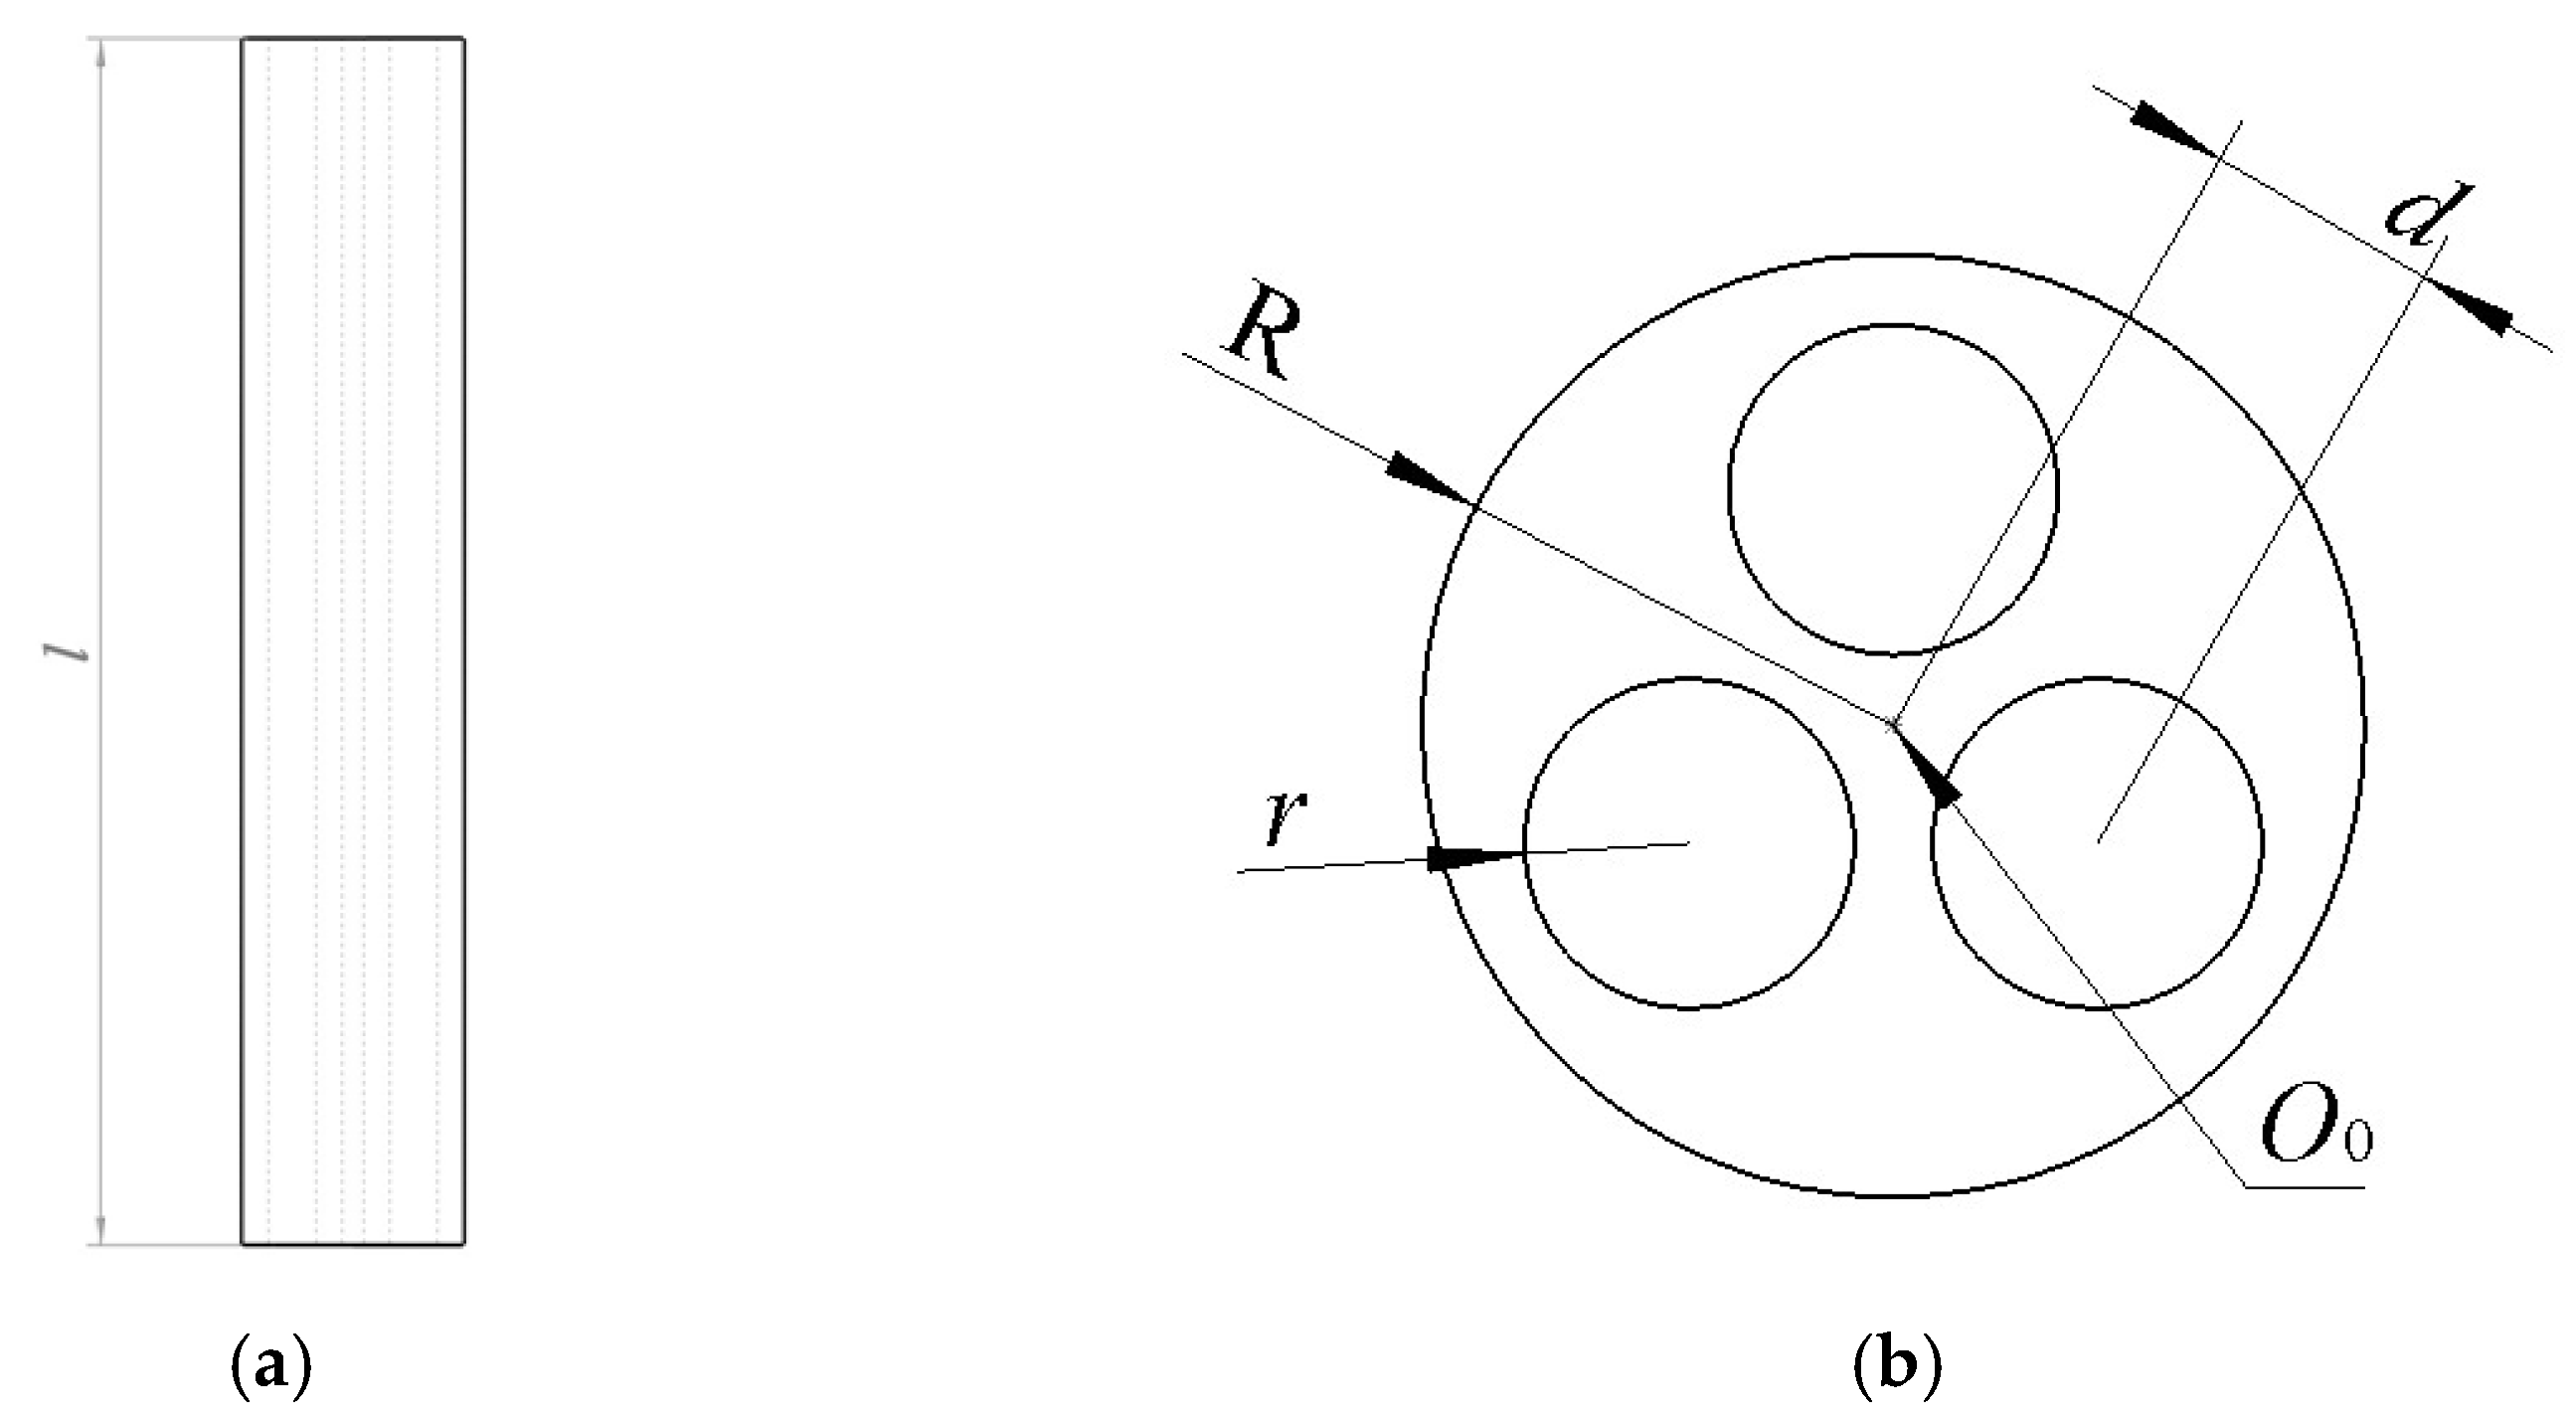
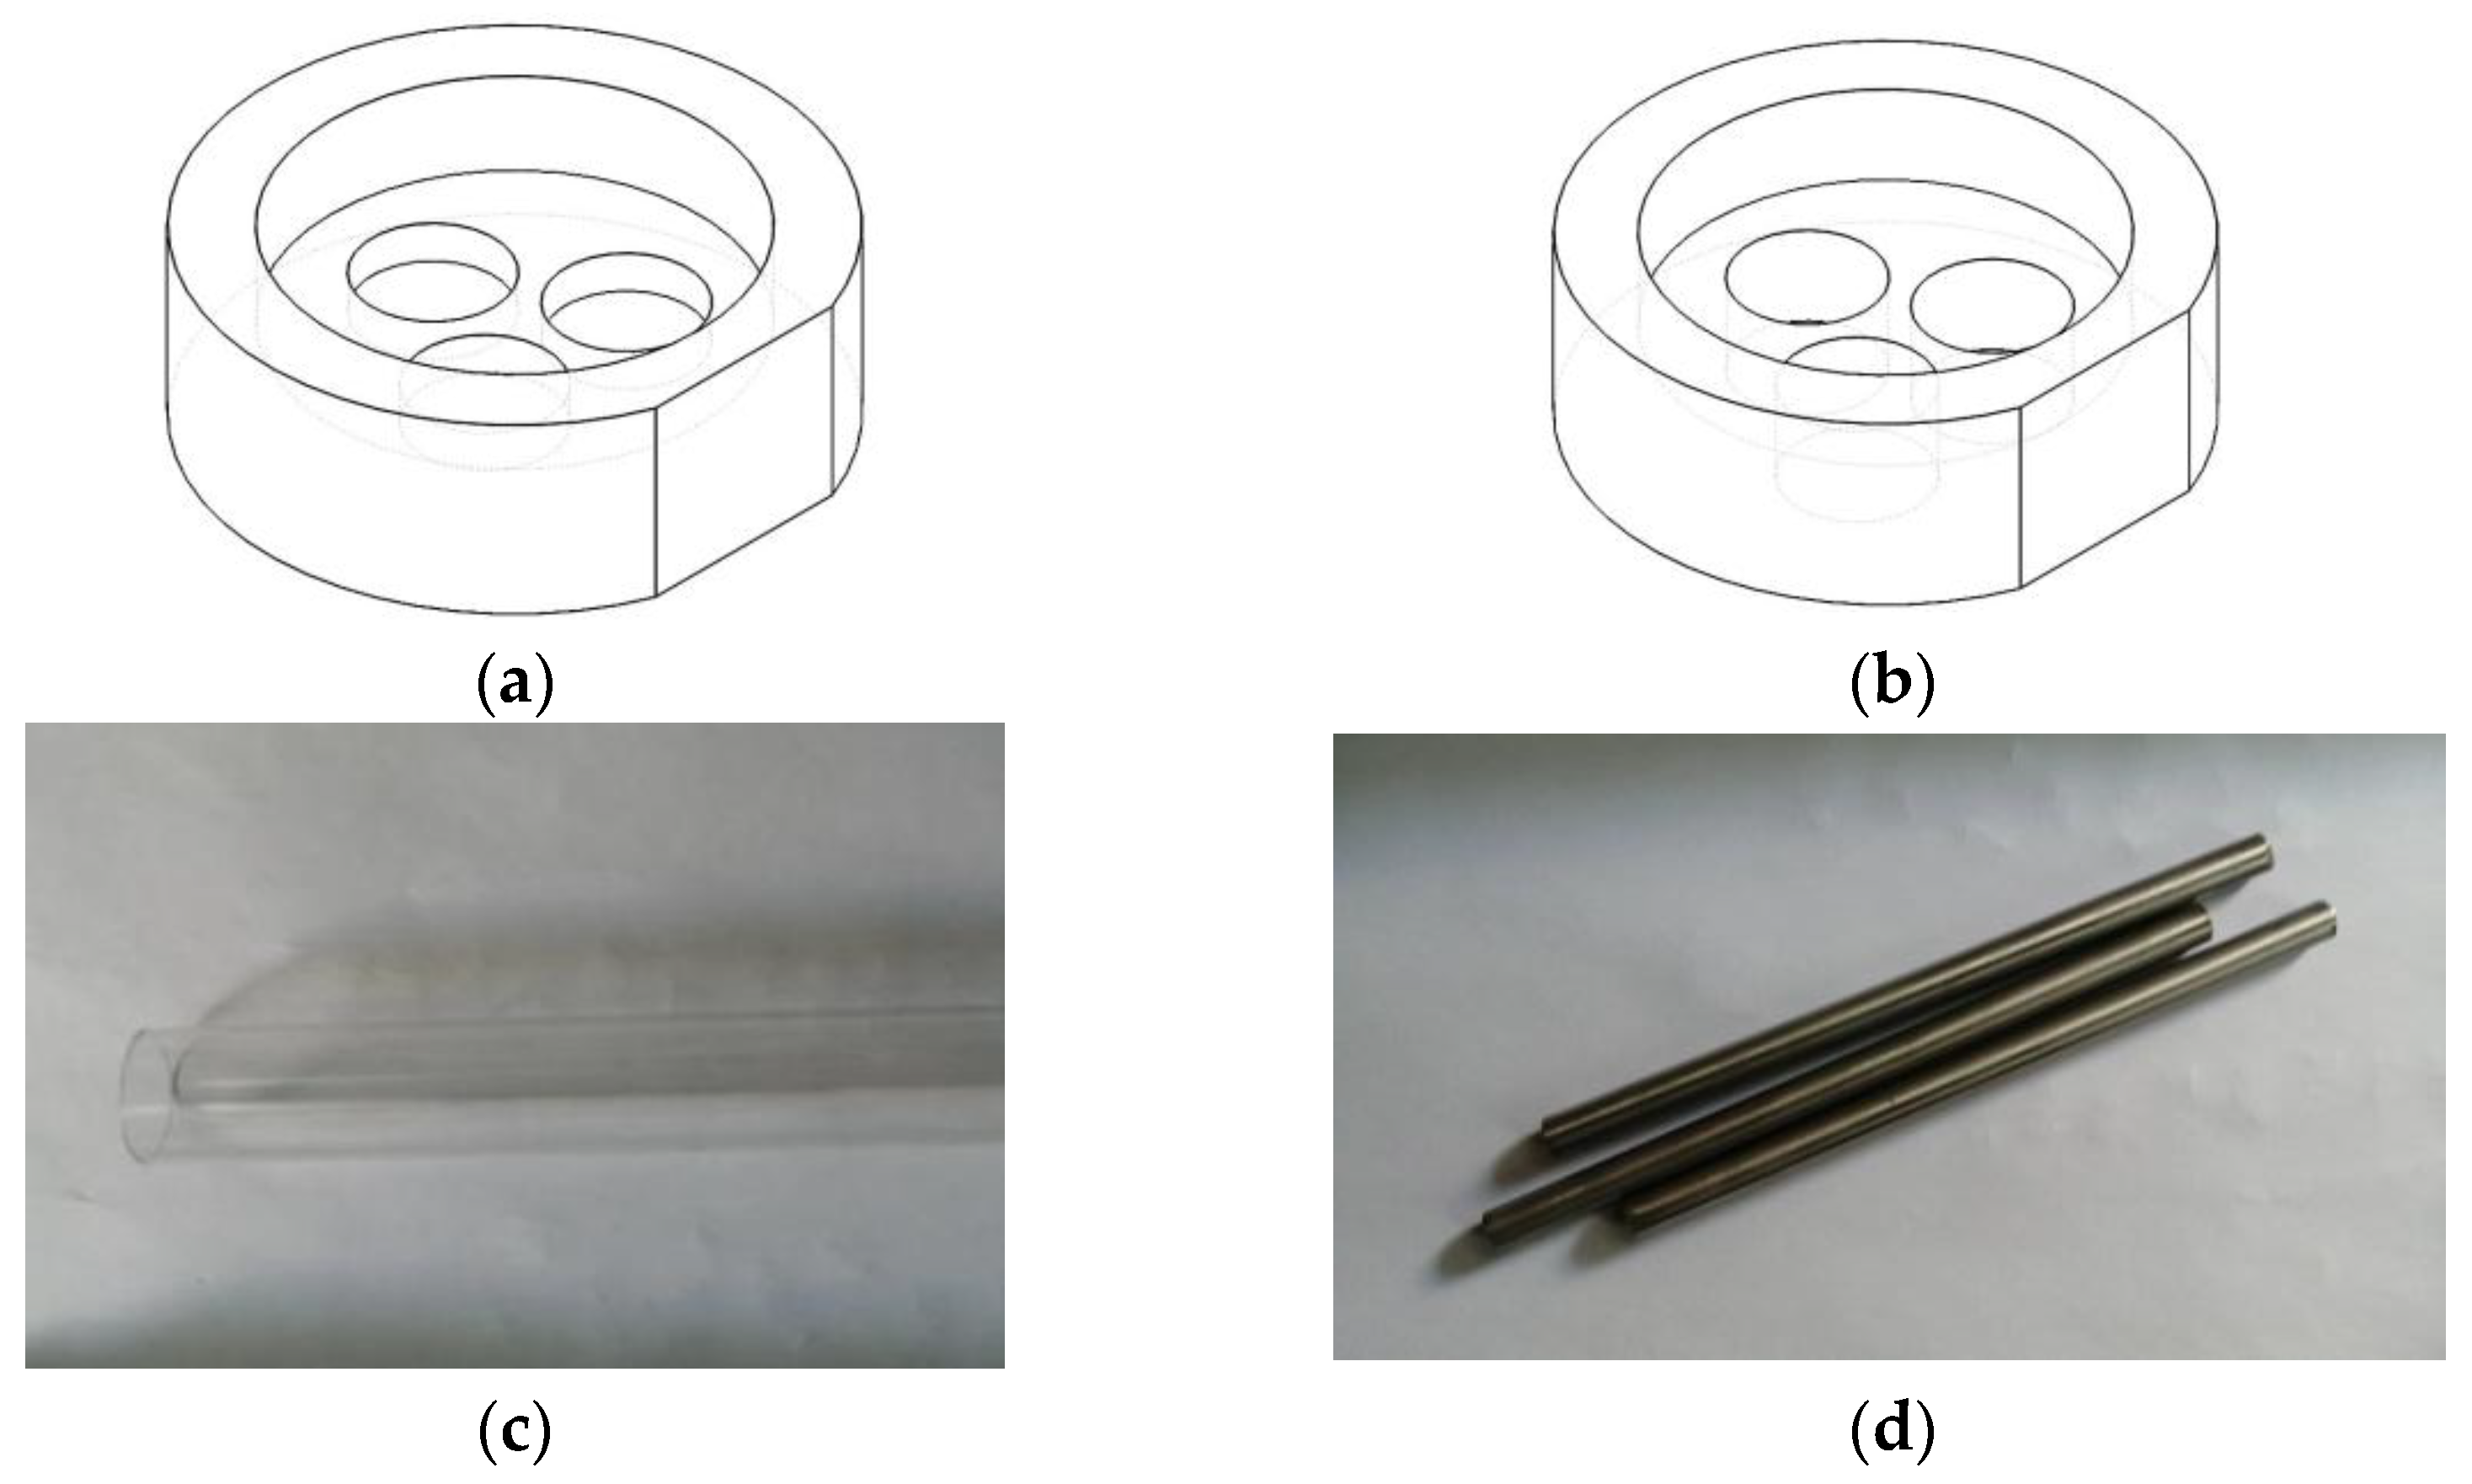
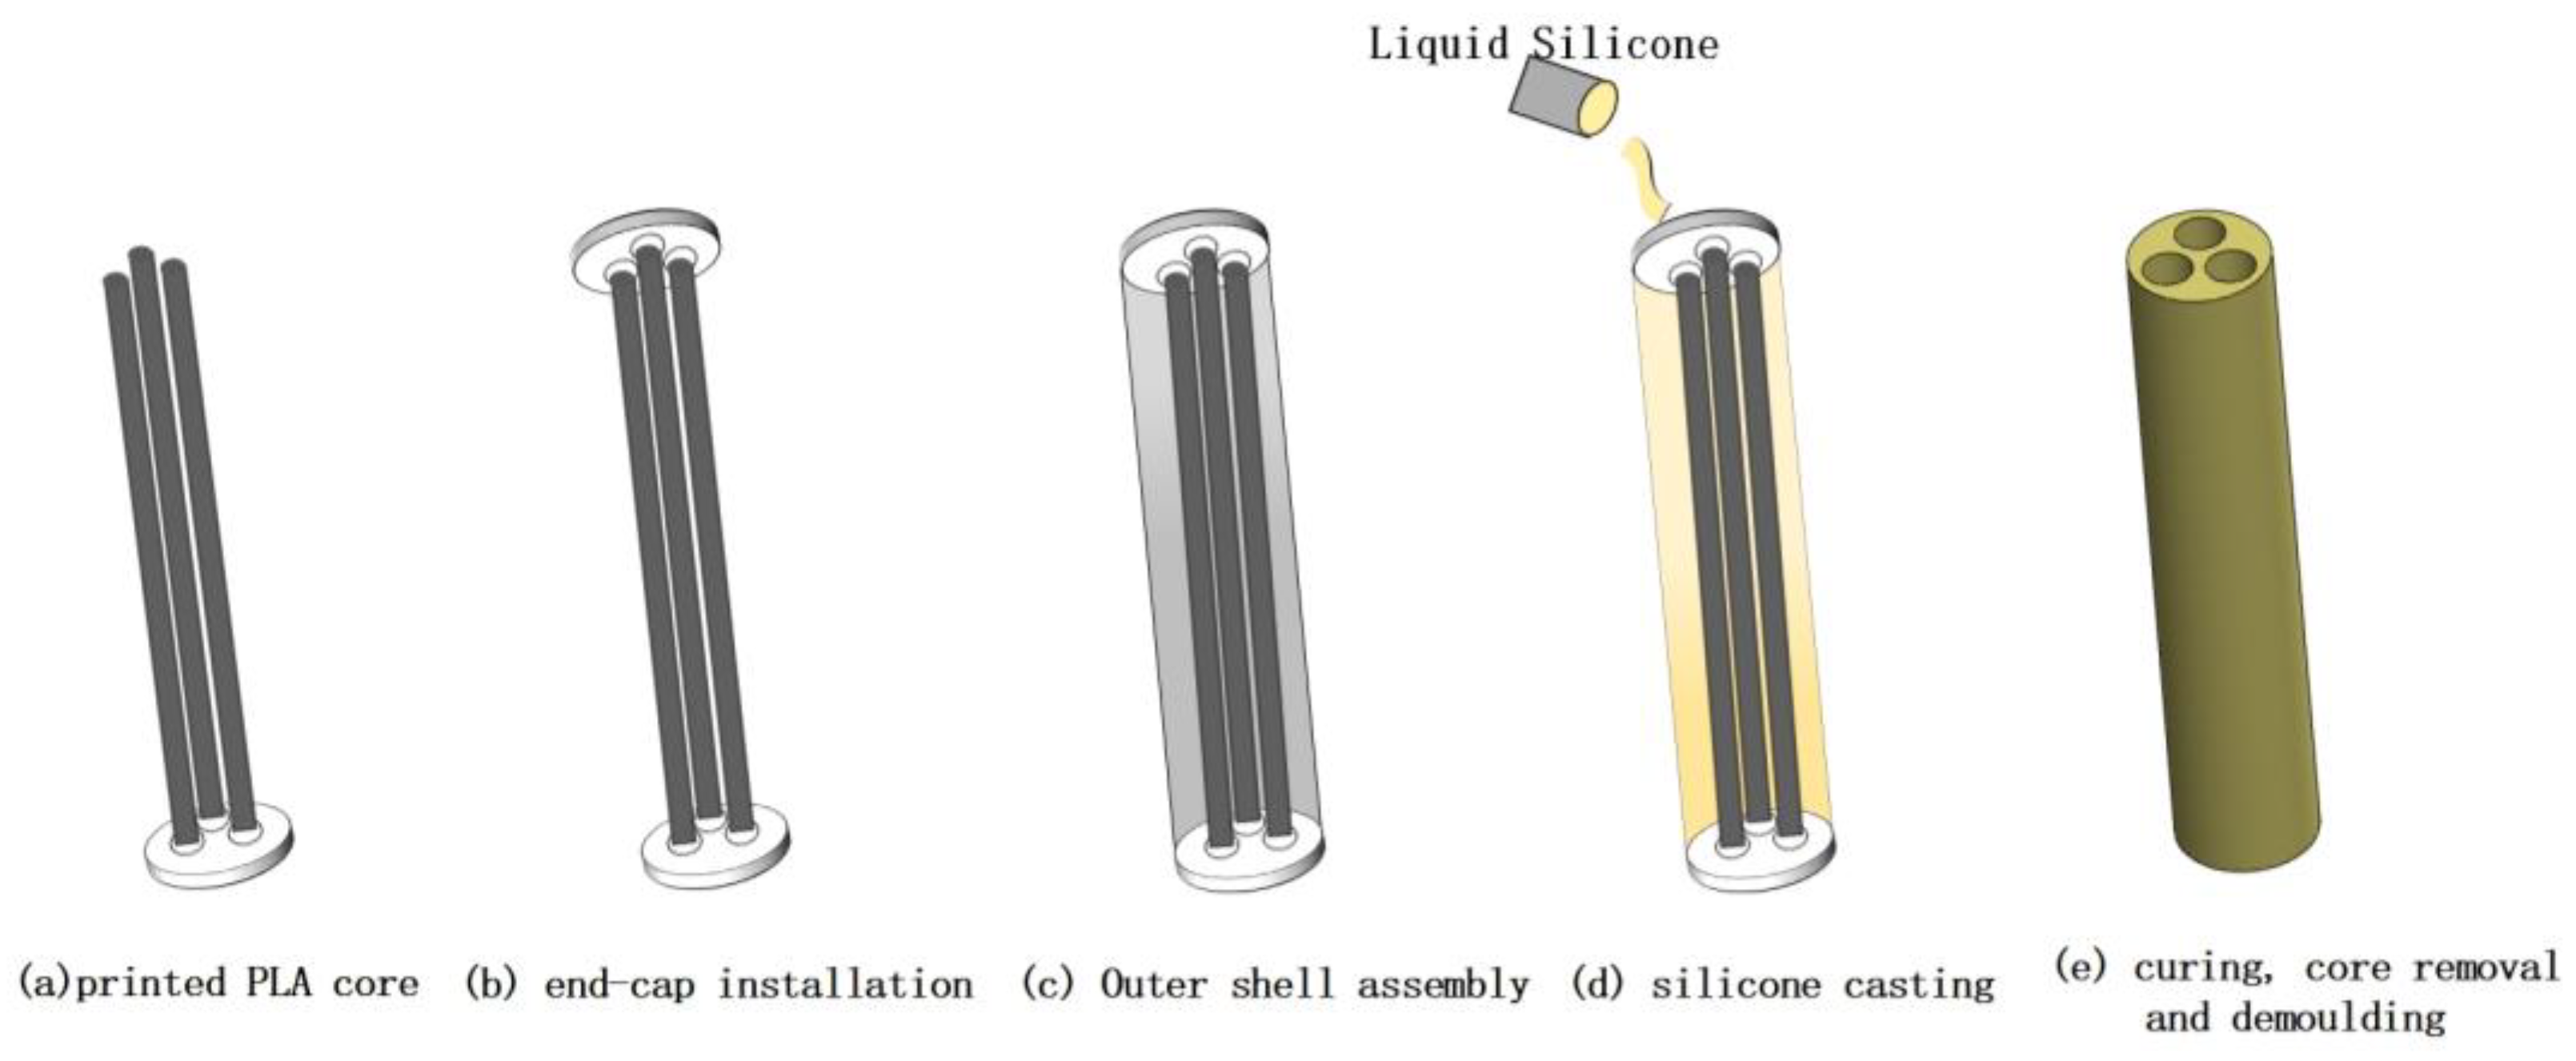
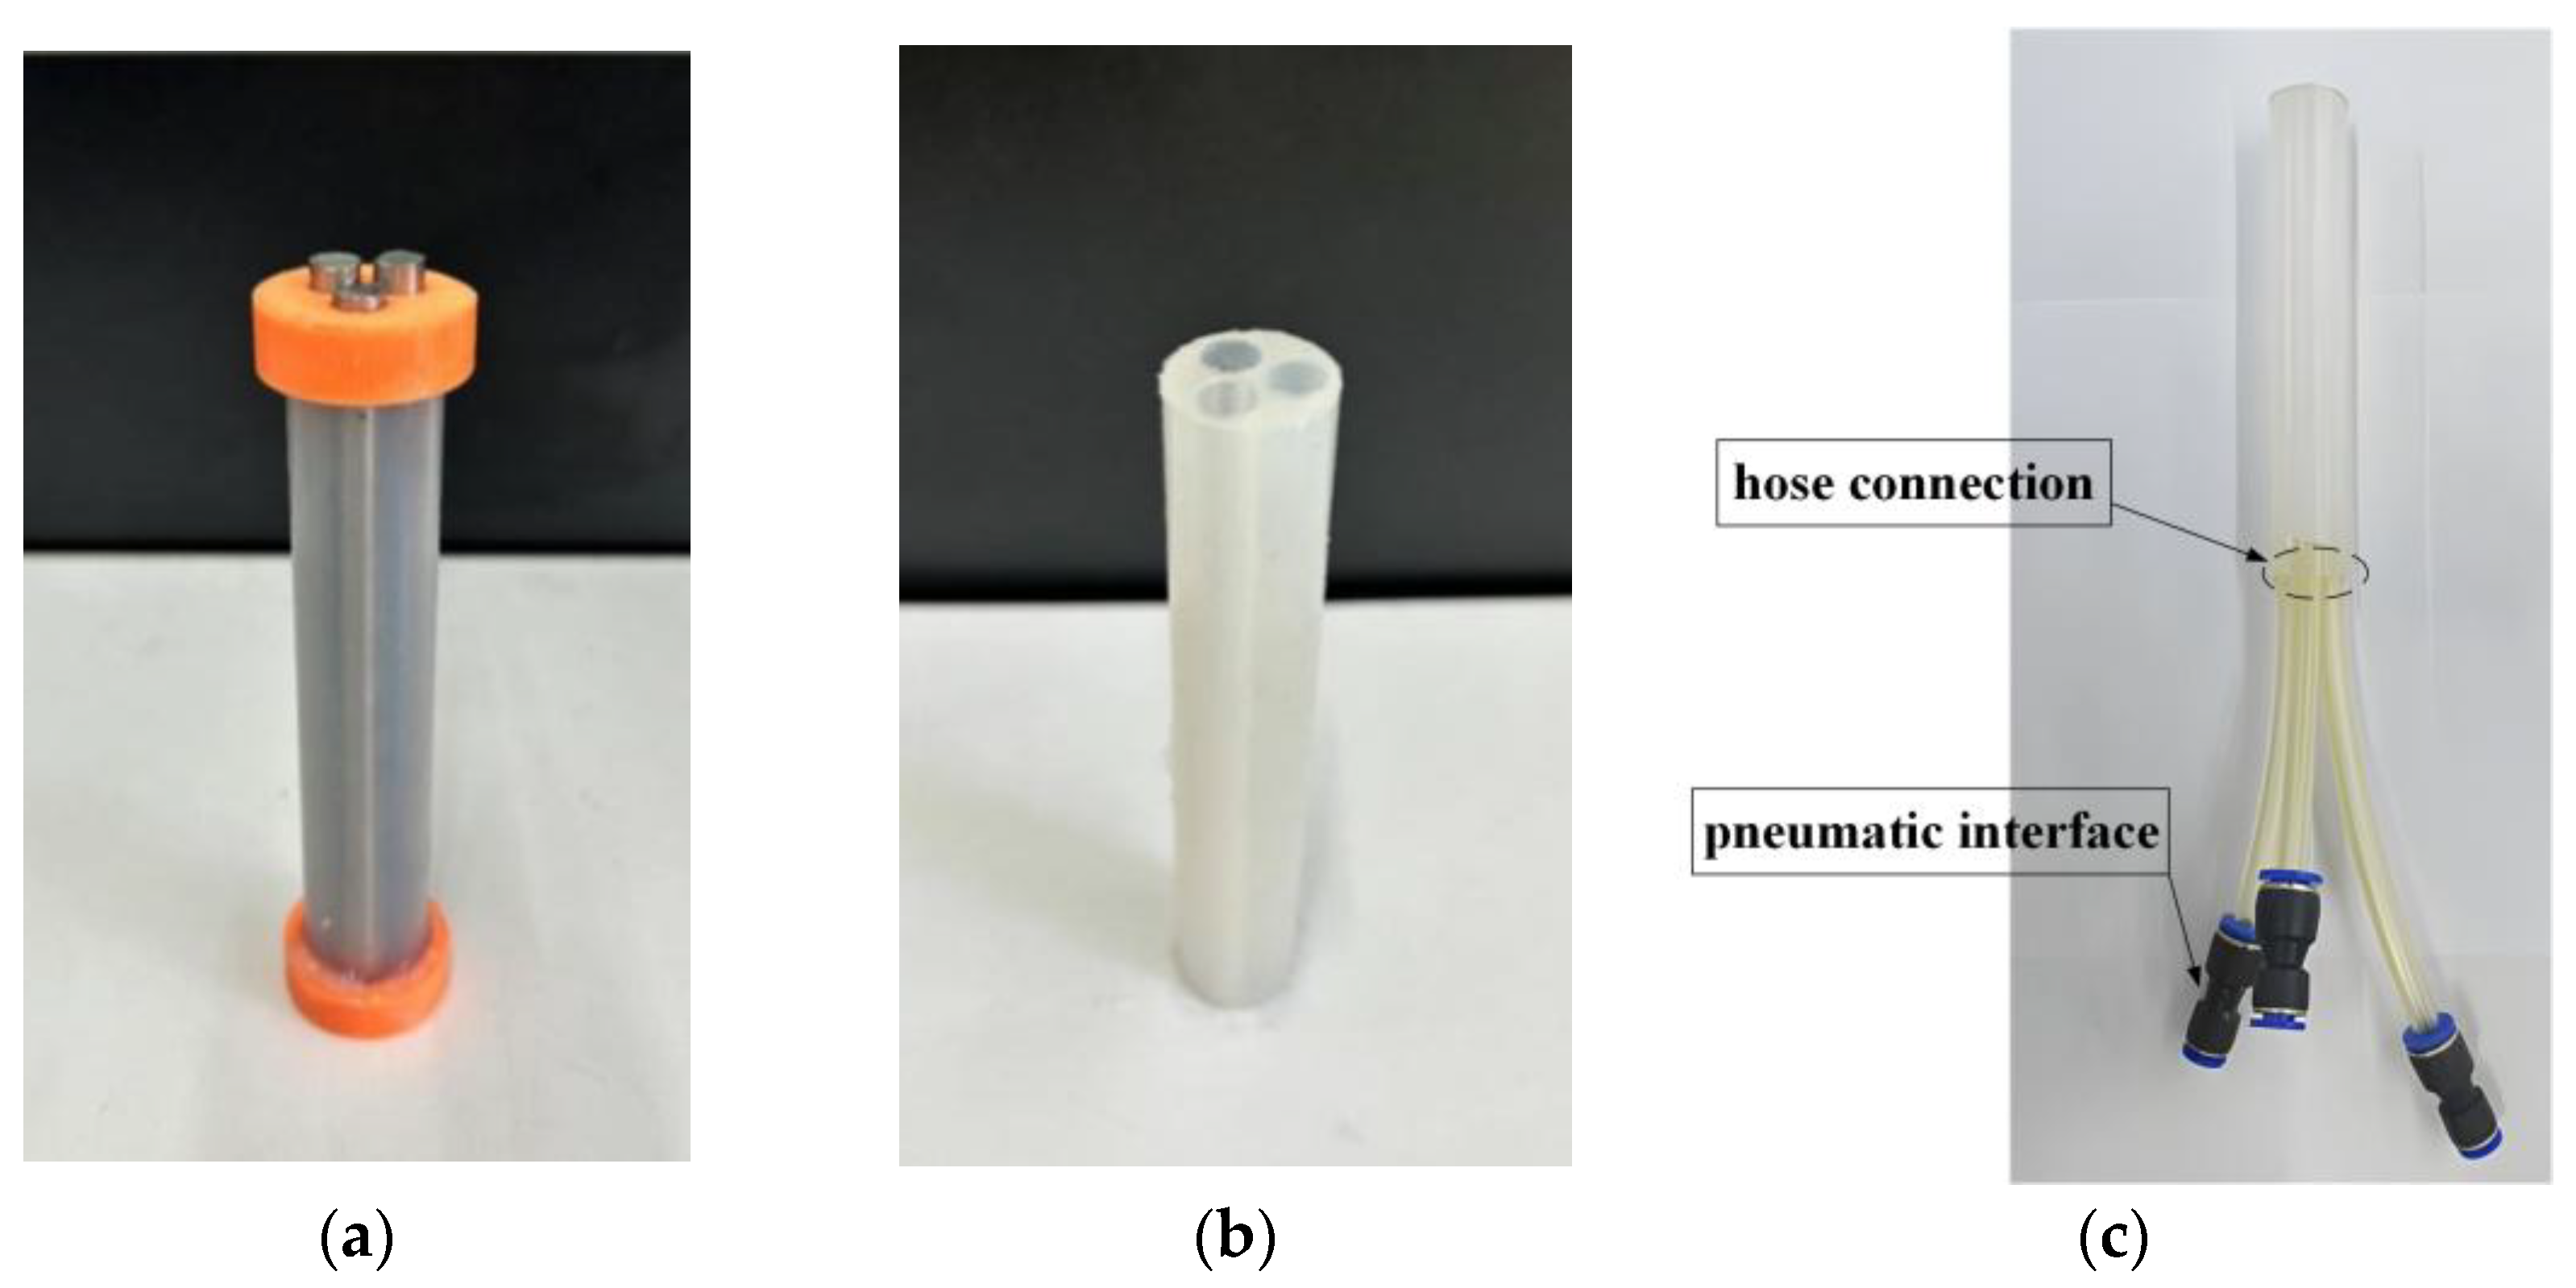
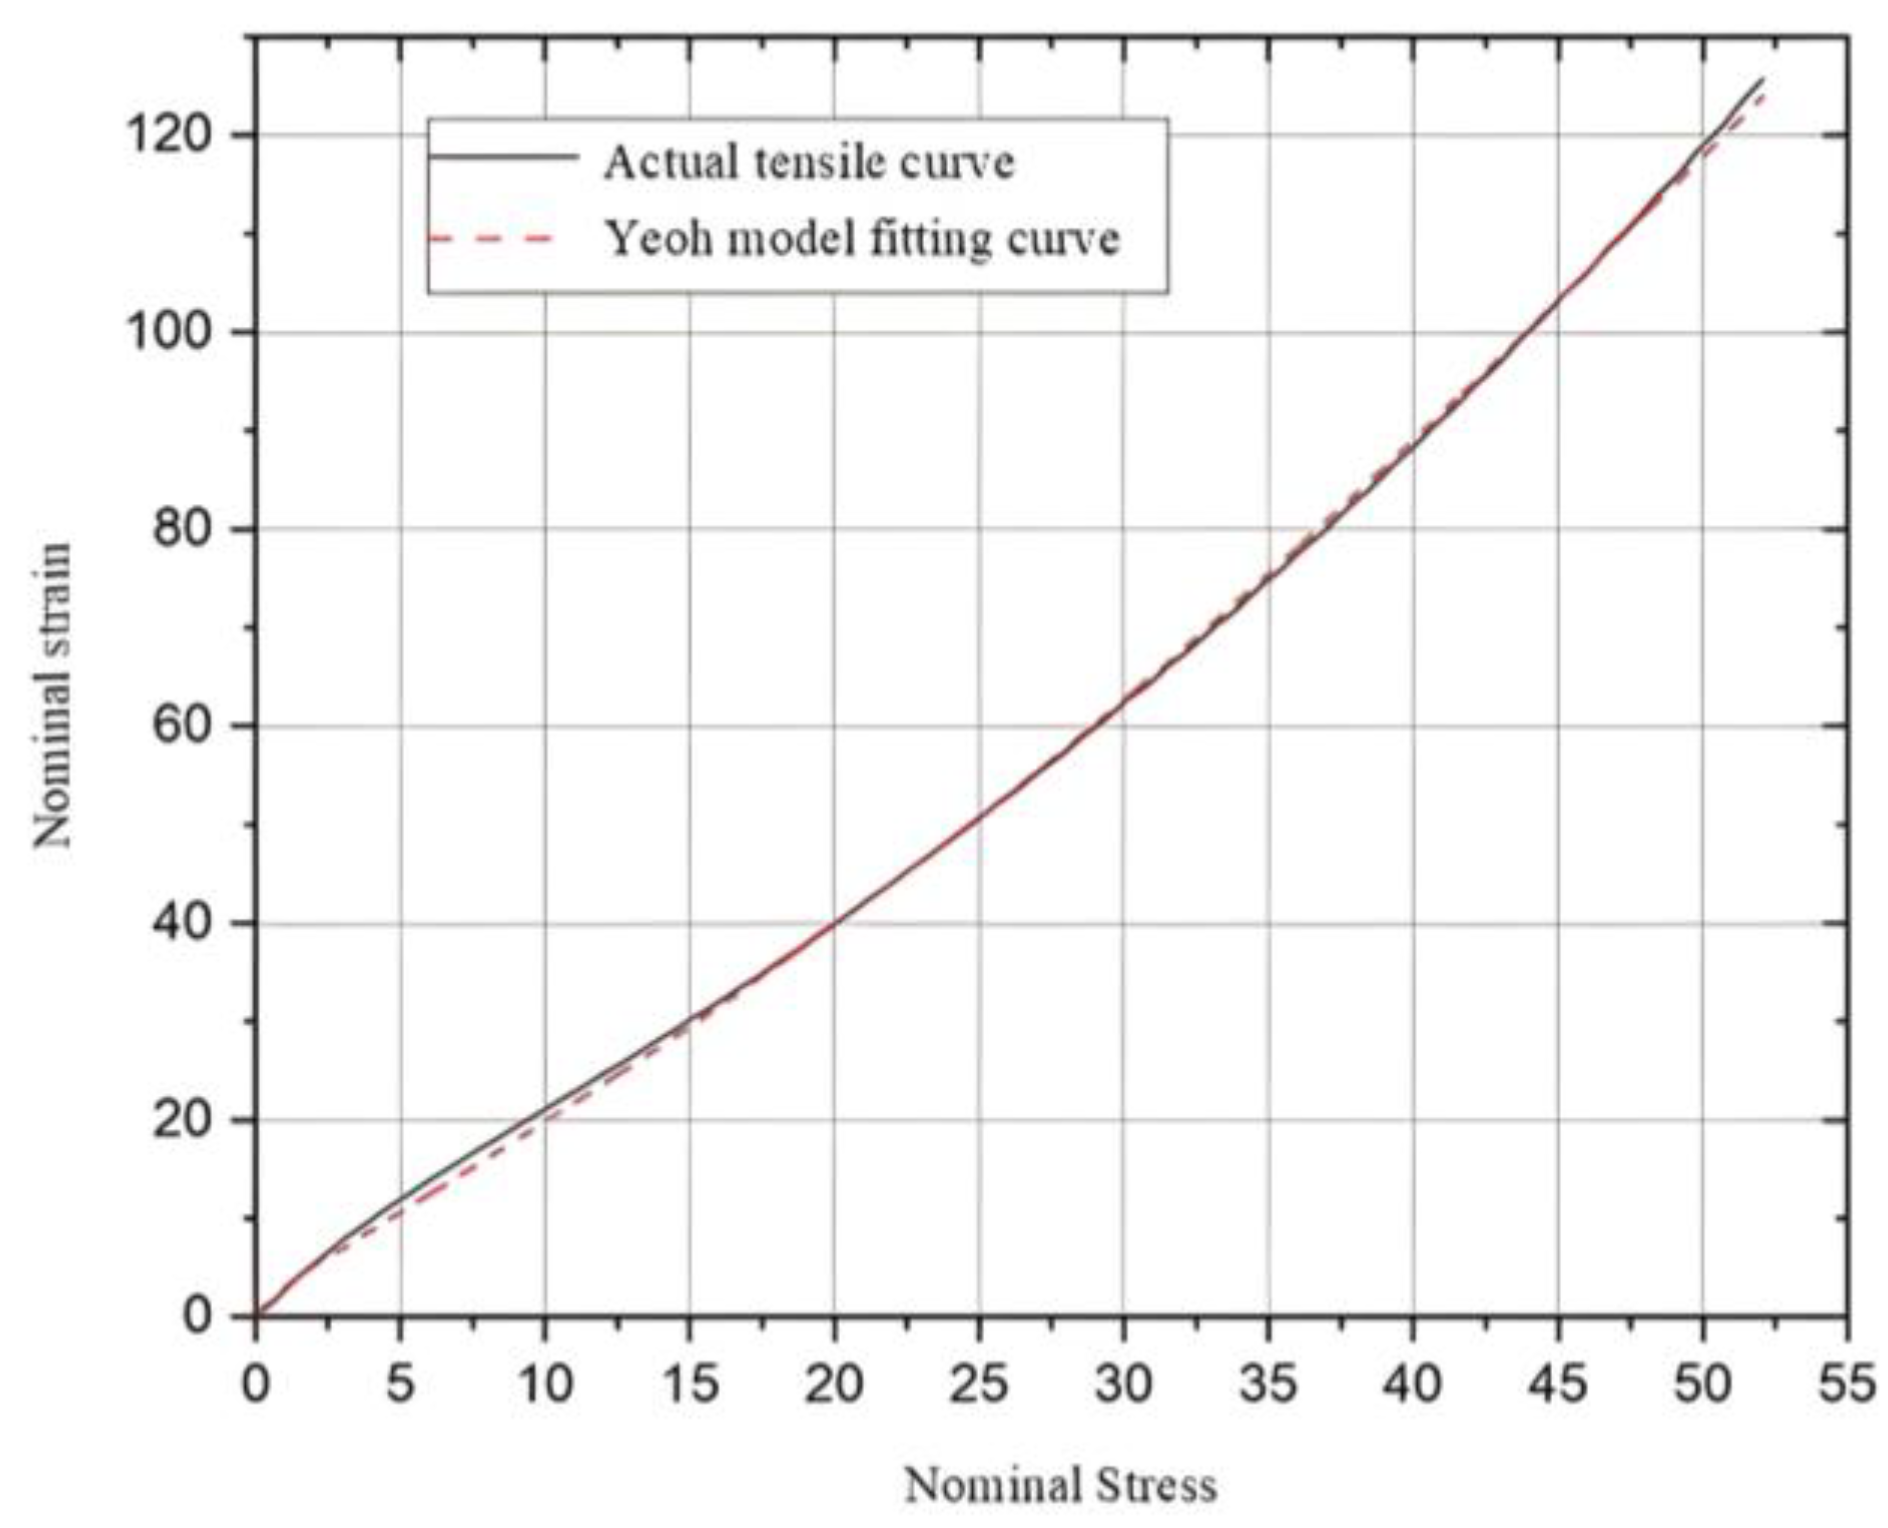
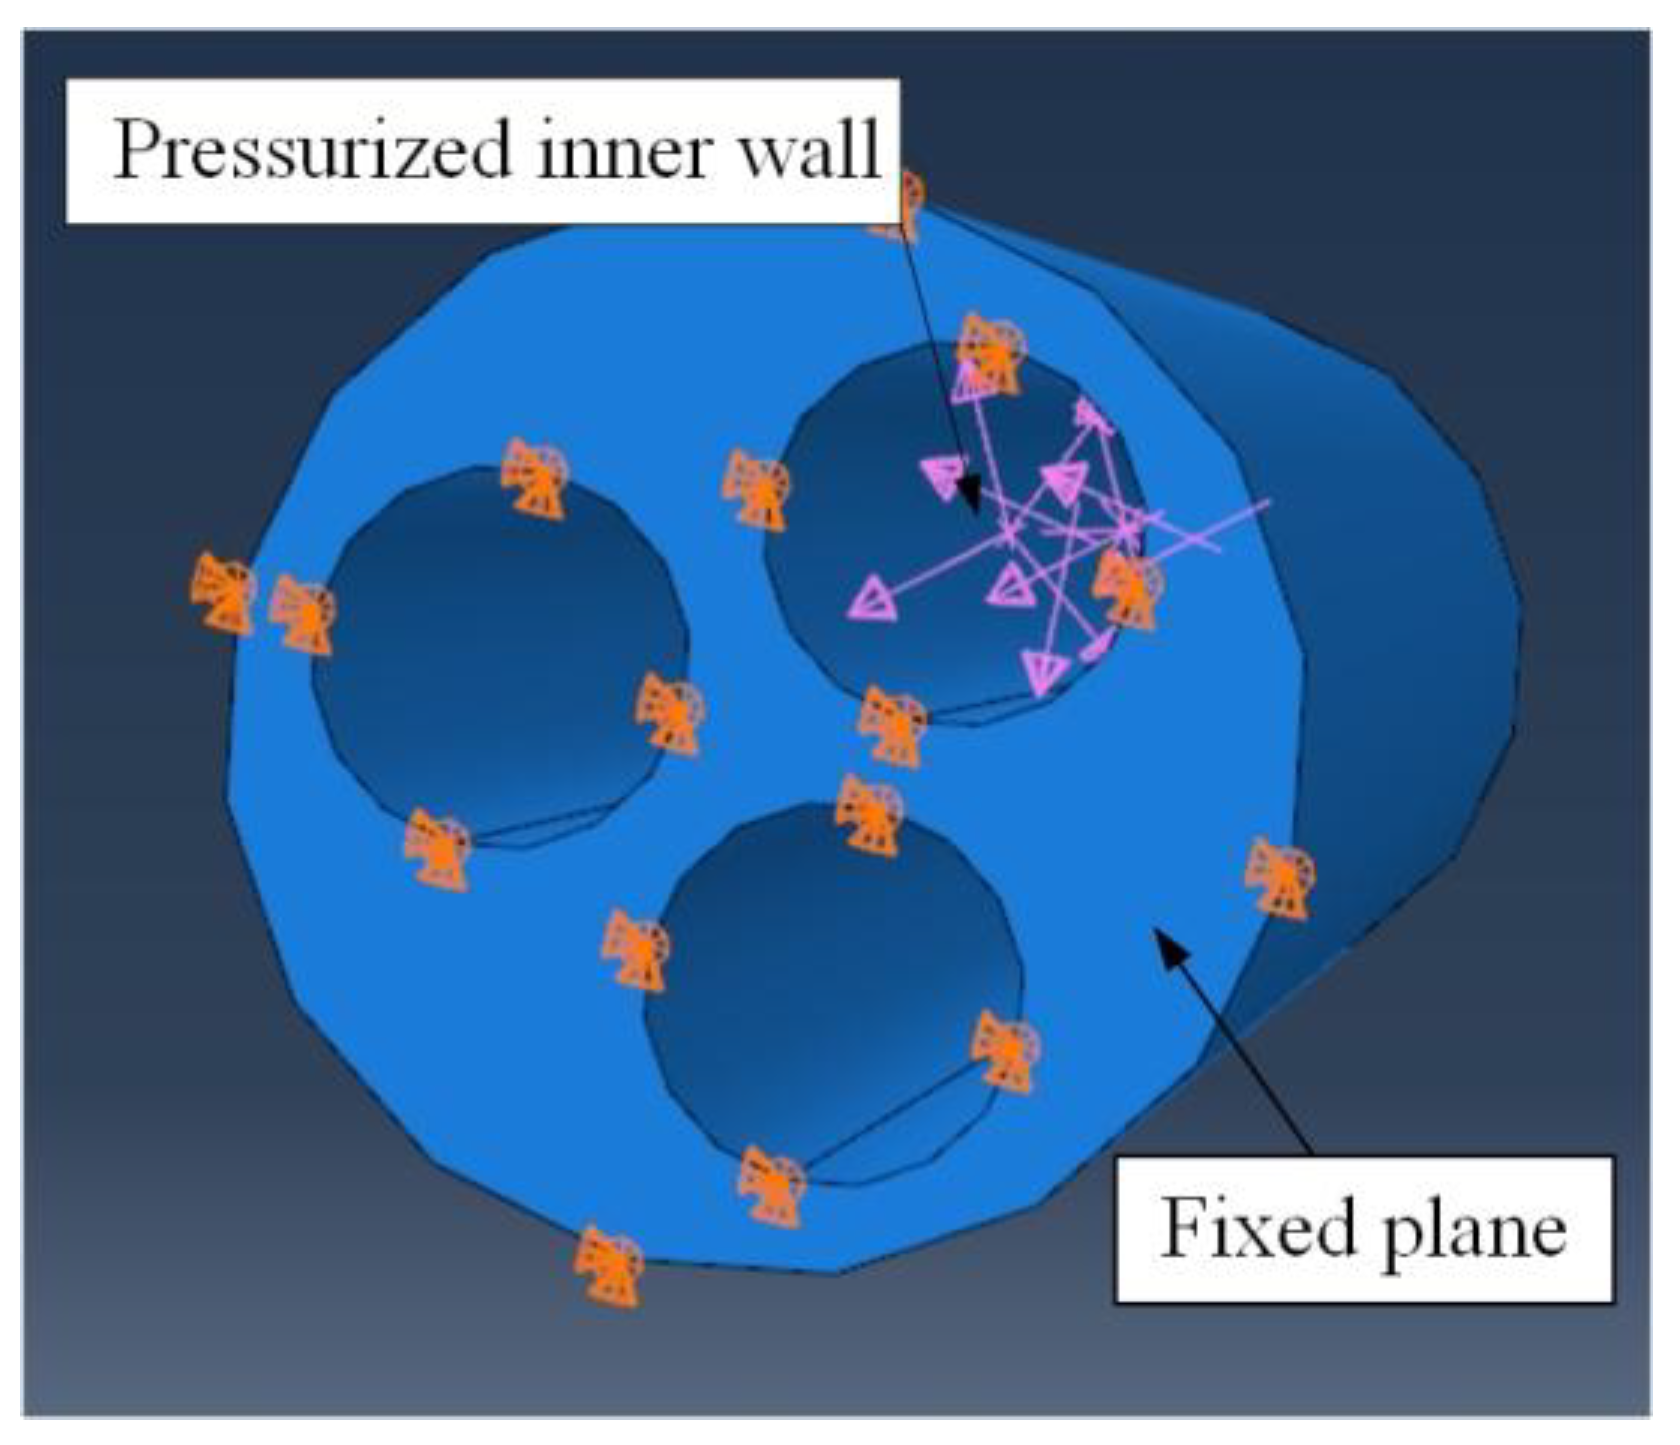
The key novelty of this study is the integration of a fuzzy-tuned PID control algorithm with a newly designed three-chamber cylindrical actuator. This combination enables precise three-dimensional pose modulation while maintaining low fabrication complexity—an aspect seldom explored in previous soft-pneumatic actuator studies. This study investigates a silicone-rubber multi-chamber actuator capable of complex pose changes through differential inflation. A prototype was fabricated using 3D printing and lost-wax casting, with both numerical and experimental analyses, based on the Yeoh model, conducted to characterize its bending behavior across various pressures.
4. Control System Design for Multi-Chamber Flexible Mechanisms
4.1. Overall Pneumatic Control Circuit Design
Real-time deformation sensing on soft silicone chambers is impractical for high-bandwidth feedback. Strain gauges or optical fibers weaken the seal, while the vision system (
Section 6.1) delivers only 30 Hz and adds ≈40 ms processing delay—too slow for a stable inner loop. By contrast, the XGZP6847D silicon-piezoresistive pressure sensor samples at 1 kHz on the STM32 bus with negligible latency. The actuator exhibits a monotonic, rate-independent pressure–strain curve in the 0–90 kPa range (
Figure 8 and
Figure 11), so chamber pressure can serve as a reliable proxy for tip displacement. Limiting pressure to ±2 kPa around the set point prevents exposure to the >120 kPa burst-and-creep region and stays below the 100 kPa rating of the pump/valve assembly. For these reasons the controller is closed on pressure; an outer shape loop will be added in future work once a faster, non-intrusive deformation sensor becomes available.
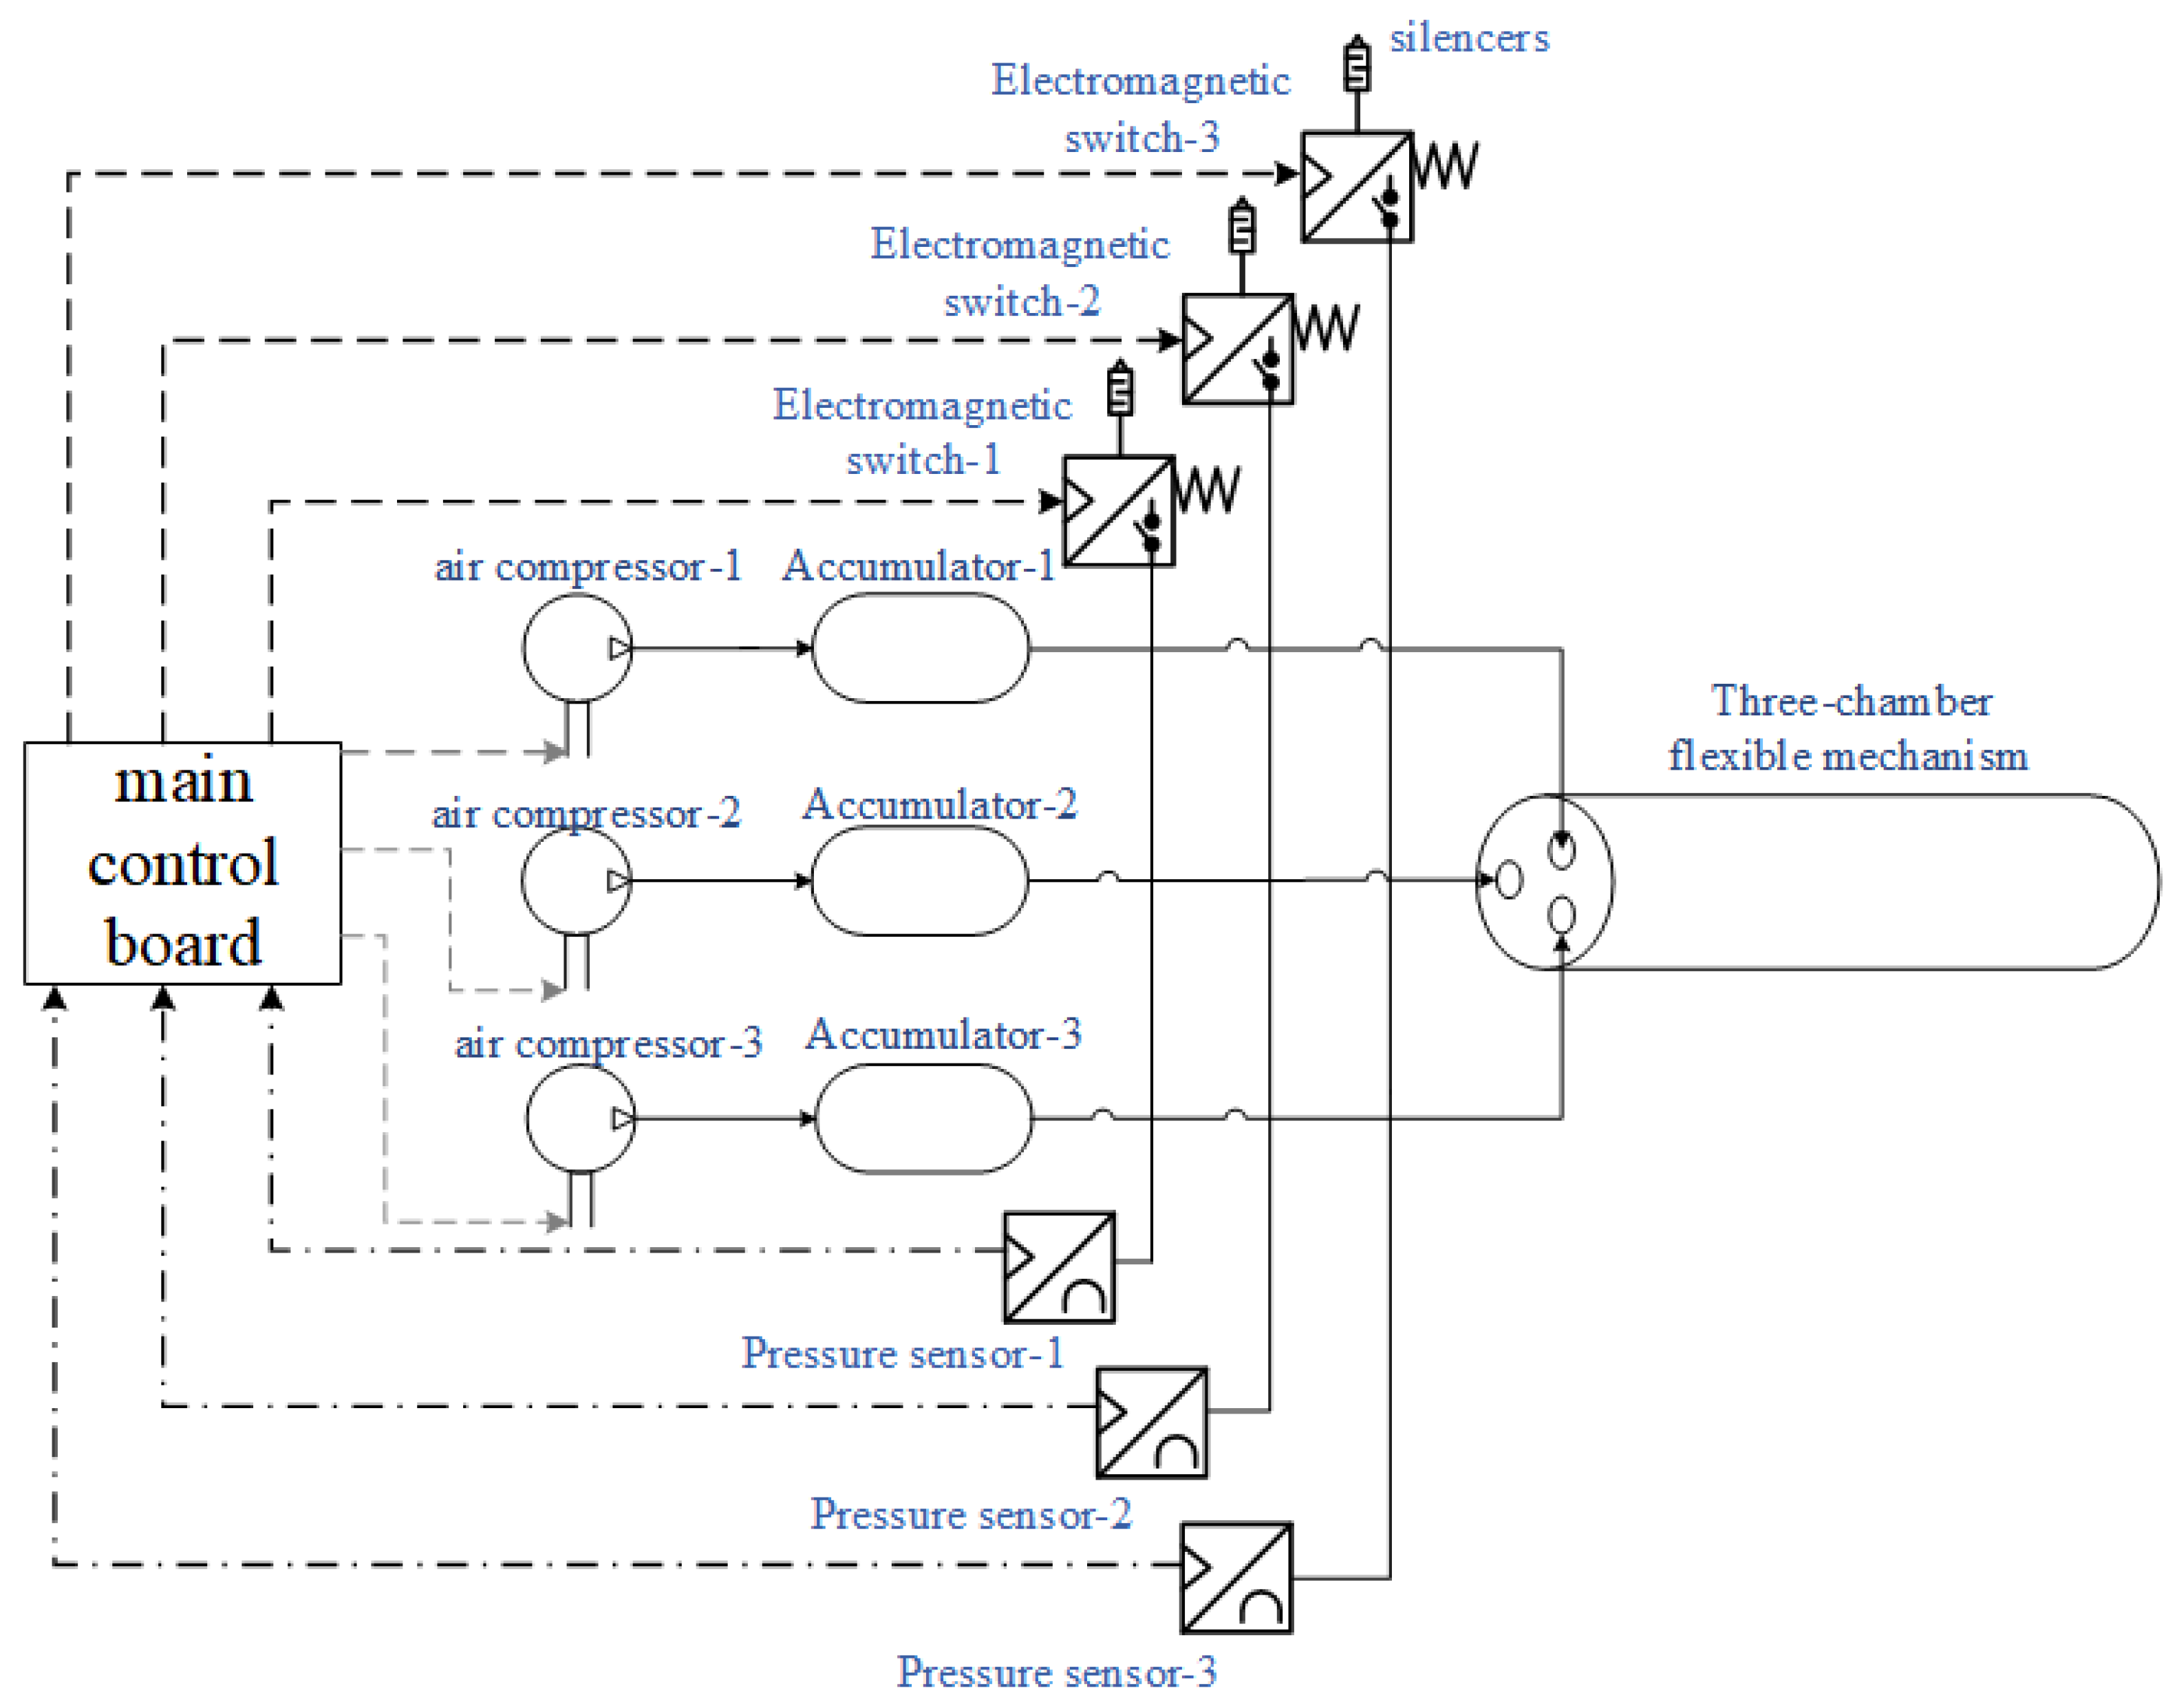
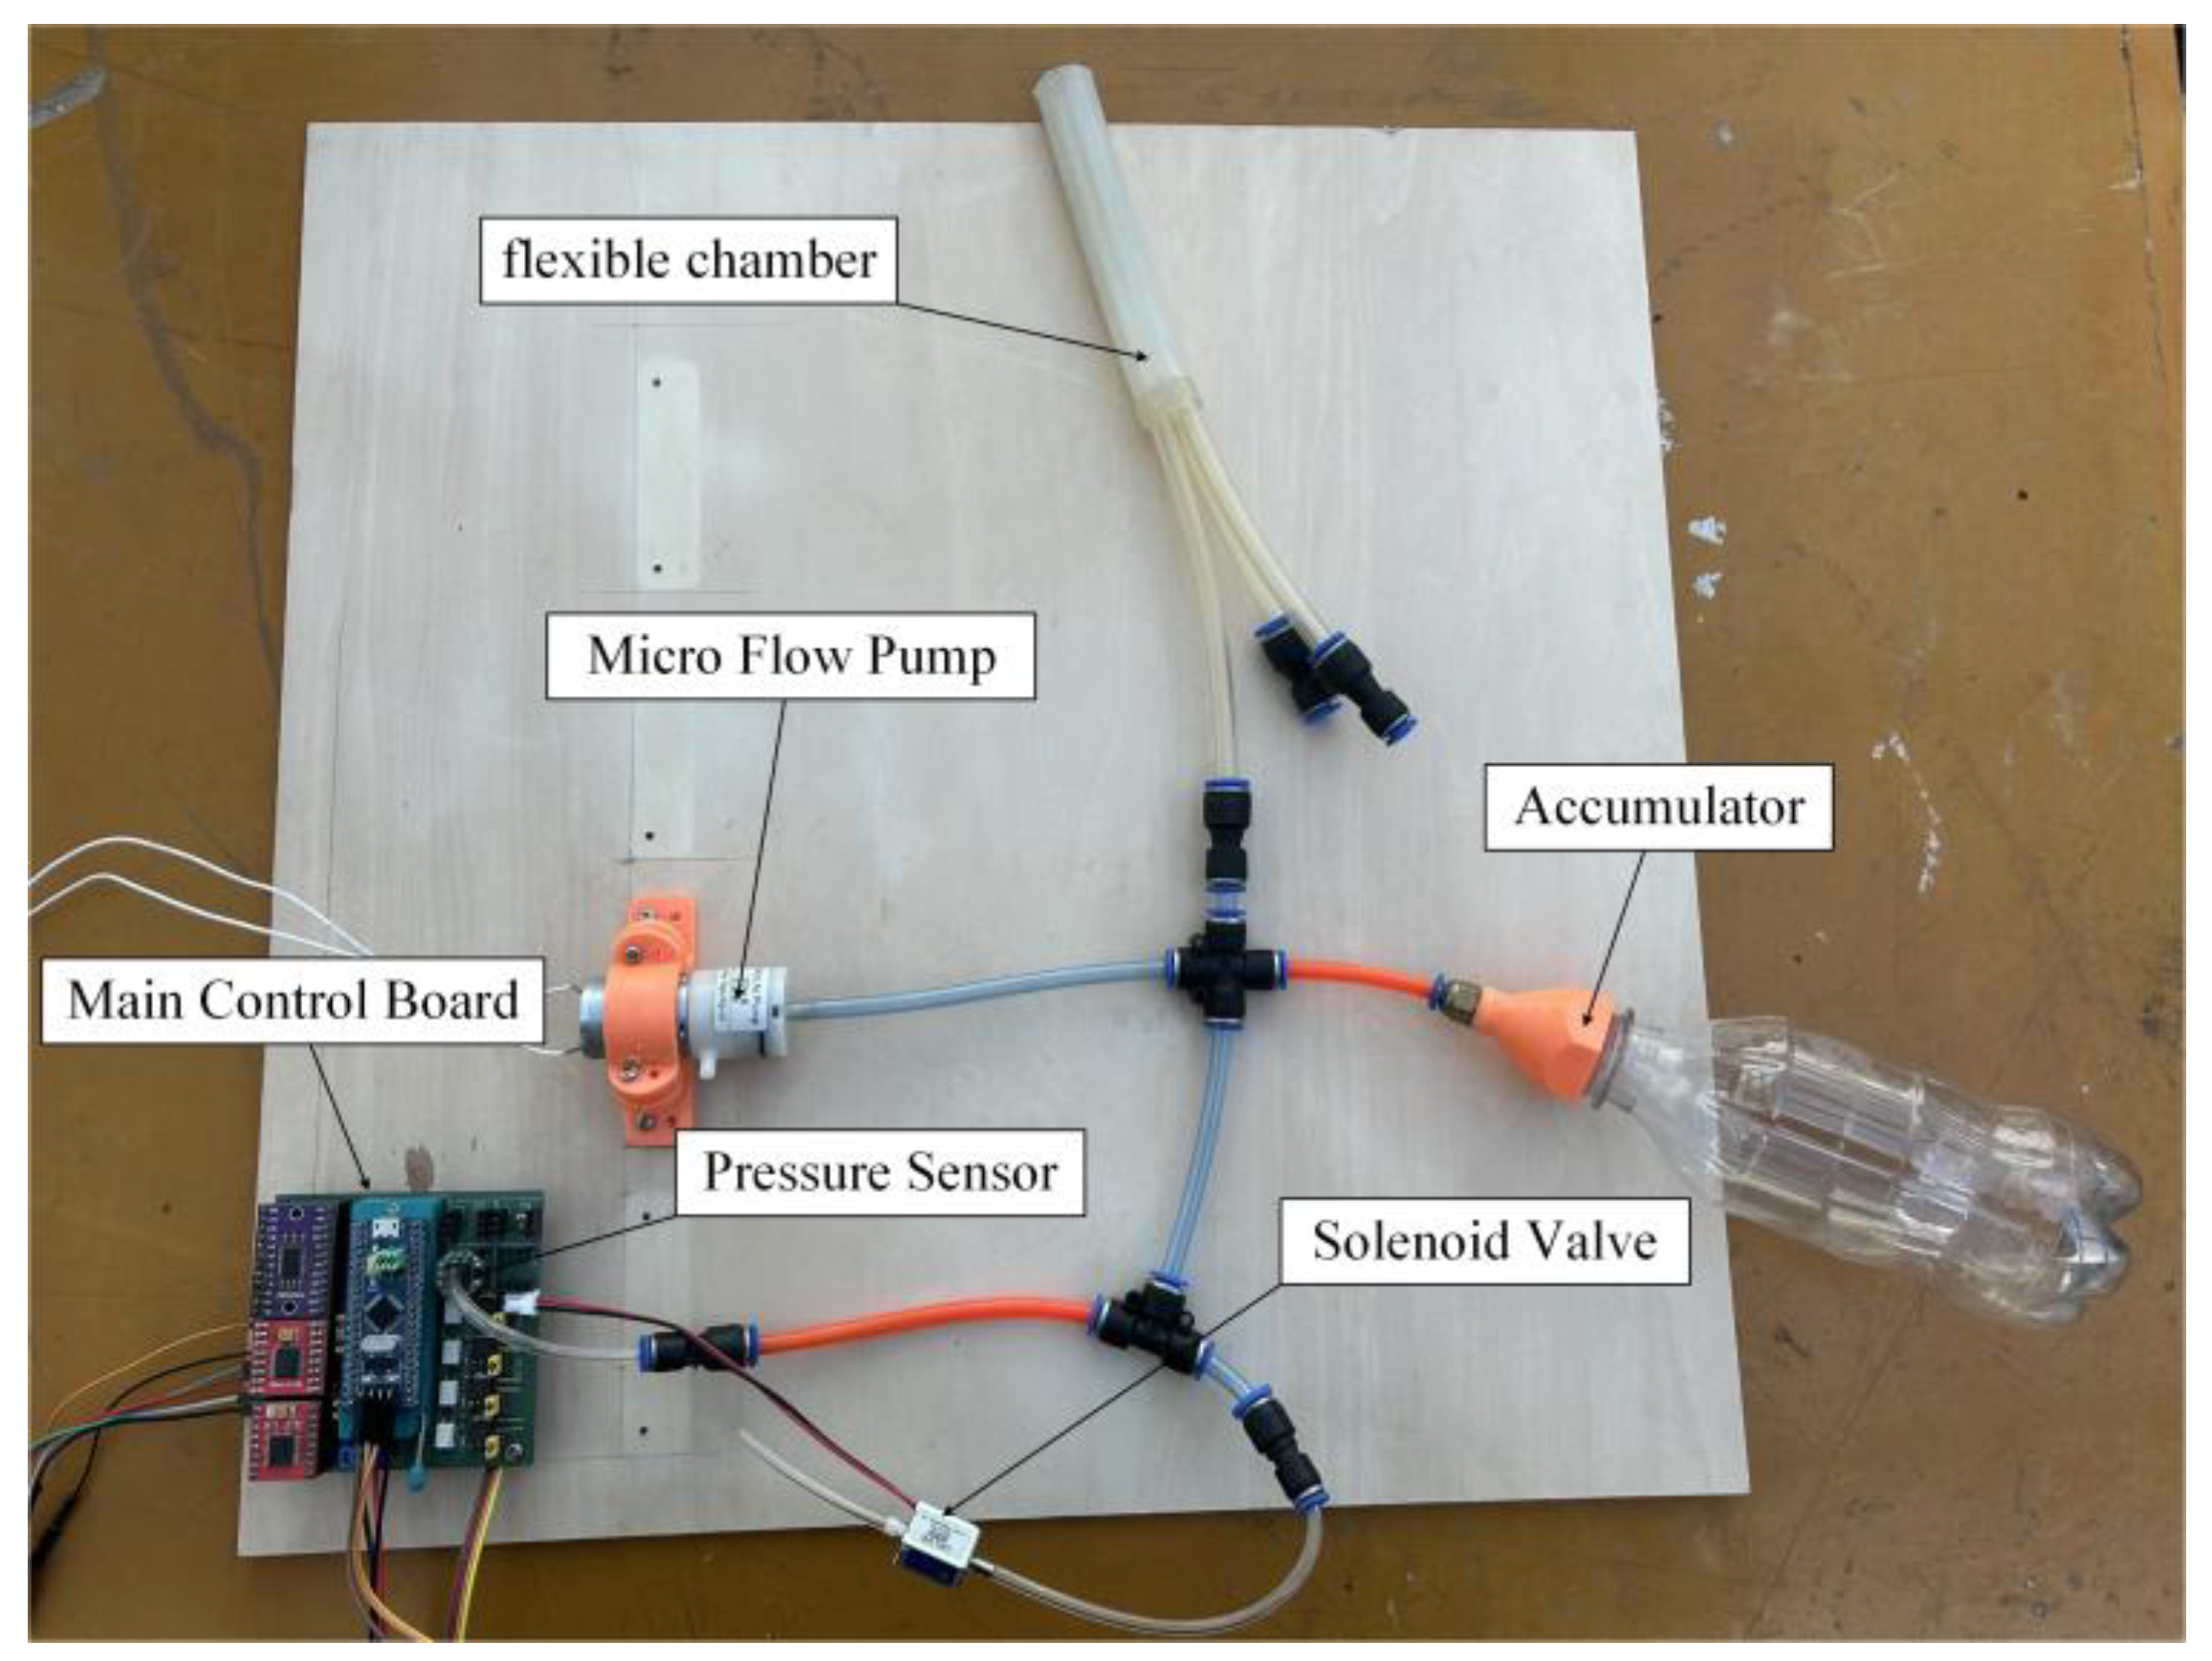
In order to control the motion trajectory of multi-chamber flexible mechanisms, a pneumatic control platform as shown in
Figure 12 is constructed. This control platform demonstrates the working principle of the flexible mechanism’s motion. The overall system consists of a multi-chamber flexible mechanism, electromagnetic switch valve, small flow pump, pressure sensor, accumulator, and main control board. The control principle is shown in
Figure 13, and the basic equipment parameters are shown in
Table 2.
The air pressure sensor is used to collect air pressure data inside the chamber, the main control board serves as the data processing center, the micro flow pump is used to inflate the flexible actuator, the accumulator is used to stabilise the air pressure, and the electromagnetic switch valve is used to release air and pressure.
As shown in
Figure 14, it displays the experimental platform for charging and discharging a single-chamber.
When inflating the flexible mechanism, the program sets the air pressure value and sends it to the central control board. The real air pressure value collected by the air pressure sensor is compared with the set air pressure value. The PID algorithm is used to control the PWM duty cycle of the small flow pump, thereby stabilizing the internal air pressure of the flexible mechanism. When releasing air, the central control board controls the opening and closing of the solenoid valve through a switch function, thereby achieving pressure relief of the flexible mechanism chamber.
4.2. Microcontroller-Based Control System Design
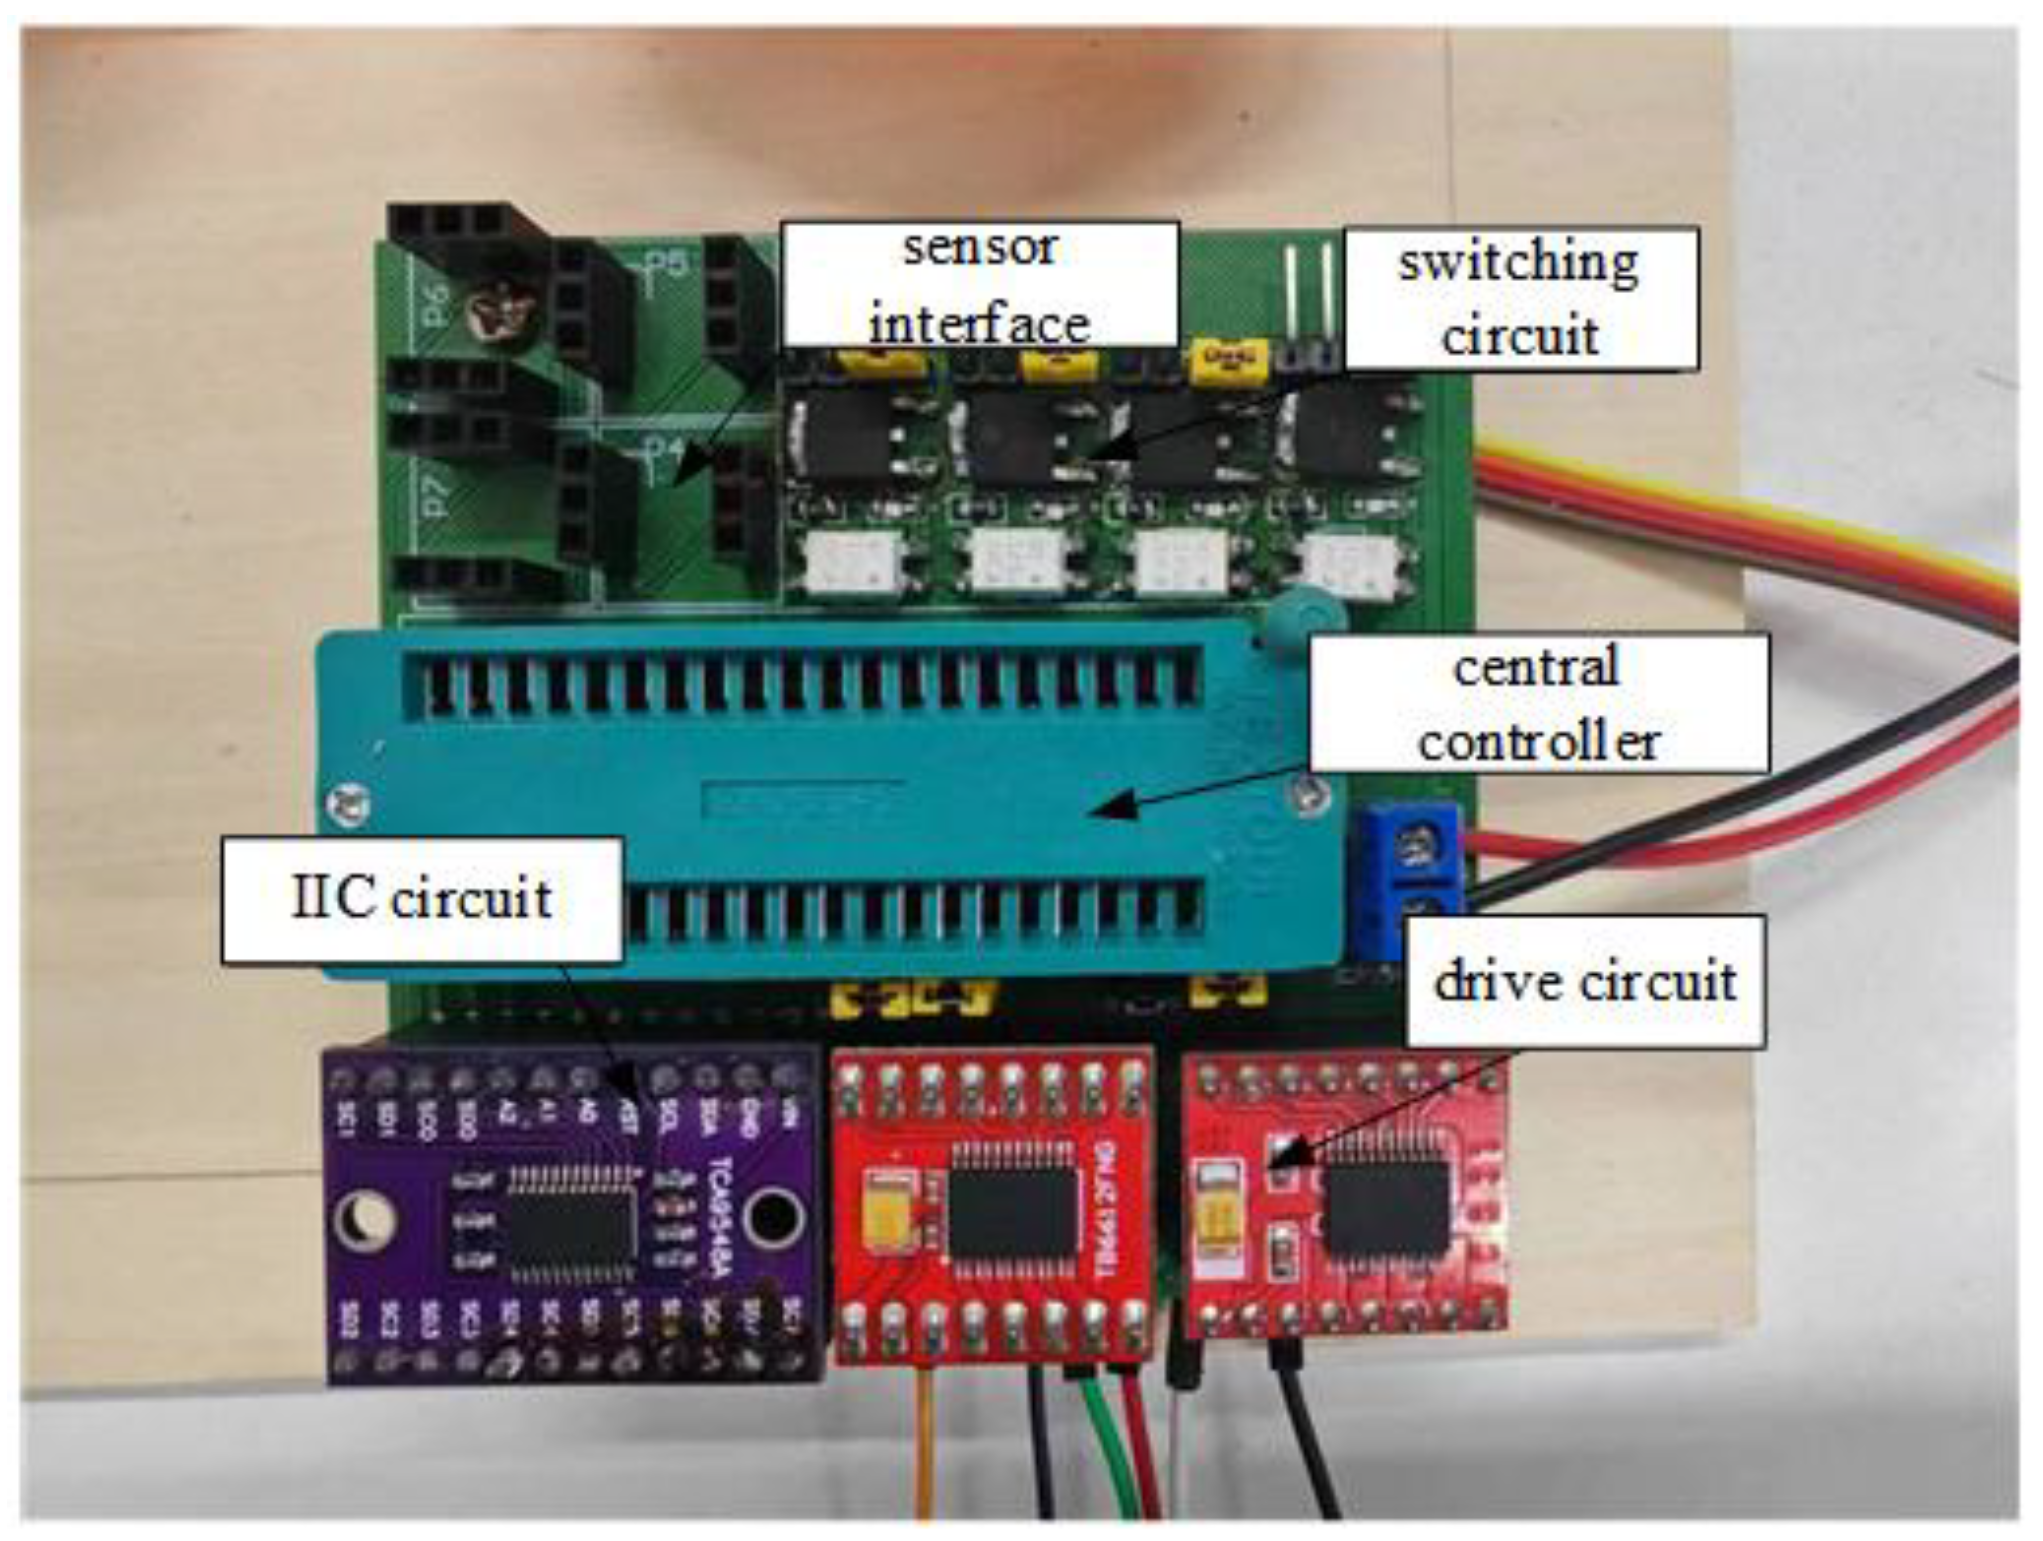
According to the current experimental requirements of multi-chamber mechanisms, the main control board can be divided into several parts: the central control circuit, power supply circuit, communication circuit, driving circuit for processing small flow pumps, and switch circuit for driving solenoid valves, which handle most of the data and interaction problems.
The main control core of the central control circuit adopts the LQFP48 package of the STM32F103C8T6 model from the ST company as the main control core.
In order to meet the stable power supply requirements of 3.3 V and 5 V for the peripheral circuits of the main control IC, this design adopts ASM1117-5V and ASM1117-3.3V chips to build a two-stage step-down circuit, with the input voltage range of 9~12 V, compatible with the characteristics of the driver and switching circuits, and a preferred 12 V reference input to balance the compatibility and stability of the system. The power supply is connected through the KF301_2P terminal, and the input side is configured with 3 groups (6 in total) of bypass capacitors, which combine with the typical circuit architecture of the chip manual to achieve precise voltage reduction and collaborative filtering, effectively suppressing the interference of transient fluctuations of the back-end load on other modules of the system and ensuring the stability of the input/output voltages and anti-noise capability.
In order to meet the demand for efficient acquisition and transmission of multi-channel pressure signals, this design uses the CFSensor XGZP6847D pressure sensor (IIC digital signal output, default address 0X6D) [
33], combined with TI’s TCA9548A multiplexer to achieve the signal expansion. Based on the constraints that the system needs to collect 3-channel pressure information and needs to compress the PCB size, the 4-channel communication interface (channels 0~3) of TCA9548A is selected to optimise the layout space through its flexible IIC bus expansion capability while ensuring the signal integrity to satisfy the centralised reading and processing of multi-sensor data by the main controller.
For the driver circuit to deal with micro-flow pumps, in order to make the overall PCB size as compact as possible and to drive 12 V power below 3 W micro-flow pumps to work, the TB6612FNG driver IC was selected as the core of the overall circuit design.
For driving the solenoid valve switching circuit, there is a need to control at least 3-way solenoid valve switching, and the solenoid valve uses 12 V to drive, so the single circuit planning, in accordance with the corresponding form of the same array, can be obtained in accordance with the same function of the multi-group interface similar circuit diagrams.
The actual product of the final main control board is shown in
Figure 15.
4.3. Flow Characteristics Analysis of Micro Pressure Pumps
Because the motor speed and outlet pressure are different, the output flow is affected to a certain extent. To further study the output characteristics of the micro-flow pump, the theoretical model of the pump is studied using the control variable method. Since the micro-flow pump uses a brushless DC motor as the main mechanical energy component for electrical energy conversion, PWM (Pulse Width Modulation) control can be adopted as the primary control method [
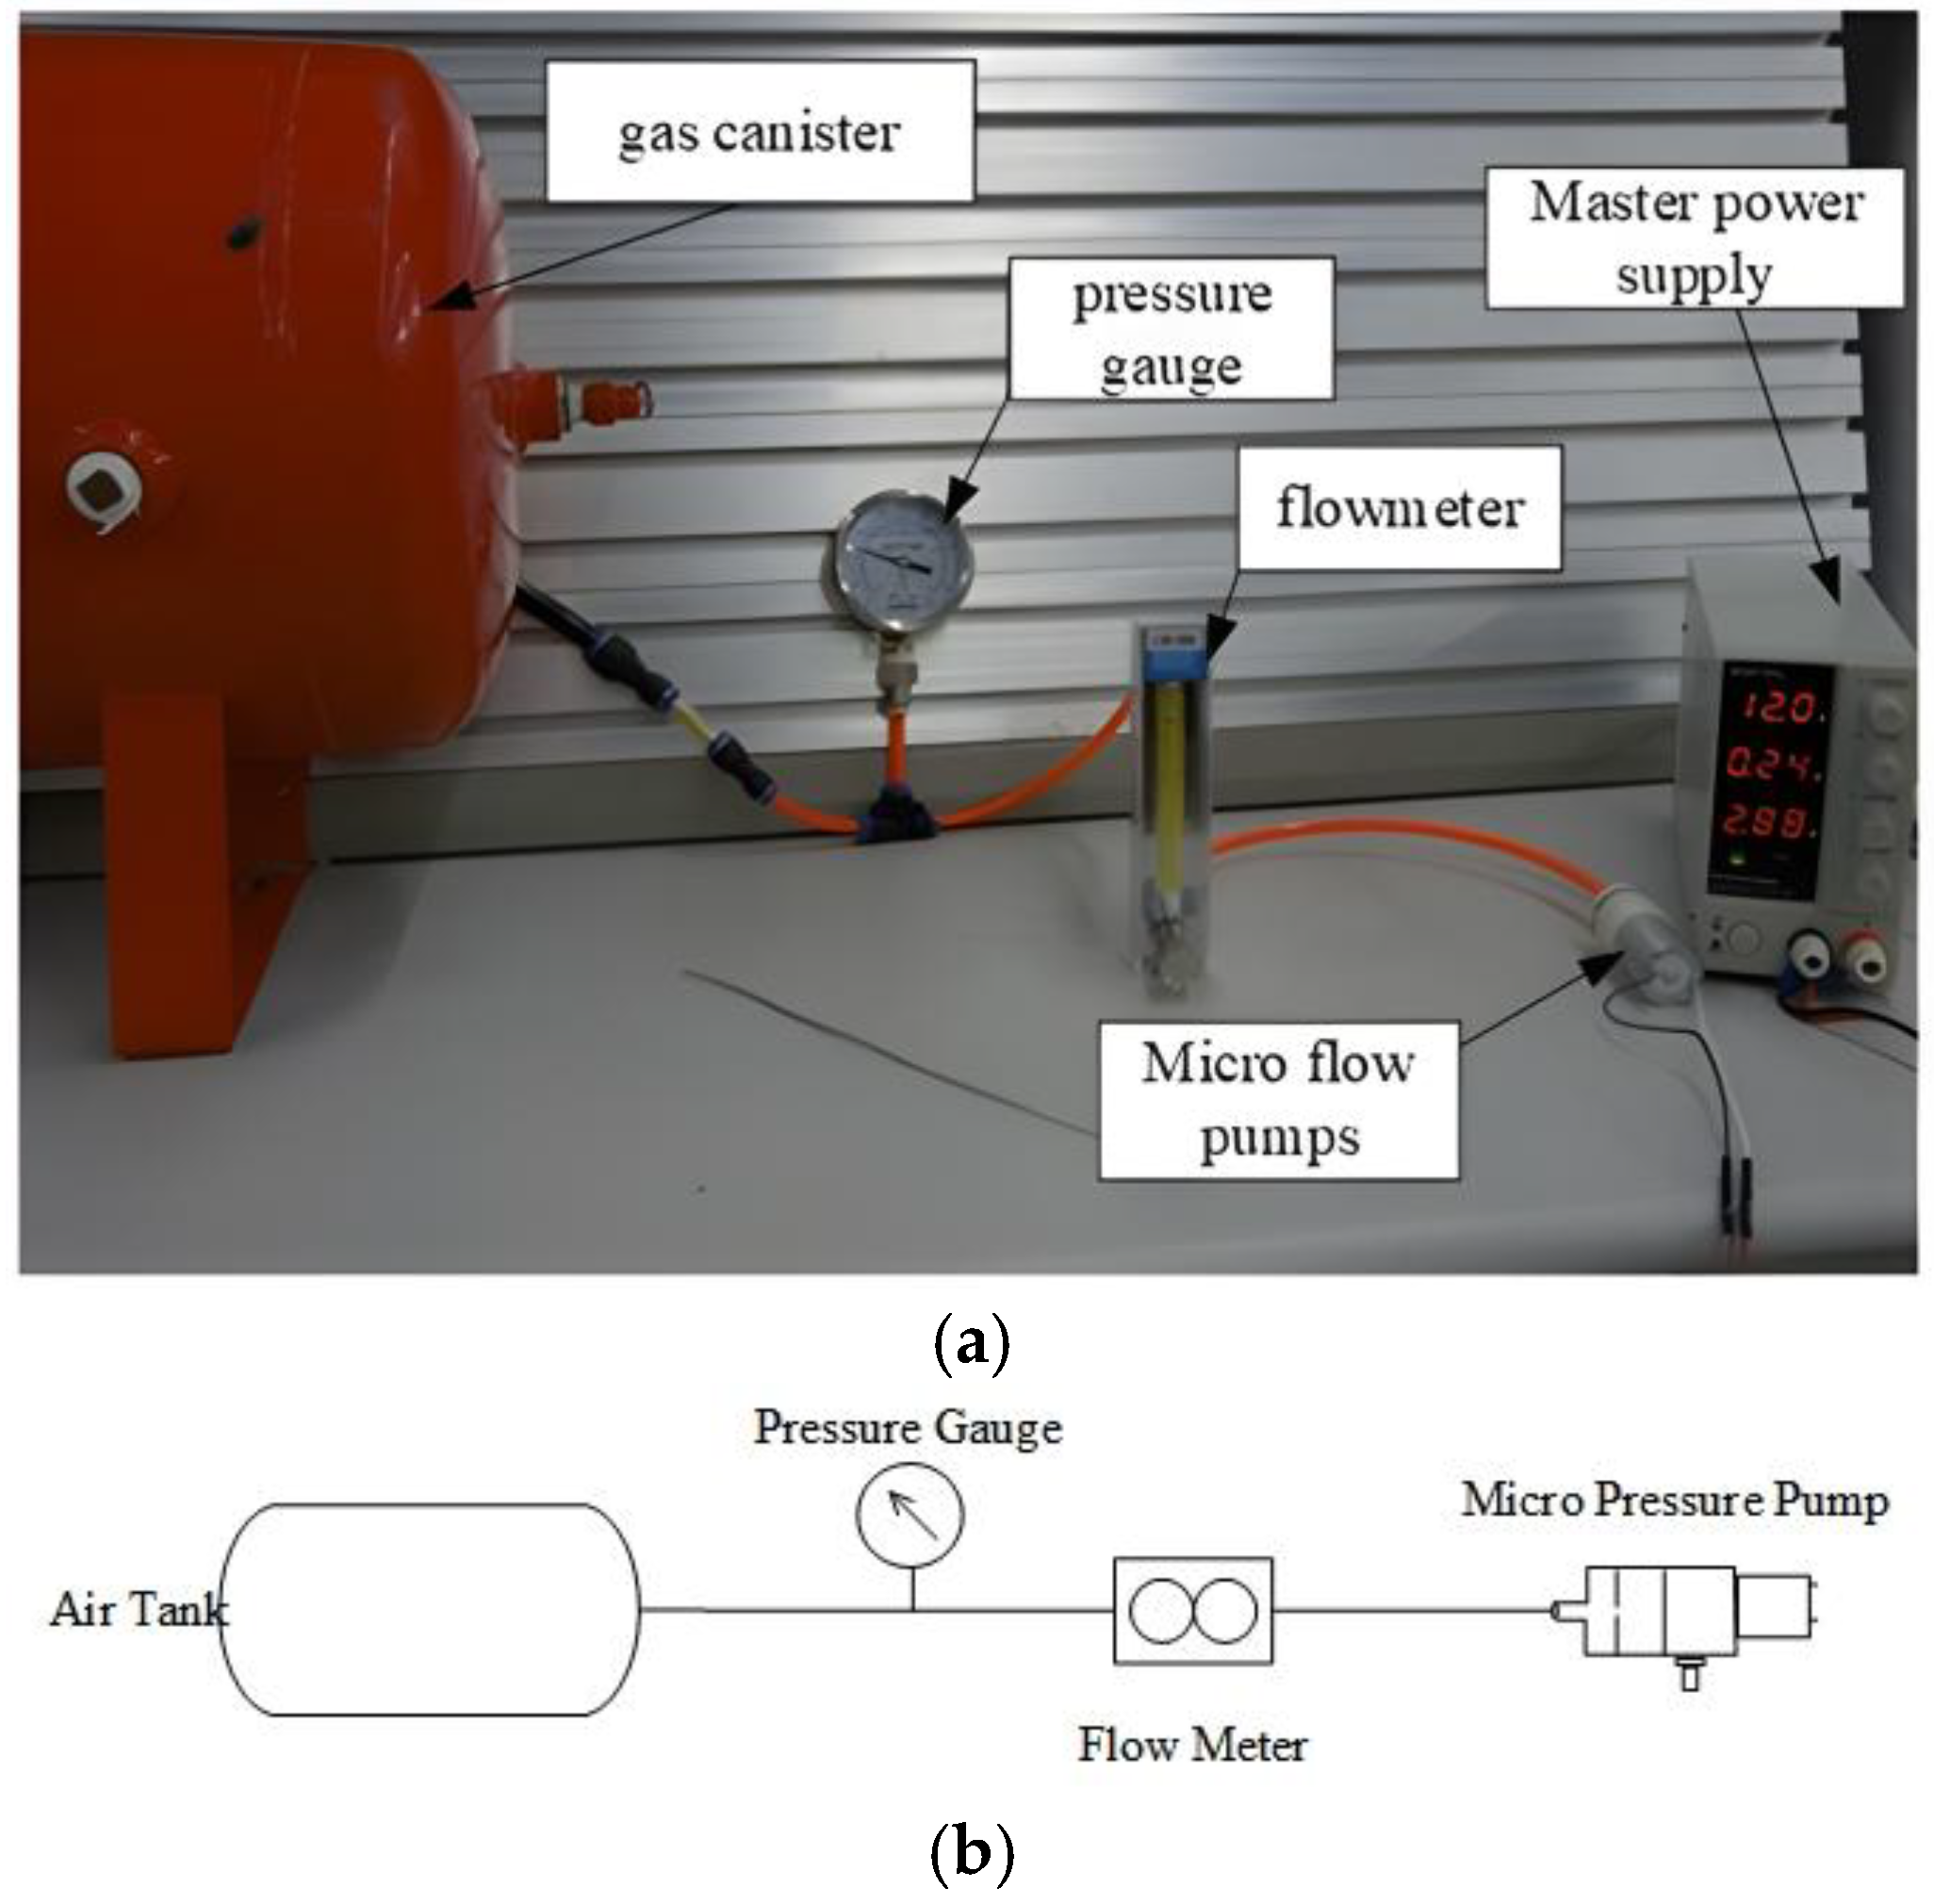
34]. However, due to the complexity of analog control circuits, which hinder overall circuit structure planning, this paper adopts the PWM mode to control the DC brushless motor to regulate the outlet flow. To test the flow characteristics of the entire micro-flow pump, the experimental platform shown in
Figure 16 is used for testing. The main focus of the test is the relationship between outlet pressure, output flow, and PWM output. Since the energy storage container uses a 5 L container tank, the volume of the outlet chamber is approximately infinite relative to the volume pumped by the micro-flow pump each time, meaning the outlet pressure can be assumed to remain constant for a short period.
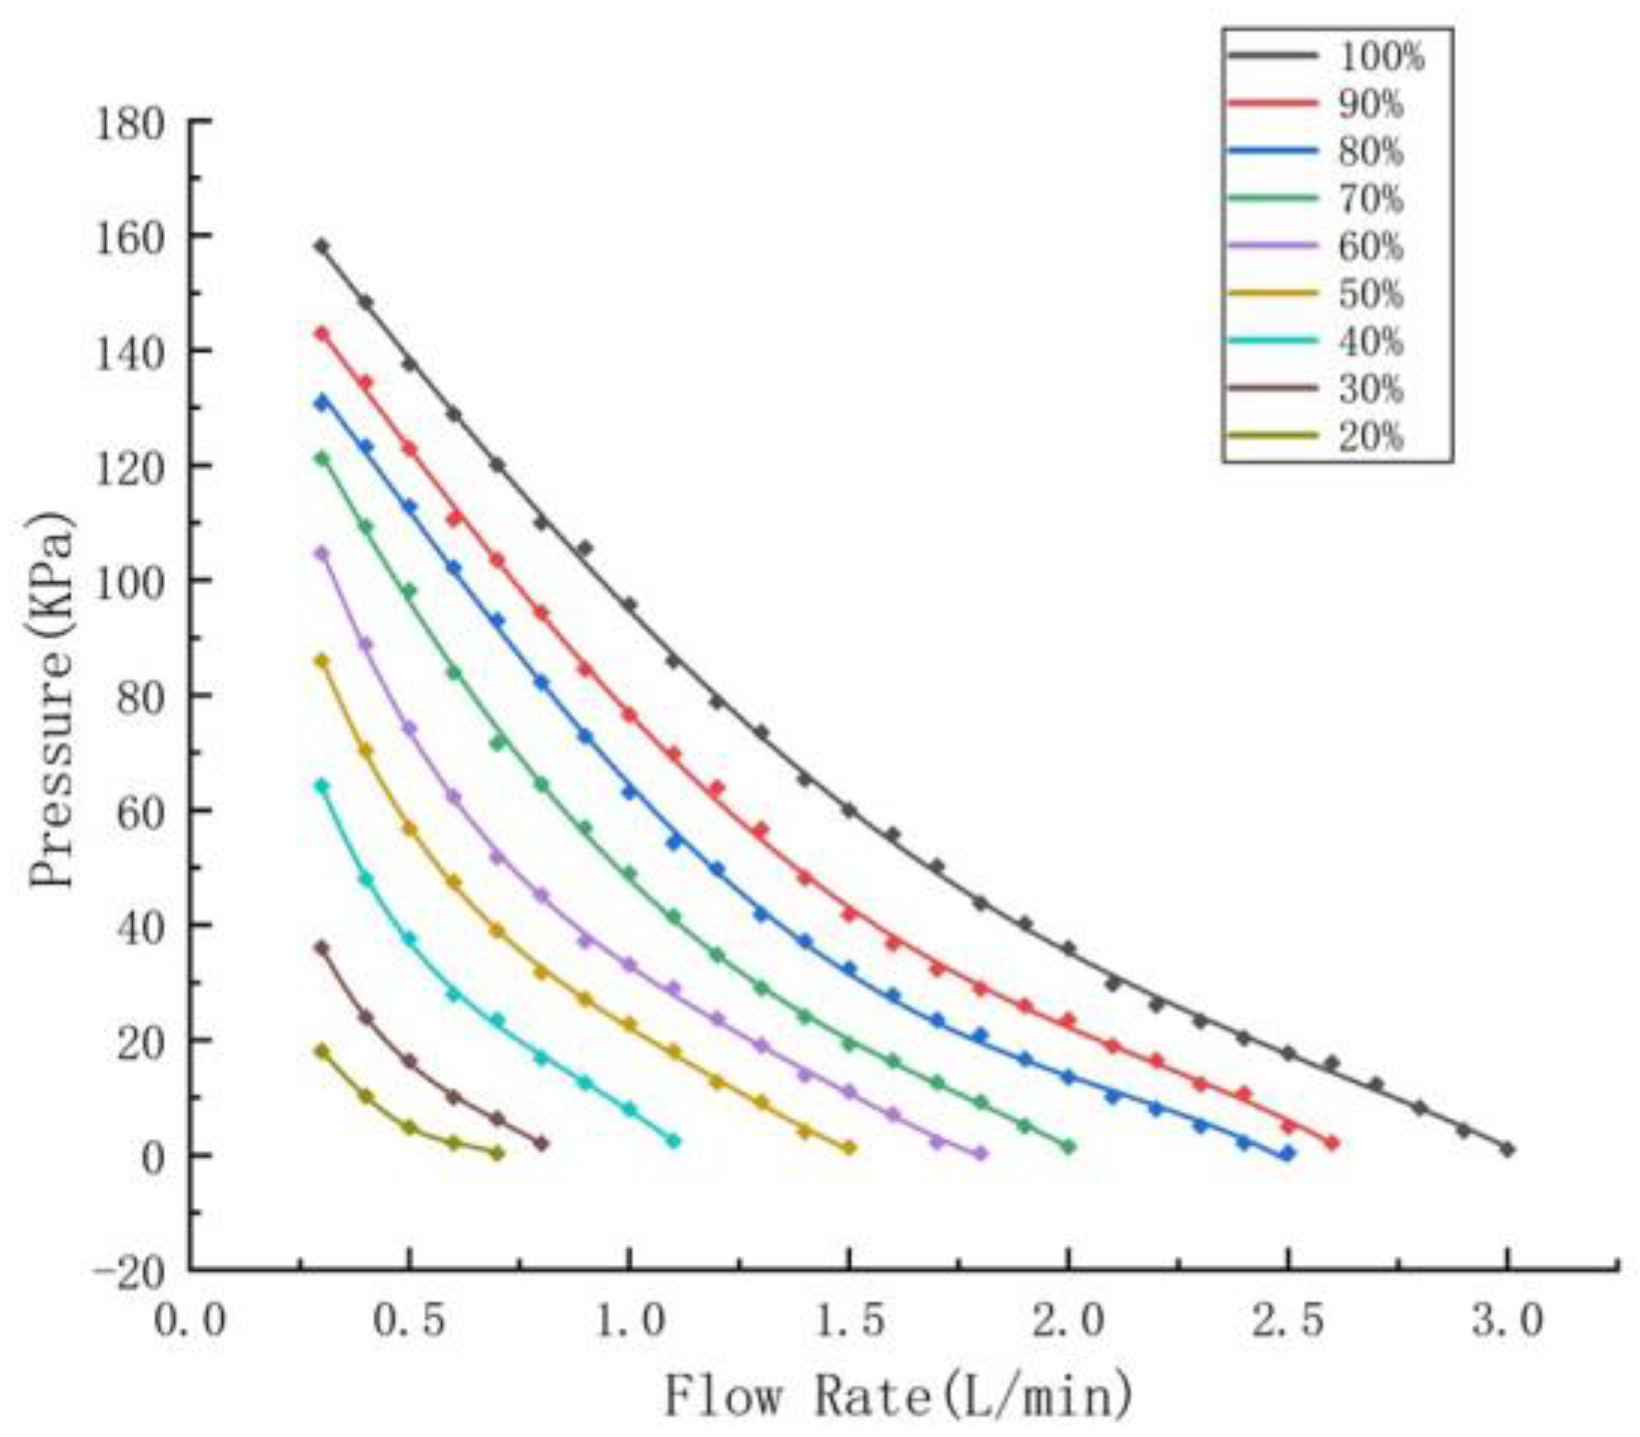
First, control the PWM output to a specific duty cycle (0~100%), then read the corresponding outlet pressure and the output flow rate under the given duty cycle conditions. This allows us to establish the relationship among the three variables. By adopting a strategy of increasing the PWM by 10% each time, the pressure-flow characteristics of the micro flow pump in relation to PWM were analyzed. The resulting data is shown in
Figure 17. Due to some fluctuations in each measurement, 20 data points were collected and averaged to serve as calibration points. In practical operation, at a PWM of 10%, the pressure and flow values were extremely small, approximately zero, due to experimental equipment errors, and thus are not displayed in the graph. In
Figure 17, a fourth-order polynomial was used to fit the data points, and the corresponding curves were obtained. As shown in
Table 3, the corresponding coefficients
of the fourth-order polynomial for the fitting curves and the goodness of fit
R2 are provided.
As shown in
Figure 17, the output pressure of the micro pressure pump is related to the output flow rate and the corresponding PWM duty cycle. Its mathematical model is expressed as:
In the equation,
P represents pressure (kPa),
Q represents flow rate (L/min),
U represents PWM (%), and
ai represents the coefficients of the fourth-order polynomial.
To describe the relationship between PWM and the polynomial coefficients, a third-order polynomial is used for fitting. The form of the third-order polynomial is as follows:
In the equation, represents the fitting coefficients, bi represents the fitting relationship between the PWM signal and the polynomial coefficients ai.
By inputting the PWM and corresponding coefficient values into the fitting function, the least squares method is used to fit the third-order polynomial, obtaining the relationship of each coefficient as a function of PWM:
By substituting Equation (6) into the fourth-order polynomial mathematical model of Equation (4), the mathematical model for the entire microflow pump can be obtained:
4.4. Characteristics Analysis of Electromagnetic Switch Valves
The electromagnetic switching valve, as a critical component widely used in fluid control systems, directly affects the system’s dynamic response, control accuracy, and operational efficiency. This study systematically tested and analyzed the pressure-flow relationship of the valve, examined its operating characteristics, and established a mathematical model through experimental data fitting to elucidate the characteristic patterns of the electromagnetic switching valve.
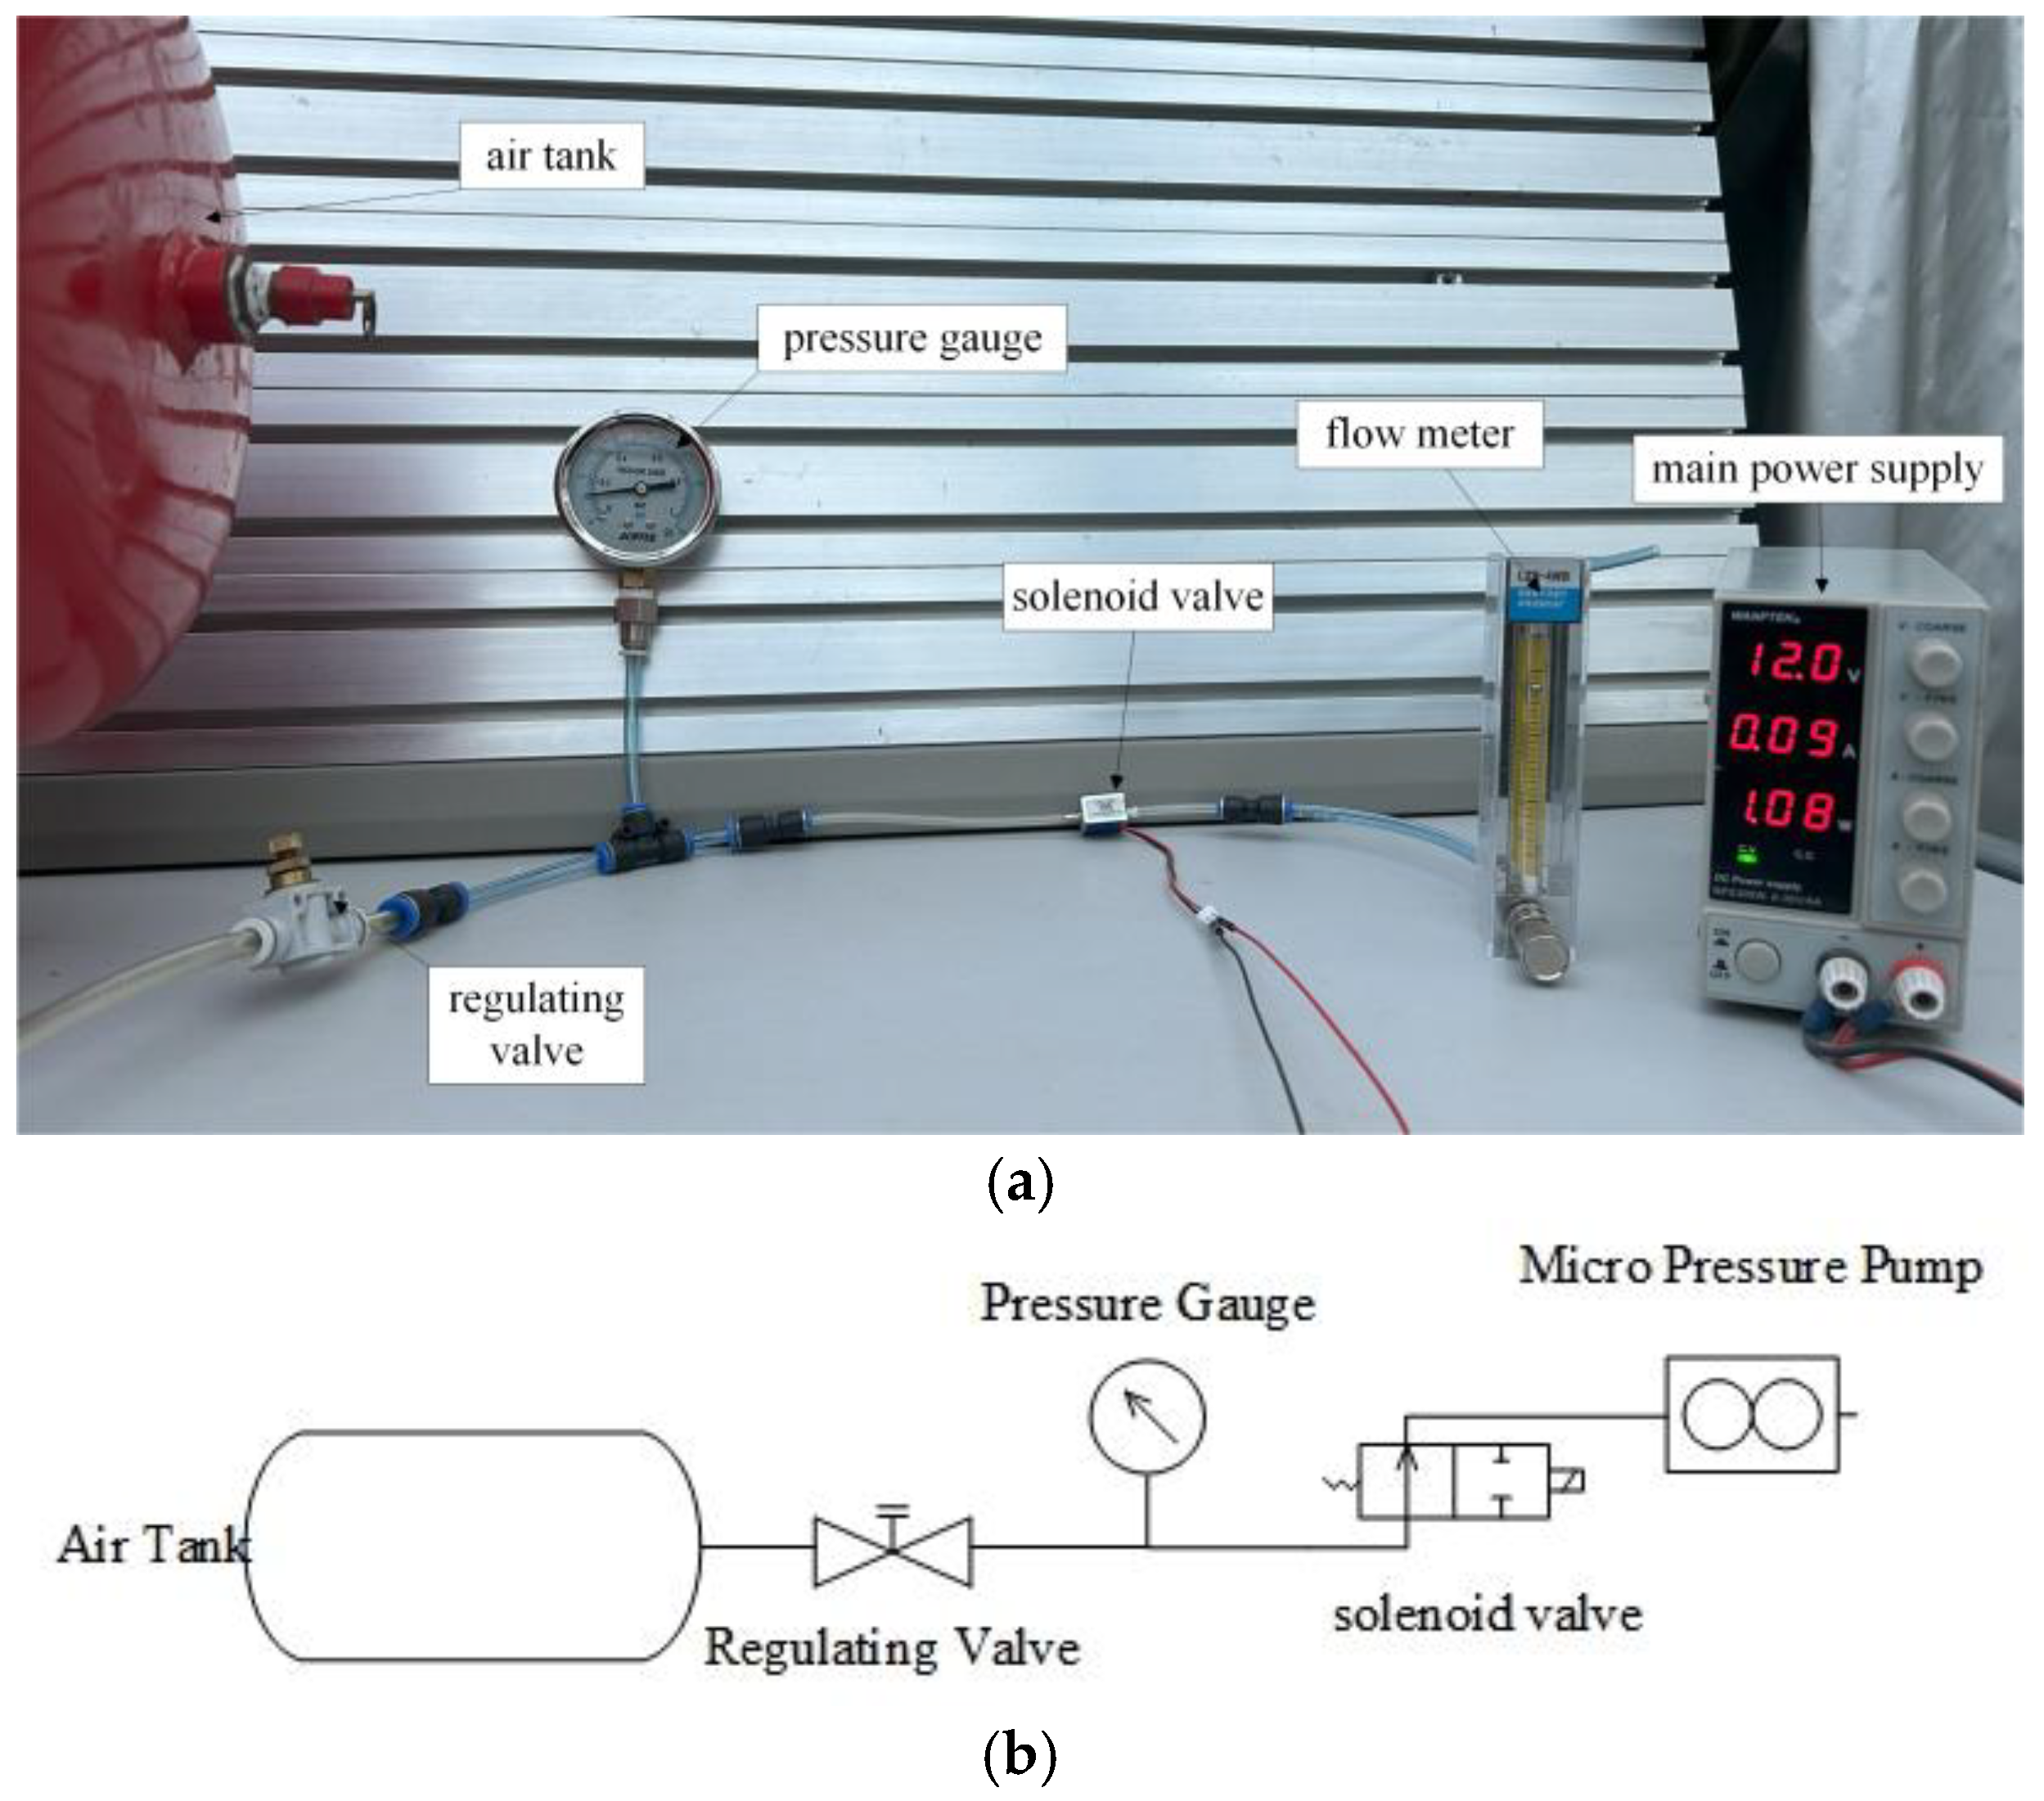
The experimental setup, as shown in
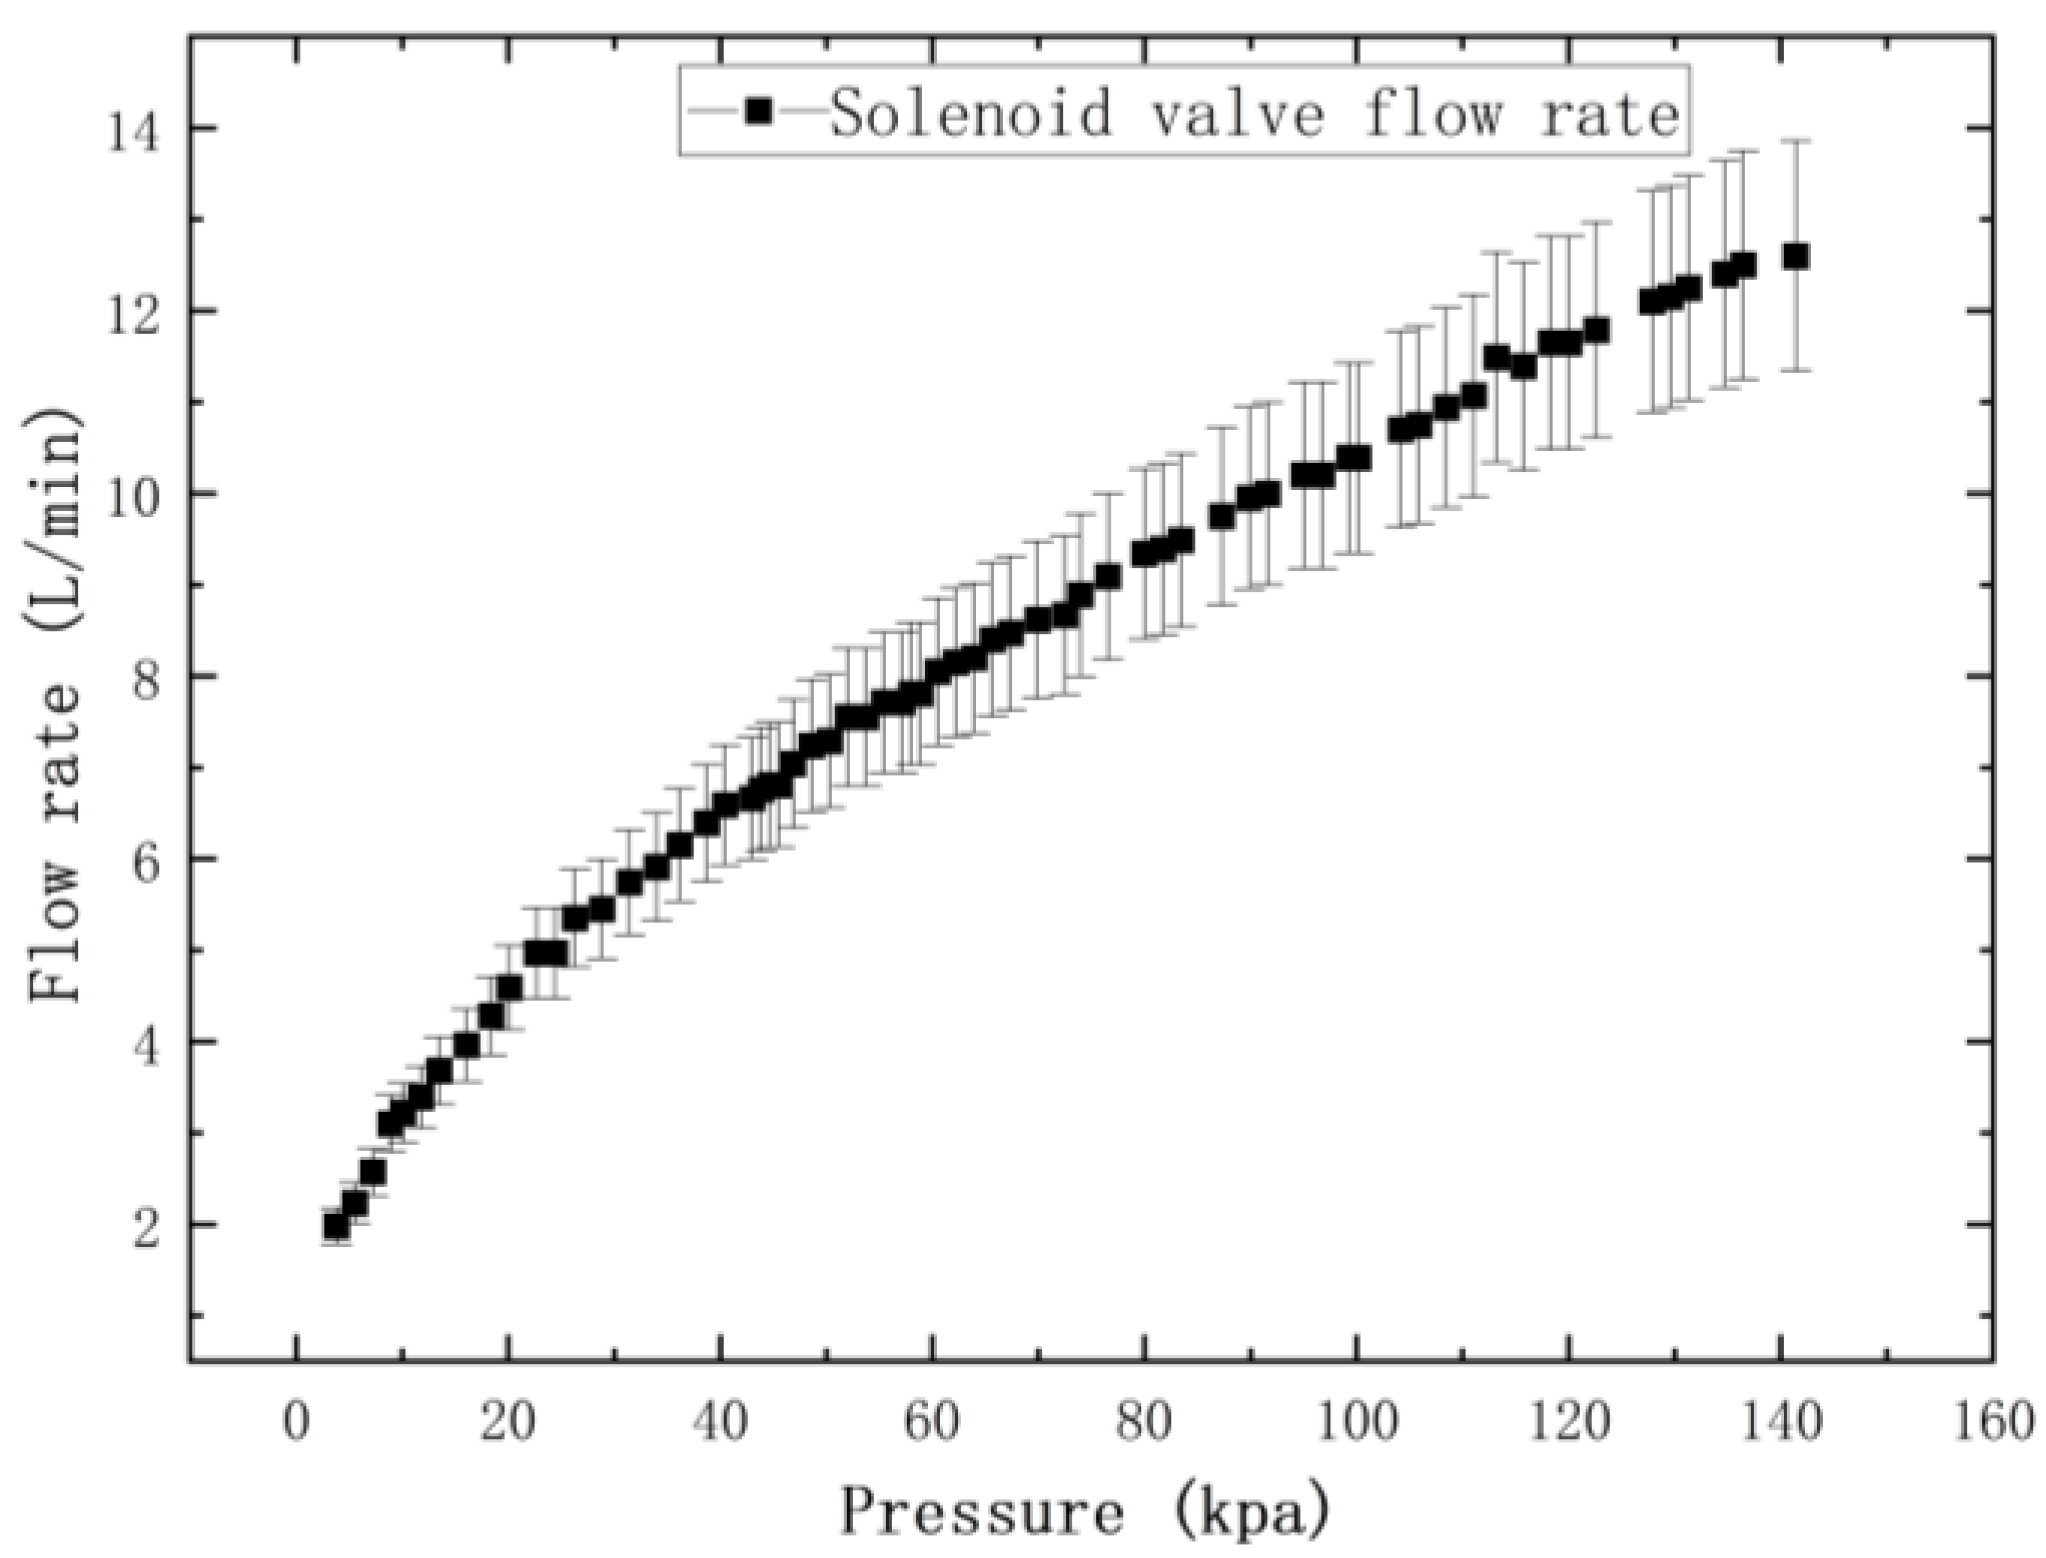
Figure 18, primarily consists of a gas source, a regulating valve, a pressure gauge, an electromagnetic switching valve, a flow meter, and data acquisition equipment. The experiment involved adjusting the input pressure and recording the flow rate variations of the electromagnetic switching valve under different pressure conditions. A total of 20 sets of experimental data were collected, and their average values were used to plot the pressure-flow relationship curve, as shown in
Figure 19. The experimental results indicate that the flow rate of the electromagnetic switching valve exhibits a clear nonlinear variation with increasing pressure.
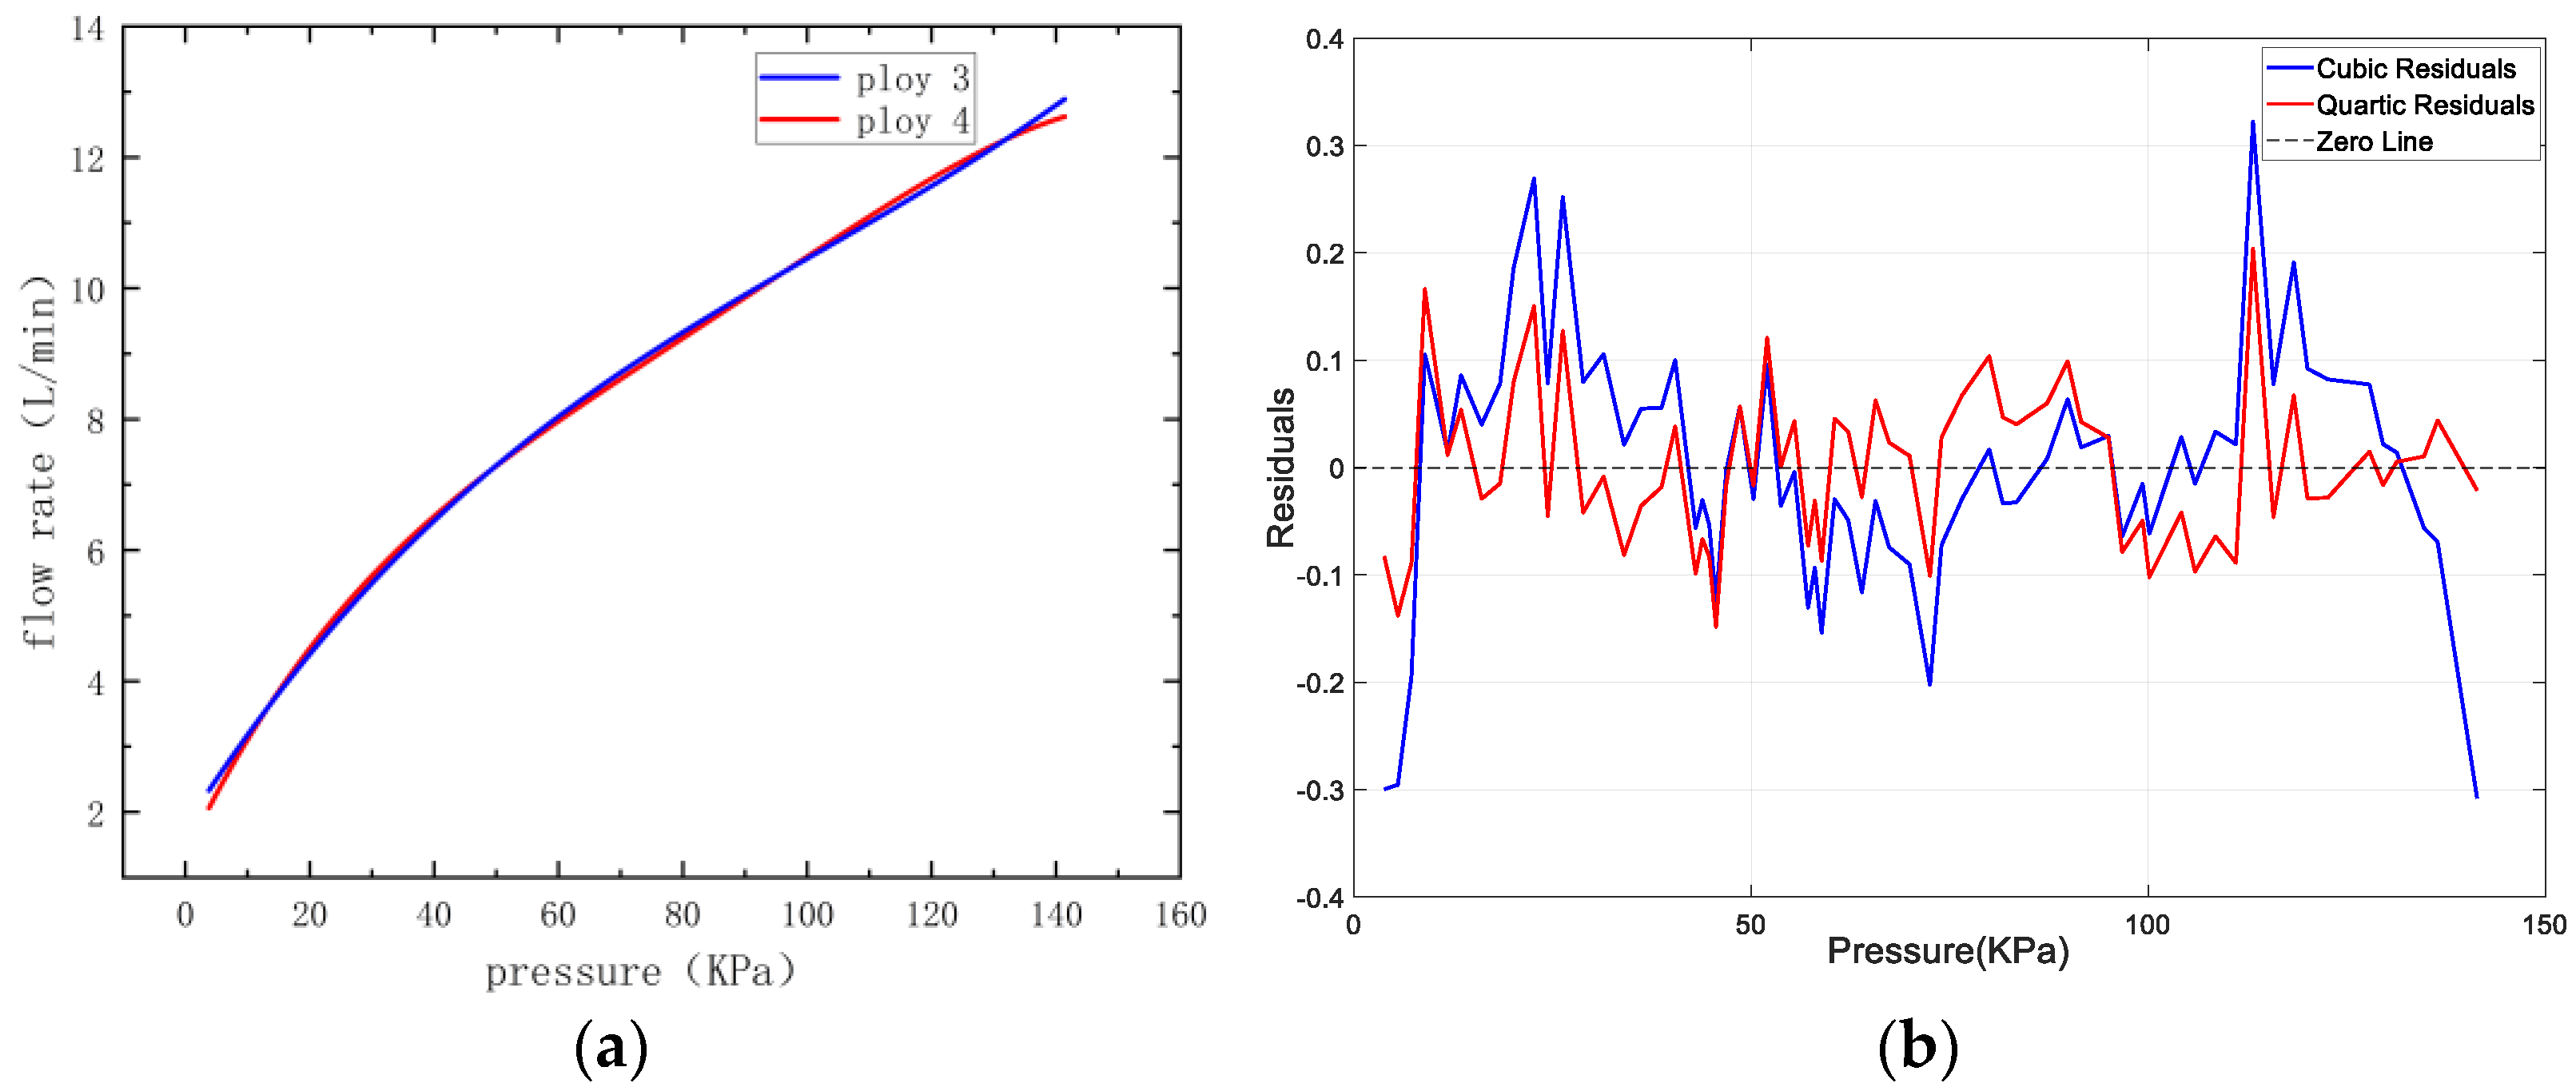
In order to describe the relationship between pressure and flow more precisely, the experimental data were fitted using third- and fourth-degree polynomials, and the fitted curves (
Figure 20) and the corresponding residual distribution plots (
Figure 21) were generated using MATLAB software.
From the residual distribution plot (
Figure 20b), it can be observed that the residual fluctuation range of the quartic polynomial is smaller and more evenly distributed, indicating higher fitting accuracy and data consistency. Therefore, the quartic polynomial fitting curve is selected as the mathematical model to describe the pressure-flow relationship of the electromagnetic switching valve.
In summary, through polynomial fitting analysis, the mathematical model of the electromagnetic switching valve is obtained as shown in Equation (8). This model can accurately describe the pressure-flow relationship of the electromagnetic switching valve in practical operation.
4.5. Accumulator Design for Pneumatic Control Circuits
Due to the structural characteristics of the microflow pump, its supply flow is not continuously stable. Therefore, in order to smooth the overall pipeline pressure, an accumulator is added as a buffer device. The accumulator consists of three parts: a 300 mL volumetric bottle, a pneumatic quick-release interface, and a 3D-printed connector. In order to ensure the airtightness of the overall accumulator, sealant is applied at the connection between the two ends of the 3D-printed part, as shown in
Figure 21.
5. Fuzzy PID Control Study of Multi-Chamber Flexible Mechanisms
5.1. Incremental PID Control Strategy
In recent years, the development of microprocessor technology and the exploration of the universality of embedded system development have provided a good implementation platform for some complex control strategies. Due to the increasing complexity of production technology required for industrial production, some non-traditional control systems also urgently need further processing, especially for some nonlinear and parameter-unknown systems, which require high robustness of the controller. However, PID control, as the focus of traditional control, has always been the most common and widely used traditional control algorithm. Digital PID control, also known as discrete PID control, can be subdivided into positional PID control and incremental PID control. The output of incremental PID control is the increment of the control quantity, which can reduce the impact of accumulated errors and accuracy issues on the output [
35]. This article intends to adopt a discrete incremental PID control strategy.
The control law of the PID control strategy is:
where:
t—The time interval from the start of adjustment to the output of the current control quantity;
—output value;
—deviation, the difference between the output value and the input value of the controlled object;
—proportional gain;
—integral time constant;
—derivative time constant.
The transfer function of the PID controller is:
To discretize the integral and derivative terms in a simulated PID controller, first replace time
t with a series of sampled points. Then, use a summation formula to replace the integral term and a difference formula to replace the derivative term.
In the equation,
k represents the sampling index, and
T is the sampling period. Replacing
with
, we obtain the following formula. As can be seen from the formula, when the sampling period
T is sufficiently short, the control accuracy of the position-based PID controller can be ensured to a certain extent.
where:
—The system output value at the k-th sampling;
—The input error value at the k-th sampling;
—The input error value at the (k − 1)-th sampling.
The algorithm for the incremental PID control strategy can be derived from Equation (11) using the recursive principle:
Subtracting Equation (12) from Equation (9) yields:
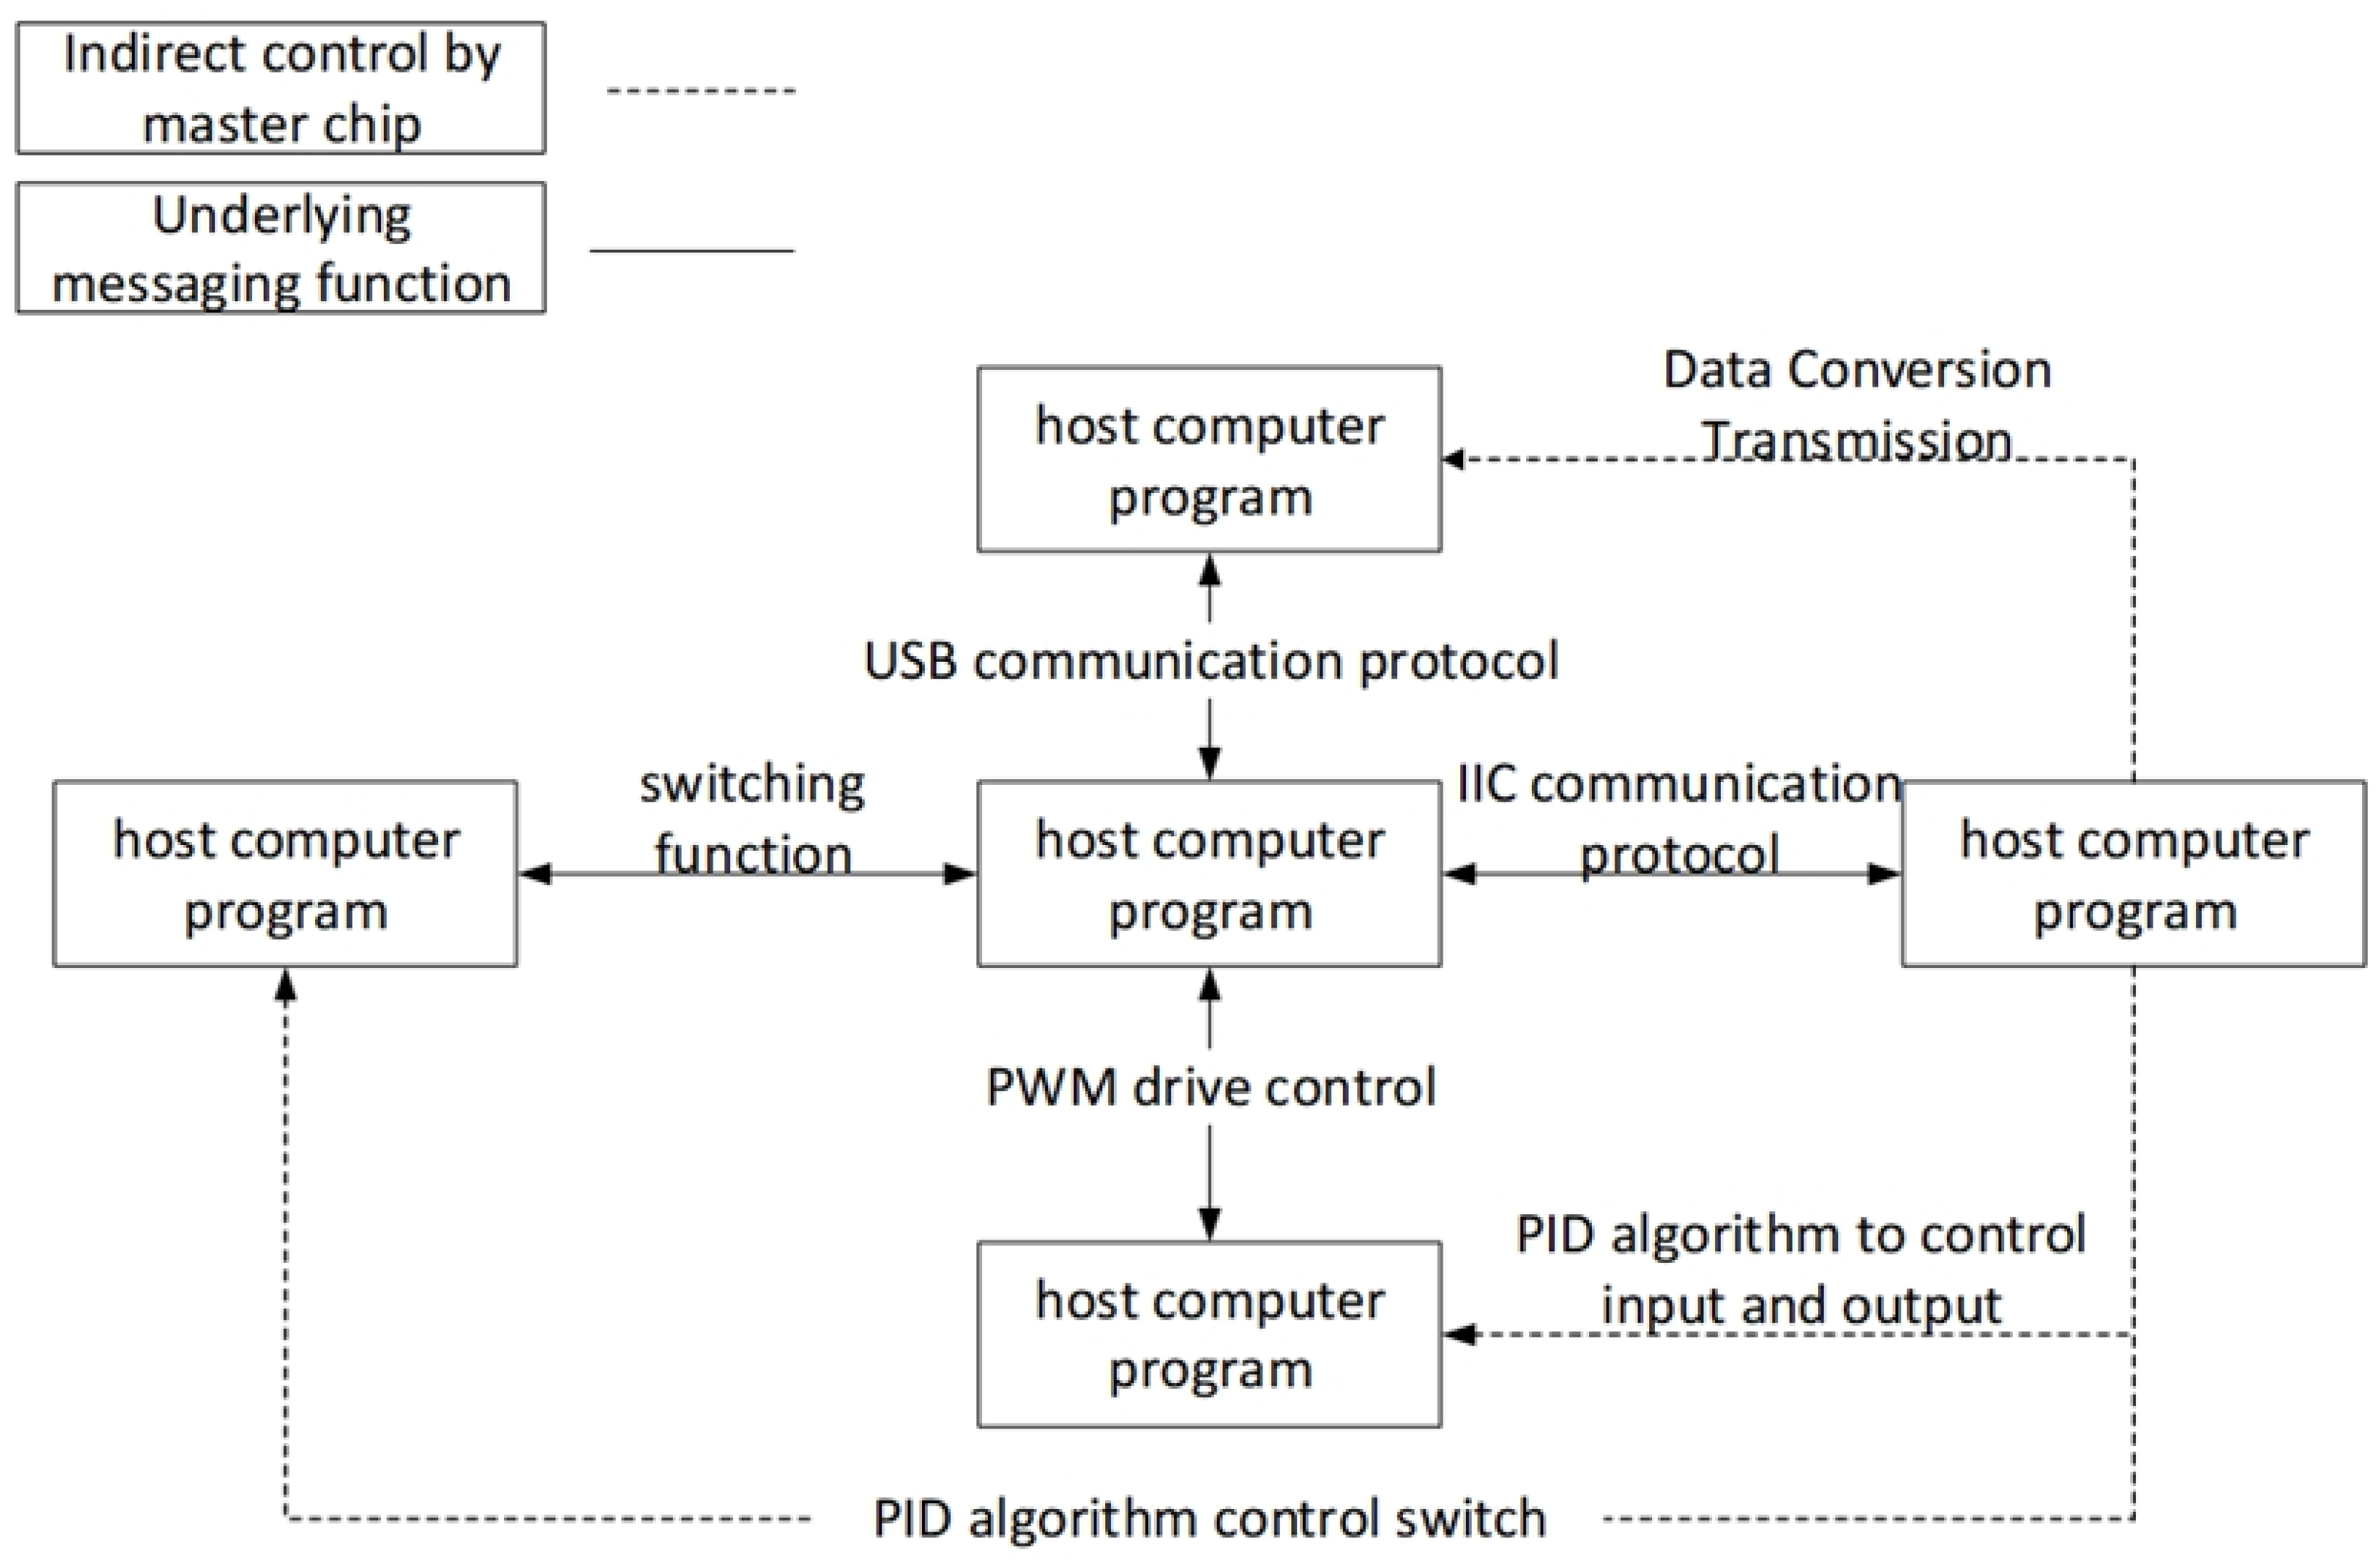
The block diagram of the discrete incremental PID control system is shown in
Figure 22.
5.2. Fuzzy PID Control Strategy
When using traditional PID control logic, the control effects, such as response speed and steady-state precision, are often not well balanced. One solution to this problem is to modify the main PID tuning parameters in real time, thereby achieving both fast dynamic response and accurate steady-state precision.
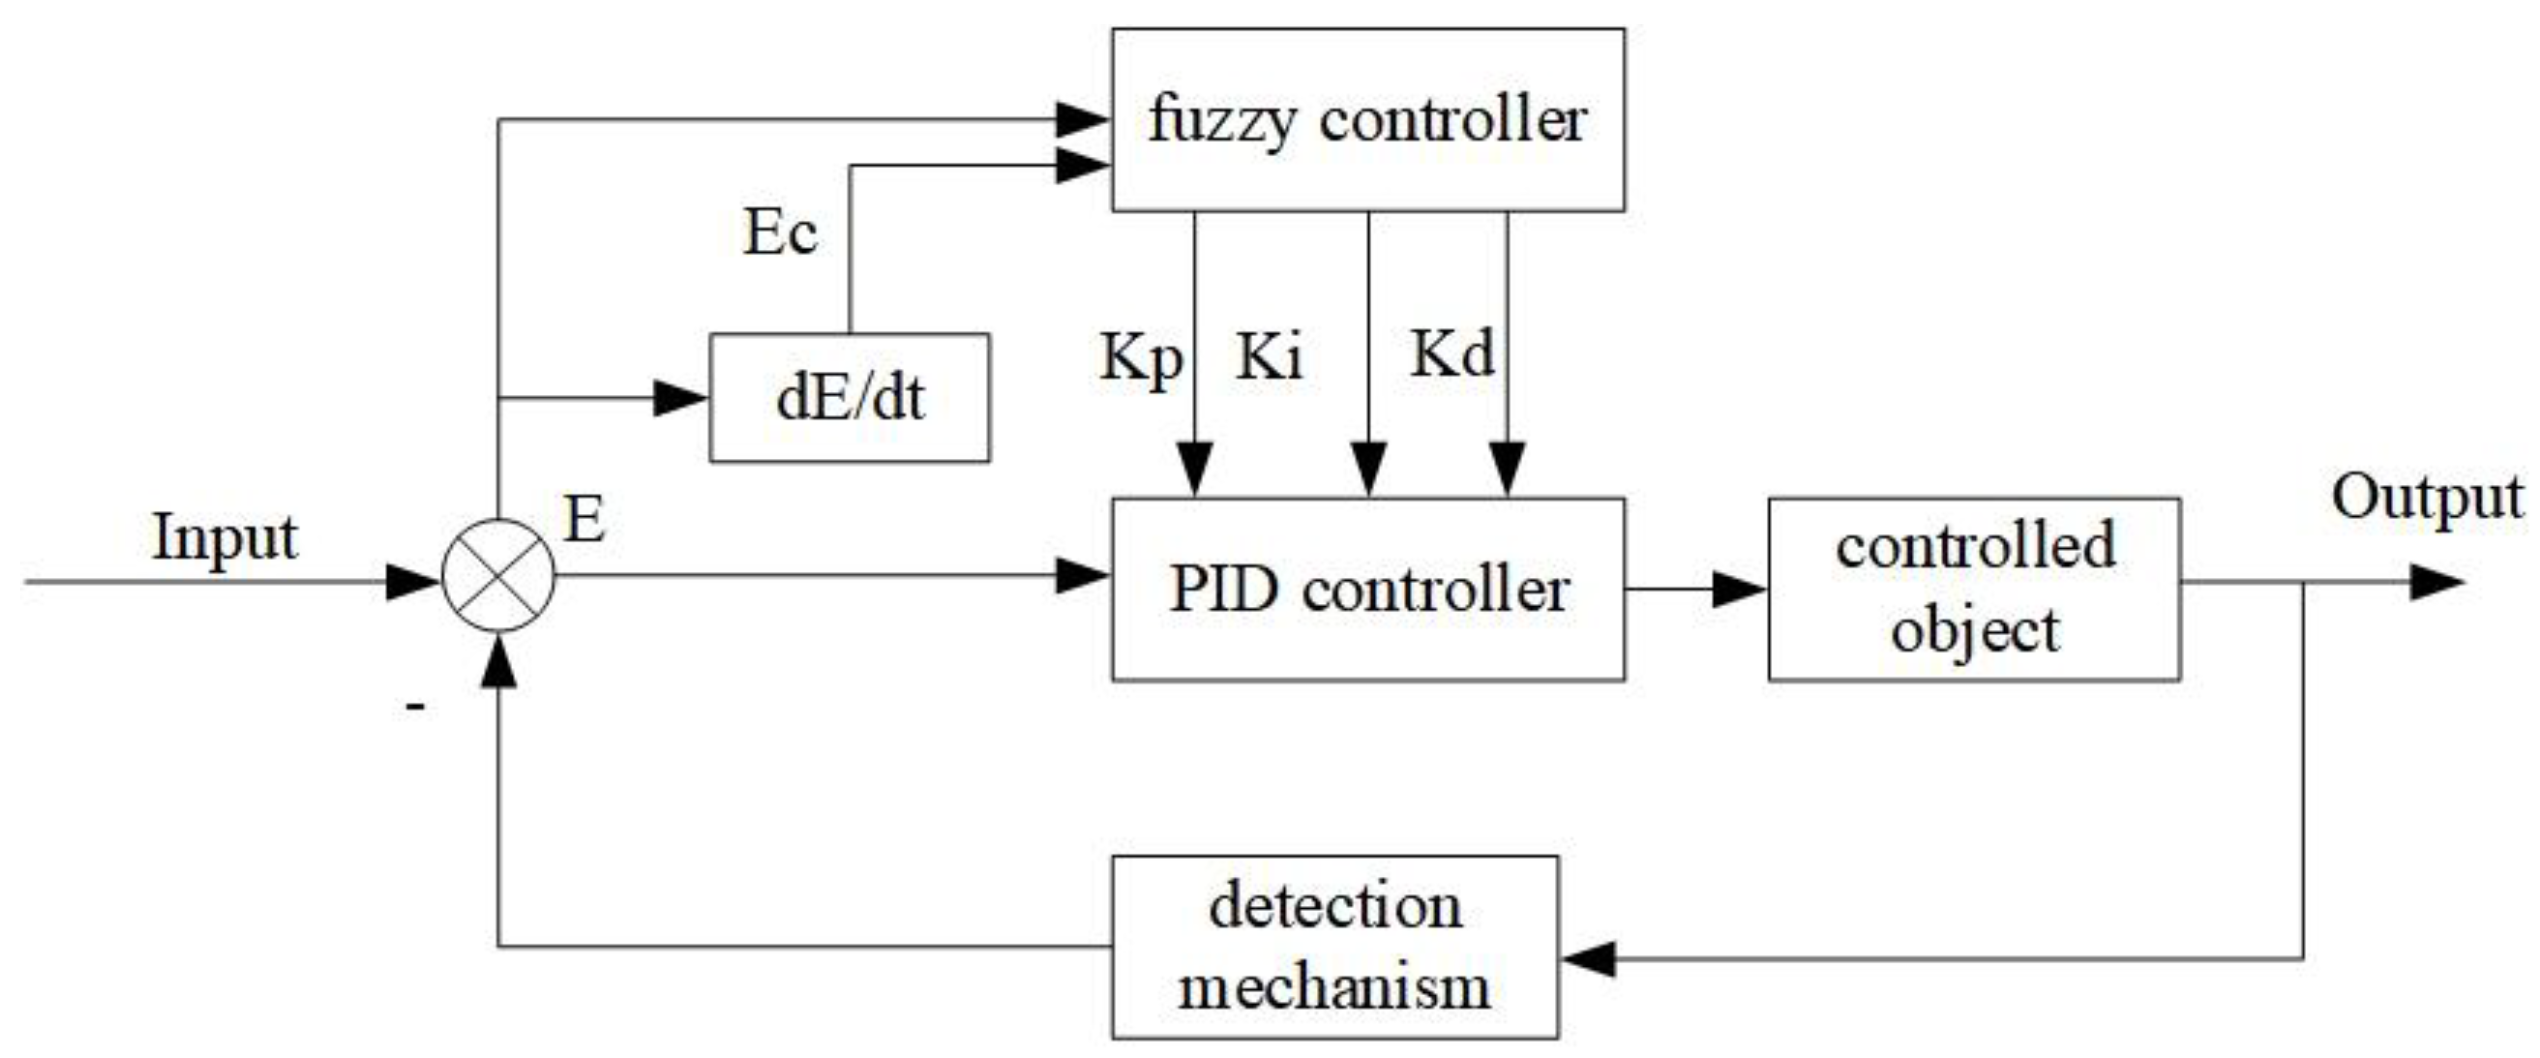
Fuzzy PID is a control strategy that uses a fuzzy controller to adjust PID parameters in real time. Compared to conventional PID control, fuzzy PID integrates a fuzzy controller that utilizes the error and its derivative to dynamically modify the main PID tuning parameters for control optimization. This enables the PID parameters to be adjusted dynamically, making the system adaptable to nonlinear and time-varying characteristics.
Fuzzy PID control introduces a fuzzy controller to adjust the main tuning parameters of the PID controller in real time based on the current error and the error rate of change (error derivative). This rule-based gain scheduling enables fuzzy PID control to adapt to complex and nonlinear control requirements. The control structure is shown in
Figure 23 [
36].
Pressure is kept as the 1 kHz inner-loop variable, whereas vision sensing operates at ~30 Hz. The fuzzy rules (
Table 4,
Table 5 and
Table 6, ZO column) impose a no-overshoot constraint that keeps chamber pressure within ±2 kPa of the set-point and eliminates pressure spikes, while still achieving a comparable (and in our tests slightly faster) rise-time, as shown in Figure 27.
5.3. Establishment of Fuzzy PID Database
Considering the limited computing performance of the microcontroller and the constraints on the range of the main PID tuning parameter
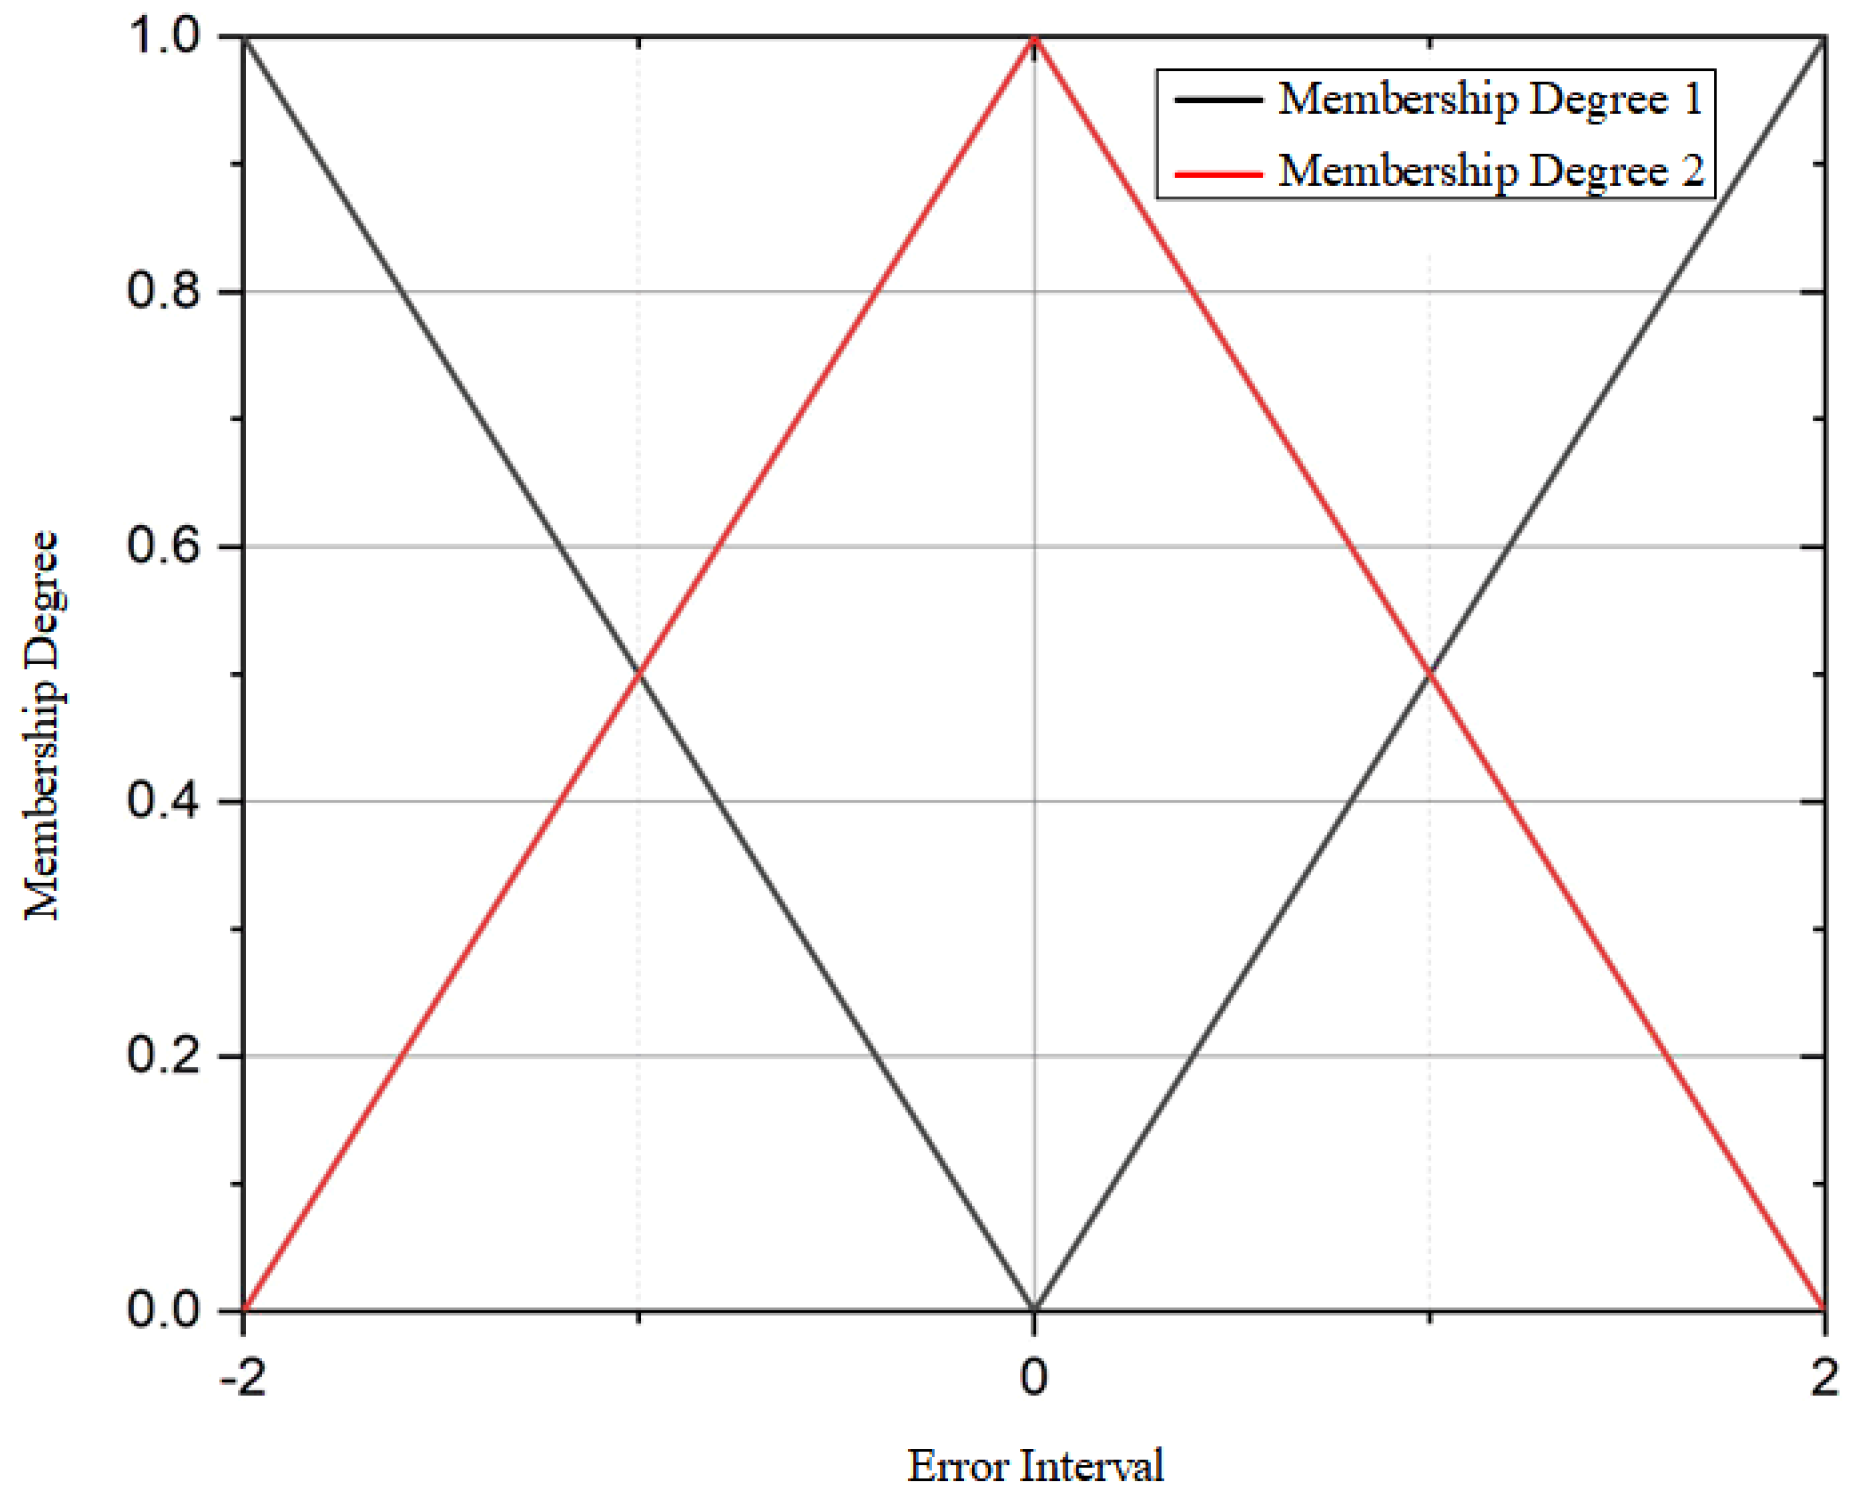
, a triangular membership function is adopted, and the centroid method is used to calculate the final output value.
Figure 24 shows the schematic diagram of the triangular membership function used in fuzzy PID control.
Using
Table 4,
Table 5 and
Table 6 as the corresponding fuzzy rule libraries for the main adjustment parameters of PID, the changes in the main adjustment parameters and their first derivative
ec of PID are divided into five levels for regulation: positive large (PB), positive small (PS), zero (ZO), negative small (NS), and negative large (NB).
To show how these rules were generated, the design methodology is summarized below.
The fuzzy rule-base was generated by the following structured procedure:
- (1)
Input variables: The normalized error e(k) and its first-order difference Δe(k) fully describe the closed loop.
- (2)
Linguistic partitioning: Both inputs are divided into five symmetric terms {NB, NS, ZO, PS, PB} with 50 % overlap, represented by triangular membership functions (
Figure 24).
- (3)
Output strategy: Three 5 × 5 tables are defined:
Table 4 updates Δ
Kp,
Table 5 updates Δ
Ki, and
Table 6 updates Δ
Kd. Their design follows the Mac Vicar-Whelan heuristics:
increase when |e| is large;
add only when |e| is small to prevent wind-up;
raise when the error slope is steep to improve phase lead.
- (4)
Illustrative derivation: If e = PB and ec = NB (large positive error that is already decreasing), the chosen actions are ΔKp = PS, ΔKi = NB, ΔKd = PB.
- (5)
Scaling factors—Hardware tests on a 20 → 70 kPa step input yielded optimal gains = 0.12, = 0.08, and = 0.15 (Equation (17)), identified by minimizing the integral of absolute error.
The resulting 5 × 5 × 5 rule-base (
Table 4,
Table 5 and
Table 6) is conflict-free, symmetric, and readily implementable on the STM32 microcontroller.
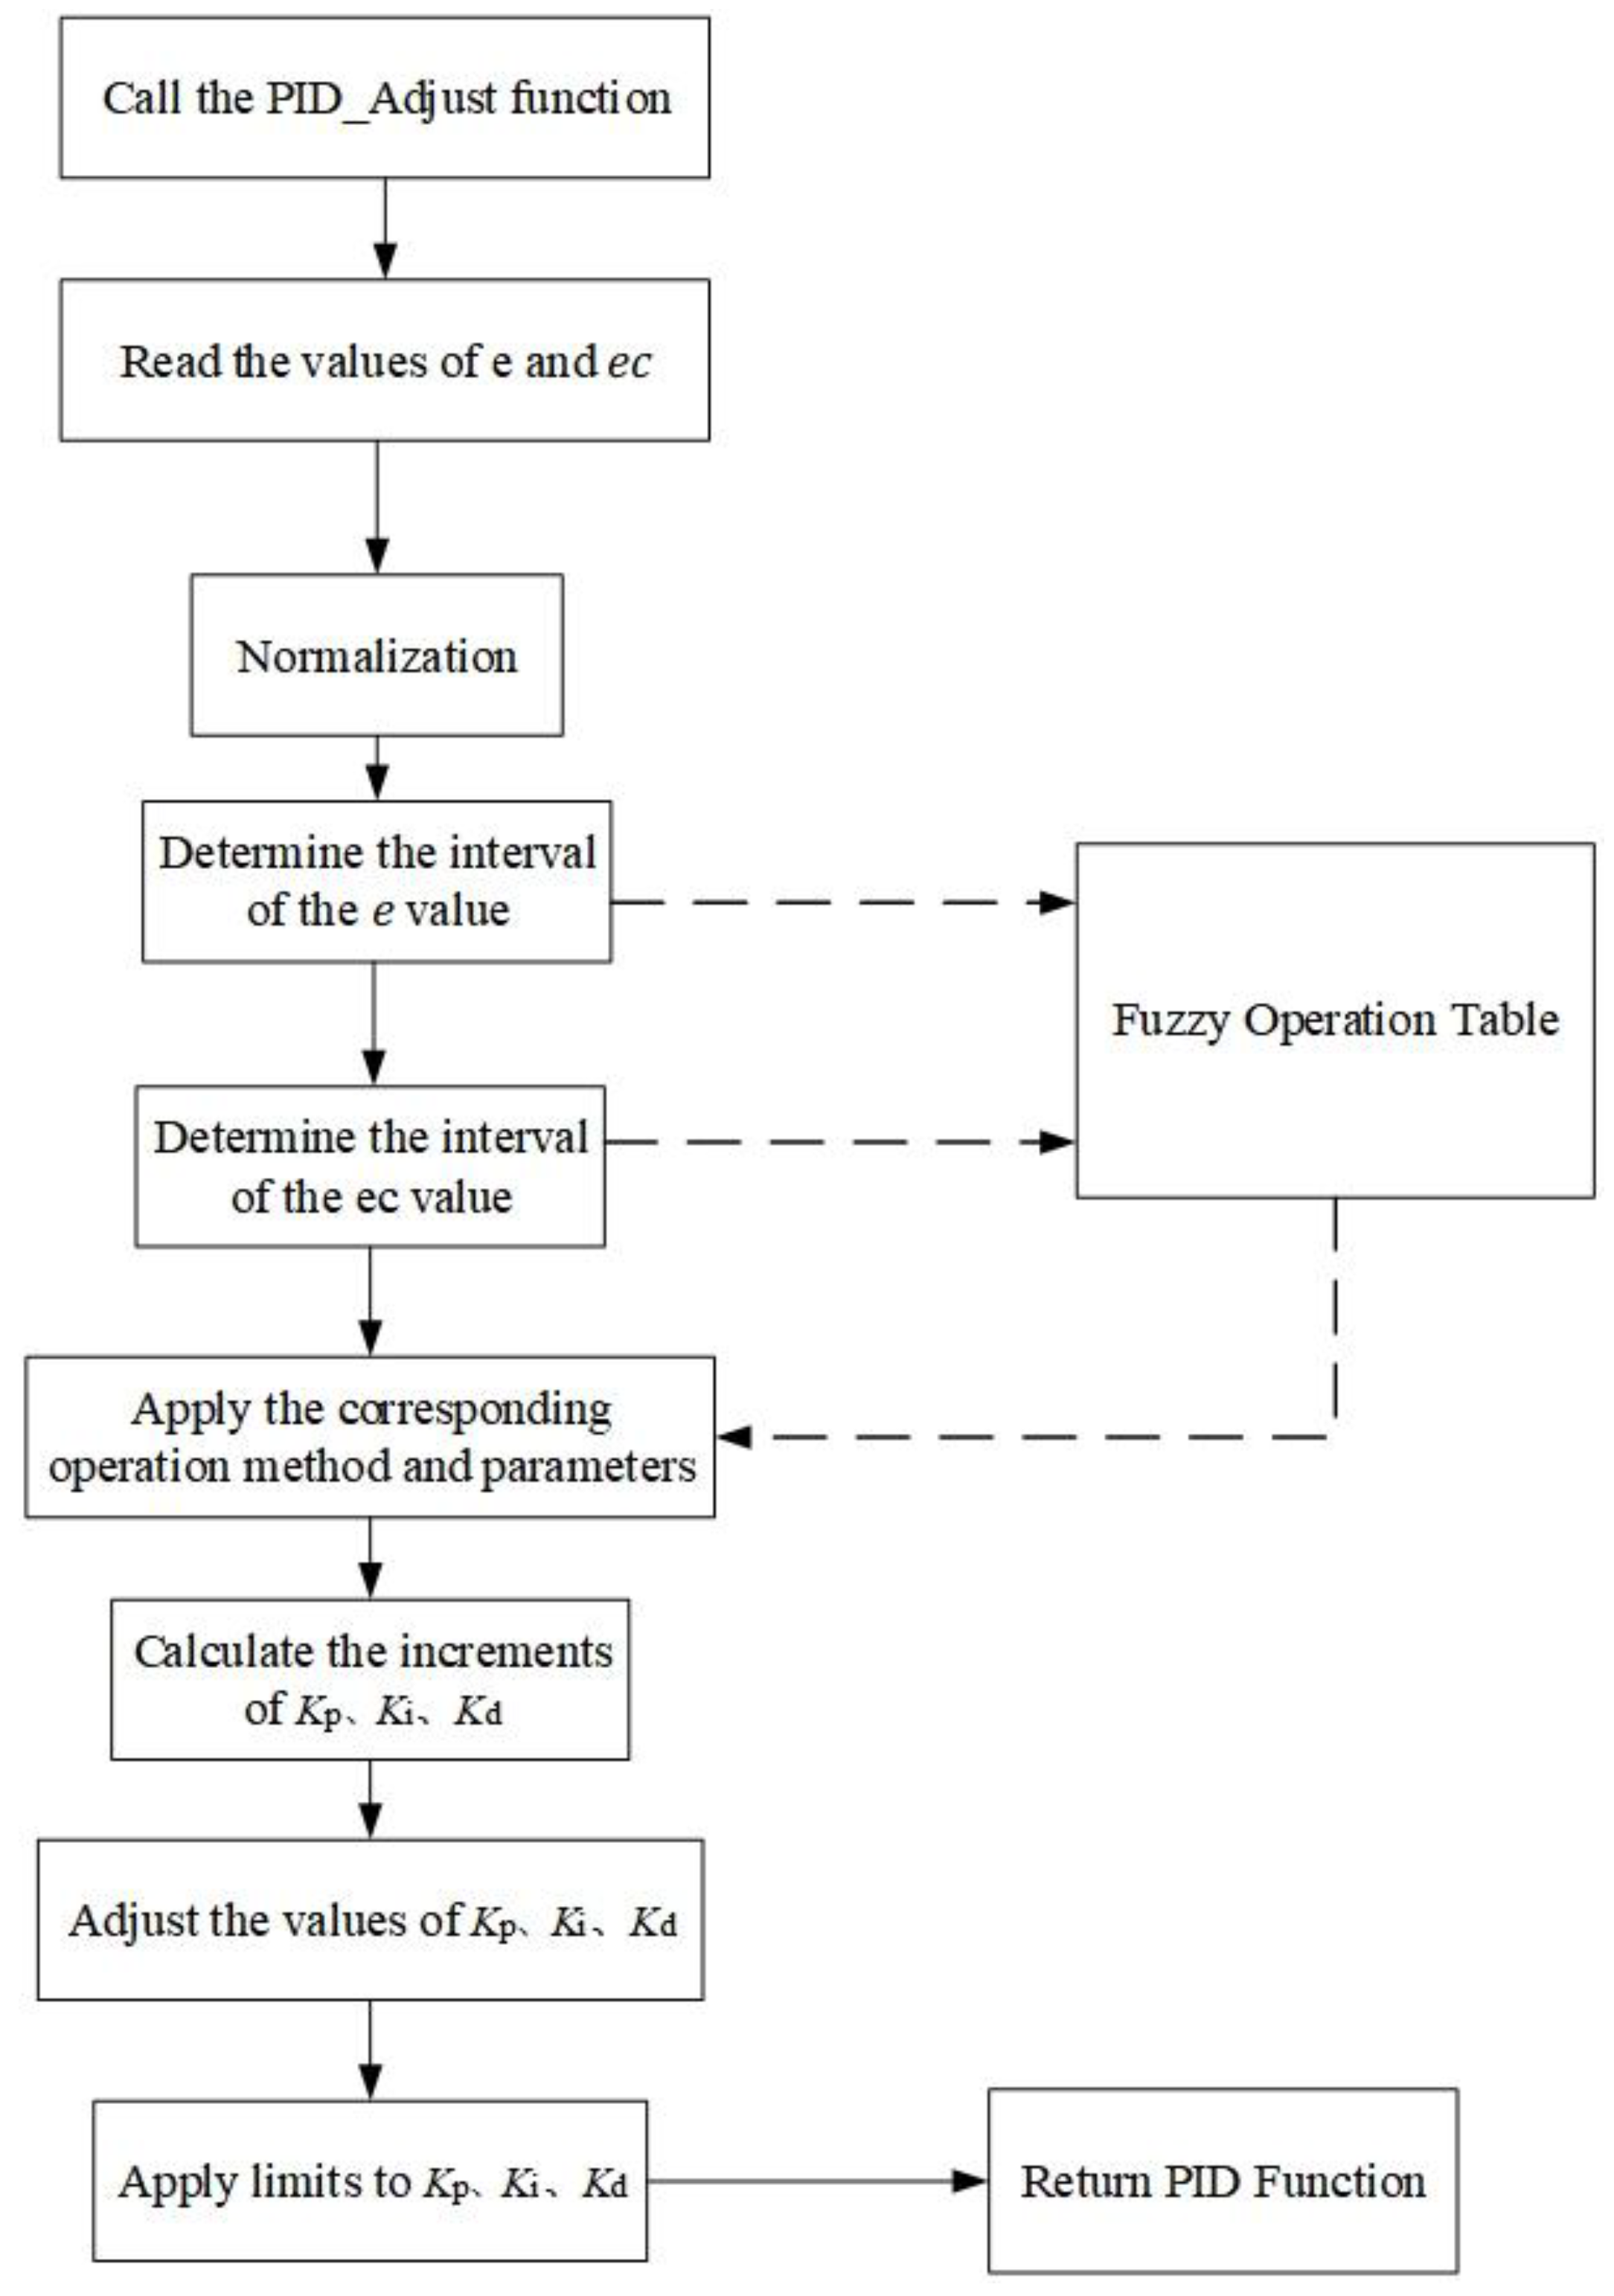
The fuzzy rules are processed by segmented judgement, and the deviation and its first-order derivative are firstly normalized. Due to the discrete PID control, the first-order derivative can be regarded as the error between the error of the last sampling result and the error of the current sampling result, which further determines the approximate range of the error and its first-order derivative, and this is used to carry out the normalization process, which is convenient for the fuzzy operations to be carried out in the subsequent period.
Since the triangular membership function is used and the input values have been normalized, the affiliation of the fuzzy variables in which the inputs and outputs are located is the same at any sampling moment, so the quantitative value of each output can be calculated using the center of gravity method [
37]. Its formula is shown in Equation (15):
where
is the membership degree,
is the fuzzy quantitative value, and
is the output value calculated using the centroid method. Since the sum of the membership degrees calculated in any direction for the chosen membership function is always 1, the denominator in Equation (15) can be omitted. Therefore, the actual calculation can be simplified to the following matrix operation, as shown in Equation (16):
Since the input variables of fuzzy control are normalized, the output variables of fuzzy control need to be converted into actual values to obtain the real variation. To achieve this, a coefficient
can be introduced to scale the variation in
and the specific implementation is shown in Equation (17):
where ∆
K is the fuzzy logic output value,
is the scaling factor,
is the PID parameter value at the previous time step, and
is the PID parameter value at the current time step.
To implement the fuzzy logic controller, this experiment uses triangular membership functions to process the fuzzy operation rules. First, the normalized value of e is checked to determine whether it falls within one of the four intervals: −1 to −0.5, −0.5 to 0, 0 to 0.5, or 0.5 to 1. Then, the normalized value of
ec is similarly checked to see if it lies within one of these four intervals. Based on this, the corresponding fuzzy logic parameters are selected to perform the fuzzy logic operations. The centroid method is used to calculate the output membership degree, yielding a normalized fuzzy output result. Based on this result, the parameter
is adjusted to achieve better response speed and steady-state accuracy. The overall logic operation is shown in
Figure 25.
5.4. PID Parameter Tuning Experiment Using the Fuzzy Control Rule Base
In order to better exploit the effect of fuzzy controllers on the tuning of PID parameters [
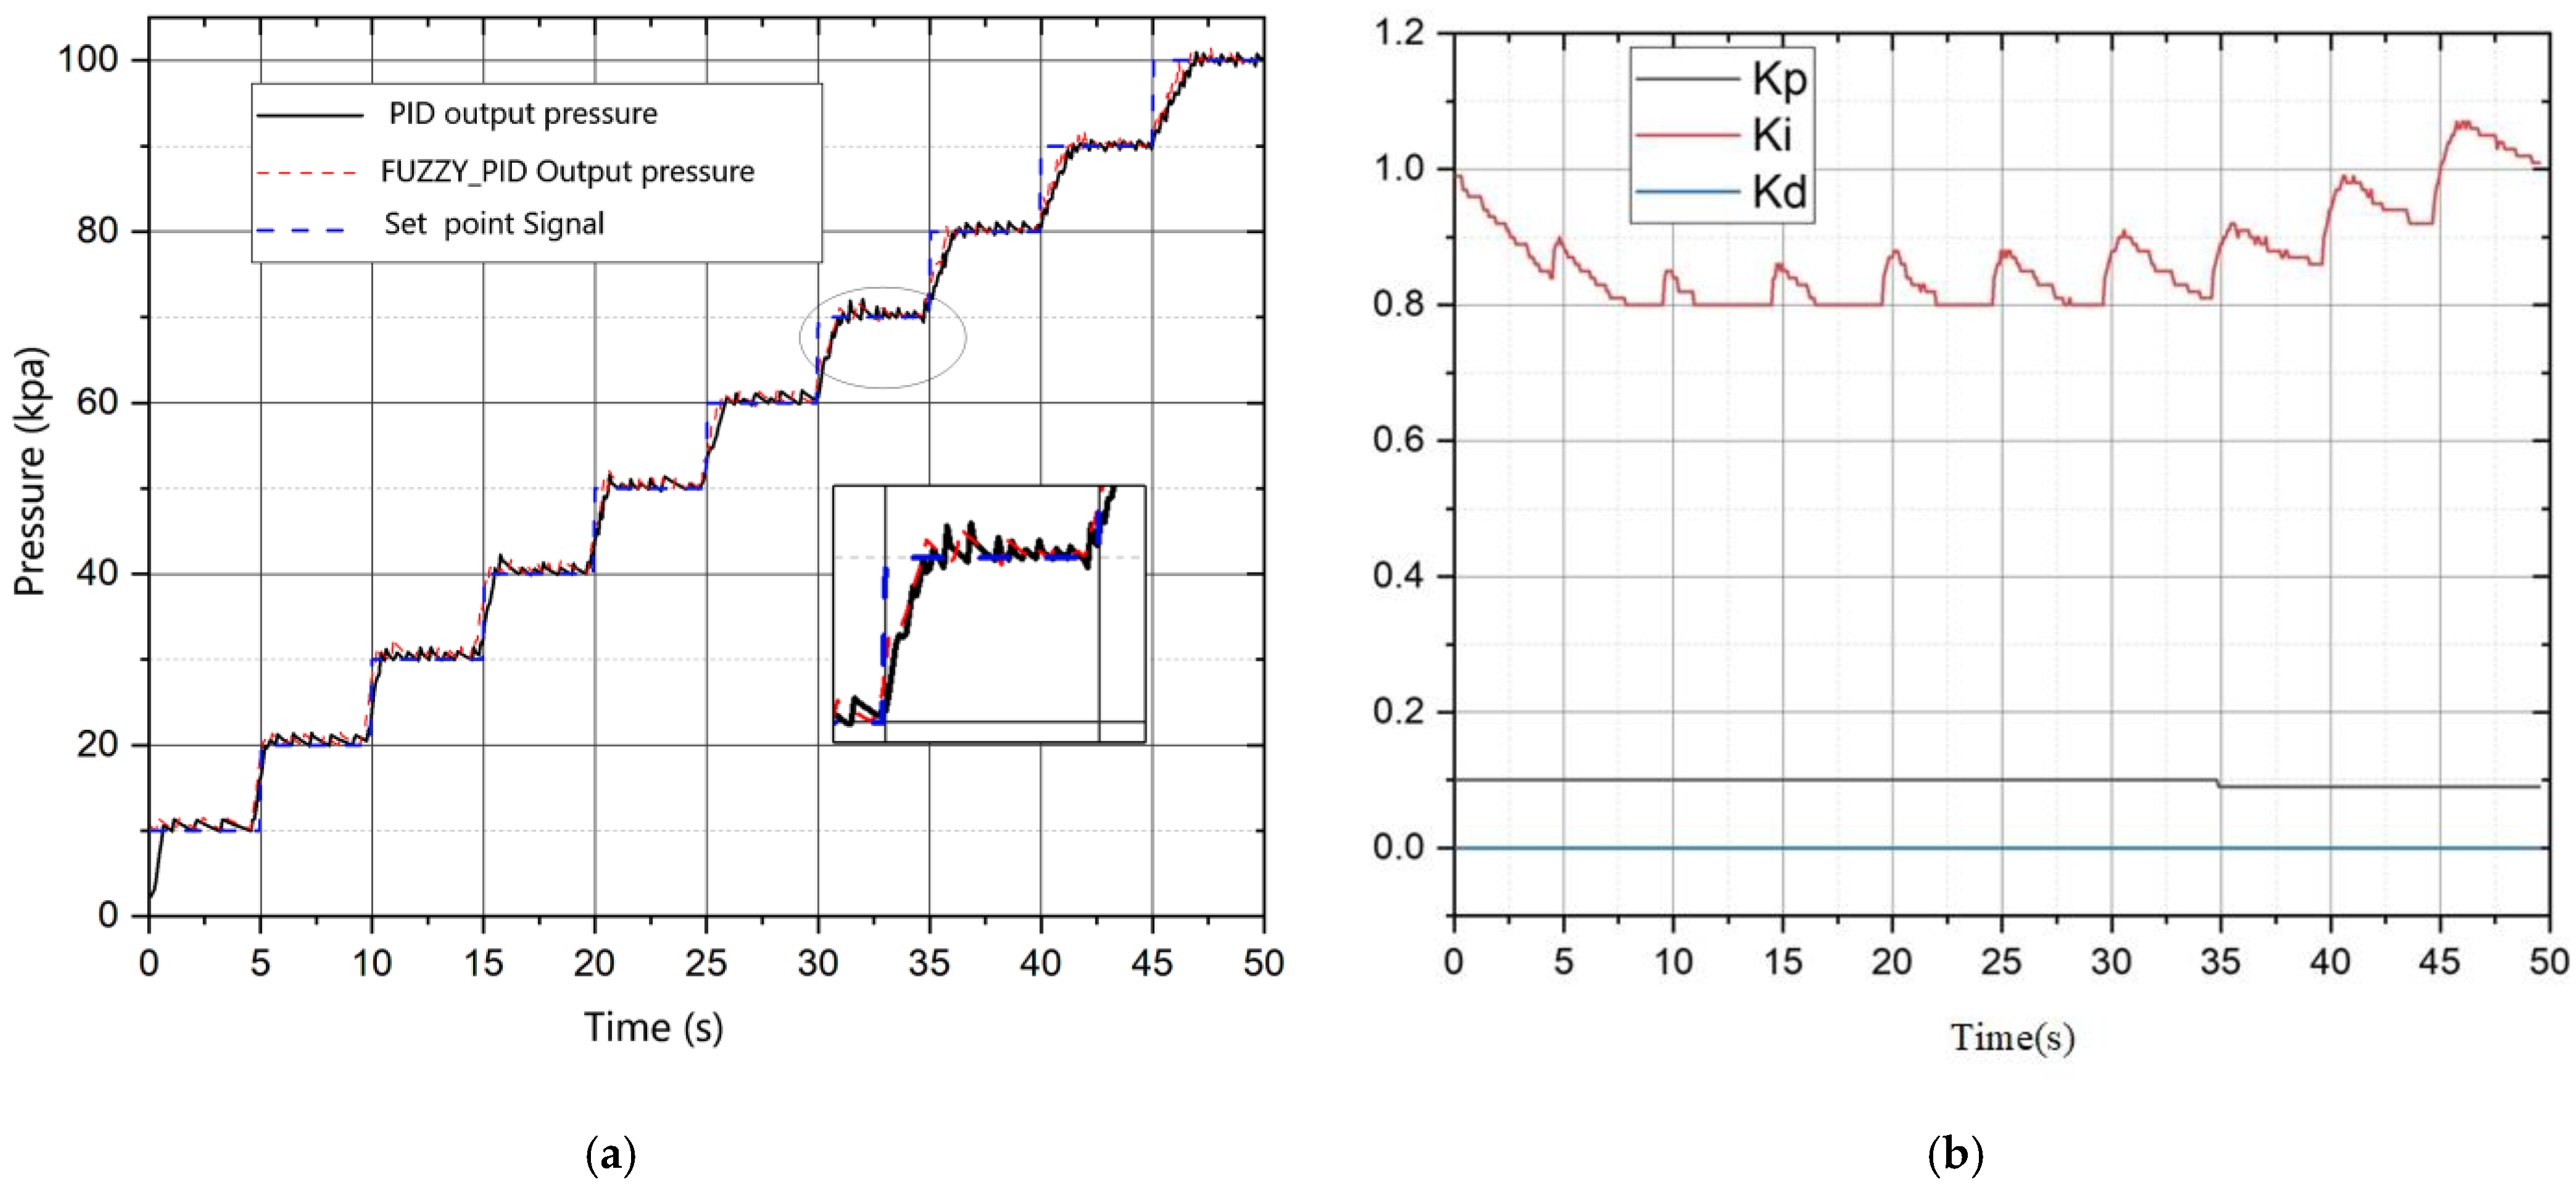
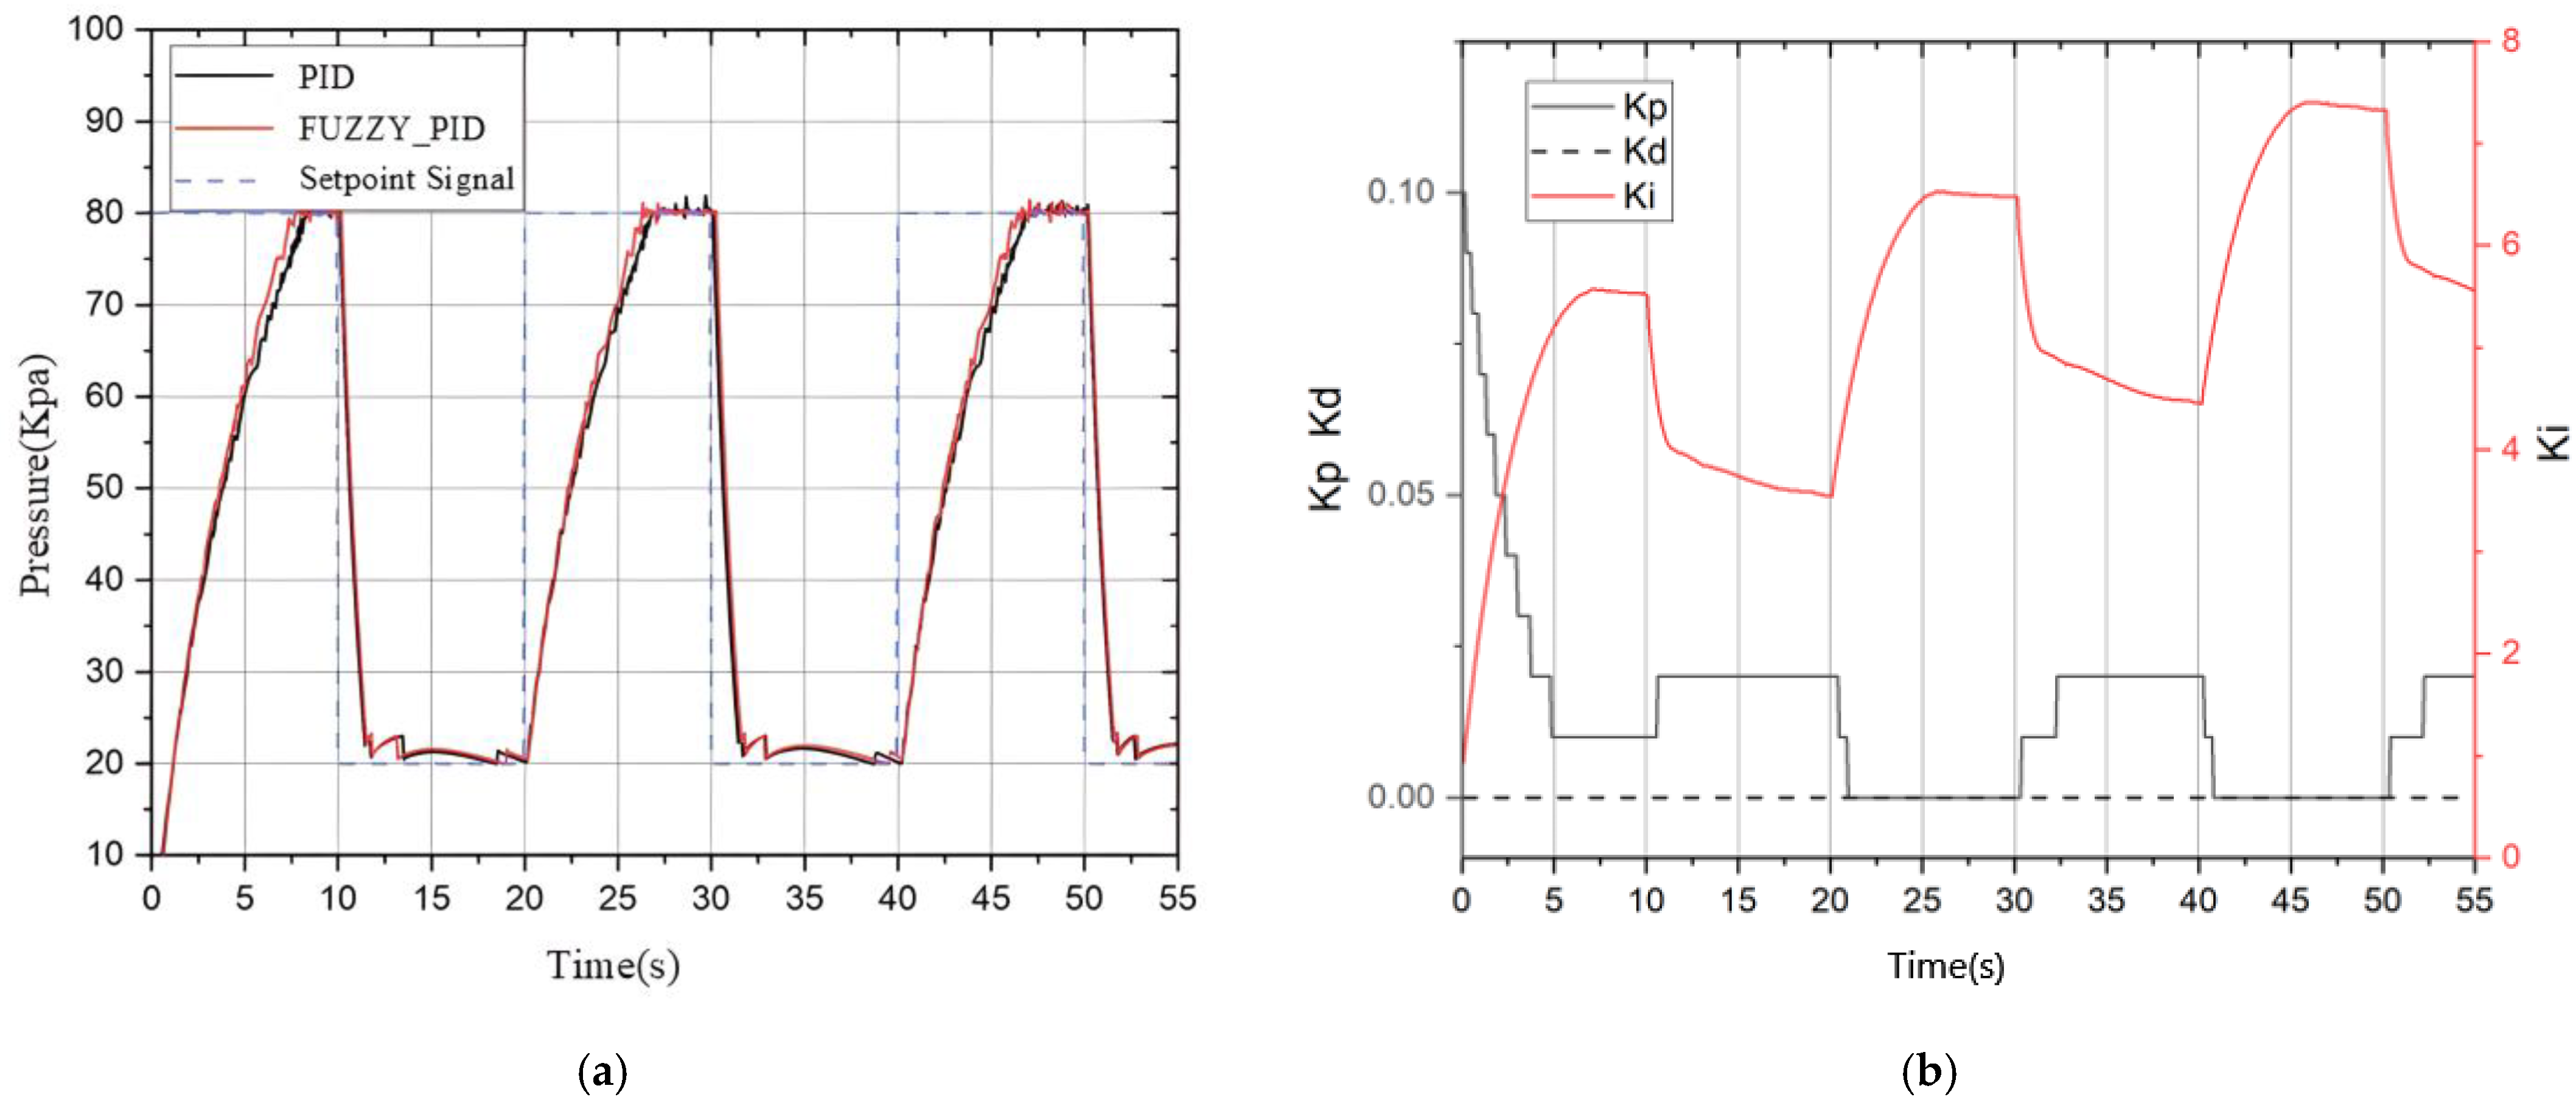
38], a fixed chamber inflation and deflation platform as described above was used to test the overall control performance. Similarly, in order to compare the accuracy of the experimental results, the same two signals were used for input testing, namely the first step signal that increases the pressure setting value by 10 kPa every 5 s, and the second square wave signal that switches signal settings between 20 kPa and 80 kPa pressures every 10 s. Thus, algorithm parameters can be adjusted and optimised, and based on this, further research can be conducted on the robustness and real-time characteristics of algorithms in small deformation cavities.
Collect the overall output information of the controller, mainly focusing on real-time pressure signals and PID parameter changes. Both the traditional PID and fuzzy PID controllers were tuned using the same experimental setup and test signal to ensure a fair comparison. The tuning process was based on optimizing key performance indicators using the same criteria for both controllers. By collecting and displaying the collected information, a comparison chart of the stair-step signal following effect can be obtained, as shown in
Figure 26 From the graph, it can be seen that under the optimization of PID parameters by the fuzzy controller, the overall inflation speed and signal-following effect have been significantly improved.
Furthermore, the real-time data obtained using the square wave signal is shown in
Figure 27. In terms of sinusoidal signal inflation and deflation tracking, fuzzy PID also has certain advantages, with faster response speed and the ability to quickly approach the set value.
To characterise the closed-loop dynamics, seven key performance indicators were extracted from the 20→80 kPa step response in
Figure 26 and
Figure 27: rise-time
(10–90%), settling-time
(±2% band), maximum overshoot
, steady-state error
ess, integral of squared error (
ISE), integral of absolute error (
IAE), and total variation in the control signal (
TV). As summarized in
Table 7, the fuzzy-PID shortens
by 22%, suppresses
to below 2%, and reduces
by roughly 40%, corroborating the trend observed in
Figure 26. It further lowers Integral of Squared Error (
ISE) by 74%, halves Integral of Absolute Error (
IAE), and cuts Total Variation (
TV) by 45%, demonstrating both tighter tracking accuracy and smoother, more energy-efficient actuation.
6. Comprehensive Performance Experiment of the Multi-Chamber Flexible Mechanism
Mainly aimed at the systematic testing of the overall experimental setup and further control testing of position and corresponding speed, in order to achieve certain control effects and provide theoretical and experimental data support for more complex mechanisms using flexible multi-chamber mechanisms in the future. Earthworm-inspired pneumatic soft robots integrating winding transmission structures have also shown promising multimodal locomotion performance, supporting the potential of flexible continuous actuation [
39]. Firstly, prepare the posture acquisition device by using a camera to record the object’s posture and establishing a database to link pressure with posture. Then, analyze the collected pressure and posture data to understand the working characteristics and steady-state dynamic performance of this multi-chamber flexible mechanism.
6.1. Position Measurement of the Multi-Chamber Flexible Mechanism
Since images captured by standard cameras often exhibit some degree of distortion, particularly when using fisheye lenses, it becomes crucial to correct these distortions to accurately measure the posture changes in the multi-chamber flexible mechanism during experiments. In this study, camera calibration techniques were used to correct the camera’s intrinsic parameters, which describe the geometric relationship between a 3D object and its 2D projection. These parameters mainly include the focal length, principal point location, and distortion coefficients. By calibrating the intrinsic parameters, image distortion caused by lens aberrations (such as fisheye effects) can be effectively reduced. In our experiments, we first conducted camera calibration using a checkerboard calibration pattern to obtain the intrinsic matrix of the camera. Subsequently, these intrinsic parameters were applied to undistort the captured images, ensuring that the 2D images provided more accurate posture measurements of the multi-chamber flexible mechanism.
6.1.1. Correction of Camera Intrinsic Parameters
In order to achieve this goal, a camera calibration plate is used for printing, and Matlab’s built-in tool library Camera Calibrator is used for the solution process of automatic internal reference [
40]. So firstly, it is necessary to take the corresponding pictures of the 9 cameras to be tested and generally take 20 sets of calibration paper that can appear completely in the lens and clearer, and the pose is not exactly the same in the pictures for corner detection and identification. Input the corresponding reference physical quantities, such as the real physical square edge length of the grid paper and other parameters, and Matlab’s built-in tool library Camera Calibrator can be carried out to automatically calculate the corresponding camera internal reference. The postures of the multi-chamber flexible mechanism after pressure stabilisation are photographed and recorded in each test, and the postures under different pressures are recorded separately, and then the OpenCV open-source vision library is used for the test, and the recorded postures are processed with anti-aliasing.
6.1.2. Establishment of the Pose Correspondence Table for the Multi-Chamber Flexible Mechanism
Due to the use of a three-chamber deformation mechanism, the area that can be swept by the end movement without considering axial elongation can be approximated as the area enclosed by a set of envelope lines in a two-dimensional plane. Place the camera centered on the central axis of the entire multi-chamber flexible mechanism model and capture the end effector motion clearly.
During the experiment, the experimental effect was not significant at pressures below 60 kPa. Therefore, the obvious and non-damaging area of 60 kPa to 90 kPa was used for testing. The test results can be roughly divided into three parts: single-chamber inflation and deflation, dual-chamber inflation and deflation, and three-chamber inflation and deflation. However, triple chamber inflation and deflation will cause the entire structure to antagonize. If three-chamber inflation and deflation control is used, the multi-chamber flexible mechanism will waste more energy after stabilizing at a certain position. Therefore, the deformation of the flexible multi-chamber mechanism is mainly controlled by single-chamber and dual-chamber posture, thereby achieving stable motion.
The overall measurement process for multi-chamber mechanisms is as follows:
- (1)
Connect the corresponding hardware camera and main control USB interface.
- (2)
Control the upper computer program to set pressure information.
- (3)
Wait for the pressure sensor value to stabilize within ±1 kPa before taking photos of the object’s pose.
- (4)
Record the pressure state corresponding to the corresponding pose.
- (5)
Perform anti-distortion processing on captured images.
- (6)
Measure the number of pixels between the stationary origin at the end and the pose points after inflation at the end.
- (7)
Using the outer cylinder diameter of a multi-chamber flexible mechanism as a ruler, perform point-to-point distance conversion.
- (8)
Establish a corresponding pressure data table and record it.
In order to map the pixel coordinate system in the figure to the real physical coordinate system, the outer circumference of the model without inflation is used as the reference object. Before testing, the multi-chamber flexible mechanism in a stationary state is first photographed and recorded, and its circumference is 160 pixels. Therefore, this data can be used as an approximation of the conversion relationship between the physical dimensions and the pixels in the captured image in order to obtain the end displacement of the multi-chamber flexible mechanism when controlling the pressure change of the chamber each time. In summary, the upper computer program is controlled to inflate each single chamber from 60 kPa to 90 kPa and record relevant data. Then, adjacent chambers are simultaneously inflated and stabilized, and the relevant pose changes are recorded.
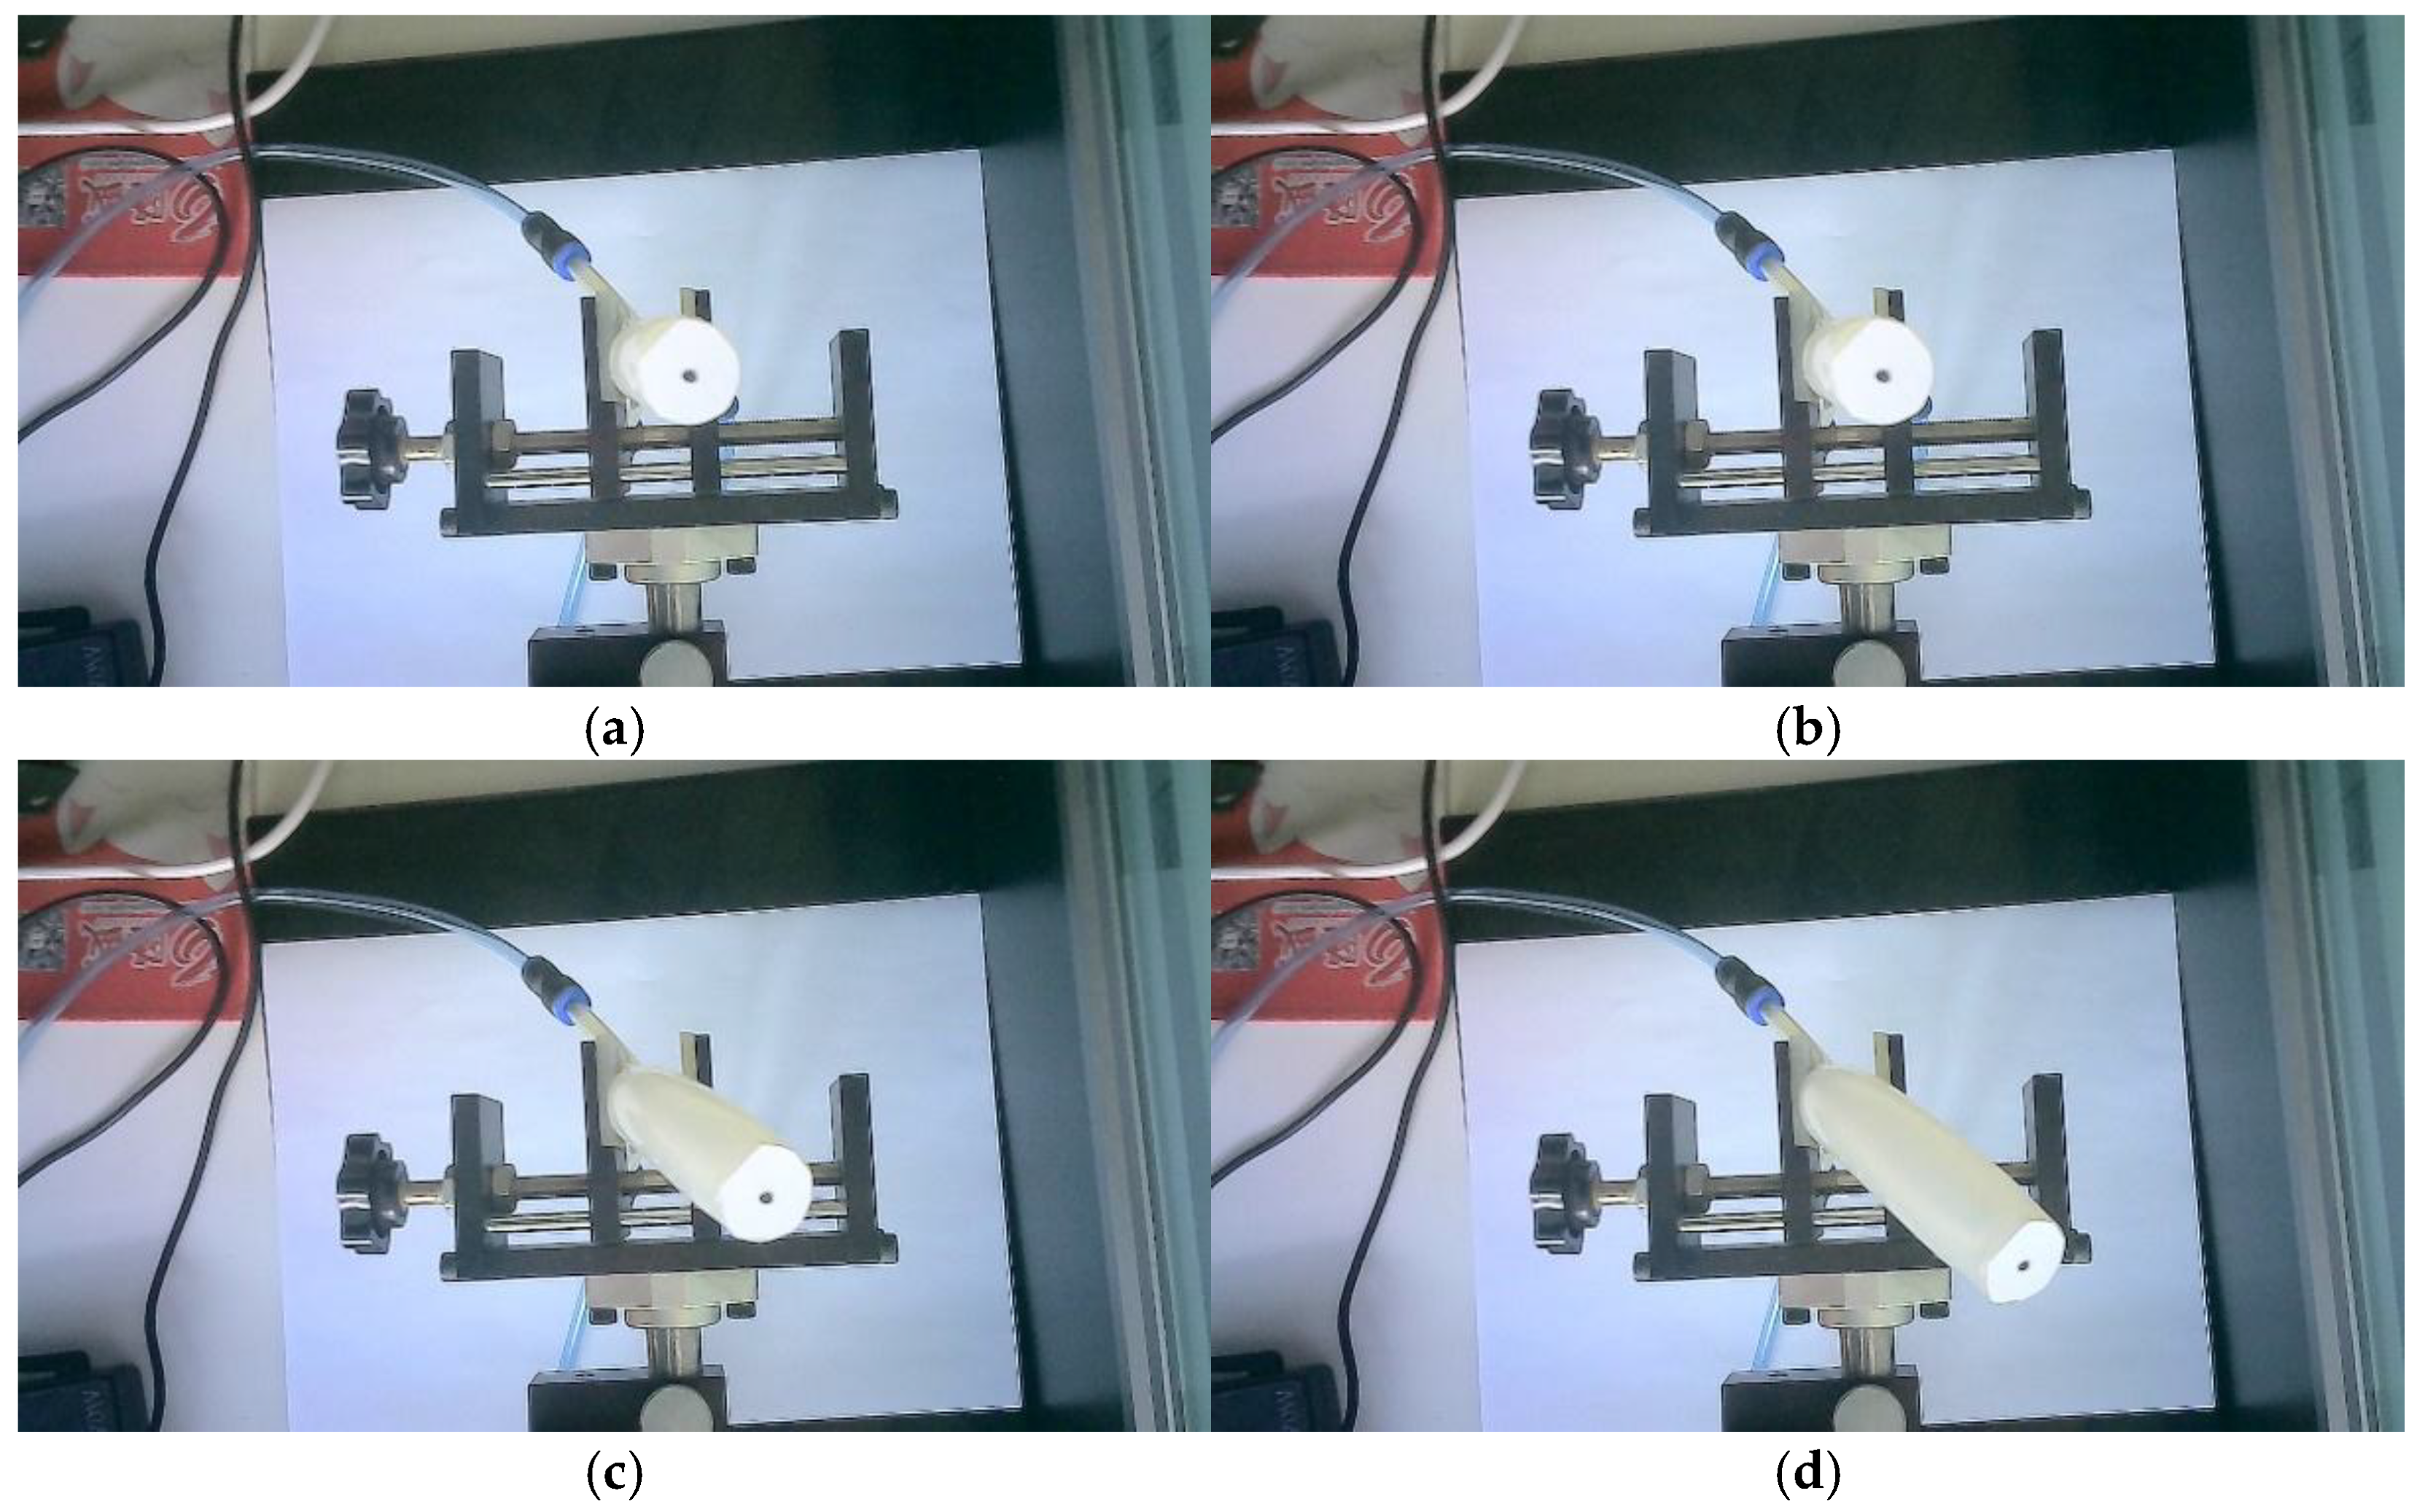
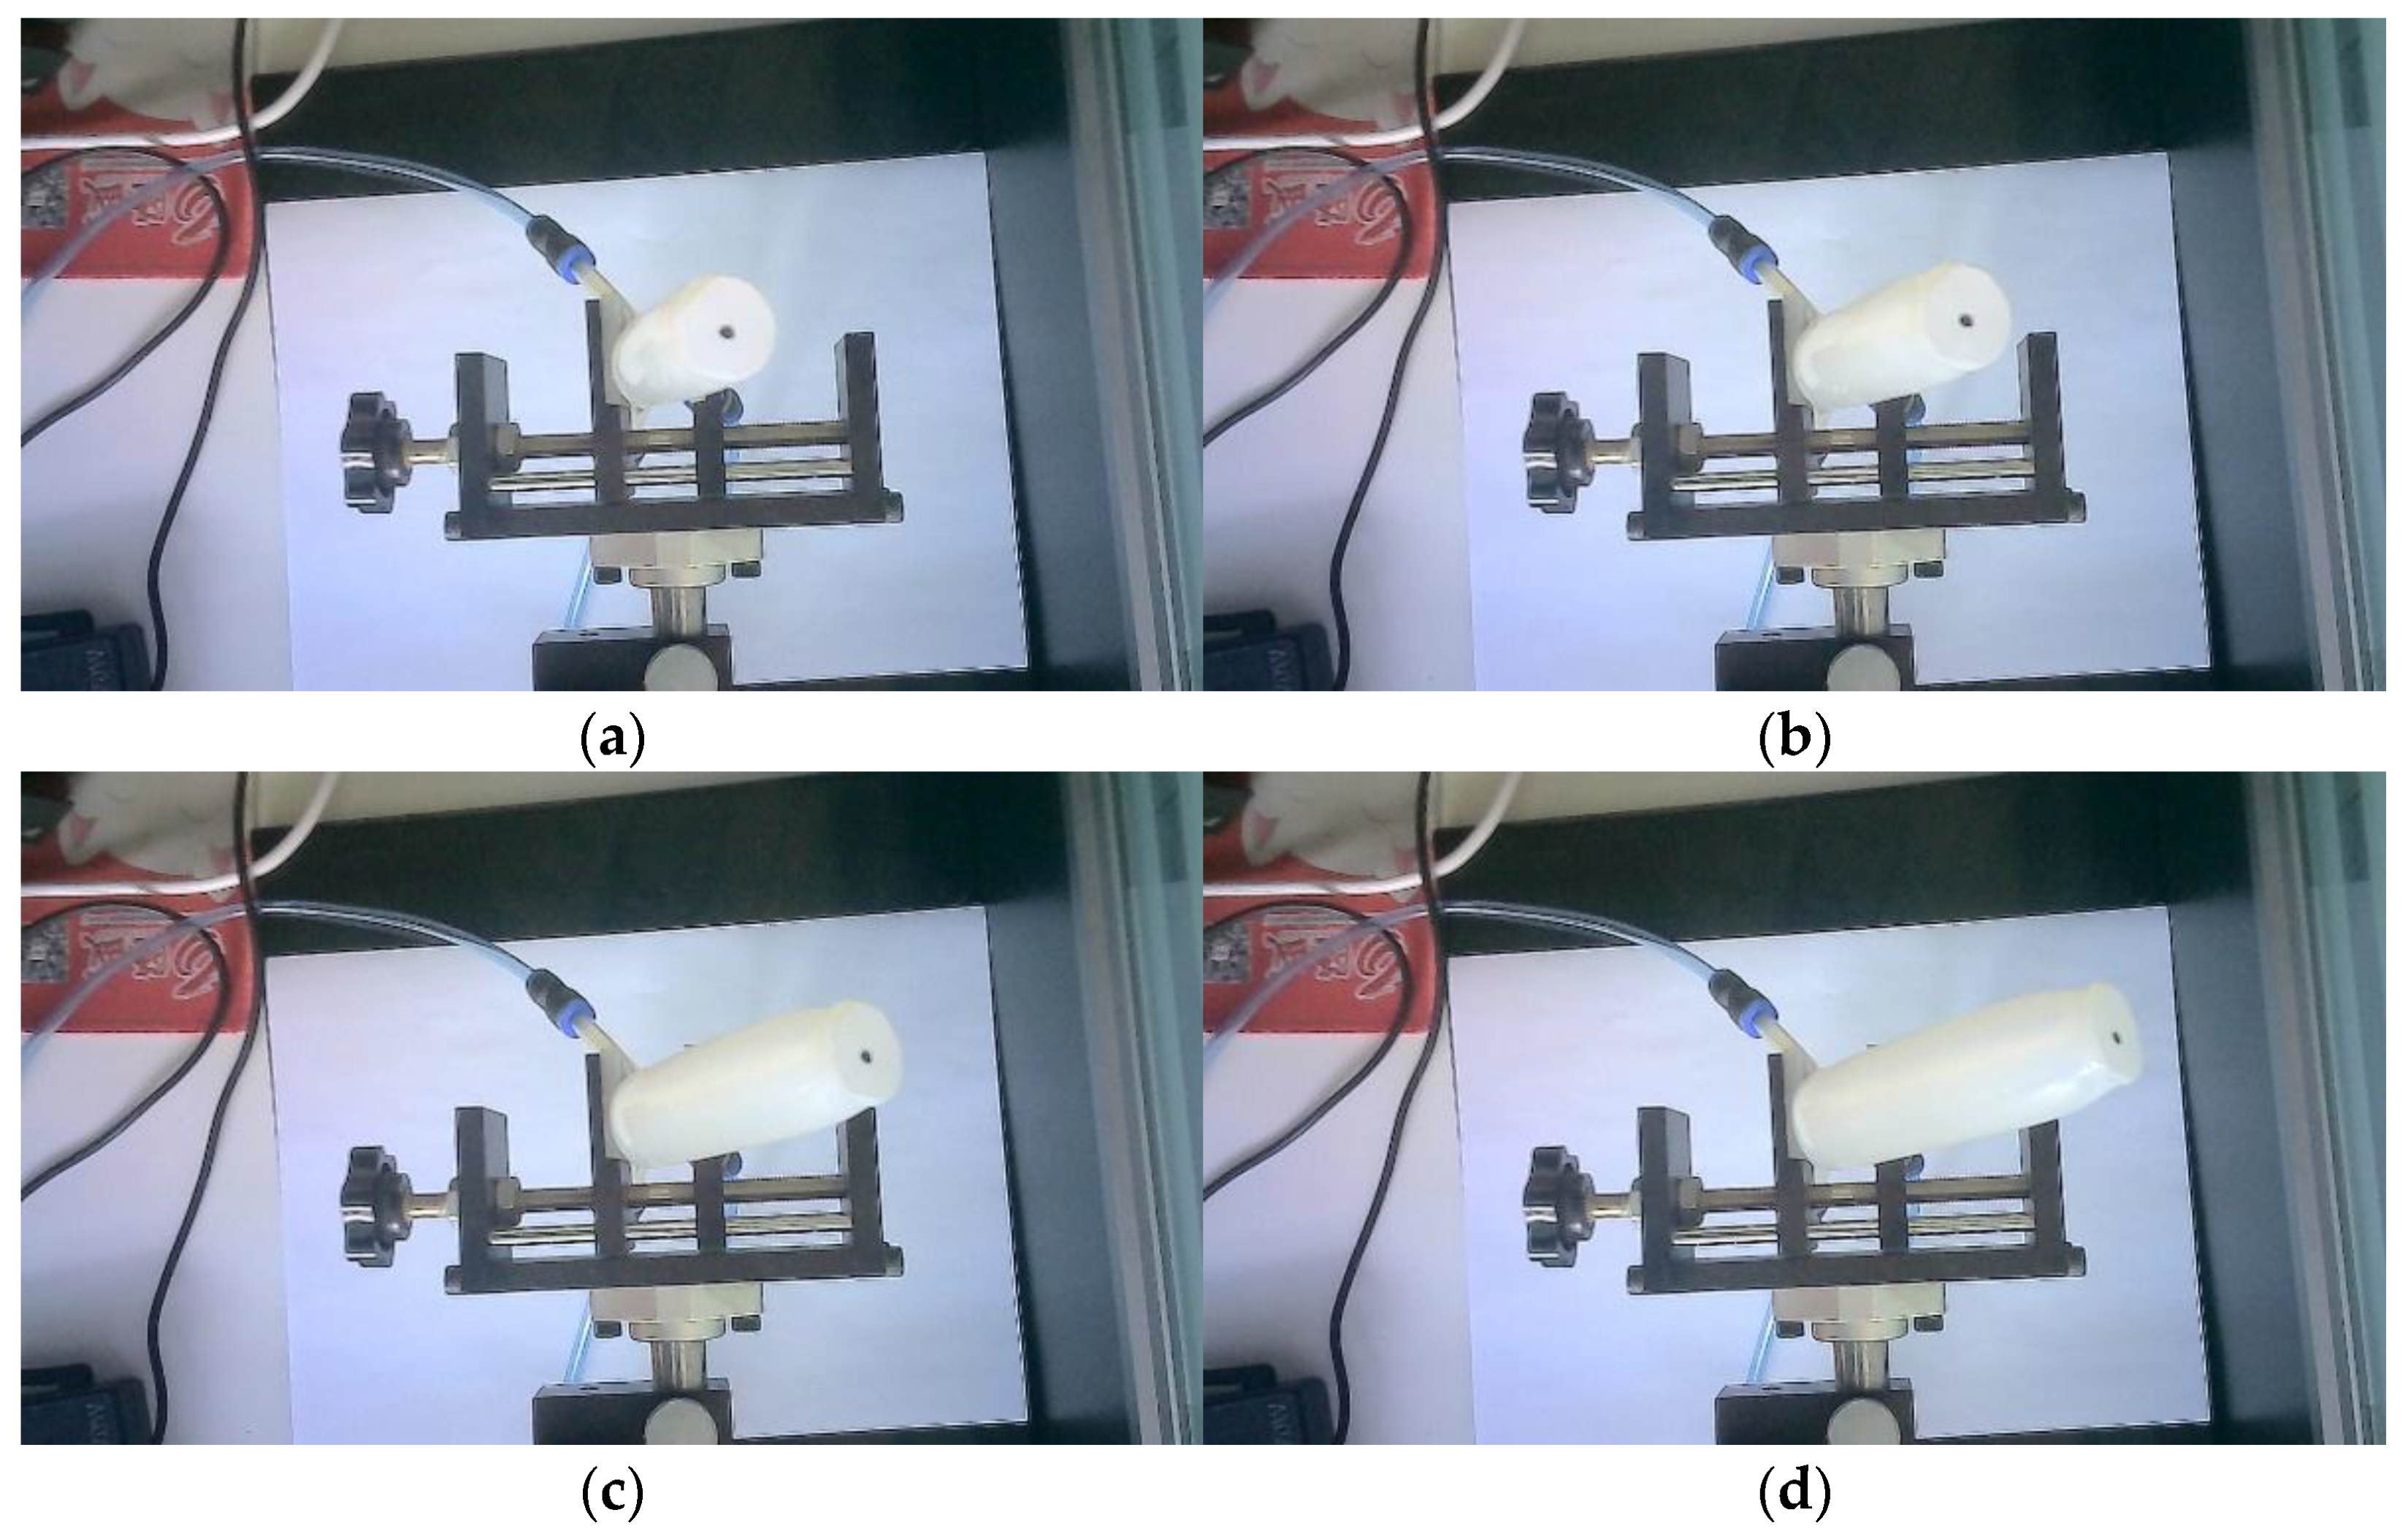
For the stable motion experiment of a single-chamber, the pressure loading of 60 kPa~90 kPa is first carried out, as shown in
Figure 28, which are several obvious experimental images in the corresponding images after the pressure loading of a single-chamber. Due to certain cropping and anti-distortion processing of the image, the position of the center point at rest can be directly measured, thereby estimating the position of its end points on the entire compression plane and estimating its attitude change.
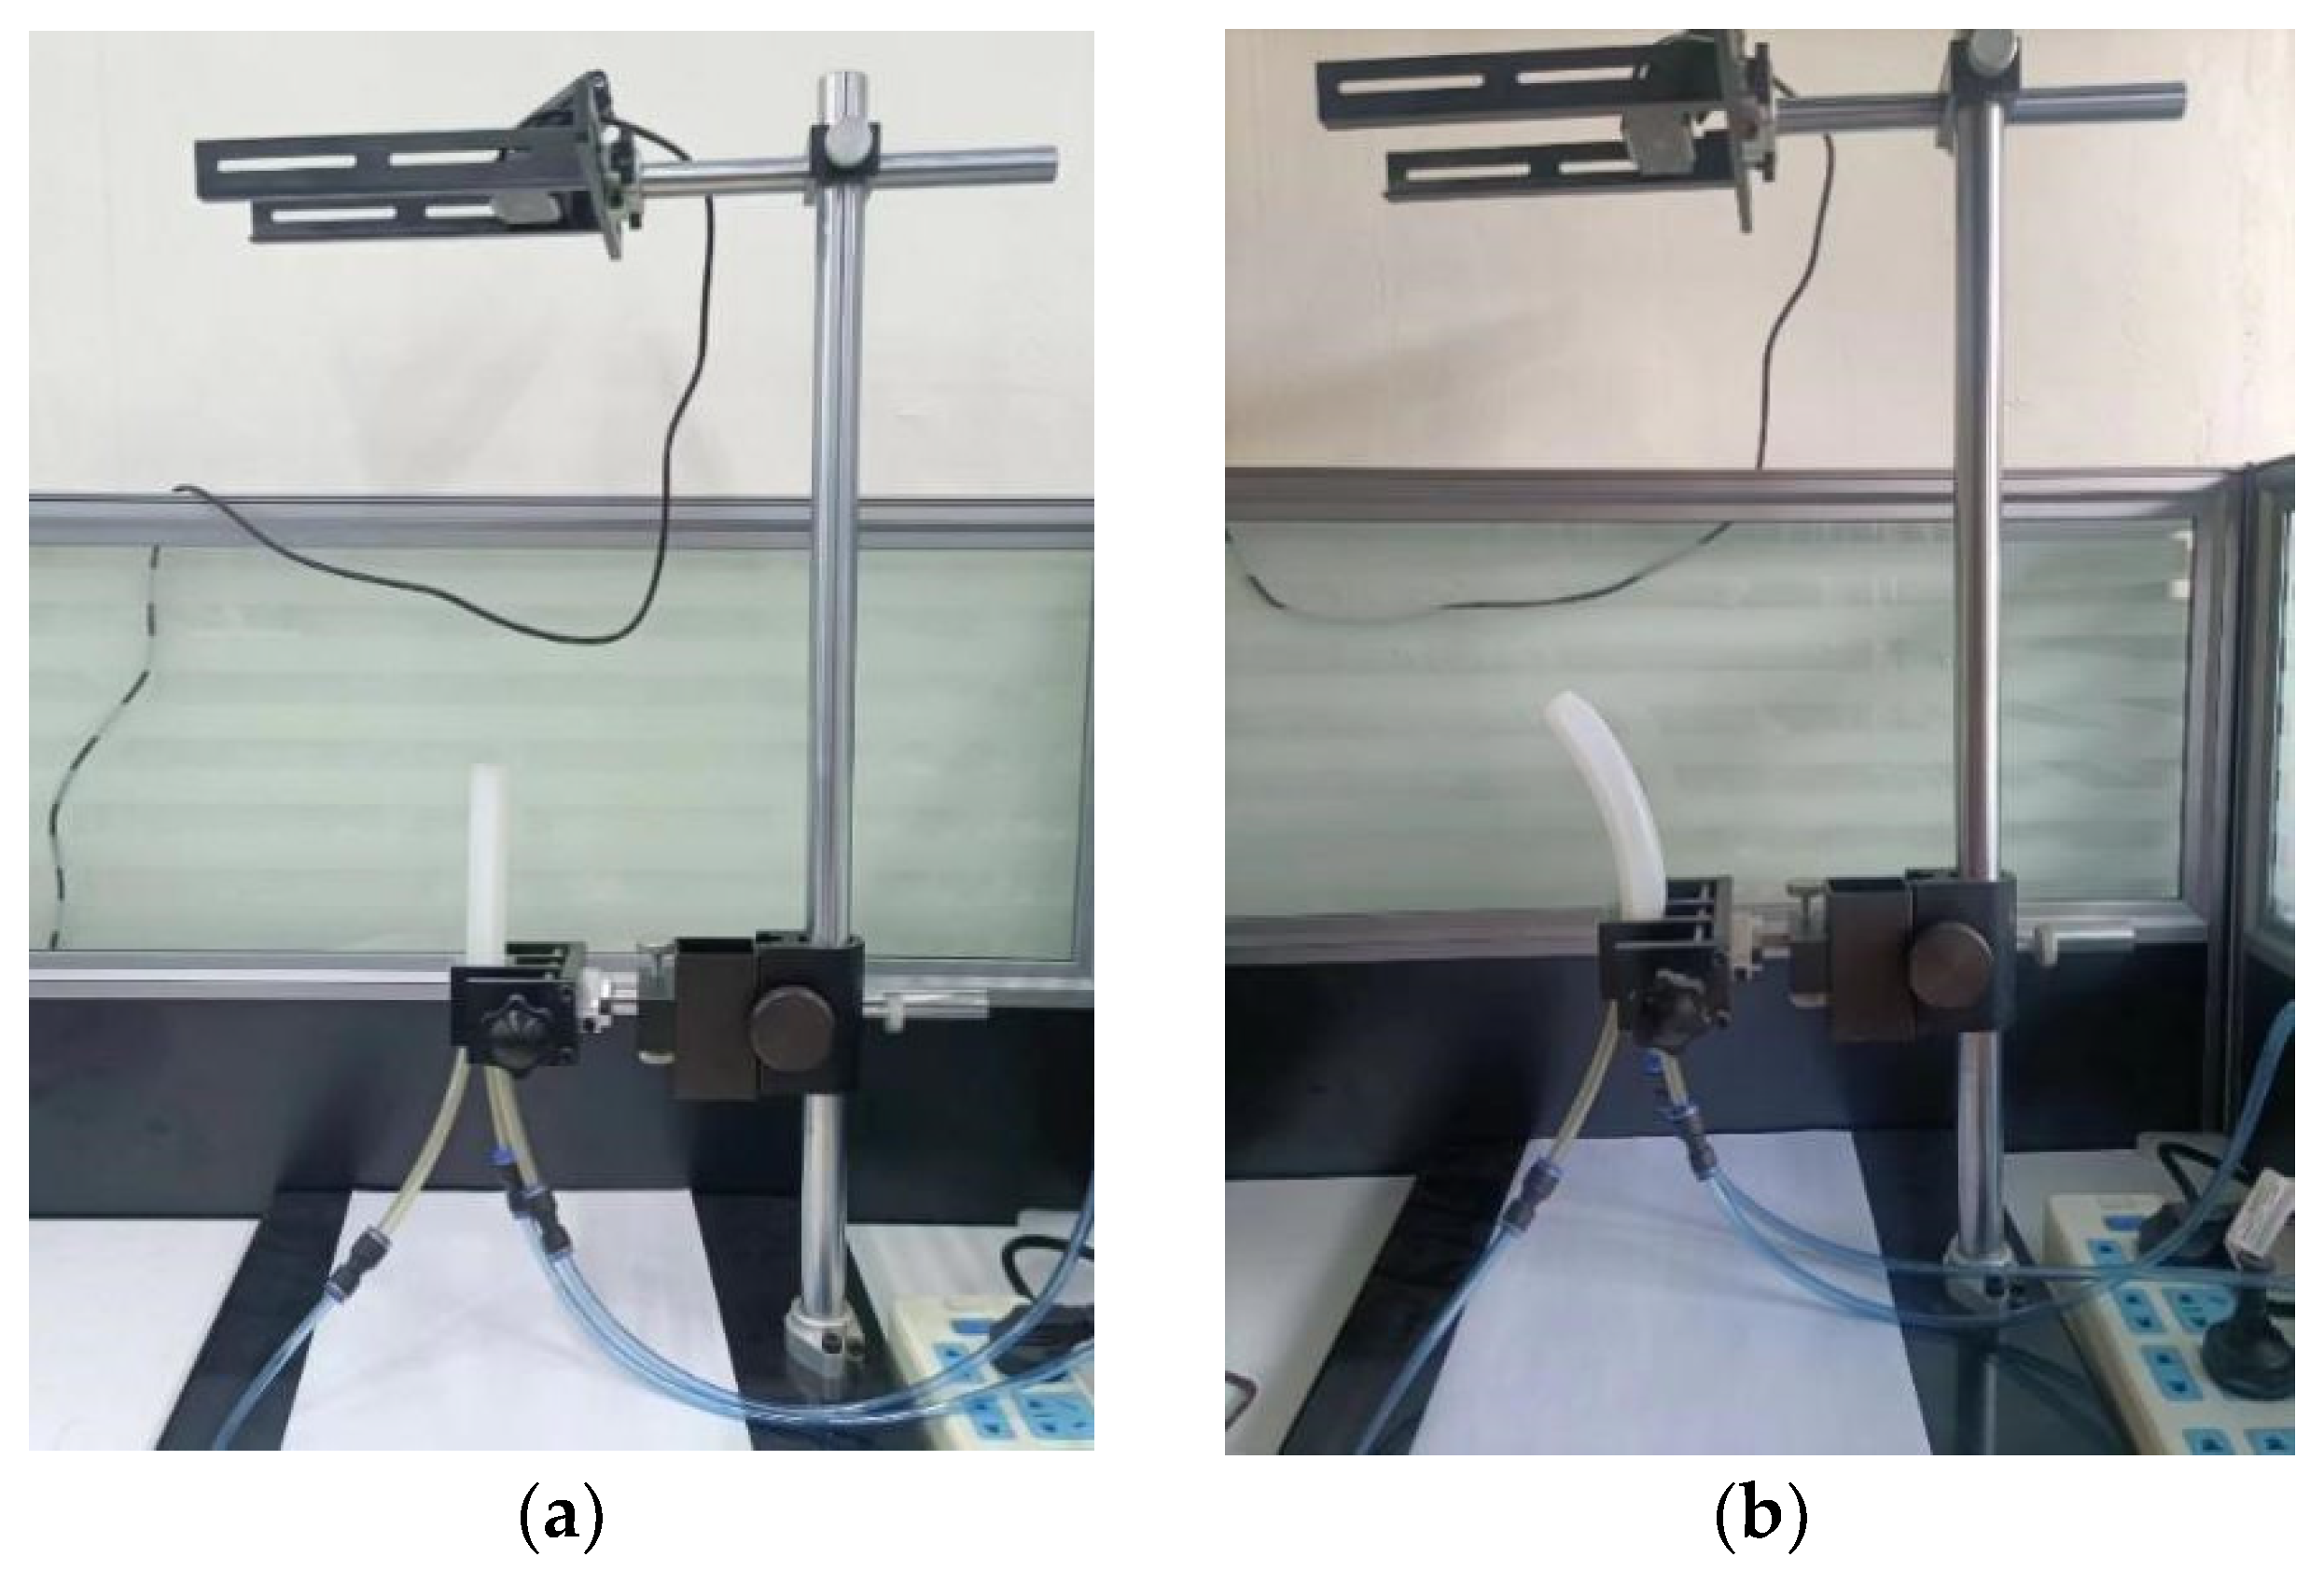
For dual-chamber control, as mentioned above, due to the fact that single-chamber pressure control can only move in the plane determined by the axis of the single-chamber and the axis of the model chamber, it cannot cover the entire compression plane well. Therefore, it is necessary to control the dual-chamber pressure so that the end movement of the entire flexible multi-chamber mechanism can cover the entire hemisphere well. The bending experiment diagram of dual-chamber control is shown in
Figure 29.
Therefore, without the need for internal antagonism, the execution point of the manipulation end can be moved in a hemispherical manner by manipulating the pressure changes in at most two pressure chambers to complete the movement of the point pose.
6.2. Motion Experiment and Analysis
The upper computer is used to adjust the real-time pressure setting of the main control board. After the pressure stabilises, the posture of the endpoint is collected after each change in pressure. The final data obtained is shown in
Table 8, which is the projection coordinates of the end point on the projection plane after the pressure in each chamber is fixed.
The projection plane diagram of the final endpoint is shown in
Figure 30, which is the corresponding relationship diagram between the measured pressure curve and the endpoint projection points, namely the pressure pose correspondence diagram. Based on this image, the pose of the physical model of the entire multi-chamber mechanism and the pressure relationship of each chamber can be obtained in order to further control the endpoint position.
The final experimental result is shown in
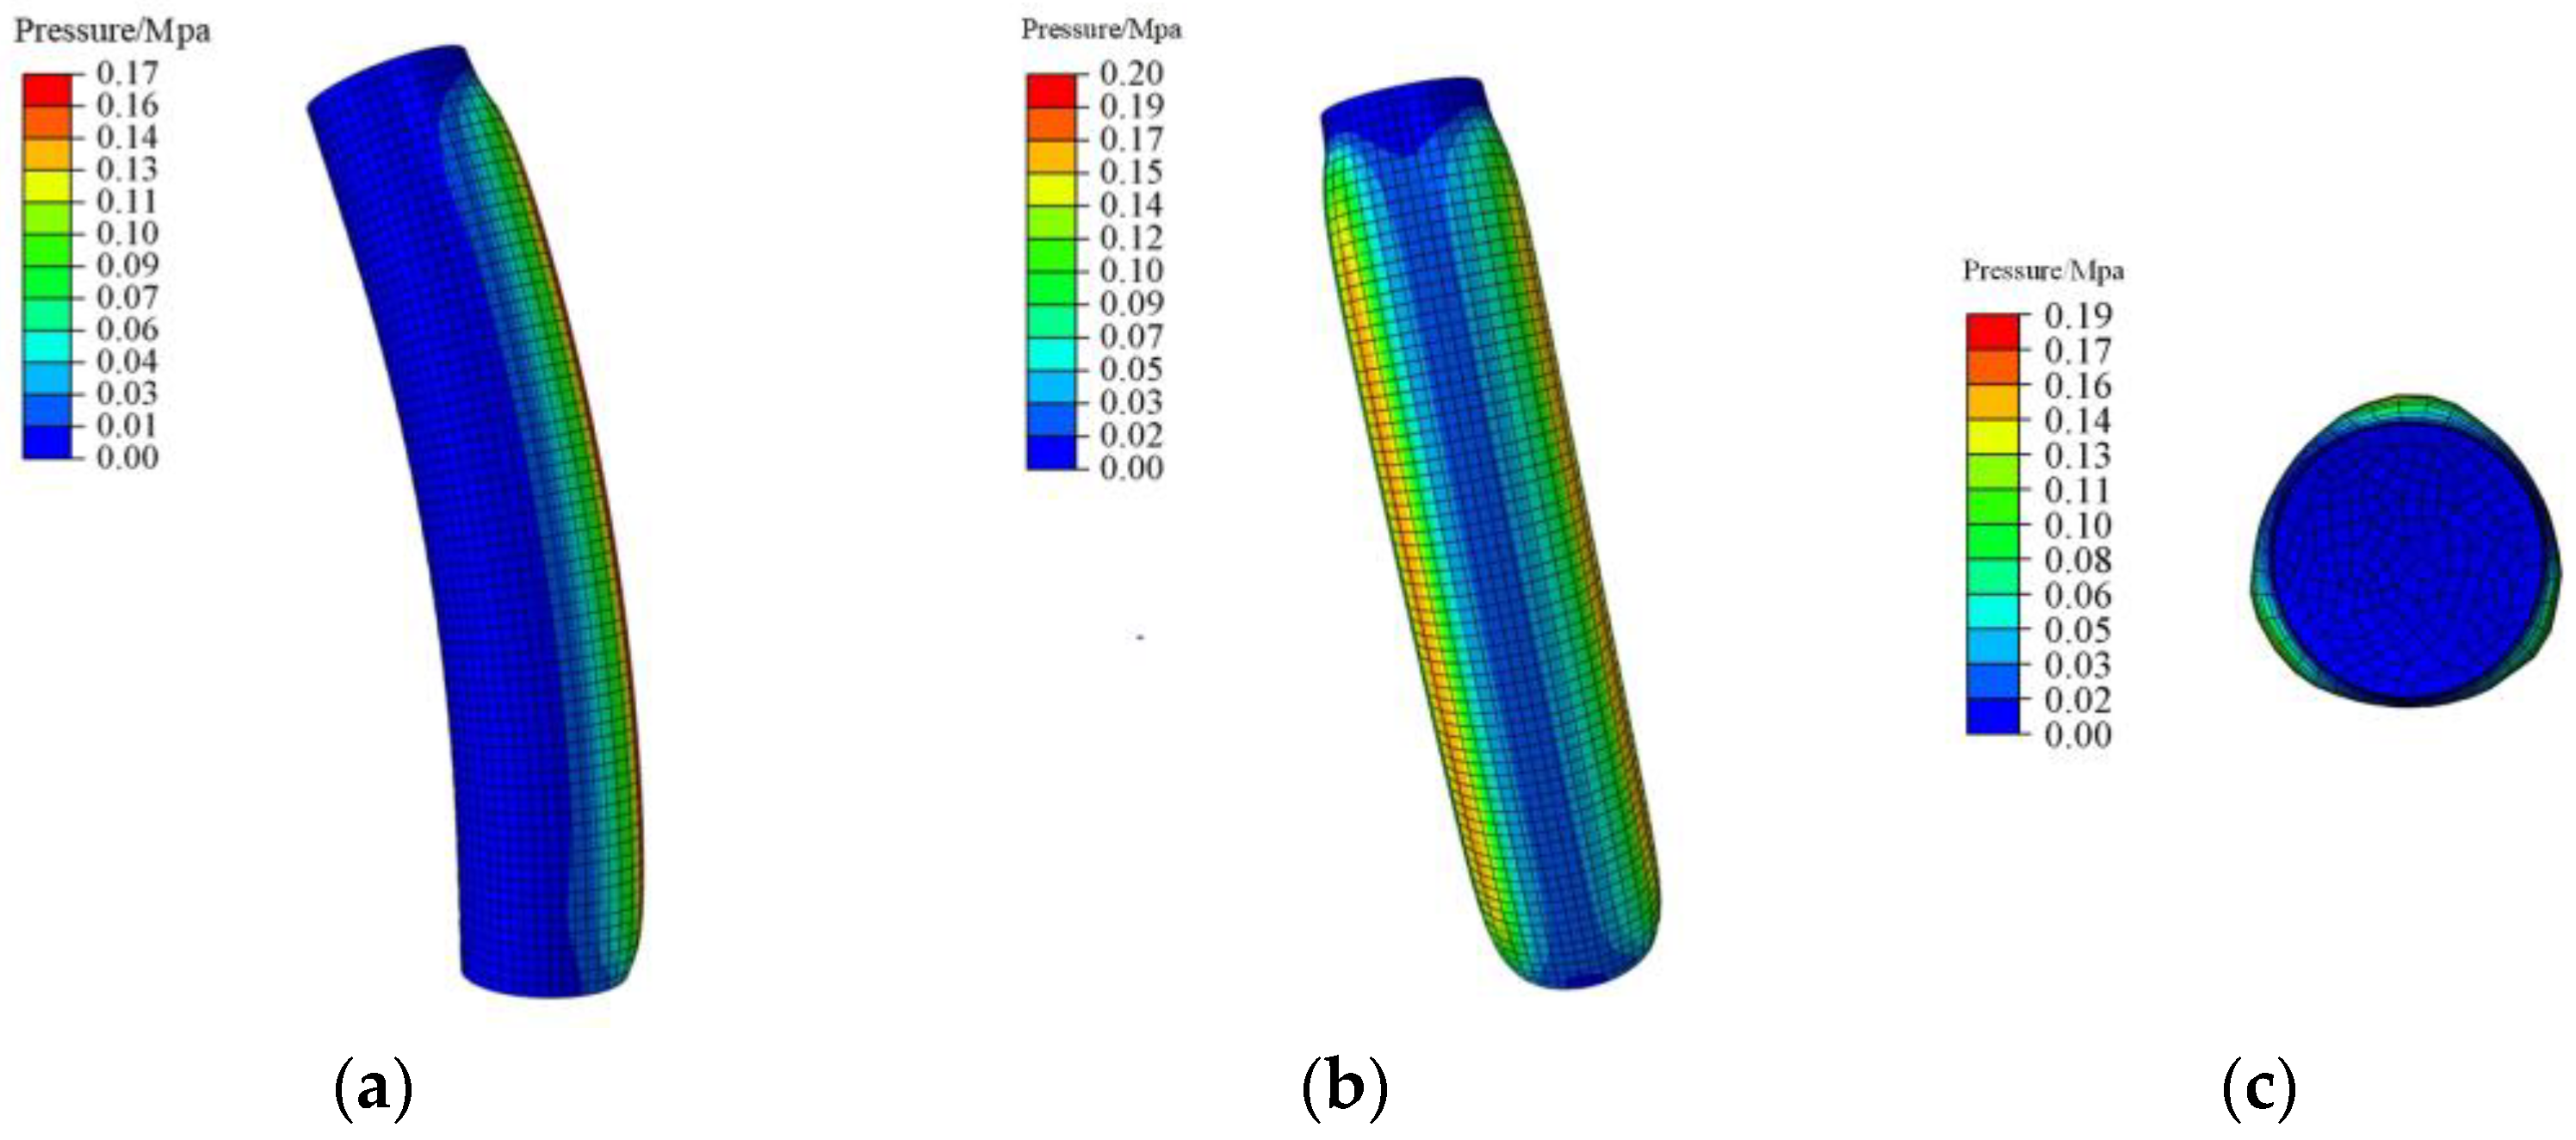
Figure 31, indicating that the bending degree of the physical mechanism is in good agreement with the simulation result.
Table 8 provides data including experimental values and simulation values and calculates the displacement error (Error
E) between them. The error is calculated by comparing the experimental data (
and
) with the simulation data (
and
), using the formula:
where:
and : experimental tip coordinates (mm);
and : simulated tip coordinates (mm);
Error E (%) represents the relative error between the experimental and simulation data, expressed as a percentage.
The mean relative tip-position error, evaluated with Equation (18) over all 24 test points in
Table 8, is 3.2%, confirming that the Yeoh-based model reproduces the pressure–pose map with satisfactory accuracy. The residual spread is mainly attributed to sub-millimetre air bubbles trapped during molding and to slight coaxial misalignments introduced by manual assembly.
6.3. Repeatability Analysis
To evaluate the repeatability of the three-chamber flexible actuator under typical working pressures, this section adopts the driving mode of “synchronous inflation of two chambers”. At four pressure settings of 60 kPa, 70 kPa, 80 kPa, and 90 kPa, 30 inflation-discharge cycles are performed at each setting point.
The specific test plan is as follows: (1) Inflate to the target pressure. (2) When feedback pressure settles within ±1 kPa, record the end-effector coordinates . (3) Vent to ambient and allow 5 s for silicone relaxation. (4) Repeat until 30 cycles are logged.
The repeatability of the flexible chamber was quantified by calculating the single-cycle positioning error from 30 experimental trials.
The analysis relies on two complementary quantities:
Single-cycle Euclidean error:
where:
are the measured tip coordinates at cycle i;
are the reference coordinates obtained from the static.
Repeatability : standard deviation of .
Table 7 and
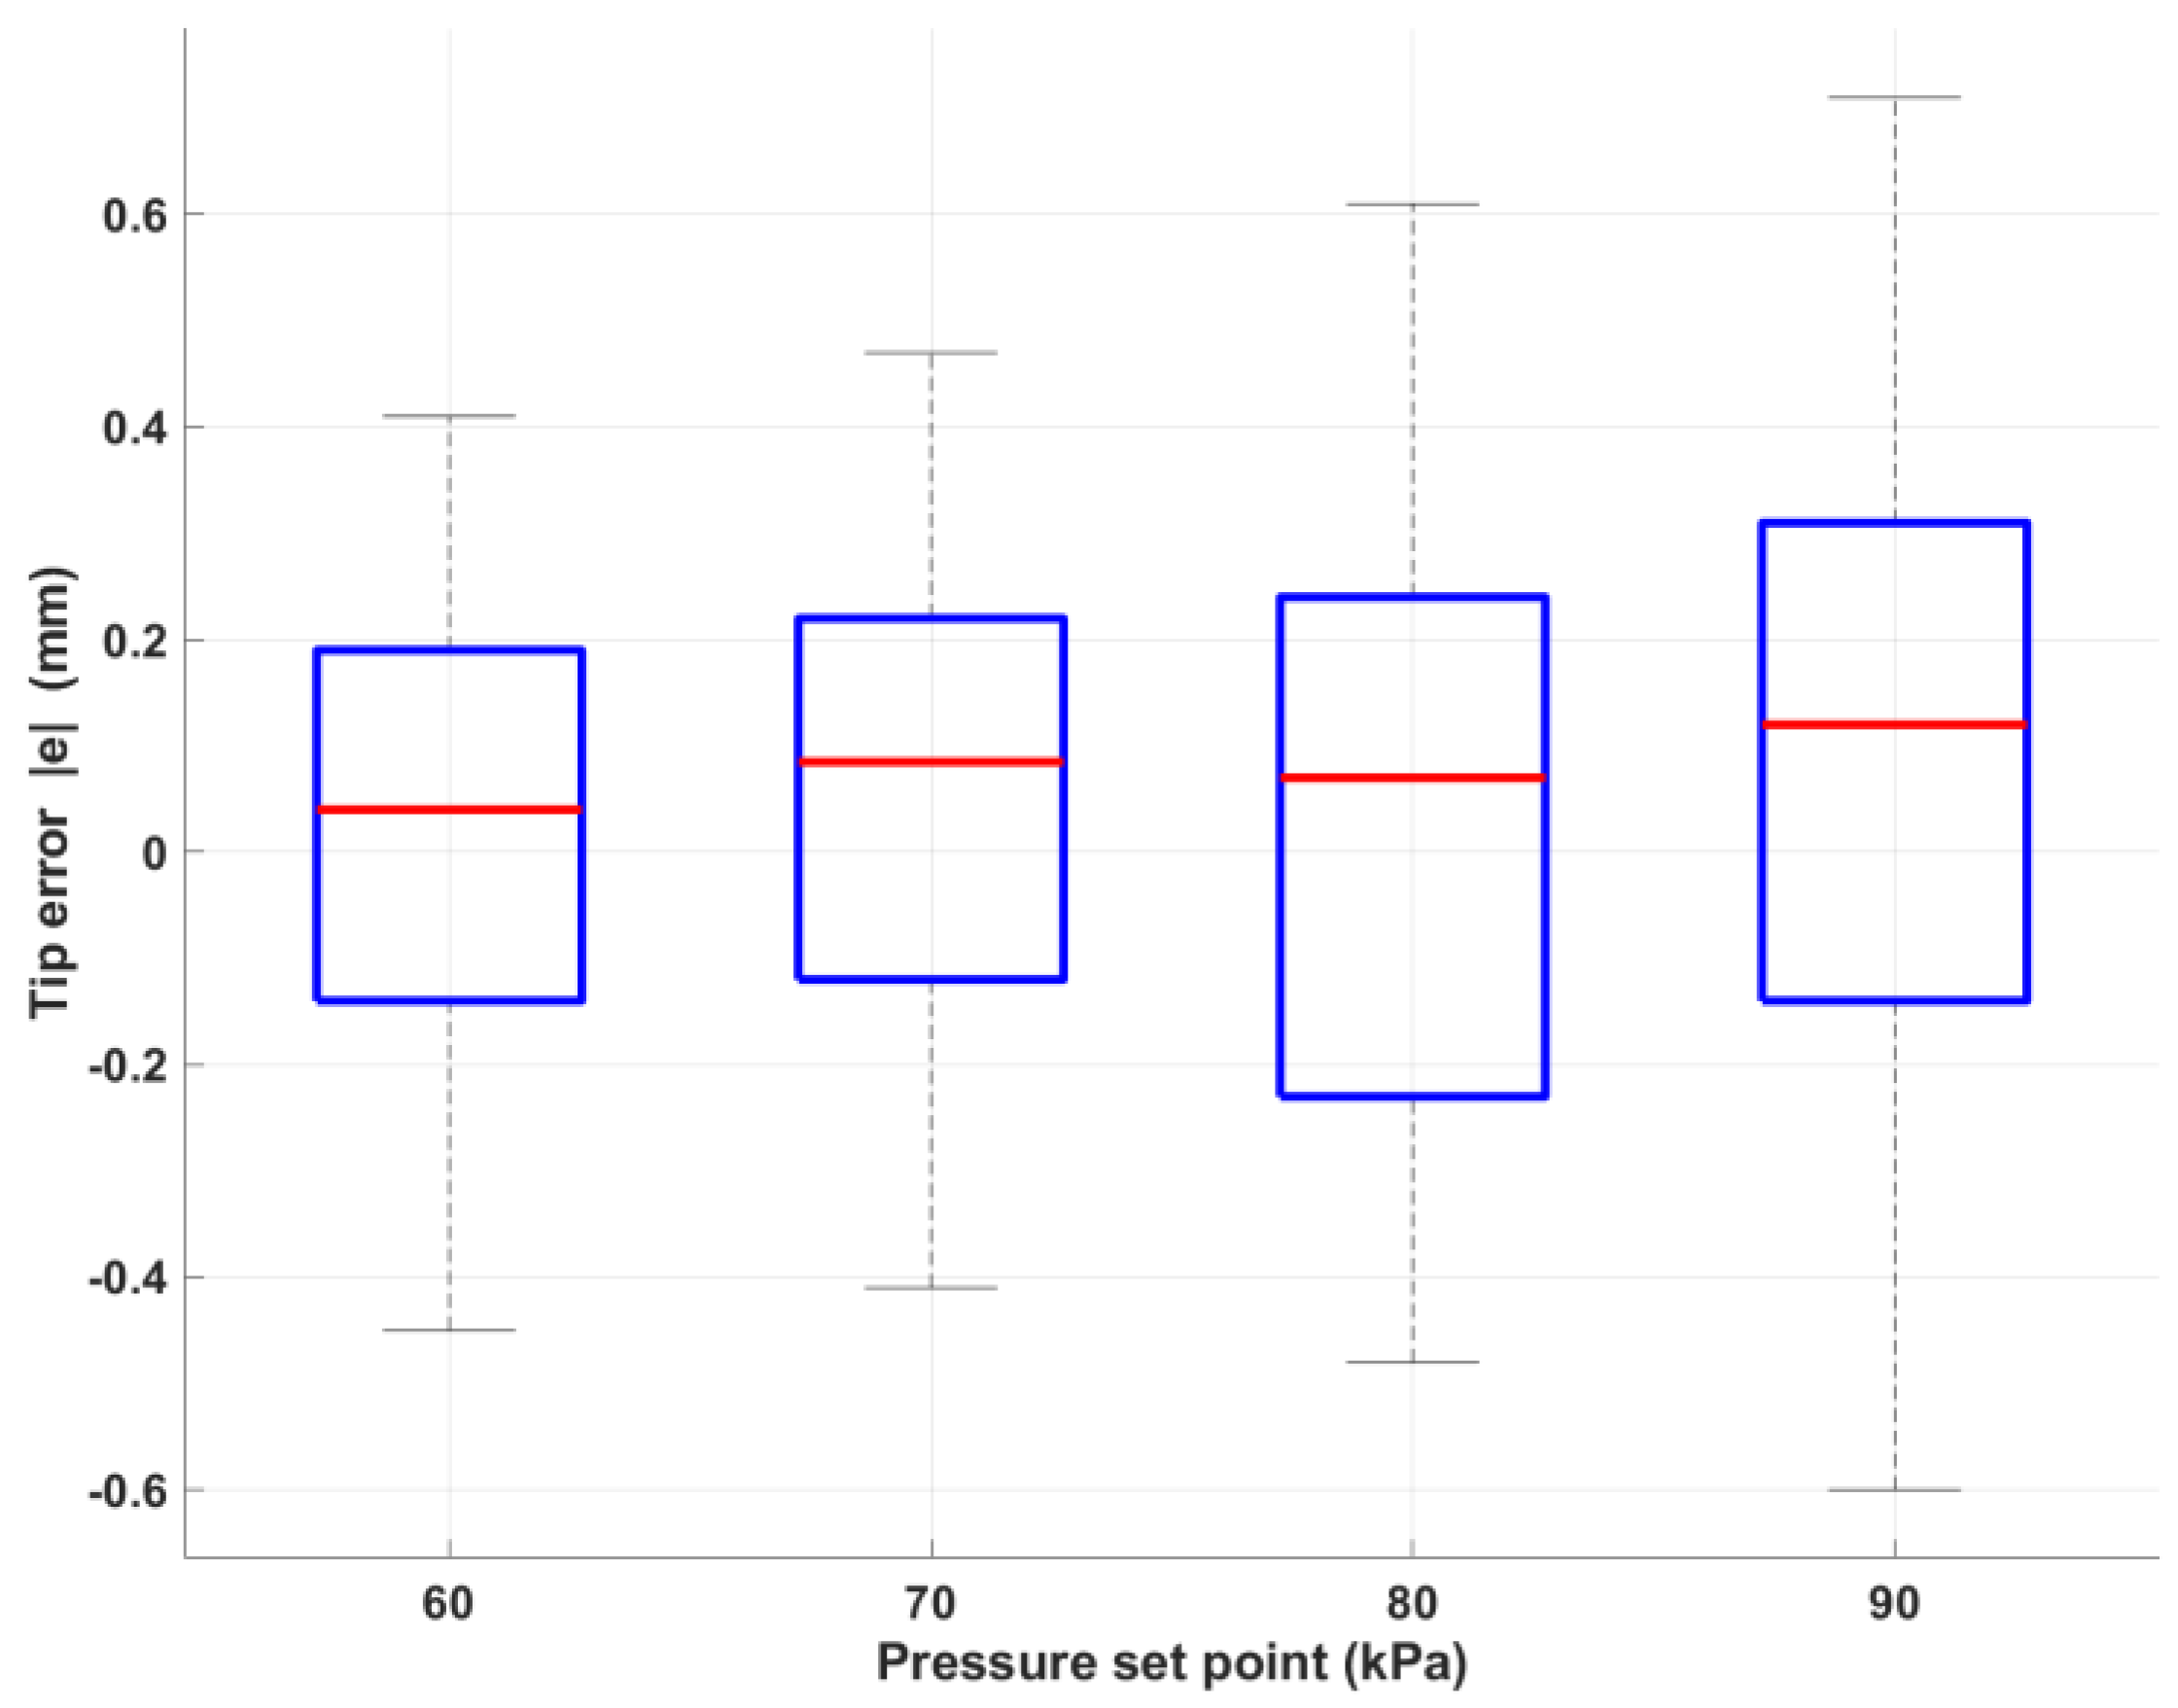
Figure 32 jointly capture the statistical story. Numerically,
Table 7 shows that the cycle-to-cycle standard deviation increases modestly with pressure—from 0.35 mm at 60 kPa to 0.72 mm at 90 kPa, yet even the worst-case value remains well below the 1 mm threshold. The associated ±3 σ bands confirm that 99.7 % of repeat cycles stay within ±2.2 mm.
Figure 32 further visualizes the data: median errors (red lines) hover near 0 mm, the inter-quartile ranges tighten under 0.6 mm, and no whisker or outlier exceeds 1 mm, underscoring the consistency implied by
Table 9.
Table 9 lists
for each pressure together with:
±3 σ repeatability band, covering ~99.7% of normally distributed outcomes,
95% confidence interval (CI) for, derived from the χ
2 distribution with
degrees of freedom:
The manipulator therefore delivers sub-millimeter repeatability throughout the 60–90 kPa operating window, comfortably meeting the precision demanded by soft-robotic positioning tasks.
