Article

Analytical Modeling of Shrouded Rotors in Hover with Experimental and Computational Validation

by
Abdallah Dayhoum
*,
Alejandro Ramirez-Serrano
and
Robert J. Martinuzzi
Mechanical and Manufacturing Engineering, University of Calgary, 2500 University Drive NW, Calgary, AB T2N 1N4, Canada
*
Author to whom correspondence should be addressed.
Actuators 2025, 14(3), 138; https://doi.org/10.3390/act14030138
Submission received: 31 January 2025 / Revised: 25 February 2025 / Accepted: 7 March 2025 / Published: 11 March 2025
(This article belongs to the Special Issue Aerospace Mechanisms and Actuation—Second Edition)

Abstract

:
Rotors have been utilized for aircraft propulsion since the dawn of aviation, but their performance can degrade significantly if not properly designed. This study focuses on developing an accurate design tool and model validation for shrouded rotors. An experimental test rig was designed and manufactured to measure the rotor thrust and total thrust separately as well as the rotor torque. A key aspect was to account for the impact of a test rig on experimental results using computational simulations for the shrouded rotor configuration with and without the test rig. The findings indicate that the effects of the test rig were minimal and could be neglected, ensuring the validity of the experimental data compared to the analytical model. The analytical model employs a hybrid approach combining blade element momentum theory (BEMT) and the sphere-cap model which are used in conjunction with the shrouded rotor inflow ratio, as well as post-stall and tip gap clearance models. BEMT is used to calculate rotor performance, while the sphere-cap model addresses the aerodynamic influence of the shroud. The results demonstrate that the analytical model predicts shrouded rotor performance with considerable accuracy, addressing both the rotor dynamics and the shroud’s contribution to performance.

1. Introduction

Unmanned Aerial Vehicles (UAVs) have gained considerable attention within the scientific and aerospace engineering communities due to their various applications across both military and civilian sectors. Among these, Vertical Take-Off and Landing (VTOL) aircraft, such as quad-rotors, tilt-wings, and helicopters, are expected to play a critical role in the future of urban air mobility, reconnaissance missions, surveillance, disaster response, and other vital operations [1,2,3].
One effective approach to improving the performance of VTOL UAVs is the incorporation of shrouds around the rotors. Shrouds have been shown to significantly enhance thrust, resulting in more efficient propulsion [4,5]. Additionally, shrouds play a key role in reducing acoustic emissions, making UAVs quieter and more suitable for urban environments and stealth operations.
Another major benefit is the reduction in rotor tip losses, which is achieved by limiting the high-energy airflow that escapes at the rotor tips, further improving aerodynamic efficiency and overall performance [6,7]. Despite these promising theoretical results, the practical application of shrouded rotors in aircraft has been limited, largely due to an incomplete understanding of the complex interactions between various geometrical features and their combined effects on aerodynamic performance [8,9].
In the aerodynamics area, one of the first to use a potential flow method to extend prior work on shrouded rotors in hover conditions to describe ducted fan aerodynamics in forward flight and the angle of attack was Kriebel [10]. He researched stability derivatives for longitudinal flight and developed formulae to compute the forces and pitching moments experienced by shrouded rotors.
The understanding of the aerodynamic behavior of shrouded rotors has become more apparent as computing power has increased over time. An incompressible Navier–Stokes Computational Fluid Dynamics (CFD) solver for axisymmetric ducted fans was created in 2003 by Chang and Rajagopalan [11] who modeled the fan as a “momentum source”. The approach, however, only considered pure axial flight (vertical climb). To further analyze the aerodynamics of ducted fans, Quackenbush et al. [12] created a novel surface method combining fuselages and ducts with a free-wake potential flow method for propellers which showed good agreement with experimental data (e.g., X-22A ducted rotor-powered aircraft [13] and isolated annular wings without propellers [14]).
Research on the design and aerodynamic characteristics of shrouded rotors has increasingly focused on analyzing configuration characteristics. For instance, Zhongyun et al. [15] developed a propeller design method capable of determining circulation distribution. Angelo et al. [16] optimized the radial distributions of chord length and twist angle based on the blade’s working conditions and airfoil distribution. Additionally, Guo introduced a blade design method for ducted fans by refining blade element momentum theory using insights from CFD results [17].
The growing adoption of computational research methods has led to a rise in the use of theoretical and low-order panel methods combined with rotor module techniques [18,19], as well as CFD simulations [20,21]. These methods have become increasingly common in recent studies. For example, Yu employed both the panel method and CFD to optimize shrouded rotor blades [22]. Despite these advancements, the demand for highly accurate analytical models remains significant.
One-dimensional momentum theory can be used to estimate a shrouded rotor’s thrust. However, it is important to note that this theory alone cannot account for rotor geometric features such as rotor blade shape and the number of blades. The inlet cap model extends momentum theory for open rotors to shrouded ones. Adopting a one-dimensional analytical approach, it proposes an imaginary inlet surface model [23,24].
The inlet cap model provides insight into one-dimensional momentum theory by accounting for the thrust from the shroud’s inlet. However, because it is based on momentum theory, it still cannot account for the rotor blade shape or the number of blades. BET and BEMT can cover such a gap; however, the shroud effect on rotors can be accomplished by modifying the inflow ratio.
Blade element theory (BET) can be utilized to investigate the aerodynamic forces acting on each blade element comprising the rotor. The contribution of each segment is calculated to obtain the rotor’s overall performance. BET is considered for analyzing blade geometry and its impact on rotor performance. Such theory, however, is limited in accurately predicting induced velocities through the rotor. This limitation is particularly significant when dealing with shrouded rotors, which introduce increased induced velocity in the rotor plane and other complexities compared to open rotors. To overcome this challenge, combined BEMT is strategically employed. The purpose of using BEMT is to combine the strengths of both momentum and blade element theories. BEMT is used to enable accurate predictions of the induced flow velocities in each one of the shrouded rotor’s elements [25,26,27].
In this research, a mathematical formulation for the aerodynamics of shrouded rotors is developed using a BEMT model, along with the integration of a previously developed sphere-cap model for shrouded rotors which depends on the shape of the shroud that was introduced by Dyer [25]. This approach, which combines the strengths of both models, provides a more accurate and detailed description of the aerodynamics of shrouded rotors. The aerodynamic interactions between shrouded rotor blades and the surrounding flow can be more accurately captured. This development will significantly enhance the ability to optimize rotor designs and improve performance predictions, especially in applications such as VTOL aircraft.

2. Analytical Model

Achieving a perfect match between theoretical and real-world rotor blade performance is challenging due to the complexity of shrouded rotor aerodynamics. Therefore, simplifying assumptions are made in the present analytical work to streamline the calculations. The rotor blades are assumed to be rigid and the weight of the blades is ignored. Additionally, dynamic stall, which occurs under high angles of attack, and compressibility effects, which become significant at higher rotor speeds, are not accounted for in the present calculations. The flow is assumed to be steady and incompressible, with an ambient pressure, p .
A set of mathematical formulations is developed to better understand the performance of shrouded rotors concerning various design parameters. The geometrical characteristics of the shroud’s inlet play an important role in calculating the shroud’s contribution to overall thrust using the sphere-cap model. Then, by combining that model with classical BEMT, a more accurate analysis of rotor performance is achieved.

2.1. Inlet Cap Area Definition

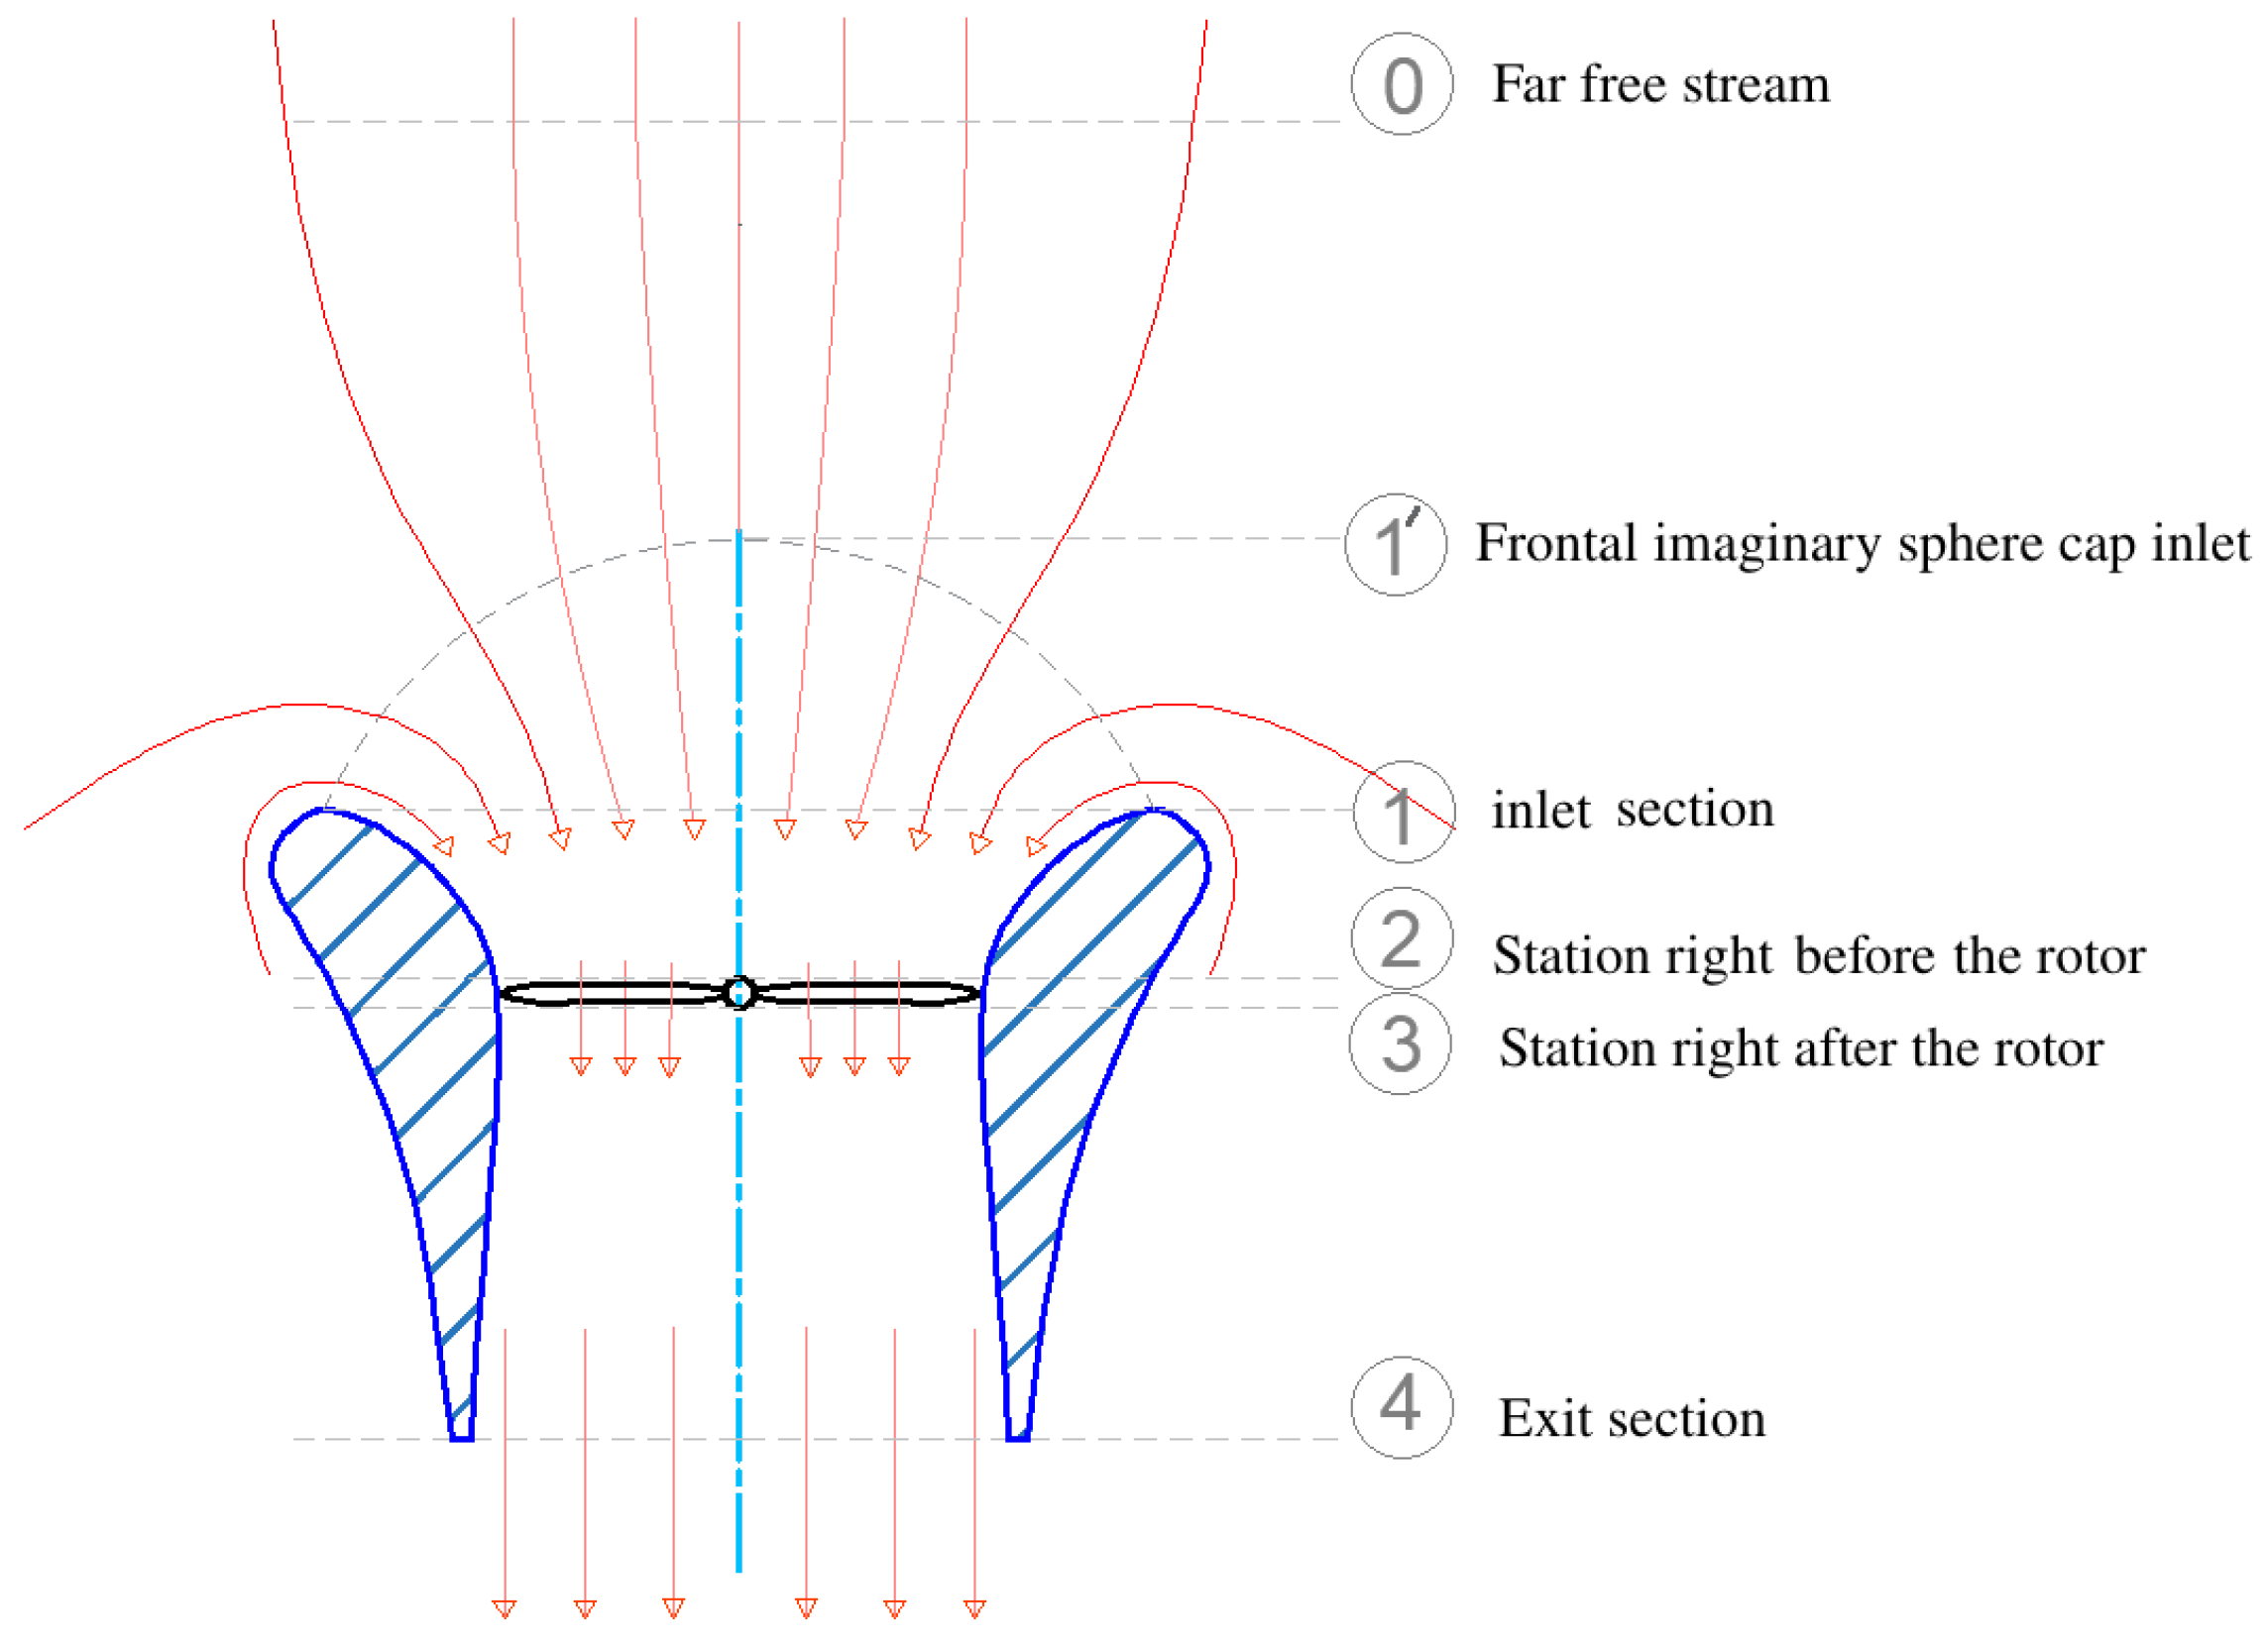
Figure 1 shows the numbered stations that are used to derive the total thrust and rotor thrust relations with the inlet cap representation. The stations along the longitudinal direction are as follows:
  • Section (0): the far free stream.
  • Section (1′): the frontal imaginary sphere-cap inlet.
  • Section (1): the shrouded rotor inlet.
  • Section (2): the station just before the rotor.
  • Section (3): the station right after the rotor.
  • Section (4): the exit section.
The definition of the inlet surface, shown in Figure 1, required for setting up the model is not straightforward since the flow is highly distorted (i.e., strongly two-dimensional) at the shroud inlet [23]. A sphere cap is an imaginary surface generated when a spherical shell is intersected by a plane, and the part of the shell above it (the “base plane”). The base plane can lay either above or below the sphere center. A sphere cap represents a potential surface to which the streamlines of the flow are assumed to be normal. The surface area of a sphere cap, as illustrated in Figure 2, is given by the following equation:
A 1 = 2 π R C h c = π R 1 2 + h c 2
where R C is the radius of the sphere, h is the height of the sphere cap, and R 1 is the radius of the base circle. Applied to a shroud inlet, R 1 and h are given by
R 1 = R C sin θ s = R t h + R lip ( 1 cos θ s ) h c = R C ( 1 cos θ s ) = R 1 sin θ s ( 1 cos θ s )
where θ s is the inlet angular coordinate that varies from 0 at the throat to 180 at the outer edge of the inlet lip, R t h is the duct throat radius, and R l i p is the radius of the inlet lip.

2.2. BEMT

BEMT represents a synthesis of key concepts from both momentum theory and blade element theory, providing a more comprehensive understanding of the forces acting on rotor aerodynamics. This theory offers insights into how inflow is distributed along the radius of the rotor, allowing for a more precise calculation of local lift, drag, and induced velocity in each blade section [28,29,30].
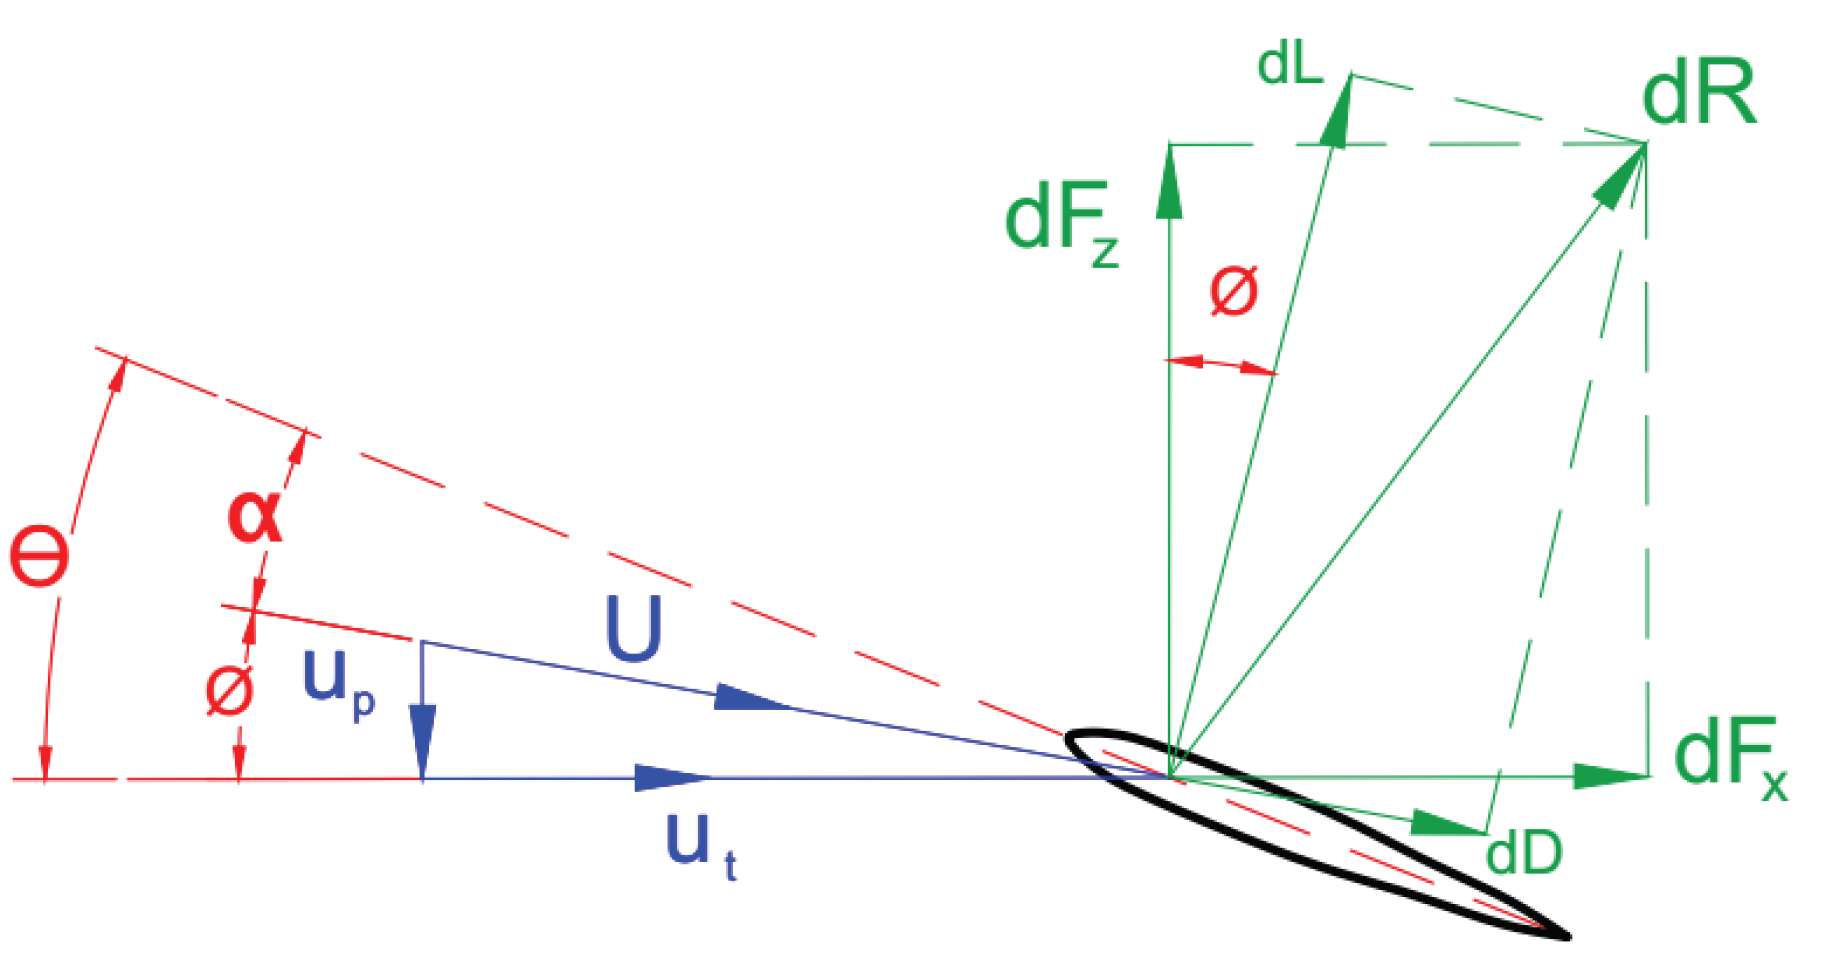
Considering the local velocities at a blade element (shown in Figure 3), the tangential velocity, u t , arises from the blade’s rotational motion (Equation (1)). The perpendicular velocity, u p , is formed by the induced velocity at the blade element. The tangential and the perpendicular velocity components for each of the rotor’s elements are presented as a function of the non-dimensional radial positions (r) in Equation (1) and Equation (2), respectively.
u t ( r ) = Ω y
u p ( r ) = ( v i n d ( r ) )
The relative elementary angle of attack can be written as
α ( r ) = θ t w ( r ) + t a n 1 ( u p ( r ) u t ( r ) )
where θ t w ( r ) is the local twist angle. Based on the value of the calculated local values of the angle of attack, Reynolds number, and cross-sectional airfoil type, the corresponding local lift coefficient, drag coefficient, and lift curve slope are obtained. So, the elementary lift, d L , and drag, d D , per unit spanning the corresponding blade element can be described as per Equation (4) and Equation (5), respectively.
d L = 1 2 ρ U 2 c c l d y
d D = 1 2 ρ U 2 c c d d y
where ρ is the air density, c is the local chord, U is the resultant total velocity, U = u t 2 + u p 2 , and c l and c d are the lift and drag coefficients, respectively, both obtained for each section of the rotor blade according to the sectional airfoil characteristics.
By resolving the lift and drag forces into parallel and normal components relative to the rotor disk, as shown in Figure 3, Equations (6) and (7) are obtained.
d F z = d L c o s ϕ d D s i n ϕ
d F x = d L s i n ϕ + d D c o s ϕ
Therefore, the elementary thrust, torque, and power of the disk can be defined as per Equation (8), Equation (9), and Equation (10), respectively.
d T R = ( d L c o s ϕ d D s i n ϕ )
d Q = ( d L s i n ϕ + d D c o s ϕ ) y
d P = ( d L s i n ϕ + d D c o s ϕ ) Ω y
By integrating Equation (8), Equation (9), and Equation (10) radially, the instantaneous thrust, torque, and power of the disk are obtained as shown by Equation (11), Equation (12), and Equation (13), respectively.
T R ( ψ ) = r 0 R d T
Q ( ψ ) = r 0 R d Q
P ( ψ ) = r 0 R d P
Finally, the rotor’s average thrust, torque, and power can be obtained by integrating T R ( ψ ) , Q ( ψ ) , and P ( ψ ) over the azimuth cycle for all blades, N b , comprising the rotor, as represented by Equation (14), Equation (15), and Equation (16), respectively.
T R ¯ = N b 2 π 0 2 π T R ( ψ ) d ψ
Q ¯ = N b 2 π 0 2 π Q ( ψ ) d ψ
P ¯ = N b 2 π 0 2 π P ( ψ ) d ψ
Accounting for tip gap and root losses in shrouded rotors is essential for accurate performance prediction. Furthermore, the aerodynamic effect of the shroud on the rotor is characterized by the inflow ratio.

2.3. Tip Gap and Root Losses

Accurately predicting the performance of shrouded rotors requires accounting for both tip gap losses and root losses. The concept of tip loss, commonly applied to open rotors, is adapted to model the reduction in lift near the blade root [28]. A more complex approach is needed to account for leakage losses due to the tip clearance gap. This is addressed using the tip correction factor introduced by Goodman [31]. The overall loss correction factor for a shrouded rotor, denoted as F s h , is given by
F s h = F r o o t . F g a p
where F r o o t and F g a p represent the root loss factor (Equation (18)) and the tip gap loss factor (Equation (20)), respectively.
F r o o t = 2 π cos 1 e f r o o t
where
f r o o t = N b 2 r ( 1 r ) ϕ a n d
F g a p = 1 K { s e c h ( g ) } c d 1 { cosh ( g ) cosh ( f + g ) , s e c h ( g ) }
where K is the complete elliptic integral of the first kind and c d 1 is the inverse of the Jacobi elliptic function. In the current modeling framework, both the elliptic integral of the first kind and the inverse of the Jacobi elliptic function are calculated using MATLAB R2021b functions. The modulus is defined as s e c h ( g ) , where f and g are defined in Equation (21) and Equation (22), respectively.
f = N b 2 1 r sin ( ϕ )
g = N b d g a p 2 R sin ( ϕ )
where d g a p is the tip gap clearance (the difference between the shroud’s inner walls and the rotor tip).

2.4. Shrouded Rotor Inflow Ratio

We define σ d as the expansion ratio of the shroud’s diffuser ( σ d = A 4 A R ), where A R is the rotor disc area. Then, applying the conservation of momentum equation between just before and just after the rotor (i.e., from station 2 to station 3), the rotor thrust can be calculated as per Equation (23).
T rotor = P 3 P 2 A R
By substituting p 2 = ρ v 1 2 v i n d 2 2 + p 1 , p 3 = ρ v 4 2 v i n d 2 2 + p 4 and p 1 = p atm 1 2 ρ v 1 2 in Equation (23), the rotor thrust can be found according to Equation (24), where v i n d ( r ) is the induced velocity in the rotor plane.
T rotor = 1 2 ρ A R v i n d 2 σ d 2
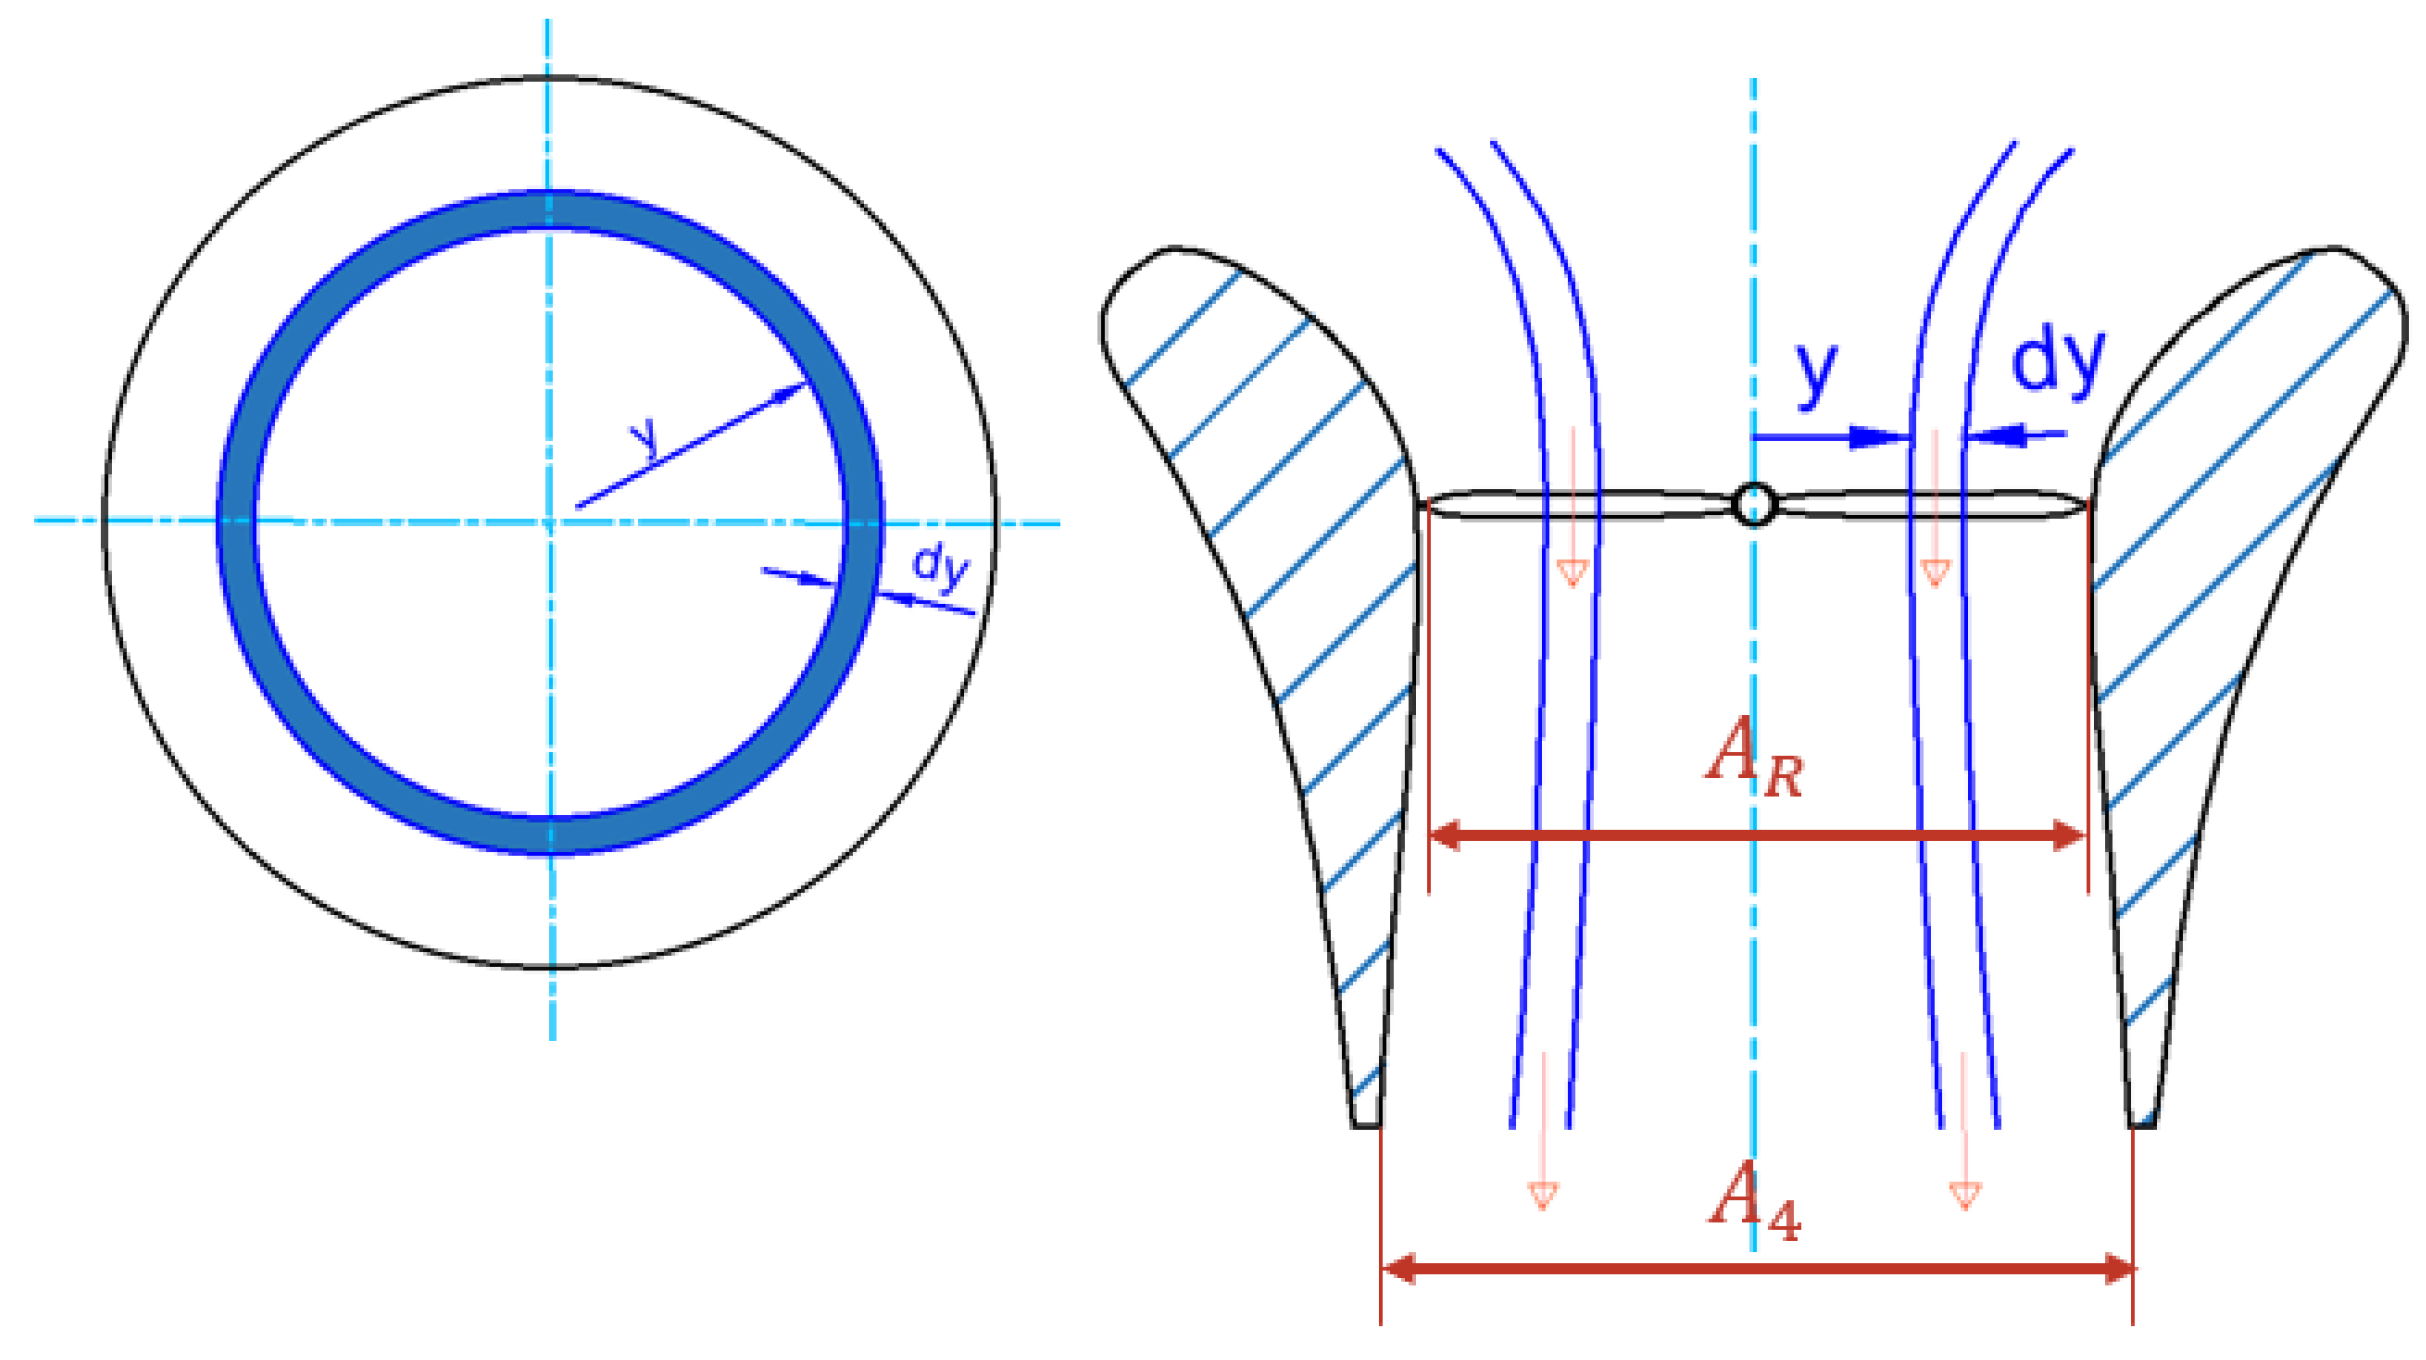
As part of the proposed analysis of shrouded rotors, BEMT [26] is used to predict the induced velocity experienced in shrouded rotors. From Figure 4, the area of the specific blade element of interest can be found as d A R = 2 π y d y , where y is the radial position. Thus, the elementary rotor thrust can be found as per Equation (25).
d T rotor = 1 2 ρ d A R v i n d 2 σ d 2 = π σ d 2 ρ v i n d 2 y d y
Then, the elementary rotor thrust coefficient can be found as per Equation (26).
d c T r o t o r = π ρ v i n d 2 y d y σ d 2 ρ π R 2 ( Ω R 2 ) 2 = 1 σ d 2 λ 2 r d r
where λ is the inflow ratio ( λ = v i n d Ω R ), r is the nondimensional radius ( y R ), and Ω is the rotational velocity in r a d / s . By including the overall loss correction factor, F s h , the thrust coefficient becomes
d C T = 1 σ d 2 F s h λ 2 r d r
A derivation of a linear equation for the induced velocity is needed for iterating a stable solution when modeling BEMT, similarly to the open rotor case [28,30]. As one blade element theory finding, the elementary rotor thrust coefficient can be obtained as follows [28]:
d c T r o t o r ( r ) = 1 2 σ c l α θ r 2 λ r d r
where θ is the local pitch angle, ( σ = N b c R π R 2 ) is the rotor solidity ratio, c l α is local lift curve slope, and Φ ( r ) is the local inflow angle ( Φ ( r ) = λ ( r ) r ).
By equating Equations (27) and (28), a quadratic function of the inflow ratio for the shrouded rotor can be obtained (Equation (29)). Then, the solution of that equation provides the local inflow ratio for the shrouded rotor case (Equation (31)).
σ c l α 2 θ r 2 λ r = 1 σ d 2 F s h λ 2 r d r
Rearranging Equation (29), we obtain
λ 2 + σ c l α σ d 2 2 F s h λ σ c l α σ d 2 2 F s h θ r = 0
By solving the quadratic equation for λ , we obtain
λ = 1 / 2 σ c l a σ d 2 2 F s h ± σ c l a σ d 2 2 F s h 2 + 4 σ c l a σ d 2 2 F s h θ r
Since λ typically represents a physical quantity that should be positive, the negative root is neglected. Finally, Equation (30) can be simplified to
λ ( r ) = σ c l α σ d 2 4 F s h 1 + 8 F s h σ c l α σ d 2 θ r 1
BEMT enables us to obtain accurate predictions of the induced flow velocities around and within shrouded rotors which relates to the induced power that is required to produce thrust at each one of the rotor’s elements [32,33]. To calculate the induced velocity at each element, Equation (31) is used through an iteration process. Moreover, in the case of local angles of attack exceeding the critical angle of attack, the model needs to account for the post-stall effects.

2.5. Post-Stall Behavior

Viterna and Corrigan [34,35] modified classical BEMT to improve its correlation with measured data when aerodynamic stall occurs at high angles of attack. The model proposes the following expressions for the lift and drag coefficients (Equation (32) and Equation (33), respectively) being affected by post-stall behavior.
c l = A 1 sin ( 2 α ) + A 2 cos 2 α sin α
c d = B 1 sin 2 ( α ) + B 2 cos α
where
A 1 = B 1 2 = c d max 2 B 1 = c d max = 1 + 0.065 A R 0.9 + t / c A 2 = c l s c d max sin α s cos α s B 2 = c d s c d s sin 2 α s cos α s
where c d max is the maximum drag coefficient, A R is the aspect ratio of the blade element ( d y c ( y ) ), t / c is the local airfoil thickness-to-chord ratio, α s is the stall angle of attack, and c l s and c d s are the lift and drag coefficients at the stall angle of attack, respectively.

2.6. Total Thrust According to Inlet Cap Model

The total thrust can be calculated as per Equation (34) according to the inlet cap model [24].
T t o t a l = 1 2 ρ A R v i n d 2 2 σ d 1 I 0 2 i 0
where i 0 is the inlet ratio ( A 1 A R ) and I 0 is the inlet cap ratio ( A 1 A 1 ). Consequently, the shroud thrust can then be found as per Equation (35) while the rotor thrust is calculated from BEMT, as illustrated in Figure 5.
T s h r o u d = T t o t a l T r o t o r = 1 2 ρ A R v i n d 2 2 σ d 1 I 0 2 i 0 1 σ d 2

3. Experimental Setup

Test Rig Design

A custom test rig fixture was developed and fabricated to securely hold the shrouded rotor, allowing for the validation of the analytical model, as seen in Figure 6. A two-axis load cell was attached directly to the rotor, ensuring that the force and torque measurements were unaffected by either the shroud or the struts and could measure the rotor’s thrust separate from the total thrust, as shown in Figure 6b. Meanwhile, the main load cell that measured the total thrust was connected to the whole assembly.
A schematic of the instrumentation is shown in Figure 7. The rotor’s RPM was calculated by capturing the voltage frequency from two phases of the Brushless Direct Current (BLDC) motor, ensuring precise mechanical power measurements. A Pololu Maestro Controller is used to send pulse width modulation (PWM) signals to the electronic speed controller (ESC), which adjusted the RPM of the BLDC motor. Automated data collection was managed by National Instruments Data Acquisition (DAQ) Systems. All data were gathered simultaneously, with each test running for a minimum of 15 s. The recorded data represented an average of ten readings taken every second.
The tip clearance was selected to be 0.03 times the rotor radius for this work to avoid the risk of potential physical interference between the rotor and the shroud. Additionally, all experimental tests were conducted under consistent operating conditions to ensure consistency.

4. Case Study

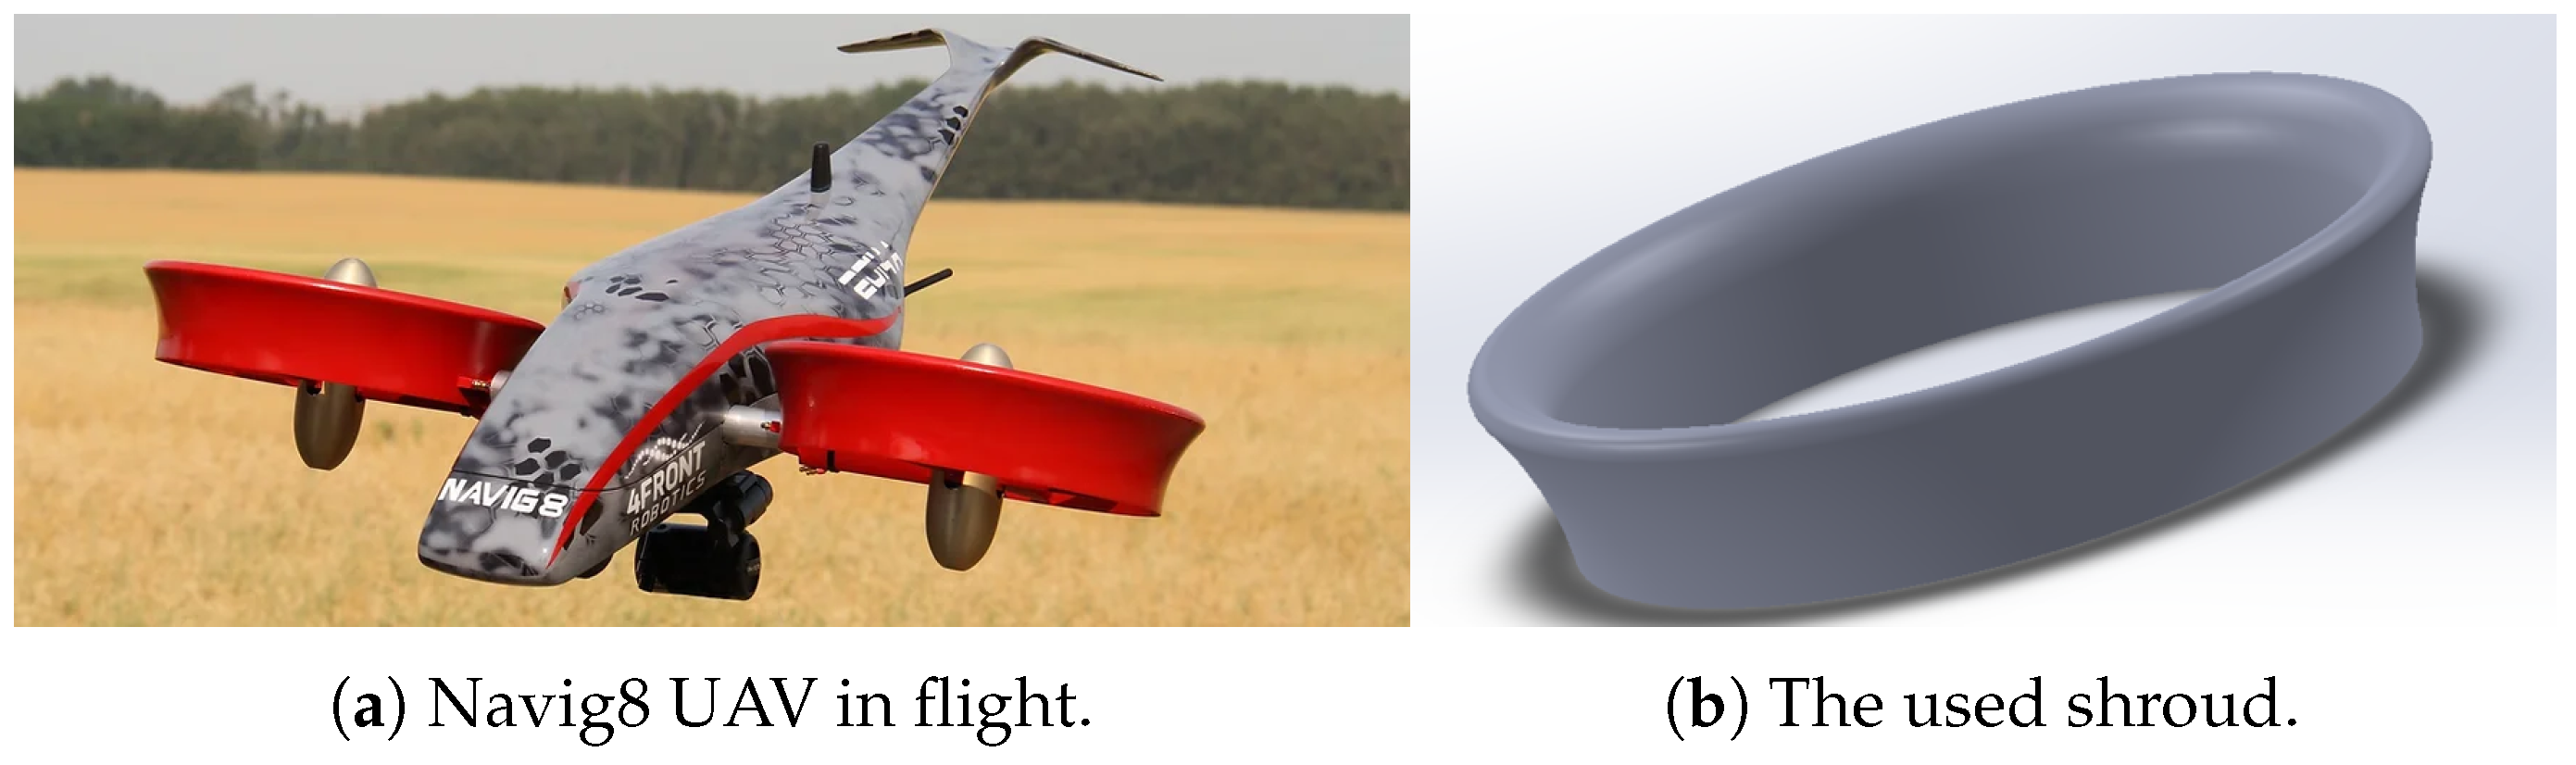
The shroud used in this study was originally designed for the Navig8 UAV, shown in Figure 8a, a maneuverable VTOL aircraft that incorporates shrouded rotors to improve the aerodynamic efficiency and overall performance of the rotor system. The shroud, as illustrated in Figure 8b, is engineered to ensure that the rotor functions within optimal conditions for both thrust generation and maneuverability. It has a lip radius ( r l i p ) of 0.01 m, the corresponding inlet angular coordinate θ s = 78 , and the diffuser expansion ratio σ d = 1.04 .
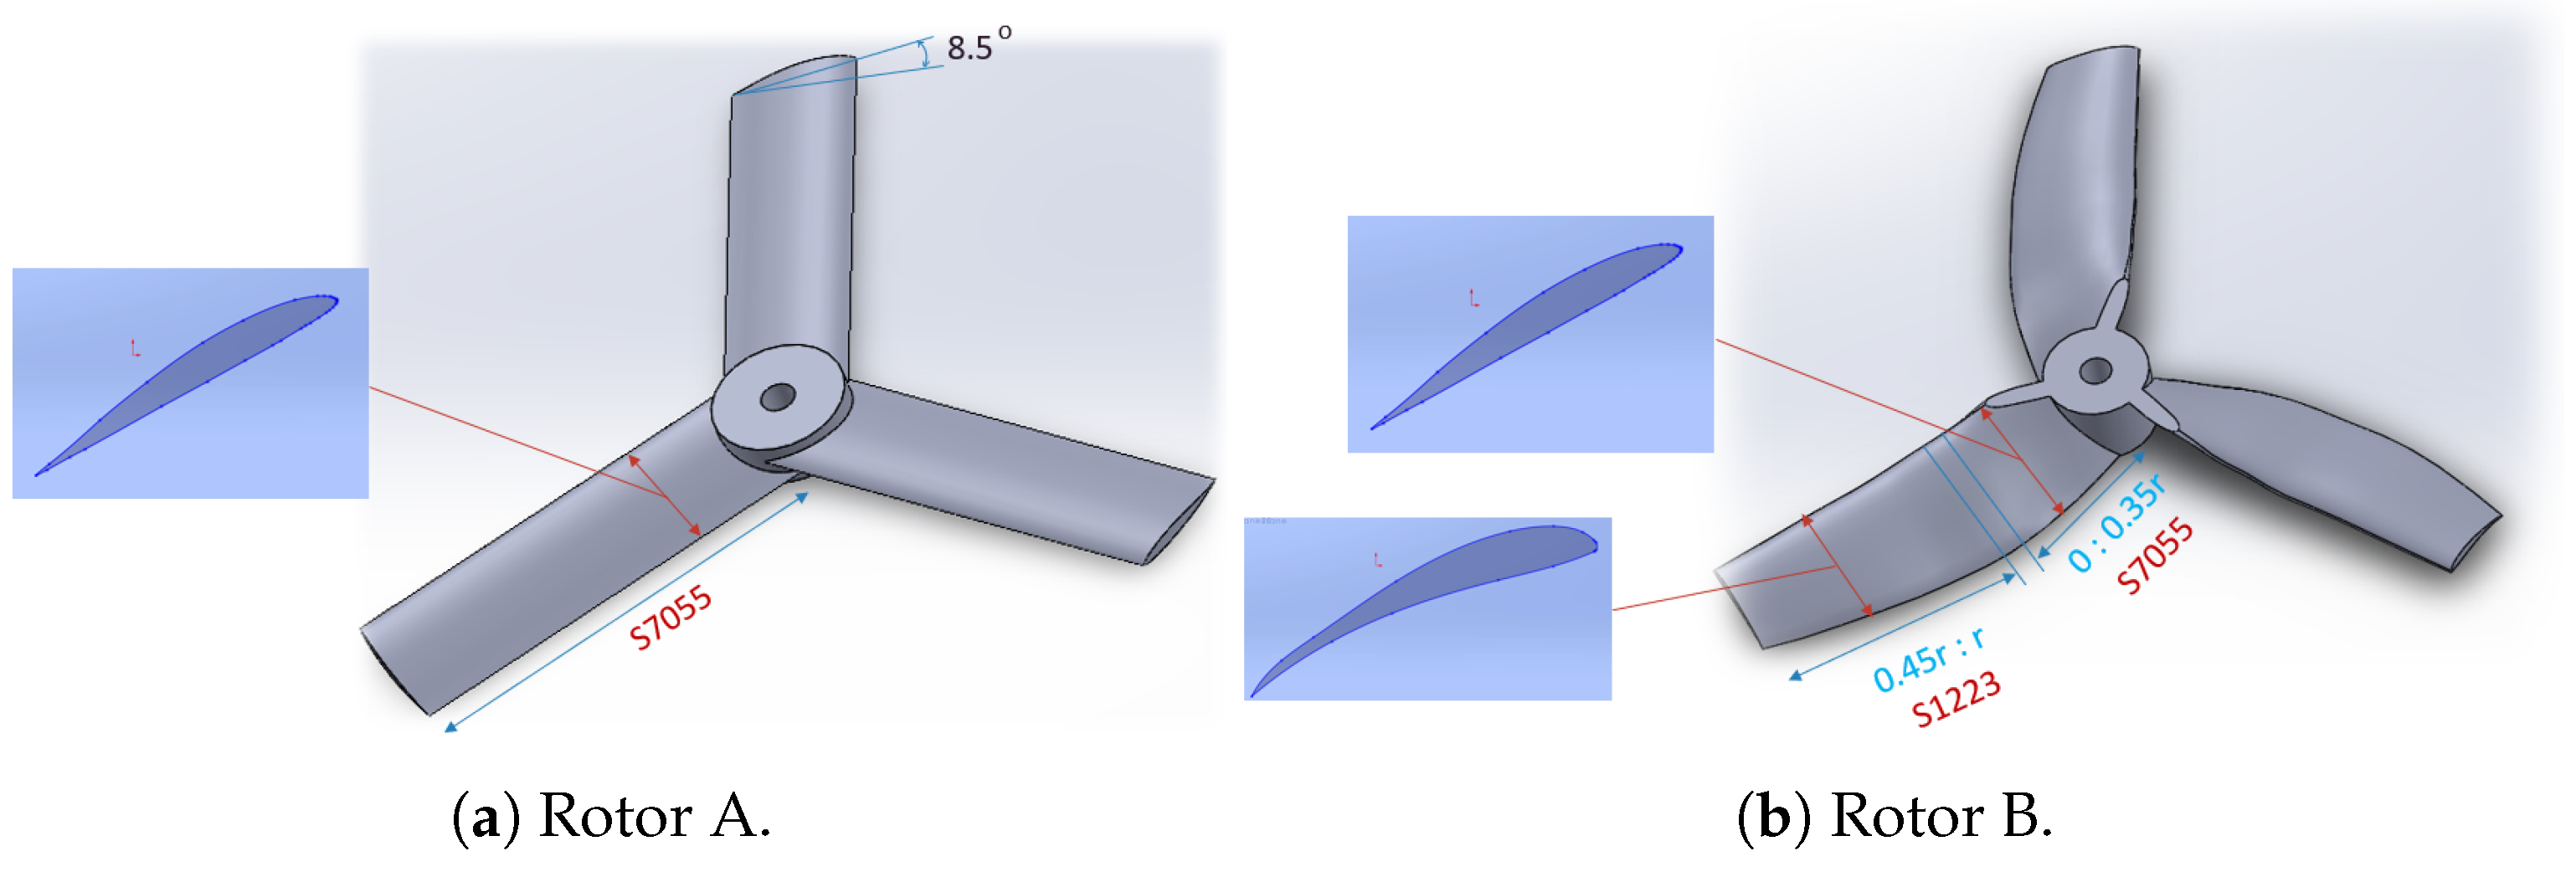
Two different rotors were chosen for the analytical modeling validation, which were Rotor A and Rotor B, with a radius 0.1143 m. Rotor A, shown in Figure 9a, was designed to have a basic shape of one cross-sectional airfoil (S7055), constant chord (0.033 m), and no twist (8.5°) along its radius. Rotor B, shown in Figure 9b, was designed by optimizing the chord and twist distributions, employing a third-degree variation for both the chord ( c ( r ) ) and twist ( θ ( r ) ). The Navig8 UAV served as a reference framework to establish the feasible regions for the function coefficients. BEMT was applied to optimize the rotor, aiming to surpass the thrust-to-power ratio of the original Navig8 rotor [36]. The equations governing the variations in the chord ( c ( r ) ) and twist ( θ t w ( r ) ) are presented in Equation (36) and Equation (37), respectively.
c ( r ) = 1.66 E 6 r 3 2.87 E 2 r 2 + 0.022 r + 0.033
θ t w ( r ) = 5.06 r 3 + 60.55 r 2 93 r + 51.23
It is important to note that the performance data for the S7055 and S1223 airfoils used in the analytical model were sourced from available experimental results to enhance the model’s accuracy [37].

5. Computational Model

To simulate the flow structure and predict the aerodynamic effects of the designed test rig, ANSYS (2021 R1) FLUENT CFD software was used. The simulations were performed in a steady-state, 3D framework, with rotor rotation modeled using the Multiple Reference Frame (MRF) approach. The flow field was divided into two sub-domains: a stationary domain covering the entire computational area and a rotating domain surrounding the rotor, as shown in Figure 10. The computational domain was cylindrical, measuring 2.5 m in length (about 11 D R ) and 2 m in diameter (about 9 D R ), with the shrouded rotor positioned 1 m downstream of the stationary domain’s entry point. The inlet boundary was defined as a velocity inlet with zero velocity, while the outlet boundary was set as a pressure outlet. The walls within the stationary domain were treated as symmetry boundaries, and all surfaces of the shrouded rotor were assigned no-slip wall conditions.
Figure 11 shows the two computational meshes, with and without the test rig with the same meshing properties. An unstructured mesh with tetrahedral cell meshing was generated for the entire flow domain using the ANSYS mesh tool due to the complex shrouded rotor configuration geometry. A CFD grid dependency study was carried out to verify that the simulation results were unaffected by mesh size. The grid was progressively refined until thrust and torque values stabilized, indicating minimal sensitivity to further refinement.
The Realizable k ϵ turbulence model, combined with enhanced wall functions, was employed in the simulations. This choice is particularly well-suited for applications involving rotating flows, which are typically characterized by high Reynolds numbers and complex vortex structures. The Realizable k ϵ model is known for its ability to accurately handle such flow conditions with delay in flow separation occurrences [38,39]. It offers a good balance between computational efficiency and the accuracy needed to capture essential flow dynamics, making it an appropriate and effective choice for these types of simulations [40].
The simulation conditions are summarized in Table 1. The air was assumed to have a constant density of 1.054 kg / m 3 for Rotor A and 1.057 kg / m 3 for Rotor B, in line with the experimental conditions. Equations (38) and (39) present the mathematical expressions for the turbulent kinetic energy (k) and turbulent dissipation rate ( ϵ ), respectively.
( ρ k ) t + ρ U j k x j = P k ρ ε + x j μ + μ t σ k k x j
( ρ ε ) t + ρ U j ε x j = C 1 ε S C ε 2 ρ ε k + v ε ε + x j μ + μ t σ ε ε x j
In contrast to the standard model, the Realizable variant treats C μ as a variable when computing the turbulent viscosity ( μ t = ρ C μ k 2 ε ). The value of C μ is calculated using the following relation:
C μ = 1 A 0 + A S k U * ε
The modification in the k ϵ Realizable model allows for the accurate simulation of turbulent rotating flows, capturing the recirculation and boundary layer separation effectively. This makes it particularly suitable for rotor flow simulations [41,42].

6. Results and Discussion

6.1. Test Rig Effects

The effect of the test rig on the results is accounted for through a computational study by simulating the shrouded rotor configuration both with and without the test rig. To verify the accuracy of the computational model, the experimental data for total thrust and torque are also considered, providing a basis for validation of the simulation results. Figure 12a and Figure 13a compare the total thrust from the simulated shrouded rotor configurations for Rotor A and Rotor B, respectively, both with and without the test rig, against the experimentally measured total thrust.
Additionally, the thrust of the shrouded rotor with the test rig is noticeably higher than that without the test rig. This difference can be attributed to the increased wake velocity in the CFD simulations when the test rig was present, as the rig reduced the exit area of the shroud.
The results suggest that the influence of the test rig on total thrust as well as the torque can be ignored for both rotors, allowing direct comparison between the analytical model and experimental data.

6.2. Analytical Model Validation

The main conclusion from the previous section enables a direct comparison between the analytical and experimental results by considering the effects of the test rig. In this section, CFD simulation results without the influence of the test rig are also included, as they, like the analytical results, are unaffected by the rig. Figure 14 and Figure 15 present a comparison between the analytical model, the experimental data, and the CFD simulations without the test rig for Rotor A and Rotor B, respectively. The overall conclusion from the total thrust, rotor thrust, and torque plots for both rotors is that the analytical model could accurately predict the performance of the shrouded rotor.
The total thrust presented in Figure 14a for Rotor A shows the relationship between rotational speed (RPM) and the total thrust generated by the rotor. The plot compares the experimental results, CFD simulations without the test rig (CFD W/O TR), and the analytical model predictions. The analytical model closely follows the experimental data. The CFD results without the test rig also follow the experimental trend, and the agreement with the analytical model is consistent across all RPMs. The slight deviation seen at higher RPMs is due to differences in the wake behavior not captured by the analytical model and the experimental rig effects not present in the CFD simulations. It must be noted that data below 4000 rpm are excluded because the BLDC motor could not generate sufficient torque to overcome the load and only achieved stable operation above approximately 3800 rpm when PWM was increased.
The rotor thrust for Rotor A plot in Figure 14b specifically isolates the contribution of the rotor to the overall thrust, once again comparing experimental data, CFD without the test rig, and the analytical model. The analytical model estimates higher rotor thrust than the CFD results without test rig effects. This discrepancy is likely due to the CFD’s inaccurate rotor thrust predictions for Rotor A.
The torque plot in Figure 14c shows how the torque varies with increasing RPM, providing insight into the power required to maintain the rotor at different speeds. The analytical model, similarly to the CFD without the test rig, accurately predicts the torque, showing a near-perfect match with experimental data up to around 7000 RPM, with a slight deviation beyond this point. This deviation is due to small discrepancies in modeling aerodynamic losses and assumptions made in the analytical formulation.
Based on Figure 15 for Rotor B, the results show a similar trend for total thrust, rotor thrust, and torque to that in the Rotor A case. The total thrust, presented in Figure 15a, continues to increase with RPM, and the data show that the experimental results, CFD without the test rig, and the analytical model are in close agreement, indicating that the analytical model provides a reliable prediction. The CFD results without the test rig also align closely with the analytical model, supporting the conclusion that the test rig does not significantly affect thrust prediction and can be ignored for analytical and computational comparisons.
The rotor thrust, shown in Figure 15b, which isolates the rotor’s contribution to the overall system, shows an increasing trend with RPM, similar to total thrust. The analytical model provides a strong match with the experimental data, with a very small difference across all RPMs. The model accurately predicts rotor thrust, confirming its validity in estimating rotor performance. The CFD results without the test rig follow the same trend as the analytical predictions. This suggests that the rotor’s thrust performance is well captured by both methods and is minimally influenced by the presence of the test rig.
The torque results, in Figure 15c, are also in excellent agreement across the experimental data, CFD without the test rig, and the analytical model. The analytical model predicts the torque with high precision, as indicated by the minimal discrepancy between the model and experimental data. At higher RPMs, the small deviation observed is likely due to minor aerodynamic effects not fully accounted for in the analytical approach. Similar to the thrust results, the CFD predictions for torque align closely with the analytical model and experimental data, further validating the model’s ability to accurately predict torque in the absence of the test rig.

7. Conclusions

The study employed a combination of BEMT and the sphere-cap model, alongside applying the inflow ratio for shrouded rotors. BEMT formed the foundation for calculating rotor performance, while the sphere-cap model accounted for the aerodynamic influence of the shroud. This provided a comprehensive analysis of shrouded rotors, capturing both the rotor dynamics and the shroud’s contribution to performance.
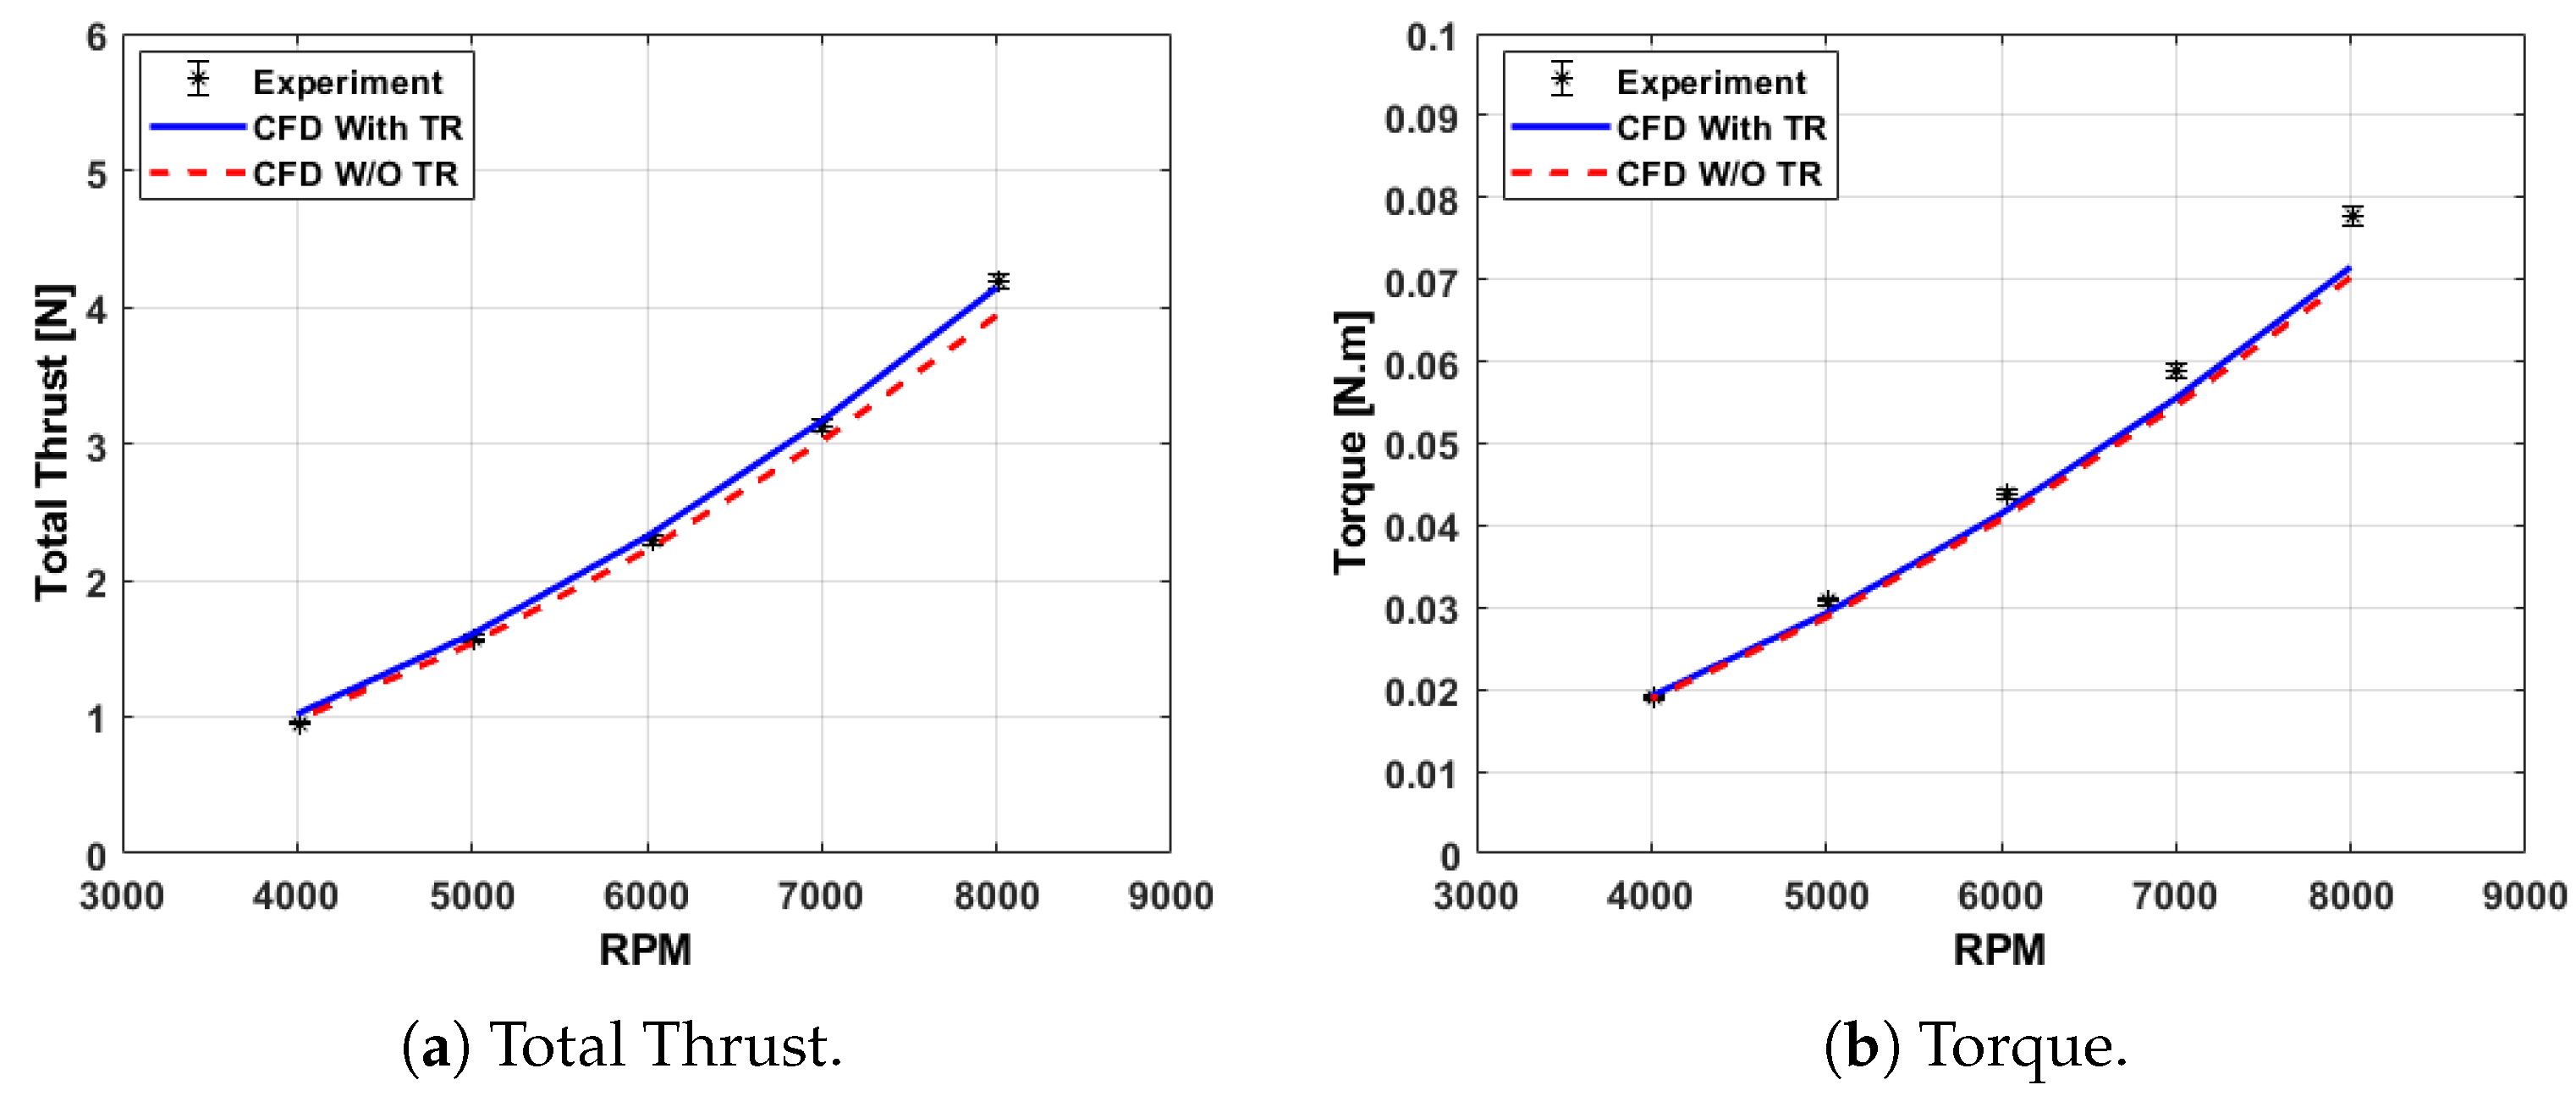
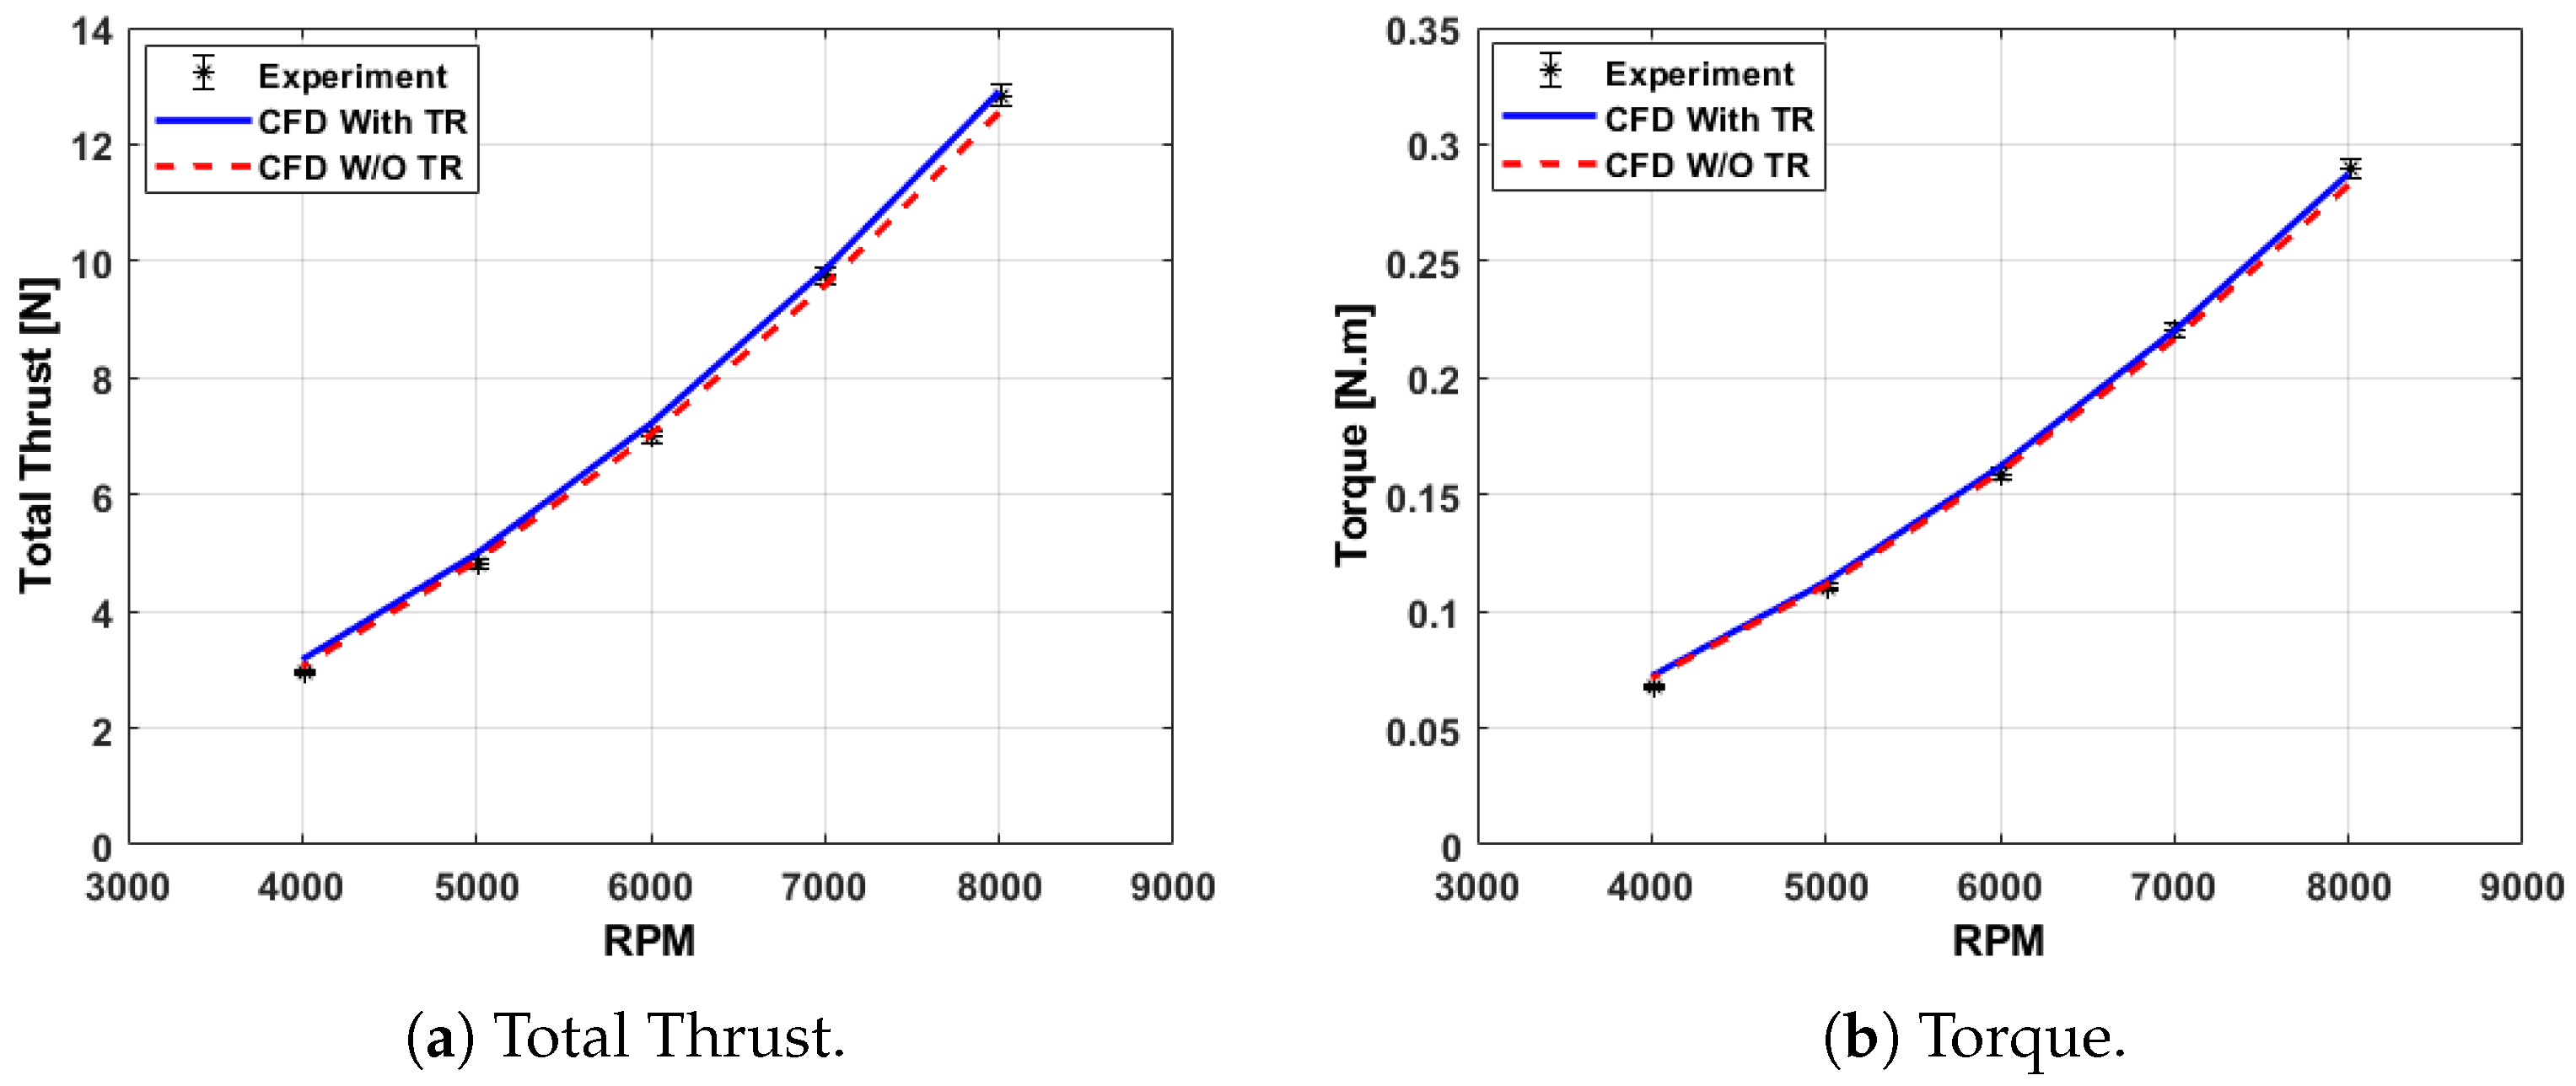
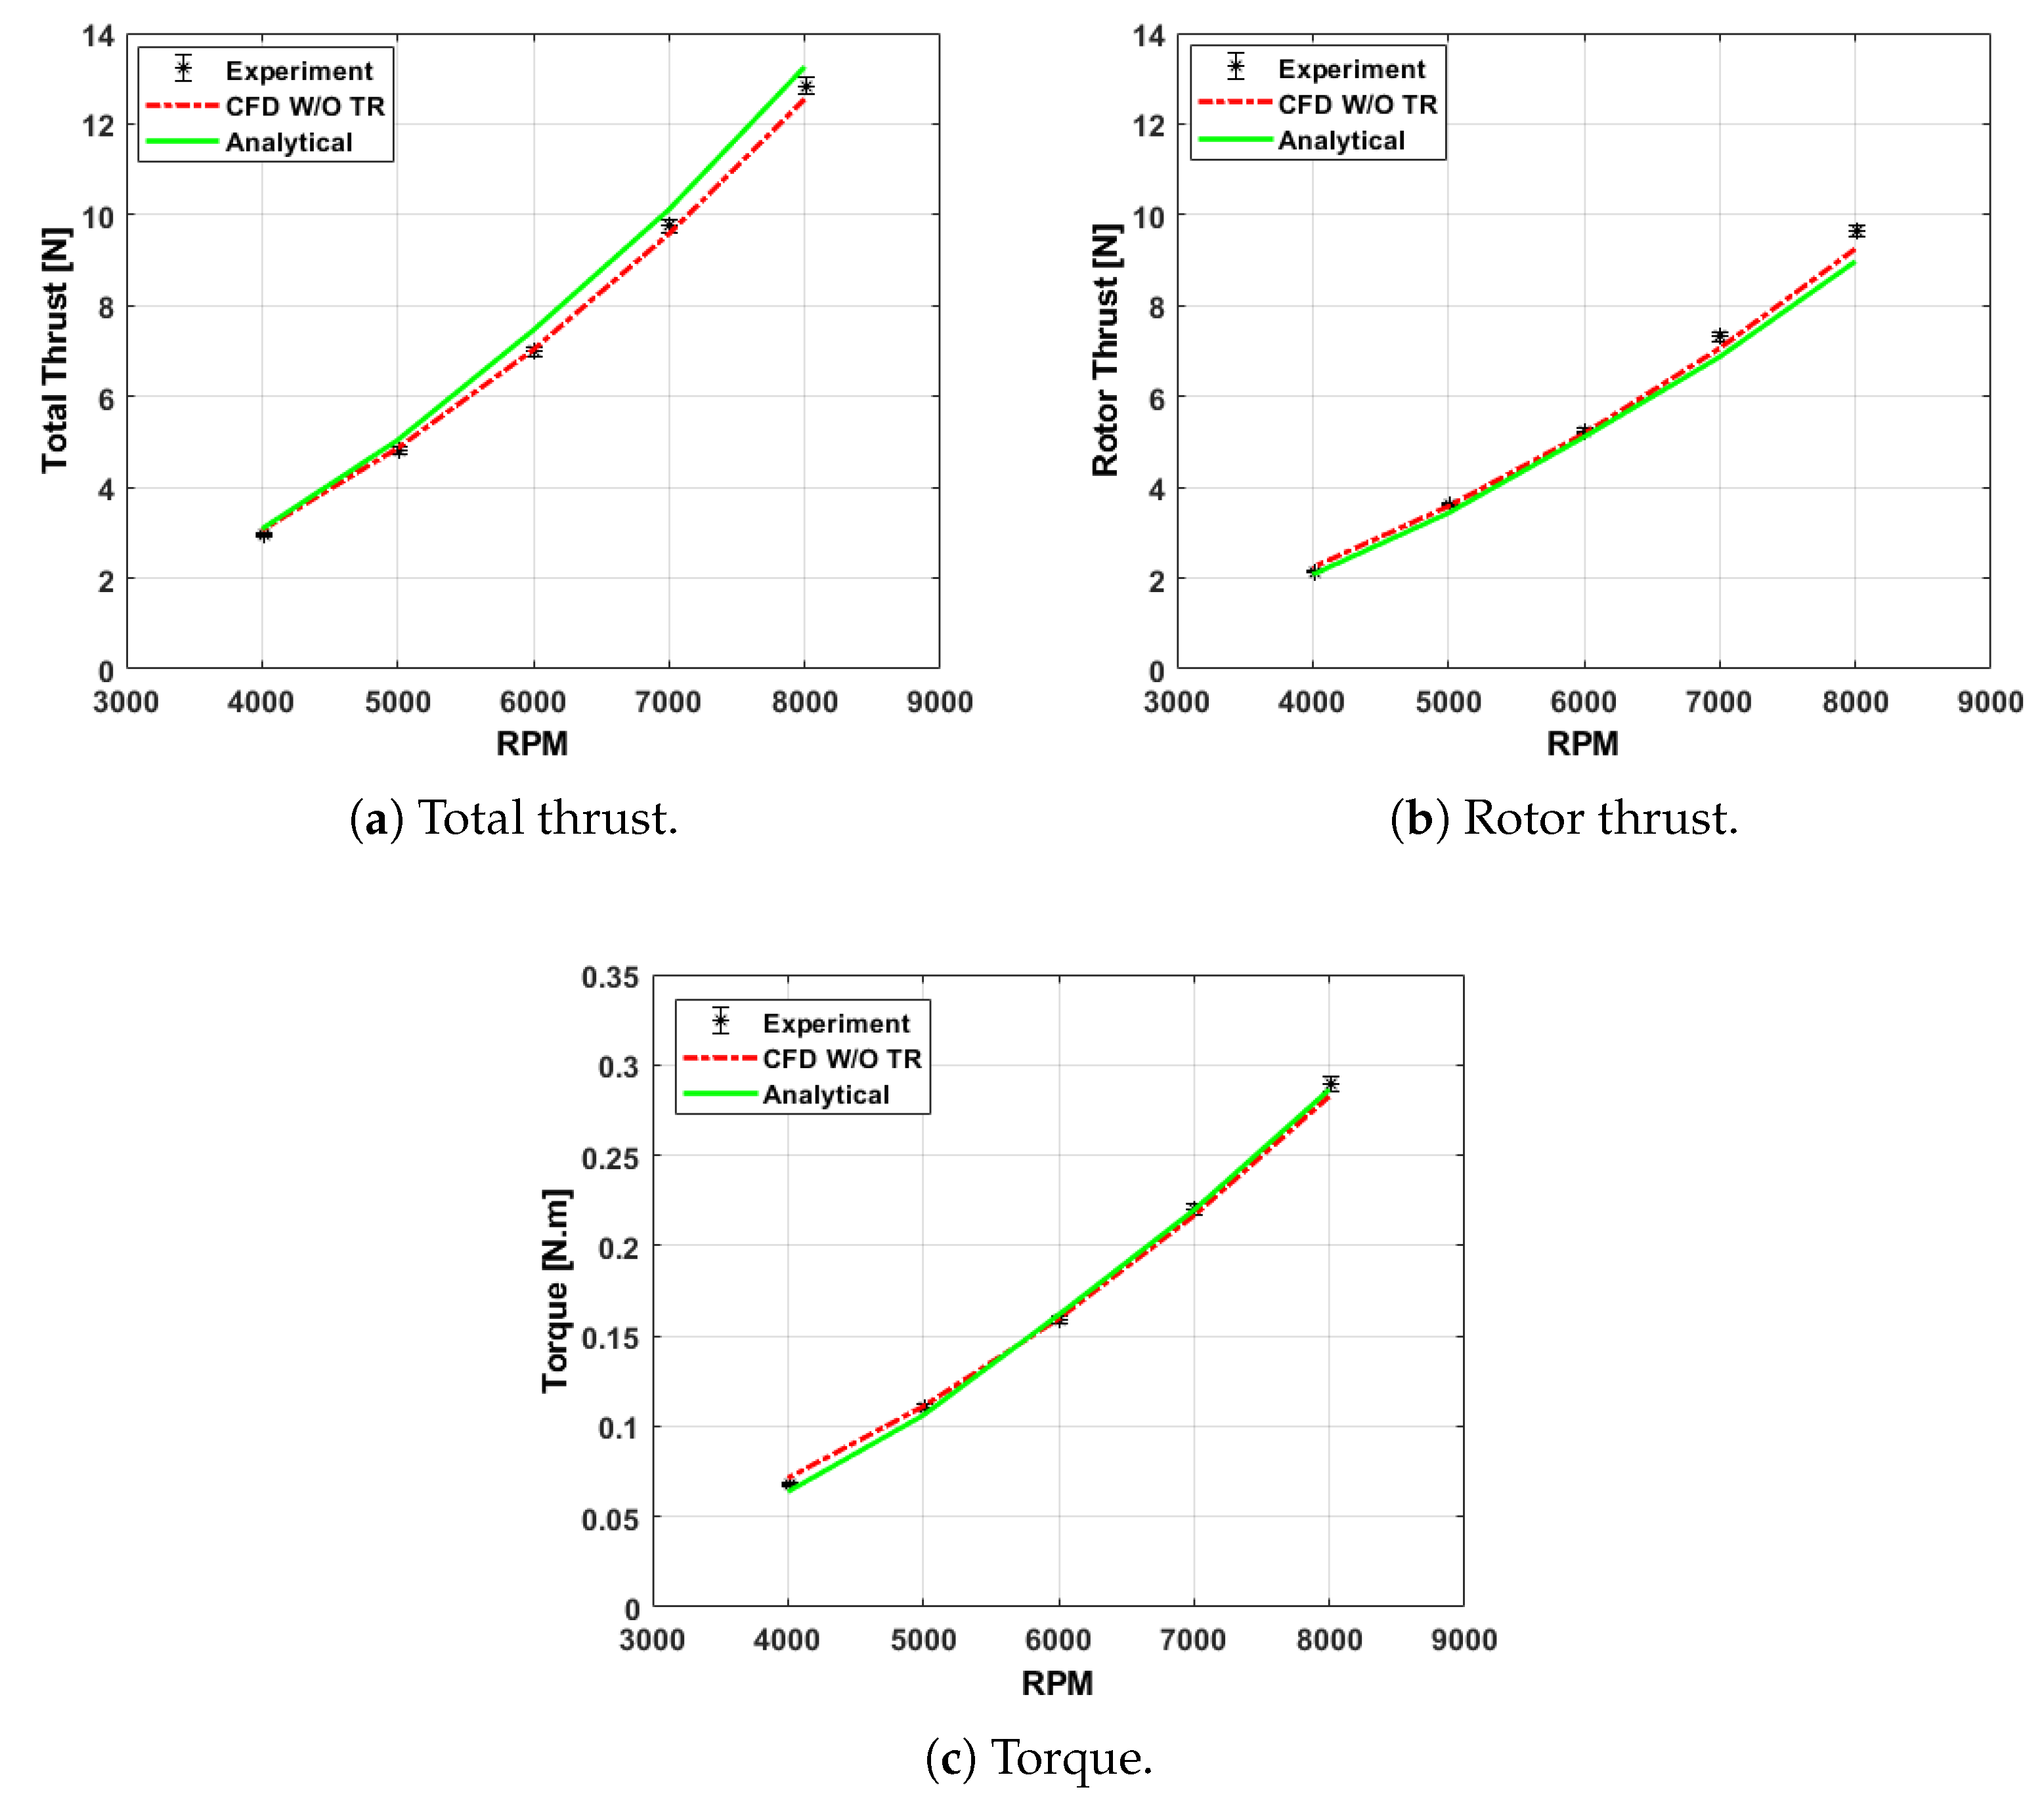
The effects of the test rig on shrouded rotor performance were investigated by conducting computational simulations with and without the test rig and comparing these results with experimental data. The agreement between the CFD without the test rig and the analytical model further suggested that the test rig’s influence could be reasonably disregarded, allowing for a more straightforward comparison between the analytical model and experimental results.
A comparison between the analytical model, experimental results, and computational simulations without the test rig was performed. The close match between the analytical model, experimental data, and CFD without the test rig across all three performance parameters (total thrust, rotor thrust, and torque) reinforces the accuracy of the analytical model in predicting rotor performance. Overall, these results suggest that the analytical model is a reliable tool for predicting the performance of the shrouded rotor, and the CFD simulations without the test rig provide additional validation by confirming that the test rig has minimal impact on the performance metrics.
The presented formula for the inflow ratio demonstrated its value and validity through the strong agreement between the predicted rotor thrust and both the experimental and CFD results. The close alignment across a wide range of RPMs indicated that the formula accurately captured the inflow characteristics of the shrouded rotor.
In summary, this study validated the analytical model for predicting the performance of the shrouded rotor with high accuracy. To assess the practical applicability and scalability of the analytical model, it was essential to consider the effects of scaling on the shrouded rotor performance. Variations in Reynolds numbers influenced aerodynamic forces, which was accounted for while calculating the lift and drag coefficients. While the analytical model predicts key performance metrics with reasonable accuracy, discrepancies may arise due to unmodeled scale-dependent effects, such as increased tip leakage at larger sizes or changes in boundary layer behavior within a shroud. Future research should evaluate the model’s accuracy across different rotor sizes, ensuring its reliability for both laboratory experiments and full-scale applications.

Author Contributions

All authors conducted the research, analyzed the data, and approved the final version. A.D. conducted the experiments, simulations, and analysis. A.R.-S. and R.J.M. revised the work and developed the conclusions. All authors have read and agreed to the published version of the manuscript.

Funding

This research received no external funding.

Data Availability Statement

The original contributions presented in this study are included in the article. Further inquiries can be directed to the corresponding author.

Conflicts of Interest

The authors declare no conflicts of interest.

References

  1. Hoffmann, G.; Rajnarayan, D.G.; Waslander, S.L.; Dostal, D.; Jang, J.S.; Tomlin, C.J. The Stanford testbed of autonomous rotorcraft for multi agent control (STARMAC). In Proceedings of the 23rd Digital Avionics Systems Conference (IEEE Cat. No. 04CH37576), Salt Lake City, UT, USA, 24–28 October 2004; Volume 2, p. 12-E. [Google Scholar]
  2. Hoffmann, G.; Huang, H.; Waslander, S.; Tomlin, C. Quadrotor helicopter flight dynamics and control: Theory and experiment. In Proceedings of the AIAA Guidance, Navigation and Control Conference and Exhibit, Honolulu, HI, USA, 18–21 August 2007; p. 6461. [Google Scholar]
  3. Martin, P.; Tung, C. Performance and flowfield measurements on a 10-inch ducted rotor vtol uav. In Proceedings of the 60th Annual Forum of the American Helicopter Society (AHS), Baltimore, MD, USA, 7–10 June 2004; Technical report. Army Research Development and Engineering Command Army Missile Command Moffett Field: Mountain View, CA, USA, 2004. [Google Scholar]
  4. Riley, T.M. Aeroacoustics and Fluid Dynamics Investigation of Open and Ducted Rotors. Ph.D. Thesis, University of Cincinnati, Cincinnati, OH, USA, 2021. [Google Scholar]
  5. Dayhoum, A.; Etewa, M.; Ramirez-Serrano, A.; Martinuzzi, R. Enhancing VTOL Performance: Shrouded Rotor BLDC Motor Model and Validation. In Proceedings of the 7th International Conference on Aeronautical, Aerospace and Mechanical Engineering (AAME 2024), Hong Kong, 8–10 March 2024. [Google Scholar]
  6. Dayhoum, A.; Ramirez-Serrano, A.; Martinuzzi, R. Number of Blades Influence on Rotor Performance in Open and Shrouded Configurations: Experimental Analysis. Aerospace 2024, 11, 644. [Google Scholar] [CrossRef]
  7. Thipyopas, C.; Barènes, R.; Moschetta, J.M. Aerodynamic analysis of a multi-mission short-shrouded coaxial UAV: Part I-hovering flight. In Proceedings of the 26th AIAA Applied Aerodynamics Conference, Honolulu, HI, USA, 18–21 August 2008; p. 6243. [Google Scholar]
  8. De Vehí Perich, M.C. Ducted Fan Propulsion System Study for ONAerospace eVTOL. Bachelor’s Thesis, Universitat Politècnica de Catalunya, Catalonia, Spain, 2023. [Google Scholar]
  9. Dayhoum, A.; Ramirez-Serrano, A.; Martinuzzi, R. Aerodynamic Optimization and Experimental Analysis of Shrouded Rotor Blades. In Proceedings of the Vertical Flight Society’s 80th Annual Forum & Technology Display (VFS 2024), Montreal, QC, Canada, 7–9 May 2024. [Google Scholar]
  10. KRIEBEL, A.R. Theoretical stability derivatives for a ducted propeller. J. Aircr. 1964, 1, 203–210. [Google Scholar] [CrossRef]
  11. Chang, I.C.; Rajagopalan, R. CFD analysis for ducted fans with validation. In Proceedings of the 21st AIAA Applied Aerodynamics Conference, Orlando, FL, USA, 23–26 June 2003; p. 4079. [Google Scholar]
  12. Quackenbush, T.R.; Wachspress, D.A.; Boschitsch, A.H.; Solomon, C.L. Aeromechanical analysis tools for design and simulation of VTOL UAV systems. In Proceedings of the 60rd American Helicopter Society Annual Forum, Baltimore, MD, USA, 7–10 June 2004. [Google Scholar]
  13. Gamse, B.; Mort, K. A Wind-Tunnel Investigation of a 7-Foot-Diameter Ducted Propeller; Technical Report; National Aeronautics and Space Administration: Washington, DC, USA, 1967.
  14. Fletcher, H.S. Experimental Investigation of Lift, Drag, and Pitching Moment of Five Annular Airfoils; Technical Report; National Aeronautics and Space Administration: Washington, DC, USA, 1957.
  15. Zhongyun, F.; Zhou, Z.; Xiaoping, Z. A design method for propeller with arbitrary circulation distribution. J. Aerosp. Power 2019, 34, 434–441. [Google Scholar]
  16. D’Angelo, S.; Berardi, F.; Minisci, E. Aerodynamic performances of propellers with parametric considerations on the optimal design. Aeronaut. J. 2002, 106, 313–320. [Google Scholar] [CrossRef]
  17. Guo, J.; Zhou, Z.; Li, X. An efficient design method for the blade of ducted propeller. Acta Aeronaut. Astronaut. Sin 2021. [Google Scholar]
  18. Lind, R.; Nathman, J.; Gilchrist, I. Ducted rotor performance calculations and comparison with experimental data. In Proceedings of the 44th AIAA Aerospace Sciences Meeting and Exhibit, Reno, NV, USA, 9–14 January 2006; p. 1069. [Google Scholar]
  19. Bi, N.P.; Kimmel, K.R.; Haas, D.J. Performance investigation of ducted aerodynamic propulsors. In Proceedings of the First International Symposium on Marine Propulsors, Trondheim, Norway, 22–24 June 2009. [Google Scholar]
  20. Han, H.; Xiang, C.; Xu, B.; Yu, Y. Experimental and computational analysis of microscale shrouded coaxial rotor in hover. In Proceedings of the 2017 International Conference on Unmanned Aircraft Systems (ICUAS), Miami, FL, USA, 13–16 June 2017; pp. 1092–1100. [Google Scholar]
  21. Mi, B.g. Numerical investigation on aerodynamic performance of a ducted fan under interferences from the ground, static water and dynamic waves. Aerosp. Sci. Technol. 2020, 100, 105821. [Google Scholar] [CrossRef]
  22. Yu, L.; Drukenbrod, M.; Greve, M.; Abdel-Maksoud, M. Research on automatic optimization of ducted propeller design based on CFD techniques. Shui Dong Xue Yan Jiu Jin Zhan 2013, 28, 438–444. [Google Scholar]
  23. Pereira, J.L. Hover and Wind-Tunnel Testing of Shrouded Rotors for Improved Micro Air Vehicle Design; University of Maryland: College Park, MD, USA, 2008. [Google Scholar]
  24. Jardin, T.; Grondin, G.; Gressier, J.; Huo, C.; Doué, N.; Barènes, R. Revisiting Froude’s theory for hovering shrouded rotor. AIAA J. 2015, 53, 1836–1844. [Google Scholar] [CrossRef]
  25. Dyer, K.G. Aerodynamic Study of a Small, Ducted VTOL Aerial Vehicle. Ph.D. Thesis, Massachusetts Institute of Technology, Cambridge, MA, USA, 2002. [Google Scholar]
  26. Hrishikeshavan, V.; Sirohi, J.; Tishchenko, M.; Chopra, I. Design, development, and testing of a shrouded single-rotor micro air vehicle with antitorque vanes. J. Am. Helicopter Soc. 2011, 56, 12008-1–12008-11. [Google Scholar] [CrossRef]
  27. Luo, Y.; He, Y.; Qian, Y.; Zhang, Y. Aerodynamic modeling of ducted fans under environmental disturbances. J. Phys. Conf. Ser. 2024, 2707, 012075. [Google Scholar] [CrossRef]
  28. Leishman, G.J. Principles of Helicopter Aerodynamics with CD Extra; Cambridge University Press: Cambridge, UK, 2006. [Google Scholar]
  29. Seddon, J.M.; Newman, S. Basic Helicopter Aerodynamics; John Wiley & Sons: Hoboken, NJ, USA, 2011; Volume 35. [Google Scholar]
  30. Johnson, W. Helicopter Theory; Courier Corporation: Chelmsford, MA, USA, 2012. [Google Scholar]
  31. Goodman, T.R. The tip correction for wind-tunnel tests of propellers. J. Aeronaut. Sci. 1956, 23, 1094–1098. [Google Scholar] [CrossRef]
  32. Glauert, H. The Elements of Aerofoil and Airscrew Theory; Cambridge University Press: Cambridge, UK, 1983. [Google Scholar]
  33. Droandi, G.; Gibertini, G. Aerodynamic blade design with multi-objective optimization for a tiltrotor aircraft. Aircr. Eng. Aerosp. Technol. Int. J. 2015, 87, 19–29. [Google Scholar] [CrossRef]
  34. Viterna, L.A.; Corrigan, R.D. Fixed pitch rotor performance of large horizontal axis wind turbines. In Large Horizontal-Axis Wind Turbines; NASA Lewis Reasearch Center: Cleveland, OH, USA, 1982; pp. 69–85. [Google Scholar]
  35. MacNeill, R.; Verstraete, D. Blade element momentum theory extended to model low Reynolds number propeller performance. Aeronaut. J. 2017, 121, 835–857. [Google Scholar] [CrossRef]
  36. Dayhoum, A.; Ramirez-Serrano, A.; Martinuzzi, R. Aerodynamic Investigation of Shrouded Rotors with Dual Exit Channels. Int. J. Mech. Eng. Robot. Res. (IJMERR) 2024, 13, 4. [Google Scholar] [CrossRef]
  37. Selig, M.S.; Guglielmo, J.J.; Broeren, A.P.; Giguere, P. Summary of Low-Speed Airfoil Data: Volume 1; SOARTECH Publications: Virginia Beach, VA, USA, 1995. [Google Scholar]
  38. Siavash, N.K.; Najafi, G.; Hashjin, T.T.; Ghobadian, B.; Mahmoodi, E. An innovative variable shroud for micro wind turbines. Renew. Energy 2020, 145, 1061–1072. [Google Scholar] [CrossRef]
  39. Zakariaa, A.F.; Nasirb, M.F.M.; bin Mukhtar, A.; Ridzuand, M.N. Design Analysis of Open and Ducted Propellers in UAV Application. J. Kejuruter. SI 2022, 5, 119–125. [Google Scholar] [CrossRef]
  40. Siddiqi, Z.; Lee, J.W. Experimental and numerical study of novel Coanda-based unmanned aerial vehicle. J. Eng. Appl. Sci. 2022, 69, 76. [Google Scholar] [CrossRef]
  41. Li, Y.; Rowinski, D.H.; Bansal, K.; Rudra Reddy, K. CFD modeling and performance evaluation of a centrifugal fan using a cut-cell method with automatic mesh generation and adaptive mesh refinement. In Proceedings of the 24th International Compressor Engineering Conference at Purdue, West Lafayette, IN, USA, 9–12 July 2018. [Google Scholar]
  42. Vijayanandh, R.; Ramesh, M.; Raj Kumar, G.; Thianesh, U.; Venkatesan, K.; Senthil Kumar, M. Research of noise in the unmanned aerial vehicle’s propeller using CFD. Int. J. Eng. Adv. Technol. 2019, 8, 145–150. [Google Scholar]
Figure 1. Shrouded rotor stations.
Actuators 14 00138 g001
Figure 2. Sphere-cap model for inlet flow geometry of a shrouded rotor.
Actuators 14 00138 g002
Figure 3. Aerodynamic forces and angles defined for blade element.
Actuators 14 00138 g003
Figure 4. Shrouded rotor BEMT element.
Actuators 14 00138 g004
Figure 5. BEMT combined with inlet cap model.
Actuators 14 00138 g005
Figure 6. Shrouded rotor experimental setup.
Actuators 14 00138 g006
Figure 7. A schematic diagram of the instrumentation connections.
Actuators 14 00138 g007
Figure 8. Navig8 UAV shroud.
Actuators 14 00138 g008
Figure 9. Selected rotors for the analytical modeling validation.
Actuators 14 00138 g009
Figure 10. Stationary and rotating zones used in the simulation.
Actuators 14 00138 g010
Figure 11. Simulated shrouded rotor with and without test rig. (a) Shrouded rotor without test rig. (b) Shrouded rotor with test rig.
Actuators 14 00138 g011
Figure 12. Experimental vs. computational results with and without test rig for shrouded Rotor A.
Actuators 14 00138 g012
Figure 13. Experimental vs. computational results with and without test rig for shrouded Rotor B.
Actuators 14 00138 g013
Figure 14. Experimental vs. computational vs. analytical results for shrouded Rotor A.
Actuators 14 00138 g014
Figure 15. Experimental vs. computational vs. analytical results for shrouded Rotor B.
Actuators 14 00138 g015
Table 1. ANSYS fluent simulation conditions.
Turbulence ModelRealizable k ϵ
Wall TreatmentEnhanced Wall Function
SolverPressure-based
Spatial Discretization
GradientLeast-square Cell-based
Pressure MethodSecond Order
Turbulent Kinetic EnergyFirst-Order Upwind
Turbulent Dissipation RateFirst-Order Upwind
Disclaimer/Publisher’s Note: The statements, opinions and data contained in all publications are solely those of the individual author(s) and contributor(s) and not of MDPI and/or the editor(s). MDPI and/or the editor(s) disclaim responsibility for any injury to people or property resulting from any ideas, methods, instructions or products referred to in the content.

