Article

Thermal Characterization of Ceramic Composites for Optimized Surface Dielectric Barrier Discharge Plasma Actuators

by
Kateryna O. Shvydyuk
*,
Frederico F. Rodrigues
,
João Nunes-Pereira
,
José C. Páscoa
and
Abílio P. Silva
Centre for Mechanical and Aerospace Science and Technologies (C-MAST), University of Beira Interior, 6201-001 Covilhã, Portugal
*
Author to whom correspondence should be addressed.
Actuators 2025, 14(3), 127; https://doi.org/10.3390/act14030127
Submission received: 14 January 2025 / Revised: 17 February 2025 / Accepted: 3 March 2025 / Published: 6 March 2025
(This article belongs to the Section Aerospace Actuators)

Abstract

:
Ice accretion is a significant drawback in an aircraft’s and wind turbine’s aerodynamic performance in cold climate weather. Plasma actuators are an attractive technology for ice removal; however, dielectric barriers are typically restricted to borosilicate glass and various polymers, such as Teflon® and Kapton®. Nevertheless, new materials capable of withstanding prolonged exposure to charged particles are needed. In this work, Y2O3-ZrO2, MgO-CaZrO3, and MgO-Al2O3 ceramic samples were manufactured and their thermal properties as DBD plasma actuators were measured. As foreseen, the results showed that the higher the power consumed, the higher the temperature surface of the plasma actuators. The Y2O3-ZrO2 dielectric showed the highest power consumption and ceiling temperatures (20.7 W and 155 °C at 10 kVpp, respectively), followed by MgO-CaZrO3 (9.6 W and 62 °C at 10 kVpp, respectively) and by MgO-Al2O3 (5.6 W and 47 °C at 10 kVpp, respectively). It was concluded that MgO-Al2O3 presented stable magnitudes across the entire dielectric area, whilst Y2O3-ZrO2 showed a more concentrated temperature field. Therefore, considering that about 65 to 95% of the total power supplied to the DBD plasma actuator is dissipated as heat, it becomes natural to propose ceramic-based DBD plasma actuators as de-/anti-icing means for aero-dynamic structures.

1. Introduction

Ice accumulation is reported to severely decrease the aerodynamic performance of an aircraft due to induced flow separation, drag, and weight increase, which, in turn, diminishes thrust and lift forces [1]. Ice formation, followed typically by ice accumulation phenomena, promotes, for example, wing and engine blade profile modifications on aircraft surfaces. Consequently, in the United States of America, the National Transportation Safety Board [2] has identified aircraft icing as one of the safety concerns that urgently needs to be addressed. Among several reports, in 1994, an Embraer EMB120 aircraft was involved in an accident resulting from ice accretion on the wing’s upper surface, which promoted airflow separation and uncoordinated flight [3]. From 2000 to 2011, carburetor icing was pointed out to be the cause of about two hundred and fifty accidents, of which two per year were fatal [4]. From 2016 to 2019, Europe and Canada conducted the PHOBIC2ICE project aiming to develop technologies and predictive simulation routines designed to reduce the ice accretion phenomena [5]. Similarly, wind turbine icing fosters aerodynamic performance degradation due to weight imbalances in cold climates. Moreover, ice formation may lead to the automatic shutdown of wind turbines, and, therefore, loss of power. Ice falls from the wind turbines may endanger nearby people and infrastructure. Gao and Hu (2021) [6] reported that 19%, 72%, and 94% of wind turbines in Asia, North America, and Europe, respectively, have experienced icing events. Consequently, anti-icing and de-icing technologies have vastly improved over the years, e.g., liquid-based, pneumatic, ultrasonic-based, thermal, and electro-thermal systems [7,8]. Nonetheless, these mechanisms have shown associated problems, such as environmental pollution, mechanical damage (foreign object damage hazard), unreliability, or inefficiency in flight conditions due to supercooled degradation and demanding power conditions [8]. Given the abovementioned, further development of innovative de-icing/anti-icing systems is required.
Dielectric barrier discharge plasma actuators have been subject to numerous studies as mechanisms for active aerodynamic flow control, and, more recently, as de-icing/anti-icing technology due to their thermal power loss [8,9,10,11,12,13]. Anti-icing processes prevent the formation of ice layers, whereas de-icing processes involve the removal of existing ice layers [7]. Jukes et al. (2007) [14] performed thermal imagery of the gas temperature around the electrode and Mylar dielectric surface temperature, noting that both experienced heating due to the plasma discharge. Dong et al. (2008) [15] performed a breakthrough study on the impact of frequency and applied voltages on the power dissipation of a DBD plasma actuator. Moreover, the authors quantified plasma temperatures by spectroscopy emission measurements. Stanfield et al. (2009) [16] used emission spectroscopy to obtain rotational and vibrational temperature profiles for N2 for the discharge region of a single-layer surface DBD as a function of input voltage. The authors concluded that the rotational temperature profiles fluctuate in the spanwise direction of the discharge and are attenuated in the induced flow direction. The observed results led the authors to believe that a relationship exists between the area that microdischarges attach to the exposed electrode and temperature fluctuations. Joussot et al. (2010) [17] analyzed the thermal characterization of a Kapton®/Mylar®-based alternating current (AC) DBD plasma actuator via an infrared camera to assess the influence of electric parameters. Likhanskii et al. (2010) [18] proposed dielectric barrier discharge as a de-icing device. The authors remarked that due to both force and heating effects, temperature increase does not interfere with the flow characteristics, nor generates “hot spots”. Rodrigues et al. (2018) [19] constructed different plasma actuators to study the influence of the dielectric thickness and material for film cooling and de-icing/anti-icing. The results showed that Kapton®-, poly-isobutylene-, polylactic acid-, and acetoxy silicone-based dielectrics had average heat generation efficiencies between 57% and 88%. More recently, Abdollahzadeh et al. (2022) [20] performed a parametric optimization for the better ice sensing and de-icing performances of surface DBD (SDBD) plasma actuators considering Kapton®, PIB rubber, PMMA, and Teflon® dielectric layers. It was also shown that the ice sensitivity varied considering the dielectric materials used. Over the years, although several studies have focused on the de-icing, anti-icing, and ice-sensing capabilities of AC SDBD plasma actuators, the dielectric barrier materials used in these studies have primarily been polymers [21]. Therefore, new materials capable of withstanding long periods of exposure to charged particles are needed [22,23]. Shvydyuk et al. (2023) [24] manufactured ceramic-based SDBDs and captured infrared images of them assembled. Three compositions commonly applied in metallic substrates for thermal barrier coatings were used as ceramic composites. As a follow-up, in this study, Y2O3-ZrO2, MgO-CaZrO3, and MgO-Al2O3 ceramic composite dielectric barriers were thermally analyzed to propose original solutions for improving AC SDBD robustness for ice accretion mitigation. Specifically, the produced ceramics’ thermal conductivity analysis and temperature field distributions were evaluated.

2. Materials and Methods

Sample Manufacturing

In the current study, three ceramic dielectric plates were fabricated from commercially available powders. To produce the Y2O3-ZrO2 dielectric specimen 3 mol% yttria-stabilized zirconia (t-3YSZ) (Tosoh-Zirconia, Tokyo, Japan), 8 mol% yttria-stabilized zirconia (c-8YSZ) (Tosoh-Zirconia, Tokyo, Japan), and monoclinic zirconia (m-ZrO2) (Acros Organics, Antwerp, Belgium) powders of high purity (wt%: 99.8, 99.7 and 98.5 for t-3YSZ, c-8YSZ, and m-ZrO2, respectively) were used. For the MgO-CaZrO3 ceramic composite, magnesium oxide (MgO) and calcium zirconate (CaZrO3) (Alfa Aesar, Ward Hill, MA, USA) powders of high purity (wt%: 96, and 99.2, respectively) were used. Considering the MgO-Al2O3 composition, magnesium oxide (MgO) (Alfa Aesar, Ward Hill, MA, USA) and aluminum oxide (Al2O3) (Acros Organics, Antwerp, Belgium) powders of high purity (wt%: 96 and 99, respectively) were applied. The mentioned raw powders were milled (3 h for Y2O3-ZrO2 and MgO-CaZrO3; and 6 h for MgO-Al2O3) in grinding bowls with 250 mL capacity in a high-energy planetary mill (Fritsch, Pulverisette 6, Idar-Oberstein, Germany) at 500 rpm in cycles of 30 min. The milling process was performed with a powder/isopropyl alcohol/balls ratio of 1/1/2. Next, the mixtures were dried in a stove at 80 °C for 24 h (Carbolite, NR200-F, Hope Valley, UK), and sieved (Retsch, AS200, Haan, Germany) using a 63 μm mesh. The sieved mixtures were each compacted with a universal testing machine (Instron 8800, 100 kN capacity, Canton, MA, USA) using rectangular dies of high-strength steel measuring 60 × 60 mm. The sintering process was then conducted in an electrical furnace (Termolab, MLR, Águeda, Portugal) (2 h at 1450 °C for Y2O3-ZrO2 and MgO-CaZrO3; and 1600 °C for MgO-Al2O3) with an initial heating rate of 5 °C/min. Lastly, to uniformize the dielectric ceramic plates, polishing with silicon carbide paper was performed (Struers DAPV, Ballerup, Denmark). After sintering, the ceramic plates were tested for apparent porosity and relative density according to the international standard ASTM C20-00 [25]. The theoretical densities of the diffractogram cards were used to compute the relative densities of the ceramic composites. The theoretical diffractograms XRD cards no. 50-1089 (t-3YSZ), no. 49-1642 (c-8YSZ), no. 37-1484 (m-ZrO2), no. 35-0790 for (CaZrO3), no. 46-1212 (Al2O3), no. 71-1176 (MgO), and no. 77-1193 (MgAlO4) were used. Moreover, an X-ray diffraction (XRD) study (Rigaku DMAX III/C, Tokyo, Japan) was conducted with data collected within 10° to 90° (2θ) to confirm the chemical composition of the final material obtained. Scanning electron microscopy (SEM) (Hitachi S-2700, Tokyo, Japan) was performed to obtain microscopic images of Y2O3-ZrO2, MgO-CaZrO3, and MgO-Al2O3 ceramic samples. The samples were previously thermally etched at 1305 °C for zirconia-based and 1440 °C for alumina-based ceramics and coated with an ultrathin gold layer (Emitech K550 Gold Sputter Coater, Quorum Technologies, East Sussex, UK).
After obtaining the three ceramic plates of Y2O3-ZrO2, MgO-CaZrO3, and MgO-Al2O3 these were assembled into SDBD plasma actuators. Two electrodes—one exposed and one covered with an insulation tape (10 mm and 20 mm width, respectively)—were asymmetrically mounted on each side of the ceramic dielectric plates with a 1 mm gap. This way, the total resulting plasma spanwise length was approximately 30 mm. Moreover, the electrodes were made of copper tape with a thickness of 80 μm. The SDBD plasma actuators were operated by a sinusoidal AC high-voltage source (PVM 500 model, Information Unlimited, Amherst, MA, USA)—up to 20 kV peak-to-peak (kVpp) and 20 kHz to 50 kHz frequencies. Both voltage and current waveforms were monitored with a digital oscilloscope (PicoScope 5443 A, Pico Technology, Cambridgeshire, UK) connected to a high-voltage probe (MI074 Secondary Ignition Pickup, Lurgan, UK). The waveforms were obtained with a sampling rate of 125 MS/s and a 14-bit vertical resolution, providing data with an uncertainty of 1%. Power consumptions were calculated using the electric current method [26], using a metal resistor (Robert Mauser, Lda., Lousa, Portugal). The metal resistor had an impedance of 100 Ω and a tolerance of 1%. The resistor was chosen based on its temperature coefficient of 50 ppm, which means that the impedance is approximately constant during the plasma discharge process and is therefore neglected in the power consumption analysis. Considering the uncertainty of the digital oscilloscope and the tolerance of the resistor, the error of the power consumption analysis will be less than 2%.
The temperature fields induced by heat dissipation through the plasma discharge process were analyzed using an infrared technique via a thermal imaging camera (FLIR E50, Teledyne FLIR, Wilsonville, OR, USA) with a resolution of 240 × 180 pixels and an uncertainty of 2%. Infrared is a non-invasive technique that provides the user with a thermal map of the analyzed sample. The infrared technique measures the electromagnetic radiation emitted by objects and converts this radiation—at wavelengths around 700 nm and 1 mm—into temperature [27,28]. All bodies with a temperature above absolute zero emit electromagnetic (including infrared) radiation from their surfaces that is proportional to their intrinsic temperature. In practice, the emission, e , of the body varies between 0 < e < 1 . By applying the Steffan–Boltzmann law, the temperature of the dielectric layer can be computed based on the radiation it emits [15]. Since the samples varied in size due to distinct densification processes, the temperature fields were captured at different heights (130 mm for Y2O3-ZrO2 and MgO-CaZrO3, and 210 mm for MgO-Al2O3). To ensure temperature stabilization, the infrared images were captured after the plasma discharge stoppage, which lasted for 300 s [17,29,30]. It should be emphasized that the plasma actuators were first painted with black matte ink (emissivity of 0.97). Figure 1 shows the experimental setup.
Additionally, thermal conductivity was determined according to the laser flash analysis standard test ASTM E1461-13 [31]. For that purpose, disc specimens (diameter of approximately 12.55 ± 0.5 mm) were tested on a LFA 457 MicroFlash (Netzsch, Selb, Germany) after applying a high emissivity coating (Kontakt-Chemie 76009-AG, Graphit 33 Spray, Zele, Belgium) for improved energy absorption. The ceramic samples’ thermal conductivity parameter was tested in a controlled inert atmosphere with a reference material (Pyroceramic, Order number 6.256.1–94.0.03, Netzsch, Germany) for calibration aims.

3. Results and Discussion

The following sections, divided into the topics of AC SDBD consumed power, thermographic analysis, and spatial thermal variations, describe the study performed and the analysis made.

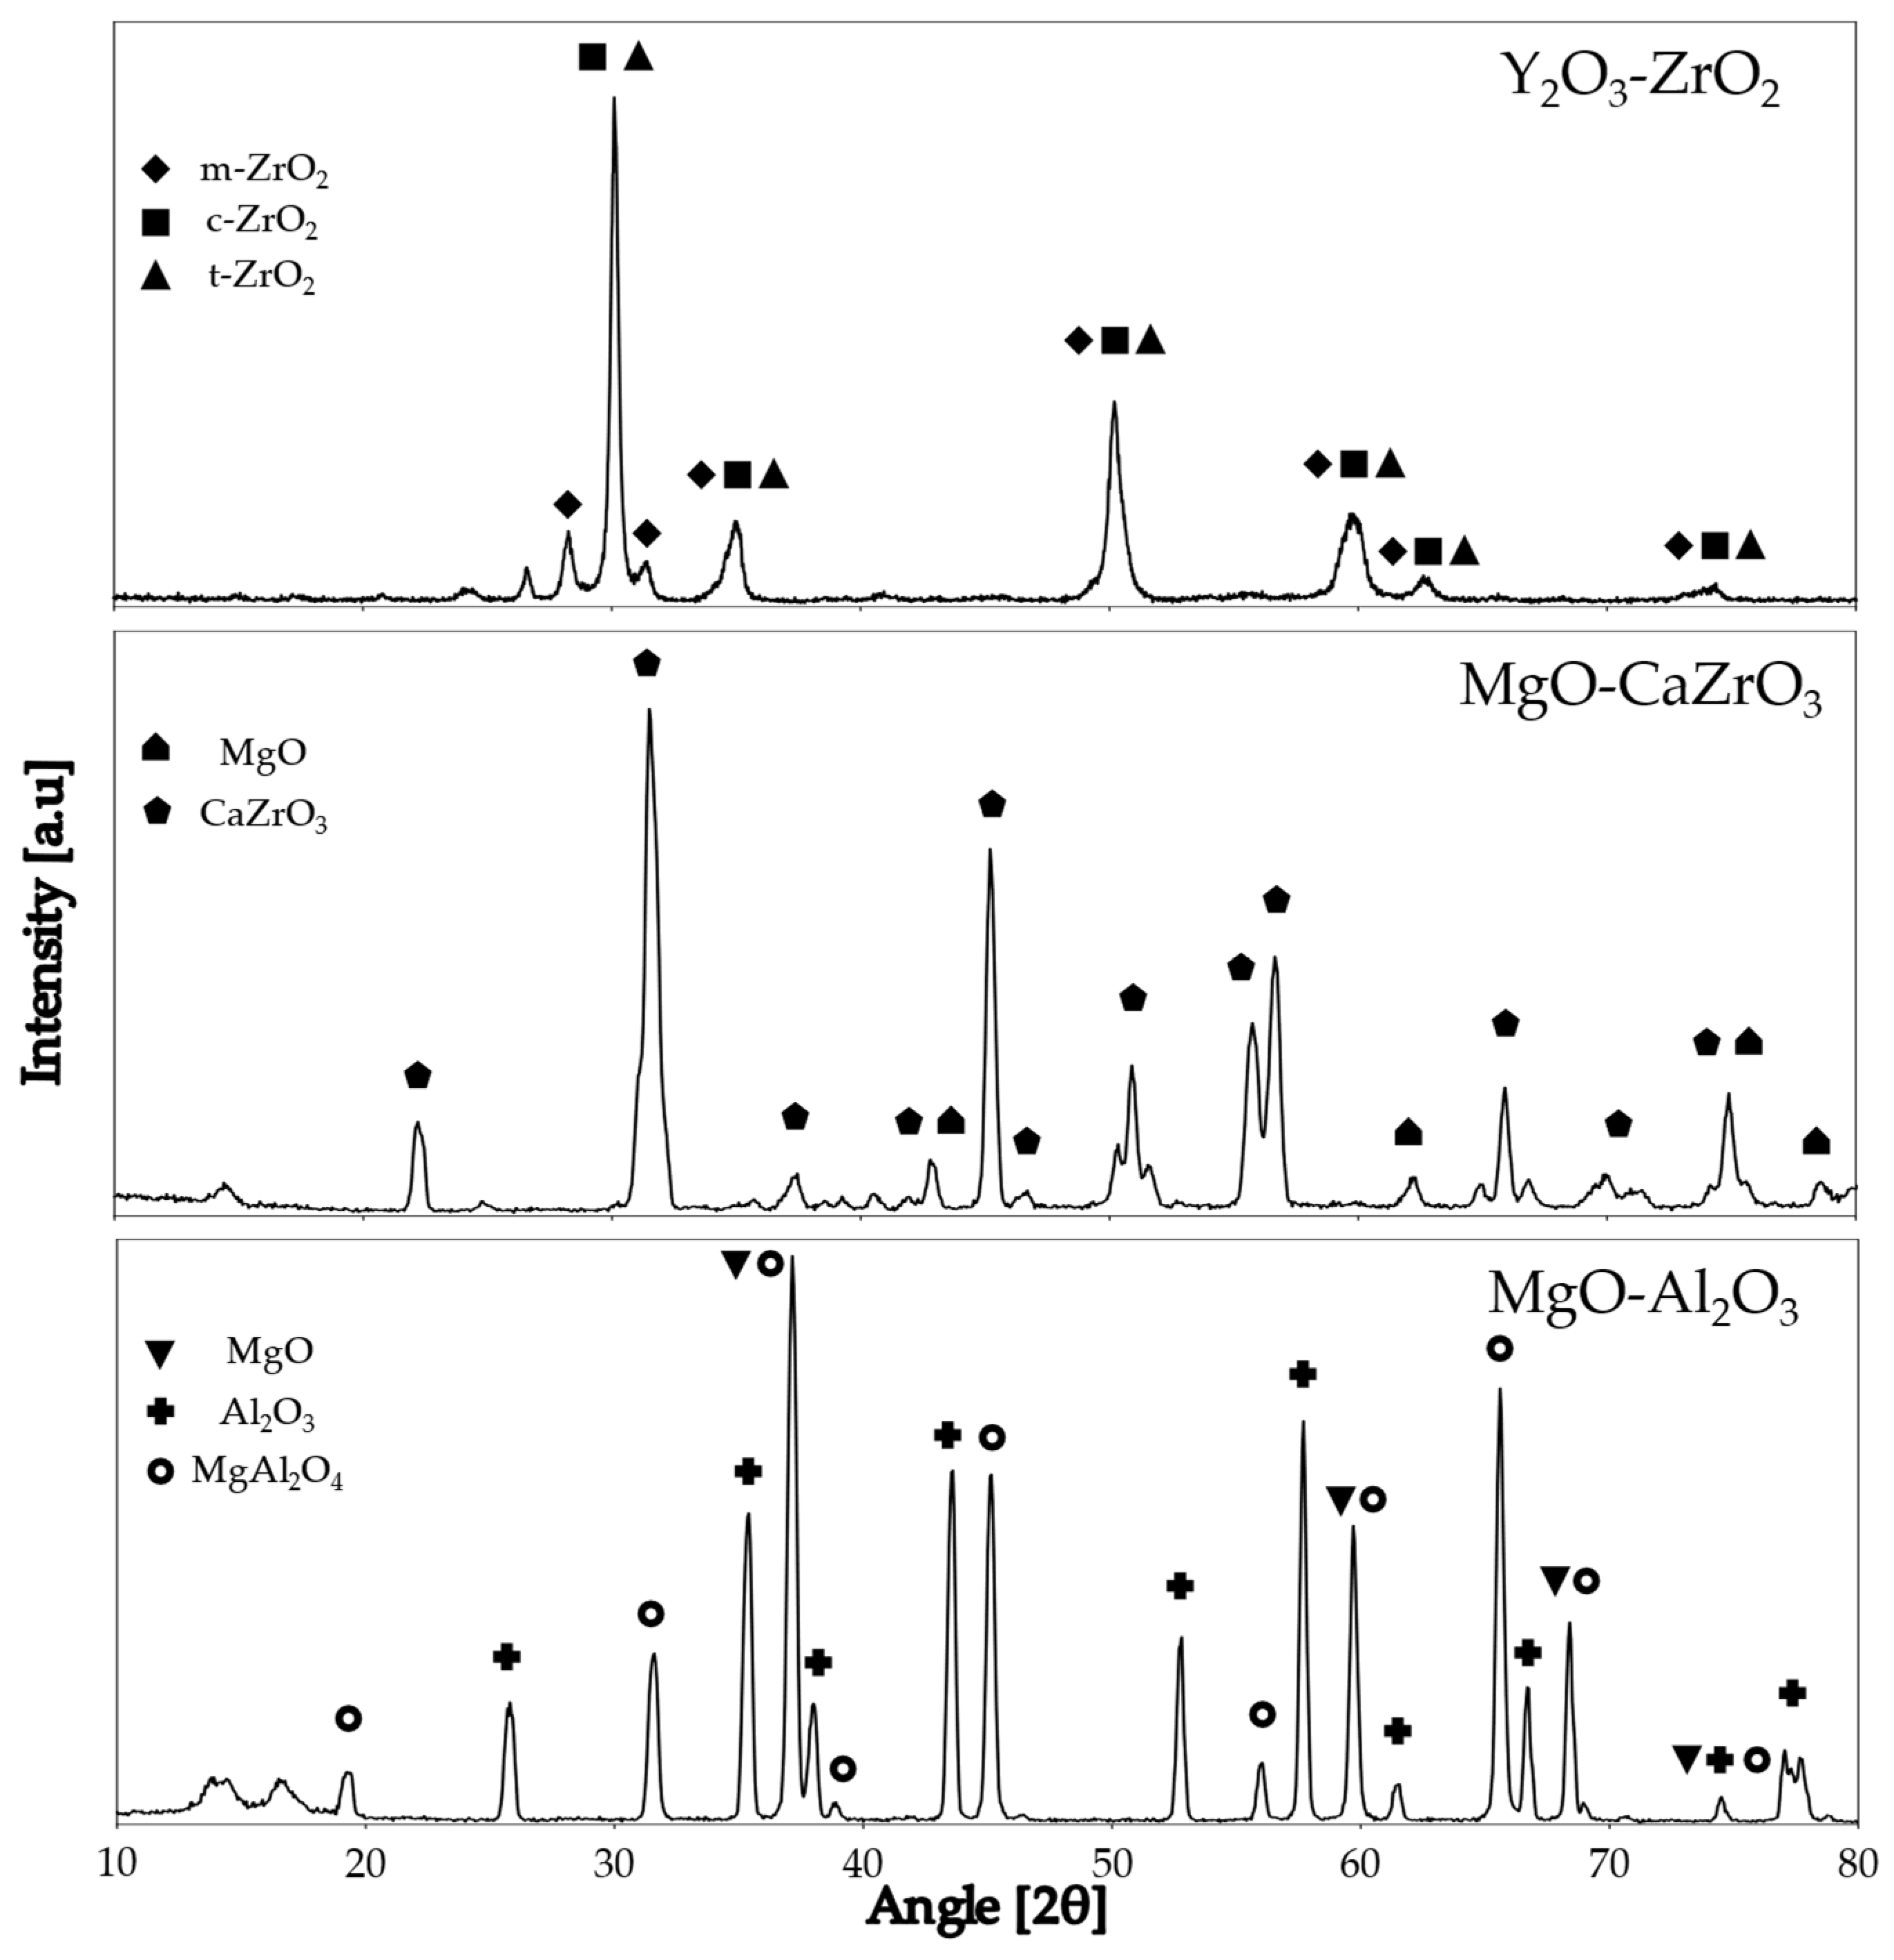
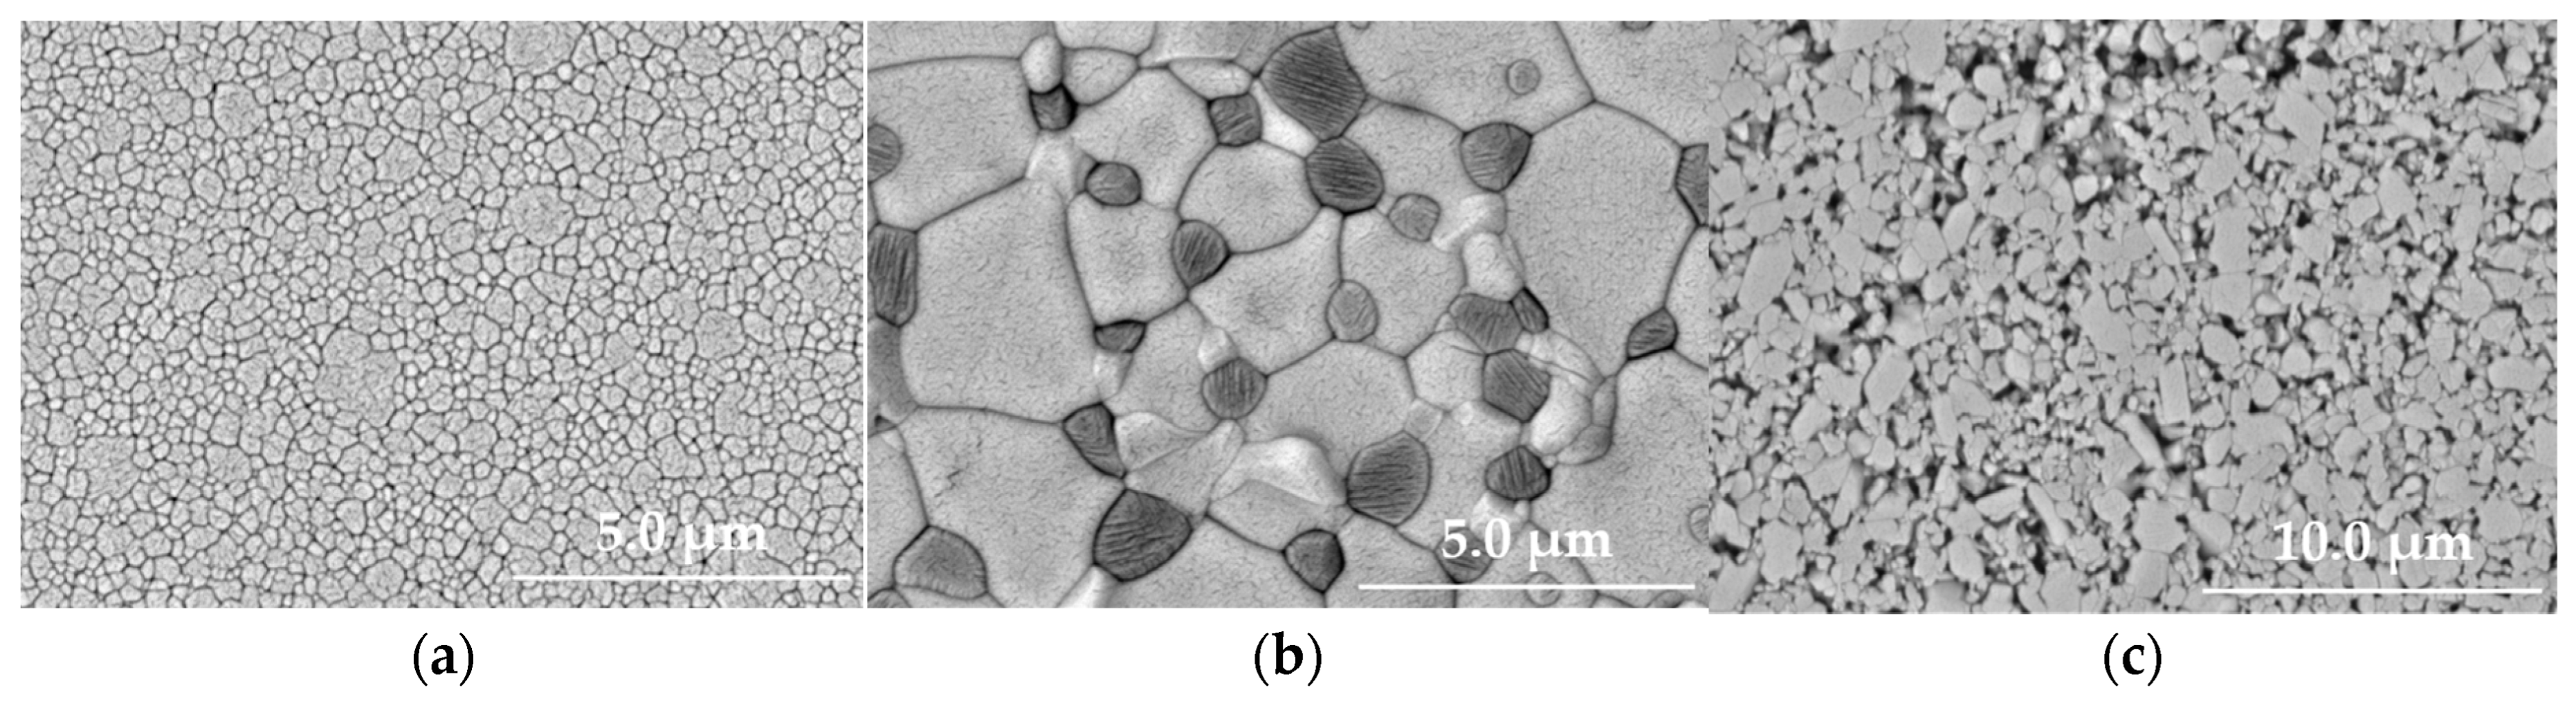
3.1. Dielectric Ceramic Sample Analysis

After the sintering phase, the apparent porosity and relative density of the Y2O3-ZrO2, MgO-CaZrO3, and MgO-Al2O3 ceramic samples were determined to ascertain the manufacturing process quality. Table 1 summarizes the values obtained for both parameters. The results in Table 1 are the average values of five measurements.
From Table 1, on the one hand, Y2O3-ZrO2, MgO-CaZrO3, and MgO-Al2O3 had porosities of 0.06, 0.04, and 6.7, respectively. On the other hand, the samples showed relative densities of 98.0, 98.8, and 71.3 for Y2O3-ZrO2, MgO-CaZrO3, and MgO-Al2O3 ceramic plates, respectively. Considering the above, it was concluded that although the MgO-Al2O3 ceramic mixture was milled for 6 h instead of the 3 h of the Y2O3-ZrO2 and MgO-CaZrO3 compositions, it still presented some unwanted porosity content. Consequently, it shows that the sintering process was successful for zirconia-based compositions but needs future adjustments in the sintering temperature for the alumina-based ceramic. Since the use of ceramics as dielectric plates for DBD plasma actuators has not been extensively reported, despite the MgO-Al2O3 6.7% porosity content, the ceramic plate was considered for further thermographic study.
The XRD results of Y2O3-ZrO2, MgO-CaZrO3, and MgO-Al2O3 are shown in Figure 2.
Figure 2 shows the diffractograms of Y2O3-ZrO2 (top figure), MgO-CaZrO3 (middle figure), and MgO-Al2O3 (bottom figure) ceramic composites. For Y2O3-ZrO2, three of the raw powder phases were found in the sample, that is, m-ZrO2, c-ZrO2, and t-ZrO2. However, due to higher intensity peaks, the c-ZrO2 and t-ZrO2 are the dominant phases. The MgO-CaZrO3 ceramic had the most pronounced presence of calcium zirconate rather than magnesium oxide. Lastly, in addition to the MgO and Al2O3 phases, spinel (MgAl2O4) was also detected in the MgO and Al2O3 diffractograms. Considering the results of the XRD analysis, it was concluded that no contamination of the samples occurred during the manufacturing process of the dielectric plates.
For the three compositions, the scanning electron microscopy is illustrated in Figure 3; i.e., Figure 3a exhibits the Y2O3-ZrO2, while Figure 3b is representative of MgO-CaZrO3, and lastly Figure 3c is of the MgO-Al2O3 ceramic sample. A major difference in densification is observed between Figure 3a and 3b compared to Figure 3c. Micrographs (a) and (b) show that for Y2O3-ZrO2 and MgO-CaZrO3, respectively, the ceramic mixing process and green body sintering fostered good powder compaction. The grain boundary is well defined with homogeneous grain sizes and shapes.
Contrastingly, the alumina micrograph (c) shows grains of different sizes and shapes. This phenomenon is representative of an incompletely sintered ceramic material. The micrographs show the data collected and determined regarding apparent porosities and relative densities.

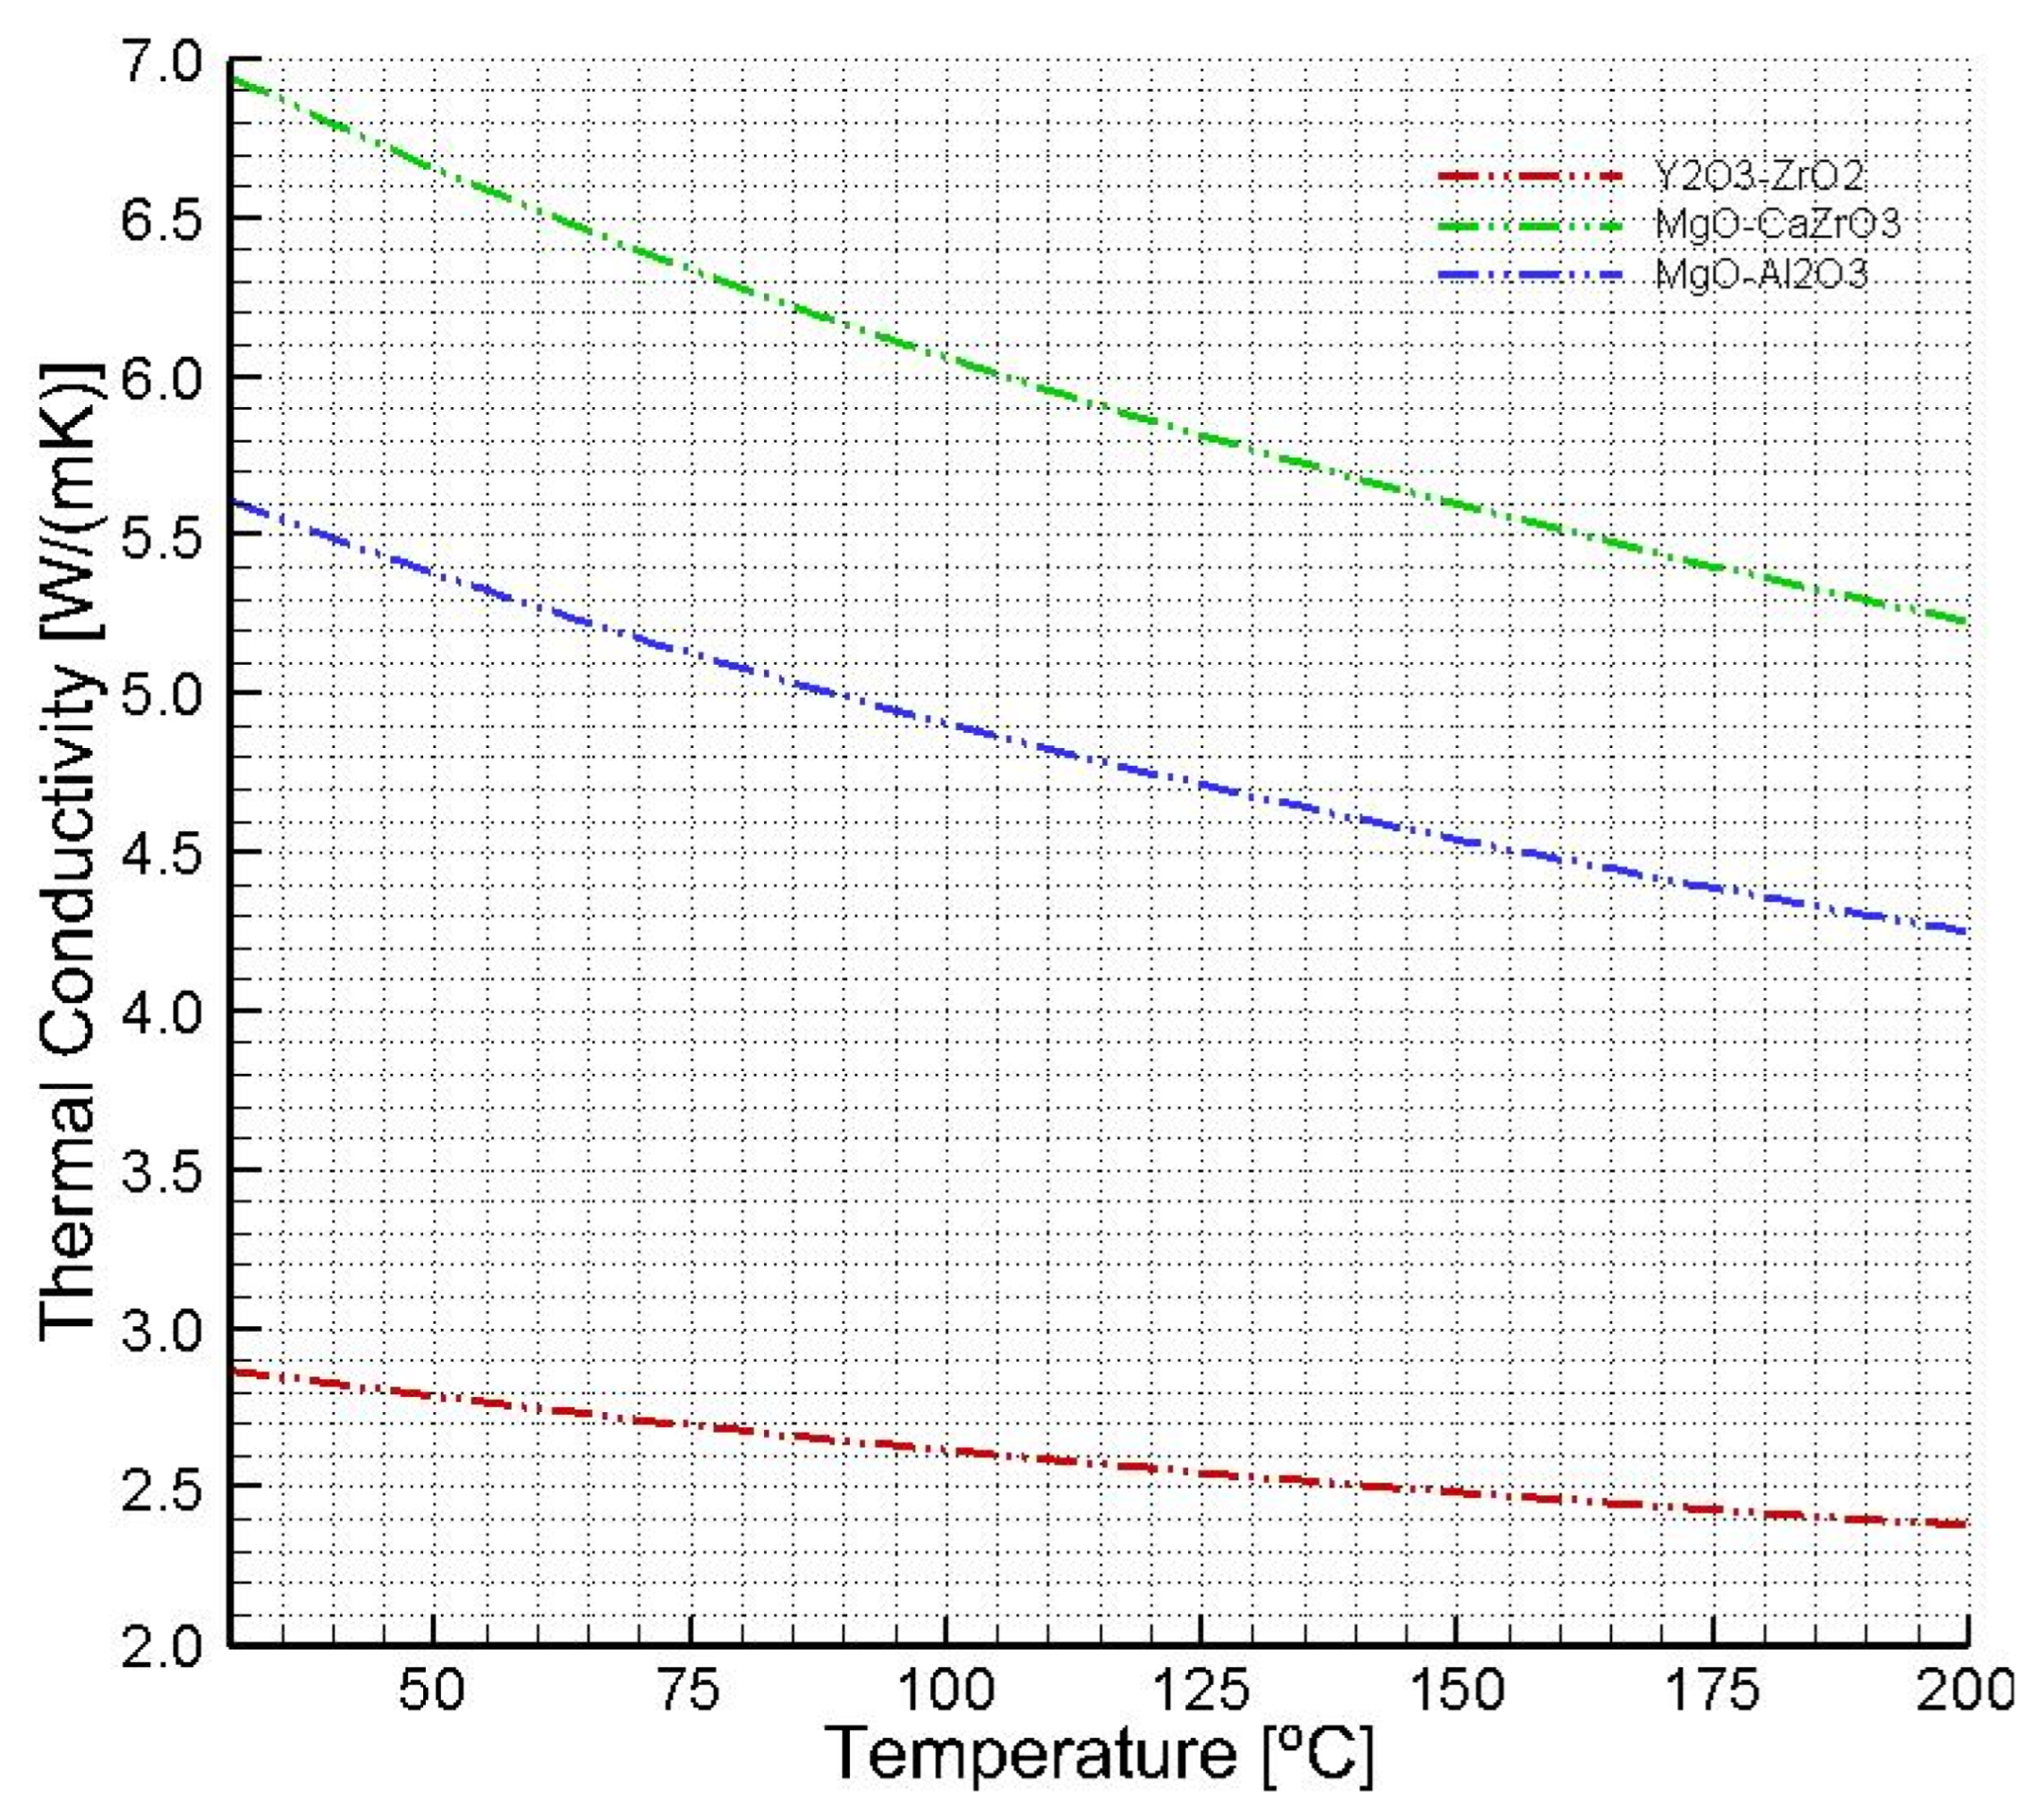
3.2. Thermal Conductivity of the Ceramic Samples

Thermal conductivity was computed after the experimental determination of thermal diffusivity and specific heat properties based on the flash method standard ASTM E1461-13 [31]. In thermal characterization, ceramic thermal conductivity is closely related to the design and development of new materials, manufacturing process control, and material quality assurance via analysis of the operating safe temperature ranges. Figure 4 shows the ceramic manufacturing plates’ thermal conductivity evolution with the temperature rising from 30 °C to 200 °C.
Analyzing the plot of Figure 4 leads to two main conclusions. Firstly, regardless of the ceramic sample, the thermal conductivity tends to diminish with temperature increase. Next, the Y2O3-ZrO2 ceramic plate has the lowest temperature conductivity behavior, followed by MgO-Al2O3, which, in turn, is lower than MgO-Al2O3.
Yttria-stabilized zirconia exhibited good results based on the commercially available datasheets, i.e., values ranging between 2 and 3 W/(mK) [32,33]. Moreover, Zhao et al. (2006) [34] reported an interval of 2.2–2.9 W/(mK) for Y2O3-ZrO2 ceramic composite, whilst Schlichting et al. (2001) [35] supported that the ceramic’s thermal conductivity is lower with the increase in temperature. For magnesium-doped calcium zirconate, thermal conductivities are reported in the literature to be between 3 and 7 W/(mK) for temperatures ranging from 20 °C to 500 °C [36,37]. Additionally, the authors confirmed with experimental and simulation work that thermal conductivity diminishes with temperature for MgO-CaZrO3. Lastly, considering the values for magnesium-doped alumina, these were lower than expected. At room temperature, the alumina’s conductivity varies from 30 to 40 W/(mK) [38]. Consequently, a gap exists between the values measured and the ones reported in the literature. This reasoning consists of the 6.7% porosity content, shown in Table 1. Sun et al. (2014) [39] concluded that by increasing the porosity content of a ceramic material, the solid phase heat conduction decreases despite the temperature range considered.

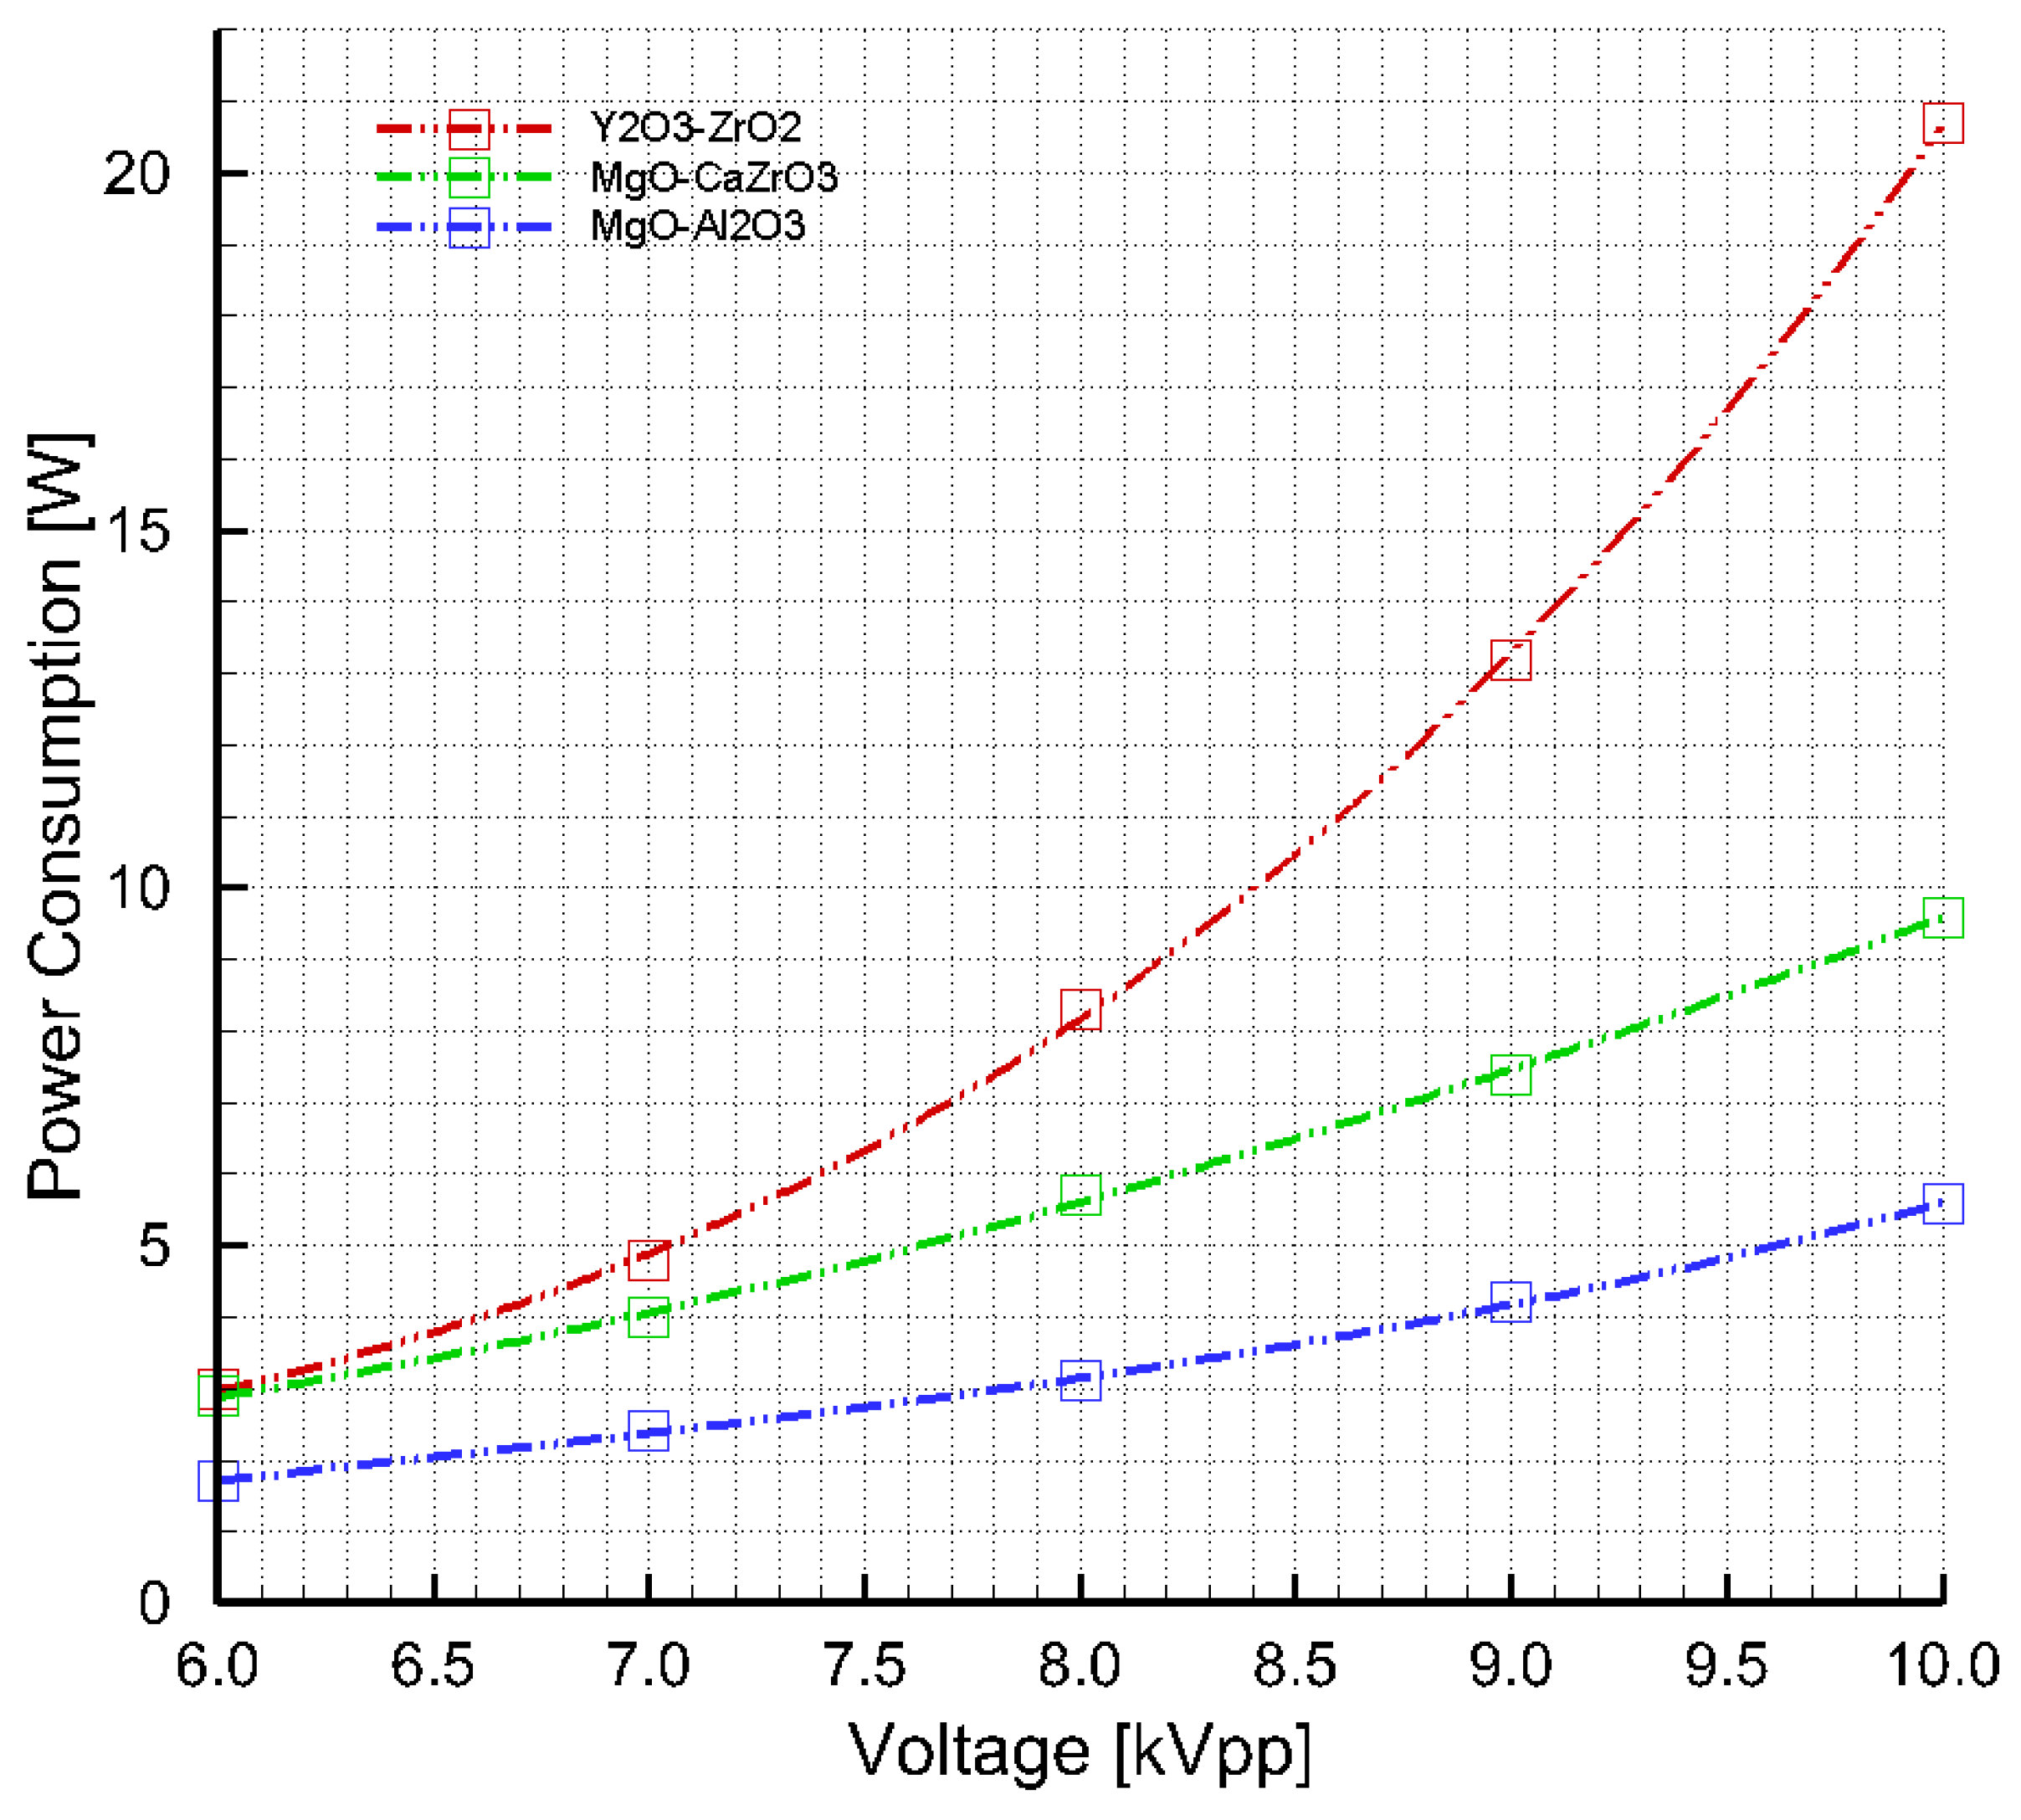
3.3. AC SDBD Consumed Power

The average power consumed by the Y2O3-ZrO2, MgO-CaZrO3, and MgO-Al2O3 AC SDBD plasma actuators was computed through the electric current method. Table 2 summarizes the results obtained as a function of the applied voltage levels at 24 kHz. The average electric power consumption has an associated error lower than 2%, considering the 1% tolerance of the resistor and the 1% high resolution of the digital oscilloscope. The input voltage varied between 6 kVpp and 10 kVpp since these were the minimum and maximum voltage levels at which the plasma discharge generation started (at 6 kVpp) and before it showed unstable behavior (10 kVpp), respectively.
From Table 2, despite the AC SDBD dielectric material being considered, it is possible to infer that by augmenting the input voltage, the average power consumption tends to increase. The Y2O3-ZrO2 consumed the highest average power, followed by MgO-CaZrO3, and then by MgO-Al2O3. At the maximum input voltage level of 10 kVpp, the MgO-Al2O3 (5.6 ± 0.112 W) and MgO-CaZrO3 (9.6 ± 0.192 W) consumed, approximately, a third and a half of the average power consumed by the Y2O3-ZrO2 (20.7 ± 0.414 W). These results evidence, from a practical point of view, that the MgO-Al2O3 is the most cost-effective actuator due to its low electric consumption. Additionally, since Y2O3-ZrO2 presents larger power consumption, it is prone to dissipating more heat energy. Figure 5 exhibits the evolution of the power consumption behavior of the three dielectric-based DBD plasma actuators.

3.4. AC SDBD Thermographic Analysis

Infrared thermographic images were taken for the thermal behavior analysis of the Y2O3-ZrO2, MgO-CaZrO3, and MgO-Al2O3 AC SDBD plasma actuators. Heat generation during the plasma actuators’ operation must be thoughtfully comprehended to assess the ceramic-based SDBDs’ suitability as de-icing/anti-icing/ice-sensing tools. Therefore, Figure 6 presents the thermographic images in quiescent air after a 5 min temperature stabilization process at 10 kVpp input voltage. It should be noted that evaluating plasma temperature through infrared imaging is not possible due to the emissivity of the plasma resulting from its filamentary and nonuniform nature. Thus, the temperature of the dielectric surface and the exposed electrode must be considered. The grey rectangle placed in the middle of the images represents the exposed electrode position. Moreover, the asymmetries (on the sides of the electrode’s rectangle) in the temperature field distributions are justified by the circuit cables connected to the AC SDBD plasma actuators. Overall, different ceiling temperatures were recorded for the three ceramic AC SDBD plasma actuators: approximately, 155 °C, 62 °C, and 47 °C for Y2O3-ZrO2, MgO-CaZrO3, and MgO-Al2O3, respectively. Additionally, the temperature fields of the different ceramic dielectrics showed dissimilarities in the function of the dielectric material. These results are justified by the different thermal properties of the studied ceramic composites [37,40]. Additionally, it is strongly highlighted that the order of the maximum temperature achieved depicted in Figure 6 coincides with the power consumption analyzed in Table 2. The Y2O3-ZrO2 had the highest average power consumption and ceiling temperature (20.7 W and 155 °C), followed by MgO-CaZrO3 (9.6 W and 62 °C), and MgO-Al2O3 (5.6 W and 47 °C).
The results achieved evince the premise that the heat dissipation—due to plasma discharge phenomena—is responsible for the dielectric surface/its surrounding heating, promoting the anti- and de-icing features of SDBD plasma actuators. On top of that, the temperature achieved by Y2O3-ZrO2 is much higher than the ones achieved by typical polymers, e.g., Kapton®, used as dielectric barriers [29]. After being switched on for 180 s, Rodrigues et al. (2017) [29] reported that the Kapton actuators heated up to maximum temperatures of 48 °C, 40 °C, 30 °C, and 25 °C for 0.3 mm, 0.6 mm, 0.84 mm, and 1.02 mm dielectric layer thickness, respectively.

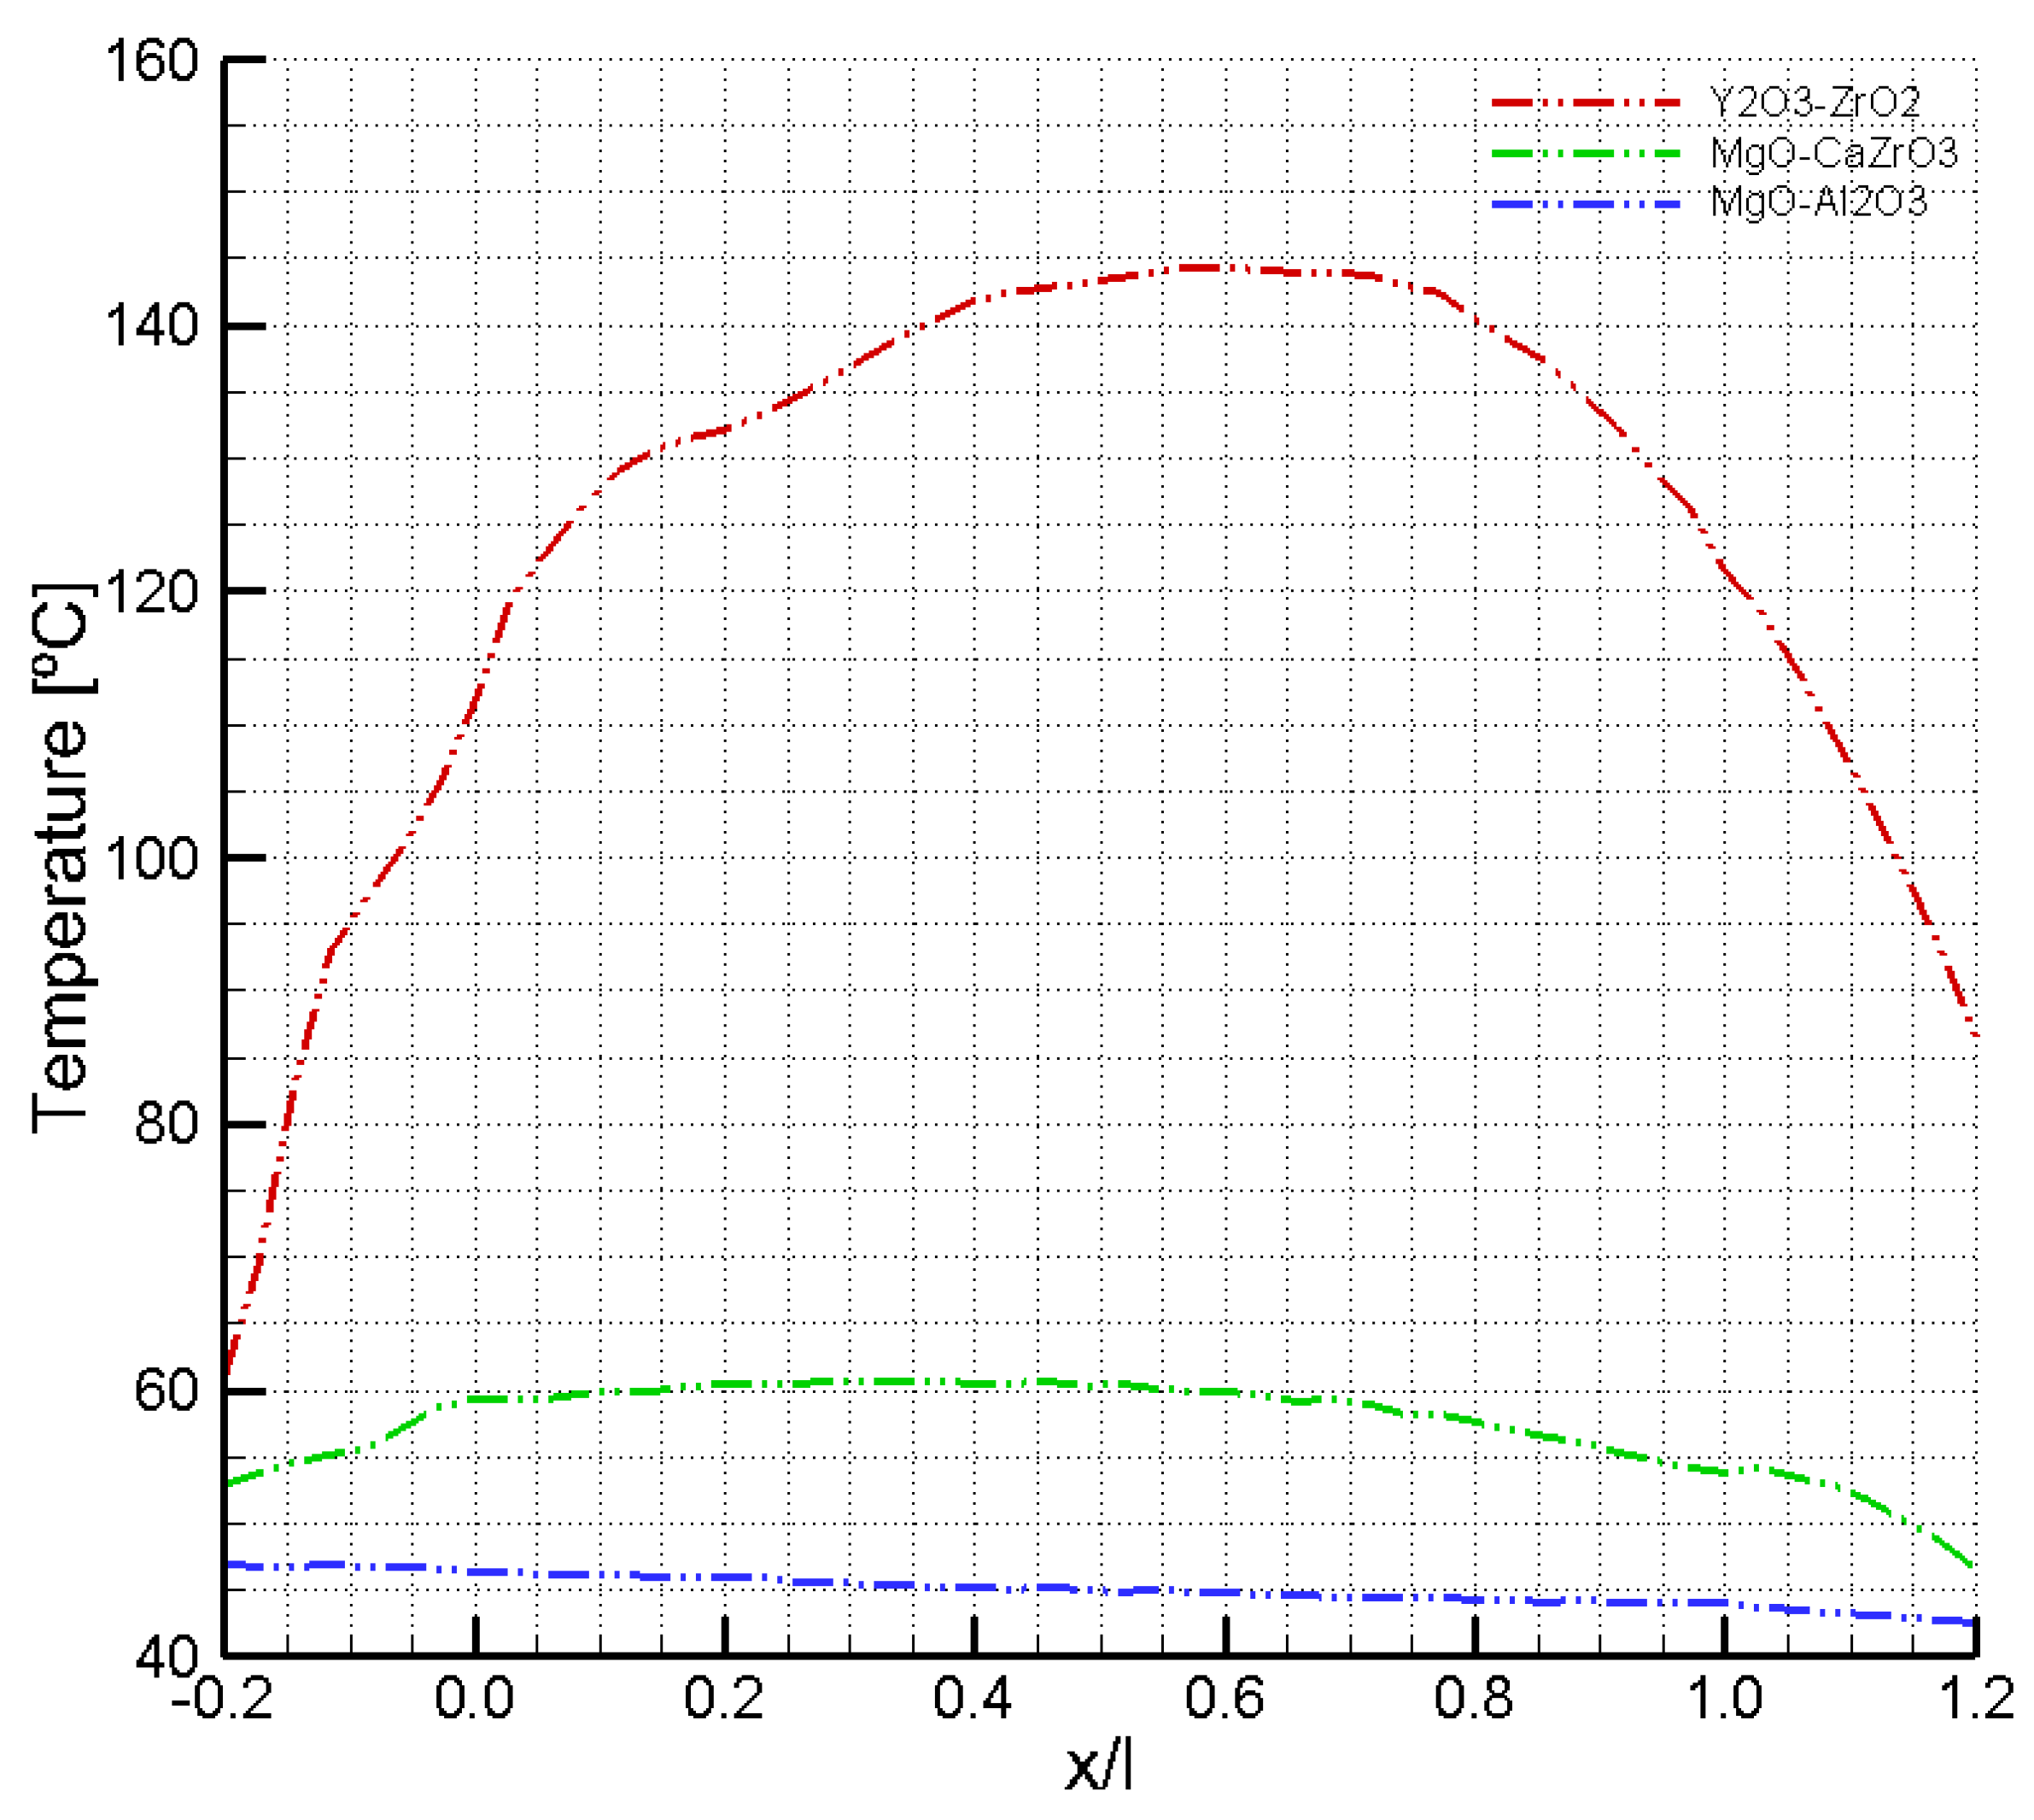
3.5. AC SDBD Spatial Temperature Variation for 10 kVpp

Additionally, for the Y2O3-ZrO2, MgO-CaZrO3, and MgO-Al2O3 AC SDBD plasma actuators an analysis of the spatial temperature variation for 10 kVpp and 24 kHz along the x– and y–axis follows below.
Figure 7 represents the temperature spatial variation along the x-axis for the three ceramic-based AC SDBD plasma actuators between x/l = −0.2 and x/l = 1.2 at y/w = 0.0. In this section, l is the length of the exposed electrodes, whereas 0 < x/l < 1 is their frontal region. The extended interval of [−0.2, 1.2] was adopted to investigate the x-axis spatial temperature variation comprehensively. The spatial temperature variations along the x-axis were analyzed on the adjacent points of the exposed electrode edge, the region where the maximum temperature levels are located.
For the MgO-Al2O3 ceramic SDBD, and owing to Figure 7, it is possible to infer that the temperature distribution across the x-axis presents distinctly stable magnitudes. Additionally, MgO-Al2O3 depicted a temperature profile with slightly pronounced variation modification in temperature levels from distances of x/l in the ranges of [−0.2, 0.0] and [1.0, 1.2]. Although reaching higher temperatures, the same analysis—as MgO-Al2O3—can be made for the MgO-CaZrO3 ceramic AC SDBD, i.e., stable temperature magnitudes with some variations around the [−0.2, 0.0] and [1.0, 1.2] interval.
When compared to both MgO-Al2O3 and MgO-CaZrO3, a significant change, however, can be observed for the Y2O3-ZrO2 ceramic. The AC SDBD plasma actuator made of Y2O3-ZrO2 had profound dissimilarity between the temperature of the electrode’s frontal central region (0.2 < x/l < 0.8) and its edges (−0.2 < x/l < 1.0 and 1.0 < x/l < 1.2). Moreover, in terms of maximum achieved temperatures, MgO-Al2O3 does not achieve temperatures above 50 °C, MgO-CaZrO3 ceramic slightly surpasses 60 °C, whereas Y2O3-ZrO2 reaches over 140 °C.
Figure 7 depicts the spatial variation of the temperature across the y-axis (perpendicularly to the exposed electrode length, i.e., x/l = 0.5 outwards) for the Y2O3-ZrO2, MgO-CaZrO3, and MgO-Al2O3 AC SDBD plasma actuators between y/w = 0.0 and y/w = 2.5. In this section, w is the width of the exposed electrodes.
Based on Figure 8 and along the y-axis, the temperature recorded was higher near the exposed electrode edge, i.e., y/w = 0.0, at the onset of plasma discharge formation. The main dissimilarities between MgO-Al2O3 and MgO-CaZrO3 plasma actuators and the Y2O3-ZrO2 is that the latest had a much more pronounced temperature initial increase—within the 0.0 < y/w < 0.2—and stepped decrease for the rest of the y-axis—0.2 < y/w < 2.5. This behavior represents that the temperature of the plasma is higher than the temperature of the exposed electrode.
Lastly, non-uniformities (i.e., steep spikes that indicate that the plasma is close to the limit of the dielectric material) caused by hot spots, were not identified in either of these spatial temperature profiles. These non-uniformities are commonly present in other dielectric materials, such as Kapton®, PLA polymers, and PIB rubbers [24]. It is emphasized that the absence of non-uniformities shows the good stability of the plasma discharge created on the surface of the MgO-Al2O3, MgO-CaZrO3, and Y2O3-ZrO2 dielectrics.

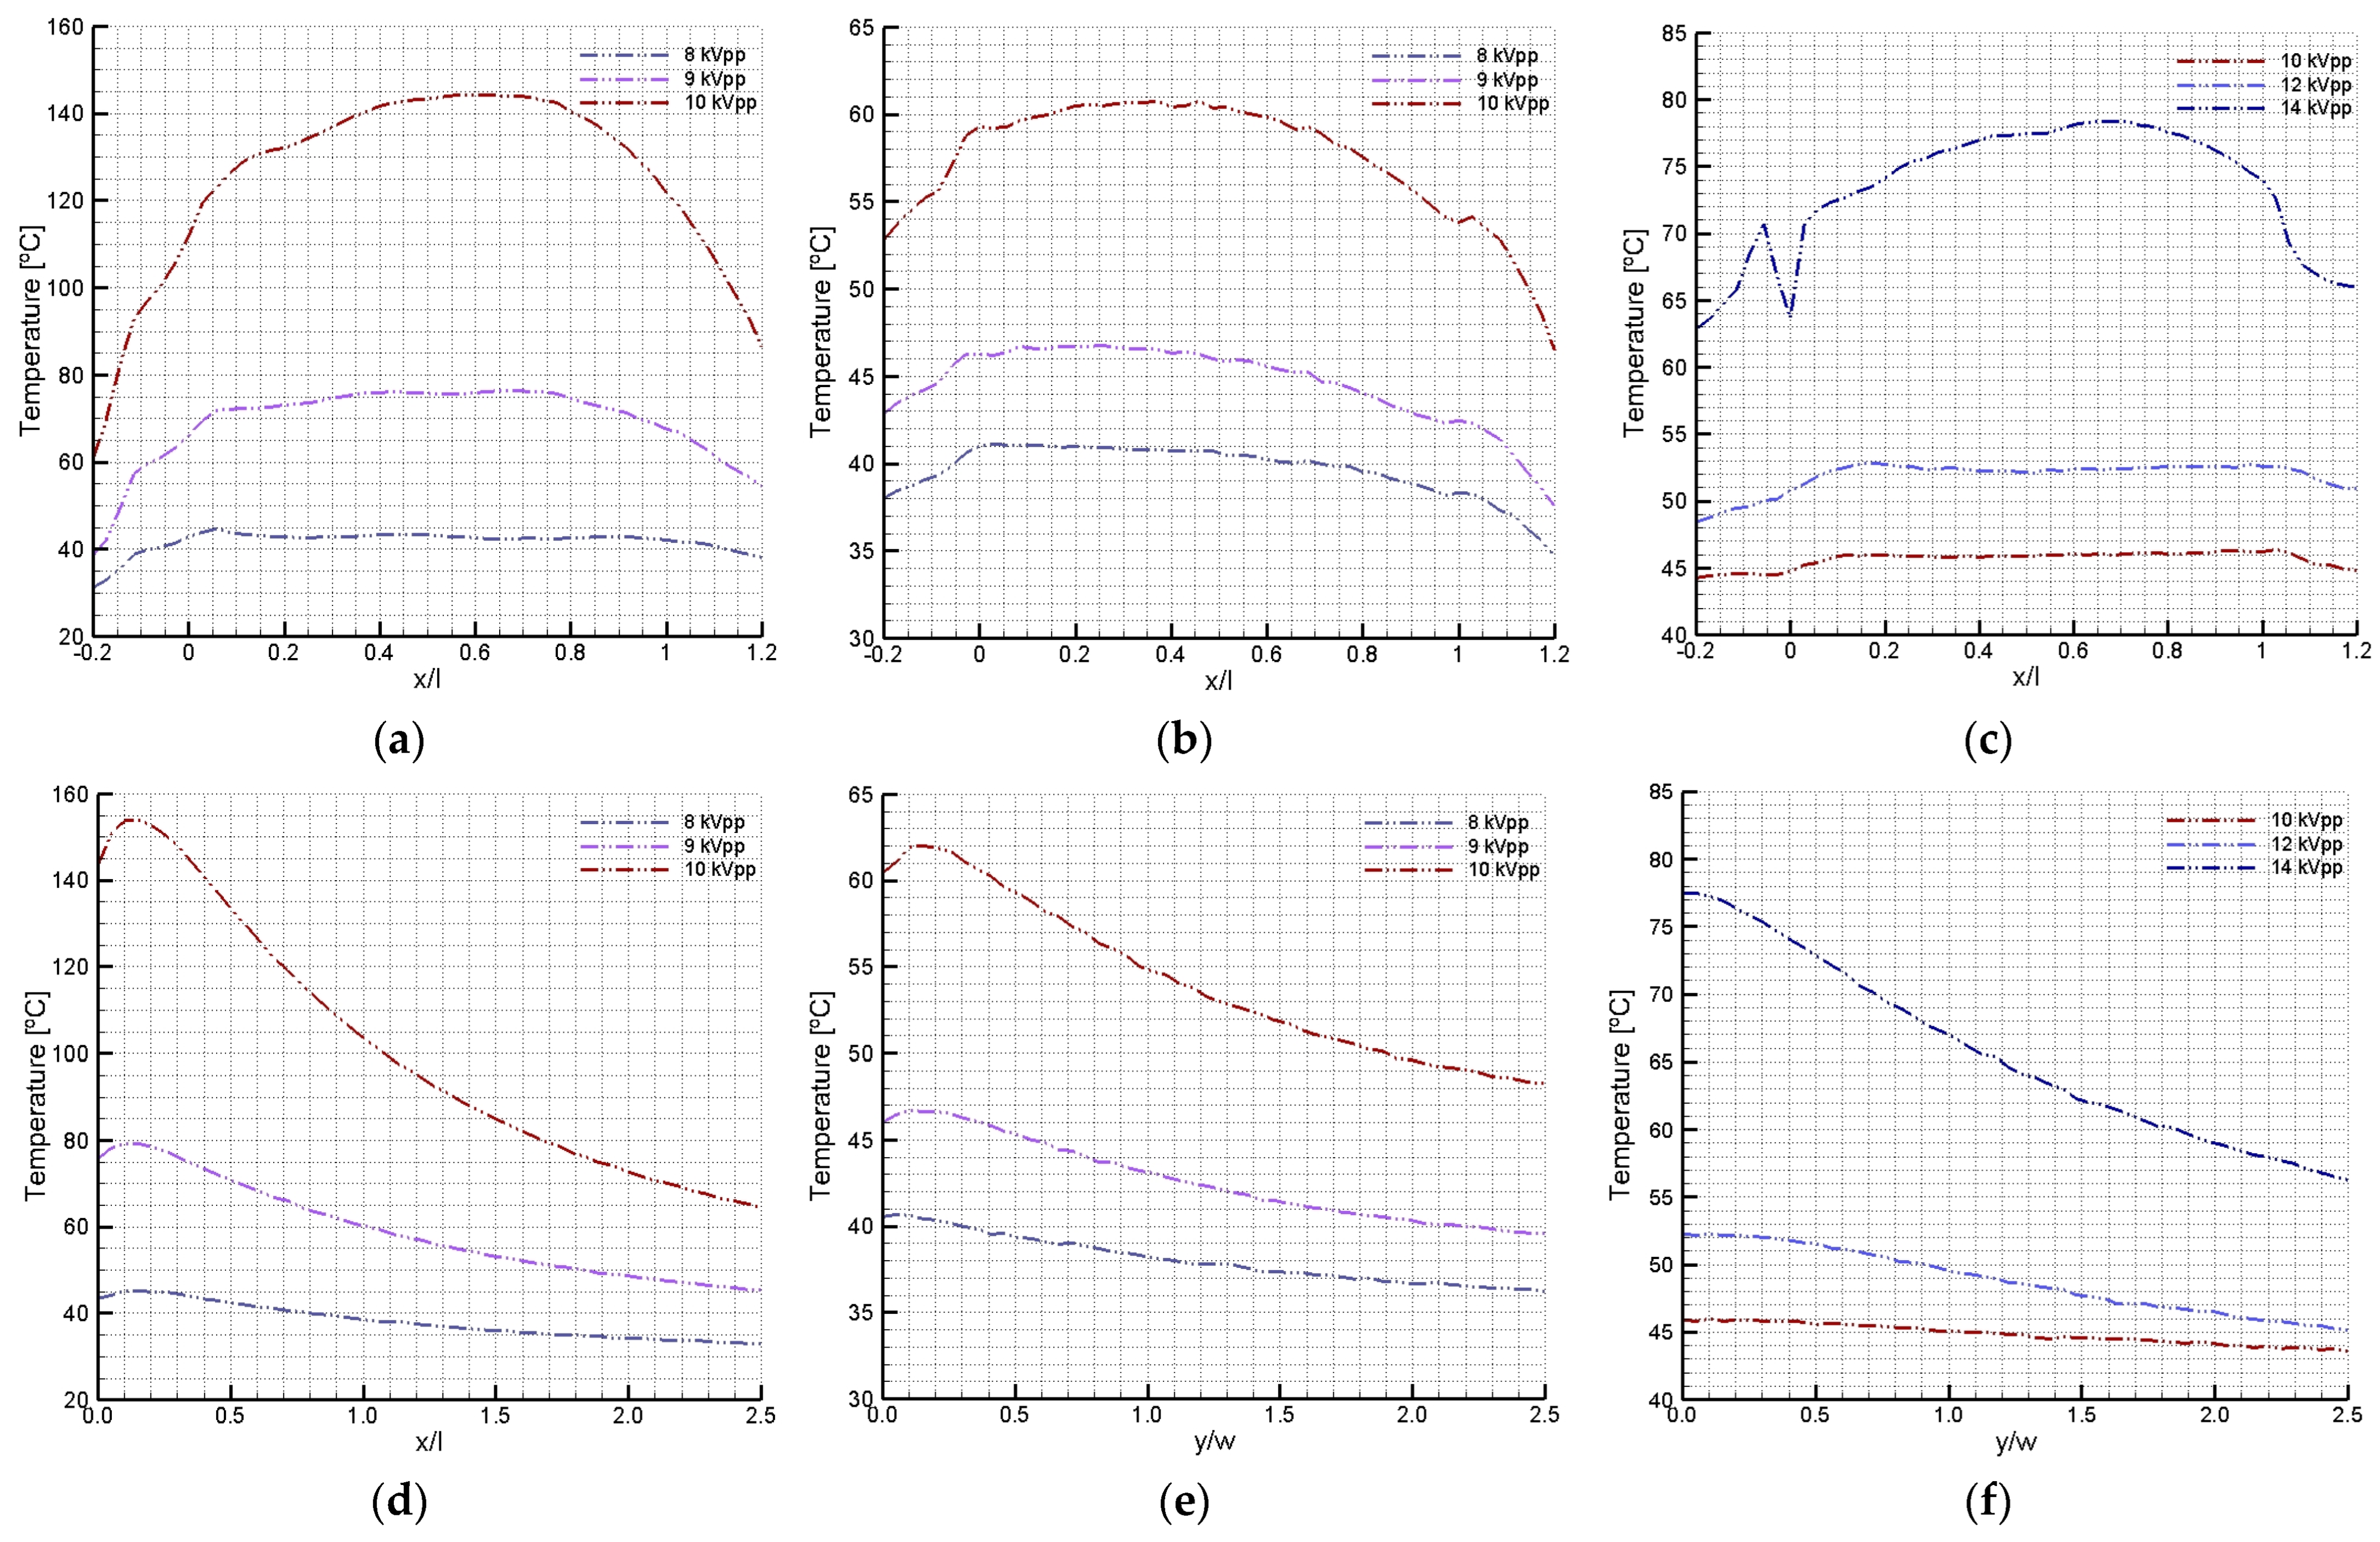
3.6. AC SDBD Spatial Temperature Variation for Different Input Voltage Levels

Similarly to the information presented in Section 3.4, Figure 9 shows the spatial variation of the temperature along the x- and the y-axis for Y2O3-ZrO2 (graphs a and d, respectively), MgO-CaZrO3 (graphs b and e, respectively), and MgO-Al2O3 (graphs c and f, respectively) for different input voltage levels. For the zirconia-based ceramics, 8 kVpp, 9 kVpp, and 10 kVpp voltages were considered. Contrastingly, the higher levels of 10 kVpp, 12 kVpp, and 14 kVpp for the alumina-based ceramic were studied to demonstrate that alumina-based ceramic can also achieve considerably high temperatures. It is noted that it was not possible to apply the same vast voltage range to every ceramic composite sample due to their diverse limiting capacity in a plasma discharge.
In detail, some ceramics showed unstable filamentary behavior much sooner than others. Therefore, the alumina-based ceramic was tested up to 14 kVpp (graphs c and f), whilst the zirconia-based ones were tested up to 10 kVpp (graphs a, b, d, and e).
Figure 9a–c represent the spatial variation of the temperature along the x-axis for the sintered ceramics, i.e., Y2O3-ZrO2, MgO-CaZrO3, and MgO-Al2O3 between x/l = −0.2 and x/l = 1.2. The temperature variations along the x-axis were analyzed on the adjacent points of the exposed electrode edge, where the maximum temperature levels are located. Overall, the higher the input voltage, the higher the temperature next to the edge of the exposed electrode. Particularly, both zirconia-based ceramics, in Figure 9a,b, somehow exhibited a smooth temperature distribution profile between 0.0 < x/l and < 1.0. Conversely, MgO-Al2O3 evidenced scattered values at 14 kVpp for x/l of [−0.1; 0.1].
The phenomenon observed can be explained by the gradual deterioration of the insulating tape used to secure and electrically insulate the connecting wires of the circuitry mounted. Despite that, the rest of the profiles showed a homogeneous temperature distribution between 0.0 < x/l and < 1.0.
Figure 9d–f depict the spatial variation of the temperature along the y-axis for the manufactured plasma actuators between y/w = 0.0 and y/w = 2.5. The spatial variation of the temperature is taken across the y–axis, i.e., perpendicularly to the exposed electrode length (outwards). For all samples and from the experimental tests performed it is concluded that along the y-axis, the temperature recorded was higher near the exposed electrode edge, i.e., y/w = 0.0, in the onset of plasma discharge formation. Moreover, for MgO-Al2O3, little increase in temperature is noted for y/w marginally over the start of the axis reference, i.e., for 0.0 < y/w < 0.2 interval. Contrastingly, for Y2O3-ZrO2 and MgO-CaZrO3 a pronounced increase in temperature corresponds with a slightly increased interval distance outwards of the exposed electrode. The same tendency in temperature rise is noted for the x-axis variation; that is, the higher the input voltage, the higher the surface temperature.
In Figure 9a,d of the Y2O3-ZrO2 composites, for 10 kVpp (approximately, 160 °C) the temperature ceiling almost doubles when compared to the temperature ceiling for 9 kVpp (approximately, 80 °C). In graphs (b) and (e) of MgO-CaZrO3, for 10 kVpp the temperature (approximately 60 °C) is 30% higher than that registered for 9 kVpp (approximately, 45 °C). Lastly, in graphs, (c) and (f) of MgO-Al2O3, for 14 kVpp the temperature (approximately 78 °C) is 40% higher than that registered for 10 kVpp (approximately, 46 °C).
Lastly, in Figure 9 the plots do not show the incident fluctuations along the temperature variation curves that are typically resultant of the instability of the plasma discharge across the dielectric plate. These anomalies (nonuniformities) caused by hot spots, which are typically visible in the filamentary plasma discharge at higher voltages, appear as sharp spikes, signaling that the plasma is approaching the threshold of the dielectric material. To emphasize, these specific features were not observed in these temperature profiles but are typically seen in studies of other dielectric materials, such as Kapton® (polyimide), PLA (polylactic acid), and PIB (poly-isobutylene) rubbers [22,41]. This demonstrates that the developed ceramic composites allow the inducing of large surface temperatures without reaching the limit of the dielectric material and, thus, are good alternatives to polymeric materials for SDBD anti-/de-icing applications.

4. Conclusions

In this study, successfully assembled Y2O3-ZrO2, MgO-CaZrO3, and MgO-Al2O3 ceramic composite dielectrics were thermally analyzed to propose original solutions for improving the robustness of SDBDs.
The thermal characterization evidenced that, regardless of the ceramic composite, the thermal conductivity tends to decrease with increasing temperature. Specifically, the Y2O3-ZrO2 ceramic dielectric plate exhibited the lowest temperature conductivity, followed by MgO-Al2O3, which in turn was lower than MgO-Al2O3.
For 10 kVpp, the DBD plasma actuator analysis showed that Y2O3-ZrO2 had the highest average power consumption and ceiling temperature (20.7 W and 155 °C), followed by MgO-CaZrO3 (9.6 W and 62 °C), and MgO-Al2O3 (5.6 W and 47 °C).
Furthermore, the Y2O3-ZrO2, MgO-CaZrO3, and MgO-Al2O3 AC SDBD plasma actuators were studied for spatial temperature variation along the x- and y-axes during the discharge process. Two separate sets of studies were performed, one at 10 kVpp for the three ceramic-based SDBDs, and another for different input voltages (8, 9, and 10 kVpp for the zirconia-based compositions, and (10, 12, and 14 kVpp) for the alumina-based composition). For the MgO-Al2O3 and MgO-CaZrO3 ceramic SDBDs at 10 kVpp, the temperature distribution across the x-axis presents distinctly stable magnitudes. Contrastingly, Y2O3-ZrO2 showed a profound dissimilarity between the temperature of the frontal central region of the electrodes and its edges. For the y-axis at 10 kVpp, the major difference between the MgO-Al2O3 and MgO-CaZrO3 and the Y2O3-ZrO2 plasma actuators is that the latter had a much more pronounced initial temperature increase and stepped decrease for the rest of the streamwise direction.
Considering the temperatures achieved and the spatial temperature variations, the heating of the ceramic SDBD plasma actuators is believed to be a smart solution to mitigate ice accretion in cold climates.

Author Contributions

Conceptualization, K.O.S. and F.F.R.; methodology, F.F.R. and A.P.S.; validation, K.O.S. and A.P.S.; formal analysis, K.O.S., J.N.-P. and A.P.S.; investigation, K.O.S., J.N.-P., F.F.R., J.C.P. and A.P.S.; resources, J.N.-P., F.F.R., J.C.P. and A.P.S.; data curation, K.O.S., J.N.-P. and A.P.S.; writing—original draft preparation, K.O.S.; writing—review and editing, K.O.S., J.N.-P., F.F.R. and A.P.S.; visualization, K.O.S. and A.P.S.; supervision, J.N.-P., F.F.R. and A.P.S.; project administration, A.P.S.; funding acquisition, J.N.-P., F.F.R., J.C.P. and A.P.S. All authors have read and agreed to the published version of the manuscript.

Funding

This research was funded by the Portuguese Foundation for Science and Technology, I.P. (FCT, I.P.) under the PhD Scholarship Reference 2024.00387.BD; FCT/MCTES through national funds (PIDDAC) under the research unit C-MAST (Center for Mechanical and Aerospace Science and Technology), Research Unit No. 151, reference: Projects UIDB/00151/2020 (https://doi.org/10.54499/UIDB/00151/2020) and UIDP/00151/2020 (https://doi.org/10.54499/UIDP/00151/2020); through the contract of João Nunes-Pereira within the framework of the FCT Stimulus of Scientific Employment, Individual Support: 2022.05613.CEECIND (https://doi.org/10.54499/2022.05613.CEECIND/CP1746/CT0001), and through the exploratory project “IceWindSolution” grant no. 2023.15318.PEX (https://doi.org/10.54499/2023.15318.PEX).

Data Availability Statement

Data are contained within the article.

Conflicts of Interest

The authors declare no conflicts of interest.

References

  1. In Flight Icing. EGAST: European General Aviation Safety Team, Köln, Germany. 2015. Available online: https://www.easa.europa.eu/en/document-library/general-publications/egast-leaflet-ga-10-flight-icing (accessed on 25 July 2024).
  2. About the NTSB. NTSB: National Transportation Safety Board. 2013. Available online: https://www.ntsb.gov/about/Pages/default.aspx (accessed on 25 July 2024).
  3. Appendix G-Embraer Icing Guidance/Procedures. Brasilia, Embraer EMB120. NTSB: National Transportation Safety Board, Florida, USA. 1995. Available online: https://www.ntsb.gov/investigations/AccidentReports/Reports/AAR9804_G.pdf (accessed on 25 July 2024).
  4. Engine Power Loss Due to Carburetor Icing. NTSB: National Transportation Safety Board, Washington, DC, USA. 2015. Available online: https://www.ntsb.gov/Advocacy/safety-alerts/Documents/SA-029.pdf (accessed on 25 July 2024).
  5. Super-IcePhobic Surfaces to Prevent Ice Formation on Aircraft. CORDIS-EU, Warsaw, Poland. 2015. Available online: https://cordis.europa.eu/project/id/690819 (accessed on 25 July 2024). [CrossRef]
  6. Gao, L.; Hu, H. Wind turbine icing characteristics and icing-induced power losses to utility-scale wind turbines. Proc. Natl. Acad. Sci. USA 2021, 118, e2111461118. [Google Scholar] [CrossRef] [PubMed]
  7. Kolbakir, C.; Hu, H.; Liu, Y.; Hu, H. An Experimental Investigation on the Thermodynamic Characteristics of DBD Plasma Actuations for Aircraft Icing Mitigation. In Plasma Science and Technology; IntechOpen: London, UK, 2022; p. 25. [Google Scholar] [CrossRef]
  8. Liu, Y.; Kolbakir, C.; Hu, H. A parametric study to explore ns-DBD plasma actuation for aircraft icing mitigation. In Proceedings of the 2018 Flow Control Conference, Atlanta, GA, USA, 25–29 June 2018. [Google Scholar] [CrossRef]
  9. Kolbakir, C.; Gao, L.; Liu, Y.; Hu, H. A Parametric Study on the Thermodynamic Characteristics of DBD Plasma Actuation and Its Potential for Wind Turbine Icing Mitigation; SAE Technical Paper 2019-01-2031; SAE: Warrendale, PA, USA, 2019. [Google Scholar] [CrossRef]
  10. Lindner, M.; Pipa, A.; Karpen, N.; Hink, R.; Berndt, D.; Foest, R.; Bonaccurso, E.; Weichwald, R.; Friedberger, A.; Caspari, R.; et al. Icing mitigation by MEMS-Fabricated surface dielectric barrier discharge. Appl. Sci. 2021, 11, 11106. [Google Scholar] [CrossRef]
  11. Zhuoling, R.; Xuanshi, M.; Xian, Y.; Senyun, L. Simulation of in-flight Anti-Icing based AC-SDBD plasma actuation. In Proceedings of the AIAA Aviation 2023 Forum, San Diego, CA, USA, 12–16 June 2023; p. 3806. [Google Scholar] [CrossRef]
  12. Borghi, C.; Cristofolini, A.; Carraro, M.; Neretti, G. An analysis of a three phase flat panel uniform barrier discharge at atmospheric pressure. In Proceedings of the 37th AIAA Plasmadynamics and Lasers Conference, San Francisco, CA, USA, 5–8 June 2006. [Google Scholar] [CrossRef]
  13. Moreau, E. Airflow control by non-thermal plasma actuators. J. Phys. D Appl. Phys. 2007, 40, 605. [Google Scholar] [CrossRef]
  14. Jukes, T.N.; Choi, K.S.; Segawa, T.; Yoshida, H. Jet flow induced by a surface plasma actuator. Proc. Inst. Mech. Eng. Part I J. Syst. Control Eng. 2008, 222, 347–356. [Google Scholar] [CrossRef]
  15. Dong, B.; Bauchire, J.; Pouvesle, J.; Magnier, P.; Hong, D. Experimental study of a DBD surface discharge for the active control of subsonic airflow. J. Phys. D Appl. Phys. 2008, 41, 155301. [Google Scholar] [CrossRef]
  16. Stanfield, S.; Menart, J.; DeJoseph, J.C.; Kimmel, R.; Hayes, J. Rotational and vibrational temperature distributions for a dielectric barrier discharge in air. AIAA J. 2009, 47, 1107–1115. [Google Scholar] [CrossRef]
  17. Joussot, R.; Boucinha, V.; Weber-Rozenbaum, R.; Rabat, H.; Leroy-Chesneau, A.; Hong, D. Thermal characterization of a DBD plasma actuator: Dielectric temperature measurements using infrared thermography. In Proceedings of the 40th Fluid Dynamics Conference and Exhibit, Chicago, IL, USA, 28 June–1 July 2010. [Google Scholar] [CrossRef]
  18. Likhanskii, A.; Shneider, M.; Opaits, D.; Macheret, S.; Miles, R. Limitations of the DBD effects on the external flow. In Proceedings of the 48th AIAA Aerospace Sciences Meeting Including the New Horizons Forum and Aerospace Exposition, Orlando, FL, USA, 4–7 January 2010. [Google Scholar] [CrossRef]
  19. Rodrigues, F.; Páscoa, J.; Trancossi, M. Heat generation mechanisms of DBD plasma actuators. Exp. Therm. Fluid Sci. 2018, 90, 55–65. [Google Scholar] [CrossRef]
  20. Abdollahzadeh, M.; Rodrigues, F.; Nunes-Pereira, J.; Páscoa, J.C.; Pires, L. Parametric optimization of surface dielectric barrier discharge actuators for ice sensing application. Sens. Actuators A Phys. 2022, 335, 113391. [Google Scholar] [CrossRef]
  21. Cai, J.; Yongqiang, T.; Xuanshi, M.; Xuzhao, H.; Duo, Z.; Haiyang, H. An experimental study of icing control using DBD plasma actuator. Exp. Fluids 2017, 58, 102. [Google Scholar] [CrossRef]
  22. Rodrigues, F.; Shvydyuk, K.; Nunes-Pereira, J.; Páscoa, J.; Silva, A. Plasma Actuators Based on Alumina Ceramics for Active Flow Control Applications. Ceramics 2024, 7, 192–207. [Google Scholar] [CrossRef]
  23. Deng, X.; Hou, Z. Thermal characteristic and spatial morphology between electrode and phase changing ice during de-icing process of dielectric barrier discharge and critical behavior of the surface charge density. Int. J. Heat Mass Transf. 2022, 190, 122556. [Google Scholar] [CrossRef]
  24. Shvydyuk, K.O.; Rodrigues, F.F.; Nunes-Pereira, J.; Páscoa, J.C.; Lanceros-Mendez, S.; Silva, A.P. Long-lasting ceramic composites for surface dielectric barrier discharge plasma actuators. J. Eur. Ceram. Soc. 2023, 43, 6112–6121. [Google Scholar] [CrossRef]
  25. ASTM C20-00; Standard Test Methods for Apparent Porosity, Water Absorption, Apparent Specific Gravity, and Bulk Density of Burned Refractory Brick and Shapes by Boiling Water. ASTM—American Society for Testing and Materials: West Conshohocken, PA, USA, 2022; p. 3.
  26. Ashpis, D.; Laun, M.; Elmer, G. Progress toward accurate measurements of power consumption of DBD plasma actuators. In Proceedings of the 50th AIAA Aerospace Sciences Meeting Including the New Horizons Forum and Aerospace Exposition, Nashville, TN, USA, 9–12 January 2012. [Google Scholar] [CrossRef]
  27. Vollmer, M. Infrared Thermal Imaging. In Computer Vision; Springer: Berlin/Heidelberg, Germany, 2020; pp. 1–4. [Google Scholar] [CrossRef]
  28. Luykx, D.; Van Ruth, S. An overview of analytical methods for determining the geographical origin of food products. Food Chem. 2008, 107, 897–911. [Google Scholar] [CrossRef]
  29. Rodrigues, F.; Páscoa, J.; Trancossi, M. Experimental thermal characterization of DBD plasma actuators. In Proceedings of the ASME International Mechanical Engineering Congress and Exposition, Tampa, FL, USA, 3–9 November 2017. [Google Scholar] [CrossRef]
  30. Tirumala, R.; Benard, N.; Moreau, E.; Fenot, M.; Lalizel, G.; Dorignac, E. Temperature characterization of dielectric barrier discharge actuators: Influence of electrical and geometric parameters. J. Phys. D Appl. Phys. 2014, 47, 255203. [Google Scholar] [CrossRef]
  31. ASTM E1461–13; Standard Test Method for Determining Thermal Diffusivity by the Flash Method. ASTM International: West Conshohocken, PA, USA, 2007. Available online: https://www.astm.org/e1461-13r22.html (accessed on 15 May 2024).
  32. Ceramic Material Properties Chart. Precision Ceramic. Available online: https://precision-ceramics.com/materials/properties/chart/ (accessed on 19 December 2024).
  33. Thermal Conductivity Easily Transmits Heat. Fine Ceramics World. Available online: https://global.kyocera.com/fcworld/charact/heat/thermalcond.html (accessed on 19 December 2024).
  34. Zhao, H.; Yu, F.; Bennett, T.D.; Wadley, H.N. Morphology and thermal conductivity of yttria-stabilized zirconia coatings. Acta Mater. 2006, 54, 5195–5207. [Google Scholar] [CrossRef]
  35. Schlichting, K.W.; Padture, N.P.; Klemens, P.G. Thermal conductivity of dense and porous yttria-stabilized zirconia. J. Mater. Sci. 2001, 36, 3003–3010. [Google Scholar] [CrossRef]
  36. Zou, Y.; Gu, H.; Huang, A.; Fu, L.; Li, G. Fabrication and properties of in situ intergranular CaZrO3 modified microporous magnesia aggregates. Ceram. Int. 2020, 46 Pt B, 16956–16965. [Google Scholar] [CrossRef]
  37. Shvydyuk, K.; Nunes-Pereira, J.; Rodrigues, F.; Páscoa, J.; Lanceros-Mendez, S.; Silva, A. Holistic Characterization of MgO-Al2O3, MgO-CaZrO3, and Y2O3-ZrO2 Ceramic Composites for Aerospace Propulsion Systems. Ceramics 2024, 7, 364–384. [Google Scholar] [CrossRef]
  38. Heimann, R.B. Oxide Ceramics: Structure, Technology, and Applications. In Classic and Advanced Ceramics: From Fundamentals to Applications; Wiley & Sons: Hoboken, NJ, USA, 2010; pp. 175–252. [Google Scholar] [CrossRef]
  39. Sun, J.; Hu, Z.; Zhou, J.; Wang, X.; Sun, C. Thermal Properties of Highly Porous Fibrous Ceramics. In Proceedings of the 5th International Conference on Porous Media and their Applications in Science, Engineering and Industry, Kona, HI, USA, 22–27 June 2014; Available online: https://dc.engconfintl.org/cgi/viewcontent.cgi?article=1002&context=porous_media_V (accessed on 25 July 2024).
  40. Lu, X.; Zhi, F.; Dong, D.; Tao, S.; Feng, L.; Cheng, Z.; Dawei, L.; Lanlan, N.; Chunqi, J. On the chronological understanding of the homogeneous dielectric barrier discharge. High Volt. 2023, 8, 1132–1150. [Google Scholar] [CrossRef]
  41. Kolbakir, C.; Hu, H.; Liu, Y.; Hu, H. An experimental study on different plasma actuator layouts for aircraft icing mitigation. Aerosp. Sci. Technol. 2020, 107, 106325. [Google Scholar] [CrossRef]
Figure 1. Experimental setup of the thermal study of the ceramic-based SDBD plasma actuators.
Actuators 14 00127 g001
Figure 2. XRD analysis of Y2O3-ZrO2, MgO-CaZrO3, and MgO-Al2O3 ceramic composites.
Actuators 14 00127 g002
Figure 3. SEM micrographs of (a) Y2O3-ZrO2, (b) MgO-CaZrO3, and (c) MgO-Al2O3 ceramic composites at 10,000×, 10,000×, and 5000× magnification.
Actuators 14 00127 g003
Figure 4. Thermal conductivity as a function of the temperature of the Y2O3-ZrO2, MgO-CaZrO3, and MgO-Al2O3 ceramic composites.
Actuators 14 00127 g004
Figure 5. Evolution of power consumption of Y2O3-ZrO2, MgO-CaZrO3, and MgO-Al2O3 ceramic-based DBD plasma actuators.
Actuators 14 00127 g005
Figure 6. Thermographic images of ceramic DBD plasma actuators at 10 kVpp and 24 kHz (a) Y2O3-ZrO2, (b) MgO-CaZrO3, and (c) MgO-Al2O3 (grey rectangles correspond to the location of exposed electrodes on the SDBD plasma actuators).
Actuators 14 00127 g006
Figure 7. Spatial temperature variation along x-axis at 10 kVpp of Y2O3-ZrO2, MgO-CaZrO3, and MgO-Al2O3 AC SDBD ceramic plasma actuators.
Actuators 14 00127 g007
Figure 8. Spatial temperature variation along y-axis at 10 kVpp of Y2O3-ZrO2, MgO-CaZrO3, and MgO-Al2O3 AC SDBD ceramic plasma actuators.
Actuators 14 00127 g008
Figure 9. Spatial temperature variation along the x-axis (ac) and y-axis (df) at different input voltage levels of Y2O3-ZrO2 (a,d), MgO-CaZrO3 (b,e), and MgO-Al2O3 (c,f) AC SDBD ceramic plasma actuators.
Actuators 14 00127 g009
Table 1. Apparent porosities and relative densities of manufactured ceramic composite plates and their respective standard deviations.
Ceramic SampleY2O3-ZrO2MgO-CaZrO3MgO-Al2O3
Apparent porosity [%]0.06 ± 0.040.04 ± 0.026.7 ± 0.3
Relative density [%]98.0 ± 0.198.9 ± 0.371.3 ± 0.3
Table 2. Ceramic-based DBD plasma actuator average power consumption [W].
Input Voltage [kVpp]Y2O3-ZrO2MgO-CaZrO3MgO-Al2O3
63.0 ± 0.060 2.9 ± 0.0581.7 ± 0.034
74.8 ± 0.0964.0 ± 0.0802.4 ± 0.048
88.3 ± 0.1665.7 ± 0.1143.1 ± 0.062
913.2 ± 0.2647.4 ± 0.1484.2 ± 0.084
1020.7 ± 0.4149.6 ± 0.1925.6 ± 0.112
Disclaimer/Publisher’s Note: The statements, opinions and data contained in all publications are solely those of the individual author(s) and contributor(s) and not of MDPI and/or the editor(s). MDPI and/or the editor(s) disclaim responsibility for any injury to people or property resulting from any ideas, methods, instructions or products referred to in the content.

