Article

Development of a Basilar Membrane-Inspired Mechanical Spectrum Analyzer Using Metastructures for Enhanced Frequency Selectivity

by
Shantanu H. Chavan
and
Vijaya V. N. Sriram Malladi
*
Vibrations, Intelligent Testing, Active Learning of Structures Group, Mechanical and Aerospace Engineering, Michigan Technological University, 1400 Townsend Drive, Houghton, MI 49931, USA
*
Author to whom correspondence should be addressed.
Actuators 2025, 14(2), 63; https://doi.org/10.3390/act14020063
Submission received: 9 December 2024 / Revised: 21 January 2025 / Accepted: 24 January 2025 / Published: 29 January 2025
(This article belongs to the Special Issue Actuator Technology for Active Noise and Vibration Control)

Abstract

:
This study introduces a mechanical spectrum analyzer (MSA) inspired by the tonotopic organization of the basilar membrane (BM), designed to achieve two critical features. First, it replicates the traveling-wave behavior of the BM, characterized by energy dissipation without reflections at the boundaries. Second, it enables the physical encoding of the wave energy into distinct spectral components. Moving beyond the conventional focus on metamaterial design, this research investigates wave propagation behavior and energy dissipation within metastructures, with particular attention to how individual unit cells absorb energy. To achieve these objectives, a metastructural design methodology is employed. Experimental characterization of metastructure samples with varying numbers of unit cells is performed, with reflection and absorption coefficients used to quantify energy absorption and assess bandgap quality. Simulations of a basilar membrane-inspired structure incorporating multiple sets of dynamic vibration resonators (DVRs) demonstrate frequency selectivity akin to the natural BM. The design features four types of DVRs, resulting in stepped bandgaps and enabling the MSA to function as a frequency filter. The findings reveal that the proposed MSA effectively achieves frequency-selective wave propagation and broad bandgap performance. The quantitative analysis of energy dissipation, complemented by qualitative demonstrations of wave behavior, highlights the potential of this metastructural approach to enhance frequency selectivity and improve sound processing. These results lay the groundwork for future exploration of 2D metastructures and applications such as energy harvesting and advanced wave filtering.

1. Introduction

The basilar membrane (BM) is a critical structure in the cochlea, enabling hearing by converting mechanical vibrations into neural signals. Positioned beneath the organ of Corti, the BM vibrates in response to sound waves transmitted through the endolymph, allowing auditory receptor cells (hair cells) to generate electrical signals that are sent to the brain [1,2,3,4,5,6]. The BM exhibits frequency-dependent wave propagation, organized tonotopically: high-frequency (HF) waves excite regions near the base, while low-frequency (LF) waves travel further to stimulate the apex [1,2,3]. This spatial frequency coding, or “place code”, is fundamental to pitch perception and auditory processing.
Inspired by the BM’s frequency selectivity, researchers have developed artificial basilar membranes (ABMs) to advance cochlear implant technology. These biomimetic designs achieve mechanical frequency selectivity by tailoring structural parameters such as width, length, and thickness [7,8,9,10]. By mimicking the ability of the BM to selectively filter frequencies, ABMs hold promise for next-generation acoustic filtering systems [11,12,13,14,15,16].
This study introduces a novel mechanical spectrum analyzer inspired by the basilar membrane (BM) in the cochlea. The design focuses on two objectives: (1) replicating the BM’s traveling-wave behavior, including its energy dissipation properties and minimal reflections at the boundaries, and (2) encoding the wave energy into distinct spectral components to achieve precise and frequency-specific responses. By addressing these goals, the analyzer functions as a robust analog for frequency filtering, mirroring the tonotopic organization of the BM.
To realize this concept, a metastructural design methodology is employed, utilizing engineered materials with spatially varying properties. This approach enables the precise tuning of the stiffness, damping, and mass distribution along the structure to manipulate wave propagation and energy dissipation. The resulting metastructures exhibit frequency-selective absorption, where individual unit cells contribute to the spectral resolution.
A metastructure is defined as a periodic arrangement of engineered unit cells that dissipate vibrational energy over specific frequency ranges. The attenuation behavior is governed by bandgaps, spectral regions where wave propagation is suppressed, and energy is absorbed [17,18,19,20,21,22]. The position and width of these bandgaps are determined by the geometric and dynamic properties of the unit cells, such as stiffness and mass, enabling precise control over frequency-selective behavior. Recent studies on metastructures have further advanced this field by exploring the mechanical behavior and optimization of auxetic and honeycomb configurations. For example, Ghasemi et al. [23] investigated nonlinear bending and post-buckling responses in auxetic tubes, while Nasri et al. [24] analyzed the buckling resistance of polymeric meta-sandwich beams with honeycomb cores. These works highlight the potential of metastructures for mechanical optimization but focus primarily on static and dynamic responses under mechanical loads.
Building on the BM’s structural inspiration, this study employs a metastructure design incorporating dynamic vibration resonators (DVRs) attached to a beam. The natural frequency of the DVRs determines the bandgap’s spectral position, while factors such as the DVR mass influence the bandgap’s width. Prior research has demonstrated that tuning DVRs to a single frequency results in a distinct bandgap in the frequency response function (FRF) [17,19,20,21,22]. Extending this concept, we assemble metastructures with DVRs tuned to different frequencies, allowing their individual bandgaps to overlap. This configuration enables the assembled structure to absorb a continuous range of frequencies, replicating the BM’s frequency-selective behavior.
The attenuation effectiveness of each metastructure depends on the number of unit cells, correlating with the density of DVRs per unit length of the beam. As the number of unit cells increases, attenuation quality improves. While frequency response functions (FRFs) are commonly used to assess attenuation depth, they lack the ability to qualitatively analyze elastic-wave reflection and absorption in bandgaps as a function of the number of unit cells.
Reflection and absorption coefficients, widely used to evaluate acoustic materials and impedance tube studies [25,26,27], provide an alternative for assessing sound absorption. These techniques have been adapted to study elastic-wave reflection in beams with various boundary conditions, with mathematical models developed to calculate reflection coefficients in beams featuring DVRs [28,29,30,31,32]. Prior research has primarily focused on reducing frequency-resonance wave reflections using Acoustic Black Hole (ABH) terminations [33,34,35,36,37,38]. In addition, absorption coefficient and transmission loss approaches are often used in analyzing the performance of acoustic metamaterials [39]. However, the reflection and absorption of elastic waves across broader frequency bandwidths in metastructures remain underexplored.
This gap is particularly significant in developing a mechanical spectrum analyzer. To address it, this study characterizes and evaluates bandgap quality by estimating absorption coefficients for varying numbers of unit cells within a metastructure. This approach provides critical insights into elastic-wave behavior and serves as a reliable metric for assessing energy absorption efficiency within the bandgap region.
In summary, this research presents a detailed investigation of energy transmission and absorption in metastructures, focusing on the contributions of individual unit cells to the absorption process. It explores the assembly of frequency-tuned metastructures to achieve continuous, efficient frequency-selective absorption. Furthermore, by analyzing geometric parameters in both 1D and 2D configurations, this study provides a comprehensive understanding of the physical and mechanical implications of wave propagation and energy dissipation within these structures, offering a foundation for optimized designs in frequency-selective applications.

2. Metastructure Design and Study of Absorption Coefficients

2.1. Finite Element (FE) Model of the Host Beam

A metastructure was designed with an aluminum beam as a host, and multiple cantilevered brass beam resonators are attached as DVRs. The host beam was modeled as Timoshenko beams [17] with properties as shown in Table 1. Therefore, the effects of shear deformation and rotary inertia were included [40] in the equations of motion that described the flexural displacement w ( x , t ) and the bending rotation φ ( x , t ) of the beam at a spatial location x. The equation was expressed as [41]
x E I φ x + κ 2 A G w x φ = ρ I 2 φ t 2 , x κ 2 A G ( w x φ ) = ρ A 2 w t 2 ,
where ρ is the material density of the beam, A is the cross-sectional area, I is the second moment of inertia, E is the linear elastic modulus, G represents the shear modulus, and κ is the Timoshenko shear coefficient. In our case, the host beam was modeled with free–free boundary conditions, and as a result, the bending moment and the shear force were zero at the boundaries. This was expressed as
E I φ ( x , t ) x | x = free end = 0 , κ 2 A G w ( x , t ) x φ ( x , t ) | x = free end = 0 .
Then, the Galerkin approach was employed to discretize the partial differential equation (PDE) represented by equation Equation (2) using second-order shape functions [40,42,43]. By discretizing the beam with 250 finite elements in a finite element (FE) model, the natural frequencies of the beam were accurately determined and converged within the frequency range of 1 kHz as shown in Section S1 of Supplementary Materials. The resulting global mass and stiffness matrices of the host beam were then utilized to simulate the beam response in Matlab. In this study, the damping mechanism was assumed to be proportional damping. Thus, the equation of motion for any n-degree-of-freedom (n-DOF) system could be expressed as:
M x ¨ + C x ˙ + K x = 0 ,
where the damping matrix C is expressed as a linear combination of the mass matrix M and the stiffness matrix K,
C = α M + β K .
In this equation, the values of the proportional damping coefficients α and β were estimated in a L 2 least-squares sense in the authors’ previous research using experimental modal damping ratios ζ i [17]. These values were α = 0.48 and β = 2.9 × 10 7 .

2.2. FE Model of the Host Structure with DVRs

Two dynamic vibration resonators were utilized in this study, namely DVR “A” and DVR “B”, and their dimensions and properties are listed in Table 1. To simplify the model, DVR A and DVR B were further reduced to single-degree-of-freedom (SDOF) resonators. Experimental measurements of the metastructure determined reduced-order mass and stiffness values for each resonator. The start and end frequencies of the bandgaps were estimated through experiments, and the mass and stiffness values in the simulations were tuned to achieve exact frequency locations using a finite element analysis [17]. The parameters of the reduced-order model are presented in Table 2. The SDOF DVRs of the reduced single-degree-of-freedom (SDOF) dynamic vibration resonators were dynamically coupled to the flexural DOF at the specified node of the elemental mass and stiffness matrix of the second-order element, assembling the governing matrices of the metastructure.

2.3. Study of Absorption Coefficients in a Metastructure

This study focused on evaluating the quality of the attenuation of the metastructure in the bandgap frequency spectrum by examining the reflection and absorption of elastic waves. A novel framework was developed to quantify the energy absorbed using the absorption coefficient to achieve this. Previous research explored wave reflections in homogeneous elastic media [28,29,30,31,32], as well as structures with nontraditional boundaries such as the Acoustic Black Hole (ABH) termination [33]. Based on these studies, a method was devised to calculate absorption coefficients in metastructures.
This study investigated the wave propagation in a long aluminum beam connected to a one-dimensional metastructure consisting of a finite number of unit cells. The metastructure is known to impede the propagation of elastic waves in the bandgap region of the frequency spectrum. However, the practical question of interest was how many unit cells were required to achieve significant energy absorption within the bandgap region and what was the individual contribution of each resonator. To address this, the total length of the aluminum beam was kept constant, with and without resonators. However, the number of DVRs in the structure varied, changing the number of unit cells. Each set of resonators corresponded to different metastructural design samples, enabling a comprehensive analysis of their effects on energy absorption.

2.3.1. Metastructural Design Specimens Considered for Study

In this study, four different specimens were considered to examine the depth of the bandgap and analyze the absorption coefficients. The baseline specimen represented the host structure without any DVRs, serving as a reference for comparison. The second specimen consisted of nine DVRs attached equidistantly to the host structure, a nine-unit cell specimen, creating a configuration with a 7/8th host beam and 1/8th metastructure. For the third specimen, 18 DVRs were attached, yielding an 18-unit cell specimen, where the first 3/4th portion represented the host beam without DVRs, and the remaining 1/4th portion formed a metastructure with 18 DVRs. The fourth specimen involved 36 DVRs, yielding a 36-unit cell specimen, with the first half of the structure being a host beam without DVRs and the second half forming a metastructure with 36 DVRs. The visual representation of these four specimens is provided in Figure 1. These specimens were selected to explore the depth of the bandgap and investigate the absorption coefficients in the respective metastructures. In addition to the number of unit cells, the additional mass of the DVRs contributed to the increase in wave absorption within the metastructure. It is important to note that our investigation is not limited to the specific design of metastructures with DVRs but extends to the broader concept of metastructures with periodic and repetitive unit cells. By studying the behavior of different metastructural designs and their absorption properties, we aim to better understand the philosophy and principles underlying metastructures with periodic unit cells.

2.3.2. Experimental Setup

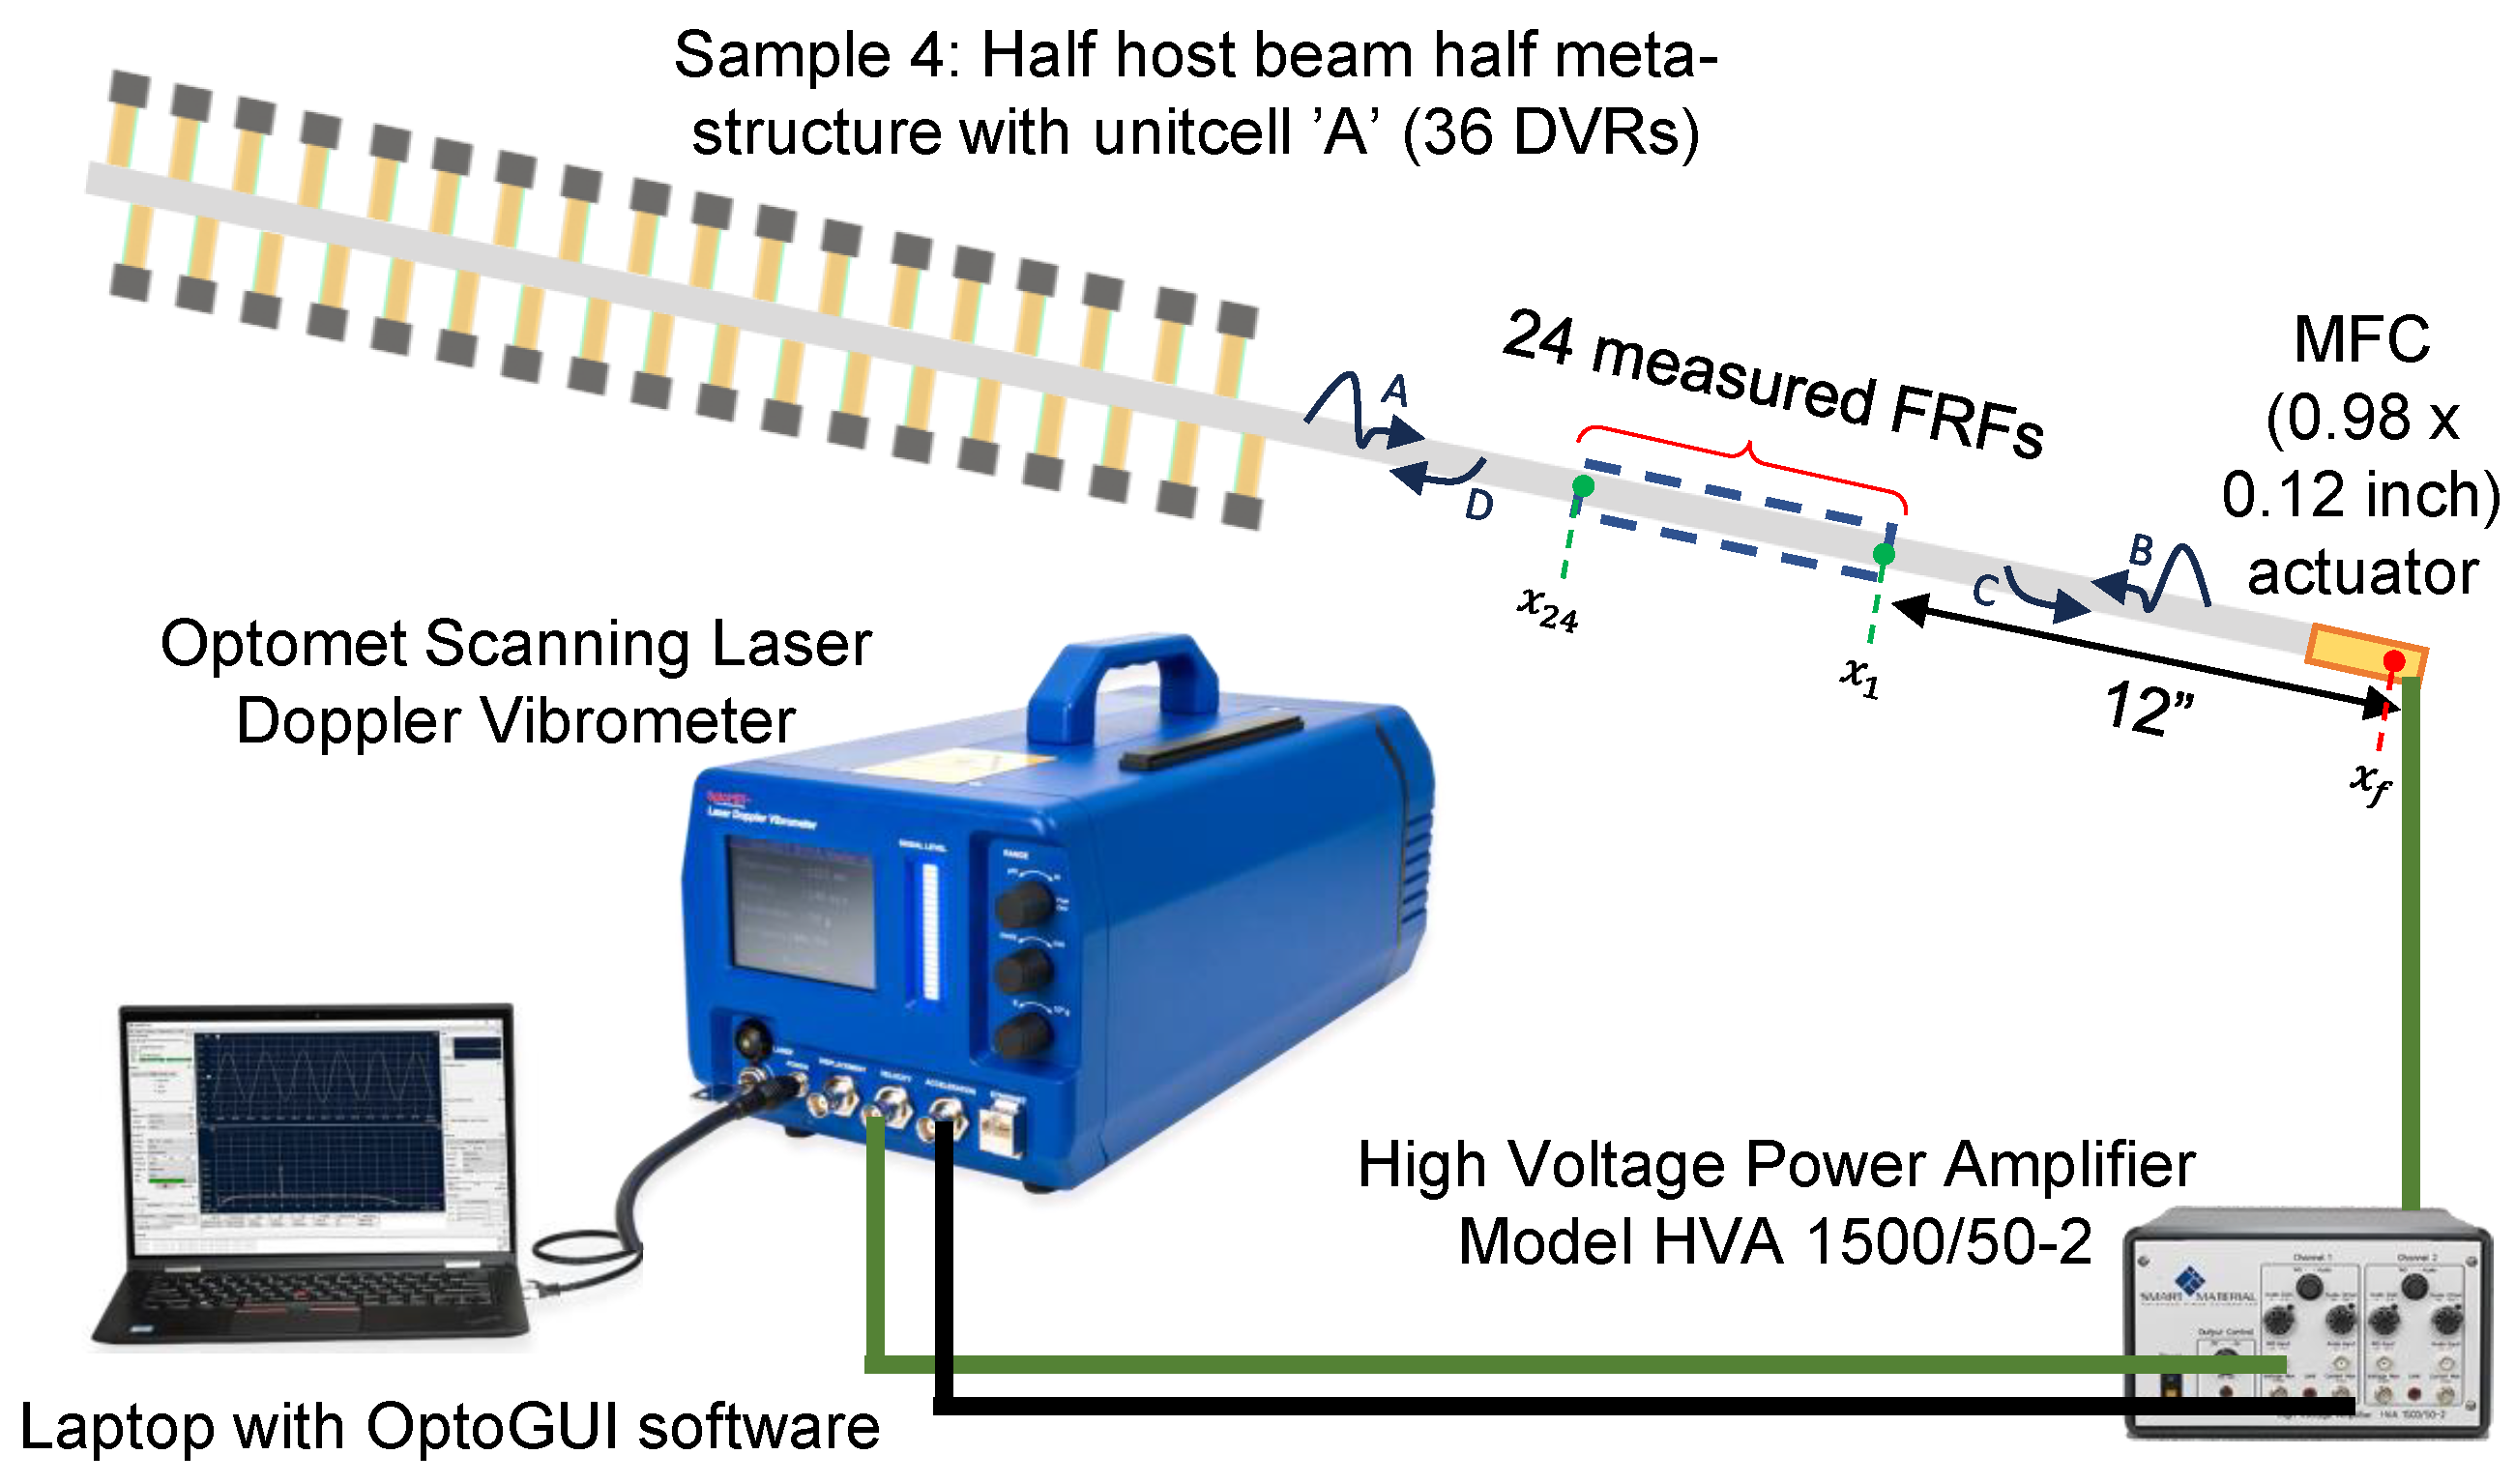
For the experimental validation, all four specimens previously discussed were fabricated and suspended in the air using fishing lines to achieve free–free boundary conditions. An excitation was applied to one end of the specimens using a macrofiber composite (MFC M2503-P1; Smart Material Corp, Sarasota, FL, USA) with an active area of 25 × 3 mm2 (0.98 × 0.12 inch2). The specimens were scanned at 24 equidistant points using an Optomet GmbH, Germany scanning laser Doppler vibrometer (SLDV) to measure the flexural velocity response. The first scan point was 12 inches away from the excitation end, and the distance between consecutive scan points was set at 0.25 inches . A chirp excitation signal with a 20 V amplitude activated the MFC. The velocity/voltage frequency response function (FRF) measurements obtained from the scans estimated the absorption coefficients for each specimen. Figure 2 provides a schematic of the experimental setup for specimen 4 as a reference.

2.3.3. Estimation of Reflection Coefficients

By examining the metastructural design specimens in Figure 1, it is evident that each specimen consists of a host beam with a constant cross-section. One end of the host beam is connected to a metastructure at its boundary, representing an unknown boundary condition. The elastic dispersion behavior of the beam is well described using the Timoshenko theory. The characteristic equation, also known as the dispersion relationship, for the beam is given by [42,43,44]:
E I ρ A k f 4 I A ( 1 + E G κ ) k f 2 ω 2 ω 2 + ρ I G A κ ω 4 = 0 , x [ 0 , L ] ,
where k f is the flexural wavenumber (spatial parameter), and ω is the temporal parameter. The equation is quadratic in k f 2 and ω 2 ; it represents the relationship between the wavenumber and the angular frequency. The roots of this equation correspond to the different modes of wave propagation in the beam. The real roots correspond to oscillatory behavior and represent flexural waves propagating along the length of the beam. The positive root corresponds to a propagating wave moving from right to left, while the negative real root signifies a propagating wave moving from left to right. On the other hand, the imaginary roots represent non-propagating wave modes, which have an exponential decay effect limited to the boundaries of the beam. The wave solution considering all roots is given by [33,34]:
W ( x , ω ) = A ˜ ( ω ) e j k f x + B ˜ ( ω ) e + j k f x + C ˜ ( ω ) e k f x + D ˜ ( ω ) e + k f x , x [ 0 , L ] ,
where A ˜ ( ω ) and B ˜ ( ω ) are scalar coefficients representing the contribution of reflected and incident propagating wave modes, respectively, while C ˜ ( ω ) and D ˜ ( ω ) represent non-propagating attenuating wave modes. These coefficients determine the amplitude and phase of each wave component. The boundary conditions associated with the equation of motion (5) give rise to the contribution of backward propagating and non-propagating attenuating wave modes, which can be expressed in terms of a reflection matrix:
A ˜ C ˜ = R B ˜ D ˜ ,
where R is the reflection matrix defined as:
R = R p p R a p R p a R a a .
Here, the subscripts p and a represent the propagating and non-propagating attenuating wave modes, respectively, while R i j denotes the reflection coefficient between the incident wave i and the reflected wave j. In this study, we focused on the propagating wave modes that had a significant effect on the entire beam, and therefore, the imaginary roots were disregarded in the analysis. As discussed in Section 2.3.2, the measurement points along the beam were evenly spaced, starting at 12 inches from the free end and extending up to 17.75 inches. This spacing ensured that any forces and irregularities at the boundary had sufficiently decayed, resulting in a negligible near-field effect [33,34]. Therefore, in that region, the wave field could be well approximated by neglecting the contributions from the non-propagating attenuating wave modes. Thus, the wave solution could be expressed as:
W ( x , ω ) A ˜ ( ω ) e j k f x + B ˜ ( ω ) e + j k f x , x far from edges .
Since responses were measured at n = 24 locations, the wave equation could be written as
W ( x , ω ) = W ( x 1 , ω ) W ( x 2 , ω ) W ( x 3 , ω ) . . W ( x 24 , ω ) = e j k f x 1 e + j k f x 1 e j k f x 2 e + j k f x 2 e j k f x 3 e + j k f x 3 . . . . e j k f x 24 e + j k f x 24 A ˜ ( ω ) B ˜ ( ω ) = X ( k f , x ) A ˜ ( ω ) B ˜ ( ω ) ,
where X is ( n × 2 ). This equation could be rearranged as
A ˜ ( ω ) B ˜ ( ω ) = X ( k f , x ) W ( x , ω ) ,
where X is the Moore–Penrose inverse [45] given by X = ( X * X ) 1 X * , and X * represents the conjugate transpose of X . Therefore, once A ˜ ( ω ) and B ˜ ( ω ) were calculated, the reflection coefficient for the far-field assumption [33,34] could be determined as
R ( ω ) = A ˜ ( ω ) / B ˜ ( ω ) .
This reflection coefficient represents the ratio of the complex amplitude of the backward propagating wave to the complex amplitude of the forward propagating wave, providing information about the reflection behavior of the wave at the boundary. It indicates the amount of wave energy that is reflected from the boundary of the structure. In an ideal scenario, such as in an elastic beam without energy losses due to damping or resonators, the reflection coefficient would be unity, indicating all the wave energy is reflected from the end by the structure.

2.3.4. Reflection Coefficient Calculations from Simulations

In the FE model of each metastructure design specimen, a force was applied at the excitation location, and the FRFs were calculated at 24 locations along the beam for each specimen. The reflection coefficients, denoted by R , were then calculated for each sample using the methodology described in Section 2.3.3. The reflection coefficients obtained are plotted in Figure 1e.
In the first specimen, which represented the host structure without any DVRs, there was no significant drop in the reflection coefficient within the bandgap region: it was a straight line (Figure 1e). For specimen 2, which included nine DVRs, instead of noticing the drop in the reflected waves in the bandgap region, a rise in reflection magnitude within the bandgap region was observed. As the number of DVRs increased to 18 in specimen 3, the rise in reflection within the bandgap became more pronounced. Finally, in specimen 4 with 36 DVRs, there was a significant rise in the reflection coefficient within the bandgap area.
Based on these observations, it can be concluded that this reflection coefficient study showed a rise in the bandgap area, which is not a good indicator to assess the bandgap quality. To validate the rise in the reflection coefficient in a metastructure, experimental investigations were conducted. These experiments aimed to confirm that the observed reflection of waves aligned with the expected behavior based on the number of unit cells present in the metastructure.

2.3.5. Reflection Coefficient Calculations from Experiments

The FRF (velocity/voltage) measured at 24 locations, as shown in Figure 2, was used to calculate the reflection coefficient R ( ω ) for each specimen. Figure 1f presents the reflection coefficient versus frequency for each sample. The results demonstrate that as the number of DVRs increased in the metastructure, the reflection coefficient increased. From the observations in Figure 1f, it can be inferred that a minimum of nine unit cells was required to observe a considerable change in the reflection coefficient in this particular metastructure configuration.
However, the reflection coefficient exhibited an unexpected increase in the bandgap area, which went against intuition and challenged the validity of our underlying assumption in this study. In this study, we approached the wave propagation analysis in the coupled system, where an elastic beam interacts with a complex metastructure, similar to the elastic wave propagation within two linear beams made of different elastic materials. However, the metastructure itself contained imaginary wavenumbers within the frequency bandgap region. One hypothesis, which falls beyond the scope of our current study, suggests that while we focused on waves with real wavenumbers in the linear beam, the reflection coefficient failed to capture the effects of coupling a structure with purely imaginary wavenumbers within the frequency band of interest. To gain deeper insights, more research is needed, especially to explore the impact of gradually increasing the number of DVRs and evaluating their influence on the reflection coefficient. Additionally, to properly quantify the absorption effect of the metastructure, we should consider using a different metric in our analysis.

2.3.6. Reflection Coefficient Calculations for Host Beam Attached with One to Nine DVRs

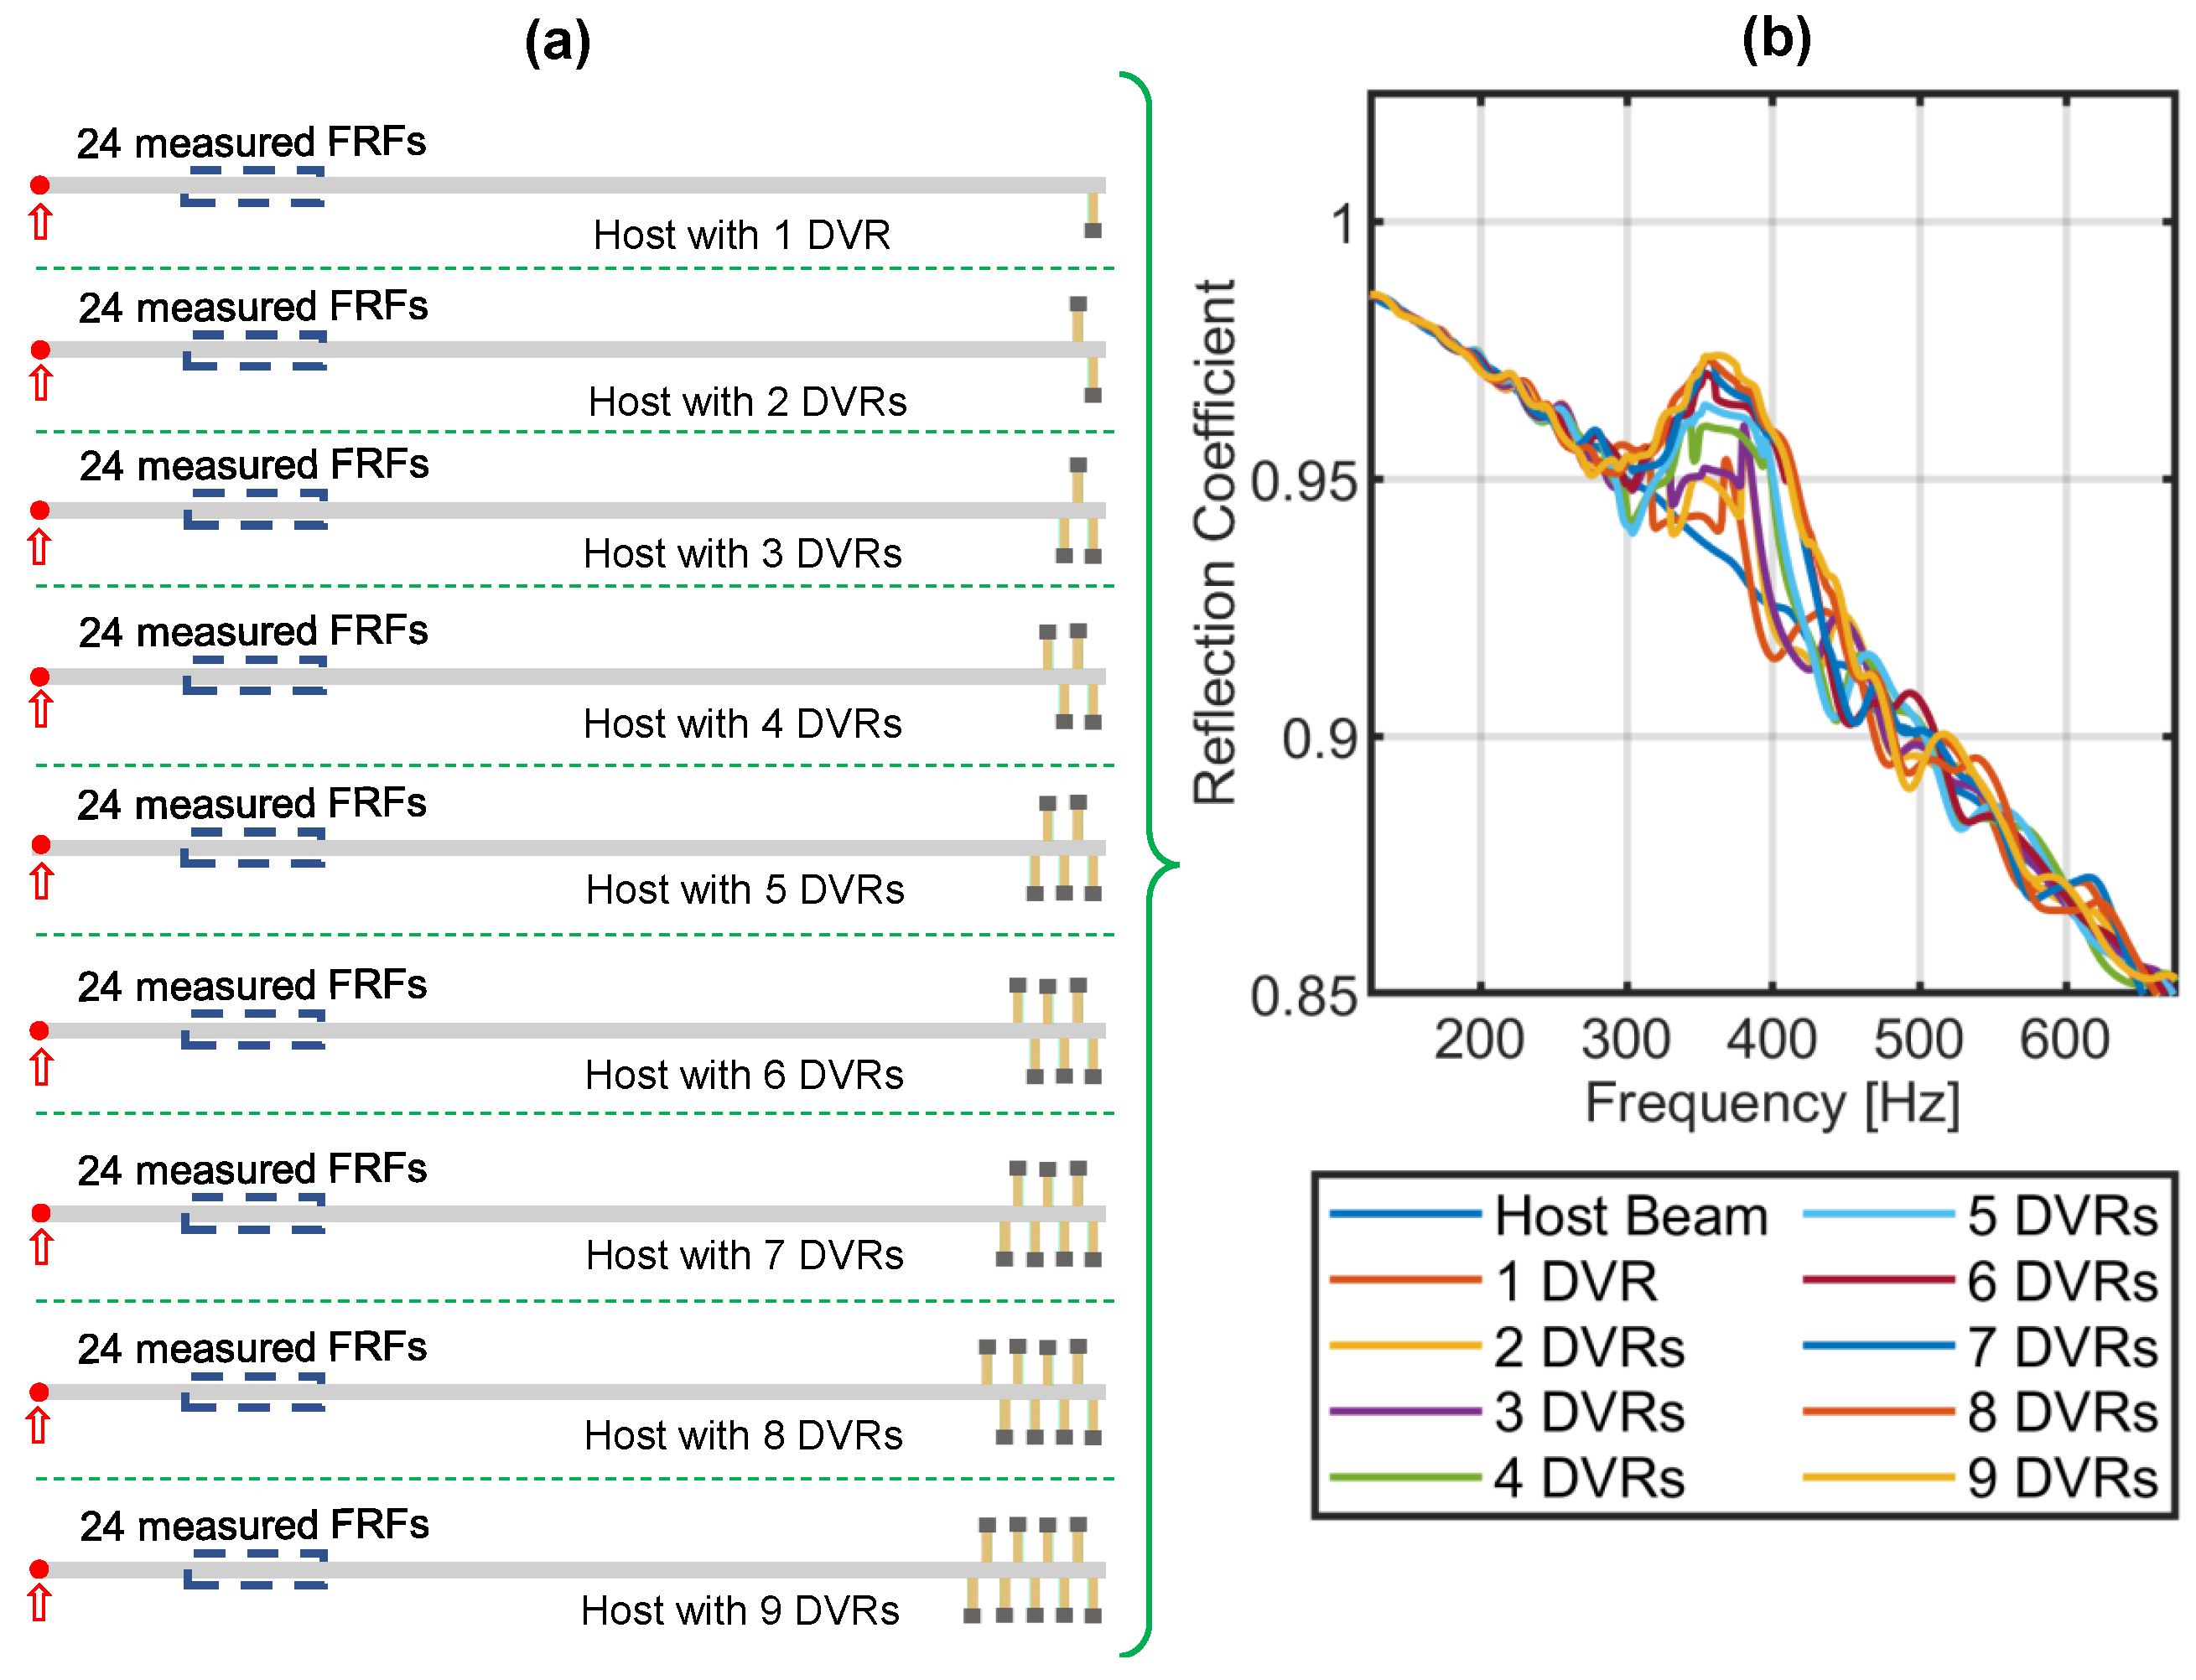
A study to assess the effect of attaching each DVR one by one to the host beam was conducted and is reported in this section. In the finite element (FE) model, nine specimens were designed such that each specimen had an increasing order of one to nine DVRs attached as a metastructure. A force was applied at the excitation location as shown in Figure 3a, and the FRFs were computed at 24 locations along the beam for each specimen. The reflection coefficients denoted by R ( ω ) were then calculated for each sample using the methodology described in Section 2.3.3. The reflection coefficients obtained are plotted in Figure 1e.
In the host structure with a single DVR, the reflection coefficient decreased and increased more than in the one without a DVR, as illustrated in Figure 3b. As the number of DVRs increased, the drop in the reflection coefficient became negligible, while the rise was highly pronounced within the bandgap region. Consequently, relying solely on the reflection coefficient is not an ideal approach to assess the quality of the bandgap. Therefore, additional simulations were carried out to calculate the transmission and absorption coefficients, which provided a more accurate assessment of the bandgap quality.

2.3.7. Transmission and Absorption Coefficient Calculations from Simulations

In Section 2.3.3, the wave solution Equation (6) was measured for the waves reflected from the boundary of the beam where the metastructure was attached. To study the transmission of waves through a metastructure in a bandgap area, it is necessary to assess the wave propagation in the host after its transmission through the series of DVRs. Consider a host beam with a metastructure having nine DVRs attached in the center as shown in Figure 4. Similar to the solution Equation (6) generated to measure the reflections from the boundary, the wave solution for quantifying the reflections of the transmitted wave at the same excitation location is expressed as
W t ( x , ω ) = P ˜ ( ω ) e j k f x + Q ˜ ( ω ) e + j k f x + R ˜ ( ω ) e k f x + S ˜ ( ω ) e + k f x , x [ 0 , L ] ,
where P ˜ ( ω ) and Q ˜ ( ω ) are scalar coefficients representing the contribution of reflected and incident propagating wave modes, respectively, while R ˜ ( ω ) and S ˜ ( ω ) represent non-propagating attenuating wave modes. These coefficients determine the amplitude and phase of each component of the wave. The boundary conditions associated with the equation of motion (5) give rise to the contribution of backward propagating and non-propagating attenuating wave modes, which can be expressed in terms of a reflection matrix for transmitted waves:
P ˜ R ˜ = R t Q ˜ S ˜ ,
where R t is the reflection matrix for the transmitted waves defined as:
R t = R t p p R t a p R t p a R t a a .
Here, the subscripts p and a represent the propagating and non-propagating attenuating wave modes, respectively, while R t i j denotes the reflection coefficient between the incident wave i and the reflected wave j. Similarly to Section 2.3.3, the wave field can be well approximated by neglecting the contributions from the non-propagating attenuating wave modes. Therefore, the wave solution can be expressed as:
W t ( x , ω ) P ˜ ( ω ) e j k f x + Q ˜ ( ω ) e + j k f x , x far from edges .
Similar to Section 2.3.3, responses were measured at 24 locations starting at a distance of 12 inches from the free end and extending up to 17.75 inches, and the wave equation was written as
P ˜ ( ω ) Q ˜ ( ω ) = X t ( k f , x ) W t ( x , ω ) ,
Once P ˜ ( ω ) and Q ˜ ( ω ) were calculated, the reflection coefficient for the transmitted waves [33,34] could be determined as
R t ( ω ) = P ˜ ( ω ) / Q ˜ ( ω ) .
In order to measure the drop in vibrational energy through the bandgap area of a metastructure, the transmission coefficient is defined as follows:
T ( ω ) = Q ˜ ( ω ) / B ˜ ( ω ) .
It indicates the amount of wave energy that is transmitted through a metastructure.
In addition, the absorption coefficient represents the wave energy that the structure absorbs as it reaches the boundary. The absorption coefficient can be calculated as follows:
A ( ω ) = 2 | R ( ω ) | 2 | T ( ω ) | 2 .
The absorption coefficient measures the energy absorbed at a specific frequency. It quantifies the amount of energy that is absorbed by the structure rather than reflected. Although we loosely refer to these coefficients in terms of power for better understanding, it is essential to note that the reflection coefficient considers the complex amplitudes of the waves. In an ideal scenario, such as in an elastic beam without energy losses due to damping or resonators, the reflection coefficient would be unity, indicating complete reflection of the incident wave. Consequently, the absorption coefficient would be zero, indicating that there is no energy absorption by the structure, and the transmission coefficient would be one, indicating that all waves are transmitted through the structure.
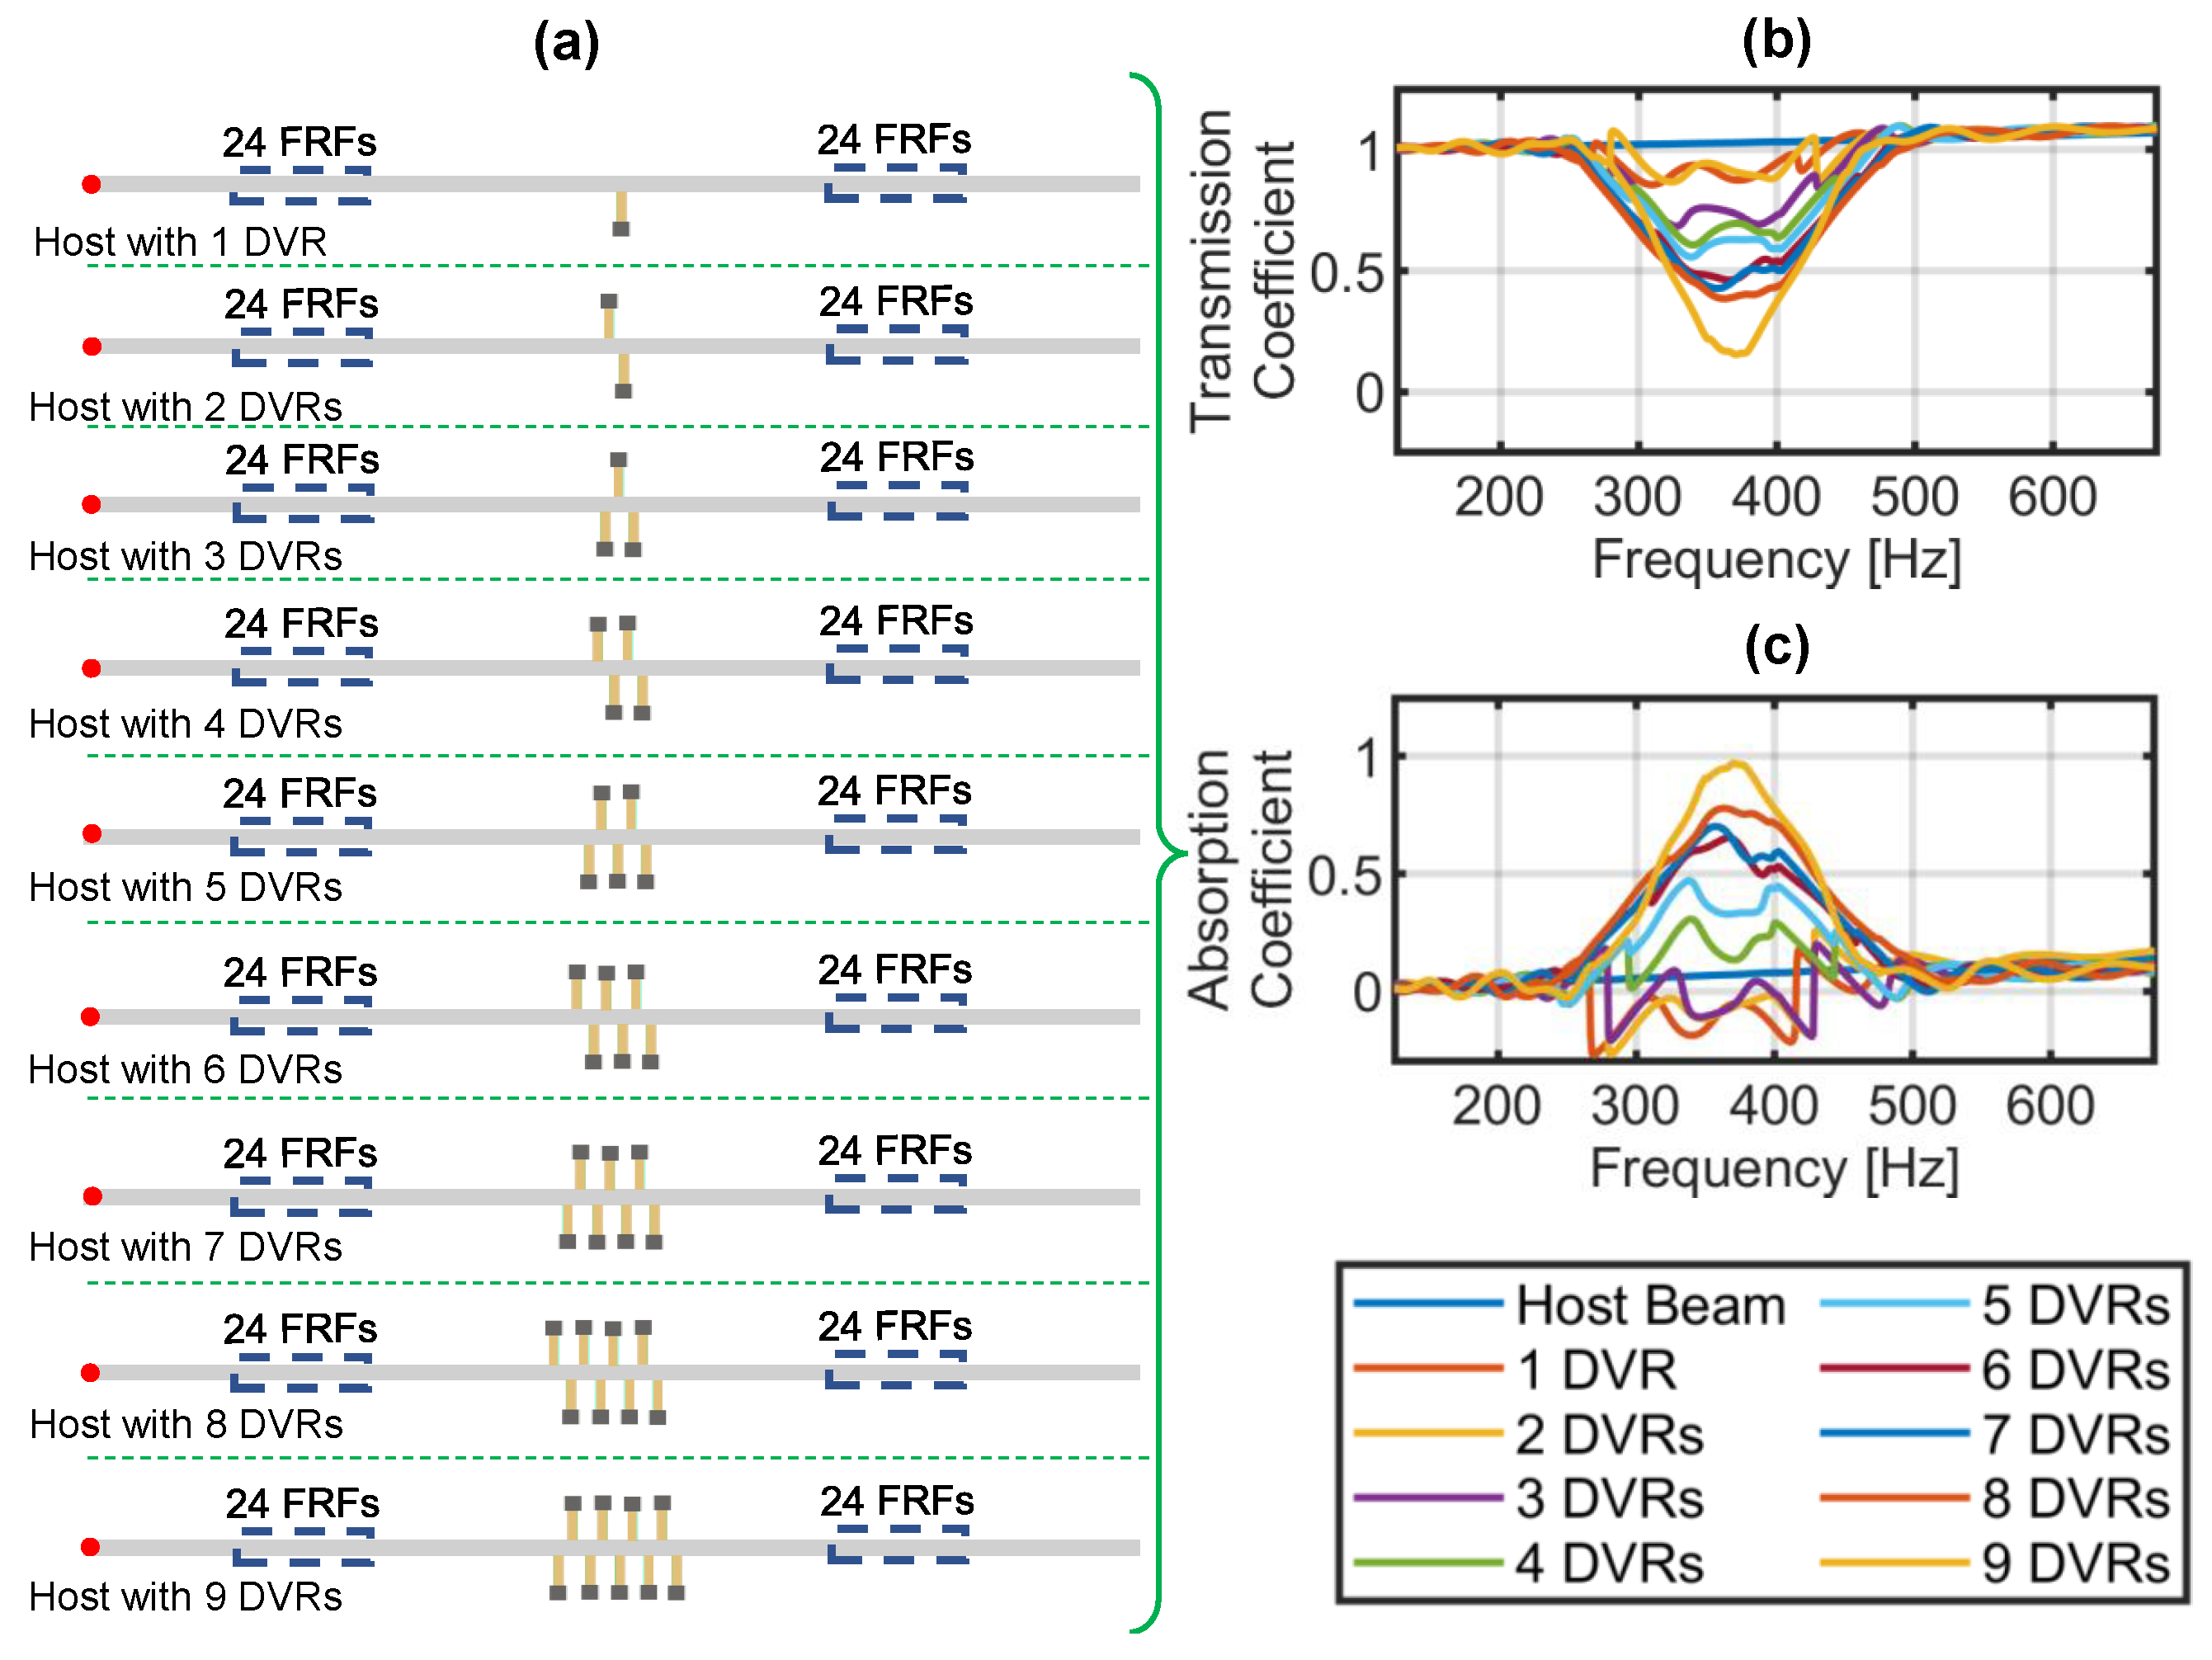
Initially, in the FE model, nine specimens were designed such that each specimen had an increasing order of one to nine DVRs as a metastructure attached in the middle of the host structure, as shown in Figure 5a, and the transmission and absorption coefficients were calculated and are plotted in Figure 5b,c. As the number of DVRs increased, the drop in the transmission coefficient increased. The rise in the absorption coefficient represents the amount of energy absorbed by the metastructure in a bandgap area. Therefore, transmission and absorption coefficient calculations provide an excellent indicator for assessing bandgap quality.
Then, simulations were conducted to calculate the transmission and absorption coefficients for a metastructure with 9, 18, and 36 DVRs attached in the middle of the host structure as shown in Figure 6a–d. The energy of the waves transmitted in the bandgap area decreased as the number of DVRs increased. Consequently, the energy absorbed increased as the number of DVR increased in the metastructure, as shown in Figure 6f. Therefore, the transmission and absorption coefficients provided a more accurate representation of the quality of the bandgap.

2.3.8. Power Absorbed by Each DVR in the Bandgap Region

For the metastructure with DVRs considered in this study, the elastic waves generated at the excitation location in the host beam are dissipated as the DVRs absorb vibrational energy. As a result, the wave undergoes decay along the length of the host structure within the bandgap region. In applications involving DVRs as energy harvesters, the absorbed power by individual DVRs can be harnessed and utilized. Therefore, it is essential to determine the amount of power absorbed by each DVR across all frequencies within the bandgap. This information is valuable for studying energy harvesting and optimizing the performance of the metastructure.
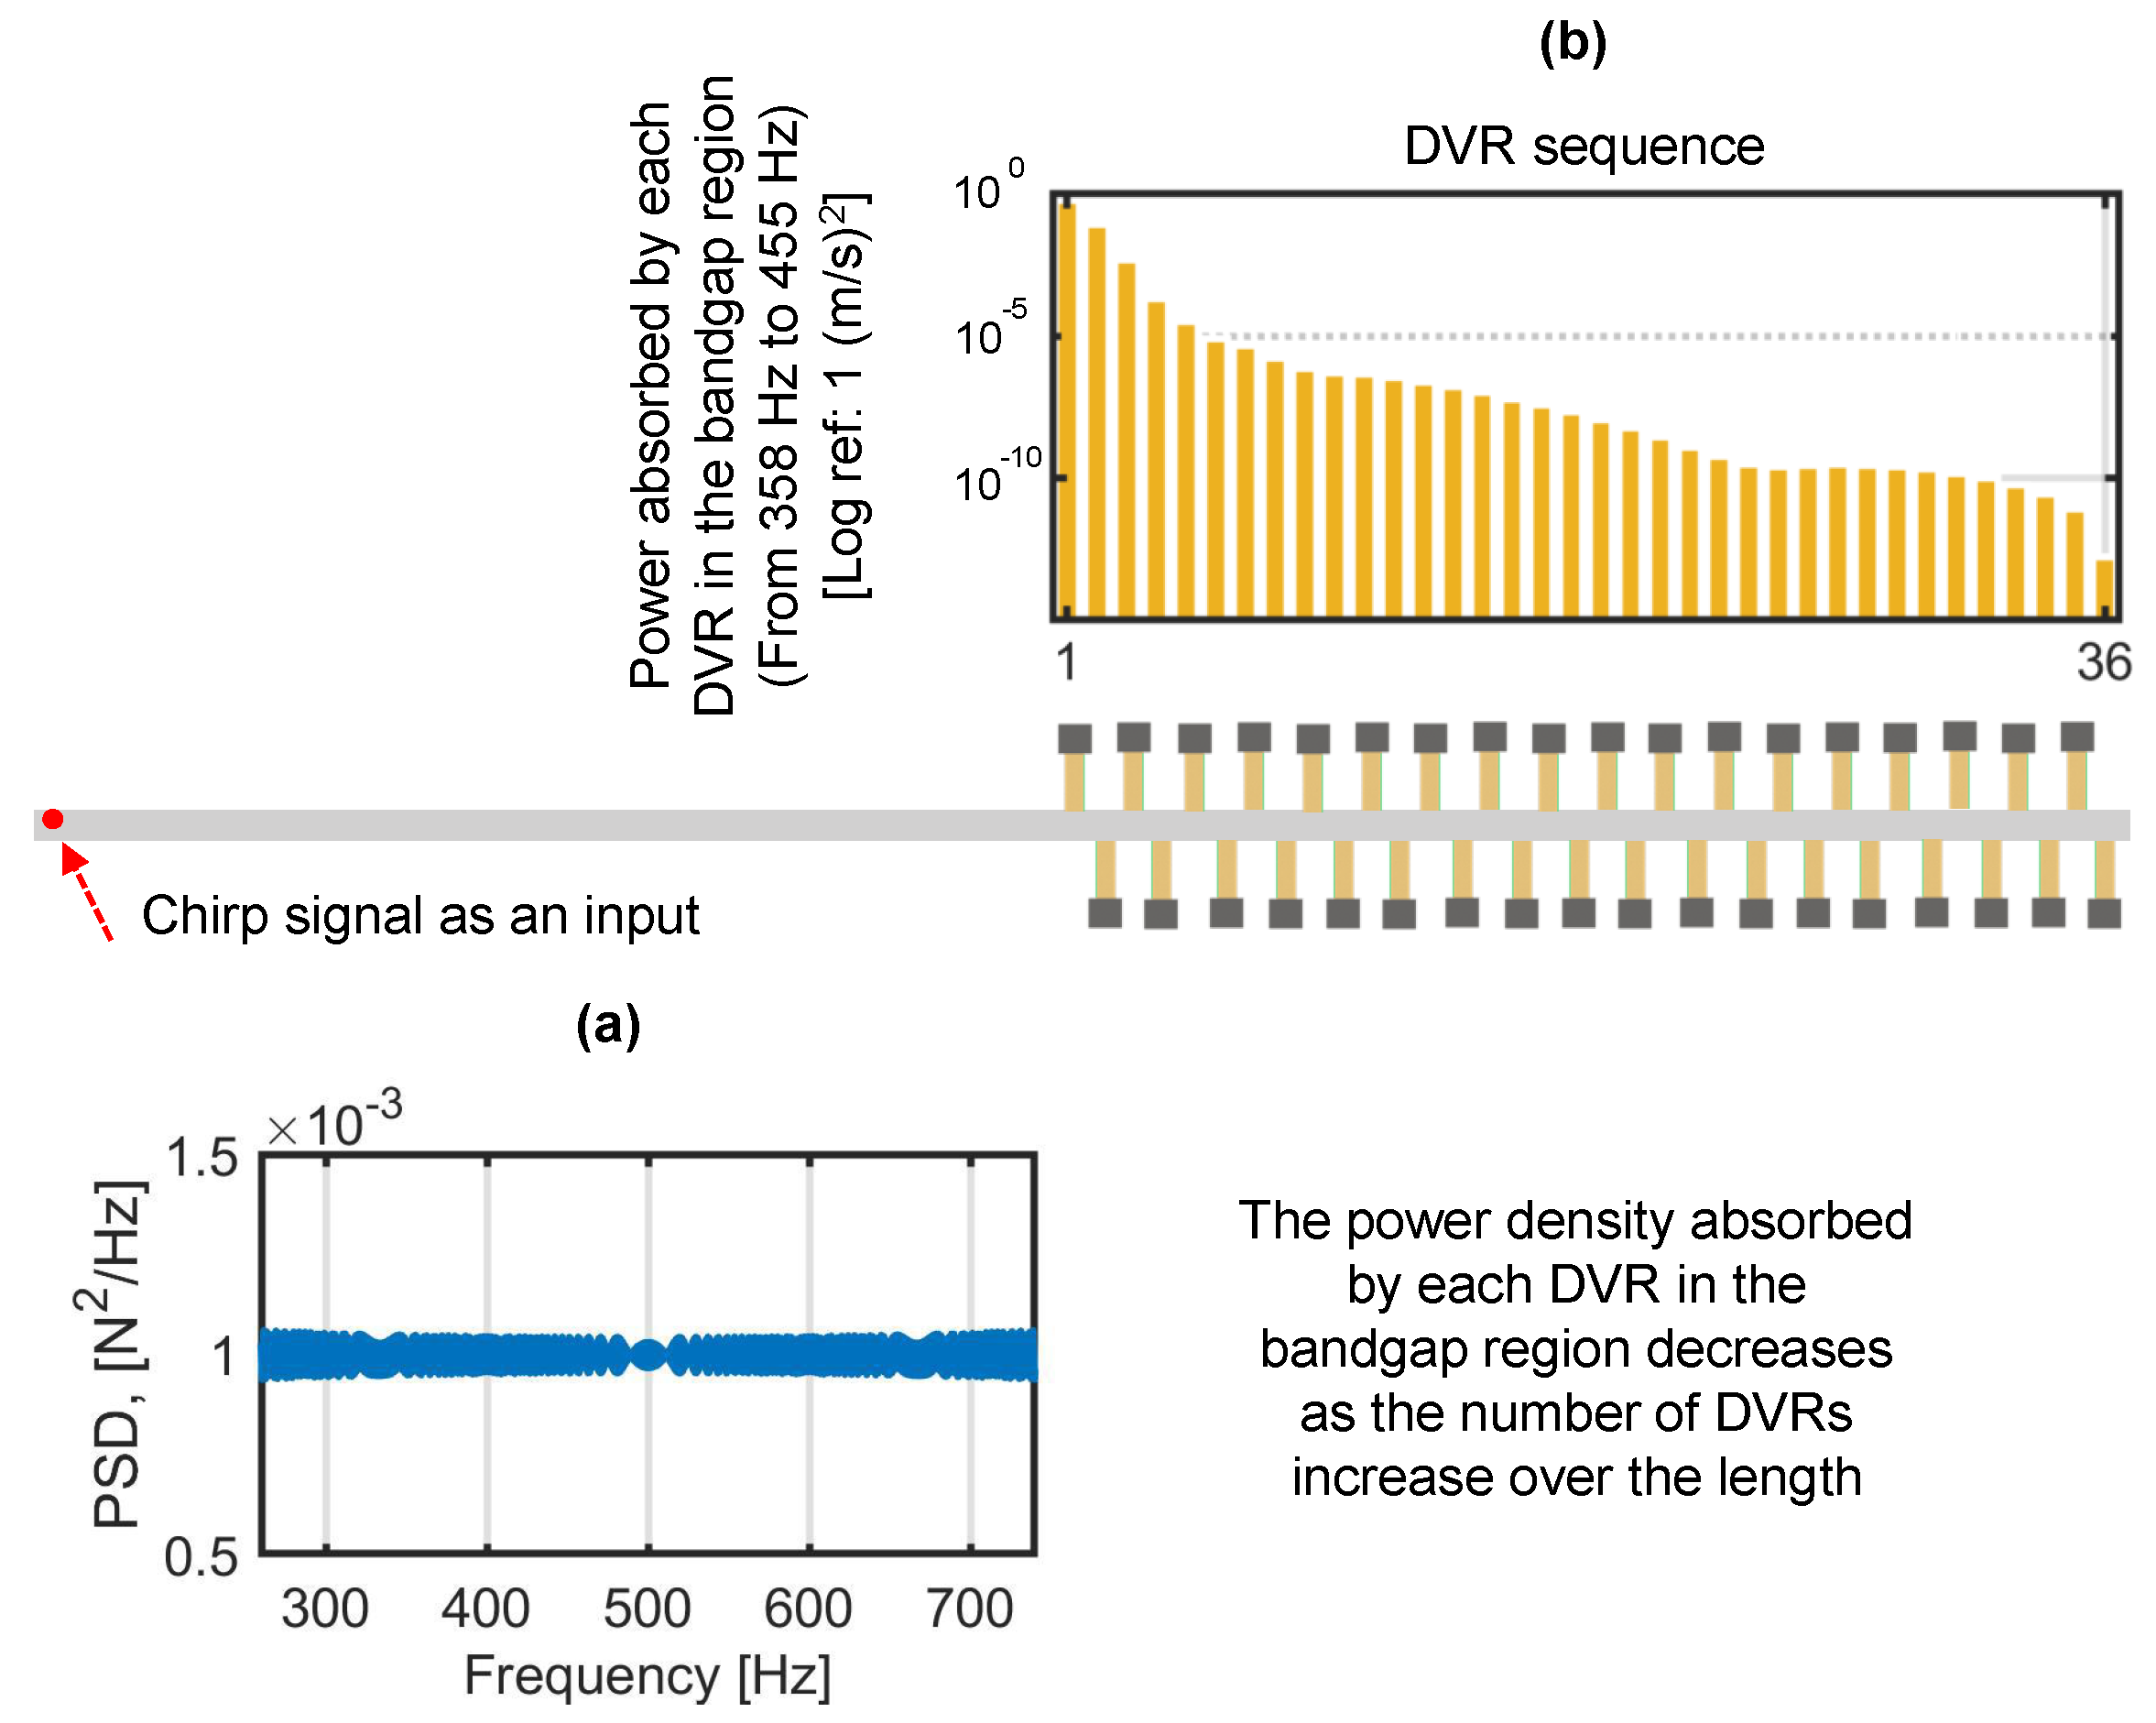
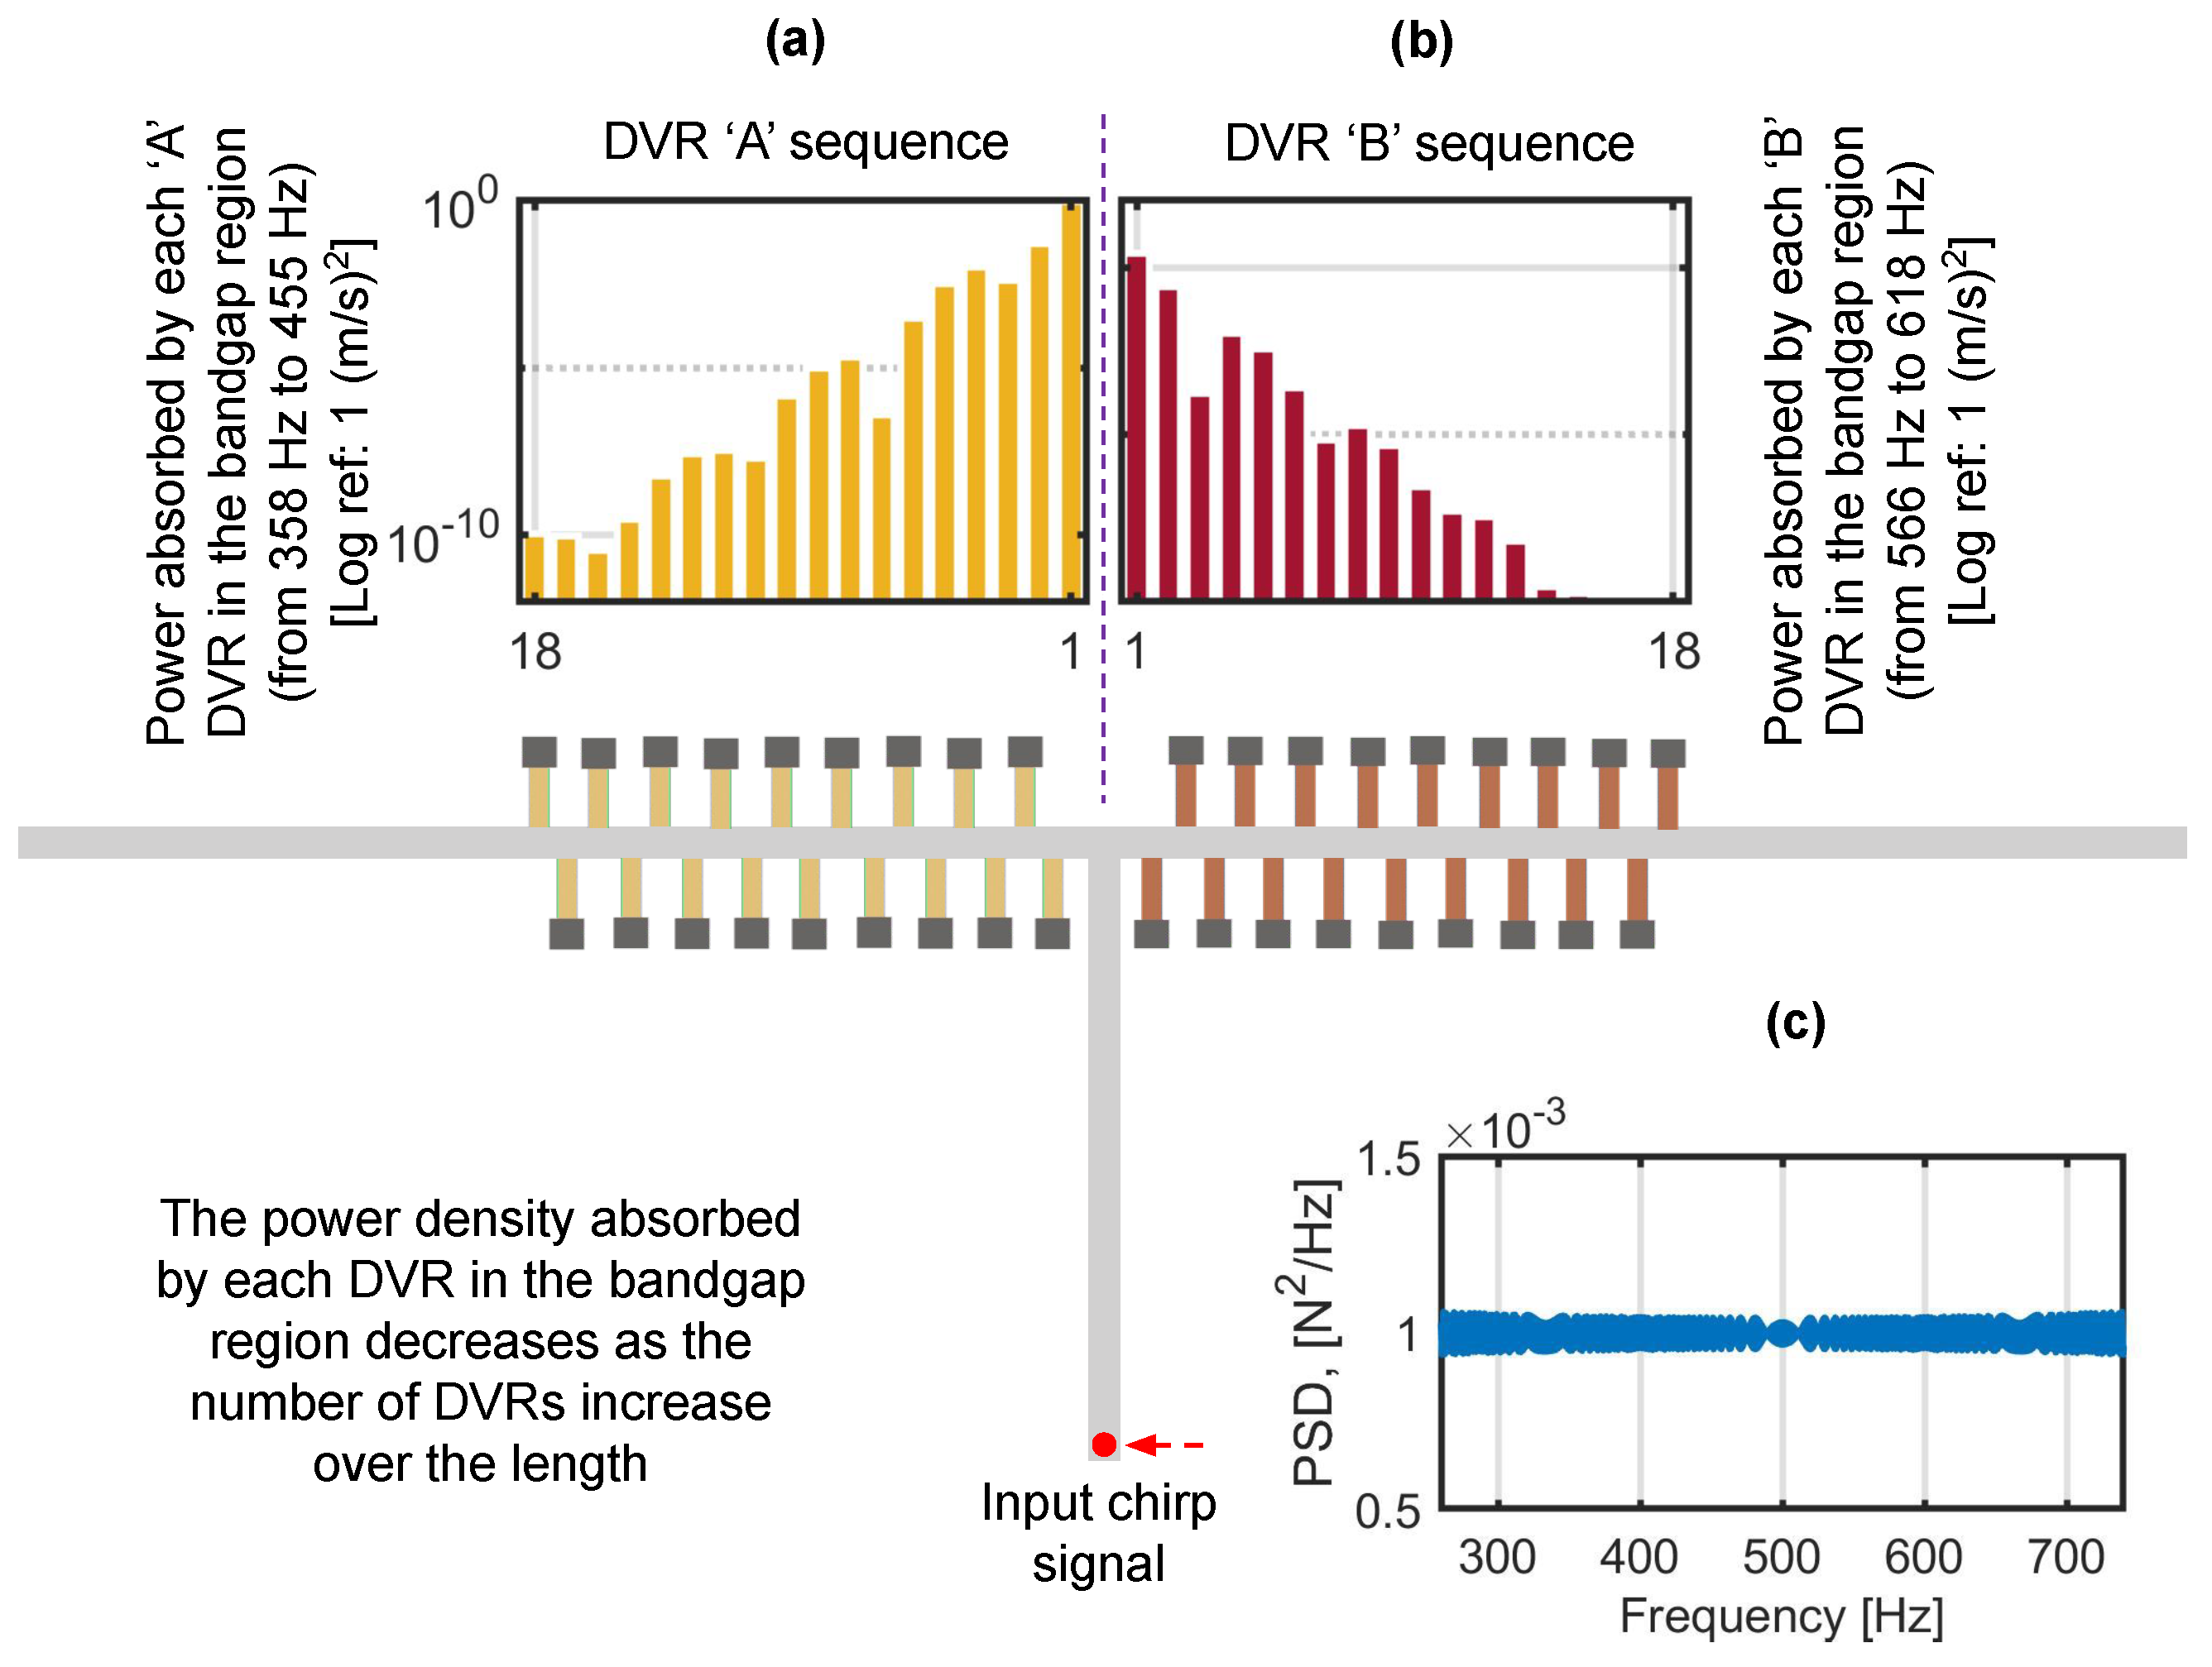
In this section, we investigated the power absorbed by each dynamic vibration resonator (DVR) within the bandgap region. The FE model was configured for the fourth specimen, as shown in Figure 7a, where the input chirp signal was applied at the boundary. We calculated the Power Spectral Densities (PSDs) of all 36 DVRs. To estimate the total RMS energy absorbed by the nth DVR in the bandgap region, we estimated the area under the PSD curve within the bandgap frequency range:
P ^ n = P n ( f i ) · Δ f f s f i f e ,
where Δ f is the frequency bin width, f s and f e are the start and end frequencies of the bandgap, and P n is the PSD of the nth DVR at each frequency bin. The total absorbed RMS energy P ^ n is shown in Figure 7b on the logarithmic scale. It can be seen that the power absorbed by the DVR decreased along the length of the metastructure. The first few DVRs absorbed the highest power, and the power absorbed gradually reduced as we moved away from the excitation location.

3. Modeling and Experimental Validation of Host T-Beam with DVRs

In this section, we investigated the interaction between two types of metastructures that were assembled together.

3.1. FE Model of the Host Structure

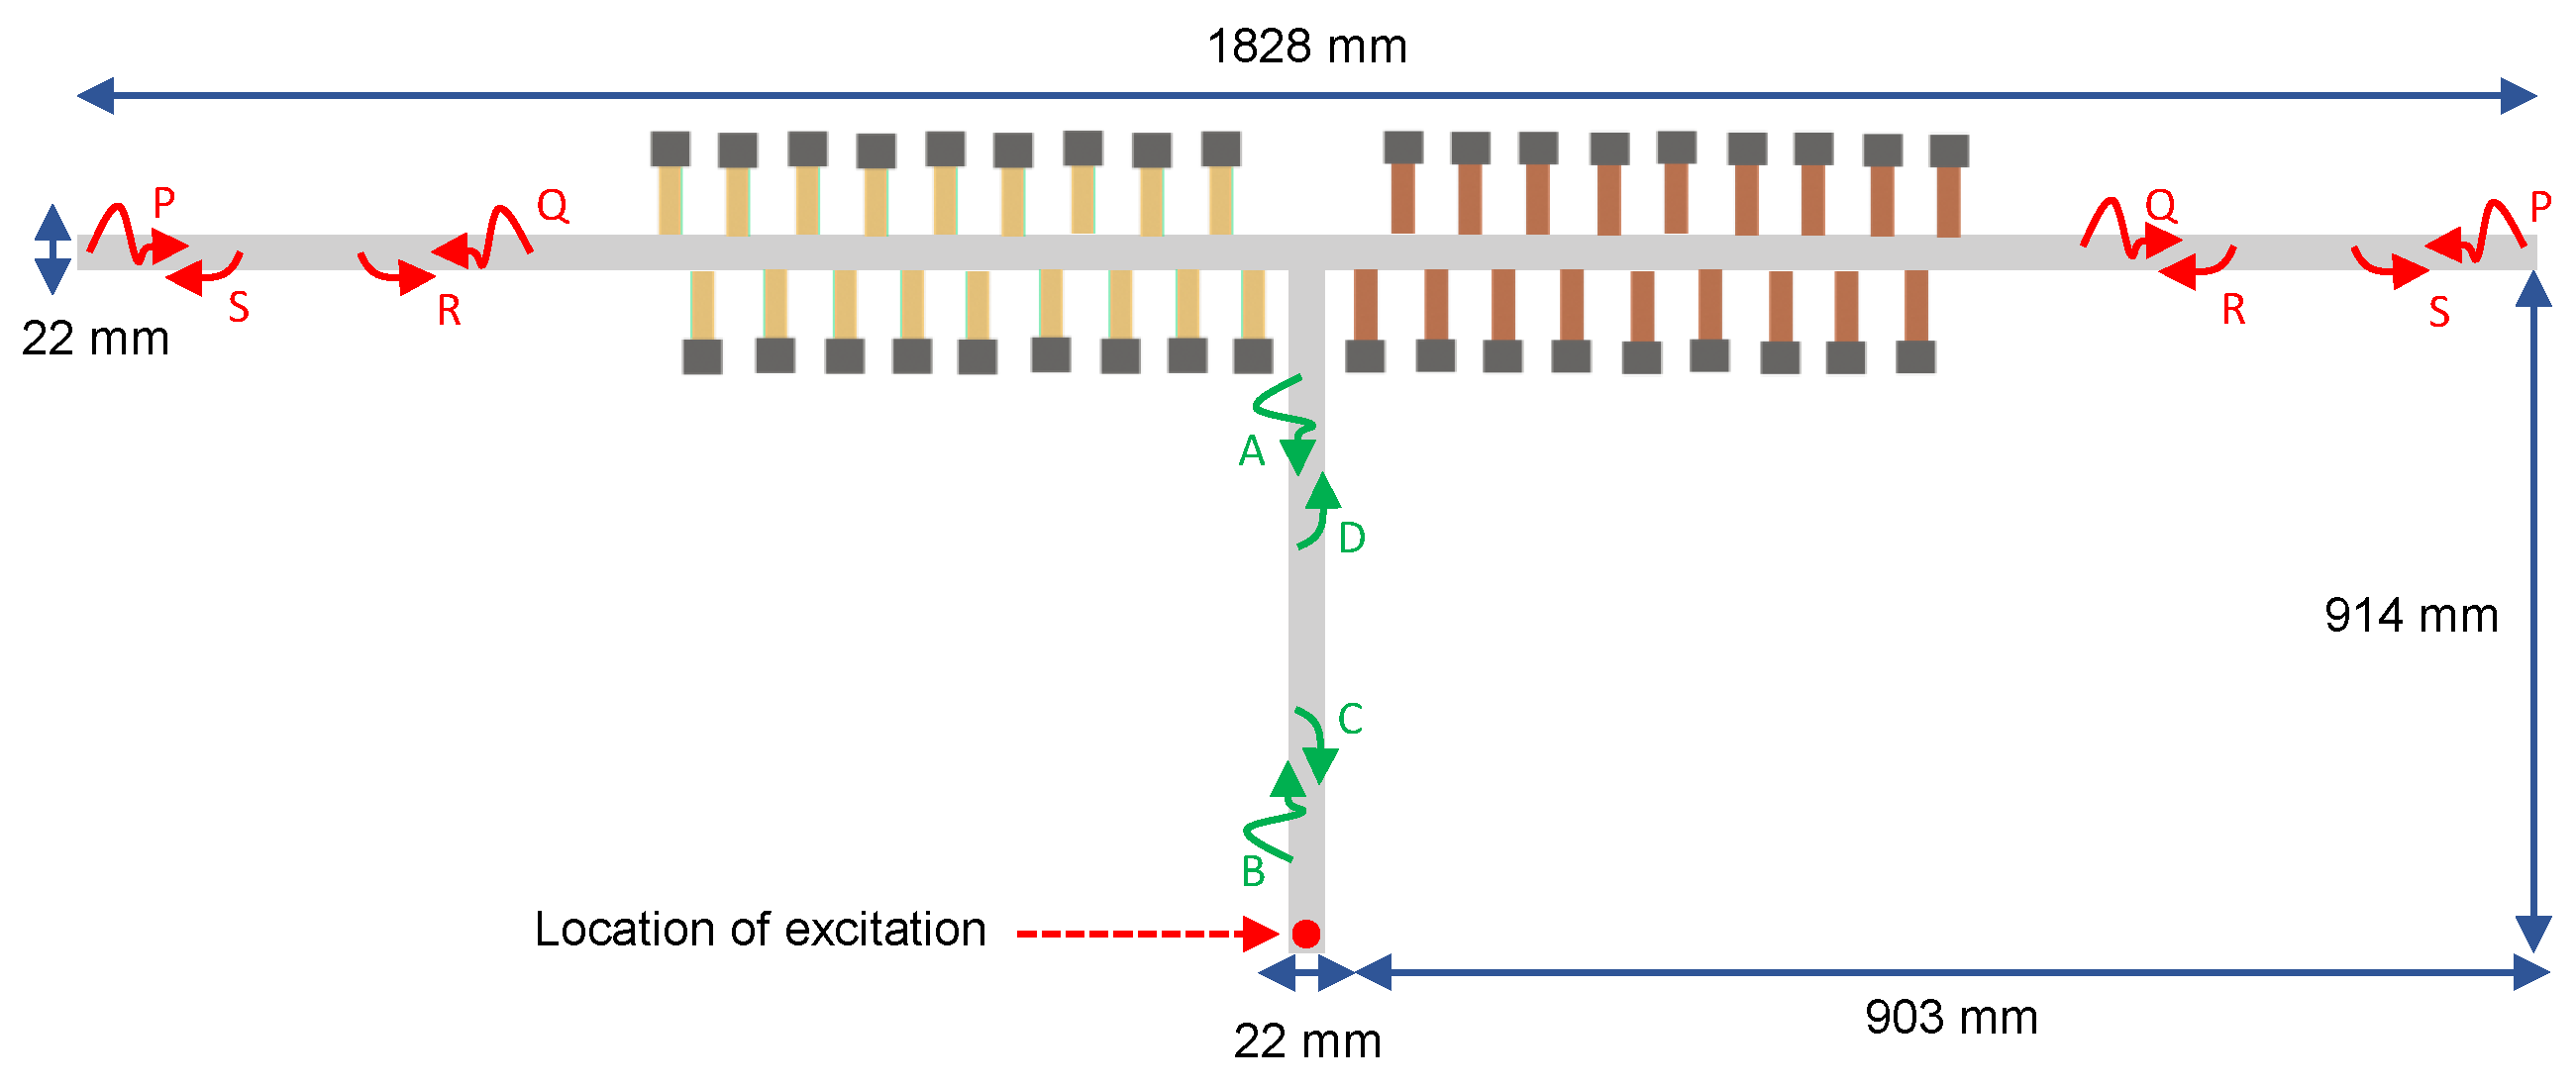
The T-shaped frame was used as the host structure in this study, consisting of two separate beams with a thickness of 1.5 mm each. This configuration is illustrated in Figure 8. Finite element (FE) modeling was conducted using the equations discussed in Section 2.1. The Galerkin approach was employed to discretize the partial differential equation (PDE) represented by Equation (2). Second-order shape functions were utilized for the discretization process [40,42,43]. This resulted in the generation of global mass and stiffness matrices for the host T-beam using MATLAB 2023. It is important to note that each arm of the T-shaped frame had its own corresponding metastructure.
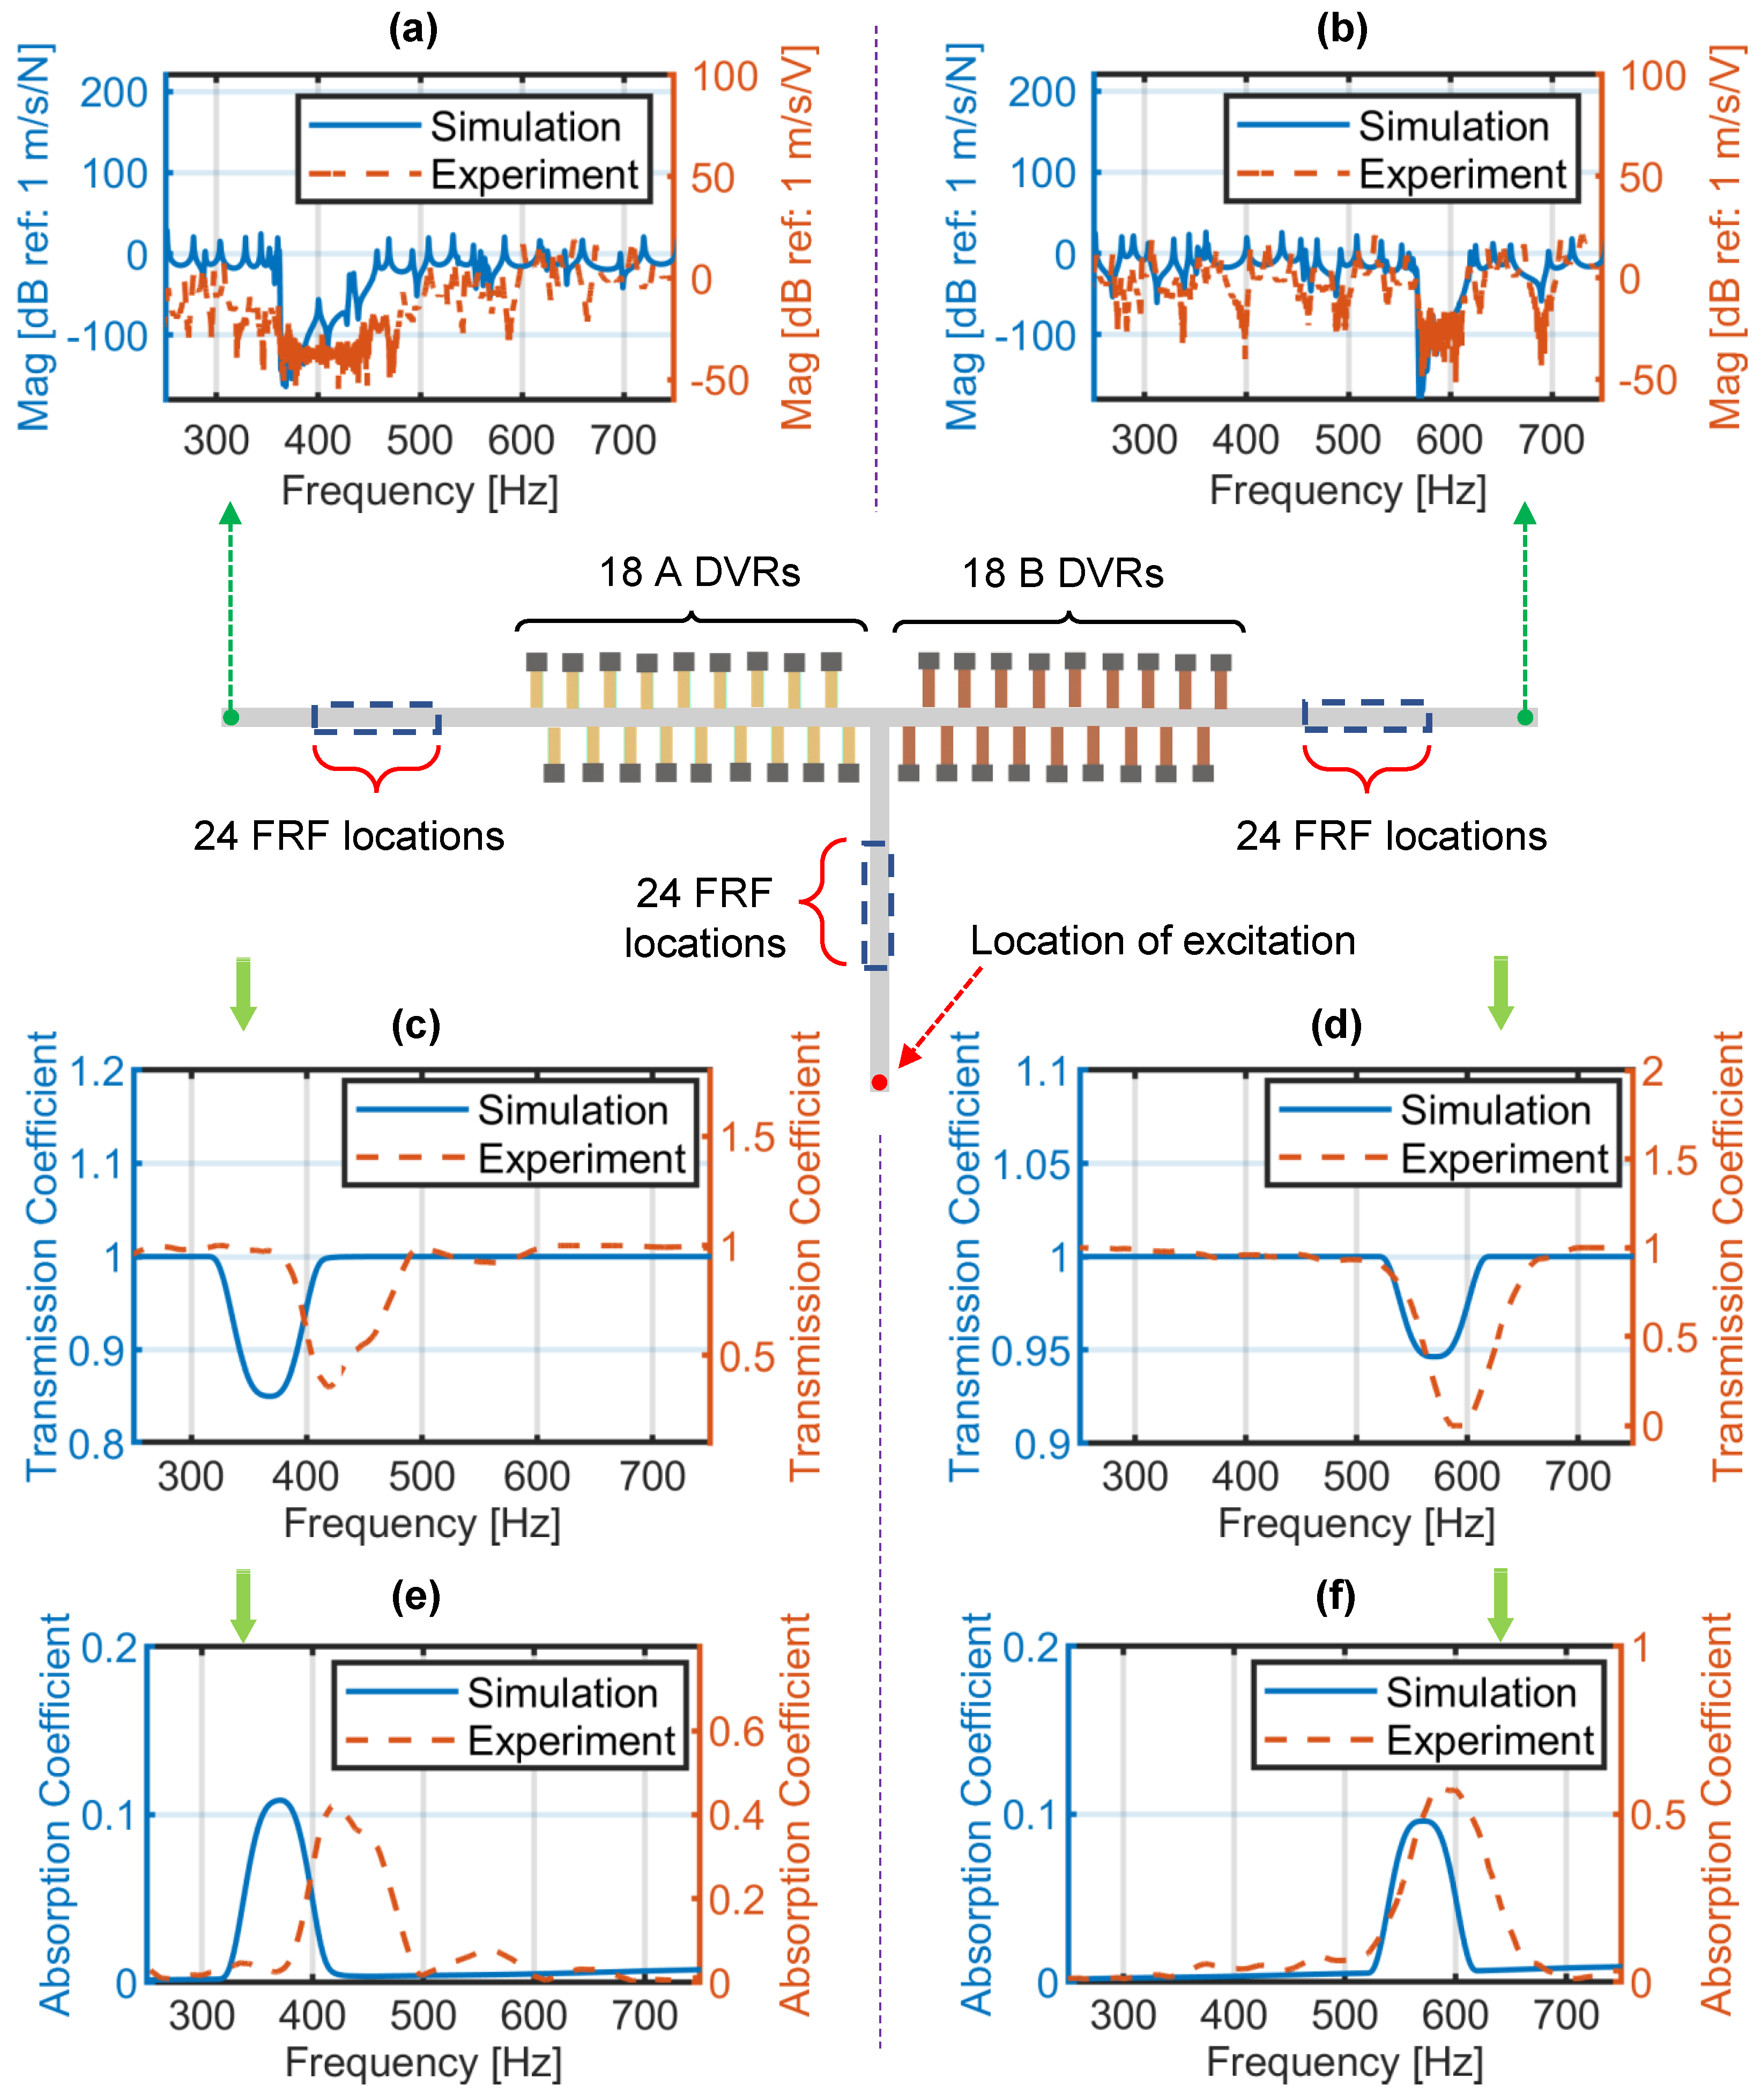
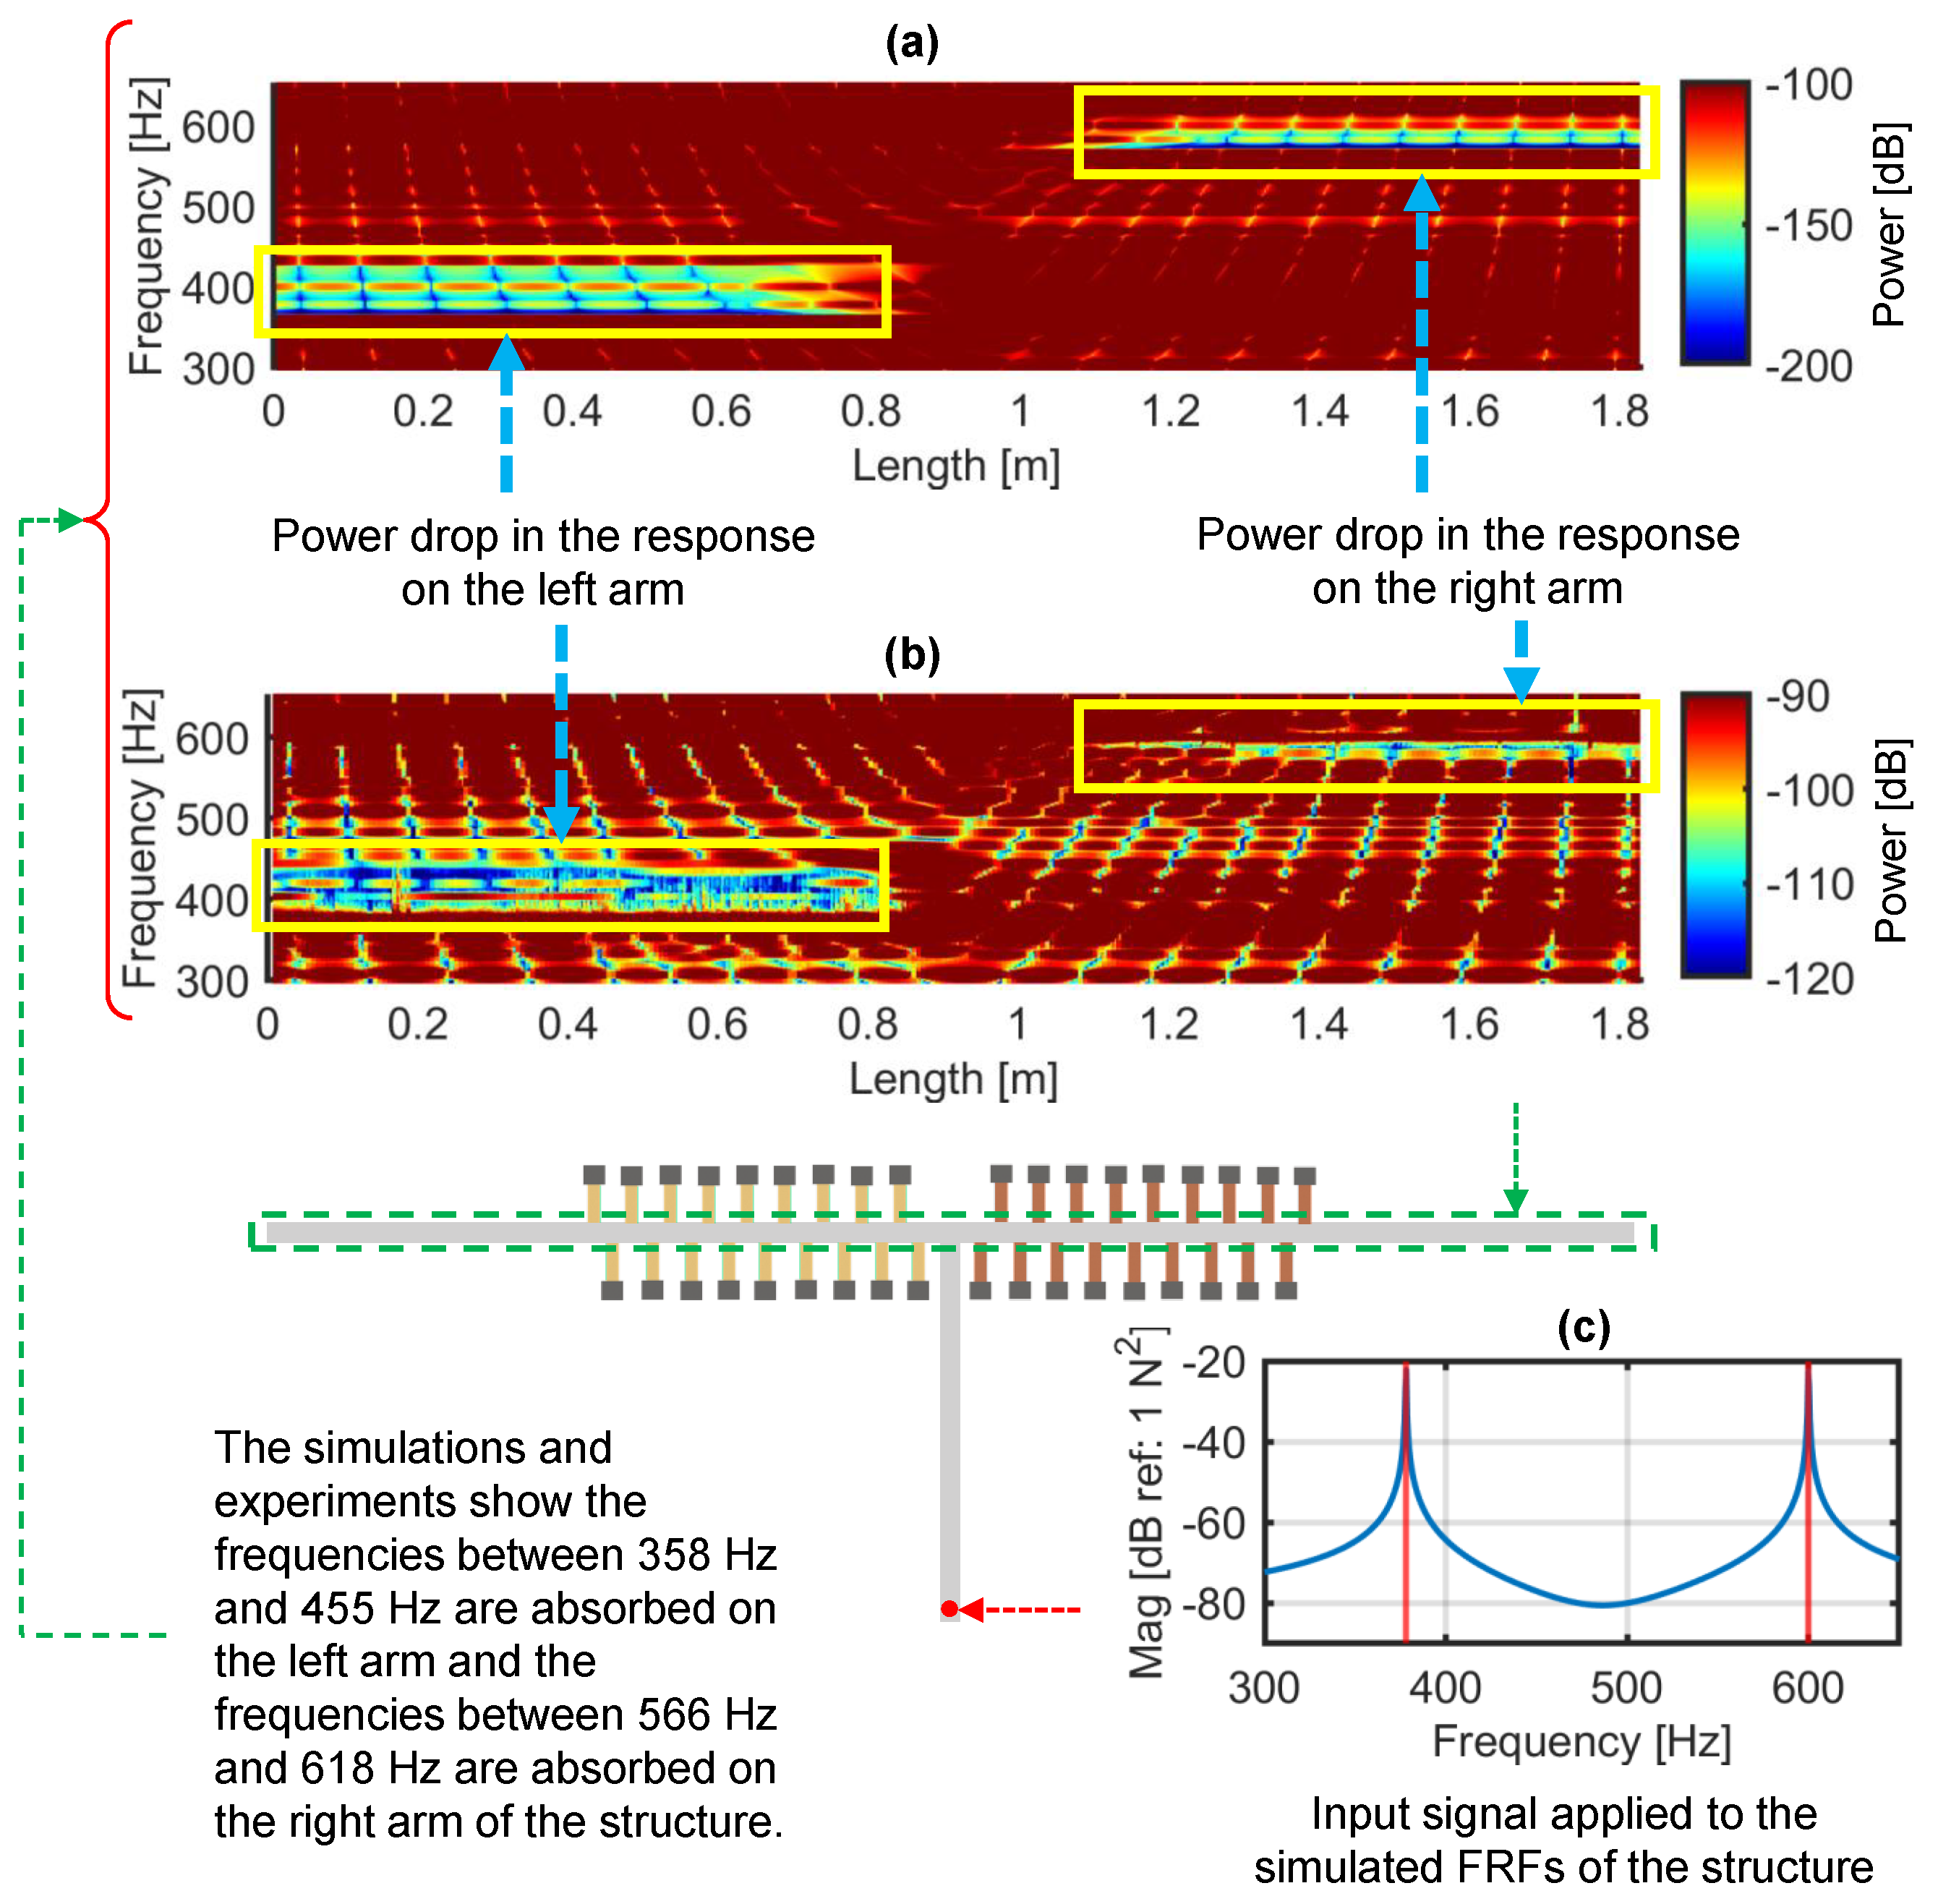
The host T-beam was augmented with dynamic vibration resonators (DVRs) in this study. Specifically, 18 DVRs of type “A” were attached to the left arm of the T-beam, while 18 DVRs of type “B” were attached to the right arm, as depicted in Figure 9. A force was applied to the bottom stem of the host structure to analyze the behavior of the T-beam with DVRs. FRFs were then calculated at each node of the T-beam. Experimental measurements were also performed on the T-beam with DVRs attached, and the resulting FRFs were compared to assess the presence of a bandgap, as illustrated in Figure 9.

3.2. Experimental Validation of T-Beam with DVRs

The T-beam structure used in this study was manufactured by welding two aluminum beams with specific cross sections, as shown in Figure 8. The dynamic vibration resonators (DVRs) were then attached to the T-beam structure following the configuration shown in Figure 9.
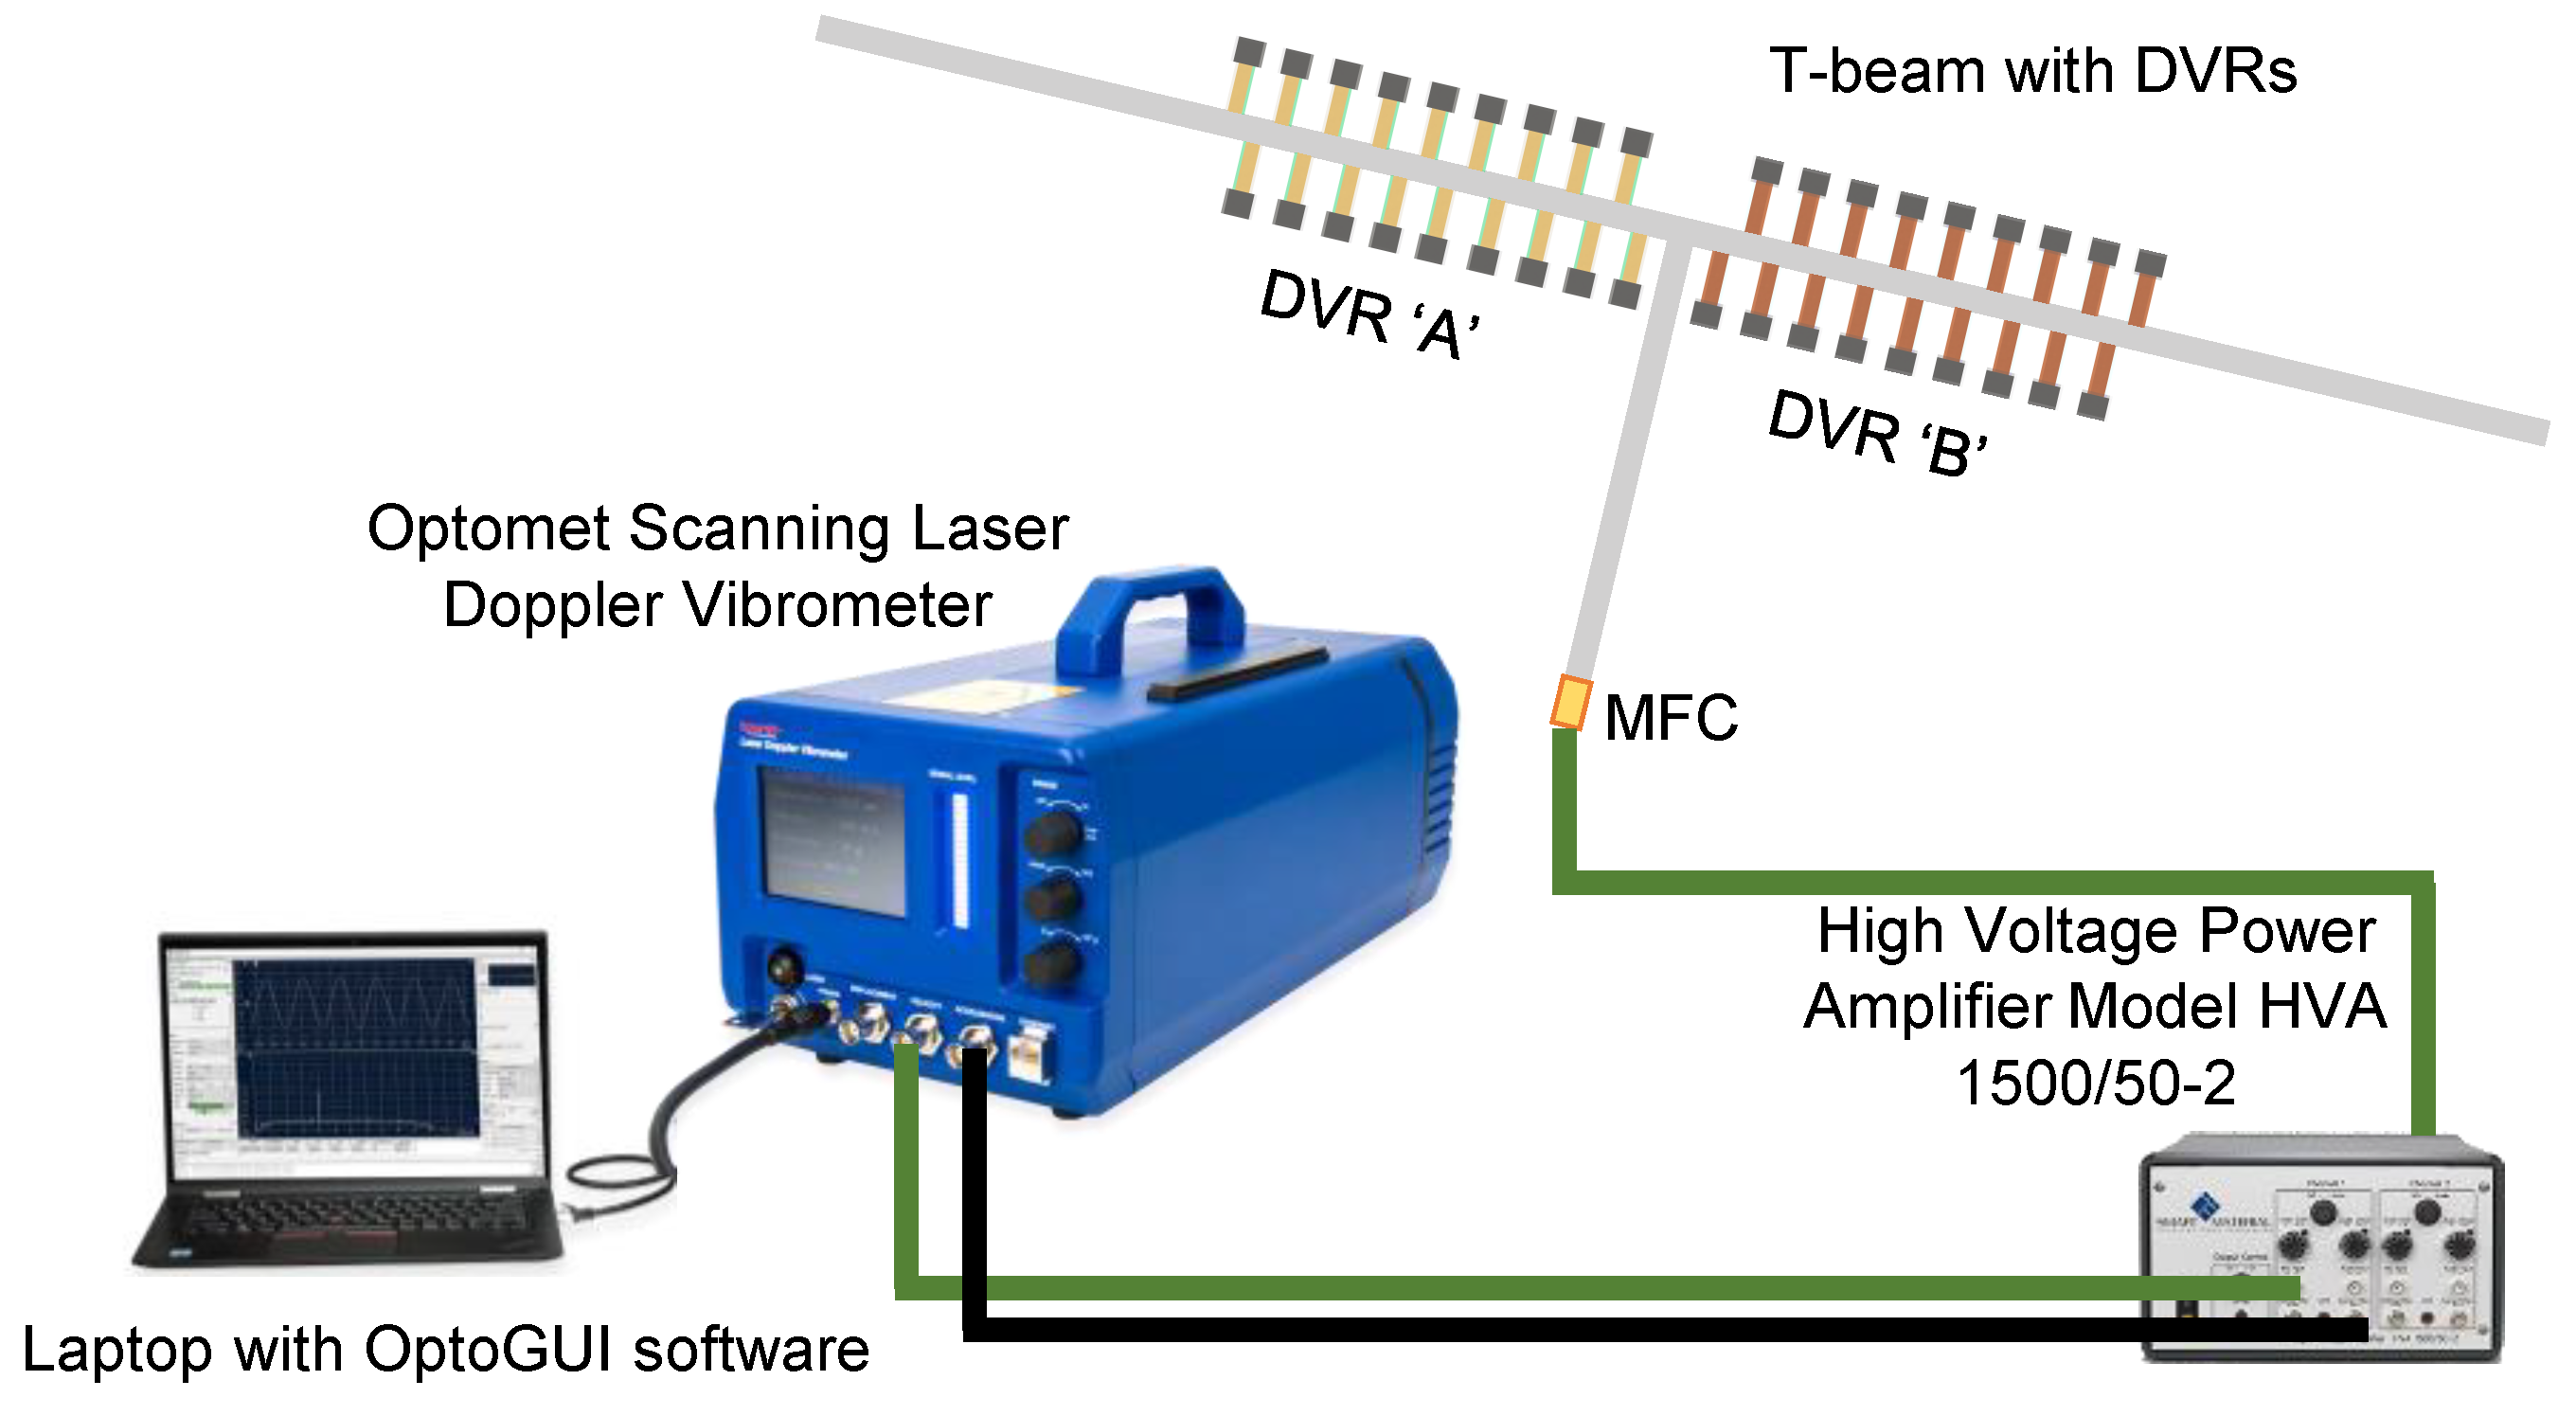
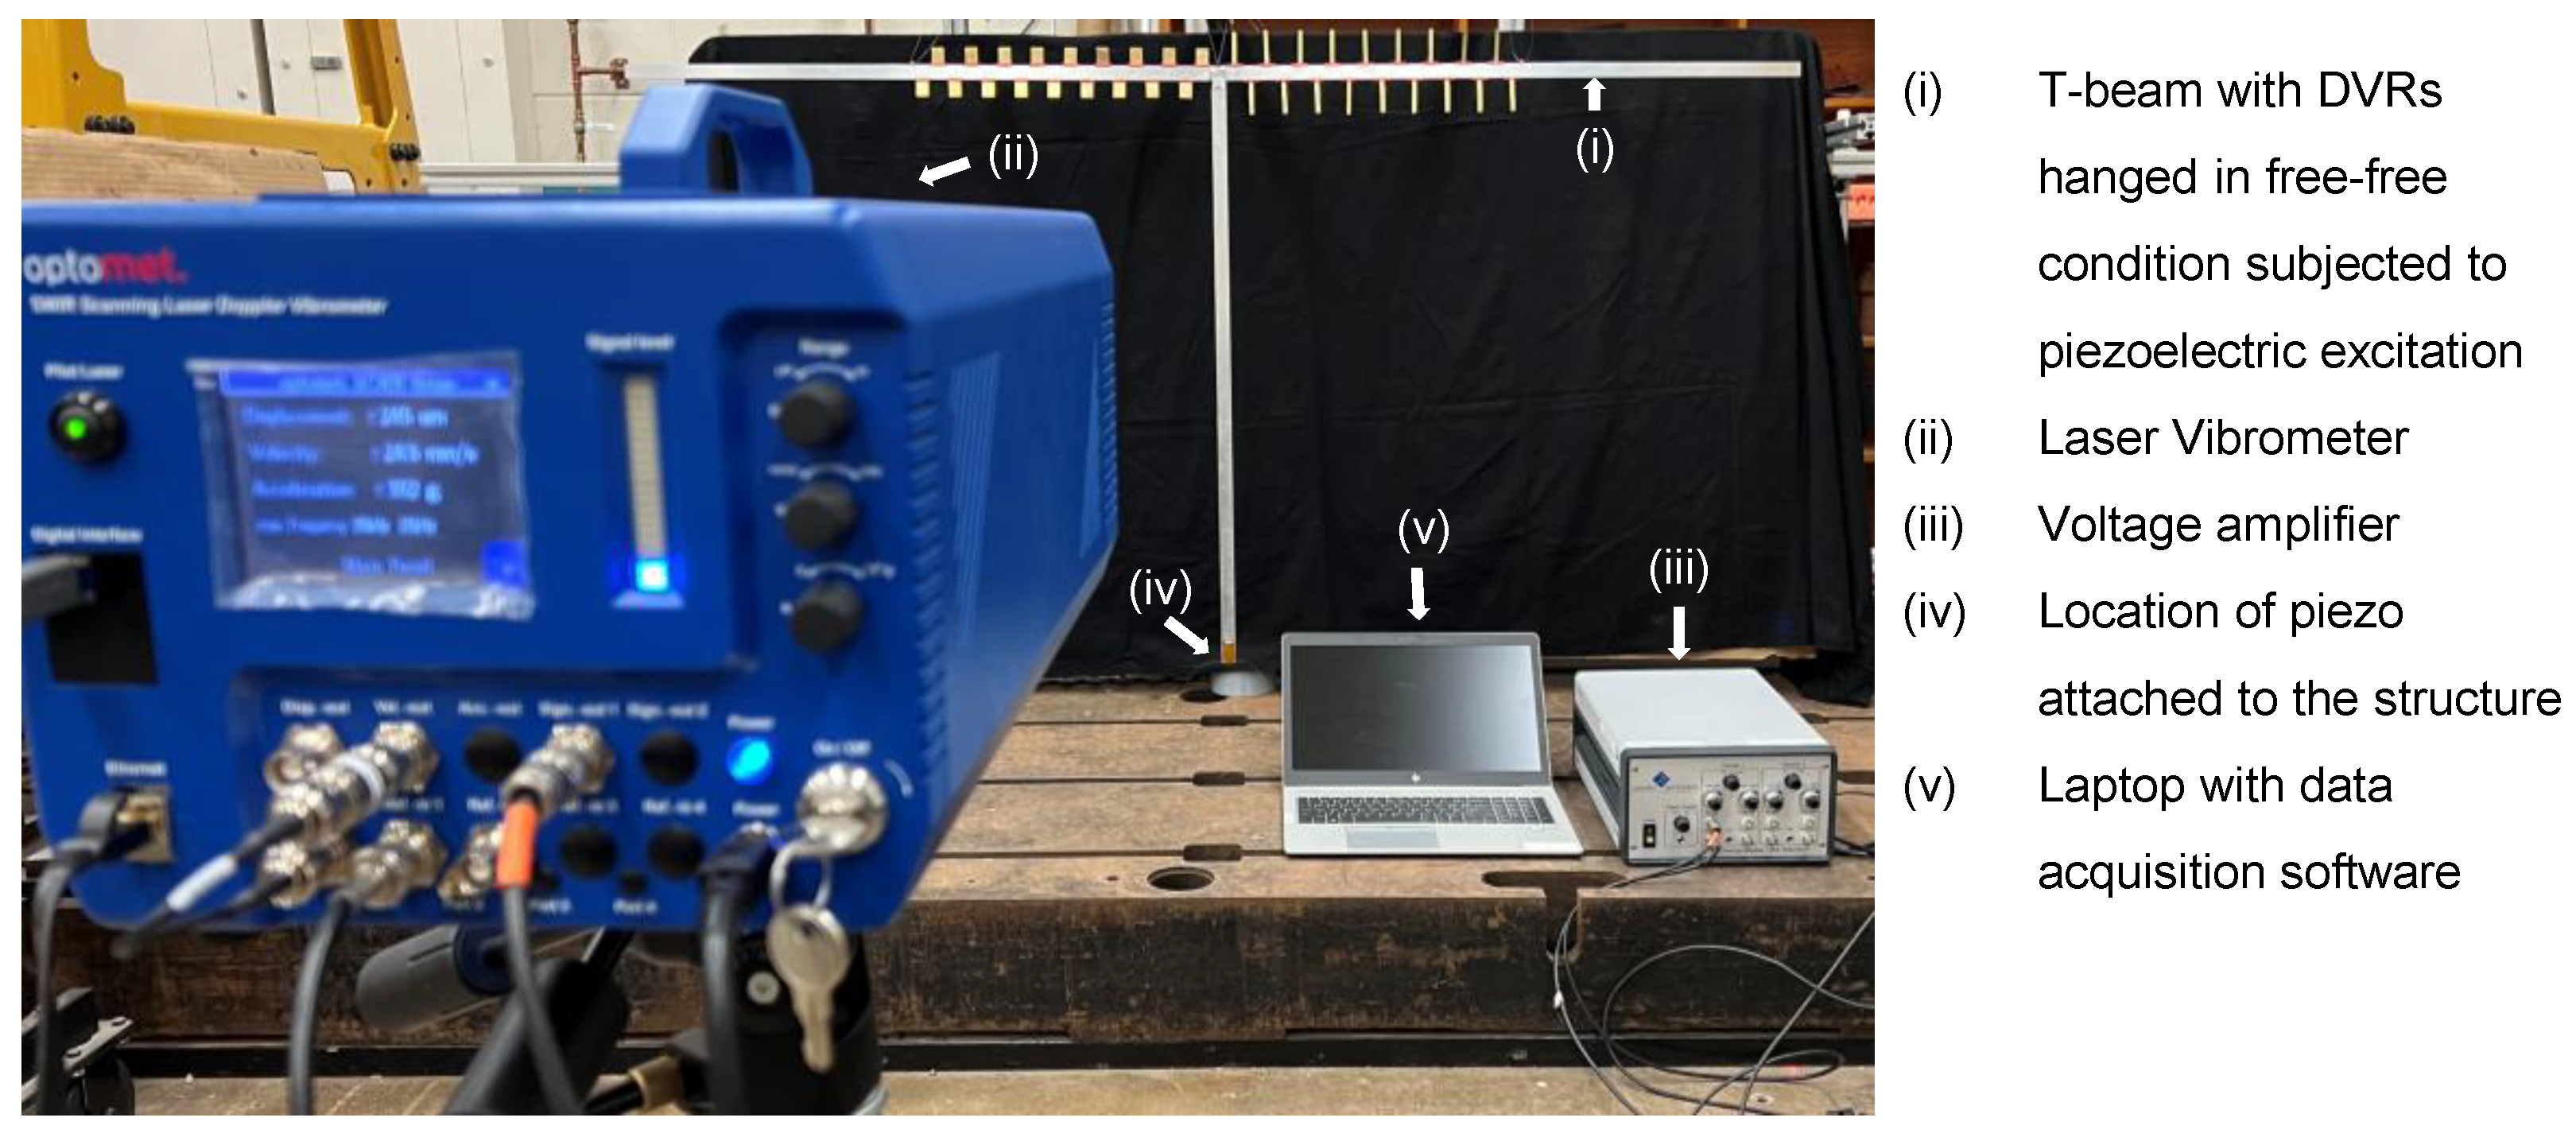
For experimental testing, the T-beam structure was suspended using fishing lines, achieving free–free boundary conditions. Chirp excitation was applied to the bottom of the structure using a macrofiber composite (MFC) with an active area of 25 × 3 mm 2 ( 0.98 × 0.12   inch 2 ). Frequency response functions (FRFs) were measured at 432 equidistant points distributed throughout the structure using a scanning laser-Doppler vibrometer (SLDV). The experimental schematics are shown in Figure 10, and the setup is illustrated in Figure 11. A 45 V voltage chirp signal was applied to the MFC to excite the structure, and the resulting velocity/voltage FRF was measured.
Figure 9a,b show the FRFs at the end of both arms of the T-beam with DVRs. By observing and analyzing these FRFs, different bandgaps could be observed on the end of each arm of the T-beam. On the left arm, the bandgap existed from 358 Hz to 455 Hz ; on the right arm, the bandgap existed from 566 Hz to 618 Hz . Hence, it was evident from the simulated and experimental FRFs that selective frequencies could be absorbed in different parts of the same structure.

3.3. Estimation of Absorption Coefficients on Each Arm of the T-Beam

To analyze the behavior of the T-beam structure with DVRs, FRFs at 24 equidistant locations were selected from the complete test on each arm of the T-beam. The first FRF point on the left arm was calculated 12 inches away from the free end, and subsequent points were spaced at 0.25 inch intervals, resulting in a total of 24 measurements from 12 inches to 17.75 inches away from the free end of the arm. The same procedure was followed for the right arm, resulting in 24 equidistant FRF measurements.
Using the methodology described in Section 2.3.7, transmission and absorption coefficients were calculated for each arm of the T-beam structure. Figure 9c,d show the transmission coefficients for the left and right arms, respectively, and Figure 9e,f show the absorption coefficients for the left and right arms, respectively. It can be observed that the absorption coefficients exhibited a significant drop at frequencies within the bandgap region of each arm, indicating the absorption of energy in those frequency ranges.
It is interesting to note that when the excitation was provided between the two metastructures, the absorption of energy appeared to be independent between the left and right arms. This means that the frequency response functions (FRFs) and absorption coefficients primarily showed changes in energy within their respective bandgap regions, without significant influence from the other arm of the T-beam structure.

Power Absorbed by Each DVR in Selective Bandgaps

In the FE model of the T-beam structure attached with DVRs, a study was conducted to assess the power absorbed by each DVR within the bandgap regions of each arm. The input chirp signal was applied at the location of excitation in the FE model, as depicted in Figure 12c, and the Power Spectral Densities (PSDs) of the 18 “A” DVRs on the left arm and 18 “B” DVRs on the right arm were calculated.
To determine the total PSD P n absorbed by the nth DVR in the left arm of the T-beam, Equation (21) was utilized. The results are shown in Figure 12a. Similarly, the total PSD P n absorbed by the n th DVR in the right arm of the T-beam is shown in Figure 12b. These figures provide insight into the amount of power absorbed by each DVR within their respective bandgap regions on each arm of the T-beam structure.
Hence, on each arm of the T-beam, as the number of DVRs increased, the total PSD absorbed by each DVR decreased in their respective bandgap regions.

4. Selective Frequency Transmission in the T-Beam

To confirm the existence of distinct bandgaps at each end of the T-beam structure, a vibration response profile was simulated using MATLAB. Two modulated sine waves were chosen randomly, with frequencies falling within the identified bandgaps [358 Hz to 455 Hz ] and [566 Hz to 618 Hz ]. Specifically, frequencies of 378 Hz and 600 Hz were used as representative frequencies based on the bandgap regions observed in Figure 9. These frequencies corresponded to the left and right arms of the T-beam, respectively.
The simulated signal was then applied as input in the FE model of the T-beam structure with DVRs. Response powers were calculated throughout the horizontal part of the T-beam, and results are plotted in Figure 13a. It can be observed from the figure that the energy at 378 Hz from the dual-frequency input signal was absorbed, while the energy at 600 Hz was transmitted to the left arm of the T-beam. Similarly, the energy at 600 Hz was absorbed, and the energy at 378 Hz was transmitted to the right arm of the T-beam. This analysis confirmed that each arm of the T-beam exhibited selective absorption and transmission of specific frequency components within their respective bandgap regions.
Similarly, the simulated input signal was applied to the experimentally measured FRFs, and the response autopower was calculated throughout the horizontal part of the T-beam, as shown in Figure 13b. It can be observed that the energy corresponding to 378 Hz was absorbed in the left arm, while the energy corresponding to 600 Hz was absorbed in the right arm of the T-beam. This further confirmed that it was possible to transmit and absorb different frequencies in different parts of the same structure. The results demonstrated the selective frequency response of the T-beam with DVRs, validating the concept of bandgap engineering for vibration attenuation.

4.1. Wave Propagation at 378 Hz and 600 Hz

4.1.1. Simulation

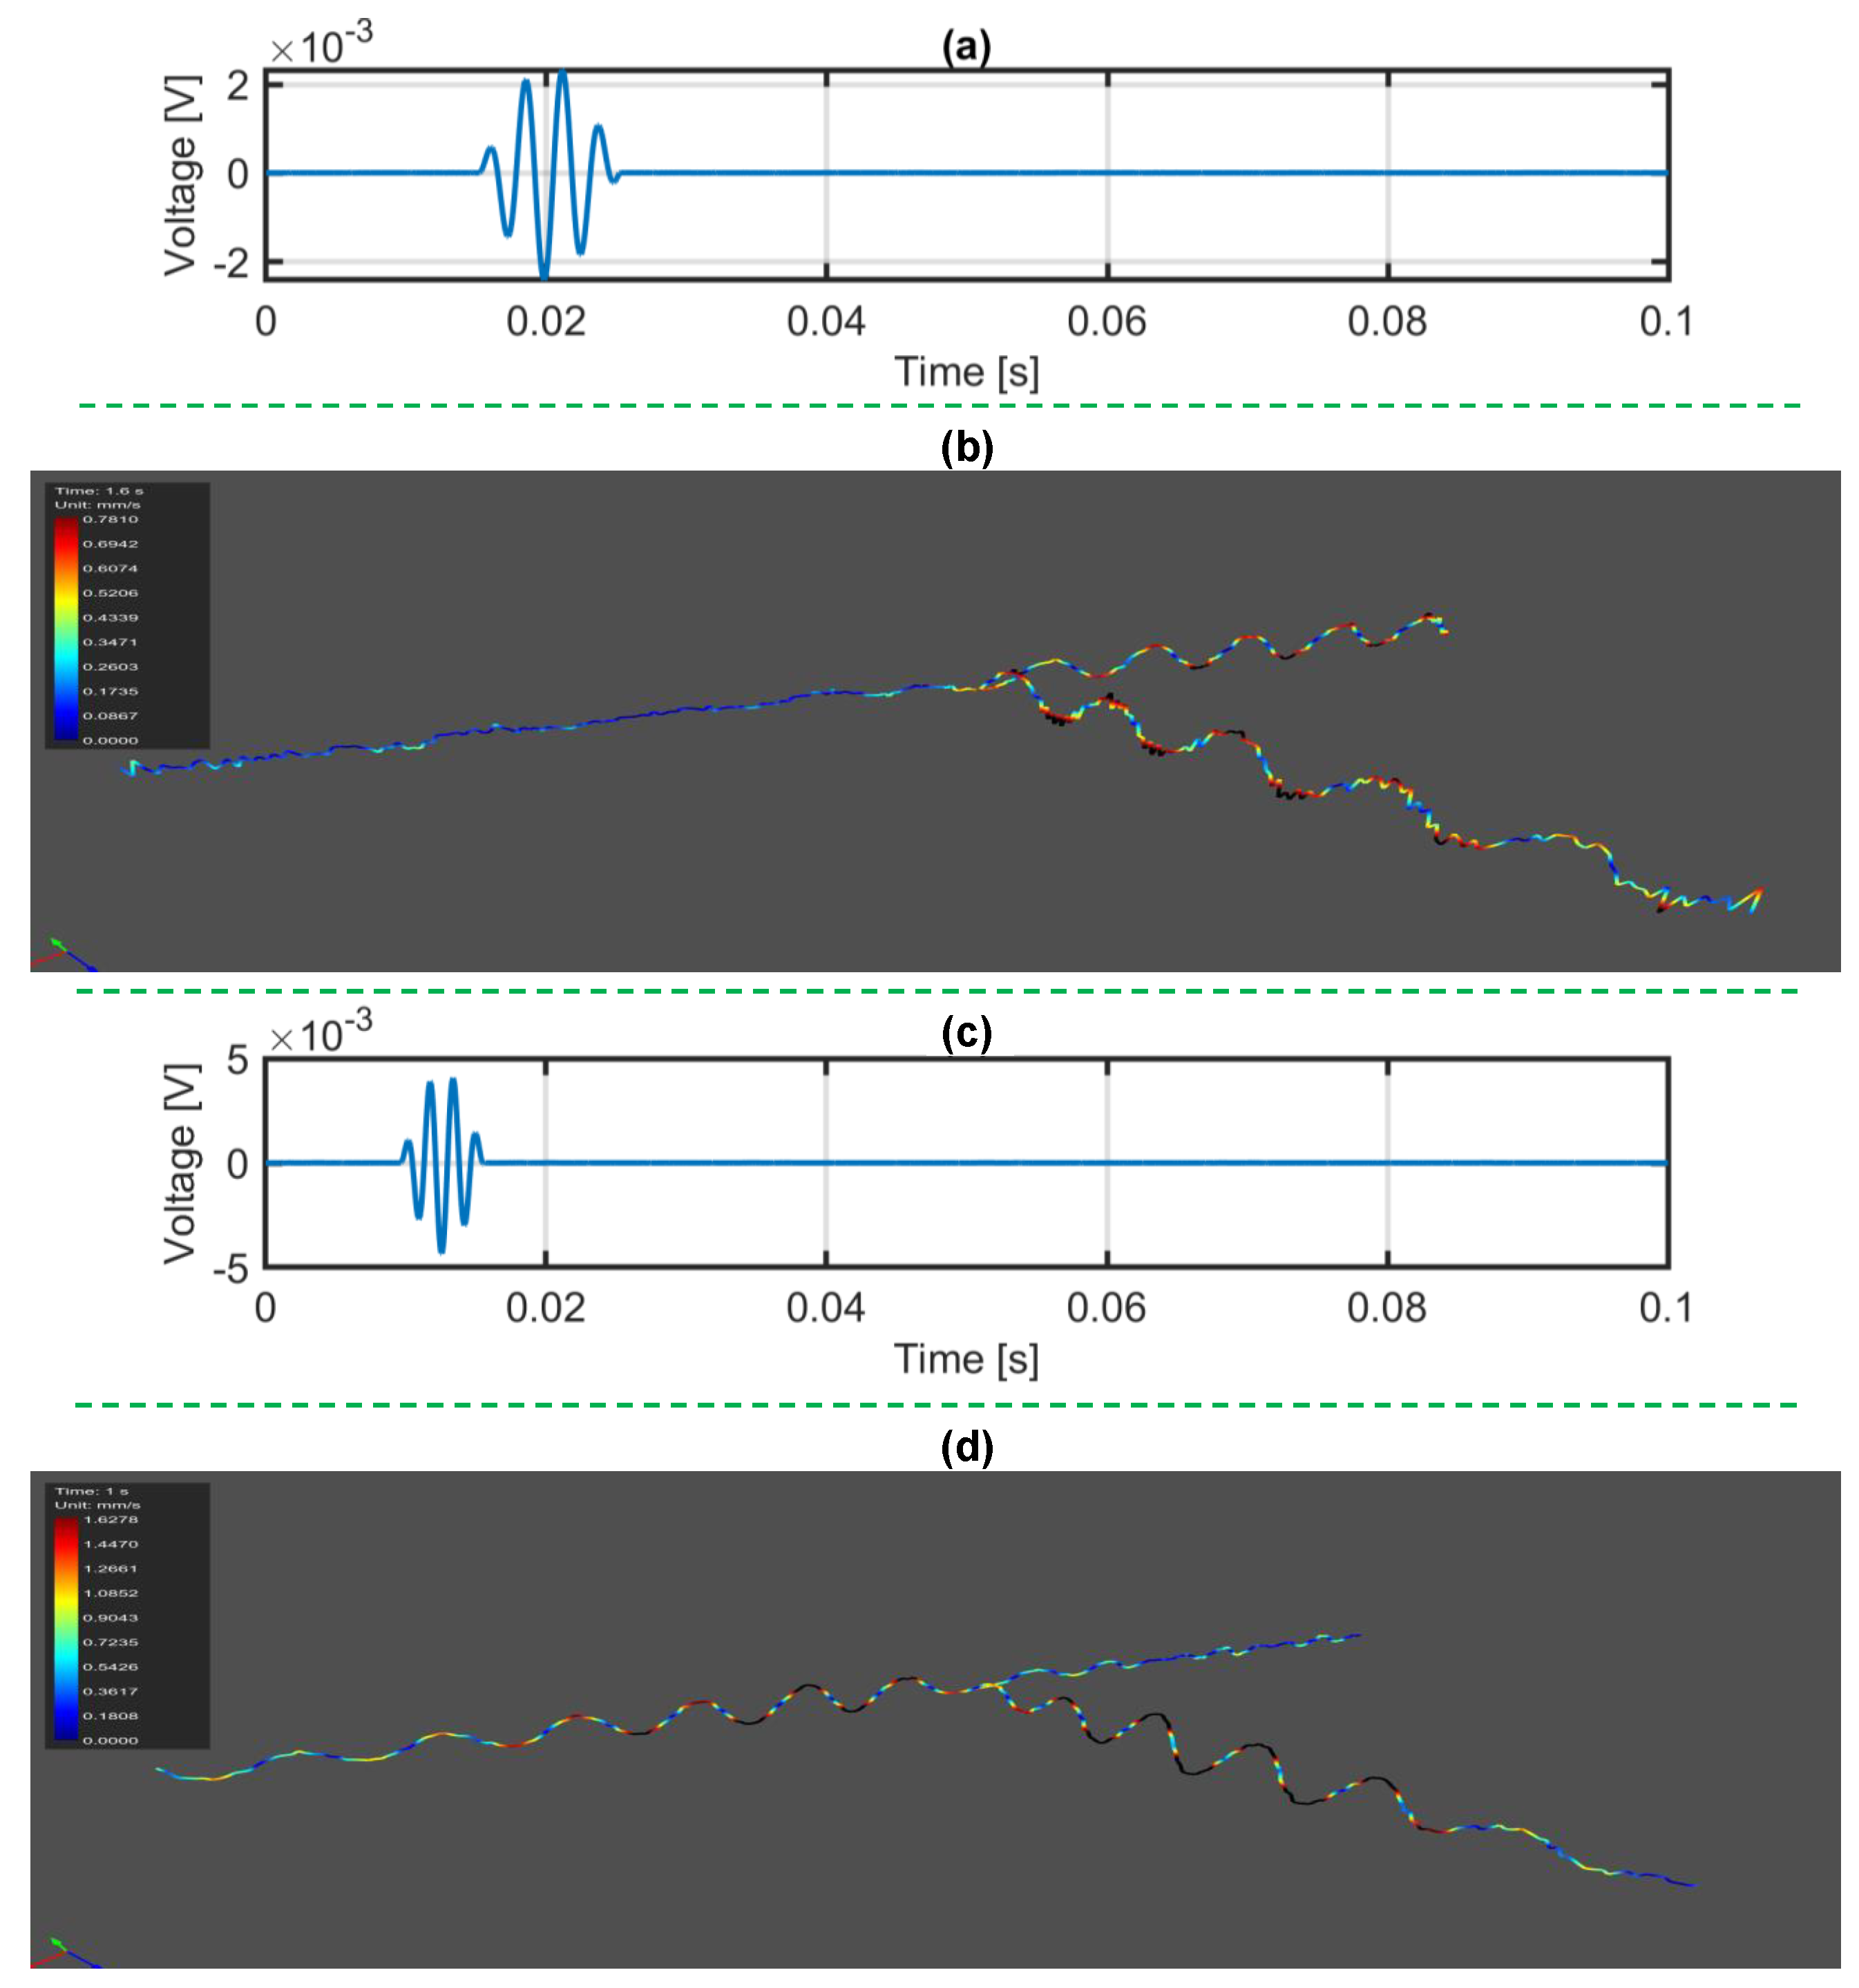
Furthermore, to visualize the real-time wave propagation of different frequencies in the structure, a modulated sine wave signal at 378 Hz, as shown in Figure 14a, was simulated as input in MATLAB and applied to the FE model. The response was calculated at each node of the FE model, and a time animation was created to visualize the transmission of the signal in the structure. From Supplementary Animation (a), it can be observed that the modulated sine wave propagated from the input node until it reached the intersection, where it continued to propagate in the right arm, while the wave propagation in the left arm was inhibited. Figure 14b shows one of the time stamps, illustrating the absorbed input wave in the left arm.
Similarly, a modulated sine wave signal at 600 Hz, as shown in Figure 14c, was simulated and applied to the FE model. Supplementary Animation (b) shows the propagation of the modulated sine wave from the input node to the left arm, inhibiting the propagation of the wave in the right arm. Figure 14d shows one of the time stamps where the 600 Hz modulated sine input was inhibited in the right arm.
These simulations provide visual evidence of the selective transmission and absorption of different frequencies in different parts of the T-beam structure, further supporting the concept of bandgap engineering for vibration attenuation.

4.1.2. Experiments

Experiments were conducted to validate and visualize the propagation of the real-time wave in the T-beam structure with DVRs. A programmed modulated sine wave signal tuned to 378 Hz, as shown in Figure 15a, was applied to the manufactured T-beam with DVRs using an MFC. The time response was measured at 432 equidistant points spread across the entire structure using an SLDV. The captured data were then animated to visualize the wave propagation in the structure. Figure 15b shows the experimental response of the structure at one of the time stamps, illustrating the wave transmitted in the right arm and the wave inhibited in the left arm.
Similarly, a programmed modulated sine wave signal tuned to 600 Hz, as shown in Figure 15c, was applied to the T-beam structure using the MFC. The time animation of the experimental responses for this signal shows the wave propagation and the selective inhibition of wave transmission in the right arm, as shown in Figure 15d.
These experiments provide empirical evidence for the selective transmission and absorption of different frequencies in different parts of the T-beam structure.
From Supplementary Animation (c) and Figure 15b, it is evident that the wave propagated through the right arm and the wave was attenuated in the left arm; and from Supplementary Animation (d) and Figure 15d, the wave propagated through the left arm and was absorbed in the right arm.

5. Basilar Membrane-Inspired Mechanical Spectrum Analyzer

In order to exploit the selective absorption of frequencies in different parts of the same structure, a long beam was considered. The dimensions of the beam are provided in Table 3. The beam was equipped with four different single-degree-of-freedom (SDOF) dynamic vibration absorbers (DVRs) denoted as “A”, “B”, “C”, and “D”, each tuned to a specific natural frequency as listed in Table 4. These DVRs were distributed into four sets, each set consisting of 18 DVRs. Set 1 comprised 18 “A” DVRs, Set 2 had 18 “B” DVRs, Set 3 consisted of 18 “C” DVRs, and Set 4 was composed of 18 “D” DVRs. The objective of this study was to analyze the bandgap generated by each metastructure individually and then to assemble them. This allowed us to understand the frequency regions that were effectively attenuated by the metastructures and their corresponding absorption coefficients.
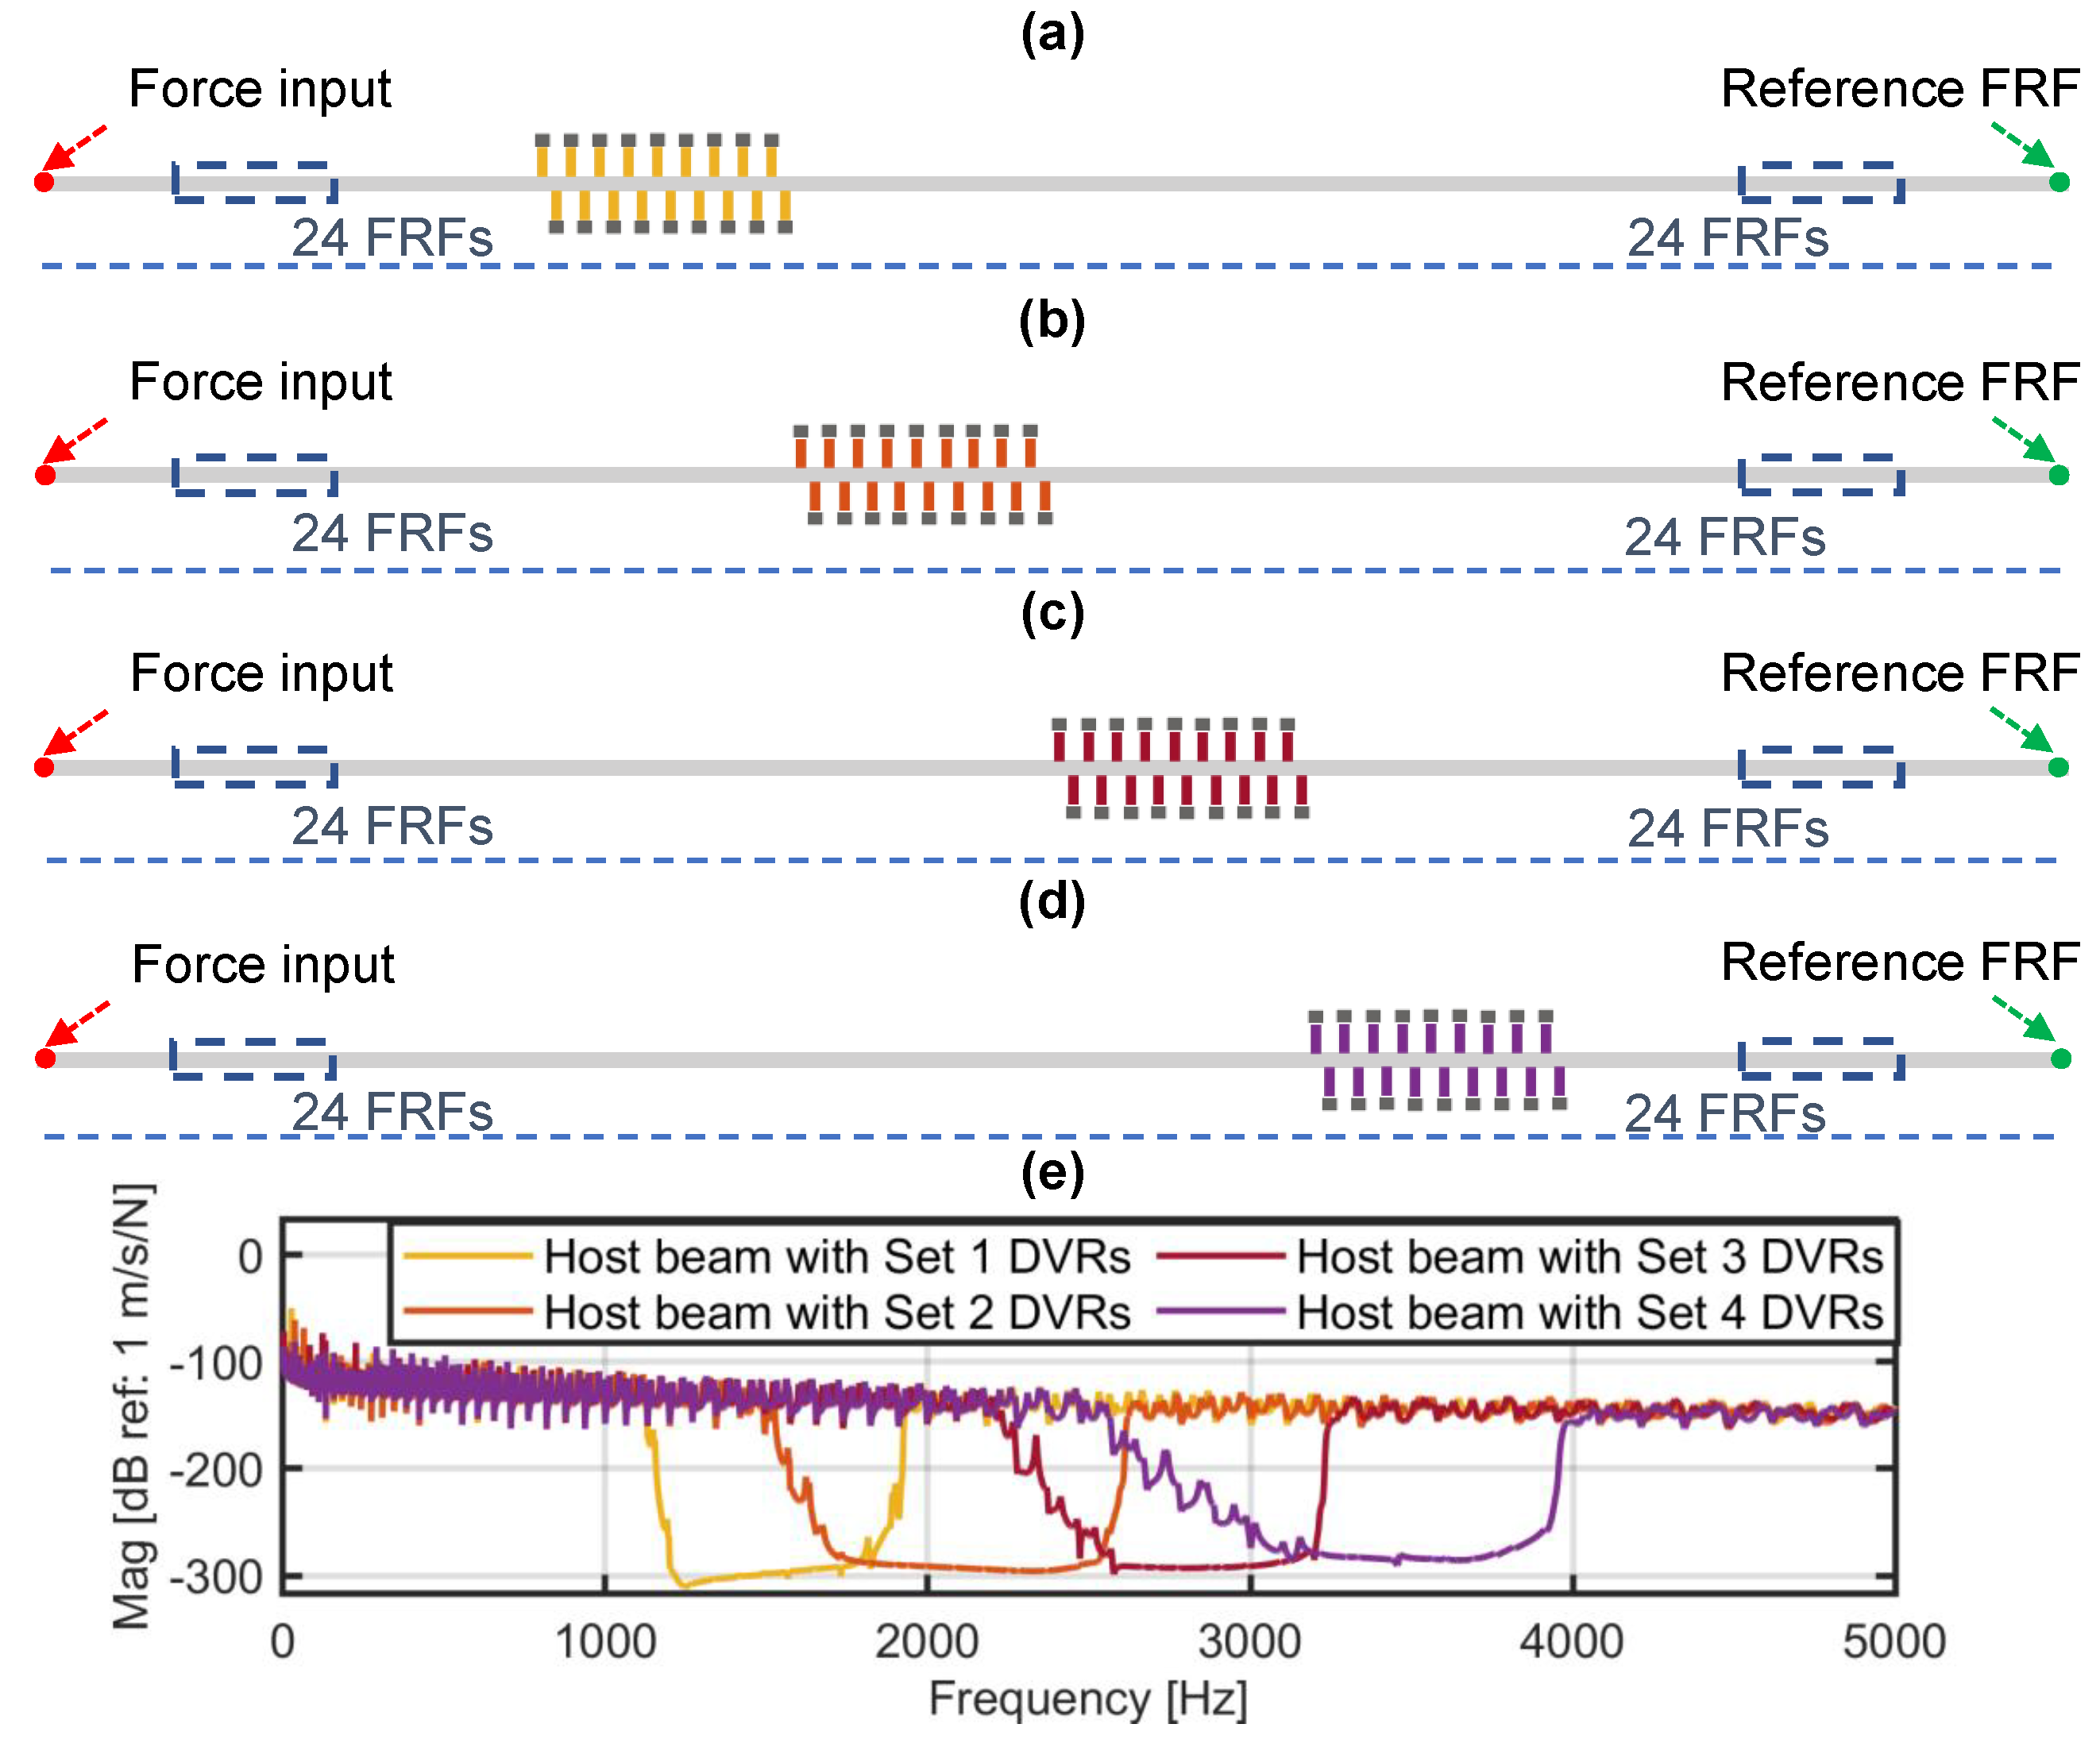
To develop the finite element (FE) model of the host beam, the equations described in Section 2.1 were utilized. Set 1 DVRs were attached to the host beam, spanning from a distance of 1828 mm (72 inches) to 2286 mm (90 inches) from the free end, as depicted in Figure 16a. The spacing between each DVR in Set 1 was 25.4 mm (1 inch). To analyze the frequency response characteristics of the host beam with Set 1 DVRs, a force was applied at the specified location shown in Figure 16a, and the frequency response functions (FRFs) were measured and calculated at each node of the host beam. The response measured at the rightmost node of the host beam is illustrated in Figure 16e. From the FRF, it was evident that there was a bandgap in the frequency range of 1130 Hz to 1925 Hz.
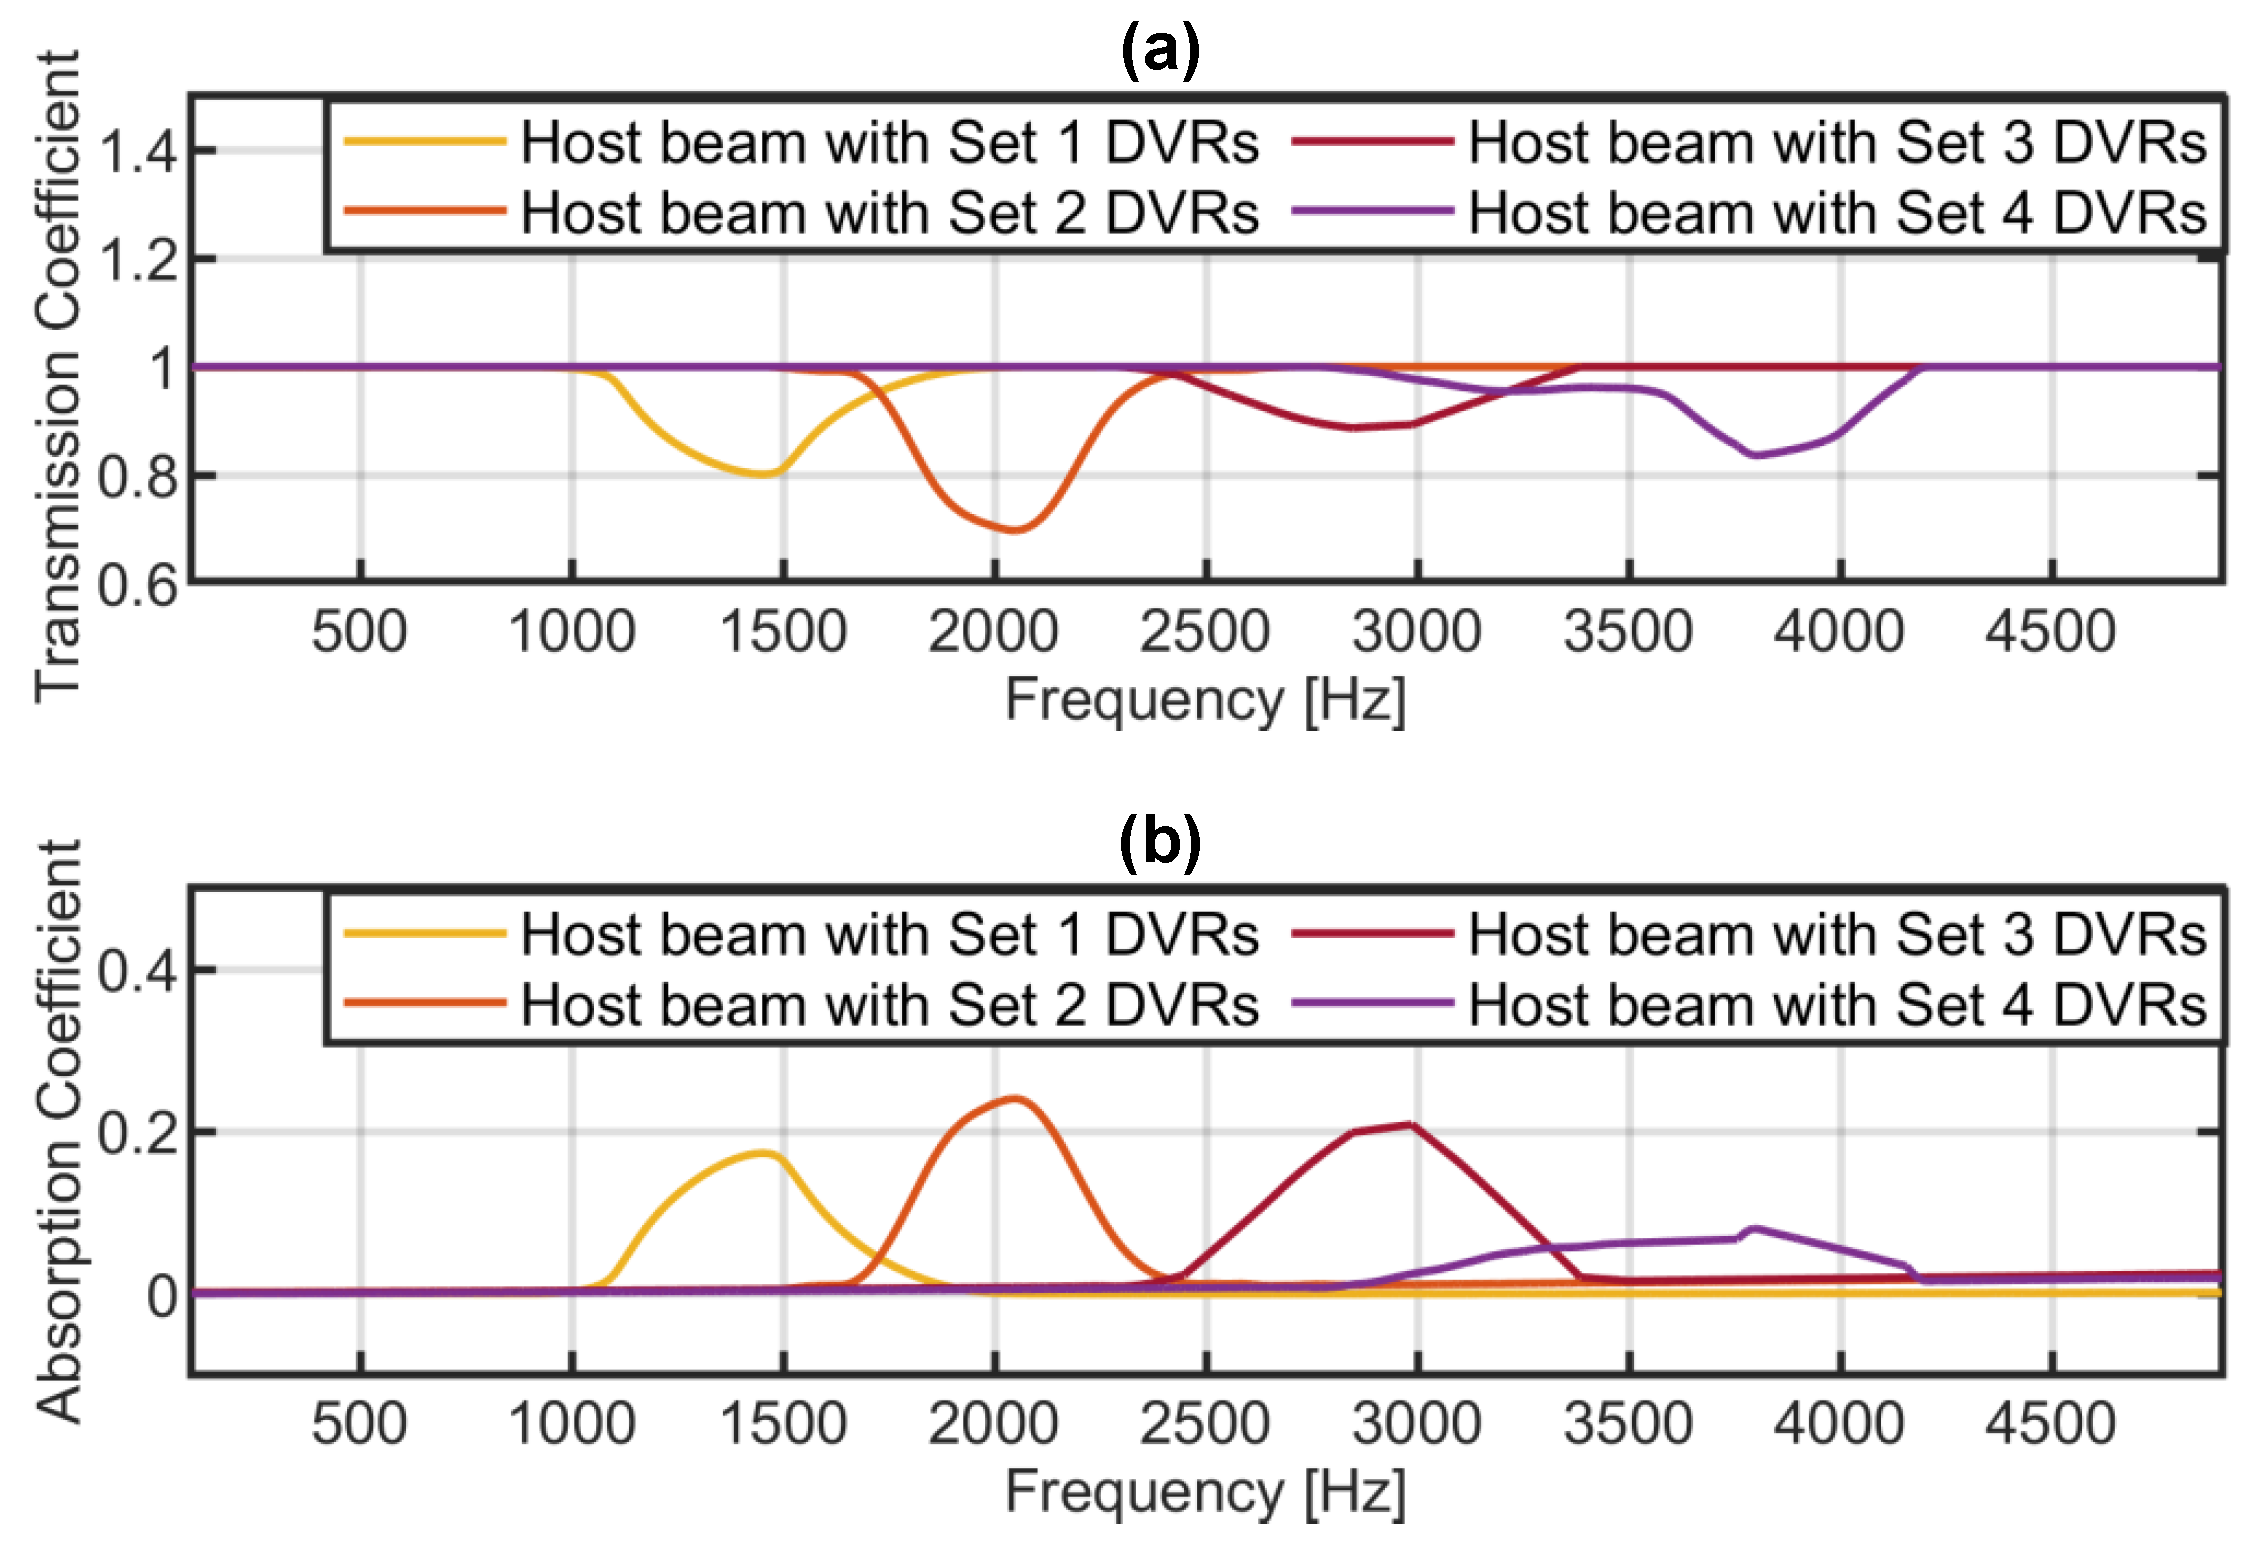
Similarly, different sets of DVRs were individually attached to the host beam. Each set generated a specific bandgap. The FRFs measured at the rightmost node of the structure confirmed the presence of these bandgaps. The location, the bandgap start frequency, and the end frequency are summarized in Table 5. Absorption coefficients were calculated for each set of DVRs individually attached to the structure. The FRFs were measured at 24 equidistant locations before and after the DVRs along the structure by applying the excitation force at the leftmost node. The transmission and absorption coefficients were then calculated using the methodology described in Section 2.3.7. The results are shown in Figure 17, indicating the absorption of energy within the respective bandgap frequencies generated by each set of DVRs. It is important to note that there was some overlap in the bandgap regions when selecting the four types of DVRs.
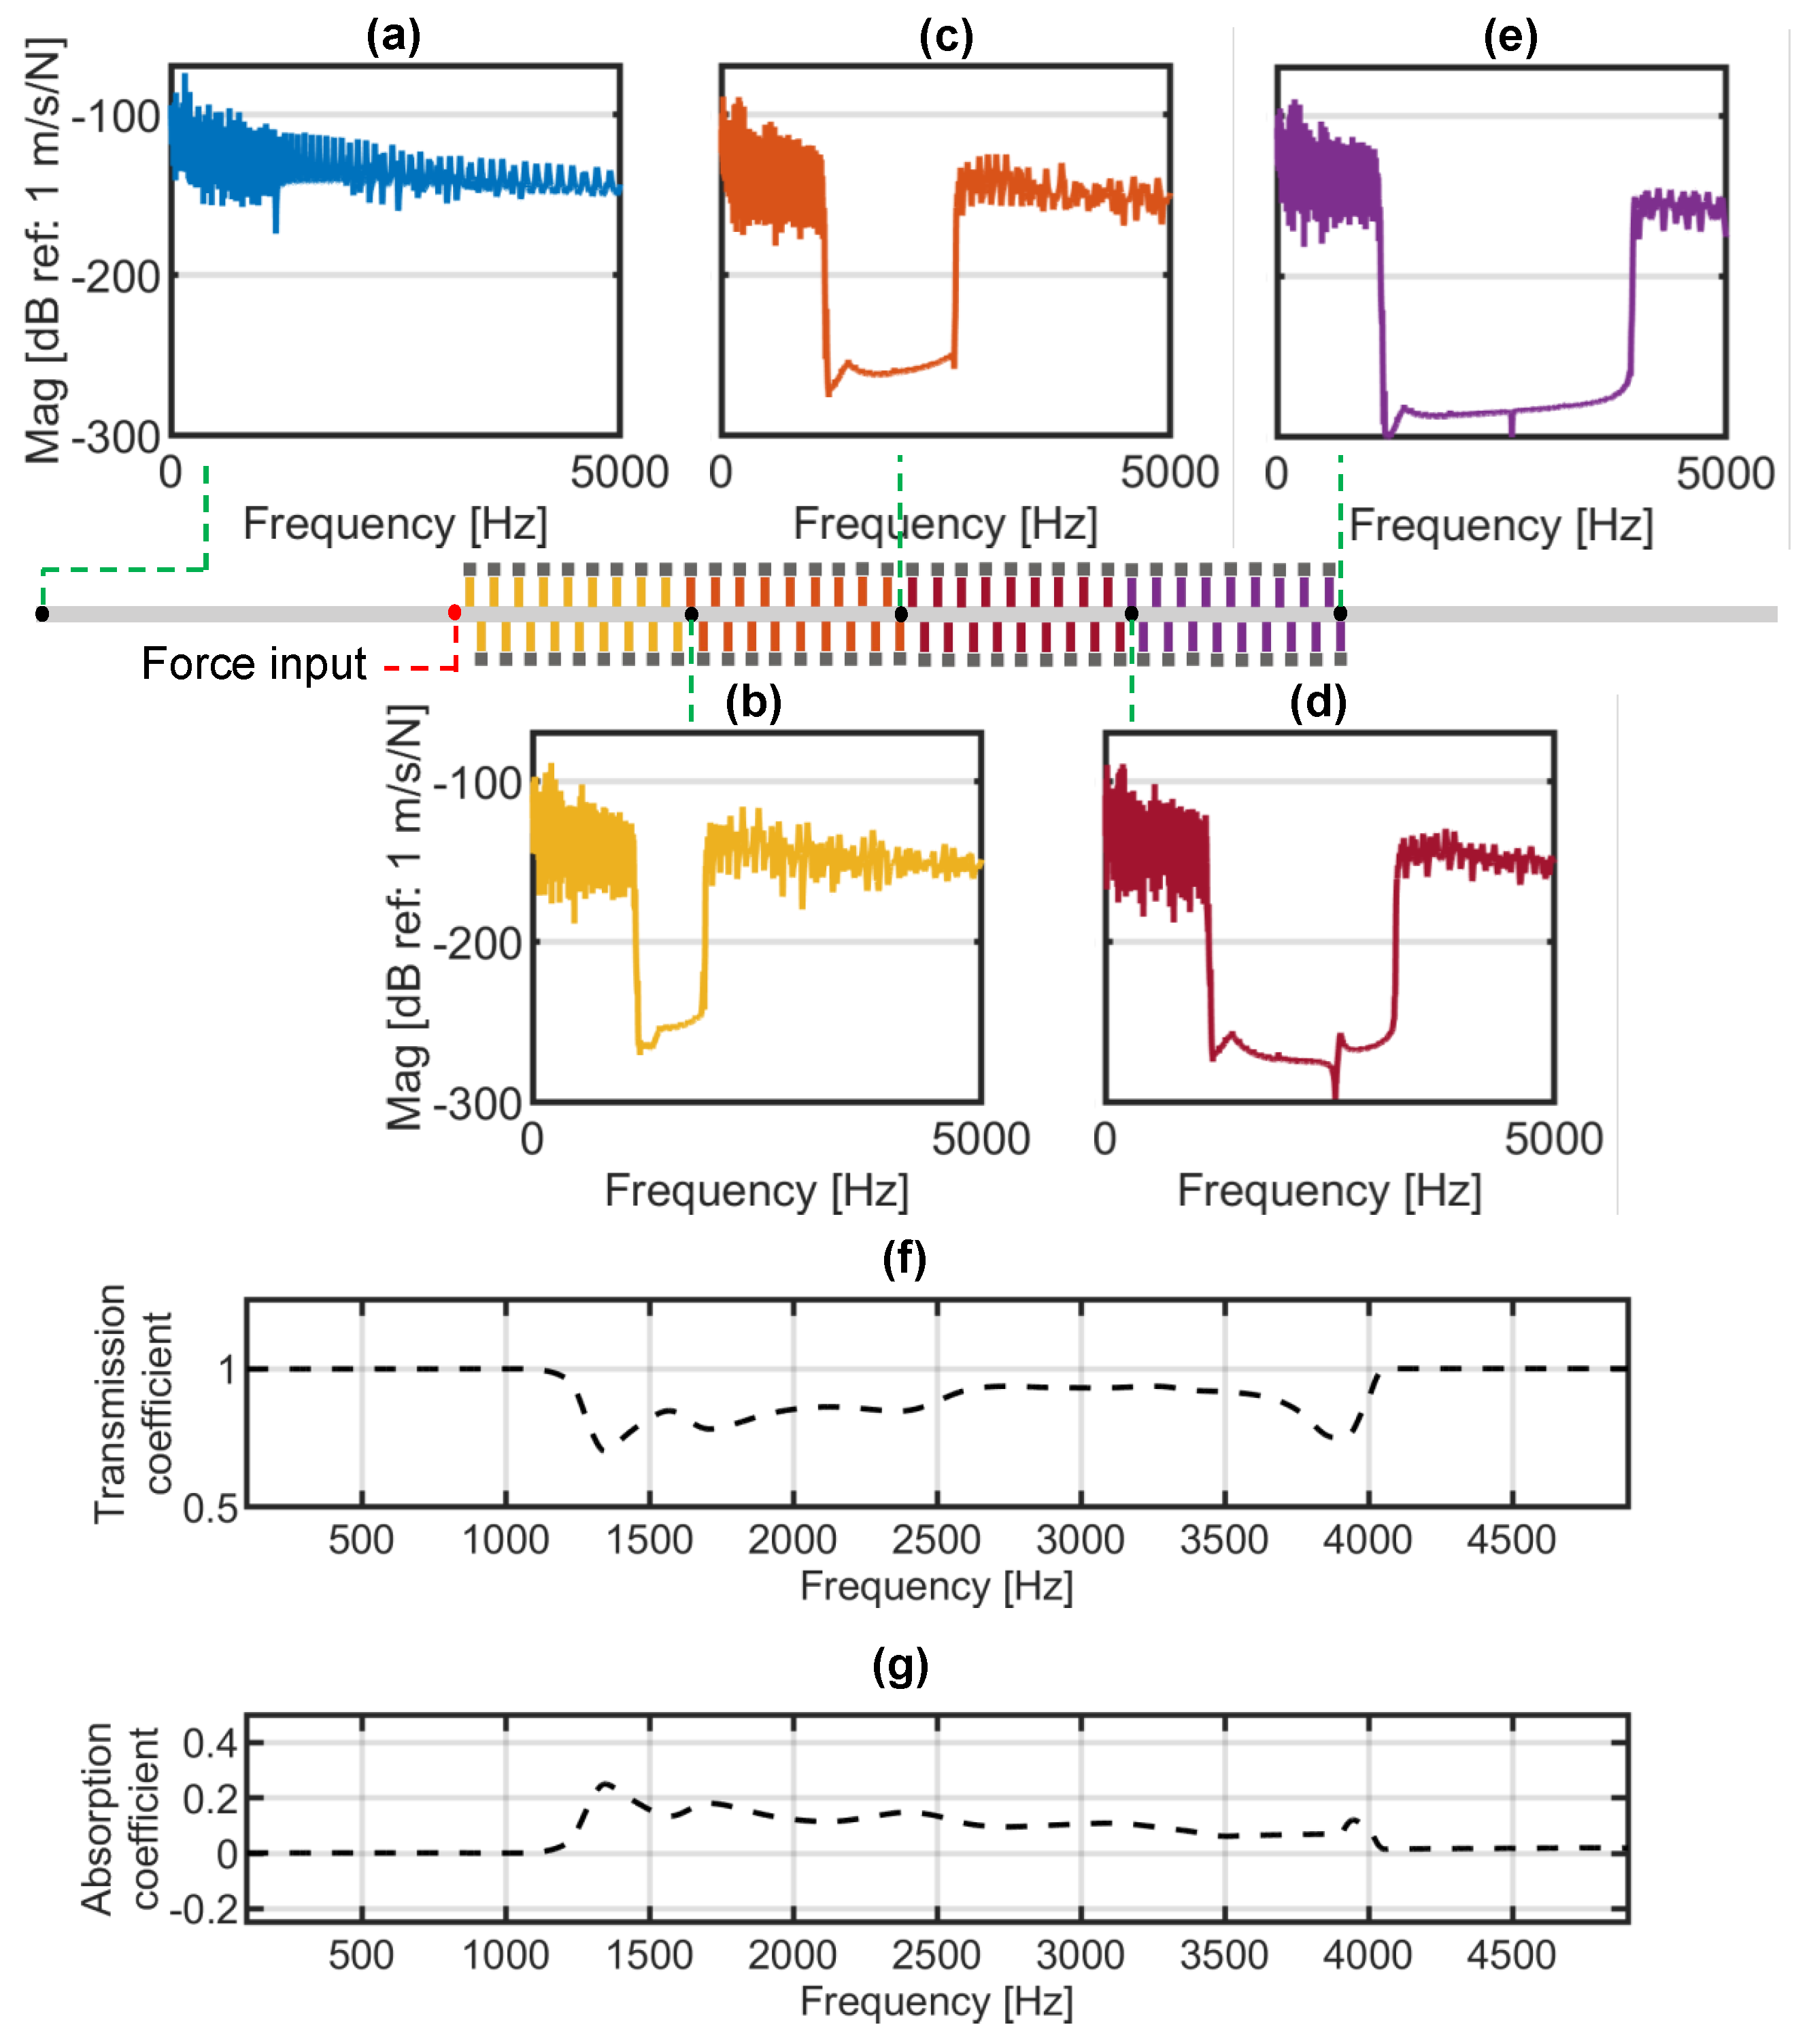
To test the ability to filter certain frequencies in the structure and transmit the desired frequencies forward, all four sets of DVRs were attached to the host beam in the FE model. A force was applied at a specific location, and FRFs were calculated at the nodes after each set of DVRs, as shown in Figure 18a–e. It can be seen that as the input signal passed through each set of DVRs, certain frequencies were filtered out, resulting in a narrower spectrum of left-out signal energy. Eventually, when the absorption coefficient was calculated for the entire structure, the energy of the frequencies absorbed within the bandgap range could be visualized, as shown in Figure 18g. This demonstrated the ability of the structure to selectively filter and transmit specific frequencies.
The step-by-step frequency absorption demonstrated in this study highlights the potential for selective frequency filtering in structures. This has implications for applications such as vibration control, noise reduction, and energy harvesting. By manipulating the wave propagation characteristics, specific frequency ranges can be attenuated or transmitted as needed. This concept is reminiscent of the selective vibrational response of the basilar membrane in the inner ear, where specific frequencies of sound waves are processed. Inspired by natural mechanisms such as the basilar membrane, exploring selective frequency filtering in engineered structures can lead to the development of innovative devices and systems for sound processing, signal filtering, and acoustic engineering. Therefore, in this study, we refer to the concept of selective frequency filtering in engineered structures as a “mechanical frequency spectrum analyzer”. Similarly to its counterpart in the auditory system, the mechanical frequency spectrum analyzer enables the absorption or transmission of specific frequency components of waves in engineered structures. By analyzing and manipulating the wave propagation characteristics, this concept provides a valuable tool for separating and controlling different frequency components in various engineering applications.

Power Absorbed by Each DVR in Selective Bandgaps

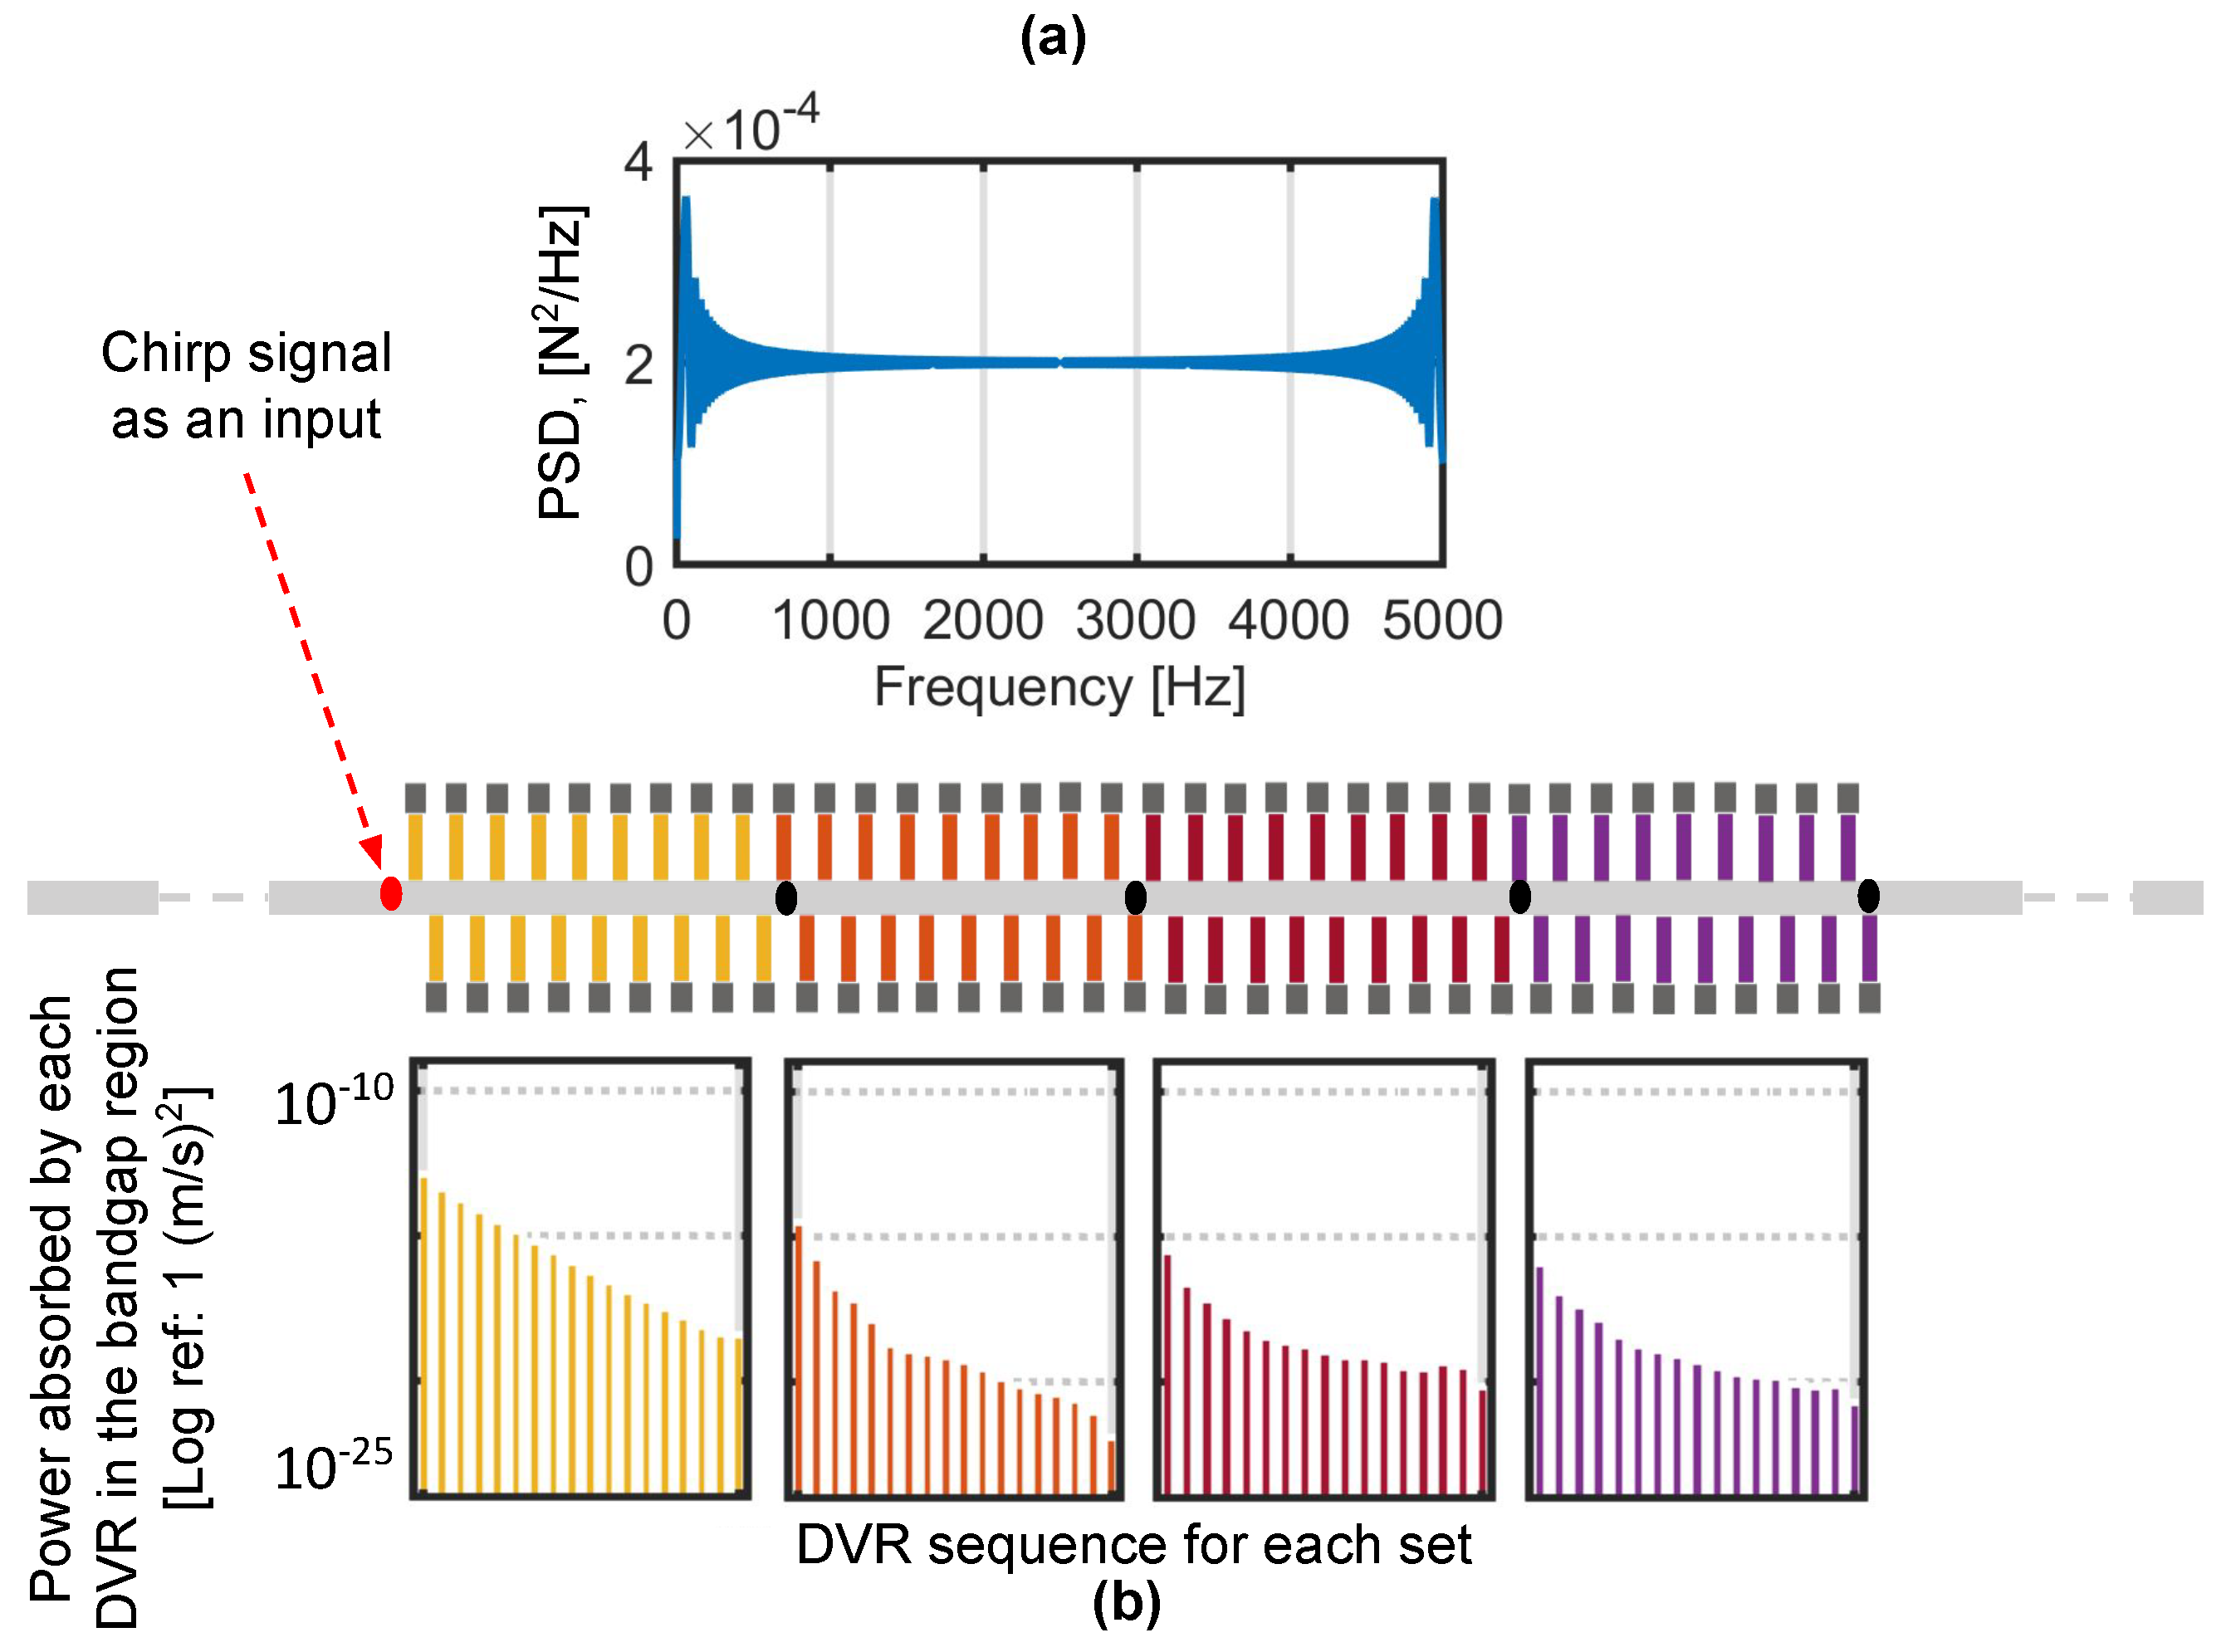
Further, the power absorbed by each DVR in every set was assessed for their respective bandgaps. In the FE model, the input chirp signal was applied at the excitation location as shown in Figure 19a, and the PSDs of all the DVRs in each set were estimated. Using Equation (21), the total PSD P n absorbed in the respective bandgap by each DVR in a set was calculated and is displayed on a logarithmic scale in Figure 19b.

6. Extension of Selective Frequency Transmission in 2D Structures and Future Work

6.1. Selective Frequency Transmission in a T-Plate

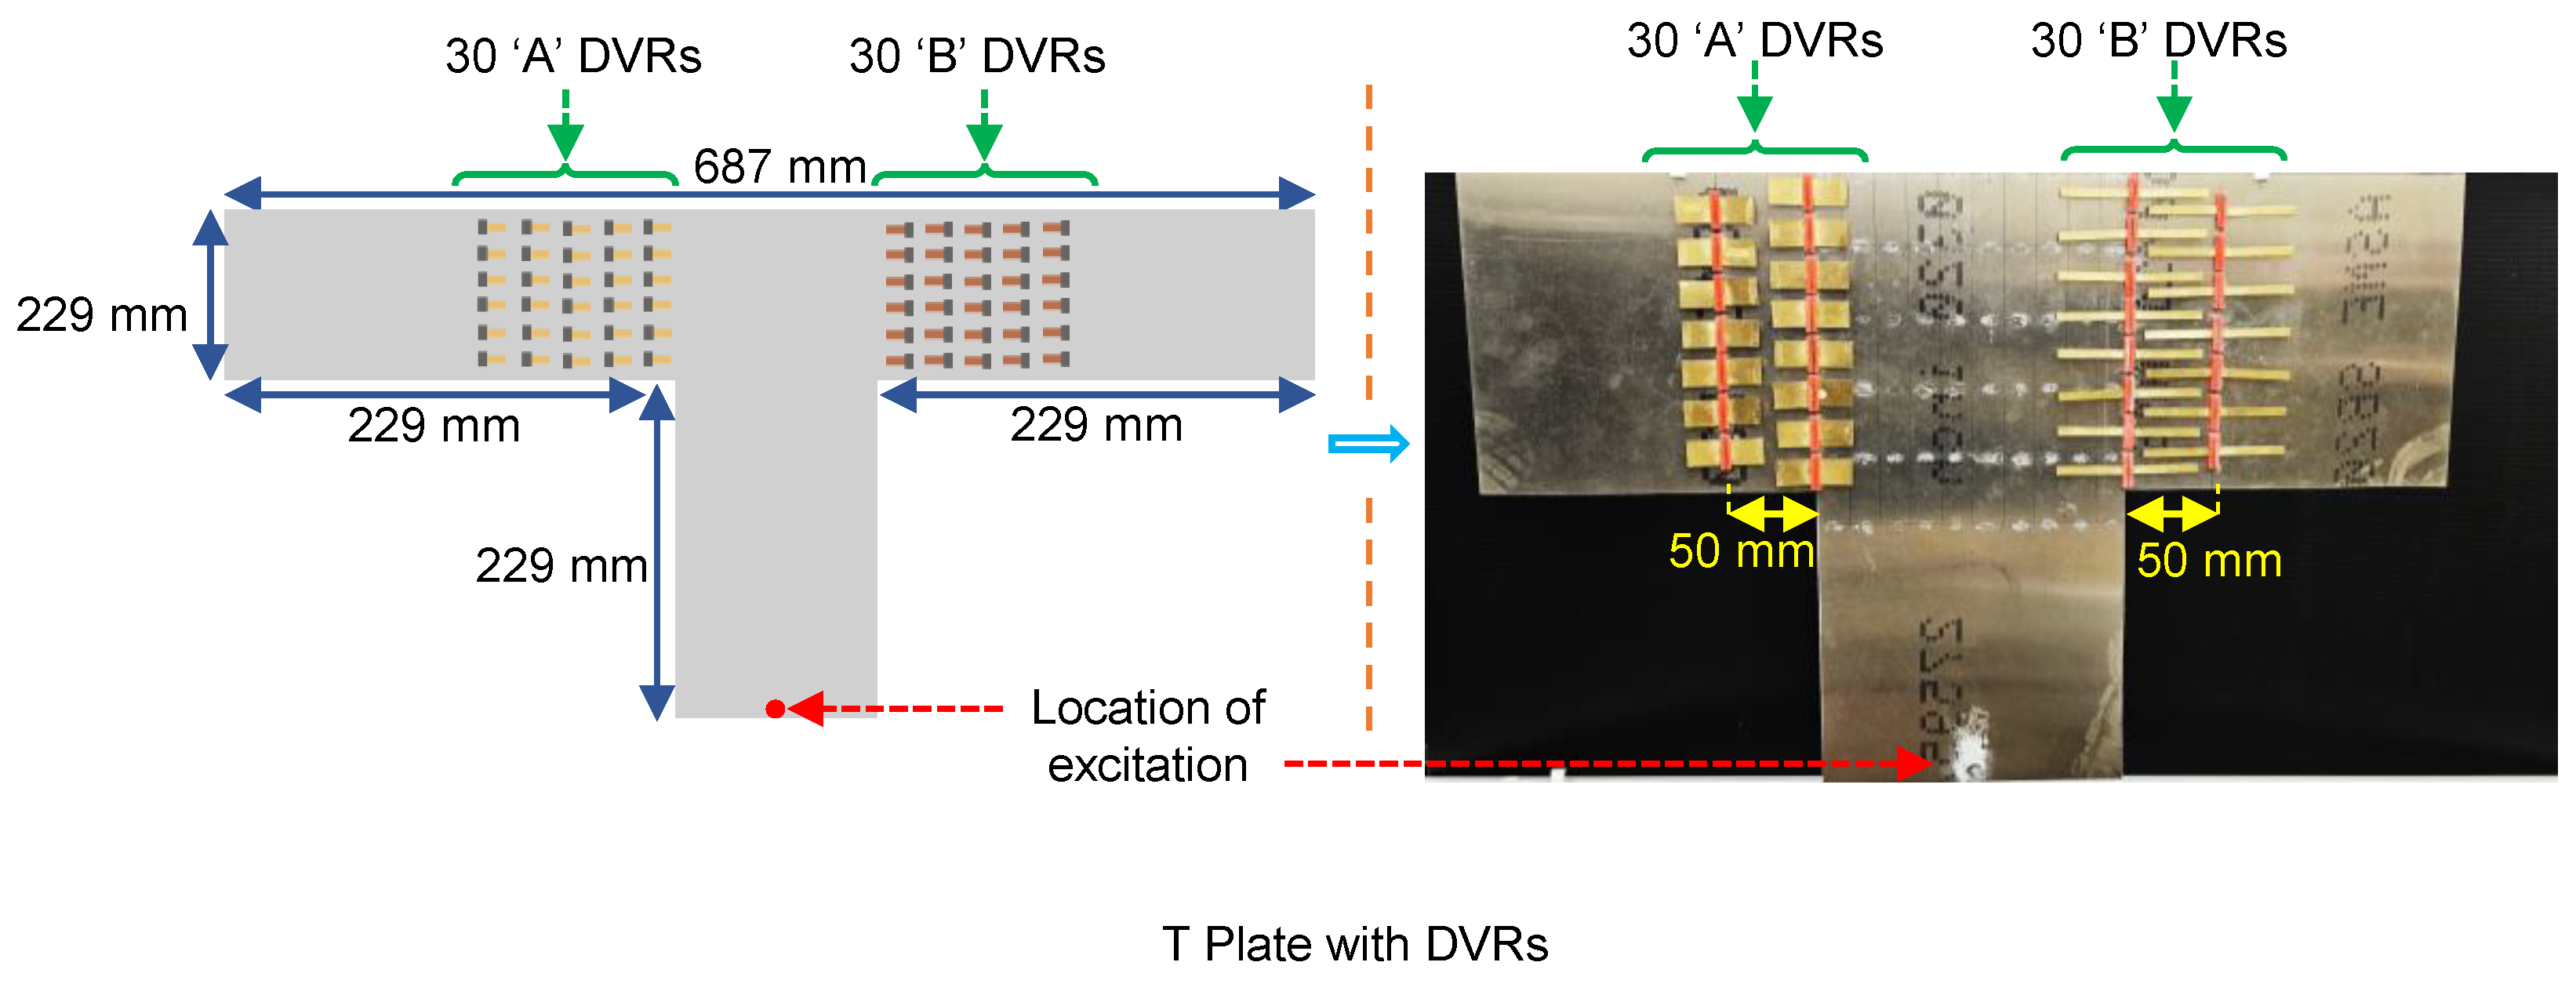
As discussed in Section 4, selective frequency transmission and absorption were validated for 1D structures. This section tries to confirm its validity on 2D structures. Hence, a plate was cut in a T shape having a thickness of 0.8 mm and dimensions as shown in Figure 20. Thirty “A” DVRs were attached to the left arm of the plate so that there were two columns of DVR attachment locations. Each column of attachment locations was separated by a distance of 50 mm. There were seven attachment points and 14 DVRs in the first column, and there were eight attachment points and 16 DVRs in the second column. The inner column of the attachment points was aligned to one of the edges of the bottom plate. Similarly, 30 “B” DVRs were attached to the right arm to perform the same procedure. Experiments were conducted on this plate with DVRs to study wave propagation.

Experiments

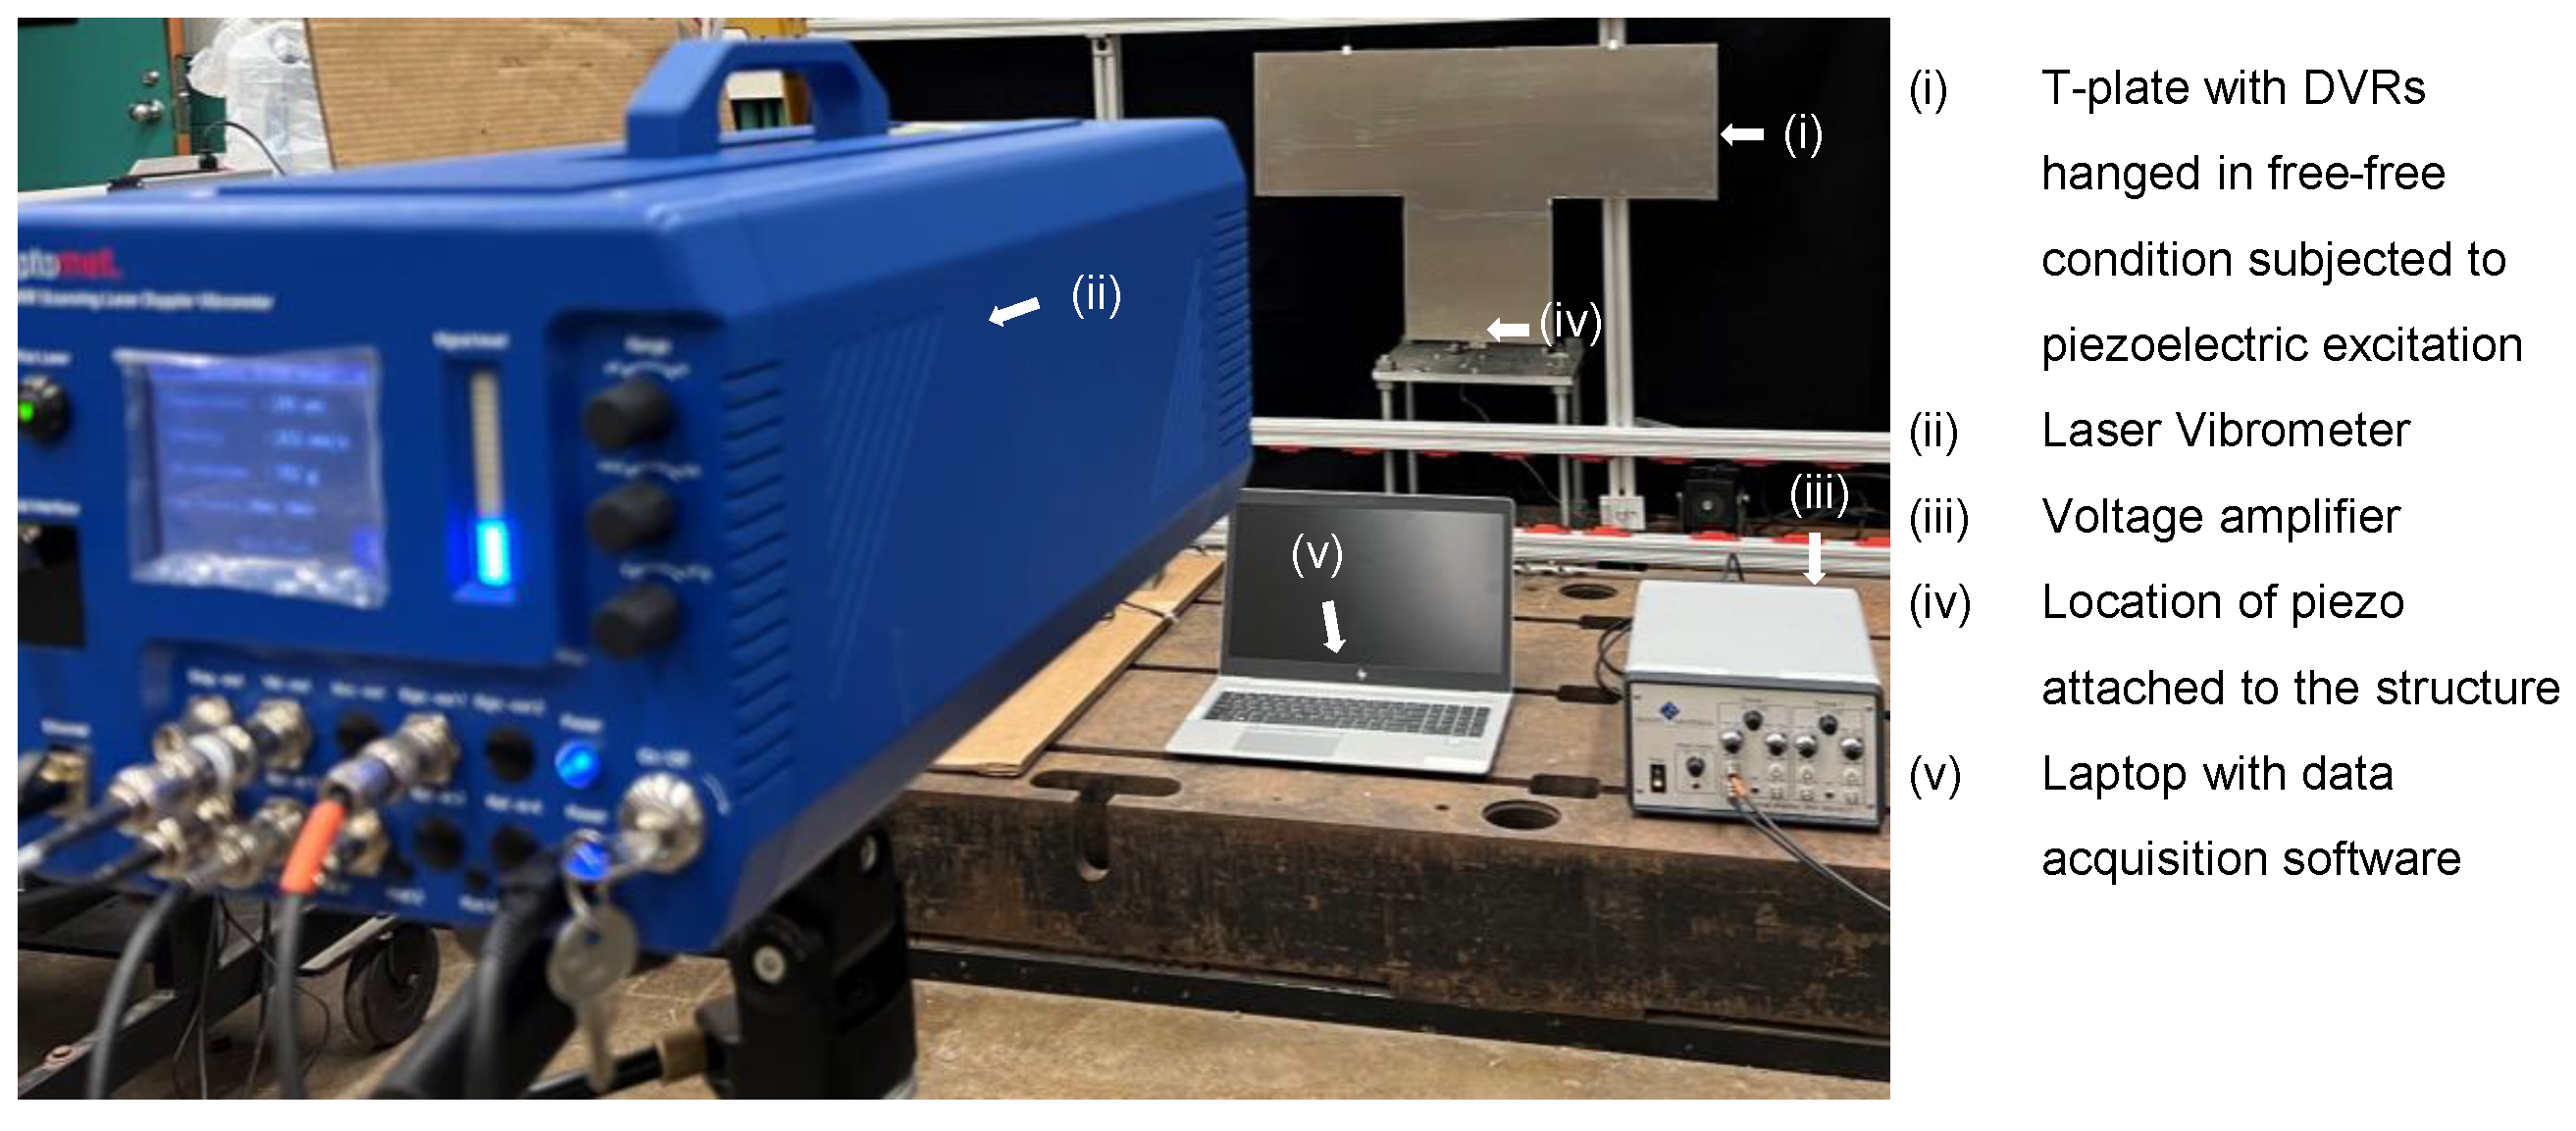
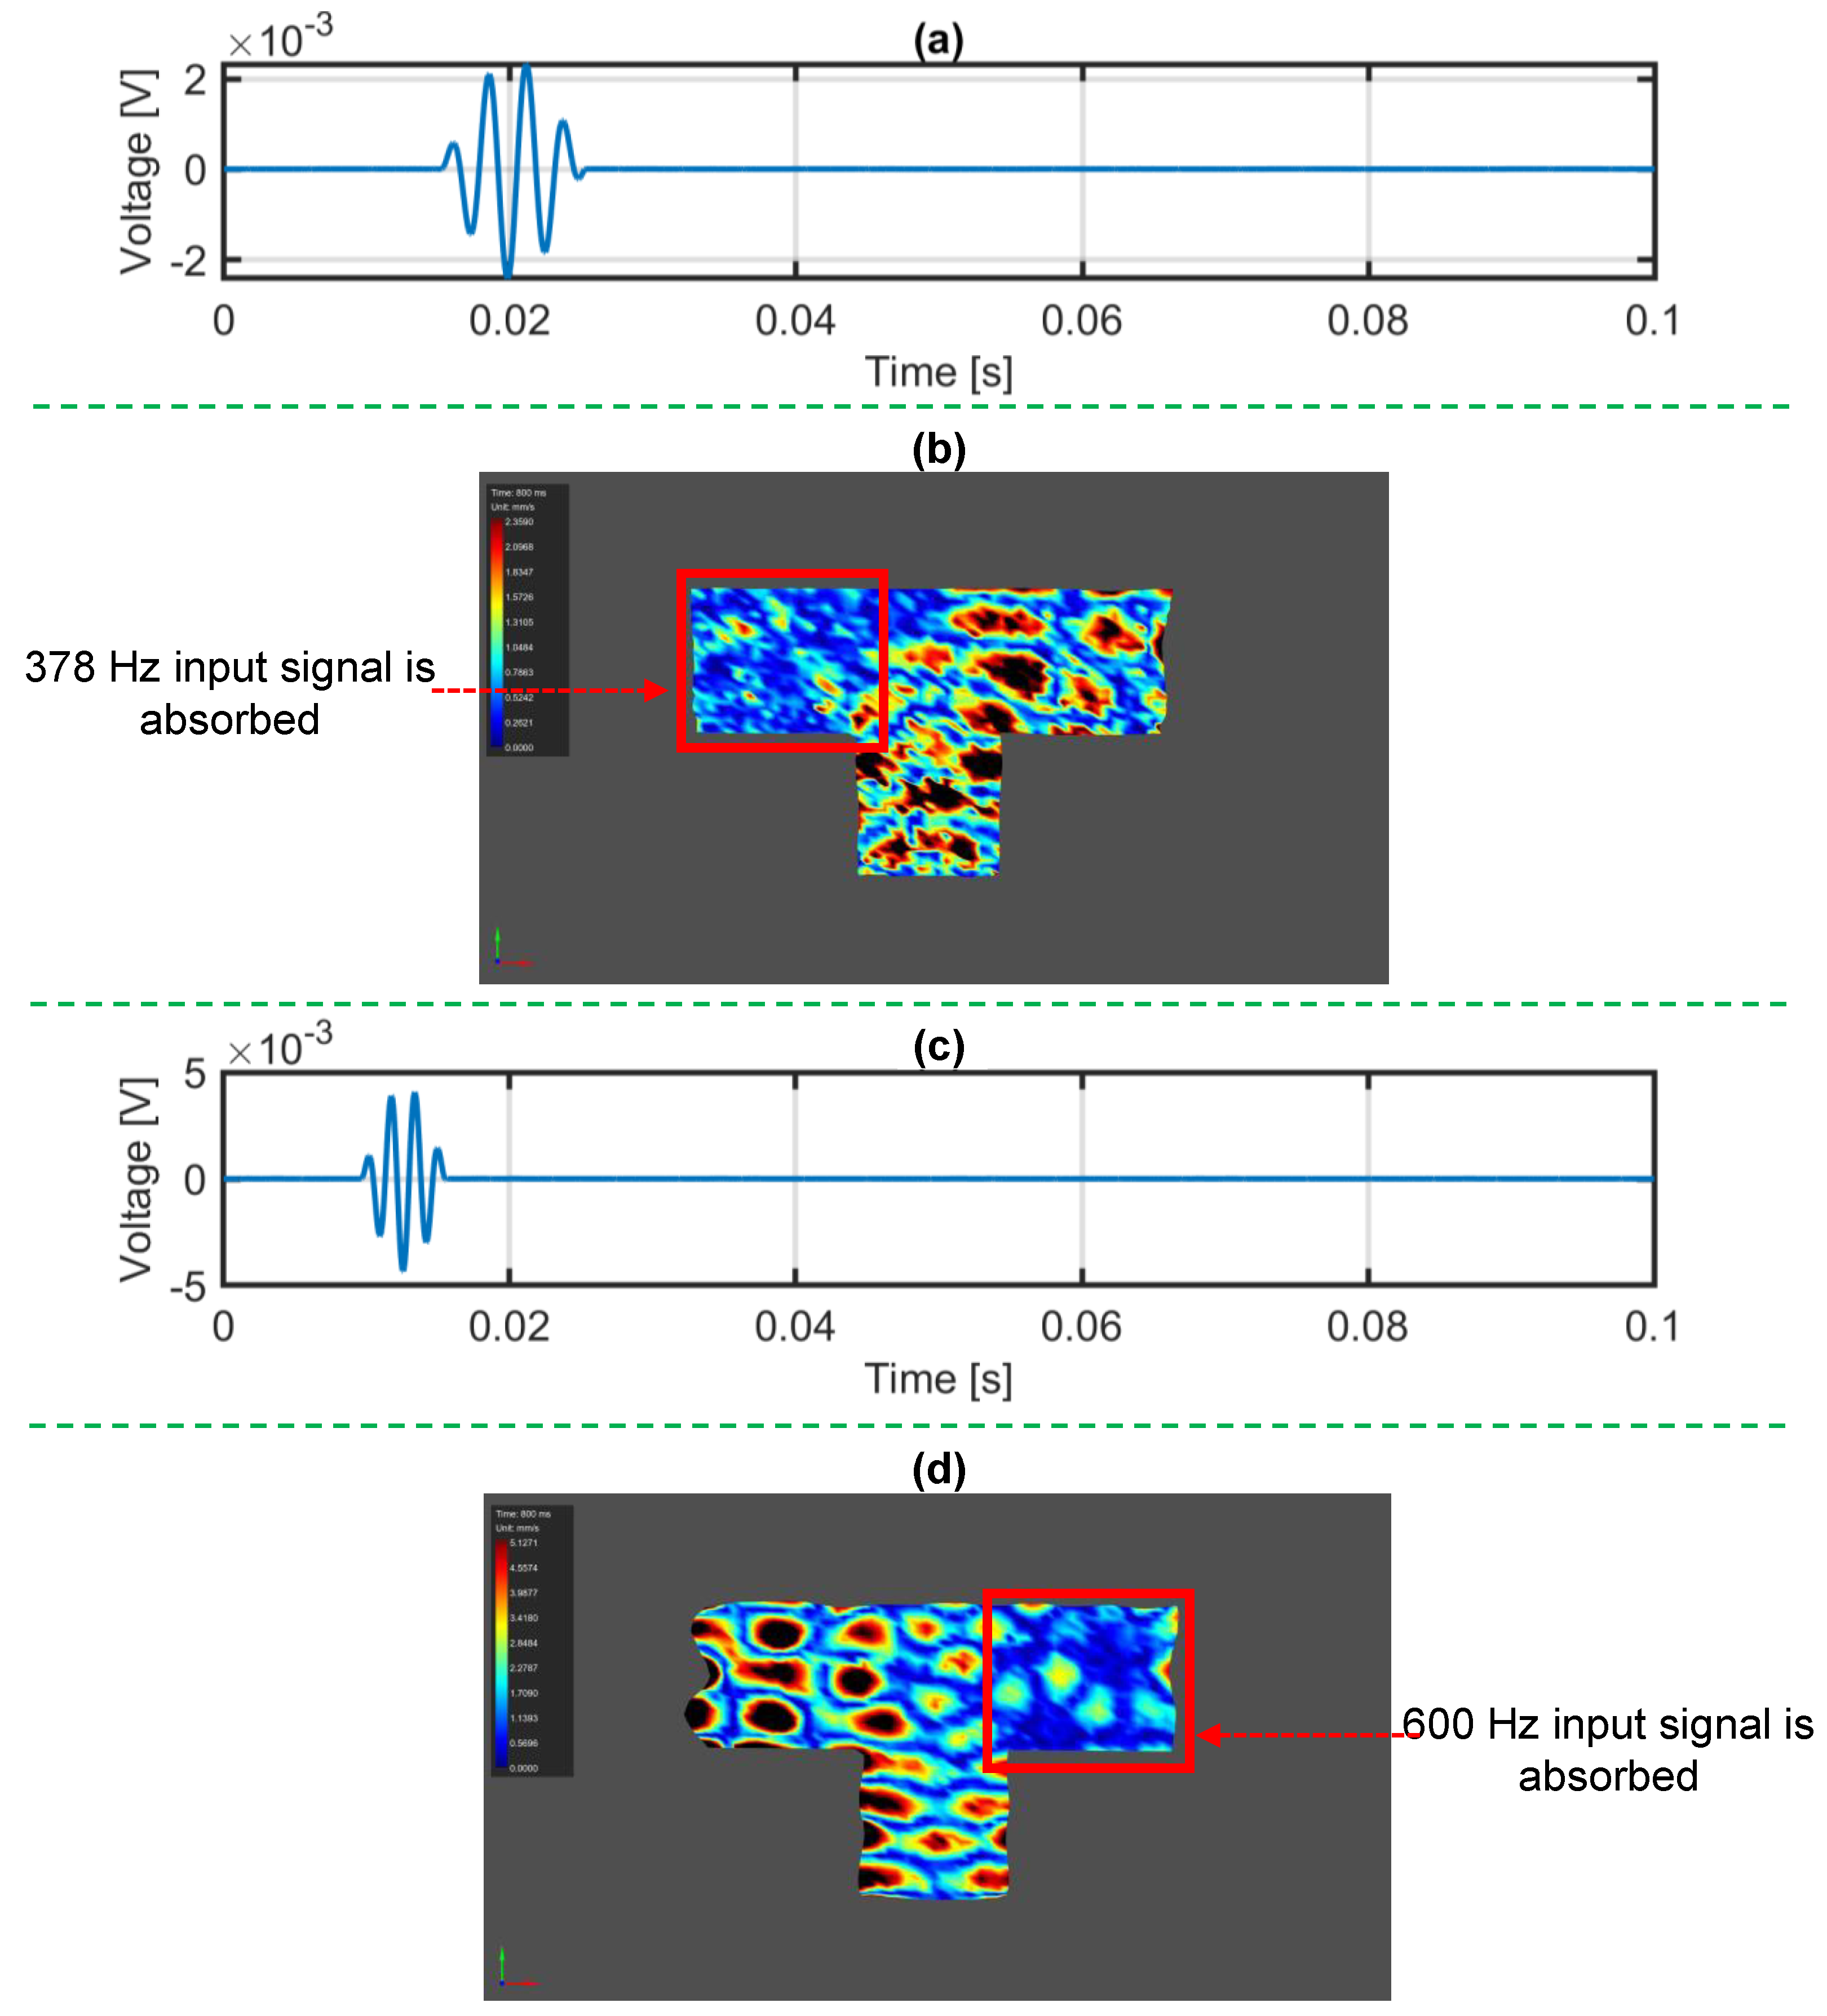
The experimental setup for the T-plate with DVRs is as shown in Figure 21. The structure was mounted using fishing lines to achieve free–free boundary conditions. An having an active area of 25 × 3 mm 2 (0.98 inch × 0.12 inch) was attached to the structure for excitation. Similarly to Section 4.1.2, initially, a programmed modulated sine wave signal tuned to 378 Hz, shown in Figure 22a, was applied to the MFC, and the time response over 1680 points distributed equidistantly over the surface of the T-plate were measured using SLDV. The animation for the modulated 378 Hz signal is as shown in Supplementary Animation (e) and a snap of one of the time stamps is shown in Figure 22b. Similarly, a programmed modulated sine wave at 600 Hz, shown in Figure 22c, was applied to the MFC, and the response at 1680 points measured was as shown in Supplementary Animation (f). Figure 22d shows the response in real time on one of the time stamps.
In Supplementary Animation (e), it can be observed that the 378 Hz input signal propagated through the right arm but was attenuated in the left arm of the T-plate. Similarly, by Supplementary Animation (f), the 600-Hz input signal propagated through the left arm but was attenuated in the right arm of the structure.
These preliminary experiments prove that selective propagation of elastic waves is possible in 2D structures. In the future, the area of using 2D metastructures as frequency filters could be explored for various applications.

7. Conclusions

The primary objective of this research was to develop a mechanical spectrum analyzer that integrated two essential features: first, the ability to mimic the behavior of a traveling wave generated by a tonal stimulus, characterized by energy dissipation without reflections at the boundaries; and second, the capability to physically encode wave energy into distinct spectral components. This study went beyond the conventional focus on metamaterial design by examining the wave propagation behavior and energy dissipation characteristics within metastructures, with an emphasis on how energy was absorbed by individual unit cells.
To achieve these goals, a metastructural design methodology was employed, enabling the creation and validation of an innovative mechanical spectrum analyzer. The initial sections of this work described the modeling and experimental validation of metastructure samples with varying numbers of unit cells. By calculating the absorption coefficient for each sample and conducting experiments, we quantified the change in the drop of absorption coefficient within the bandgap region. Furthermore, simulations were performed to evaluate the power absorbed by each dynamic vibration resonator (DVR) in the bandgap region, culminating in the formulation of an equation to quantify the total power absorbed in every DVR. This equation offers a quantitative tool for assessing energy dissipation in metastructures and could be extended to applications like energy harvesting.
A T-beam metastructure, incorporating two distinct sets of DVRs on its arms, was designed and manufactured to explore selective frequency propagation. The absorption coefficients for each arm were calculated and validated experimentally, demonstrating the feasibility of frequency-selective wave propagation in different parts of the structure. Building on this, a beam augmented with four different sets of DVRs was designed to achieve stepped bandgaps along its length, functioning as a frequency filter. These results underscore the potential of metastructures for filtering specific frequencies and absorbing targeted signals, paving the way for practical applications in wave control and energy harvesting.
Finally, preliminary experiments were conducted to explore wave propagation and reflection coefficients in 2D structures, lightly touching upon the validity of selective wave propagation in a 2D T-plate. These findings suggest promising avenues for future studies on extending this methodology to 2D metastructures. Additionally, the devised equation for quantifying power absorption provides a foundational tool for evaluating energy harvesting potential in metastructures, highlighting a key area for further investigation. Future research could explore the extension of this methodology to 2D and 3D metastructures, enabling more complex wave propagation and energy dissipation studies. Additionally, optimizing metastructures for energy harvesting and dynamic frequency filtering, possibly through adaptive or bio-inspired designs, holds significant potential for advancing applications in signal processing and vibration control. Integrating computational methods like machine learning could further accelerate design innovation and uncover optimal configurations for specific use cases.
This work provides both quantitative insights into energy dissipation and qualitative demonstrations of wave propagation control, contributing to the broader understanding of metastructural dynamics and their potential applications.

Declaration of Generative AI and AI-Assisted Technologies in the Writing Process

During the preparation of this work the author(s) used ChatGPT in order to edit the language. After using this tool/service, the author(s) reviewed and edited the content as needed and take(s) full responsibility for the content of the publication.

Supplementary Materials

The following supporting information can be downloaded at: https://www.mdpi.com/article/10.3390/act14020063/s1.

Author Contributions

Conceptualization, V.V.N.S.M.; methodology, V.V.N.S.M. and S.H.C.; software, S.H.C. and V.V.N.S.M.; validation, S.H.C.; formal analysis, S.H.C. and V.V.N.S.M.; investigation, S.H.C.; resources, S.H.C. and V.V.N.S.M.; data curation, S.H.C.; writing—original draft preparation, S.H.C.; writing—review and editing, V.V.N.S.M.; visualization, S.H.C.; supervision, V.V.N.S.M.; project administration, V.V.N.S.M.; funding acquisition, V.V.N.S.M. All authors have read and agreed to the published version of the manuscript.

Funding

This research was funded by National Science Foundation through the grant CMMI-2301776.

Data Availability Statement

The data that support the findings of this study are openly available at https://digitalcommons.mtu.edu/etdr/1661/ (accessed on 3 December 2023).

Conflicts of Interest

The authors declare no conflicts of interest.

References

  1. Eggermont, J.J. Cochlea and auditory nerve. Handb. Clin. Neurol. 2019, 160, 437–449. [Google Scholar] [PubMed]
  2. Davis, R.L. Gradients of neurotrophins, ion channels, and tuning in the cochlea. Neuroscientist 2003, 9, 311–316. [Google Scholar] [CrossRef] [PubMed]
  3. Robles, L.; Ruggero, M.A. Mechanics of the mammalian cochlea. Physiol. Rev. 2001, 81, 1305–1352. [Google Scholar] [CrossRef] [PubMed]
  4. Zwislocki, J. Analysis of the middle-ear function. Part I: Input impedance. J. Acoust. Soc. Am. 1962, 34, 1514–1523. [Google Scholar] [CrossRef]
  5. Holmes, M.; Cole, J. Pseudo-resonance in the cochlea. In Mechanics of Hearing: Proceedings of the IUTAM/ICA Symposium Held at Delft University of Technology The Netherlands 13–15 July 1983; Springer: Berlin/Heidelberg, Germany, 1983; pp. 45–52. [Google Scholar]
  6. Oghalai, J.S. The cochlear amplifier: Augmentation of the traveling wave within the inner ear. Curr. Opin. Otolaryngol. Head Neck Surg. 2004, 12, 431. [Google Scholar] [CrossRef]
  7. Kim, S.; Song, W.J.; Jang, J.; Jang, J.H.; Choi, H. Characterization and modeling of an acoustic sensor using AlN thin-film for frequency selectivity. Electron. Mater. Lett. 2014, 10, 299–303. [Google Scholar] [CrossRef]
  8. Song, W.J.; Jang, J.; Kim, S.; Choi, H. Influence of mechanical coupling by SiO2 membrane on the frequency selectivity of microfabricated beam arrays for artificial basilar membranes. J. Mech. Sci. Technol. 2015, 29, 963–971. [Google Scholar] [CrossRef]
  9. Shintaku, H.; Kobayashi, T.; Zusho, K.; Kotera, H.; Kawano, S. Wide-range frequency selectivity in an acoustic sensor fabricated using a microbeam array with non-uniform thickness. J. Micromech. Microeng. 2013, 23, 115014. [Google Scholar] [CrossRef]
  10. Jang, J.; Jang, J.H.; Choi, H. Biomimetic artificial basilar membranes for next-generation cochlear implants. Adv. Healthc. Mater. 2017, 6, 1700674. [Google Scholar] [CrossRef]
  11. Shintaku, H.; Nakagawa, T.; Kitagawa, D.; Tanujaya, H.; Kawano, S.; Ito, J. Development of piezoelectric acoustic sensor with frequency selectivity for artificial cochlea. Sens. Actuators A Phys. 2010, 158, 183–192. [Google Scholar] [CrossRef]
  12. Inaoka, T.; Shintaku, H.; Nakagawa, T.; Kawano, S.; Ogita, H.; Sakamoto, T.; Hamanishi, S.; Wada, H.; Ito, J. Piezoelectric materials mimic the function of the cochlear sensory epithelium. Proc. Natl. Acad. Sci. USA 2011, 108, 18390–18395. [Google Scholar] [CrossRef] [PubMed]
  13. White, R.D.; Grosh, K. Microengineered hydromechanical cochlear model. Proc. Natl. Acad. Sci. USA 2005, 102, 1296–1301. [Google Scholar] [CrossRef] [PubMed]
  14. Wittbrodt, M.J.; Steele, C.R.; Puria, S. Developing a physical model of the human cochlea using microfabrication methods. Audiol. Neurotol. 2006, 11, 104–112. [Google Scholar] [CrossRef] [PubMed]
  15. Jung, Y.; Kwak, J.H.; Lee, Y.H.; Kim, W.D.; Hur, S. Development of a multi-channel piezoelectric acoustic sensor based on an artificial basilar membrane. Sensors 2013, 14, 117–128. [Google Scholar] [CrossRef]
  16. Lee, H.S.; Chung, J.; Hwang, G.T.; Jeong, C.K.; Jung, Y.; Kwak, J.H.; Kang, H.; Byun, M.; Kim, W.D.; Hur, S.; et al. Flexible inorganic piezoelectric acoustic nanosensors for biomimetic artificial hair cells. Adv. Funct. Mater. 2014, 24, 6914–6921. [Google Scholar] [CrossRef]
  17. Chavan, S.H.; Malladi, S.S.; Malladi, V.V.S. Reinforcement Learning approach of switching bi-stable oscillators to adapt bandgaps of 1D-meta-structures. Mech. Syst. Signal Process. 2023, 191, 110151. [Google Scholar] [CrossRef]
  18. He, H.; Fan, H. Explosion vibration mitigation of meta-plate with mass–spring metastructures. Extrem. Mech. Lett. 2021, 42, 101108. [Google Scholar] [CrossRef]
  19. An, X.; Lai, C.; Fan, H.; Zhang, C. 3D acoustic metamaterial-based mechanical metalattice structures for low-frequency and broadband vibration attenuation. Int. J. Solids Struct. 2020, 191, 293–306. [Google Scholar] [CrossRef]
  20. An, X.; Lai, C.; He, W.; Fan, H. Three-dimensional meta-truss lattice composite structures with vibration isolation performance. Extrem. Mech. Lett. 2019, 33, 100577. [Google Scholar] [CrossRef]
  21. An, X.; Fan, H.; Zhang, C. Elastic wave and vibration bandgaps in two-dimensional acoustic metamaterials with resonators and disorders. Wave Motion 2018, 80, 69–81. [Google Scholar] [CrossRef]
  22. An, X.; Fan, H.; Zhang, C. Wave dispersion in one-dimensional periodic graded metacomposites. J. Sound Vib. 2017, 409, 217–226. [Google Scholar] [CrossRef]
  23. Ghasemi, F.; Salari, E.; Salari, A.; Rastgoo, A.; Li, D.; Deng, J. Integrating analytical and machine learning methods for investigating nonlinear bending and post-buckling behavior of 3D-printed auxetic tubes. In Engineering with Computers; Springer: Berlin/Heidelberg, Germany, 2024; pp. 1–38. [Google Scholar]
  24. Nasri, M.R.; Salari, E.; Salari, A.; Vanini, S.A.S. Nonlinear bending and buckling analysis of 3D-printed meta-sandwich curved beam with auxetic honeycomb core. Aerosp. Sci. Technol. 2024, 152, 109339. [Google Scholar] [CrossRef]
  25. Barnard, A.R.; Rao, M.D. Measurement of sound transmission loss using a modified four microphone impedance tube. In Proceedings of the ASME Noise Control and Acoustics Division (Noise-Con’04), Baltimore, MD, USA, 12–14 July 2004. [Google Scholar]
  26. Deshpande, S.P.; Rao, M.D. Development of a low-cost impedance tube to measure acoustic absorption and transmission loss of materials. In Proceedings of the 2014 ASEE Annual Conference & Exposition, Indianapolis, IN, USA, 15–18 June 2014; pp. 24–417. [Google Scholar]
  27. Jung, S.S.; Kim, Y.T.; Lee, Y.B.; Cho, S.I.; Lee, J.K. Measurement of sound transmission loss by using impedance tubes. J. Korean Phys. Soc. 2008, 53, 596–600. [Google Scholar] [CrossRef]
  28. Mei, C.; Mace, B.R. Wave Reflection and Transmission in Timoshenko Beams and Wave Analysis of Timoshenko Beam Structures. J. Vib. Acoust. 2004, 127, 382–394. [Google Scholar] [CrossRef]
  29. Cremer, L.; Heckl, M. Structure-Borne Sound: Structural Vibrations and Sound Radiation at Audio Frequencies; Springer Science & Business Media: Berlin/Heidelberg, Germany, 2013. [Google Scholar]
  30. Miller, D.W.; Von Flotow, A. A travelling wave approach to power flow in structural networks. J. Sound Vib. 1989, 128, 145–162. [Google Scholar] [CrossRef]
  31. Mace, B. Wave reflection and transmission in beams. J. Sound Vib. 1984, 97, 237–246. [Google Scholar] [CrossRef]
  32. Wang, C.; Rose, L. Wave reflection and transmission in beams containing delamination and inhomogeneity. J. Sound Vib. 2003, 264, 851–872. [Google Scholar] [CrossRef]
  33. Denis, V.; Gautier, F.; Pelat, A.; Poittevin, J. Measurement and modelling of the reflection coefficient of an acoustic black hole termination. J. Sound Vib. 2015, 349, 67–79. [Google Scholar] [CrossRef]
  34. Mace, B.; Halkyard, C.; El-Khatib, H. Real-time measurement of wave components and intensity in a beam in the presence of a near field. J. Sound Vib. 2005, 286, 507–527. [Google Scholar] [CrossRef]
  35. Cao, S.; Lee, H.P.; Lim, K.M. Estimation of wave reflection coefficient by semi-analytical method in an acoustic black hole beam. Int. J. Appl. Mech. 2020, 12, 2050004. [Google Scholar] [CrossRef]
  36. Feurtado, P.; Conlon, S. Investigation of boundary-taper reflection for acoustic black hole design. Noise Control Eng. J. 2015, 63, 460–466. [Google Scholar] [CrossRef]
  37. Huang, W.; Zhang, H.; Inman, D.J.; Qiu, J.; Cesnik, C.E.; Ji, H. Low reflection effect by 3D printed functionally graded acoustic black holes. J. Sound Vib. 2019, 450, 96–108. [Google Scholar] [CrossRef]
  38. Leng, J.; Romero-García, V.; Pelat, A.; Pico, R.; Groby, J.P.; Gautier, F. Interpretation of the acoustic black hole effect based on the concept of critical coupling. J. Sound Vib. 2020, 471, 115199. [Google Scholar] [CrossRef]
  39. Magliacano, D.; Ouisse, M.; de Rosa, S.; Franco, F.; Khelif, A. Investigations about the modelling of acoustic properties of periodic porous materials with the shift cell approach. In Proceedings of the SMART 2019: IX ECCOMAS Thematic Conference on Smart Structures and Materials, Paris, France, 8–11 July 2019. [Google Scholar]
  40. Meirovitch, L. Principles and Techniques of Vibrations; Prentice Hall: Englewood Cliffs, NJ, USA, 1997; Volume 1. [Google Scholar]
  41. Inman, D.J. Engineering Vibration; Prentice Hall: Englewood Cliffs, NJ, USA, 1994; Volume 3. [Google Scholar]
  42. Albakri, M.I.; Malladi, V.V.S.; Gugercin, S.; Tarazaga, P.A. Estimating dispersion curves from frequency response functions via vector-fitting. Mech. Syst. Signal Process. 2020, 140, 106597. [Google Scholar] [CrossRef]
  43. Rao, S.S. The Finite Element Method in Engineering; Butterworth-Heinemann: Oxford, UK, 2017. [Google Scholar]
  44. Malladi, V.V.S.; Albakri, M.I.; Krishnan, M.; Gugercin, S.; Tarazaga, P.A. Estimating experimental dispersion curves from steady-state frequency response measurements. Mech. Syst. Signal Process. 2022, 164, 108218. [Google Scholar] [CrossRef]
  45. Penrose, R. A generalized inverse for matrices. Math. Proc. Camb. Philos. Soc. 1955, 51, 406–413. [Google Scholar] [CrossRef]
Figure 1. Reflection coefficients for (a) baseline specimen with no DVRs, (b) specimen 2 with 9 DVRs, (c) specimen 3 with 18 DVRs, and (d) specimen 4 with 36 DVRs were calculated through (e) simulations and (f) experiments.
Actuators 14 00063 g001
Figure 2. Schematics of the experimental setup of specimen 4 for reference.
Actuators 14 00063 g002
Figure 3. (a) Metastructure specimens with 1 to 9 DVRs and (b) reflection coefficient for each specimen calculated through simulations.
Actuators 14 00063 g003
Figure 4. Metastructure specimen with 9 DVRs showing the location of excitation and the direction of backward propagating and non-propagating waves before and after transmission through a metastructure.
Actuators 14 00063 g004
Figure 5. (a) Metastructure specimens with 1 to 9 DVRs and (b) transmission coefficients and (c) absorption coefficients for each specimen calculated through simulations.
Actuators 14 00063 g005
Figure 6. Metastructures with (a) baseline specimen with no DVRs, (b) specimen 2 with 9 DVRs, (c) specimen 3 with 18 DVRs, and (d) specimen 4 with 36 DVRs were modeled to calculate (e) transmission and (f) absorption coefficients through simulations.
Actuators 14 00063 g006
Figure 7. In simulations, (a) an input chirp signal from 250 Hz to 750 Hz was applied to specimen 4, (b) PSDs were calculated for each DVR, and the total power absorbed by each DVR in the bandgap region (from 358 Hz to 455 Hz) were plotted on a logarithmic scale.
Actuators 14 00063 g007
Figure 8. Dimensions of the T-shaped host structure used in this study. The structure consisted of a vertical stem and a horizontal crossbeam with key measurements including the height and width. FE modeling was then conducted for this configuration using the equations discussed in Section 2.1.
Actuators 14 00063 g008
Figure 9. Eighteen “A” DVRs and eighteen “B” DVRs were attached to each arm of the T-beam. The excitation location is shown, and the measured FRFs at the end of the (a) left arm and (b) right arm through experiments and simulations are plotted for reference to provide insights into the effectiveness of the DVRs on the vibration response at each arm. The transmission coefficient calculated for the T-beam with DVRs from experiments and simulations shows an energy drop in the respective bandgap location for the (c) left and (d) right arm, indicating a reduction in the system’s ability to transmit energy within their bandgaps. As a result, the absorbed energy within the same frequency range increases, which is demonstrated by the corresponding rise in absorbed energy at the bandgap location for the (e) left and (f) right arm.
Actuators 14 00063 g009
Figure 10. Schematics of experimental setup of the T-beam with DVRs for reference.
Actuators 14 00063 g010
Figure 11. Experimental setup of the host T-beam with DVRs for reference.
Actuators 14 00063 g011
Figure 12. In simulations, (c) an input chirp signal was applied to the T-beam, and (a,b) PSDs were calculated for each DVR sequence in the respective bandgap region and are plotted in the logarithmic scale.
Actuators 14 00063 g012
Figure 13. The figure shows the response autopower measured over the entire length of the horizontal section of the beam through (a) simulations and (b) experiments, where the 378 Hz signal is absorbed on the left arm and the 600 Hz signal is absorbed on the right arm for the applied input signal (c).
Actuators 14 00063 g013
Figure 14. The input signal modulated to (a) 378 Hz when applied to the simulated model of the T-beam (b) absorbed wave propagation in the left arm and (c) the input signal modulated to 600 Hz (d) absorbed wave propagation in the right arm.
Actuators 14 00063 g014
Figure 15. The input signal modulated to (a) 378 Hz when applied to the T-beam to carry out experiments (b) absorbed wave propagation in the left arm, and (c) the input signal modulated to 600 Hz (d) absorbed wave propagation in right arm.
Actuators 14 00063 g015
Figure 16. (a) Set 1 DVRs, (b) Set 2 DVRs, (c) Set 3 DVRs, and (d) Set 4 DVRs were attached to the host structure one by one, and (e) the respective FRFs calculated at the right end are plotted.
Actuators 14 00063 g016
Figure 17. (a) Transmission coefficients and (b) absorption coefficients for a host beam with Set 1 DVRs, Set 2 DVRs, Set 3 DVRs, and Set 4 DVRs.
Actuators 14 00063 g017
Figure 18. The response was measured at the (a) leftmost point of the structure, after (b) Set 1 DVRs, (c) Set 2 DVRs, (d) Set 3 DVRs, and (e) Set 4 DVRs for the force input. (f) The transmission coefficient and (g) absorption coefficient were calculated for the entire structure, showing the depth of the bandgap.
Actuators 14 00063 g018
Figure 19. In simulations, (a) an input chirp signal was applied to the structure, and (b) PSDs were calculated for all DVRs in every set.
Actuators 14 00063 g019
Figure 20. Dimensions of the T-plate attached with 30 “A” DVRs and 30 “B” DVRs on each arm with the input excitation location.
Actuators 14 00063 g020
Figure 21. Experimental setup of the host T-beam with DVRs for reference.
Actuators 14 00063 g021
Figure 22. The input signal modulated to (a) 378 Hz when applied to the T−plate (b) absorbed wave propagation in the left arm and the input signal modulated to (c) 600 Hz (d) absorbed wave propagation in the right arm.
Actuators 14 00063 g022
Table 1. Geometric and material details of the components of the metastructure.
Geometric PropertiesMaterial Properties
L × W × H (mm × mm × mm) E  (GPa) ρ  (kg/m3) ν G  (GPa) κ
Host beam 1828 × 22 × 1.5 6627000.33240.93
DVR “A” 25.4 × 19.05 × 1.59 11087300.34770.85
DVR “B” 50.8 × 6.35 × 0.4 11087300.34770.85
Table 2. Reduced SDOF model of DVRs.
Reduced Order ModelDVR “A”DVR “B”
Targeted natural frequency (Hz)352.68 565.5
Mass m ˜ D V R (kg)0.0050.0045
Stiffness k ˜ D V R (N/m)24,028.856,170.5
Damping c ˜ D V R (Ns/m)0.48890.8267
Table 3. Geometric and material details of the host structure.
Geometric PropertiesMaterial Properties
L × W × H (mm × mm × mm) E  (GPa) ρ  (kg/m3) ν G  (GPa) κ
Host beam 5486 × 22 × 1.5 6627000.33240.93
Table 4. SDOF characteristics of DVRs.
Natural FrequencyMassStiffness
(Hz) m DVR ˜ (kg) k DVR ˜ (N/m)
DVR A12250.0024142,182
DVR B17500.002244,641
DVR C26000.000923246,345
DVR D32000.000923373,162
Table 5. Bandgaps for each set of DVRs individually.
Spatial LocationStart FrequencyEnd Frequency
(mm)(Hz)(Hz)
Set 1 DVRs1828 to 228611301925
Set 2 DVRs2286 to 274315702610
Set 3 DVRs2743 to 320022503230
Set 4 DVRs3200 to 365826603960
Disclaimer/Publisher’s Note: The statements, opinions and data contained in all publications are solely those of the individual author(s) and contributor(s) and not of MDPI and/or the editor(s). MDPI and/or the editor(s) disclaim responsibility for any injury to people or property resulting from any ideas, methods, instructions or products referred to in the content.