Review

Fault Detection and Diagnosis for Human-Centric Robotic Actuation in Healthcare: Methods, Failure Modes, and a Validation Framework

by
Camelia Adela Maican
1,
Cristina Floriana Pană
2,*,
Nicolae Răzvan Vrăjitoru
2,*,
Daniela Maria Pătrașcu-Pană
2 and
Virginia Maria Rădulescu
3
1
Department of Automation and Electronics, University of Craiova, 200585 Craiova, Romania
2
Department of Mechatronics and Robotics, University of Craiova, 200585 Craiova, Romania
3
Department of Medical Informatics and Biostatistics, Faculty of Medicine, University of Medicine and Pharmacy of Craiova, 200349 Craiova, Romania
*
Authors to whom correspondence should be addressed.
Actuators 2025, 14(12), 566; https://doi.org/10.3390/act14120566
Submission received: 27 October 2025 / Revised: 7 November 2025 / Accepted: 11 November 2025 / Published: 21 November 2025

Abstract

This review synthesises fault detection and diagnosis (FDD) methods for robotic actuation in healthcare, where precise, compliant, and safe physical human–robot interaction (pHRI) is essential. Actuator families—harmonic-drive electric transmissions, series-elastic designs, Cable/Bowden mechanisms, permanent-magnet synchronous motors (PMSM), and force–torque-sensed architectures—are mapped to characteristic fault classes and to sensing, residual-generation, and decision pipelines. Four methodological families are examined: model-based observers/parity relations, parameter-estimation strategies, signal-processing with change detection, and data-driven pipelines. Suitability for pHRI is assessed by attention to latency, robustness to movement artefacts, user comfort, and fail-safe behaviour. Aligned with ISO 14971 and the IEC 60601/80601 series, a validation framework is introduced, with reportable metrics—time-to-detect (TTD), minimal detectable fault amplitude (MDFA), and false-alarm rate (FAR)—at clinically relevant thresholds, accompanied by a concise reporting checklist. Across 127 studies (2016–2025), a pronounced technology-dependent structure emerges in the actuator-by-fault relationship; accuracy (ACC/F1) is commonly reported, whereas MDFA, TTD, and FAR are rarely documented. These findings support actuation-aware observers and decision rules and motivate standardised reporting beyond classifier accuracy to enable clinically meaningful, reproducible evaluation in contact-rich pHRI.

1. Introduction

Human-centric robots—wearable exoskeletons, assistive devices, and collaborative manipulators—operate in sustained physical contact with users. In this setting, fault detection and diagnosis (FDD) functions as a safety mechanism that directly affects comfort, trust, and clinical or field utility in physical human–robot interaction (pHRI). Recent reviews on HRI/pHRI safety underscore the need to move beyond accuracy-only reporting and to consider risk-aware characteristics and validation practices that reflect real operating envelopes, contact conditions, and mitigation behaviours [1,2].
Positioning against prior syntheses, our framing builds on four complementary reviews: (i) HRI safety and control for contact-rich interaction, which motivates measurable safety margins and supervisor layers; (ii) contact mechanics and impact measurement in pHRI testbeds, which clarify what motion/force signatures are observable at the human–robot interface; (iii) sensing and actuation in rehabilitation exoskeletons, which summarises the sensor stacks commonly available on wearable platforms; and (iv) FDD taxonomies in industrial/manipulator settings, which catalogue typical actuator and transmission faults and the residual-generation pipelines used to detect them. Together, these streams motivate an actuation-aware view that connects what fails, what can be sensed, and how detection is evaluated in pHRI.
Actuation architectures commonly used in human-centric systems—harmonic-drive electric transmissions, series-elastic designs, and Cable/Bowden tendon mechanisms, increasingly complemented by integrated force–torque sensing—exhibit distinct observability and failure profiles. Backlash, wear, and lubricant ageing are salient in harmonic drives; compliance shifts and torque-estimation drift tend to emerge in SEA; slack and friction non-stationarities are characteristic of cable-based transmissions. These properties condition the residuals and thresholds available to FDD pipelines and, therefore, the type of performance that should be reported under realistic loading and motion [3].
Methodologically, FDD approaches in robotics coalesce into recognisable families—model-based observers/parity relations, parameter-estimation strategies, signal-processing with change detection, and data-driven pipelines—and are often deployed in hybrid stacks. Complementary syntheses that focus on manipulators catalogue typical fault types (sensor, drive/transmission, control, thermal) and discuss the trade-offs between classical and AI-enhanced techniques, while also noting persistent variability in validation practice and reporting completeness across platforms and tasks [4]. Such variability complicates cross-study comparison and obscures safety-relevant properties in pHRI. Two recent state-of-the-art overviews in wearable/assistive and collaborative robotics reinforce this perspective. Both emphasise that contact-rich pHRI requires reporting beyond classifier accuracy—explicit sensitivity, timeliness, and false-alarm behaviour [5,6].
The present review addresses these gaps in three ways. First, actuator families are mapped to characteristic fault classes and to the sensing/residual/decision pipelines used to detect them, revealing technology-specific structure in the actuator-by-fault contingency. Second, reporting practices for ACC/F1, minimal detectable fault amplitude (MDFA), time-to-detect (TTD), and false-alarm rate (FAR) are quantified through adjusted analyses that examine associations with actuator family, era (Pre-/Pandemic/Post), publication year, and validation platform. Third, a compact, pHRI-oriented minimum reporting set is proposed—intended to complement accuracy with sensitivity, latency, and no-fault specificity—so that results become comparable and decision-relevant in contact-rich interaction [1,4]. Analyses by publication period are secondary and exploratory; they aid interpretation but do not alter inclusion, weighting, or the main conclusions.
An actuation-aware stance is emphasised. In reducer-based electric drives, thermal and torque-derating monitors can be informative; in series-elastic designs, compliance-aware residuals and drift-robust force–torque sensing are central; in Cable/Bowden systems, change-detection schemes benefit from robustness to friction variability and slack compensation. By making such assumptions explicit and pairing them with reportable metrics (ACC/F1 alongside MDFA/TTD/FAR), the evidence base can better reflect the constraints of pHRI practice and the expectations of risk-management processes [2,3].
Working hypotheses. Guided by the above, we posit that (a) family-specific actuator and transmission faults produce distinct, often low-SNR signatures at the interface; (b) observability in pHRI depends on multi-sensor stacks that combine mechanical and electrical channels; and (c) validation in this domain should report, beyond discrimination (ACC/F1), sensitivity thresholds (minimal detectable fault amplitude), detection latency (time-to-detect), and no-fault specificity (false-alarm rate). These hypotheses shape our minimum reporting set and the family-specific analysis that follows.
The remainder of the paper is organised as follows. Section 2 details the materials and methods, including the assembly of the included studies (n = 127), taxonomies, and statistical analyses. Section 3 presents results on technology–fault mappings, platform distributions, and adjusted analyses of reporting prevalence, with figures/tables adopting consistent conventions (95% CI with en dash ranges, percentages to one decimal place, n in legends). Section 4 discusses implications for actuator-aware observers and decision rules, emphasises the need for MDFA/TTD/FAR in pHRI reporting, and outlines directions for standardised validation. Section 5 concludes.

2. Materials and Methods

2.1. Study Scope

Peer-reviewed studies that propose, evaluate, or benchmark fault detection and diagnosis (FDD) methods for human-centric robotic actuation and physical human–robot interaction (pHRI) were reviewed. The set of included studies comprised n = 127 articles [3,7,8,9,10,11,12,13,14,15,16,17,18,19,20,21,22,23,24,25,26,27,28,29,30,31,32,33,34,35,36,37,38,39,40,41,42,43,44,45,46,47,48,49,50,51,52,53,54,55,56,57,58,59,60,61,62,63,64,65,66,67,68,69,70,71,72,73,74,75,76,77,78,79,80,81,82,83,84,85,86,87,88,89,90,91,92,93,94,95,96,97,98,99,100,101,102,103,104,105,106,107,108,109,110,111,112,113,114,115,116,117,118,119,120,121,122,123,124,125,126] from indexed biomedical and engineering literature (e.g., PubMed/MEDLINE, IEEE Xplore, Scopus). Eligible records reported at least one actuator technology and a detectable fault mode—actual or emulated—together with a sensing/estimation pipeline and a decision rule; purely theoretical papers without validation evidence were excluded. Time windows (exploratory). To contextualise shifts in topic mix and reporting practices, we performed a descriptive stratification by publication window: Pre-pandemic (2016–2019), Pandemic (2020–2021), and Post-pandemic (2022–2025). This periodisation is secondary and exploratory—it does not constitute a primary outcome, nor does it drive weighting or modelling; rather, it helps display corpus heterogeneity over time and facilitates transparent reporting.

2.2. Data Sources and Search Strategy

Electronic search strings were prepared in late February 2025 and executed between 10 March 2025 and 31 July 2025. Screening and data extraction proceeded in parallel and were locked on 31 July 2025; no updates were performed after the lock date. Databases queried included IEEE Xplore, Scopus, Web of Science, and Google Scholar. Search terms combined setting and method descriptors, for example: “(exoskeleton OR wearable robot OR rehabilitation robot OR cobot OR prosthesis) AND (actuator OR transmission OR harmonic drive OR series-elastic OR cable) AND (fault detection OR diagnosis OR anomaly OR failure) AND (pHRI OR human-in-the-loop OR interaction)”. Reference lists of included studies and relevant reviews were hand-screened to identify additional records. Only English-language, peer-reviewed articles (journals or full conference papers) were eligible; editorials, tutorials, and abstracts were excluded at source.

2.3. Eligibility Criteria (PICOS-Aligned)

Records were eligible if they (i) were peer-reviewed and in English; (ii) involved human-centric robotic systems (wearable, rehabilitation, assistive, or collaborative) with explicit links to actuation; (iii) proposed or evaluated an FDD method pertinent to actuator/transmission subsystems; (iv) reported quantitative evaluation—such as Accuracy (ACC), F1, minimal detectable fault amplitude (MDFA), time-to-detect (TTD), or false-alarm rate (FAR)—or provided sufficient data to derive these metrics; and (v) described the validation platform (simulation, hardware-in-the-loop/benchtop, on-body/clinical). Records were excluded if they were non-English; if they were abstracts, posters, theses, or patents; if purely theoretical without validation; if perception-only or control-only and lacking actuation-fault content; if lacking extractable quantitative outcomes; or if duplicates/near-duplicates (with the most complete primary record retained).
Scope and exclusions. Our review focuses on electric actuation architectures prevalent in contact-rich pHRI platforms—gear-reduced electric drives (e.g., harmonic/planetary), series-elastic joints, Cable/Bowden transmissions, and PMSM-based torque-sensed designs—because (i) these families dominate the recent pHRI literature we screened, (ii) their faults are observable with the sensing stacks commonly available at the human–robot interface, and (iii) they enable like-for-like appraisal across studies. Hydraulic, pneumatic, and smart-material actuators (e.g., piezoelectric, SMA, dielectric elastomers) were excluded from quantitative synthesis due to sparse representation in our corpus and heterogeneous instrumentation/reporting that precluded meaningful comparisons within our FDD framework. Where appropriate, we point readers to domain-specific surveys of those technologies; here, we remain actuation-aware but electric-drive-focused to preserve internal coherence of the evidence.

2.4. Screening and Study Selection

Records were deduplicated before screening. Titles and abstracts were screened independently in duplicate by two reviewers; disagreements were resolved by consensus after full-text review. Full texts were then assessed against the eligibility criteria above. The final set included 127 studies that met all inclusion criteria.

2.5. Taxonomy and Variable Definitions

Actuation technology was coded into non-overlapping families used throughout the analysis: electric drives with harmonic reducers (HD), permanent-magnet synchronous motors (PMSM), series-elastic actuators (SEA), Cable/Bowden transmissions, torque-sensed architectures (including integrated force–torque sensing), and another category for rare or hybrid designs that did not fit the above. Fault modes were harmonised from each study’s native terminology into sensor faults (bias, drift, quantisation, dropout), transmission/drive faults (backlash, stiction, slack, tooth wear, partial failure), control/actuation faults (saturation, coil/open-circuit, miscalibration), thermal/overload, and other/mixed. For SEA, the predominance of “other/mixed” reflects compliance-related heterogeneity that precluded a stable sub-labelling across sources. FDD pipelines were categorised as model-based observers/parity relations, parameter-estimation approaches, signal-processing with change detection, and data-driven/ML; composite pipelines were tagged by their dominant mechanism. Validation environments were grouped at the study level under a single best descriptor—simulation, hardware-in-the-loop/benchtop, or on-body/clinical. Where platform information was not explicitly reported, bibliographic indexers were captured separately and labelled in tables as Indexers (PubMed/DOI). For cross-study comparability, metric reporting was coded Yes/No for ACC, F1, MDFA, TTD, and FAR; derived variables included publication year (continuous), period window (Pre/Pandemic/Post), and platform group. Data collation, deduplication, and codebook-based variable coding were performed in Microsoft Excel 2019 (Microsoft Corp., Redmond, WA, USA).
Fault-injection protocol and clinical relevance (MDFA). For studies reporting minimal detectable fault amplitude (MDFA), we coded the fault-induction procedure (fault type, injection site, dwell/background motion, and measurement units—e.g., Δτ in N·m for torque deficits, Δθ in degrees for backlash/slack, ΔI/THD for PMSM current anomalies). Within our framework, MDFA is the smallest fault magnitude that reaches a prespecified detection probability at a fixed operating point (τ) and task context. To anchor clinical relevance, we recommend calibrating benchtop/HIL injections to task-phase operating envelopes (e.g., stance vs. swing, reaching vs. load-holding), using human-level surrogates (assistive torque profiles, ROM limits, temperature/derating limits) and reporting MDFA alongside the human-task reference (e.g., percent of nominal assistive torque, degrees relative to joint ROM). This ties detectability to conditions that matter for pHRI comfort and risk controls, without prescribing a disease- or device-specific threshold a priori.

2.6. Outcomes

The primary outcomes were the probabilities of reporting ACC/F1, MDFA, TTD, and FAR as functions of actuator family, period window, year, and platform group. Secondary outcomes assessed the association between actuator family and fault class, as well as the distribution of platform groups across periods.
Threshold selection for TTD and FAR. Time-to-detect (TTD) is reported both as milliseconds and as human-event units (e.g., fractions of a gait cycle or repetitions), and false-alarm rate (FAR) is normalised to operating time (per hour) or task repetitions, always at the stated operating point (τ). Rather than enforcing universal cut-offs, we align thresholding with ISO-style risk management: target TTD is constrained by the window within which a mitigation remains effective (e.g., before heel-strike, before a load transfer), and target FAR is set below the nuisance level that would degrade user trust or trigger unnecessary safety responses for the given task. Each study should therefore state (i) the operating point τ and calibration rule, (ii) the TTD unit and task phase, and (iii) FAR with denominator and confidence intervals.

2.7. Statistical Analysis

Descriptive summaries are reported as n (%) with one decimal place. Associations between categorical variables were tested with χ2 tests; Fisher’s exact test was used when expected counts were <5. Effect size for multi-level associations is Cramér’s V. The annual trend in the number of included studies was examined using Spearman’s rank correlation (ρ). For each metric of interest (ACC/F1, MDFA, TTD, FAR), logistic generalised linear models with a binomial link were fitted to estimate the probability that the metric was reported. All models were simultaneously adjusted for actuator family, period window (Pre/Pandemic/Post), calendar year (continuous), and platform group. Results are presented as adjusted odds ratios (ORs) with 95% confidence intervals, summarised in a forest plot on a logarithmic OR scale. In strata with complete separation or zero cells, ORs were not estimable and were denoted NA–NA; these instances were interpreted cautiously, and no ad hoc continuity corrections were applied. Where multiple comparisons were applied, the false discovery rate was controlled using the Benjamini–Hochberg procedure and adjusted p-values are reported as p_BH. Statistical analyses were conducted in IBM SPSS Statistics v26 (IBM Corp., Armonk, NY, USA); tabulations, data verification, and figure assembly were based on SPSS outputs, with data handling performed in Microsoft Excel 2019 (Microsoft Corp., Redmond, WA, USA).
Operating point and trade-off. Because the operating point (τ) determines the balance between sensitivity to small faults (MDFA) and no-fault specificity (FAR), for each study we extracted the declared τ (or decision rule), the unit used for TTD (milliseconds or task-phase fraction), and any nuisance-alarm controls (e.g., hysteresis, refractory windows, majority voting, state-dependent gating). Where multiple operating points were reported, the primary τ specified by the authors was used. No universal thresholds were imposed by this review.

2.8. Reproducibility and Data Handling

All variables were extracted directly from included articles and coded according to the taxonomy above. The working dataset and coding sheet can be shared upon reasonable request to the corresponding author, subject to publisher and project confidentiality; no new human or animal studies were conducted.

3. Results

3.1. Overview of Study Set

The annual trend was evaluated using Spearman’s rank correlation between calendar year and the number of included studies (ρ = 0.97, p = 3.6 × 10⁻⁶). A total of 127 peer-reviewed studies [3,7,8,9,10,11,12,13,14,15,16,17,18,19,20,21,22,23,24,25,26,27,28,29,30,31,32,33,34,35,36,37,38,39,40,41,42,43,44,45,46,47,48,49,50,51,52,53,54,55,56,57,58,59,60,61,62,63,64,65,66,67,68,69,70,71,72,73,74,75,76,77,78,79,80,81,82,83,84,85,86,87,88,89,90,91,92,93,94,95,96,97,98,99,100,101,102,103,104,105,106,107,108,109,110,111,112,113,114,115,116,117,118,119,120,121,122,123,124,125,126] published between 2016 and 2025 were identified and included. By actuator family, the distribution was SEA 31/127 (24.4%), PMSM 26/127 (20.5%), Cable/Bowden 25/127 (19.7%), HD 23/127 (18.1%), and torque-sensed (F–T) 22/127 (17.3%). The annual volume shows a consistent increase across the observation window (Spearman’s ρ = 0.97, p = 3.6 × 10⁻⁶) (Figure 1, Table 1).
Studies were located across multiple publisher platforms and indexes. Most articles appeared in MDPI (47/127, 37.0%, 95% CI 29.1–45.7), followed by ScienceDirect/Elsevier (28/127, 22.0%, 15.7–30.0), PubMed/PMC (13/127, 10.2%, 6.1–16.7), and Other (12/127, 9.4%, 5.5–15.8). Additional sources contributed smaller fractions: SpringerLink/Nature (6/127, 4.7%, 2.2–9.9), Indexers (PubMed/DOI) (5/127, 3.9%, 1.7–8.9), ASME Digital Collection (4/127, 3.1%, 1.2–7.8), Wiley/Hindawi (3/127, 2.4%, 0.8–6.7), arXiv (3/127, 2.4%, 0.8–6.7), Frontiers (2/127, 1.6%, 0.4–5.6), and single entries from IEEE Xplore, IET Digital Library, SAGE Journals, and PLOS (each 1/127, 0.8%, 95% CI 0.1–4.3).
Regarding validation context, on-body/clinical studies accounted for 27/127 (21.3%, 95% CI 15.0–29.2), while hardware-in-the-loop (HIL) accounted for 23/127 (18.1%, 12.4–25.7); the remaining studies were conducted in benchtop/simulation environments Across the 2016–2025 corpus, electric-drive families typical of contact-rich pHRI dominate the evidence base. The distribution in Figure 2 reflects usage prevalence and platform availability rather than performance per se; percentages may not add up to 100% due to rounding. This scope underpins our actuation-aware analysis of fault manifolds and observable signatures.

3.2. Sub-Analyses by Actuator Families and Defect Types

Fault-type distributions varied systematically across actuator families (Figure 3). Within-family frequencies with 95% Wilson confidence intervals are reported in Table 2. The overall association between actuator family and fault class was statistically significant and extensive (χ2(20) = 361.28, p = 2.10 × 10−64; Cramér’s V = 0.84), indicating a non-random concentration of fault themes by technology.
For Cable/Bowden systems, tendon elongation/slack/routing (Δθ trend) was most frequent (13/25, 52.0%; 95% CI 33.5–70.0), followed by transmission non-idealities—friction/hysteresis/backlash (11/25, 44.0%; 26.7–62.9).
In harmonic-drive (HD) studies, transmission error and wear (including lubrication effects) dominated (16/23, 69.6%; 49.1–84.4), with the remainder categorised as other/mixed (7/23, 30.4%; 15.6–50.9).
For PMSM drives, electrical faults (ITSC, demagnetisation, eccentricity) were most prevalent (20/26, 76.9%; 57.9–89.0), with other/mixed faults less represented (6/26, 23.1%; 11.0–42.1).
In series-elastic actuation (SEA), reports were predominantly other/mixed (30/31, 96.8%; 83.8–99.4), with isolated sensor drift/temperature (1/31, 3.2%; 0.6–16.2); the predominance of “other/mixed” reflects heterogeneous compliance behaviours that precluded stable sub-labelling across sources.
Torque-sensed (F–T) architectures concentrated on sensor drift/temperature/cross-talk (17/22, 77.3%; 56.6–89.9), with other/mixed comprising the remainder (5/22, 22.7%; 10.1–43.4).
These patterns align with expected mechanisms: geometry- and routing-driven effects in Cable/Bowden (Δθ = θ_motor − θ_joint), transmission-error growth and wear in HD gearings, current-signature anomalies in PMSM, heterogeneous compliance-related behaviours in SEA, and offset/temperature sensitivities in F–T sensing chains. Percentages are rounded to one decimal place; minor discrepancies may reflect rounding.
Year-wise proportions by fault class are shown in Figure 4. Logistic trend estimates (OR per +1 year) with BH-FDR q-values (Table 3) did not identify statistically significant changes after multiplicity control (all q > 0.05). Directionally, sensor drift/temperature increased modestly (OR 1.29; 95% CI 0.90–1.86; q = 0.5924), and bearing faults showed a wide-interval increase (OR 2.66; 0.41–17.18; q = 0.6743), whereas HD transmission-error/wear trended slightly downward (OR 0.93; 0.77–1.12; q = 0.8682); the width of intervals counsels cautious interpretation.

3.3. Metric Reporting and Gaps (TTD, MDFA, FAR, ACC/F1)

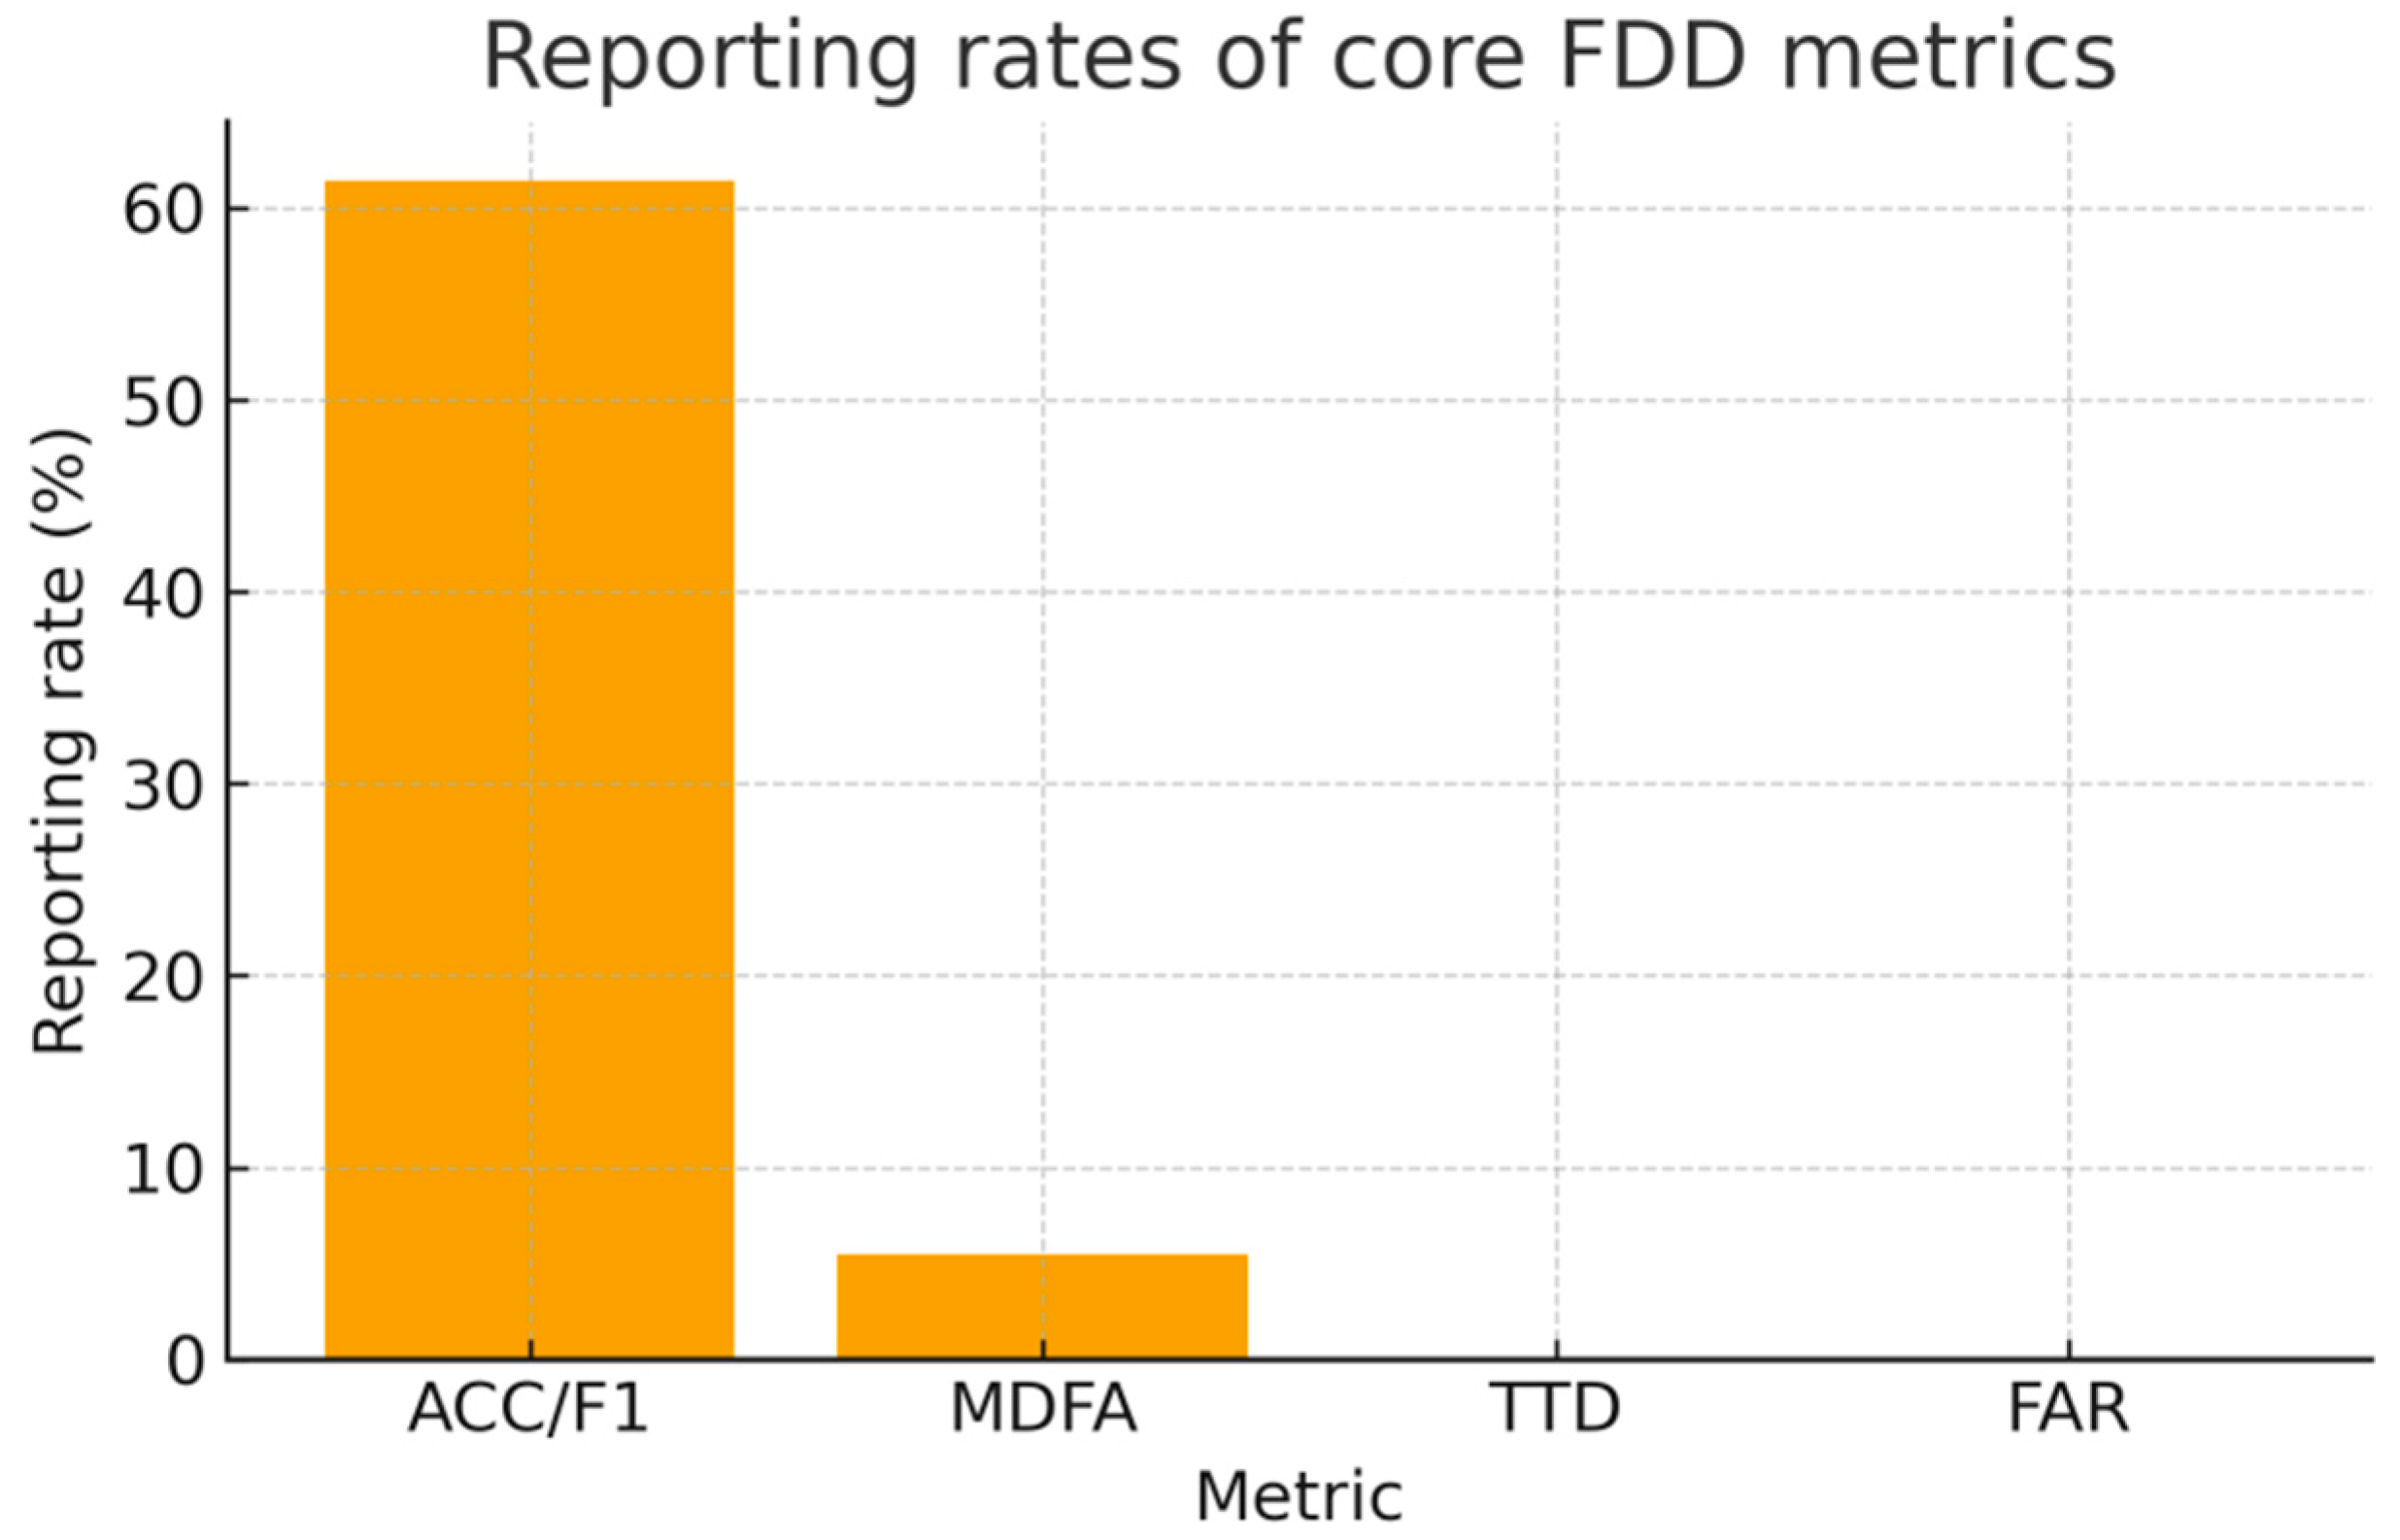
To account for potential confounding, logistic generalised linear models (binomial link) with fixed effects for actuator family, temporal window (Pre/Pandemic/Post), calendar year, and platform group were specified. Reporting patterns were heterogeneous across studies and actuator families. Overall, ACC/F1 was documented in 78/127 (61.4%, 95% CI 52.7–69.4), whereas MDFA appeared infrequently (7/127, 5.5%, 95% CI 2.7–10.9). TTD and FAR were not reported (0/127, 0.0%, 95% CI 0.0–2.9 for each). The gap-plot in Figure 5 summarises these differences.
By actuator family (Table 4). Reporting of ACC/F1 ranged widely: Torque-sensed (F–T) 100.0% (22/22; 95% CI 85.1–100.0), PMSM 88.5% (23/26; 71.0–96.0), SEA 51.6% (16/31; 34.8–68.0), Cable/Bowden 52.0% (13/25; 33.5–70.0), and HD 17.4% (4/23; 7.0–37.1). In contrast, MDFA was reported almost exclusively in HD (30.4%, 7/23; 15.6–50.9), with 0.0% in the other families (upper CI bounds 11.0–14.9%). TTD and FAR were 0.0% across all families (family-specific upper bounds 11.0–14.9%). Chi-square tests indicated non-uniformity for ACC/F1 (p < 0.0001; Cramér’s V = 0.58) and MDFA (p < 0.0001; V = 0.51); TTD and FAR could not be tested due to universal zeros.
Across families, discriminative accuracy (ACC/F1) is reported far more often than safety-relevant sensitivity and timeliness. Minimal detectable fault Amplitude (MDFA) appears infrequently, while time-to-detect (TTD) and false-alarm rate (FAR) are effectively absent. This reporting gap limits cross-study comparability and safety appraisal in pHRI, and it motivates the minimum reporting set codified in our checklist.
By source platform (Table 5). For ACC/F1, proportions were 74.5% in MDPI (35/47; 60.5–84.7), 58.1% in other publisher platforms (18/31; 40.8–73.6), 50.0% in indexers (PubMed/DOI) (9/18; 29.9–70.1), 46.4% in Elsevier/ScienceDirect (13/28; 29.5–64.2), and 100.0% in preprints (arXiv) (3/3; 43.8–100.0; small denominator). For MDFA, the highest fraction appeared in other publisher platforms (12.9%, 4/31; 5.1–28.9), with 1/47 (2.1%) in MDPI (0.4–11.1) and ≤5.6% elsewhere; TTD and FAR were 0.0% across all platform groups (group-specific upper bounds 7.6–56.2% reflecting small denominators). For clarity, FAR is interpreted as the false-alarm rate at the study’s stated decision threshold (τ) when such a threshold is defined.
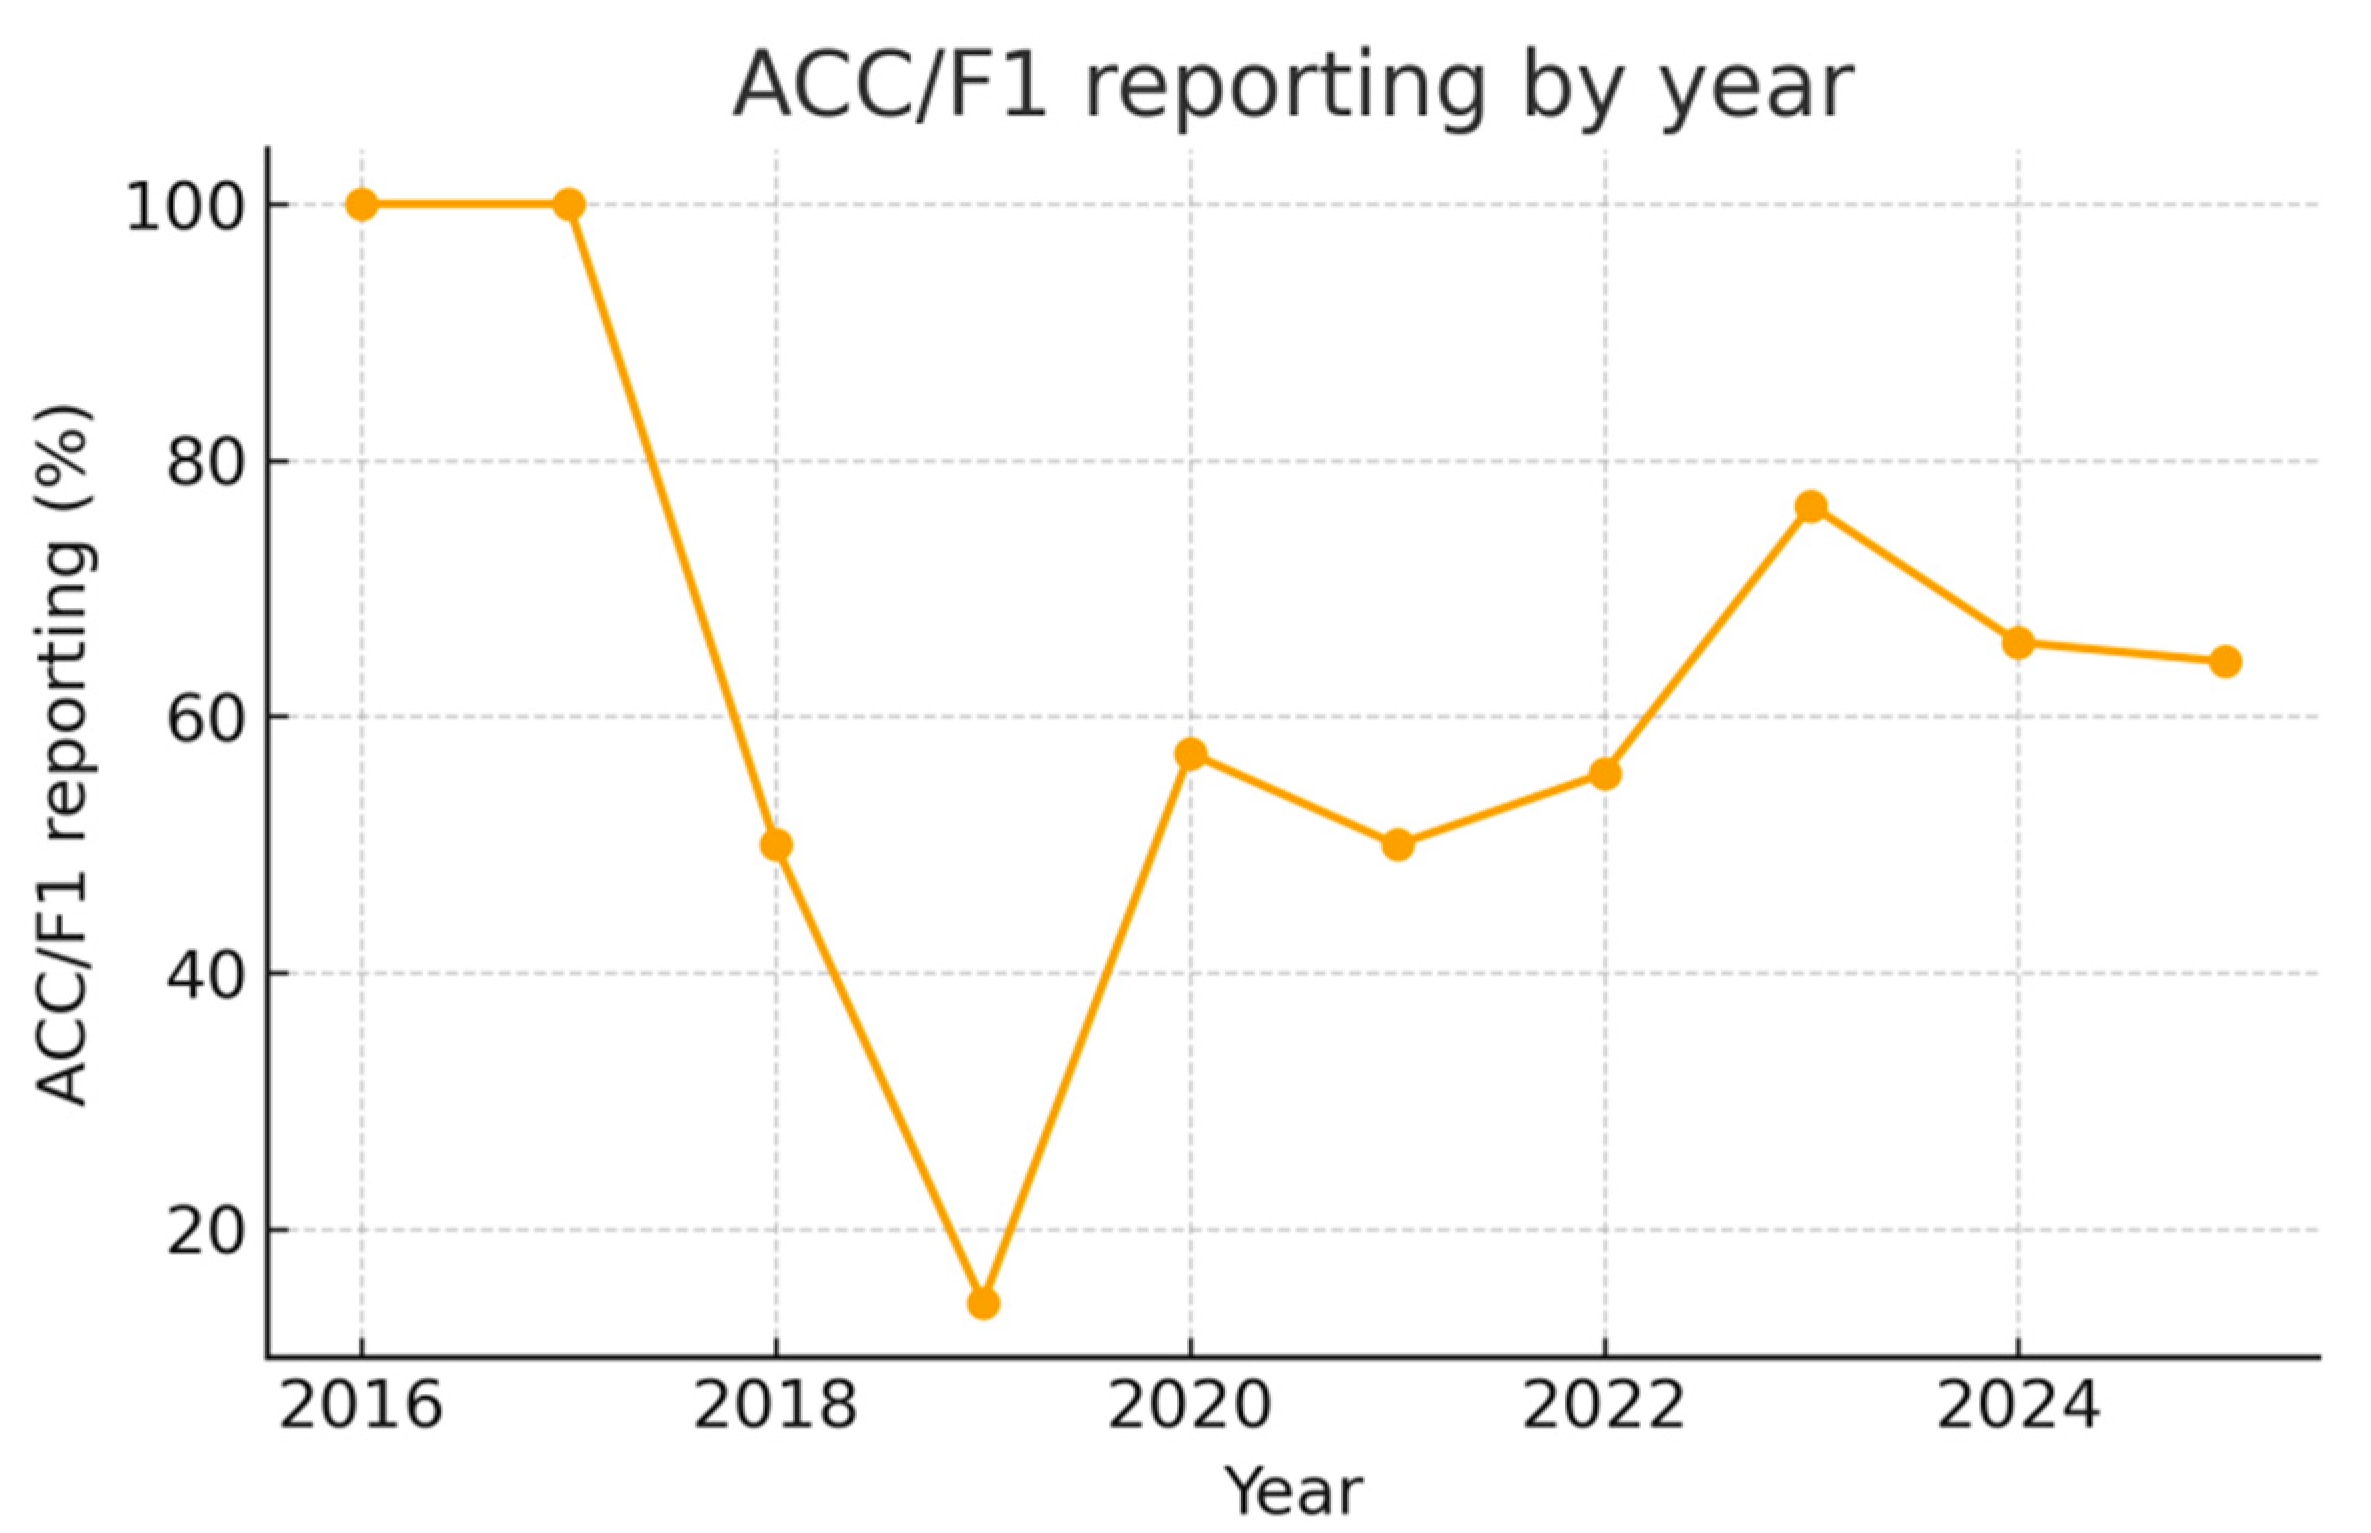
Yearly patterns (Figure 6 and Figure 7). No clear temporal trend was evident. ACC/F1 yearly reporting spanned 14.3–100.0% (Spearman’s ρ = −0.09, p = 0.802), whereas MDFA spanned 0.0–28.6% (ρ = 0.38, p = 0.277).
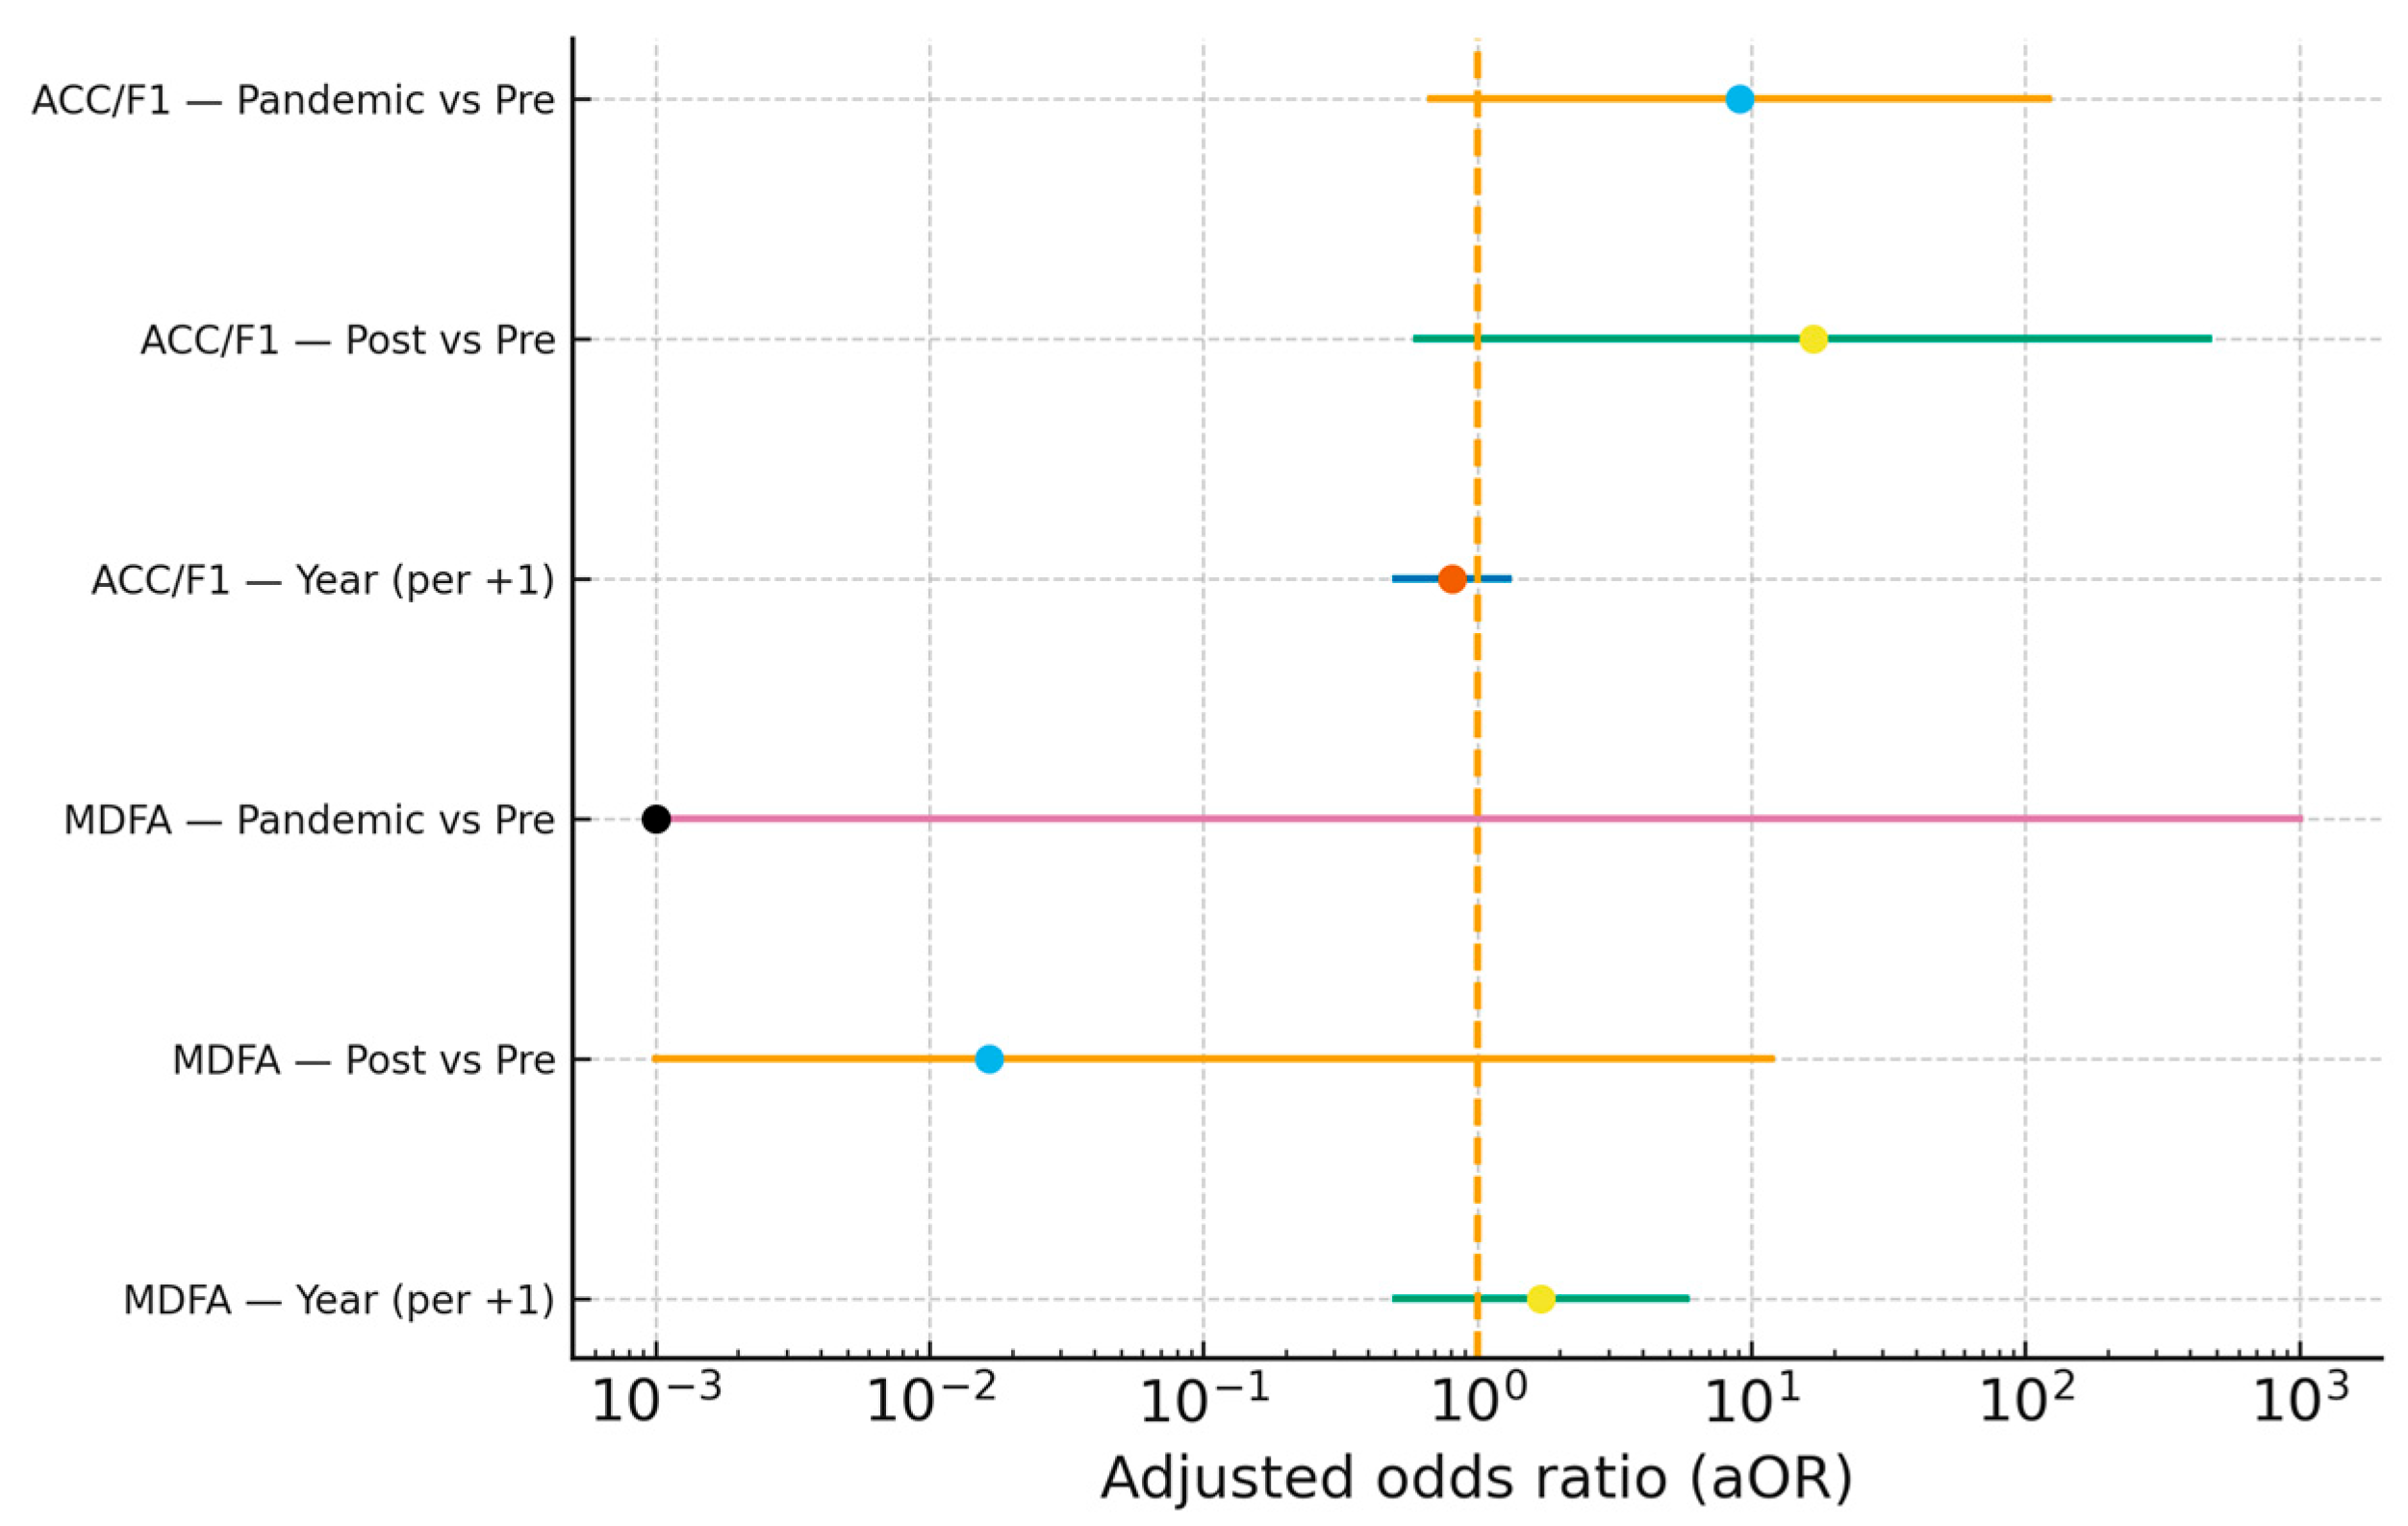
Adjusted analyses. Logistic GLMs with fixed effects for actuator family, period (Pre 2016–2019; Pandemic 2020–2021; Post 2022–2025), calendar year, platform group corroborated the unadjusted contrasts (Table 6; Figure 8), with uncertainty in sparse strata. For ACC/F1, period contrasts showed elevated but imprecise adjusted odds: Pandemic vs. Pre aOR 9.06 (95% CI 0.68–120.84; p = 0.0954); Post vs. Pre aOR 16.78 (0.60–466.52; p = 0.0965); year (per +1) aOR 0.81 (0.50–1.30; p = 0.3772). For MDFA, Pandemic vs. Pre was NA–NA (separation), Post vs. Pre aOR 0.02 (0.00–11.78; p = 0.2209), and year aOR 1.70 (0.50–5.75; p = 0.3931). Multiple testing was controlled using Benjamini–Hochberg FDR.
The field reports discriminative accuracy (ACC/F1) more consistently than detectability thresholds (MDFA) and does not routinely include time-to-detect (TTD) or false-alarm rate (FAR). This imbalance limits comparability and the appraisal of safety-relevant performance, underscoring the need for standardised reporting alongside ACC/F1.

3.4. Database Coverage and Source Bias

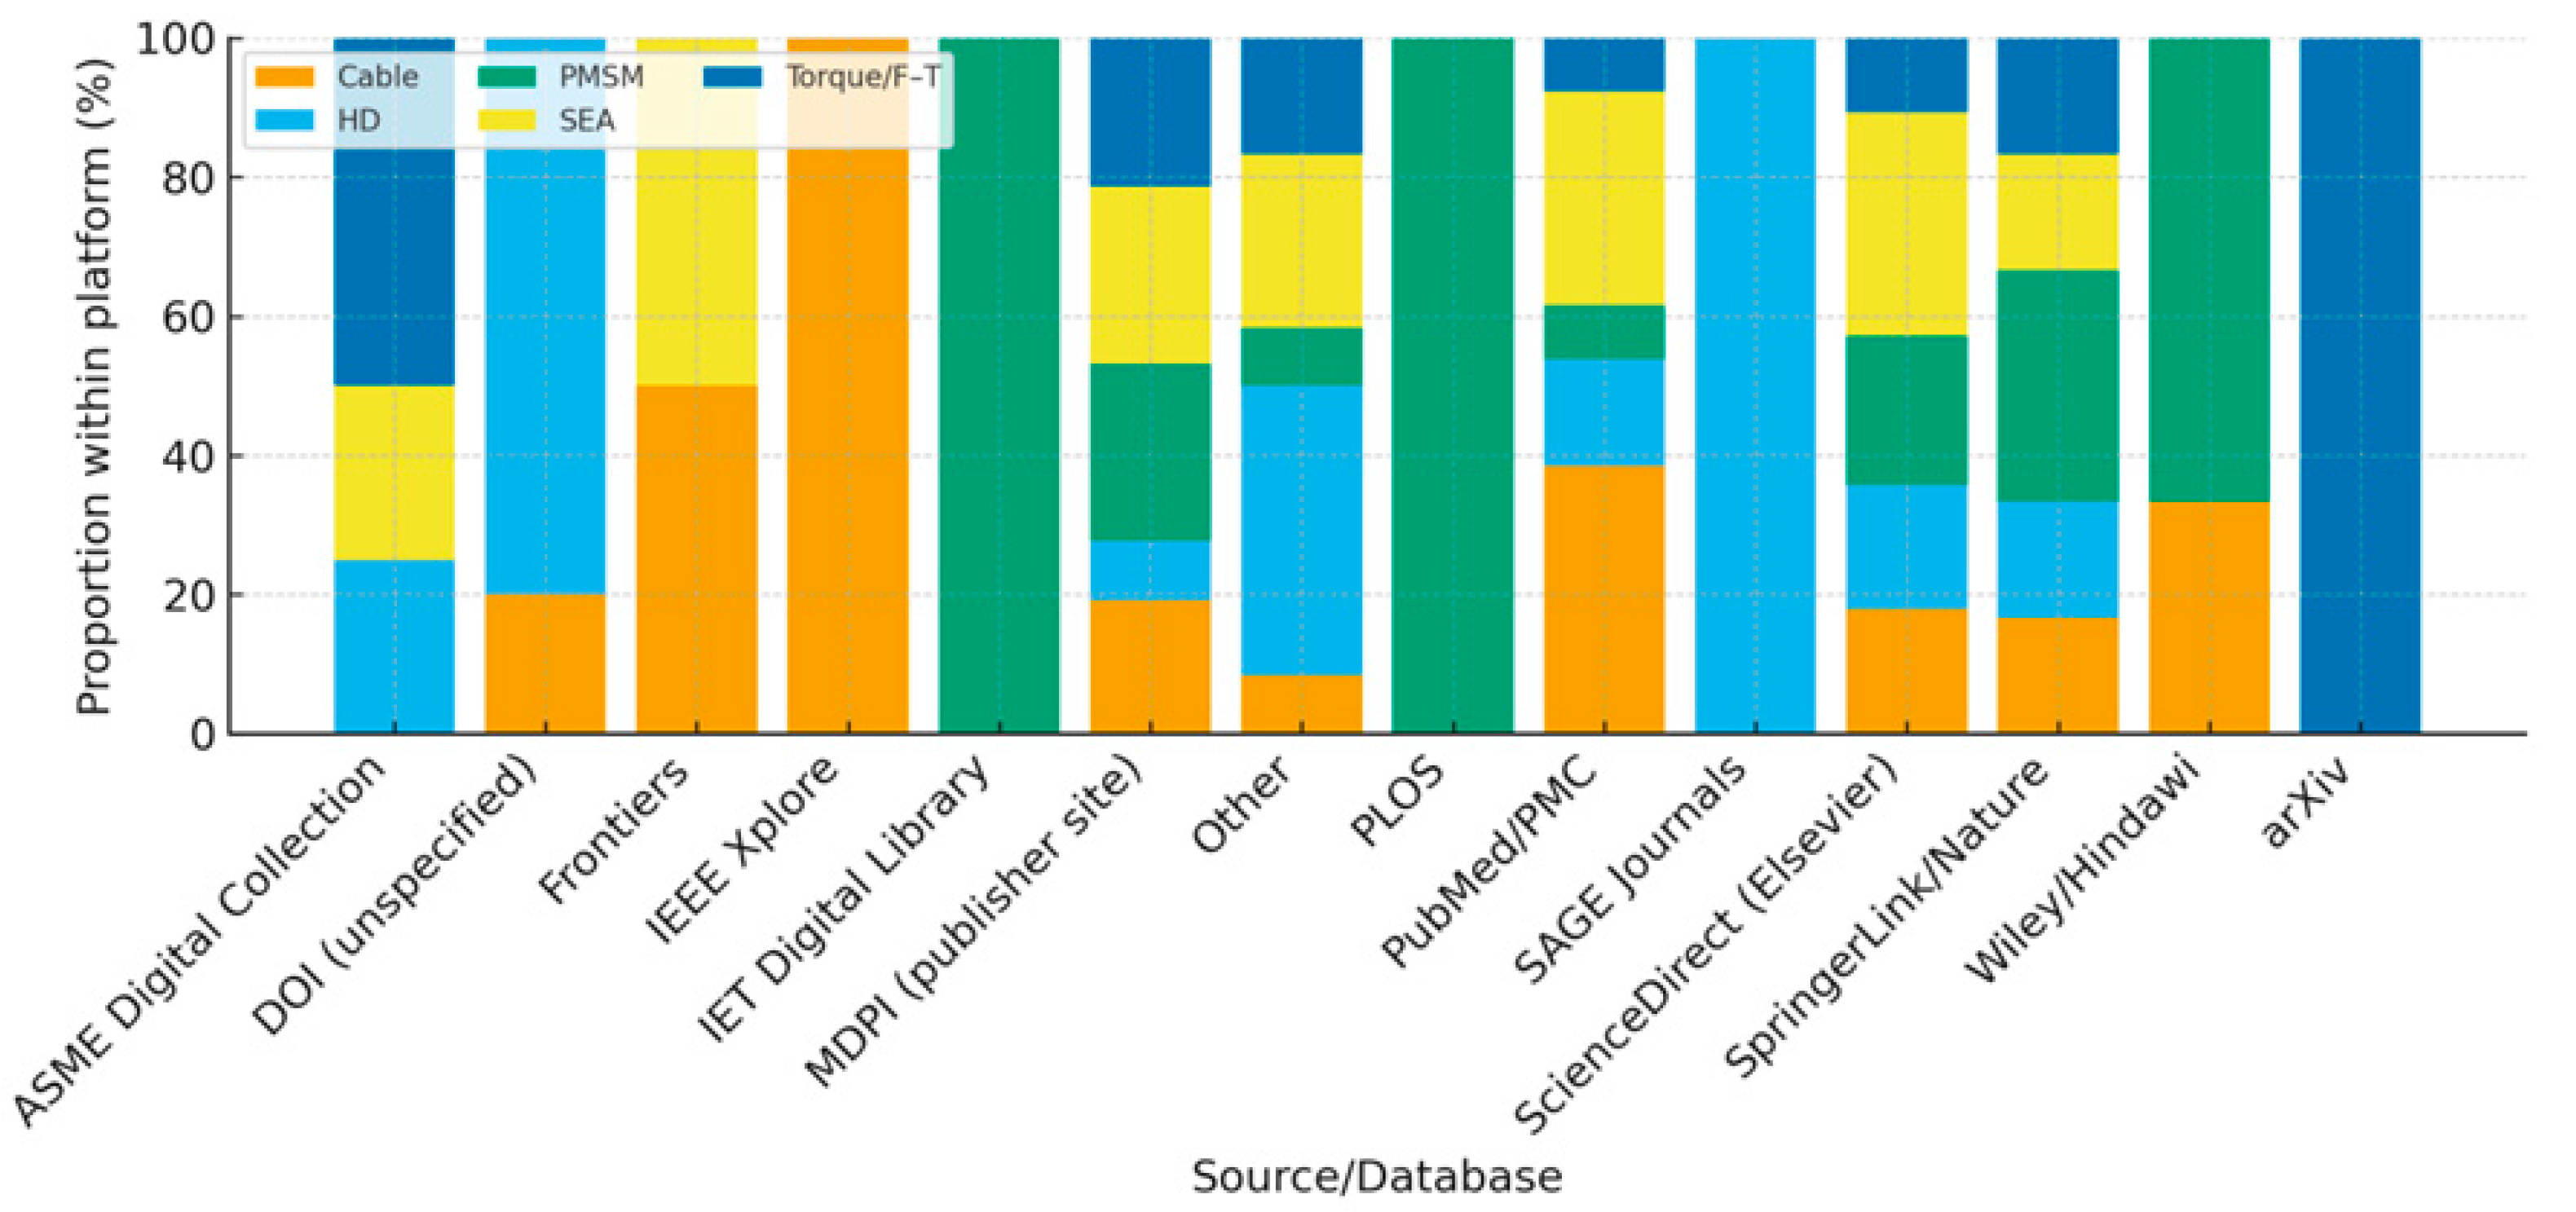
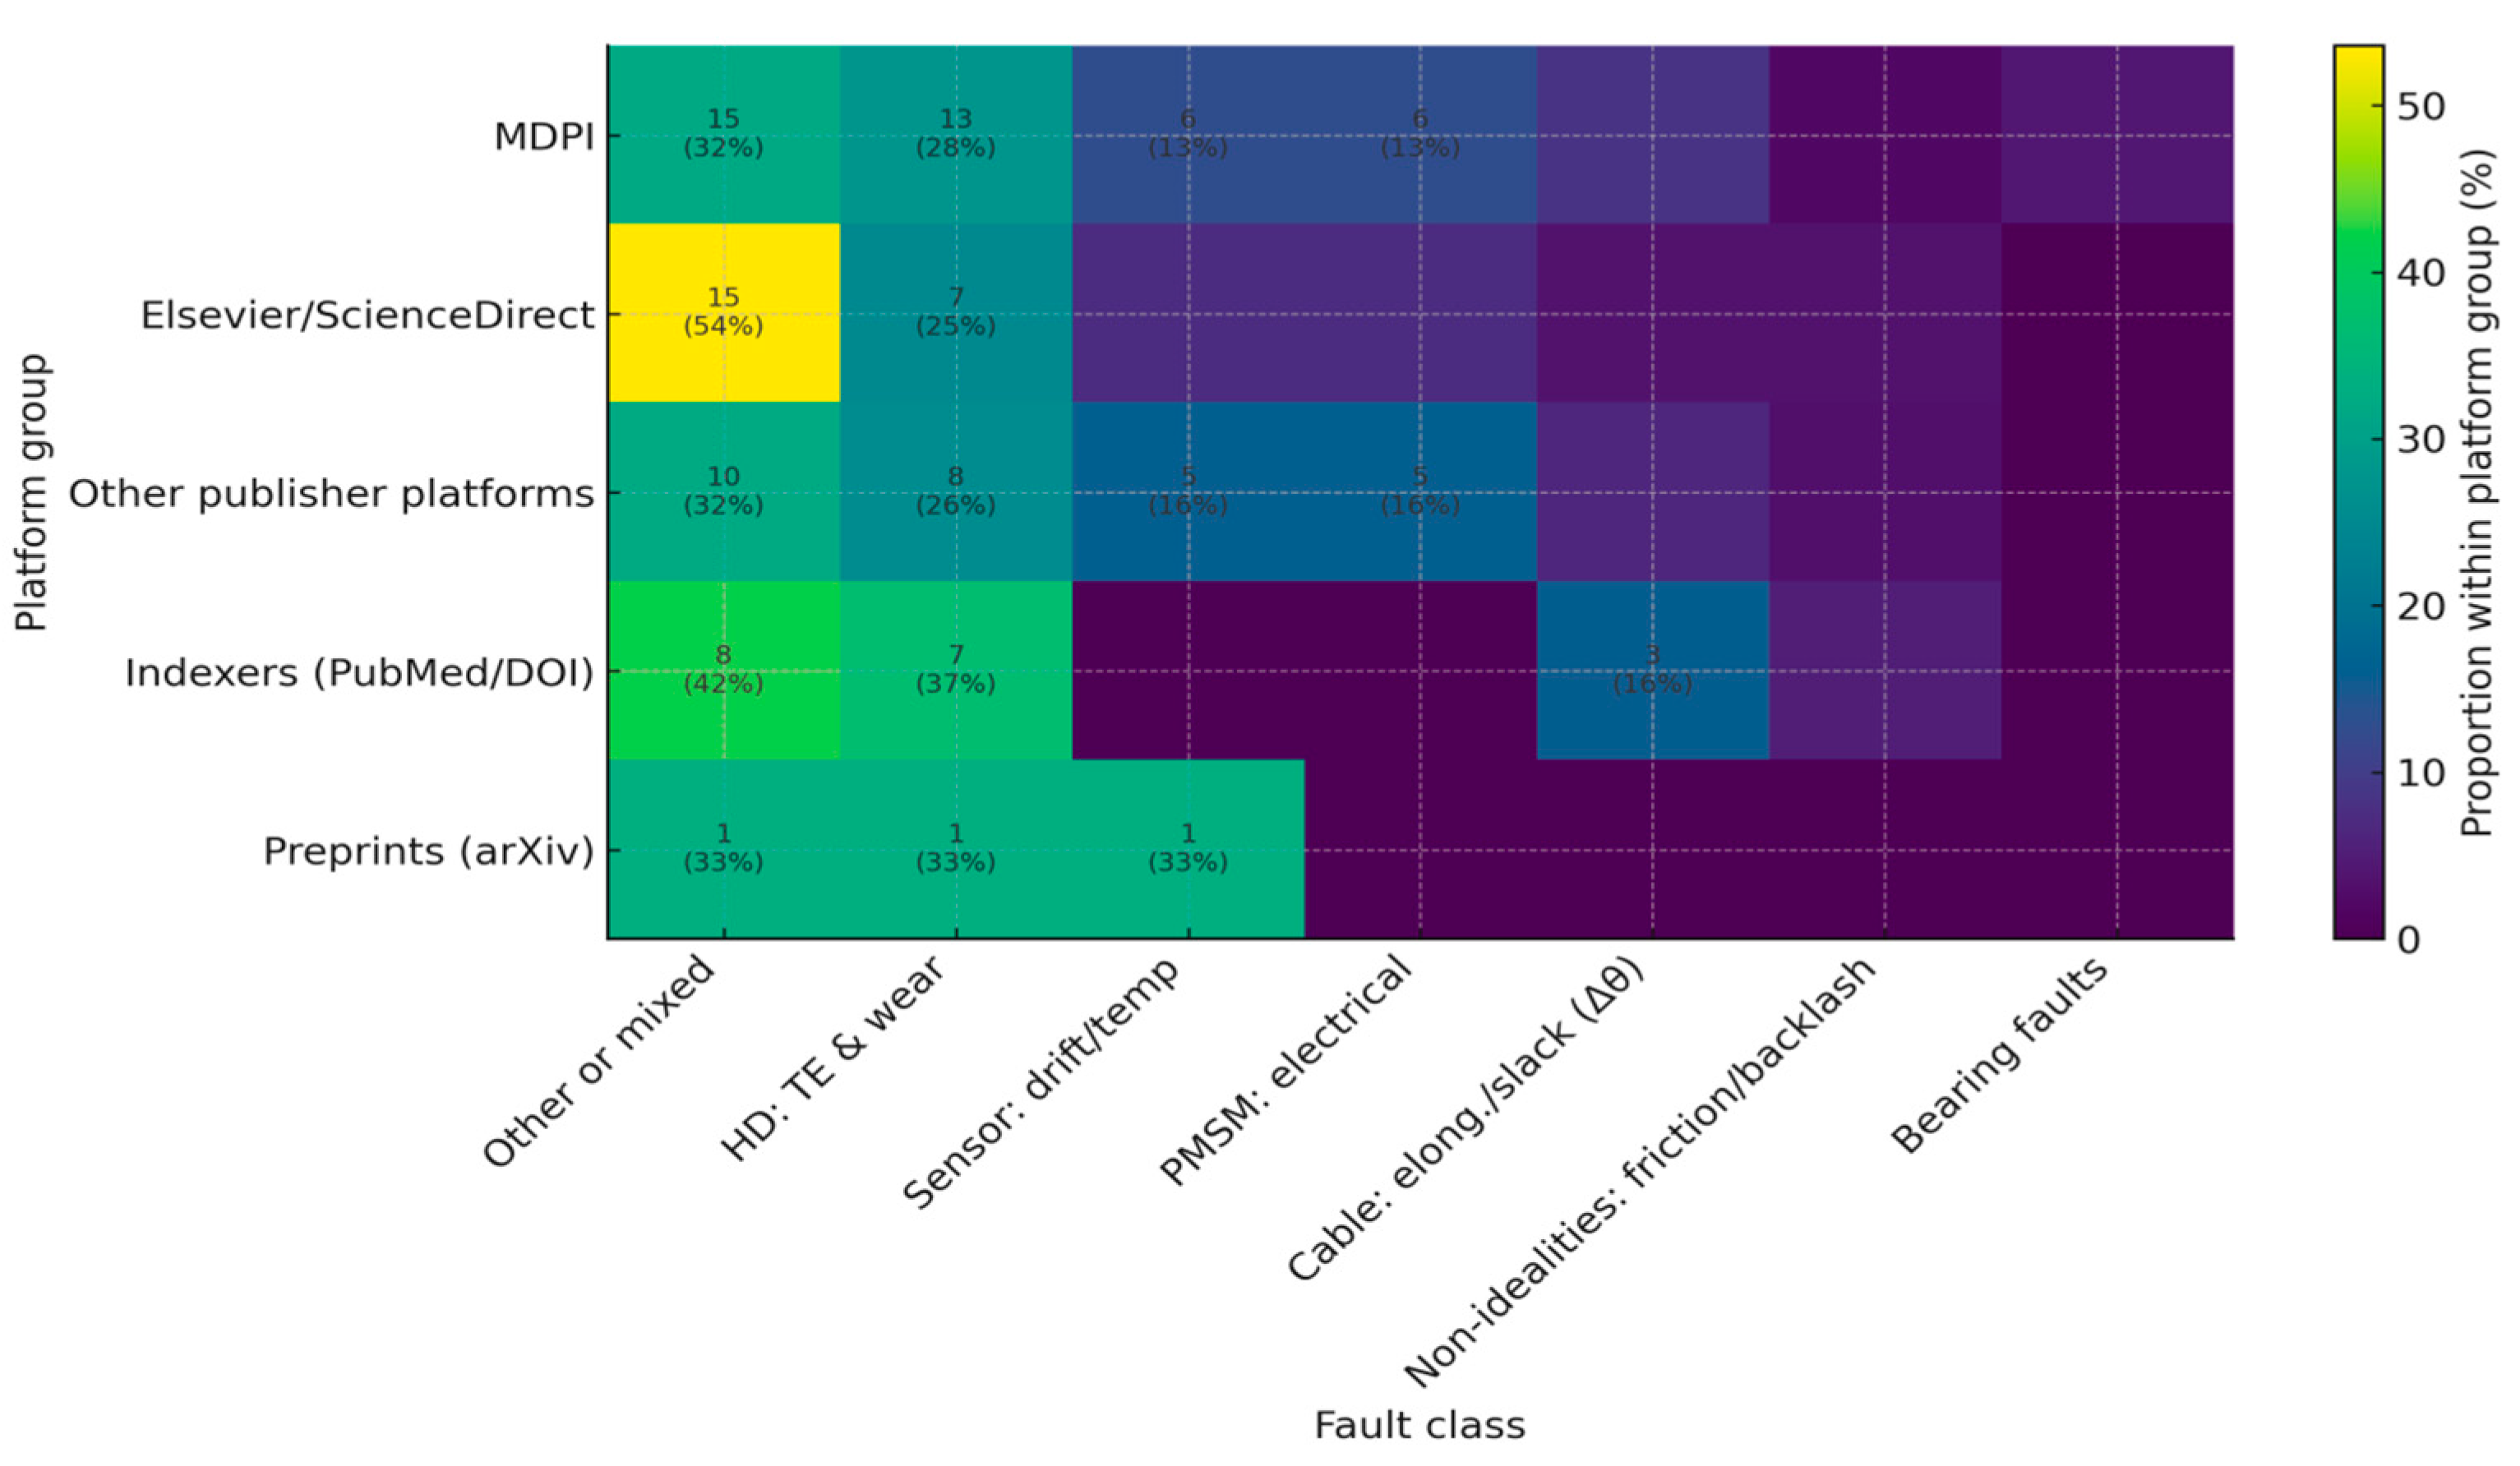
Database stratification indicated variations in topical emphasis but no clear database-driven bias in metric reporting. Across platform groups, χ2 tests did not identify significant differences for ACC/F1 (p = 0.296; Cramér’s V = 0.35) or MDFA (p = 0.729; V = 0.27). Coverage matrices for platform × fault class are shown in Figure 9, with numerical summaries in Table 7. In MDPI, the leading category was other/mixed (19/47, 40.4%), followed by PMSM electrical faults (9/47, 19.1%), with Cable/Bowden Δθ (12.8%) and F–T drift/temperature/cross-talk (14.9%) represented at moderate levels; HD transmission error and wear and friction/hysteresis/backlash each contributed 6.4%. In Elsevier/ScienceDirect, other/mixed again dominated (12/28, 42.9%), with PMSM electrical at 21.4% and three categories at 10.7% each (HD TE and wear, F–T drift/temp/cross-talk, friction/hysteresis/backlash); Cable Δθ was 3.6%. For other publisher platforms (Springer/Wiley/ASME/SAGE/PLOS/Frontiers/IEEE/IET/Other), other/mixed remained highest (11/31, 35.5%), while F–T drift/temp/cross-talk, HD TE & wear, and PMSM electrical each accounted for 16.1%; Cable Δθ was 6.5% and friction/backlash 9.7%. Among Indexers (PubMed/DOI), the profile was more evenly split—other/mixed (6/18, 33.3%), HD TE & wear (27.8%), and Cable Δθ (22.2%), with PMSM electrical 0.0% in this group. Preprints (arXiv) had a minimal denominator (N = 3): F–T drift/temp/cross-talk reached 66.7%, while other/mixed contributed 33.3%; other categories were 0.0%.
Taken together, platforms differ mainly in topic mix, not in metric-reporting behaviour: “other/mixed” is consistently the most represented class across large groups (MDPI, Elsevier/ScienceDirect), while the relative prominence of PMSM electrical and HD TE and wear varies by source. These patterns support the interpretation of broad thematic coverage rather than tight specialisation at the database/platform level. Proportions are computed within the platform group; caution is warranted when the denominators are small.
Beyond metric reporting, the within-year method mix was dominated by model-based approaches (11.8–100.0% per year), with data-driven approaches contributing 3.6–12.5%. This composition supports the interpretation that gains in discriminative accuracy co-exist with limited reporting of MDFA/TTD/FAR, rather than reflecting a wholesale methodological shift.

3.5. Period Effects (Pre 2016–2019; Pandemic 2020–2021; Post 2022–2025)

Period-stratified analyses were conducted to explore shifts in topic mix, validation practice, and metric reporting. Annual counts by fault class were modelled using Poisson regression with a log-offset for yearly totals (switched to negative binomial when over-dispersion was detected), including fixed effects for period and period × fault-class interaction (Table 8; Figure 10). The probability of reporting hardware-in-the-loop (HIL) was examined with logistic regression, including period and actuator family (Table 9). For metric reporting, separate logistic models considered ACC/F1 and MDFA (Table 10); TTD and FAR were unreported across all periods and are summarised descriptively. Period-wise platform distributions are shown in Table 11 and Figure 11, with χ2 and Cramér’s V quantifying association strength.
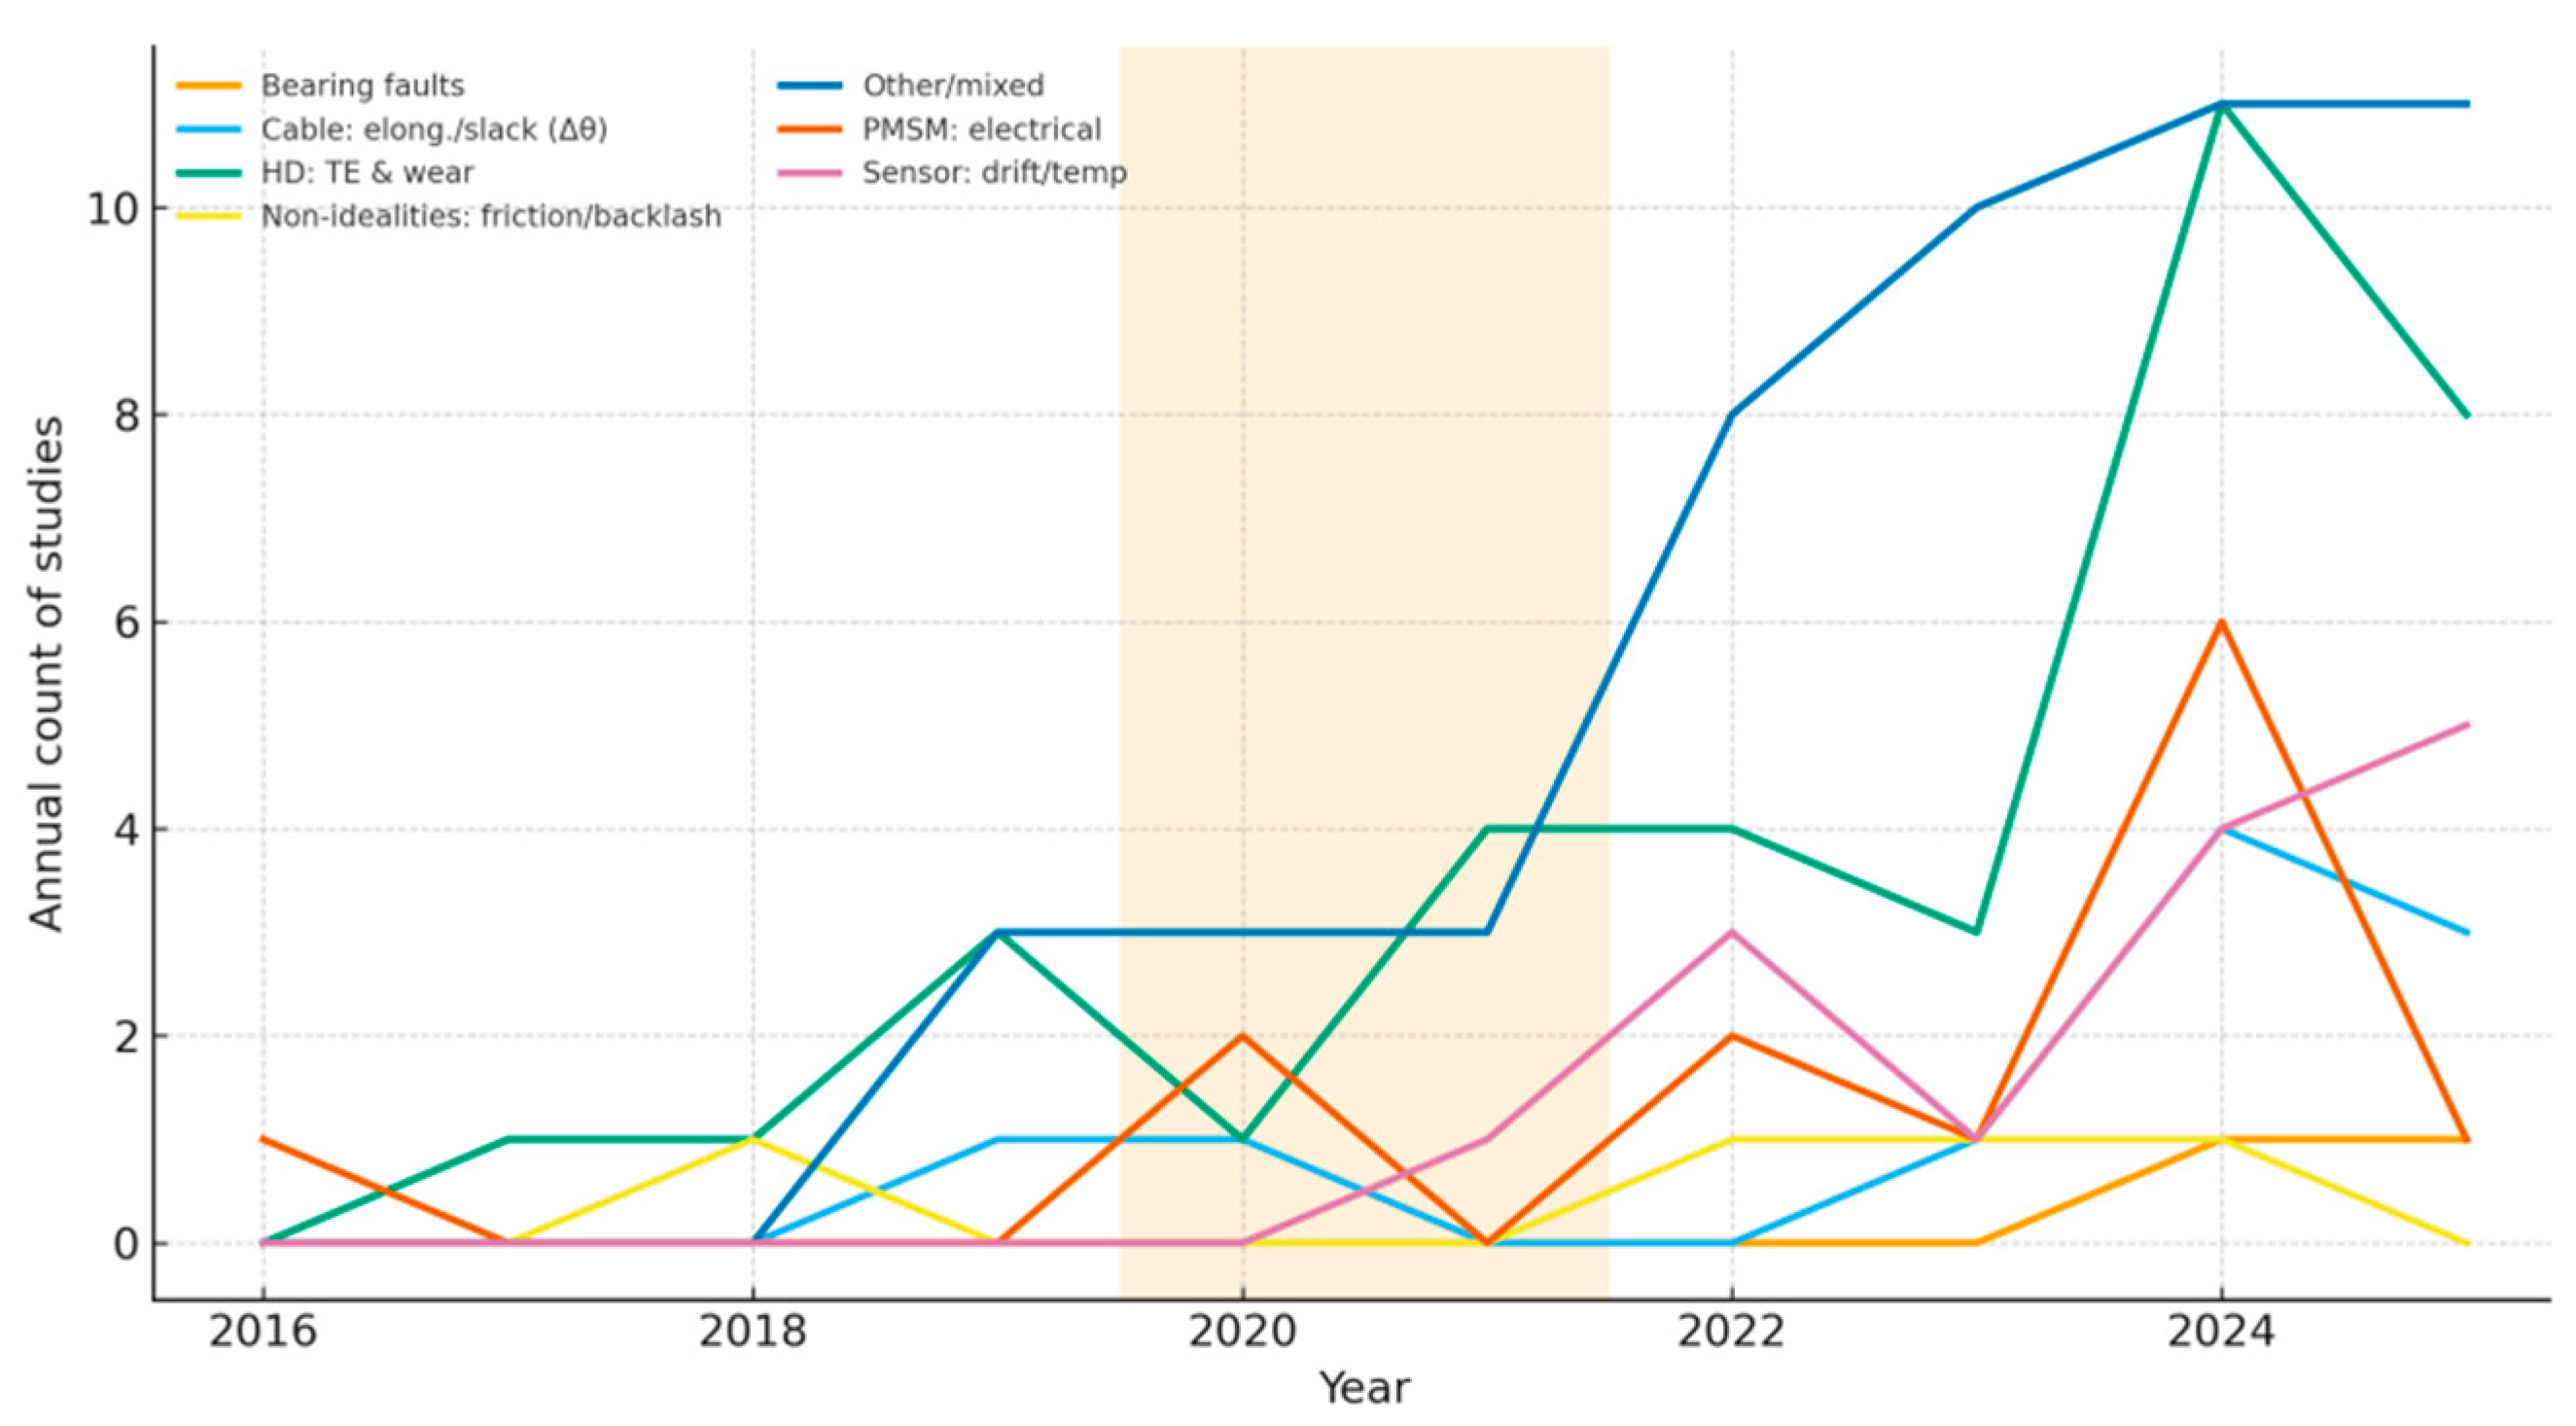
In Figure 10, the shaded band marks the 2020–2021 Pandemic window defined in Materials and Methods. Yearly counts are sparse in several classes, so apparent fluctuations should be interpreted cautiously. A few contrasts (e.g., non-idealities and PMSM electrical categories) show relative decreases/increases across windows, but sample sizes preclude inferential claims.
Confidence intervals were wide for several classes due to sparse yearly counts. Two Post-vs.-Pre contrasts showed RR < 1 with 95% CIs not crossing 1: Non-idealities (friction/backlash) (RR 0.08; 95% CI 0.01–0.79) and PMSM electrical faults (RR 0.10; 0.01–0.77), suggesting relative declines in these topics during the Post window. Other contrasts (e.g., HD transmission error and wear RR 0.51; 0.20–1.33) were imprecise and compatible with no change. Several classes were NA in specific windows (e.g., bearing faults, sensor drift/temperature), reflecting zero events and limited power. Interpretation remains cautious given multiple comparisons and heterogeneous denominators across years.
Odds ratios for HIL usage were 0.30 (95% CI 0.05–1.70) for Pandemic vs. Pre and 0.41 (0.12–1.46) for Post vs. Pre, indicating no statistically discernible shift in HIL prevalence across periods within the available precision.
For ACC/F1, odds were higher in later windows (Post vs. Pre OR 3.21; 95% CI 0.88–11.70; Pandemic vs. Pre OR 2.00; 0.41–9.84) but intervals include 1.00. For MDFA, odds trended lower in the Post window (OR 0.18; 0.03–1.14) with wide uncertainty. Across all periods, TTD and FAR remained unreported, reinforcing the imbalance noted in Section 3.3.
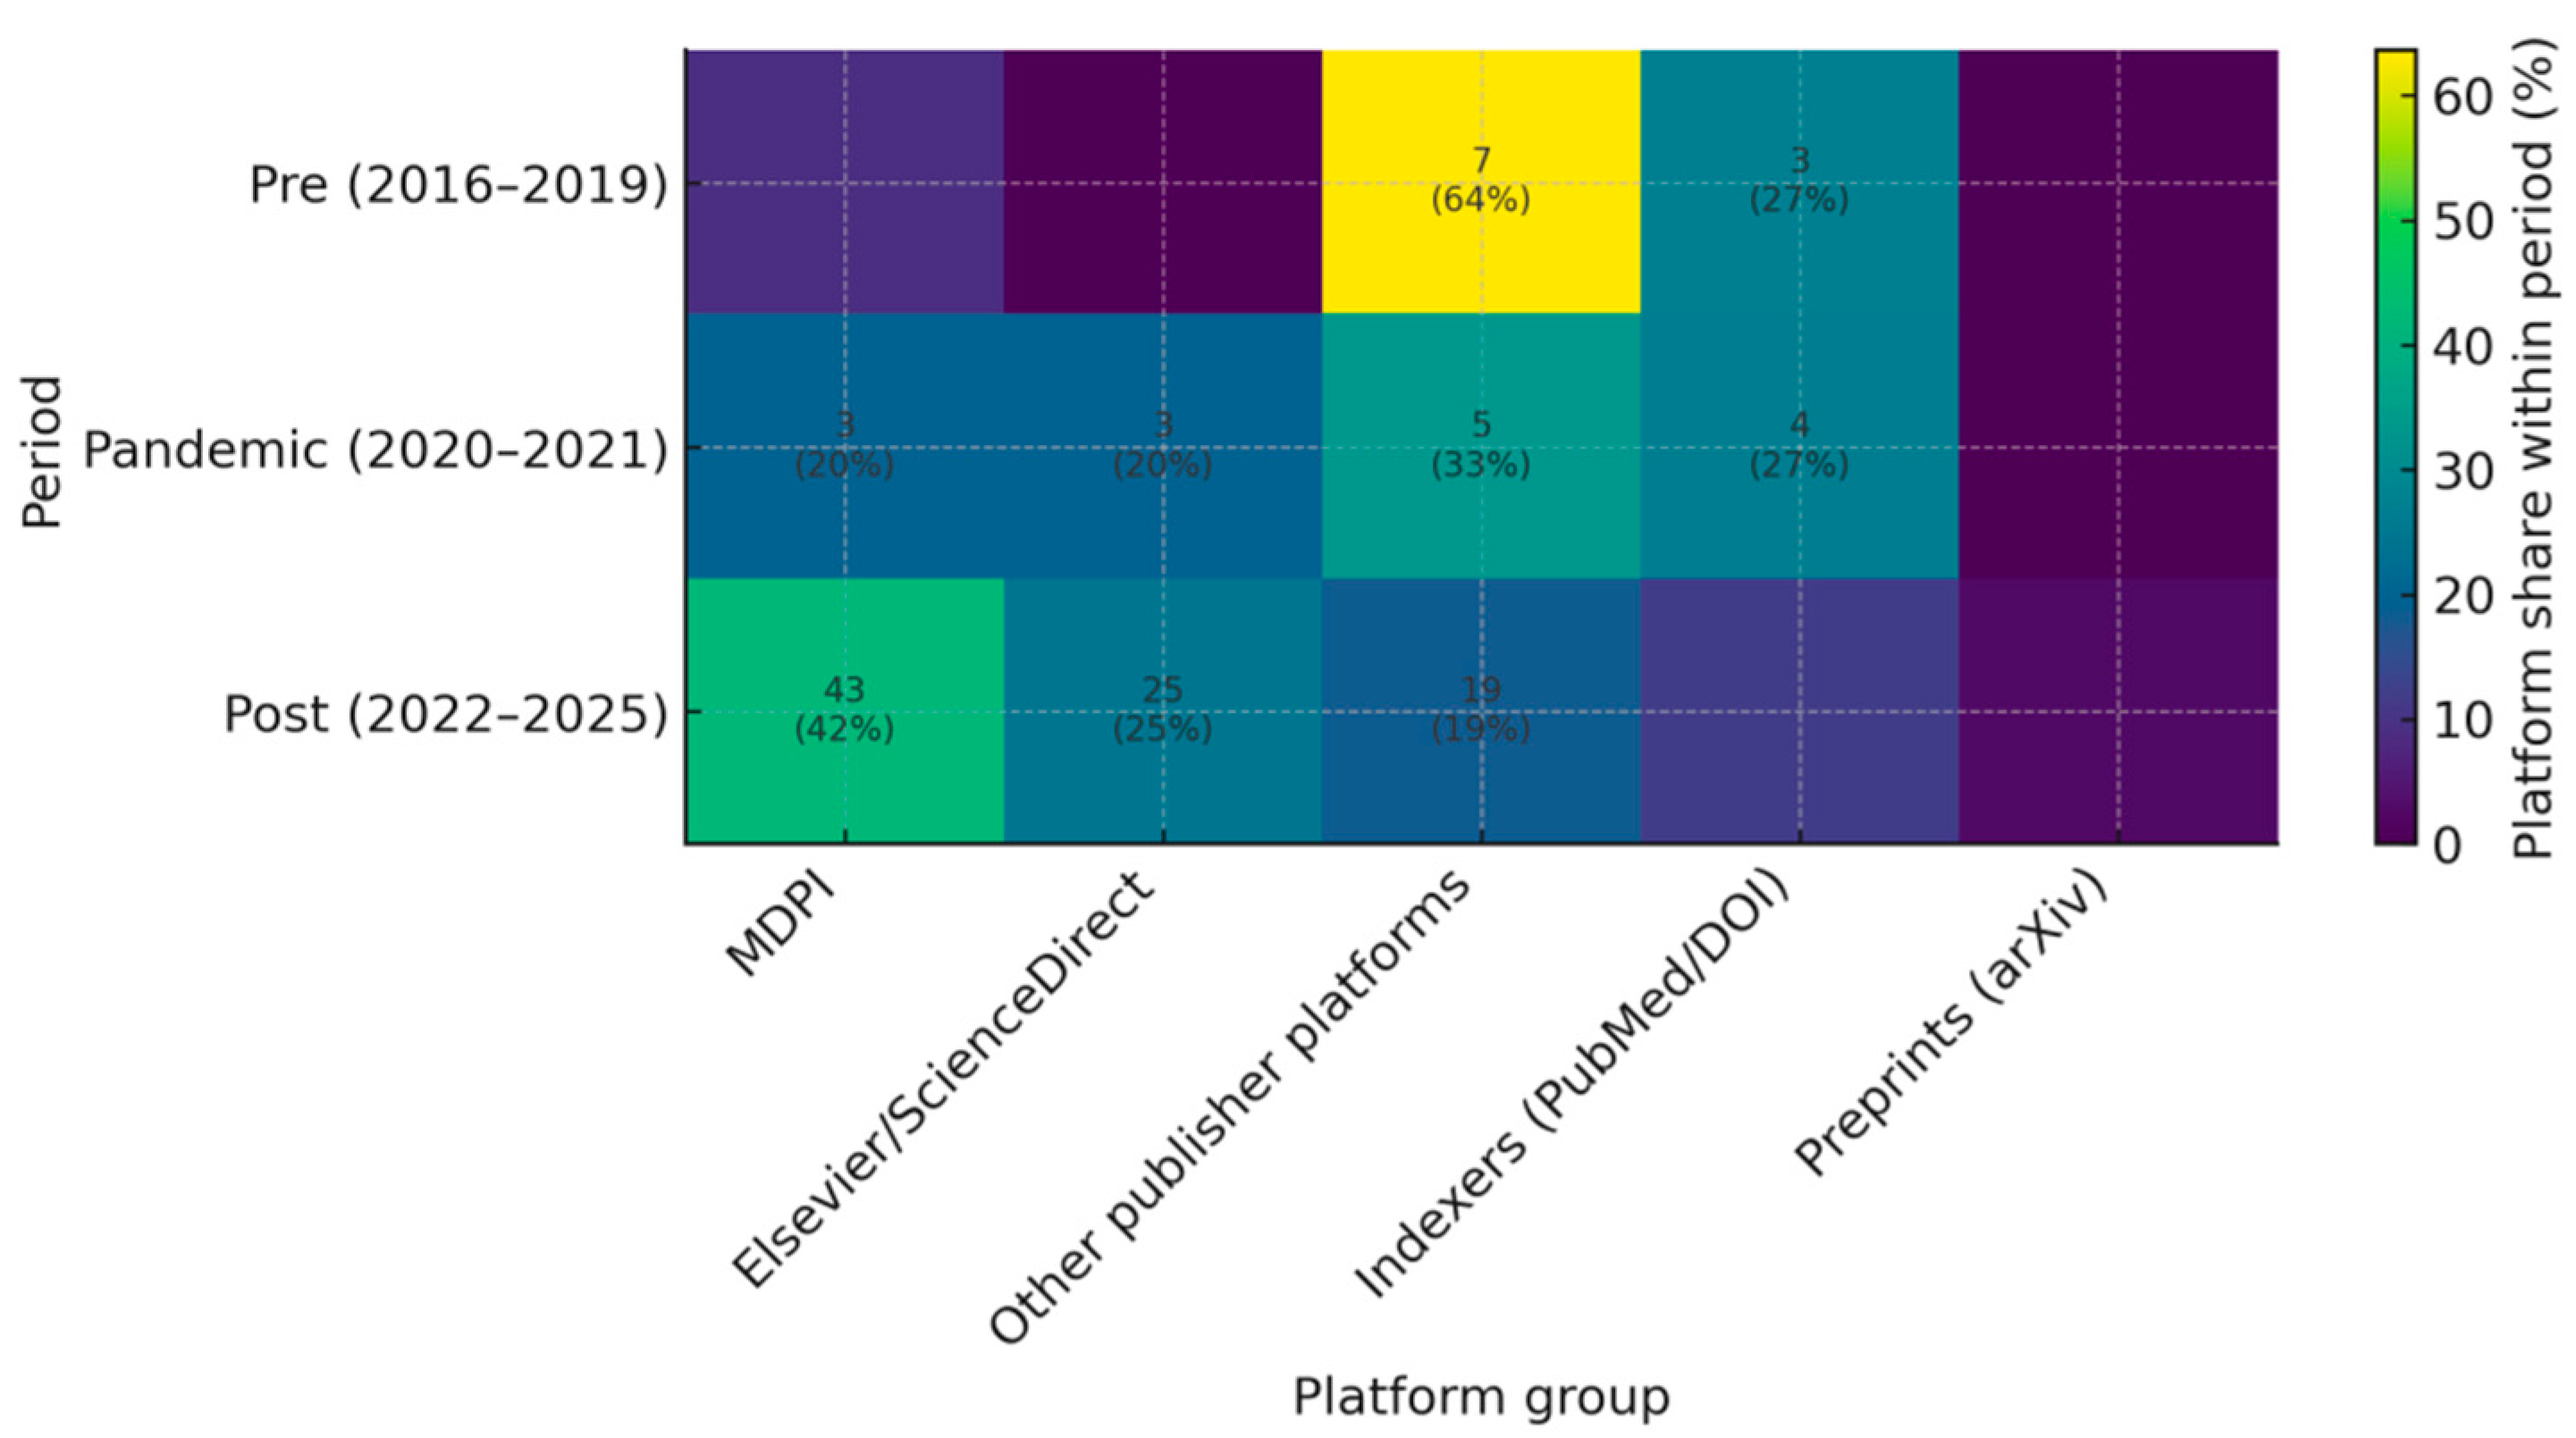
Platform shares varied by period (χ2 = 19.87, df = 8, p = 0.0109; Cramér’s V = 0.279, small–moderate). The Post window was characterised by a larger MDPI share and growth in Elsevier/ScienceDirect, alongside declines in Indexers (PubMed/DOI) and Other publisher platforms. Because platform and period may co-vary with topic mix and reporting practices, period effects are interpreted with appropriate caution.
Table 12 (reporting checklist). A compact FDD reporting checklist is provided to standardise disclosures (task/context; actuator/transmission; fault ground-truth; sensors/sampling; residual/features; decision threshold τ and operating point; ACC/F1, MDFA, TTD, FAR@τ; safety response; reproducibility). This structure enables comparability across periods and platforms.

4. Discussion

Mapping actuator technologies used in human-centric robotics to characteristic fault classes and validation approaches reveals a strong technology-dependent structure in the actuator × fault-class contingency (Figure 3; Table 2). In practice, failure propensity and detectability are determined by the transmission architecture and its sensing stack. Reporting practices remain uneven: accuracy-centric metrics (ACC, F1) are prevalent, whereas pHRI-relevant properties—minimal detectable fault amplitude (MDFA), time-to-detect (TTD), and false-alarm rate (FAR)—are rarely or never reported (Figure 5, Figure 6 and Figure 7; Table 4). Adjusted analyses (logistic GLMs; Figure 8; Table 6) further indicate that period and validation platform can influence the probability that performance is reported, although wide confidence intervals and non-estimable effects in sparse strata warrant cautious interpretation. These patterns are consistent with the MDPI literature, which calls for safety-aligned FDD evaluation beyond accuracy in contact-rich interactions [119,120].
Position within the literature and standards. Reviews of wearable/assistive robotics underscore that actuator and sensing choices shape observability, thresholds, and validation protocols; the present set of included studies substantiates this view at scale. Sole reliance on classifier scores obscures timeliness and no-fault specificity under realistic loading—properties that matter for risk-aware decision-making in pHRI—and motivates routine inclusion of MDFA/TTD/FAR alongside accuracy [119,120].
Actuator-aware implications (by family). Family-specific tendencies observed here align with recent MDPI analyses. Harmonic-drive transmissions concentrate transmission-error growth, wear, and lubricant effects, with multi-sensor and acoustic approaches showing distinctive signatures that benefit from robust validation [9,122]. Series-elastic designs foreground compliance changes and torque-estimation drift, consistent with MDPI studies on SEA configurations and dynamics [120]. Cable/Bowden architectures introduce slack and friction non-stationarities; state-of-the-art analyses of cable-driven parallel/continuum robots and rehabilitation control emphasise friction/hysteresis mitigation and tension management—implications for change-detection thresholds and residual design [121,124,125]. PMSM drives bring electrical signatures (inter-turn short circuits, demagnetisation, eccentricity) to the forefront, reinforcing the role of electrical-signature analytics for actuator-aware FDD [123]. These comparisons support actuation-aware observers and decision rules: thermal/torque derating monitors in reducer-based electric drives; compliance-aware residuals and drift-robust torque sensing in SEA; change-detection schemes robust to friction/slack in cable transmissions; and electrical-signature monitoring in PMSM.
Association between actuator family and fault class. The large Cramér’s V reported in Results (Figure 3; Table 2) indicates a high degree of structure in what fails by architecture. MDPI studies on cable-driven and harmonic-drive mechanisms similarly argue that design choices (e.g., reducer stiffness, cable routing/tensioning) shape fault manifolds and, in turn, the observability of residuals—supporting family-conditioned priors and thresholds [9,121,122].
Metric-reporting prevalence (ACC/F1 vs. MDFA/TTD/FAR). Results document systematic emphasis on classifier accuracy, with rare reporting of sensitivity thresholds, detection latency, and false-alarm behaviour. Comparative MDPI syntheses across manipulators and rehabilitation control systems reach similar conclusions about uneven validation practices and incomplete reporting, reinforcing the need for a pHRI-oriented minimum set [126].
Period and platform effects. Differences across Pre (≤2019), Pandemic (2020–2021), and Post (≥2022) windows plausibly reflect methodological maturation and shifts in validation environments (simulation ↔ HIL/benchtop ↔ on-body/clinical). The feasibility of MDFA measurement via calibrated fault injection in benchtop/HIL versus TTD/FAR estimation during on-body trials illustrates how the platform co-determines what can be measured and how thresholds are selected—an effect widely discussed in the MDPI actuator/control literature for wearable and rehabilitation contexts [119,123].
Forest plot and separation (NA–NA). Several adjusted effects are non-estimable (NA–NA) due to complete separation or zero cells. Instead of ad hoc continuity corrections, explicit NA–NA annotation with log-scale forest plots preserves interpretability and avoids overstating evidence—an approach aligned with the cautionary notes in MDPI diagnostic/FTC reports, where stratification by technology and scenario produces sparse cells [126].
Minimum reporting set for pHRI-relevant FDD (anchored to Table 12). To complement ACC/F1, an operational set is recommended: MDFA with units and protocol (fault type, injection site, dwell, background motion); TTD measured at a prespecified MDFA level; FAR with explicit no-fault segment length and confidence intervals; the operating point (threshold/cost ratio) and calibration procedure; actuator configuration (reducer/compliance class, sensor suite, controller mode); validation platform and data availability (HIL logs, on-body traces) with denominators and inclusion flow; and explicit linkage to pHRI risk controls (fail-safe response, derating logic, intervention latency). This mirrors calls in MDPI reviews for risk-aligned evaluation and standardisation across HRI/pHRI applications [119,120,121].
Strengths and advantages of the present study. Several features differentiate this review. First, the actuator-aware taxonomy pairs families (HD, SEA, Cable/Bowden, PMSM, force–torque architectures) with harmonised fault classes, enabling structured analyses that reflect what is observable given the physics of each transmission and sensing stack. Second, the reporting audit goes beyond accuracy to explicitly track MDFA/TTD/FAR, a gap repeatedly noted yet rarely quantified; adjusted models control for period, year, actuator, and platform, improving the interpretability of reporting prevalence. Third, the period analysis situates findings relative to Pre/Pandemic/Post windows, highlighting how platform migration and methodological maturation shape what is measurable. Fourth, a practical, standard-compliant checklist (Table 12) is provided to improve comparability and decision-relevance in future pHRI studies.
Limitations. The set of included works is heterogeneous in terms of definitions, labelling granularity, and platform descriptions, which introduces residual confounding and a bias toward accuracy reporting. Several adjusted effects are non-estimable in sparse strata. The synthesis is limited to English-language, peer-reviewed sources; no new human or animal studies were conducted, and under-reporting of non-significant results cannot be excluded. Sensor-modality fields were sparsely annotated, which required aggregation at the family level and conservative interpretation of modality-specific trends.
Future directions. Priorities include (i) actuator-aware fault-injection datasets with shared protocols; (ii) benchmarks that score MDFA, TTD, and FAR alongside ACC/F1; (iii) hybrid observers that embed physics priors with learned residual gating; and (iv) prospective, on-body pHRI validations in which the safety envelope (intervention latency, false alarms) is audited explicitly—directions visible across MDPI trends in exoskeletons, cable-driven mechanisms, and electrical-drive diagnostics [119,121,123,124,125,126].

5. Conclusions

This review synthesises evidence from 127 peer-reviewed studies to relate actuator/transmission families to characteristic fault classes and to the sensing–residual–decision pipelines used in physical human–robot interaction (pHRI). A pronounced technology-dependent structure emerges in the actuator-by-fault relationship, indicating that failure propensity and detectability are conditioned by the drive’s physics and the available measurements. Reporting practices are imbalanced: accuracy-centric metrics are standard, whereas sensitivity thresholds, detection latency, and no-fault specificity—captured by minimal detectable fault amplitude (MDFA), time-to-detect (TTD), and false-alarm rate (FAR)—are rarely documented. Adjusted analyses further indicate that reporting is shaped by period and validation environment across the Pre/Pandemic/Post windows, with uncertainty where data are sparse.
Taken together, these findings support an actuation-aware approach to fault detection and diagnosis in pHRI. Observers and decision rules benefit from explicit alignment with the transmission and sensor stack—thermal/torque-derating monitors for reducer-based drives, compliance-aware residuals and drift-robust force–torque sensing for series-elastic architectures, and change-detection schemes that remain stable under friction and slack variability for Cable/Bowden systems, complemented by electrical-signature analytics for PMSM actuation. Equally importantly, evaluation and reporting should move beyond classifier accuracy to include MDFA, TTD, and FAR with clear operating conditions and denominators, so that results become comparable and decision-relevant under contact-rich use.
A practical path forward is already available within the present study: the compact reporting checklist (Table 12) can be adopted as a minimum set across technologies and platforms. Consistent disclosure of MDFA with units and protocol, TTD at a prespecified MDFA level, FAR with confidence intervals and no-fault segment length, the chosen operating point and calibration, actuator configuration, and validation environment—with study denominators and inclusion flow—would materially improve interpretability across studies and accelerate safe translation in pHRI.
The analysis also highlights opportunities for the field. Public, actuator-aware fault-injection datasets with harmonised protocols would enable benchmarking beyond accuracy; hybrid observers that embed physics priors with learned residual gating could improve robustness where fault manifolds overlap with benign variability; and prospective, on-body validations that explicitly audit intervention latency and false alarms would align evaluation with real-world safety expectations. By coupling actuator-aware methods with standardised reporting of MDFA, TTD, and FAR, future studies can provide evidence that is both technically rigorous and clinically meaningful.

Author Contributions

Conceptualisation, C.F.P. and C.A.M.; methodology, C.A.M., C.F.P. and V.M.R.; software, C.A.M.; validation, N.R.V., D.M.P.-P. and V.M.R.; formal analysis, V.M.R.; investigation, C.F.P., C.A.M., N.R.V. and D.M.P.-P.; resources, N.R.V. and D.M.P.-P.; data curation, C.A.M. and C.F.P.; writing—original draft preparation, C.F.P.; writing—review and editing, C.A.M., N.R.V., D.M.P.-P. and V.M.R.; visualisation, C.A.M. and V.M.R.; supervision, C.F.P.; project administration, C.F.P. All authors have read and agreed to the published version of the manuscript.

Funding

This research received no external funding.

Institutional Review Board Statement

Not applicable.

Informed Consent Statement

Not applicable.

Data Availability Statement

No new data were created or analyzed in this study.

Conflicts of Interest

The authors declare no conflicts of interest.

Abbreviations

The following abbreviations are used in this manuscript:
ACCAccuracy
F1F1-score
MDFAMinimal Detectable Fault Amplitude
TTDTime-to-Detect
FARFalse-Alarm Rate
FDDFault Detection and Diagnosis
pHRIPhysical Human–Robot Interaction
HRIHuman–Robot Interaction
SEASeries-Elastic Actuator
HDHarmonic Drive
PMSMPermanent-Magnet Synchronous Motor
F–TForce–Torque
HILHardware-in-the-Loop
GLMGeneralised Linear Model
OROdds Ratio
CIConfidence Interval
FDRFalse Discovery Rate
BHBenjamini–Hochberg (procedure)
DOIDigital Object Identifier
NA–NANot estimable (both confidence limits not available)
BPFOBall Pass Frequency (Outer race)
CNNConvolutional Neural Network
CUSUMCumulative Sum Control Chart
EKFExtended Kalman Filter
FBGFiber Bragg Grating
GLRGeneralised Likelihood Ratio
IMUInertial Measurement Unit
RFRandom Forest
SPCStatistical Process Control
SVMSupport Vector Machine
THDTotal Harmonic Distortion
UIOUnknown Input Observer

References

  1. Sharkawy, A.-N.; Koustoumpardis, P.N. Human–Robot Interaction: A Review and Analysis on Variable Admittance Control, Safety, and Perspectives. Machines 2022, 10, 591. [Google Scholar] [CrossRef]
  2. SMBPB, S.; Valori, M.; Legnani, G.; Fassi, I. Assessing Safety in Physical Human–Robot Interaction in Industrial Settings: A Systematic Review of Contact Modelling and Impact Measuring Methods. Robotics 2025, 14, 27. [Google Scholar] [CrossRef]
  3. Tiboni, M.; Borboni, A.; Vérité, F.; Bregoli, C.; Amici, C. Sensors and Actuation Technologies in Exoskeletons: A Review. Sensors 2022, 22, 884. [Google Scholar] [CrossRef] [PubMed]
  4. Zhang, Y.; Wu, J.; Gao, B.; Xia, L.; Lu, C.; Wang, H.; Cao, G. Fault Types and Diagnostic Methods of Manipulator Robots: A Review. Sensors 2025, 25, 1716. [Google Scholar] [CrossRef] [PubMed]
  5. Inoue, Y.; Kuroda, Y.; Yamanoi, Y.; Yabuki, Y.; Yokoi, H. Development of Wrist Separated Exoskeleton Socket of Myoelectric Prosthesis Hand for Symbrachydactyly. Cyborg Bionic Syst. 2024, 5, 0141. [Google Scholar] [CrossRef]
  6. Wang, Z.; Xu, D.; Zhao, S.; Yu, Z.; Huang, Y.; Ruan, L.; Zhou, Z.; Wang, Q. Level-Ground and Stair Adaptation for Hip Exoskeletons Based on Continuous Locomotion Mode Perception. Cyborg Bionic Syst. 2025, 6, 0248. [Google Scholar] [CrossRef]
  7. Raviola, A.; De Martin, A.; Sorli, M. A preliminary experimental study on the effects of wear on the torsional stiffness of strain wave gears. Actuators 2022, 11, 305. [Google Scholar] [CrossRef]
  8. Li, W.; Hao, L. Study on the degradation law of harmonic gear drive backlash with wear and assembly errors. Eng. Fail. Anal. 2022, 140, 106614. [Google Scholar] [CrossRef]
  9. Hsieh, N.-K.; Yu, T.-Y. Fault detection in harmonic drive using multi-sensor data fusion and gravitational search algorithm. Machines 2024, 12, 831. [Google Scholar] [CrossRef]
  10. Noh, Y.R.; Khalid, S.; Kim, H.S.; Choi, S.-K. Intelligent fault diagnosis of robotic strain wave gear reducer using area-metric-based sampling. Mathematics 2023, 11, 4081. [Google Scholar] [CrossRef]
  11. Zhang, S.; Gao, J.; Wang, L.; Chen, C.; Xu, S.; Wang, B. A novel on-line approach for evaluating transmission errors in harmonic drives. Adv. Mech. Eng. 2024, 16, 16878132241276666. [Google Scholar] [CrossRef]
  12. Guida, R.; Bertolino, A.C.; De Martin, A.; Sorli, M. Comprehensive analysis of major fault-to-failure mechanisms in harmonic drives (UR5 case). Machines 2024, 12, 776. [Google Scholar] [CrossRef]
  13. Raouf, I.; Lee, H.; Noh, Y.R.; Youn, B.D.; Kim, H.S. Prognostic health management of the robotic strain wave gear reducer based on variable speed of operation: A data-driven via deep learning approach. J. Comput. Des. Eng. 2022, 9, 1775–1788. [Google Scholar] [CrossRef]
  14. Tsolakis, E.; Vasileiou, G.; Rogkas, N.; Kalligeros, C.; Zalimidis, P.; Spitas, V. Dynamic modelling and torque ripple minimisation of a lightweight ultra-high transmission ratio harmonic drive. MATEC Web Conf. 2020, 317, 01007. [Google Scholar] [CrossRef]
  15. Raviola, A.; De Martin, A.; Guida, R.; Jacazio, G.; Mauro, S.; Sorli, M. Harmonic drive gear failures in industrial robots: An overview. In Proceedings of the 6th European Conference of the Prognostics and Health Management Society, Virtual, 28 June–2 July 2021; ISBN 978-1-936263-34-9. Available online: https://papers.phmsociety.org/index.php/phme/article/download/2849/1801 (accessed on 20 May 2025).
  16. Kißkalt, J.; Michalka, A.; Strohmeyer, C.; Horn, M.; Graichen, K. Fault Detection in Gauge-Sensorized Strain Wave Gears. In Proceedings of the 2024 European Control Conference (ECC), Stockholm, Sweden, 25–28 June 2024. [Google Scholar] [CrossRef]
  17. Velasco-Guillén, R.J.; Bliek, A.; Font-Llagunes, J.M.; Vanderborght, B.; Beckerle, P. Compensating elastic faults in a torque-assisted knee exoskeleton: Functional evaluation and user perception study. J. Neuroeng. Rehabil. 2024, 21, 230. [Google Scholar] [CrossRef]
  18. Velasco-Guillén, R.J.; Furnemoant, R.; Verstraten, T.; Vanderborght, B.; Font-Llagunes, J.M.; Beckerle, P. Stiffness-fault-tolerant control strategy for elastic actuators with interaction impedance adaptation. Mechatronics 2024, 104, 103265. [Google Scholar] [CrossRef]
  19. Sarkisian, S.V.; Gabert, L.; Lenzi, T. Series-elastic actuator with two-degree-of-freedom PID control improves torque control in a powered knee exoskeleton. Wearable Technol. 2023, 4, e25. [Google Scholar] [CrossRef] [PubMed]
  20. Rosales-Luengas, Y.; Centeno-Barreda, D.; Salazar, S.; Flores, J.; Lozano, R. Movement intent detection for upper-limb rehabilitation exoskeleton based on SEA as force sensor. Actuators 2024, 13, 284. [Google Scholar] [CrossRef]
  21. Wang, T.; Zheng, T.; Zhao, S.; Sui, D.; Zhao, J.; Zhu, Y. Design and control of a series–parallel elastic actuator (SPEA) for a load-carrying exoskeleton. Sensors 2022, 22, 1055. [Google Scholar] [CrossRef]
  22. Vantilt, J.; Tanghe, K.; Afschrift, M.; Bruijnes, A.K.B.D.; Junius, K.; Geeroms, J.; Aertbeliën, E.; De Groote, F.; Lefeber, D.; Jonkers, I.; et al. Model-based control for exoskeletons with series elastic actuators. J. NeuroEng. Rehabil. 2019, 16, 65. [Google Scholar] [CrossRef]
  23. Calanca, A.; Sartori, E.; Maris, B. Force control of lightweight series elastic systems using enhanced disturbance observers. Robot. Auton. Syst. 2023, 164, 104407. [Google Scholar] [CrossRef]
  24. Chiaradia, D.; Rinaldi, G.; Solazzi, M.; Vertechy, R.; Frisoli, A. Design and control of the REHAB-EXOS, a joint torque-controllable upper-limb exoskeleton. Robotics 2024, 13, 32. [Google Scholar] [CrossRef]
  25. Jenks, B.; Levan, H.; Stefanovic, F. OpenSEA: A 3D-printed planetary-gear SEA for elbow rehab (open design). Front. Robot. AI 2025, 12, 1528266. [Google Scholar] [CrossRef]
  26. Liao, H.; Chan, H.H.-T.; Gao, F.; Zhao, X.; Liu, G.; Liao, W.-H. Proxy-based torque control of motor-driven exoskeletons for safe and compliant human–exoskeleton interaction. Mechatronics 2022, 88, 102906. [Google Scholar] [CrossRef]
  27. Hu, Q.; Liu, Z.; Yang, C.; Xie, F. Research on dynamic transmission error of harmonic drive with uncertain parameters by an interval method. Precis. Eng. 2021, 68, 285–300. [Google Scholar] [CrossRef]
  28. Kißkalt, J.; Michalka, A.; Strohmeyer, C.; Horn, M.; Graichen, K. Model-based fault simulation and detection for gauge-sensorized strain wave gears. IFAC-PapersOnLine 2025, 59, 271–276. [Google Scholar] [CrossRef]
  29. Zhang, X.; Zhang, C.; Wang, P.; Yang, F.; Peng, C.; Yun, X. Accelerated life test and performance degradation test of harmonic drive with failure analysis. Machines 2025, 13, 918. [Google Scholar] [CrossRef]
  30. Zhang, X.; Zhang, C.; Wang, P.; Peng, C.; Yang, F. Study on precision reliability evaluation method of harmonic drive based on NIPCE considering wear. Sci. Rep. 2025, 15, 14439. [Google Scholar] [CrossRef] [PubMed]
  31. Zhou, G.; Zhang, Z.; Zhang, H. Experimental study on transmission performance of harmonic drive under multiple factors. Mech. Ind. 2019, 20, 614. [Google Scholar] [CrossRef]
  32. Hu, Q.; Liu, Z.; Cai, L.; Yang, C.; Zhang, T.; Wang, G. Research on prediction method of transmission accuracy of harmonic drive (IDETC-CIE 2019). In Proceedings of the ASME IDETC-CIE 2019, Anaheim, CA, USA, 18–21 August 2019; Available online: https://asmedigitalcollection.asme.org/IDETC-CIE/proceedings/IDETC-CIE2019/59308/V010T11A006/1070360 (accessed on 20 May 2025).
  33. Hu, Y.; Zhan, Y.; Han, L.; Hu, P.; Ye, B.; Yu, Y. An angle error compensation method based on harmonic analysis for integrated joint modules. Sensors 2020, 20, 1715. [Google Scholar] [CrossRef]
  34. Li, R.; Zhou, G.; Zhao, Z.; Li, J.; Wang, J. Analysis and prediction of transmission error of harmonic reducer for space robot. Space Sci. Technol. 2025, 5, 0233. [Google Scholar] [CrossRef]
  35. Li, R.; Zhou, G.; Li, D. Structural design of flexible wheel of harmonic reducer based efficiency improvement. Mech. Syst. Signal Process. 2023, 201, 110677. [Google Scholar] [CrossRef]
  36. Li, R.; Zhou, G.; Huang, J.; Li, J. Lightweight design and verification of space harmonic drive. Int. J. Mech. Sci. 2025, 296, 110302. [Google Scholar] [CrossRef]
  37. Sun, H.; Zhang, J. Health monitoring of strain wave gear on industrial robots. In Proceedings of the IEEE 8th Data Driven Control and Learning Systems Conf. (DDCLS), Dali, China, 24–27 May 2019. [Google Scholar]
  38. de Gea Fernández, J.; Yu, B.; Bargsten, V.; Zipper, M.; Sprengel, H. Design, modelling and control of novel series-elastic actuators for industrial robots. Actuators 2020, 9, 6. [Google Scholar] [CrossRef]
  39. Bolívar-Nieto, E.; Rezazadeh, S.; Summers, T.; Gregg, R.D. Robust optimal design of energy-efficient series elastic actuators: Application to a powered prosthetic ankle. In Proceedings of the 2019 IEEE 16th International Conference on Rehabilitation Robotics (ICORR), Toronto, ON, Canada, 24–28 June 2019; Available online: https://pubmed.ncbi.nlm.nih.gov/31374719/ (accessed on 20 May 2025).
  40. Bolívar-Nieto, E.A.; Summers, T.; Gregg, R.D.; Rezazadeh, S. A convex optimisation framework for robust-feasible series elastic actuators. Mechatronics 2021, 79, 102635. [Google Scholar] [CrossRef]
  41. Toubar, H.; Awad, M.I.; Boushaki, M.N.; Niu, Z.; Khalaf, K.; Hussain, I. Design, modeling, and control of a series elastic actuator with discretely adjustable stiffness (SEADAS). Mechatronics 2022, 86, 102863. [Google Scholar] [CrossRef]
  42. Wu, L.; Wang, C.; Liu, J.; Zou, B.; Chakrabarty, S.; Bao, T.; Xie, S.Q. Novel design on knee exoskeleton with compliant actuator for post-stroke rehabilitation. Sensors 2025, 25, 153. [Google Scholar] [CrossRef]
  43. Kang, I.; Peterson, R.R.; Herrin, K.R.; Mazumdar, A.; Young, A.J. Design and validation of a torque-controllable series elastic actuator-based hip exoskeleton for dynamic locomotion. ASME J. Mech. Robot. 2023, 15, 021007. [Google Scholar] [CrossRef]
  44. Al-Dahiree, O.S.; Ghazilla, R.A.R.; Tokhi, M.O.; Yap, H.J.; Albaadani, E.A. Design of a compact energy storage with rotary series elastic actuator for lumbar support exoskeleton. Machines 2022, 10, 584. [Google Scholar] [CrossRef]
  45. Sanfilippo, F.; Økter, M.; Dale, J.; Tuan, H.M.; Zafar, M.H.; Ottestad, M. Open-source design of low-cost sensorised elastic actuator for collaborative prosthetics and orthotics. HardwareX 2024, 19, e00564. [Google Scholar] [CrossRef]
  46. Zhao, W.; Liao, J.; Qian, W.; Yu, H.; Guo, Z. A novel design of series elastic actuator using tensile springs array. Mech. Mach. Theory 2024, 192, 105541. [Google Scholar] [CrossRef]
  47. Wang, R.; Lin, X.; Yin, C.; Liu, Z.; Zhang, Y.; Liu, W.; Du, F. Robust continuous sliding-mode-based assistive torque control for SEA-driven lower-limb hip exoskeleton. Actuators 2025, 14, 239. [Google Scholar] [CrossRef]
  48. Lee, S.; Choi, S.; Ko, C.; Kim, T.; Kong, K. Design and control of the compact cable-driven series elastic actuator module in soft wearable robot for ankle assistance. Int. J. Control Autom. Syst. 2023, 21, 1624–1633. [Google Scholar] [CrossRef]
  49. Xu, J.; Chen, S.; Li, S.; Liu, Y.; Wan, H.; Xu, Z.; Zhang, C. A survey on design and control methodologies of high-torque-density joints for compliant lower-limb exoskeleton. Sensors 2025, 25, 4016. [Google Scholar] [CrossRef]
  50. Guo, Y.; Xu, W.; Pradhan, S.; Bravo, C.; Tzvi, P.B. Data-driven calibration and control of compact lightweight series elastic actuators for robotic exoskeleton gloves. IEEE Access 2021, 21, 21120–21130. [Google Scholar] [CrossRef]
  51. Shakeriaski, F.; Mohammadian, M. Enhancing upper-limb exoskeletons using sensor-based deep learning torque prediction and PID control. Sensors 2025, 25, 3528. Available online: https://www.mdpi.com/1424-8220/25/11/3528 (accessed on 20 May 2025). [CrossRef]
  52. Hochreiter, D.; Schmermbeck, K.; Vazquez-Pufleanu, M.; Ferscha, A. Intention prediction for active upper-limb exoskeletons in industrial applications: A systematic literature review. Sensors 2025, 25, 5225. [Google Scholar] [CrossRef] [PubMed]
  53. Sun, Z.; Xu, C.; Gu, J.; Zhao, L.; Hu, Y. Design, modeling and optimal control of a novel compliant actuator. Control Eng. Pract. 2024, 148, 105967. [Google Scholar] [CrossRef]
  54. Karasheva, M.; Saudanbekova, A.; Utepbergen, A.; Akkulova, S.; Niyetkaliyev, A.; Ozhikenov, K.; Ozhiken, A.; Alimbayev, C.; Shylmyrza, U.; Aimukhanbetov, Y. Sensor-driven control strategies for post-stroke shoulder rehabilitation exoskeletons: A systematic review. MethodsX 2025, 15, 103648. [Google Scholar] [CrossRef]
  55. Dežman, M.; Asfour, T.; Ude, A.; Gams, A. Mechanical design and friction modelling of a cable-driven upper-limb exoskeleton. Mech. Mach. Theory 2022, 171, 104746. [Google Scholar] [CrossRef]
  56. Wei, W.; Qu, Z.; Wang, W.; Zhang, P.; Hao, F. Design on the Bowden cable-driven upper limb soft exoskeleton. Appl. Bionics Biomech. 2018, 2018, 1925694. [Google Scholar] [CrossRef]
  57. Shi, Y.; Guo, M.; Hui, C.; Li, S.; Ji, X.; Yang, Y.; Luo, X. Learning-based repetitive control of a Bowden-cable-actuated exoskeleton with frictional hysteresis. Micromachines 2022, 13, 1674. [Google Scholar] [CrossRef]
  58. Li, X.; Ma, G.; Wang, D. Research on Bowden cable–fabric force transfer system based on force/displacement compensation and impedance control. Appl. Sci. 2023, 13, 11766. [Google Scholar] [CrossRef]
  59. Vatan, H.; Theodoridis, T.; Wei, G.; Saffari, Z.; Holderbaum, W. The design and development of a wearable cable-driven shoulder exosuit (CDSE) for multi-DoF upper limb assistance. Appl. Sci. 2025, 15, 10673. [Google Scholar] [CrossRef]
  60. Tian, M.; Liu, Y.; Chen, Z.; Wang, X.; Zhang, Q.; Liu, B. Biomimetic design and validation of an adaptive cable-driven elbow exoskeleton inspired by the shrimp shell. Biomimetics 2025, 10, 271. [Google Scholar] [CrossRef] [PubMed]
  61. Shi, K.; Song, A.; Li, Y.; Li, H.; Chen, D.; Zhu, L. A cable-driven three-DoF wrist rehabilitation exoskeleton with improved performance. Front. Neurorobot. 2021, 15, 664062. [Google Scholar] [CrossRef] [PubMed]
  62. Sanjuan, J.D.; Castillo, A.D.; Padilla, M.A.; Quintero, M.C.; Gutierrez, E.E.; Sampayo, I.P.; Hernandez, J.R.; Rahman, M.H. Cable-driven exoskeleton for upper-limb rehabilitation: A design review. Robot. Auton. Syst. 2020, 126, 103445. [Google Scholar] [CrossRef]
  63. Zhang, F.; Fu, Y.; Yang, L.; Fu, Y. A novel cable configuration method for fully-actuated parallel cable-driven systems: Application in a shoulder rehabilitation exoskeleton. Mech. Mach. Theory 2024, 199, 105693. [Google Scholar] [CrossRef]
  64. Dinh, B.K.; Xiloyannis, M.; Cappello, L.; Antuvan, C.W.; Yen, S.; Masia, L. Adaptive backlash compensation in upper-limb soft wearable exoskeletons. Robot. Auton. Syst. 2017, 92, 173–186. [Google Scholar] [CrossRef]
  65. Jin, X.; Ding, W.; Baumert, M.; Wei, Y.; Li, Q.; Yang, W.; Yan, Y. Mechanical design, analysis and dynamics simulation of a cable-driven wearable flexible exoskeleton system. Technologies 2024, 12, 238. [Google Scholar] [CrossRef]
  66. Park, D.; Di Natali, C.; Sposito, M.; Caldwell, D.G.; Ortiz, J. Elbow-sideWINDER (Elbow-side Wearable INDustrial Ergonomic Robot): Design, Control, and Validation of a Novel Elbow Exoskeleton. Front. Neurorobot. 2023, 17, 1168213. [Google Scholar] [CrossRef]
  67. Prasad, R.; El-Rich, M.; Awad, M.I.; Agrawal, S.K.; Khalaf, K. Muscle-Inspired Bi-Planar Cable Routing: A Novel Framework for Designing Cable-Driven Lower-Limb Rehabilitation Exoskeletons (C-LREX). Sci. Rep. 2024, 14, 55785. [Google Scholar] [CrossRef] [PubMed]
  68. Alapati, S.; Seth, D.; Nakka, S.; Aoustin, Y. Validation of Cable-Driven Experimental Setup to Assess Movements with Elbow Joint Assistance. Appl. Sci. 2025, 15, 1892. [Google Scholar] [CrossRef]
  69. Li, X.; Liu, J.; Li, W.; Huang, Y.; Zhan, G. Force Transmission Analysis and Optimization of Bowden Cable on Body in a Flexible Exoskeleton. Appl. Bionics Biomech. 2022, 2022, 5552166. [Google Scholar] [CrossRef]
  70. Chen, W.; Li, Z.; Cui, X.; Zhang, J.; Bai, S. Mechanical Design and Kinematic Modeling of a Cable-Driven Arm Exoskeleton Incorporating Inaccurate Anthropomorphic Parameters. Sensors 2019, 19, 4461. [Google Scholar] [CrossRef]
  71. Li, X.; Yang, Q.; Song, R. Performance-Based Hybrid Control of a Cable-Driven Upper-Limb Rehabilitation Robot. IEEE Trans. Biomed. Eng. 2021, 68, 1351–1359. [Google Scholar] [CrossRef] [PubMed]
  72. Andrade Chavez, F.J.; Traversaro, S.; Pucci, D. Six-Axis Force–Torque Sensor Model-Based In Situ Calibration Method and Its Impact in Floating-Based Robot Dynamic Performance. Sensors 2019, 19, 5521. [Google Scholar] [CrossRef]
  73. Yao, L.; Xu, Y.; Sun, B.; Yang, X.; Zhang, G.; Wang, H.; Wang, S. An Integrated Compensation Method for Force Disturbance of a Six-Axis Force Sensor in Complex Manufacturing Scenarios. Sensors 2021, 21, 4706. [Google Scholar] [CrossRef]
  74. Sun, Y. Design, Manufacture, Test and Experiment of Six-Axis Force/Torque Sensor for Chinese Experimental Module Manipulator. Sensors 2022, 22, 3603. [Google Scholar] [CrossRef]
  75. Dong, X.; Ding, F.; Zhou, H.; Wang, N.; Sun, W. Temperature Compensation of Wind Tunnel Balance Signal Detection System Based on IGWO-ELM. Sensors 2023, 23, 7224. [Google Scholar] [CrossRef] [PubMed]
  76. Wu, Z.; Revzen, S. In-Situ Calibration of Six-Axis Force/Torque Transducers on a Legged Robot. J. Dyn. Syst. Meas. Control 2025, 147, 031003. [Google Scholar] [CrossRef]
  77. Chávez, F.J.A.; Traversaro, S.; Nori, F. Model-Based In Situ Calibration of Six-Axis Force/Torque Sensors. arXiv 2018, arXiv:1812.00650. [Google Scholar]
  78. Suciu, C.C.; Stoica, V.; Ilie, M.; Ionel, I.; Ionel, R. A Low-Cost IoT-Based Bidirectional Torque Measurement System with Strain Gauge Technology. Appl. Sci. 2025, 15, 8158. [Google Scholar] [CrossRef]
  79. Zhao, H.; Lu, C.; Sun, Y.; Luo, Y.; Fu, Y.; Dong, Y.; Xue, B. Research on Calibration Methods and Experiments for Six-Component Force. J. Mar. Sci. Eng. 2025, 13, 1811. [Google Scholar] [CrossRef]
  80. Ahmad, A.R.; Wynn, T.; Lin, C.-Y. A Comprehensive Design of Six-Axis Force/Moment Sensor. Sensors 2021, 21, 4498. [Google Scholar] [CrossRef]
  81. Li, X.; Zhang, F.; Zhang, Y.; Zhang, S.; Yuan, W.; Zhang, Z. A Temperature Compensation Method for a Six-Axis Force/Torque Sensor Utilising Ensemble hWOA-LSSVM Based on Improved Trimmed Bagging. Sensors 2022, 22, 5056. [Google Scholar] [CrossRef] [PubMed Central]
  82. Kim, H.B.; Park, S.; Lee, J.; Kim, H.; Lee, D. Temperature Compensation Method of Six-Axis Force/Torque Sensor Using Gated Recurrent Unit. arXiv 2025, arXiv:2502.17528. [Google Scholar] [CrossRef]
  83. Chen, L.; Shen, J.; Li, B.; Zhang, C.; Yin, Y.; Wang, L.; Li, J.; Yang, J. Fault Mechanism Analysis and Diagnosis for Closed-Loop Drive System of Industrial Robot Based on Nonlinear Spectrum. Sci. Rep. 2022, 12, 21691. [Google Scholar] [CrossRef]
  84. Fonseca, D.S.B.; Antunes, H.R.P.; Cardoso, A.J.M. Stator Inter-Turn Short-Circuits Fault Diagnostics in Three-Phase Line-Start Permanent Magnet Synchronous Motors Fed by Unbalanced Voltages. Machines 2023, 11, 744. [Google Scholar] [CrossRef]
  85. Demirel, A.; Keysan, O.; El-Dalahmeh, M.D.; Al-Greer, M. Non-Invasive Real-Time Diagnosis of PMSM Faults Implemented in Motor Control Software for Mission-Critical Applications. Measurement 2024, 232, 114684. [Google Scholar] [CrossRef]
  86. Yu, Y.; Wang, X.; Liu, C.; Zhang, Y.; Liu, J.; Zhang, X. Permanent Magnet Synchronous Motor Demagnetization Fault Diagnosis Based on PCA-ISSA-PNN. Sci. Rep. 2024, 14, 72596. [Google Scholar] [CrossRef]
  87. He, X.; Wang, J.; Wang, H.; Li, X.; Wang, X. Early Bearing Fault Diagnosis in PMSMs Based on HO-VMD and Weighted Evidence Fusion of Current–Vibration Signals. Sensors 2025, 25, 4591. [Google Scholar] [CrossRef]
  88. Mazzoletti, M.A.; Bossio, G.R.; De Angelo, C.H. Interturn Short-Circuit Fault Diagnosis in PMSM with Partitioned Stator Windings. IET Electr. Power Appl. 2020, 14, 2365–2374. [Google Scholar] [CrossRef]
  89. Li, H.; Zhu, Z.-Q.; Azar, Z.; Clark, R.; Wu, Z. Fault Detection of Permanent Magnet Synchronous Machines: An Overview. Energies 2025, 18, 534. [Google Scholar] [CrossRef]
  90. Li, L.; Liao, S.; Zou, B.; Liu, J. Mechanism-Based Fault Diagnosis Deep Learning Method for Permanent Magnet Synchronous Motor. Sensors 2024, 24, 6349. [Google Scholar] [CrossRef] [PubMed]
  91. Ullah, Z.; Lodhi, B.A.; Hur, J. Detection and Identification of Demagnetization and Bearing Faults in PMSM Using Transfer Learning-Based VGG. Energies 2020, 13, 3834. [Google Scholar] [CrossRef]
  92. Wang, J.; Ma, J.; Meng, D.; Zhao, X.; Zhang, K. Fault Diagnosis of PMSMs Based on Image Features of Multi-Sensor Fusion. Sensors 2023, 23, 8592. [Google Scholar] [CrossRef] [PubMed]
  93. El-Dalahmeh, M.; Al-Greer, M.; Bashir, I.; El-Dalahmeh, M.; Demirel, A.; Keysan, O. Autonomous Fault Detection and Diagnosis for Permanent Magnet Synchronous Motors Using Combined Variational Mode Decomposition, the Hilbert–Huang Transform, and a Convolutional Neural Network. Comput. Electr. Eng. 2023, 110, 108894. [Google Scholar] [CrossRef]
  94. Tan, K.; Shi, J.; Mei, X.; Geng, J.; Yang, Y. Control of force transmission for cable-driven actuation system based on modified friction model with compensation parameters. Control. Eng. Pr. 2024, 151, 106035. [Google Scholar] [CrossRef]
  95. Bales, I.; Zhang, H. Kinematic benefits of a cable-driven exosuit for head–neck mobility. IEEE Robot. Autom. Lett. 2024, 9, 11849–11856. [Google Scholar] [CrossRef]
  96. KhalilianMotamed Bonab, A.; Chiaradia, D.; Frisoli, A.; Leonardis, D. A framework for modeling, optimisation, and musculoskeletal simulation of an elbow–wrist exosuit. Robotics 2024, 13, 60. [Google Scholar] [CrossRef]
  97. Ceccarelli, M.; Vaisson, J.-C.; Russo, M. Design of a cable-driven finger exoskeleton. Designs 2025, 9, 35. [Google Scholar] [CrossRef]
  98. Liang, Z.; Quan, Z.; Di, P. Stiffness regulation of cable-driven redundant manipulators through combined optimisation of configuration and cable tension. Mathematics 2025, 13, 1714. [Google Scholar] [CrossRef]
  99. Wang, Y.-J.; Wang, Z.-Q.; Feng, Y.; Xu, Y. Research on robot force compensation and collision detection based on six-dimensional force sensor. Machines 2025, 13, 544. [Google Scholar] [CrossRef]
  100. Ma, J.; Chen, S.; Di, H.; Liu, K. A fiber-optic six-axis force sensor based on a 3-UPU-compliant parallel mechanism. Appl. Sci. 2025, 15, 7548. [Google Scholar] [CrossRef]
  101. Choi, H.; Low, J.E.; Huh, T.M.; Uribe, G.A.; Hong, S.; Hoffman, K.A.W.; Di, J.; Chen, Y.; Stanley, A.A.; Cutkosky, M.R. CoinFT: A coin-sized, capacitive 6-axis force–torque sensor for robotic applications. arXiv 2025, arXiv:2503.19225. [Google Scholar]
  102. Tang, M.; Liang, L.; Zheng, H.; Chen, J.; Chen, D. Anomaly detection of permanent-magnet synchronous motor based on improved DWT–CNN multi-current fusion. Sensors 2024, 24, 2553. [Google Scholar] [CrossRef]
  103. Cao, J.; Yang, Z.; Sun, R.; Chen, X. Current signature identification and analysis for demagnetisation fault diagnosis of permanent-magnet synchronous motors. Mech. Syst. Signal Process. 2024, 214, 111377. [Google Scholar] [CrossRef]
  104. Zhang, Q.; Chen, C.; Zhang, Y.; Chen, L.; Zhang, D. Demagnetization fault diagnosis of a PMSM for electric drilling tools using GAF and CNN. Electronics 2024, 13, 189. [Google Scholar] [CrossRef]
  105. Li, M.; Geng, Y.; Wang, W.; Tu, M.; Wu, X. Permanent magnet synchronous motor inter-turn short circuit diagnosis based on physical-data dual model under oil-drilling environment. Eng. Appl. Artif. Intell. 2024, 132, 107938. [Google Scholar] [CrossRef]
  106. Ye, G.; Lu, Y.; Ju, J.; Sheng, L. Research on demagnetisation fault diagnosis of mine-cutting permanent-magnet synchronous motor. Int. J. Rotating Mach. 2024, 2024, 6648925. [Google Scholar] [CrossRef]
  107. Belgacem, A.M.; Hadef, M.; Ali, E.; Elsayed, S.K.; Paramasivam, P.; Ghoneim, S.S.M. Fault diagnosis of inter-turn short circuits in PMSM based on deep regulated neural network. IET Electr. Power Appl. 2024, 18, 1991–2007. [Google Scholar] [CrossRef]
  108. Romdhane, M.; Naoui, M.; Mansouri, A. PMSM inter-turn short-circuit fault detection using the fuzzy–extended Kalman filter in electric vehicles. Electronics 2023, 12, 3758. [Google Scholar] [CrossRef]
  109. Hasan Ebrahimi, S.; Choux, M.; Huynh, V.K. Real-Time Detection of Incipient Inter-Turn Short Circuit and Sensor Faults in Permanent Magnet Synchronous Motor Drives Based on Generalised Likelihood Ratio Test and Structural Analysis. Sensors 2022, 22, 3407. [Google Scholar] [CrossRef] [PubMed]
  110. Dai, Y.; Lee, H.-J. Torque Ripple and Electromagnetic Vibration Suppression of Fractional Slot Distributed Winding ISG Motors by Rotor Notching and Skewing. Energies 2024, 17, 4964. [Google Scholar] [CrossRef]
  111. Feng, L.; Yu, S.; Zhang, F.; Jin, S.; Sun, Y. Study on performance of low-speed high-torque permanent magnet synchronous motor with dynamic eccentricity rotor. Energy Rep. 2022, 8, 1421–1428. [Google Scholar] [CrossRef]
  112. Cui, Y.; Lu, H.; Xu, J.; Zhang, Y.; Zou, L. Study on Vibration Characteristics and Harmonic Suppression of an Integrated Electric Drive System Considering the Electromechanical Coupling Effect. Actuators 2025, 14, 386. [Google Scholar] [CrossRef]
  113. Jia, H.; Xin, H. Study on Lubrication Characteristics of Novel Forced Wave Generator of Harmonic Drive without Flexible Bearing. Materials 2022, 15, 175. [Google Scholar] [CrossRef] [PubMed]
  114. Chen, Y.; Wang, Y.; Ma, C.; Han, X.; Zhang, D.; Zhang, L.; Zhang, Y.; Wu, X.; Liu, L.; Han, Z.; et al. Towards Human-Like Walking with Biomechanical and Neuromuscular Control Features: Personalised Attachment Point Optimisation Method of Cable-Driven Exoskeleton. Front Aging Neurosci. 2024, 16, 1333985. [Google Scholar] [CrossRef] [PubMed]
  115. Ghosh, A.; Nath, K.; Bera, M.K.; Laskar, S.H. A Two Loop Sliding Mode Controller for Upper Limb Exosuit in Presence of Actuator Non-linearities. IFAC-PapersOnLine 2024, 57, 244–249. [Google Scholar] [CrossRef]
  116. Prasad, R.; El-Rich, M.; Awad, M.I.; Khalaf, K. Simulation of stroke gait impairment correction using cable-driven lower limb rehabilitation exoskeleton (C-LREX). Wearable Technol. 2025, 6, e39. [Google Scholar] [CrossRef]
  117. Lee, H.D.; Park, H.; Hong, D.H.; Kang, T.H. Development of a Series Elastic Tendon Actuator (SETA) Based on Gait Analysis for a Knee Assistive Exosuit. Actuators 2022, 11, 166. [Google Scholar] [CrossRef]
  118. Kant, S.; Pal, R.; Srivastava, R.; Jaiswal, A.K.; Salman, M.; Srivastava, R. Development of intelligent hybrid controller for torque ripple minimisation in electric drive system with adaptive flux estimator: An experimental case study. PLoS ONE 2025, 20, e0312946. [Google Scholar] [CrossRef] [PubMed]
  119. Preethichandra, D.M.G.; Piyathilaka, L.; Sul, J.-H.; Izhar, U.; Samarasinghe, R.; Arachchige, S.D.; de Silva, L.C. Passive and Active Exoskeleton Solutions: Sensors, Actuators, Applications, and Recent Trends. Sensors 2024, 24, 7095. [Google Scholar] [CrossRef]
  120. Supriyono, C.S.A.; Dragusanu, M.; Malvezzi, M. A Comprehensive Review of Elbow Exoskeletons: Classification by Structure, Actuation, and Sensing Technologies. Sensors 2025, 25, 4263. [Google Scholar] [CrossRef]
  121. Idà, E.; Mattioni, V. Cable-Driven Parallel Robot Actuators: State of the Art and Novel Servo-Winch Concept. Actuators 2022, 11, 290. [Google Scholar] [CrossRef]
  122. Kuo, J.-Y.; Hsu, C.-Y.; Wang, P.-F.; Lin, H.-C.; Nie, Z.-G. Constructing Condition Monitoring Model of Harmonic Drive. Appl. Sci. 2022, 12, 9415. [Google Scholar] [CrossRef]
  123. Vlachou, V.I.; Karakatsanis, T.S. Development of a Fault-Tolerant Permanent Magnet Synchronous Motor Using a Machine-Learning Algorithm for a Predictive Maintenance Elevator. Machines 2025, 13, 427. [Google Scholar] [CrossRef]
  124. Bai, H.; Lee, B.G.; Yang, G.; Shen, W.; Qian, S.; Zhang, H.; Zhou, J.; Fang, Z.; Zheng, T.; Yang, S.; et al. Unlocking the Potential of Cable-Driven Continuum Robots: A Comprehensive Review and Future Directions. Actuators 2024, 13, 52. [Google Scholar] [CrossRef]
  125. Yang, J.; Li, X.; Runciman, M.; Avery, J.; Zhou, Z.; Sun, Z.; Mylonas, G. A Novel, Soft, Cable-Driven Parallel Robot for Minimally Invasive Surgeries Based on Folded Pouch Actuators. Appl. Sci. 2024, 14, 4095. [Google Scholar] [CrossRef]
  126. Urrea, C.; Domínguez, C. Fault Diagnosis in a Four-Arm Delta Robot Based on Wavelet Scattering Networks and Artificial Intelligence Techniques. Technologies 2024, 12, 225. [Google Scholar] [CrossRef]
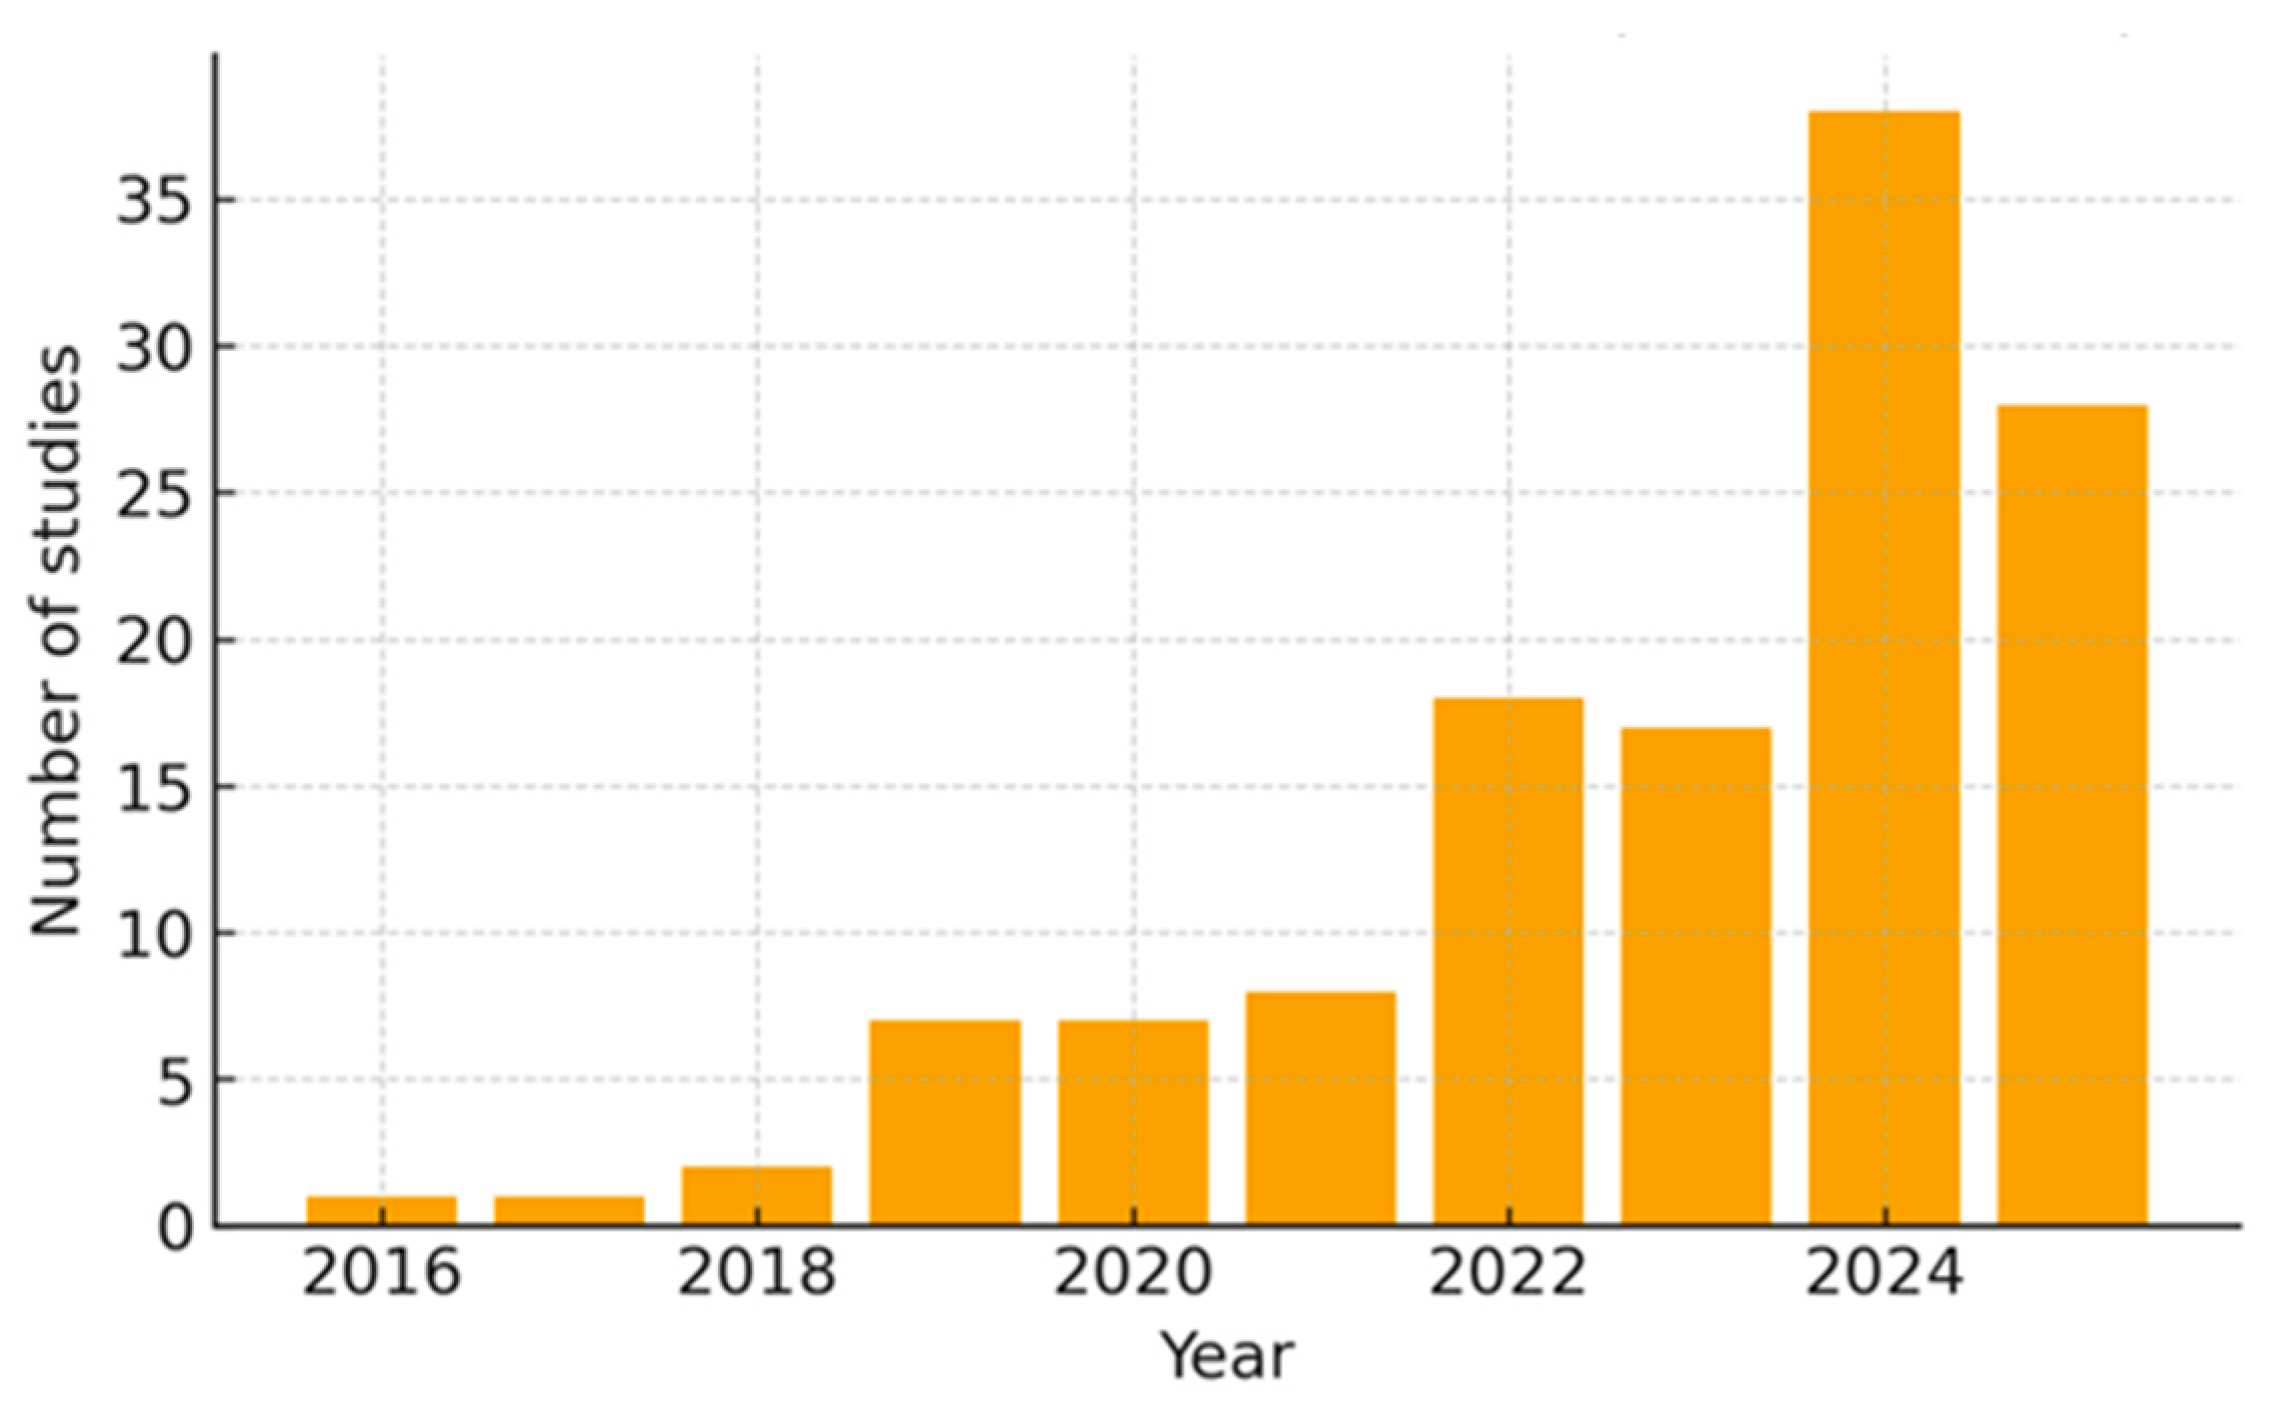
Figure 1. Annual count of included studies (2016–2025).
Actuators 14 00566 g001
Figure 2. Distribution of included studies by platform and actuator family.
Actuators 14 00566 g002
Figure 3. Actuator × fault-class composition.
Actuators 14 00566 g003
Figure 4. Yearly share by fault class (2016–2025).
Actuators 14 00566 g004
Figure 5. Reporting of core FDD metrics (ACC/F1, MDFA, TTD, FAR) across studies (gap-plot).
Actuators 14 00566 g005
Figure 6. Yearly proportion of studies reporting ACC/F1 (2016–2025).
Actuators 14 00566 g006
Figure 7. Yearly proportion of studies reporting MDFA (2016–2025).
Actuators 14 00566 g007
Figure 8. Forest plot of adjusted odds ratios (aOR, 95% CI) for ACC/F1 and MDFA. NA–NA confidence intervals are indicated; separated cases are annotated accordingly.
Actuators 14 00566 g008
Figure 9. Fault-class coverage by platform group (condensed)—heatmap (% within platform group; cells annotated for segments ≥ 10.0%).
Actuators 14 00566 g009
Figure 10. Annual counts by fault class (2016–2025); the shaded band marks the Pandemic window (2020–2021).
Actuators 14 00566 g010
Figure 11. Platform shares across Pre (2016–2019), Pandemic (2020–2021), and Post (2022–2025). Values are percentages within each period; cells show n and % for segments ≥ 10.0%.
Actuators 14 00566 g011
Table 1. Conceptual mapping of actuator families to typical faults, sensing, residuals, and decision logic.
Actuator FamilyTypical FaultsCommon SensorsResiduals/IndicatorsDecision Logic
Harmonic drive (HD)Transmission error (TE), tooth wear, lubrication loss, stiffness lossEncoders (motor/joint), motor currents, accelerometers/vibration, torque proxyTE estimate, backlash/friction proxies, vibration RMS/BPFO band, current harmonicsObservers/UIO, parity relations, H∞/EKF, GLR/CUSUM, thresholding
Series-elastic actuation (SEA)Spring fatigue/stiffness drift, torque bias, friction changes, sensor driftTorque sensor/strain gauge, dual encoders, IMU, temperatureTorque residual (τ_meas − τ_model), stiffness/deflection residuals, drift slopeModel-based observers, change-point detection, SPC/Shewhart, Bayesian filters
Cable/BowdenTendon elongation and slack, routing wear, friction/hysteresis, Δθ trendMotor and joint en-coders, FBG/strain, load cells, IMUΔθ = θ_motor − θ_joint, stick–slip features, tension residualsTrend tests (Mann–Kendall), GLR/CUSUM, SVM/RF for features
PMSM (electric drives)Inter-turn short-circuit (ITSC), partial demagneti-sation, static/dynamic ec-centricity.Phase cur-rents/voltages, Park’s vector, temperature, vibrationNegative-sequence current, current sig-nature (THD), sali-ency harmonicsModel-based estimators, spectral tests, SVM/CNN on signatures
Torque-sensed (F–T)-basedSensor bias/drift/saturation, miscalibration, overload6-axis F–T, encoders, temperatureZero-load offset, cross-axis coherence, drift rateCalibration checks, drift estimation, SPC, robust outlier tests
Table 2. Fault-class frequencies within actuator families (n, %, 95.0% Wilson CI).
ActuatorFaultnN
Act
Prop
(%)
CI_Low
(%)
CI_High
(%)
Cable/BowdenCable-/tendon-driven: elongation, slack, routing (Δθ)13255233.570.0
Force/torque sensing: drift, temperature sensitivity, cross-talk02500.013.3
Harmonic drive (strain-wave): transmission error and wear (incl. lubrication)02500.013.3
Other or mixed fault classes12540.719.5
PMSM: electrical faults (ITSC, demagnetisation, eccentricity)02500.013.3
Cable-/tendon-driven: elongation, slack, routing (Δθ)13255233.570.0
HDCable-/tendon-driven: elongation, slack, routing (Δθ)02300.014.3
Force/torque sensing: drift, temperature sensitivity, cross-talk02300.014.3
Harmonic drive (strain-wave): transmission error and wear (incl. lubrication)162369.649.184.4
Other or mixed fault classes72330.415.650.9
PMSM: electrical faults (ITSC, demagnetisation, eccentricity)02300.014.3
Transmission non-idealities: friction, hysteresis, backlash02300.014.3
PMSMCable-/tendon-driven: elongation, slack, routing (Δθ)02600.012.9
Force/torque sensing: drift, temperature sensitivity, cross-talk02600.012.9
Harmonic drive (strain-wave): transmission error and wear (incl. lubrication)02600.012.9
Other or mixed fault classes62623.111.042.1
PMSM: electrical faults (ITSC, demagnetisation, eccentricity)202676.957.989.0
Transmission non-idealities: friction, hysteresis, backlash02600.012.9
SEACable-/tendon-driven: elongation, slack, routing (Δθ)03100.011.0
Force/torque sensing: drift, temperature sensitivity, cross-talk1313.20.616.2
Harmonic drive (strain-wave): transmission error and wear (incl. lubrication)03100.011.0
Other or mixed fault classes303196.883.899.4
PMSM: electrical faults (ITSC, demagnetisation, eccentricity)03100.011.0
Transmission non-idealities: friction, hysteresis, backlash03100.011.0
Torque-sensed
(F–T)
Cable-/tendon-driven: elongation, slack, routing (Δθ)02200.014.9
Force/torque sensing: drift, temperature sensitivity, cross-talk172277.356.689.9
Harmonic drive (strain-wave): transmission error and wear (incl. lubrication)02200.014.9
Other or mixed fault classes52222.710.143.4
PMSM: electrical faults (ITSC, demagnetisation, eccentricity)02200.014.9
Transmission non-idealities: friction, hysteresis, backlash02200.014.9
Notes: n—number of studies within the actuator family that explicitly address the listed fault class; N Act—total number of studies in that actuator family (denominator); prop(%)—100 × (n/N Act); CI_low(%)/CI_high(%)—95.0% confidence interval for the proportion (Wilson method). Percentages are rounded to 1 decimal place; minor discrepancies may reflect rounding. Δθ denotes the motor–joint angle difference (Δθ = θ_motor − θ_joint), typically used in cable/tendon transmissions.
Table 3. Temporal trend per fault class (2016–2025).
Fault ClassOR Per +1 Year95% CIp-Valueq-Value
Bearing faults2.660.41–17.180.30320.6743
Cable/Bowden: elong./slack (Δθ)1.120.78–1.610.53600.8711
HD: TE and wear0.930.77–1.120.42310.8682
Non-idealities: friction/backlash0.780.52–1.180.24890.6254
Other/mixed1.020.85–1.210.86821.0000
PMSM: electrical0.890.68–1.160.38530.7075
Sensor: drift/temp1.290.90–1.860.16250.5924
OR per +1 year from logistic models (presence of fault class~year). q-values by Benjamini–Hochberg across classes.
Table 4. Metric reporting by actuator family (ACC/F1, MDFA, TTD, FAR: n, %, 95% CI).
MetricActuatorn
(Yes)
NProp
(%)
CI_Low
(%)
CI_High
(%)
ACC/F1Cable/Bowden132552.033.570.0
HD42317.47.037.1
PMSM232688.571.096.0
SEA163151.634.868.0
Torque-sensed (F–T)2222100.085.1100.0
MDFACable/Bowden0250.00.013.3
HD72330.415.650.9
PMSM0260.00.012.9
SEA0310.00.011.0
Torque-sensed (F–T)0220.00.014.9
TTDCable/Bowden0250.00.013.3
HD0230.00.014.3
PMSM0260.00.012.9
SEA0310.00.011.0
Torque-sensed (F–T)0220.00.014.9
FARCable/Bowden0250.00.013.3
HD0230.00.014.3
PMSM0260.00.012.9
SEA0310.00.011.0
Torque-sensed (F–T)0220.00.014.9
Notes: n(yes)—number of studies in the actuator family that report the metric; N—total studies in that family; prop(%)—100 × (n(yes)/N); CI_low(%)/CI_high(%)—95.0% Wilson interval. Δθ = θ_motor − θ_joint.
Table 5. Metric reporting by source platform (publisher/indexer) (condensed) (ACC/F1, MDFA, TTD, FAR: n, %, 95% CI).
MetricSource Platform (Publisher/Indexer)nN
Act
Prop
(%)
CI_Low
(%)
CI_High
(%)
ACC/F1Elsevier/ScienceDirect132846.429.564.2
Indexers (PubMed/DOI)91850.029.970.1
MDPI354774.560.584.7
Other publisher platforms183158.140.873.6
Preprints (arXiv)33100.043.8100.0
MDFAElsevier/ScienceDirect1283.60.617.7
Indexers (PubMed/DOI)1185.61.025.9
MDPI1472.10.411.1
Other publisher platforms43112.95.128.9
Preprints (arXiv)030.00.056.2
TTDElsevier/ScienceDirect0280.00.012.1
Indexers (PubMed/DOI)0180.00.018.5
MDPI0470.00.07.6
Other publisher platforms0310.00.011.0
Preprints (arXiv)030.00.056.2
FARElsevier/ScienceDirect0280.00.012.1
Indexers (PubMed/DOI)0180.00.018.5
MDPI0470.00.07.6
Other publisher platforms0310.00.011.0
Preprints (arXiv)030.00.056.2
Notes: Platform groups: MDPI; Elsevier/ScienceDirect; Other publisher platforms (Springer/Wiley/ASME/SAGE/PLOS/Frontiers/IEEE/IET/Other); Indexers (PubMed/DOI); Preprints (arXiv). Proportions are within the platform group; CIs by Wilson.
Table 6. Adjusted odds ratios (ACC/F1, MDFA).
OutcomeContrastaOR95% CIp-Value
ACC/F1Pandemic vs. Pre9.060.68–120.840.0954
Post vs. Pre16.780.60–466.520.0965
Year (per +1)0.810.50–1.300.3772
MDFAPandemic vs. PreNANA–NA0.9990
Post vs. Pre0.020.00–11.780.2209
Year (per +1)1.700.50–5.750.3931
Notes: adjusted logistic GLM with binomial link; covariates: actuator family, period (Pre 2016–2019; Pandemic 2020–2021; Post 2022–2025), calendar year, platform group. aOR = adjusted odds ratio; 95% CIs by Wald. Where separation led to unstable estimates, CI is shown as NA–NA.
Table 7. Fault-class coverage by platform group (condensed) (n and % within group).
Source Platform (Publisher/Indexer)FaultnN_GroupProp
(%)
MDPICable-/tendon-driven: elongation, slack, routing (Δθ)64712.8
Force/torque sensing: drift, temperature sensitivity, cross-talk74714.9
Harmonic drive (strain-wave): transmission error and wear (incl. lubrication)3476.4
Other or mixed fault classes194740.4
PMSM: electrical faults (ITSC, demagnetisation, eccentricity)94719.1
Transmission non-idealities: friction, hysteresis, backlash3476.4
Elsevier/ScienceDirectCable-/tendon-driven: elongation, slack, routing (Δθ)1283.6
Force/torque sensing: drift, temperature sensitivity, cross-talk32810.7
Harmonic drive (strain-wave): transmission error and wear (incl. lubrication)32810.7
Other or mixed fault classes122842.9
PMSM: electrical faults (ITSC, demagnetisation, eccentricity)62821.4
Transmission non-idealities: friction, hysteresis, backlash32810.7
Other publisher platforms (Springer/Wiley/ASME/SAGE/PLOS/Frontiers/IEEE/IET/Other) Cable-/tendon-driven: elongation, slack, routing (Δθ)2316.5
Force/torque sensing: drift, temperature sensitivity, cross-talk53116.1
Harmonic drive (strain-wave): transmission error and wear (incl. lubrication)53116.1
Other or mixed fault classes113135.5
PMSM: electrical faults (ITSC, demagnetisation, eccentricity)53116.1
Transmission non-idealities: friction, hysteresis, backlash3319.7
Indexers
(PubMed/DOI)
Cable-/tendon-driven: elongation, slack, routing (Δθ)41822.2
Force/torque sensing: drift, temperature sensitivity, cross-talk1185.6
Harmonic drive (strain-wave): transmission error and wear (incl. lubrication)51827.8
Other or mixed fault classes61833.3
PMSM: electrical faults (ITSC, demagnetisation, eccentricity)0180.0
Transmission non-idealities: friction, hysteresis, backlash21811.1
Preprints (arXiv)Cable-/tendon-driven: elongation, slack, routing (Δθ)030.0
Force/torque sensing: drift, temperature sensitivity, cross-talk2366.7
Harmonic drive (strain-wave): transmission error and wear (incl. lubrication)030.0
Other or mixed fault classes1333.3
PMSM: electrical faults (ITSC, demagnetisation, eccentricity)030.0
Transmission non-idealities: friction, hysteresis, backlash030.0
Table 8. Period effects on annual study counts by fault class (Poisson/NegBin; rate ratios).
Fault ClassRR (Pandemic vs. Pre)95% CIRR (Post vs. Pre)95% CI (Post)
Bearing faults----
Cable/Bowden: elong./slack (Δθ)1.000.06–15.990.670.08–5.33
HD: TE and wear0.670.19–2.300.510.20–1.33
Non-idealities: friction/backlashNANA0.080.01–0.79
Other/mixed0.930.23–3.730.920.28–2.96
PMSM: electrical0.290.03–3.150.100.01–0.77
Sensor: drift/tempNANANANA
Notes: Rates were computed as annual counts per fault class with log-offset for the total number of included studies per year; Haldane correction applied when a window had zero events. RR > 1 indicates a higher rate relative to Pre (2016–2019). CIs = 95.0%.
Table 9. Human-in-the-loop (HIL) across periods (logistic; odds ratios).
ContrastOR95% CINotes
Pandemic vs. Pre0.300.05–1.70Unadjusted (2 × 2).
Post vs. Pre0.410.12–1.46Unadjusted (2 × 2).
Notes: Unadjusted 2 × 2 odds ratios (Haldane correction when needed). OR > 1 indicates higher odds relative to Pre (2016–2019). CIs = 95.0%.
Table 10. Metric reporting by period (logistic; odds ratios).
OutcomeContrast95% CIORNotes
ACC/F1Pandemic vs. Pre0.41–9.842.00Unadjusted (2 × 2).
Post vs. Pre0.88–11.703.21Unadjusted (2 × 2).
MDFAPandemic vs. Pre0.03–4.090.32Unadjusted (2 × 2).
Post vs. Pre0.03–1.140.18Unadjusted (2 × 2).
Notes: Unadjusted 2 × 2 odds ratios for whether the metric is reported (ACC/F1; MDFA). TTD and FAR were not reported in any window (descriptive only). CIs = 95.0%.
Table 11. Platform distribution by period (counts and % within period).
Source Platform
(Publisher/Indexer)
Pre
n (%)
Pandemic
n (%)
Post
n (%)
Elsevier/ScienceDirect0 (0.0%)3 (20.0%)25 (24.5%)
Indexers (PubMed/DOI)3 (27.3%)4 (26.7%)12 (11.8%)
MDPI1 (9.1%)3 (20.0%)43 (42.2%)
Other publisher platforms7 (63.6%)5 (33.3%)19 (18.6%)
Preprints (arXiv)0 (0.0%)0 (0.0%)3 (2.9%)
Notes: Platform groups: MDPI; Elsevier/ScienceDirect; Other publisher platforms (Springer/Wiley/ASME/SAGE/PLOS/Frontiers/IEEE/IET/Other); Indexers (PubMed/DOI); Preprints (arXiv). χ2 tests and Cramér’s V summarise the strength of association across the 3 windows. χ2 test: χ2 = 19.87; df = 8; p = 0.0109; Cramér’s V = 0.279.
Table 12. FDD reporting checklist for pHRI.
NoDomainRecommandation
1Task and populationDescribe task context; if applicable, indicate whether the human phase was controlled.
2Actuator and transmissionSpecify actuator family (HD/SEA/Cable/PMSM/Torque-sensed) and reducer/compliance.
3Fault ground-truthFault induction protocol or labelling procedure documented.
4Sensors and samplingList sensors (F/T, encoder/IMU, currents, vibration/FBG) and sampling rate.
5Residual/featuresObserver/parity, spectral features, or learned features are described.
6Decision threshold (τ)How τ is set (validation/ROC/clinical constraint) and its value.
7ACC/F1Accuracy and/or F1 reported; class-wise if applicable.
8MDFAMinimal detectable fault amplitude (units) and procedure.
9TTDDetection latency (ms or gait cycles).
10FAR@τFalse-alarm rate at the stated decision threshold τ.
11Safety responsePost-detection fallback/reconfiguration strategy.
12ReproducibilityCode/data availability; DOI/URL provided.
Notes: Unadjusted 2 × 2 odds ratios for whether the metric is reported (ACC/F1; MDFA). TTD and FAR were not reported in any window (descriptive only). CIs = 95.0%.
Disclaimer/Publisher’s Note: The statements, opinions and data contained in all publications are solely those of the individual author(s) and contributor(s) and not of MDPI and/or the editor(s). MDPI and/or the editor(s) disclaim responsibility for any injury to people or property resulting from any ideas, methods, instructions or products referred to in the content.