Article

Dynamic Modeling of a Three-Phase BLDC Motor Using Bond Graph Methodology

by
Mayar Abdullah Taleb
1,2,* and
Géza Husi
1
1
Department of Electrical Engineering and Mechatronics, University of Debrecen, Ótemető utca 2-4, 4028 Debrecen, Hungary
2
Doctoral School of Informatics, University of Debrecen, Kassai út 26, 4028 Debrecen, Hungary
*
Author to whom correspondence should be addressed.
Actuators 2025, 14(11), 523; https://doi.org/10.3390/act14110523
Submission received: 12 September 2025 / Revised: 12 October 2025 / Accepted: 21 October 2025 / Published: 28 October 2025
(This article belongs to the Section Actuators for Robotics)

Abstract

This paper presents a dynamic modeling approach for a 3-phase BLDC motor used in a differential-drive serving robot using bond graph (BG) methodology. Designed for structured indoor environments, the serving robot incorporates mechanical, electrical, and control components that require an integrated modeling strategy. Traditional methods often fall short in handling the multi-domain nature of such systems. Bond graphs, with their energy-based modeling capability, offer a unified framework for capturing electromechanical dynamics and physical interactions. This work develops a complete bond graph model of a three-phase BLDC motor-driven robot, simulates its performance under typical operating conditions, and validates the model through current, torque, EMF, and velocity responses. The results demonstrate the model’s effectiveness in reflecting real-world robot behavior, supporting future design optimization and control development.

1. Introduction

The rapid advancement of service robotics has transformed the way autonomous systems interact with humans in dynamic, non-industrial environments such as restaurants, hospitals, and public service areas. The International Federation of Robotics (IFR) defines Service Robots (SRs) as programmable machines that actuate in at least two axes to perform useful tasks for humans [1]. Their primary function is to assist or deliver items to individuals, rather than to engage in industrial production. In addition to task execution, if a serving robot is capable of speech, emotional responsiveness, face recognition, or conversational interaction, it may also be categorized as a social robot [2].
Serving robots must operate safely and reliably in semi-structured indoor settings, often interacting with people and adapting to unpredictable conditions. Ensuring the robot’s capabilities, like variable payloads, obstacle avoidance, and energy efficiency, requires an accurate understanding of its dynamic behavior [3,4].
Traditional modeling approaches for robotic systems, such as Newtonian or Lagrangian mechanics, are often limited in their ability to handle complex, multi-domain interactions within these robots [5,6]. Moreover, much of the current research in serving robots tends to focus on navigation [7], AI-based perception [8,9], or control algorithms [10], with relatively limited attention given to comprehensive physical system modeling. In contrast, BG modeling provides a unified, energy-based methodology that captures the dynamic behavior across different domains, such as mechanical, electrical, and control domains, while maintaining system modularity and physical interpretability [11]. The advantage of the bond graph is that it is a domain-independent method that can model single-domain or multi-domain systems [12]. Wang et al. present a single-domain BG of a belt-type spindle system, which is considered a mechanical system, and they utilized the output power of the BG to predict the start-up energy consumption of the spindle through mapping the peak power [13]. On the other hand, multi-domain BG is presented in [14], where Massarotti et al. analyze the BG of a dual steering tractor to specify the optimal control algorithm for minimizing the steering noise and enhancing driving comfort. The system contains a mechanical domain that is analyzed using a 3D-BG vectorial domain, and a hydraulic domain analyzed by a 1D-BG scalar domain.
The BG method can be used in controlling methodology, predicting, diagnosing, and accommodating faults and failures [15]. Guo et al. [16] present a bond-graph–based control framework for a DC motor (with gearbox), representing a PID controller in BG for speed regulation and formulating a sliding-mode controller for position/speed tracking; to mitigate tracking errors and improve robustness under uncertainties and saturation, they further develop an adaptive robust sliding-mode controller (ARSMC), also expressed in BG.
In [17], Zaidi et al. develop an electrical-domain diagnostic BG for a two-stage interleaved boost converter and derive analytical redundancy relations (ARRs) to generate residuals and a fault-signature table, enabling detection and isolation of power-switch, sensor, and discrete-component faults; the scheme is paired with a passive fault-tolerant cascade PI–sliding-mode controller to maintain regulation during reconfiguration. Dash et al. [18] propose a hybrid Bond-Graph–CNN (BG-CNN) fault-diagnosis method that uses physics-based diagnostic bond-graph residuals (ARRs from an LFT-BG model) as inputs to a compact CNN, so the network learns fault patterns with minimal labeled data. They demonstrate the approach on a DC motor case study with parameter and sensor faults injected as both gradual and step changes under measurement noise.
Unlike previous studies that applied bond graph modeling only at component or control levels, this work introduces a unified bond graph-based framework that integrates six-step commutation, back-EMF, and torque ripple analysis, as well as robot-level dynamics, within a single energy-consistent model. This approach enables the simultaneous analysis of both the electrical and mechanical subsystems of the BLDC-driven robot, providing a foundation for future work on controller design, performance optimization, and fault diagnosis strategies.
In this paper, the authors will present a bond graph model of a differential-drive, shelf-based serving robot designed for indoor service environments. The model integrates key dynamic elements, including motor actuation, electrical and mechanical domain influence, by providing an analytical foundation for simulation, and further optimization. The main contributions of this paper are:
  • Development of a complete bond graph model for a 3-phase BLDC motor used in differential-drive serving robot.
  • Cross-domain modeling of electromechanical and structural components in a unified framework.
  • Analysis of motor performance to support future controller design and task planning.
The paper is organized as follows: Section 2 provides a review of related work on serving robots and bond graph modeling. Section 3 describes the physical and functional architecture of the robot. Section 4 details the bond graph formulation of the system. Section 5 presents simulation results and discusses dynamic performance, and Section 6 concludes the paper.

2. Bond Graph

Bond Graph (BG) is a graphical technique for determining the flow and distribution of the energy and power of a physical dynamic system [19]. The power of the system is given by multiplying the effort by the flow. For example, in an electrical system, the effort is the voltage while the flow is the current. Therefore, the product of multiplying the voltage and the current will introduce the power of the system. This method applies to various dynamic systems and the multidisciplinary systems [20].
BG enforces global energy conservation graphically instead of algebraically; at every 0-junction, the efforts are equal, and the flows sum to zero, while at every 1-junction, the flows are equal, and the efforts sum to zero. As indicated in Table 1, the standard elements of BG are junctions (one-junction and zero-junction), buffers and dissipators, sources, transformers, and gyrators.

Causality

Causality stroke is a short bar placed at one end of each bond to indicate which side imposes effort or flow. This simple mark reveals integrators (state variables) in C and I elements and exposes any algebraic loops before generating mathematical equations. As indicated in Figure 1a, if the causality is next to the arrow (bond), it means that the effort flows to the bond and the flow is out from the bond. On the other hand, when the causality is at the opposite side of the arrow, it means that the flow flows to the bond and the effort is out of the bond.
The first step in assigning the causalities to BG is to apply fixed causality, which are the sources (Se and Sf), then apply the constraint causalities (the junctions and the transformer/gyrator). The third step is the arbitrary element with preferred causality (the buffers C and I elements). The final step is applying causality to an arbitrary element with indifferent causality, such as R-elements. An example of a BG with causality preferences is shown in Figure 1b.

3. System Description

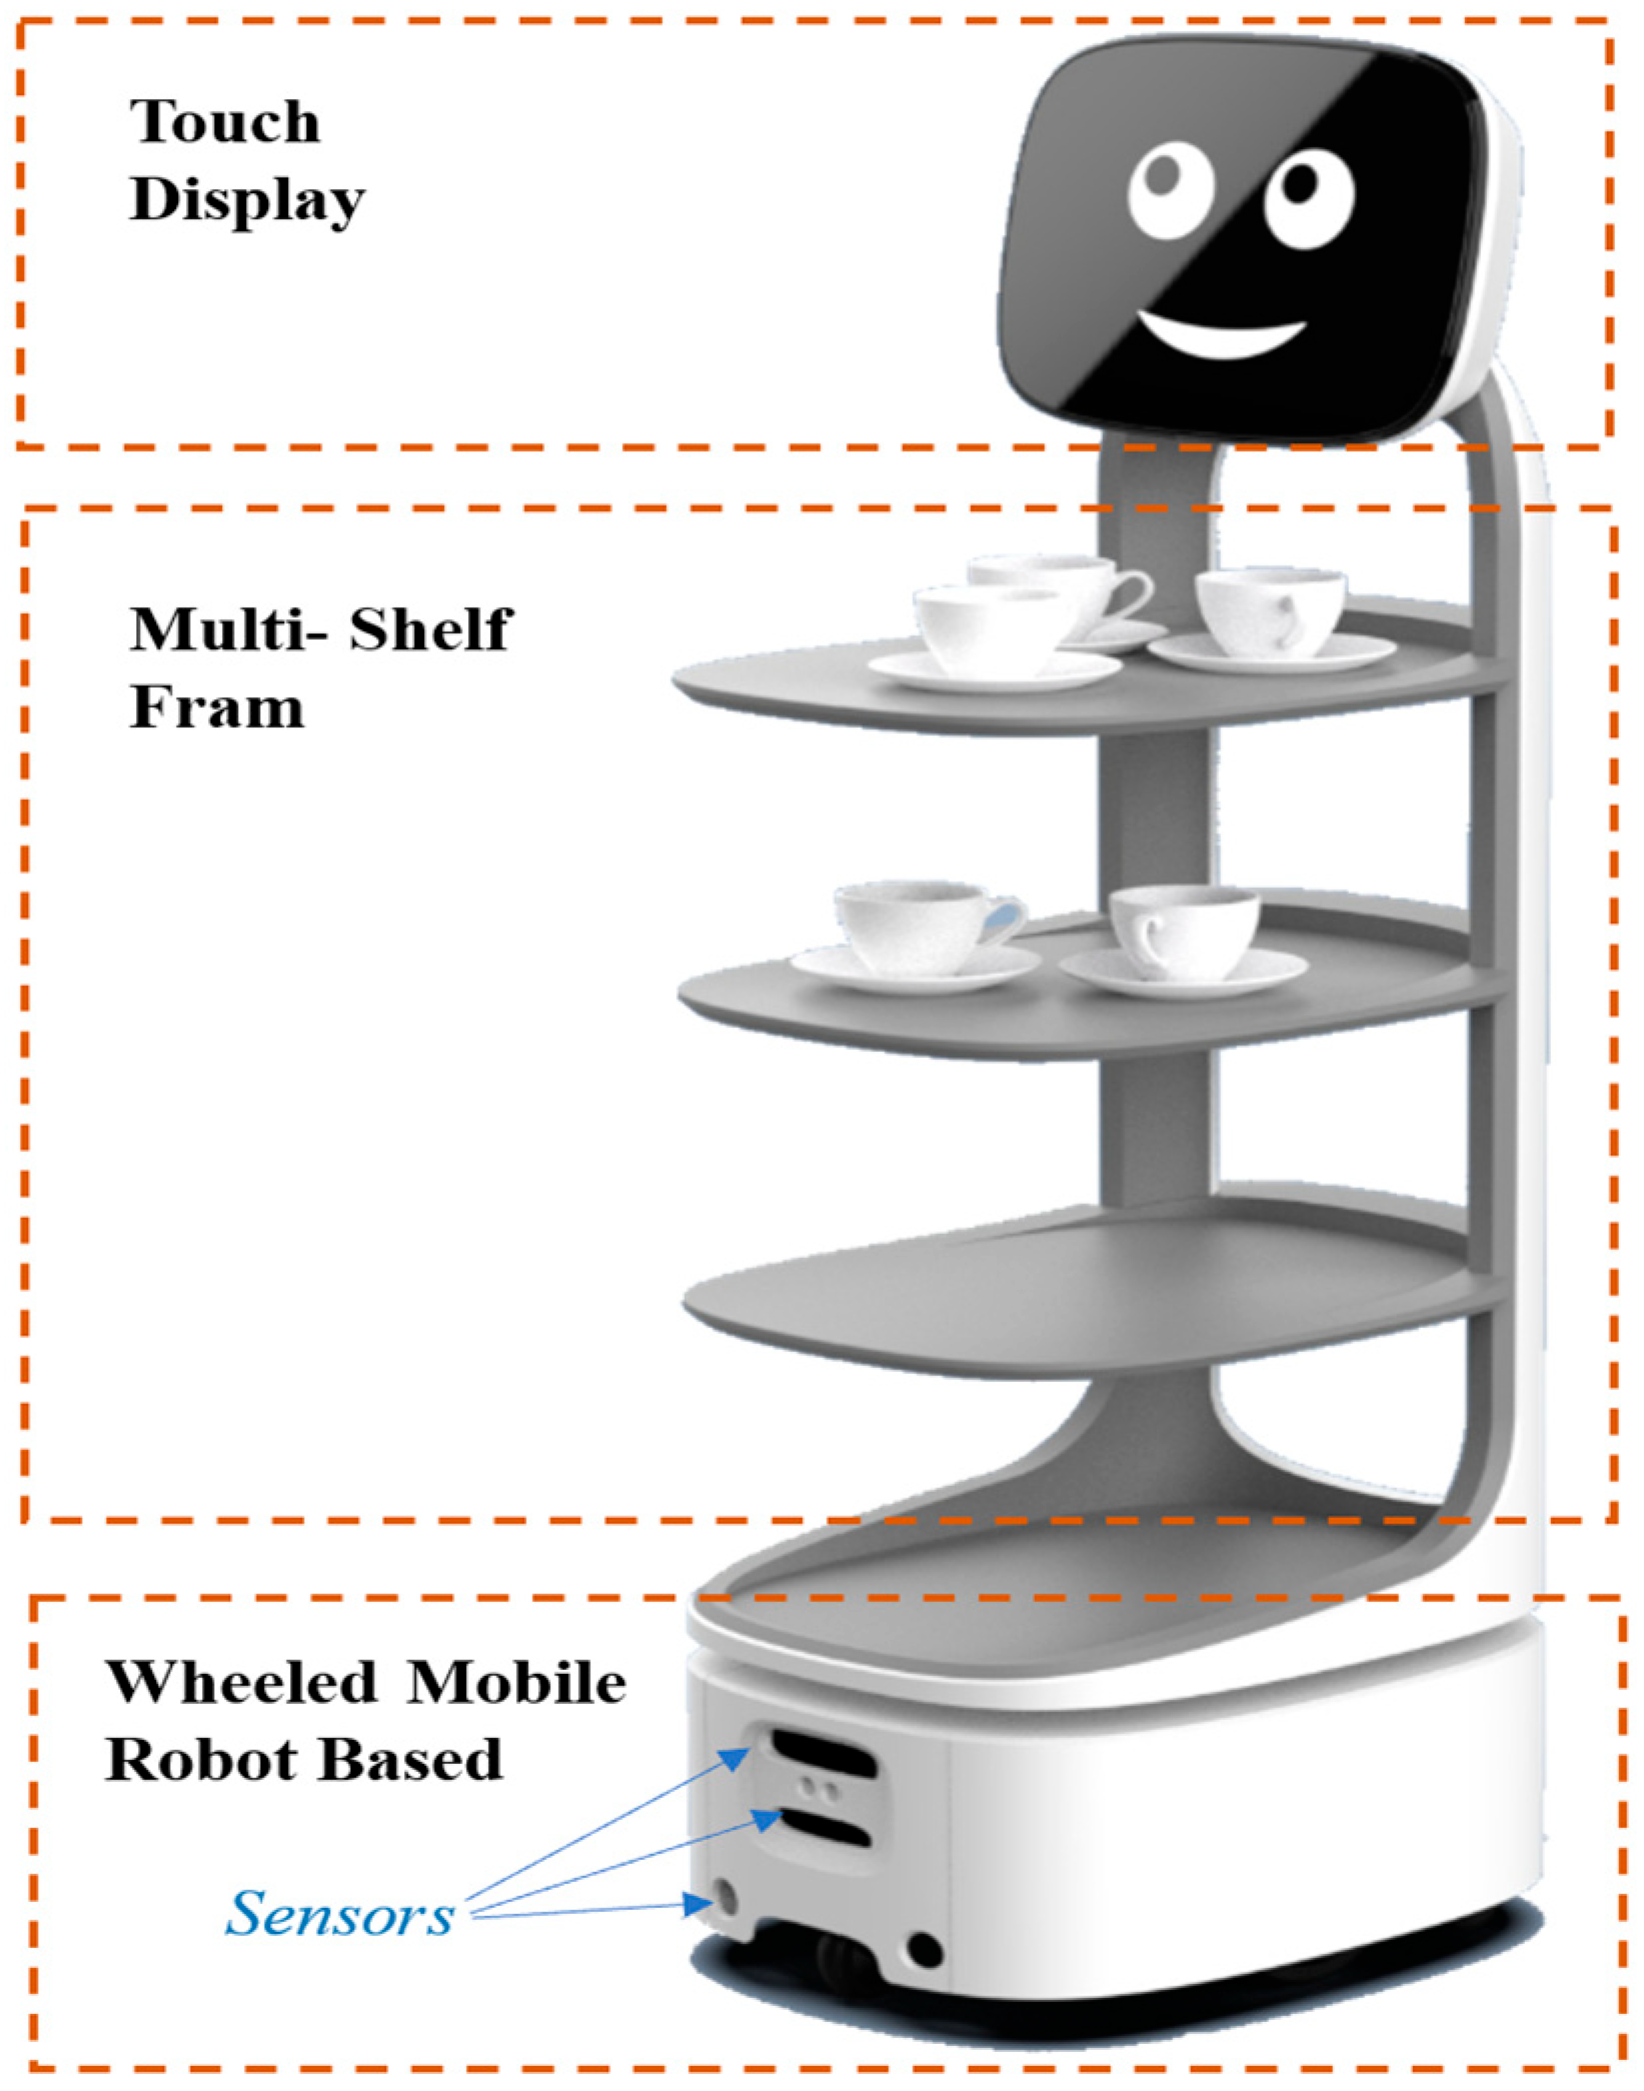
The serving robot considered in this study is the Diana robot from Enjoy Robotics [21]. As shown in Figure 2, Diana is a wheeled social mobile robot designed to navigate indoor environments and deliver items to users. The robot’s architecture integrates mechanical, electrical, and sensory components, each contributing to the overall system dynamics modeled using the BG technique.
The robot contains two driving wheels with three-phase brushless DC (BLDC) servo motors and three passive wheels. Additionally, the robot is equipped with several sensors like lidar sensors, incremental encoders, a stereo depth camera, thermal cameras, Re-Speaker, a touch display, etc.

3.1. Kinematic Configuration and Wheel Layout

Diana robot has a differential-drive mechanism with two active (driving) wheels and one passive caster wheel, and two passive supporting wheels for balance and maneuverability. The kinematic layout, shown in Figure 3, defines the relationship between the robot’s chassis, wheel placement, and motion in a planar environment.
In this configuration, the left (L) and right (R) wheels are independently driven and provide the necessary torque for forward motion and rotation. The passive wheels (1, 2, and 3) support the robot’s weight and maintain balance, but do not contribute directly to propulsion. Passive wheel 1 is the caster wheel in the system. The chassis coordinate frame ( x C , y C ) is centered at the robot’s center of mass (CoM), and the angular velocity ( ω C ) defines the rotational motion about the vertical axis (z-axis).
Let ( v C ) denote the linear velocity of the robot’s center of mass, and ( ω C ) its angular velocity about the vertical axis. Assuming no wheel slippage and planar movement, the velocity components of the CoM in the world frame are given by:
x ˙ C = v C · cos θ
y ˙ C = v C · sin θ
where θ is the robot’s orientation with respect to the inertial x -axis.
The velocities of the left and right wheels, v L and v R , respectively, are related to the robot’s translational and rotational motion by:
v L = v C D 2 · ω C
v R = v C + D 2 · ω C
where D is the distance between the two driving wheels. These expressions form the basis for the inverse kinematics used in motor control.
From these relations, the robot’s angular velocity can be derived as:
ω C = v R v L D
v C = v R + v L 2
This differential-drive configuration enables the robot to:
  • Move forward or backward by setting v L = v R ;
  • Rotate in place by setting v L = v R ;
  • Turn with a defined radius by setting v L v R .
This motion strategy is efficient for navigating narrow indoor spaces, such as restaurant aisles or corridors, making it ideal for serving tasks.

3.2. Bond Graph Modeling

The BG model of the system is analyzed by using 20-sim 5.1 software because it supports integration with control systems, parameter tuning, and real-time simulation. Overall, 20-sim combines modeling, simulation, and control capabilities in a single environment, ensuring accuracy and efficiency [22].

3.2.1. Modeling of the Electromechanical System
A three-phase brushless Direct Current (3-phase BLDC) motor contains a permanent magnet rotor and three coiled stators (A, B, and C), with a 120-degree phase difference between each coil, as shown in Figure 4a. These elements represent a combination of electrical and mechanical domains, and they are connected through a gyrator element. The electrical part consists of three components, the resistance of the stator ( R S ), stator inductance ( L S ) and input effort source for the three phases ( U A , U B and U C ), which represents the voltage sources of the motor as indicated in Figure 4b. The gyrator (GY) describes the electromechanical conversion in the motor. The mechanical part is characterized by its inertia (J) and the viscous friction coefficient B f . The transmission elasticity of the shaft is represented by the compliance (C), which is the inverse of stiffness (k), defined as the ability to resist deformation when loads are applied.
C = 1 k
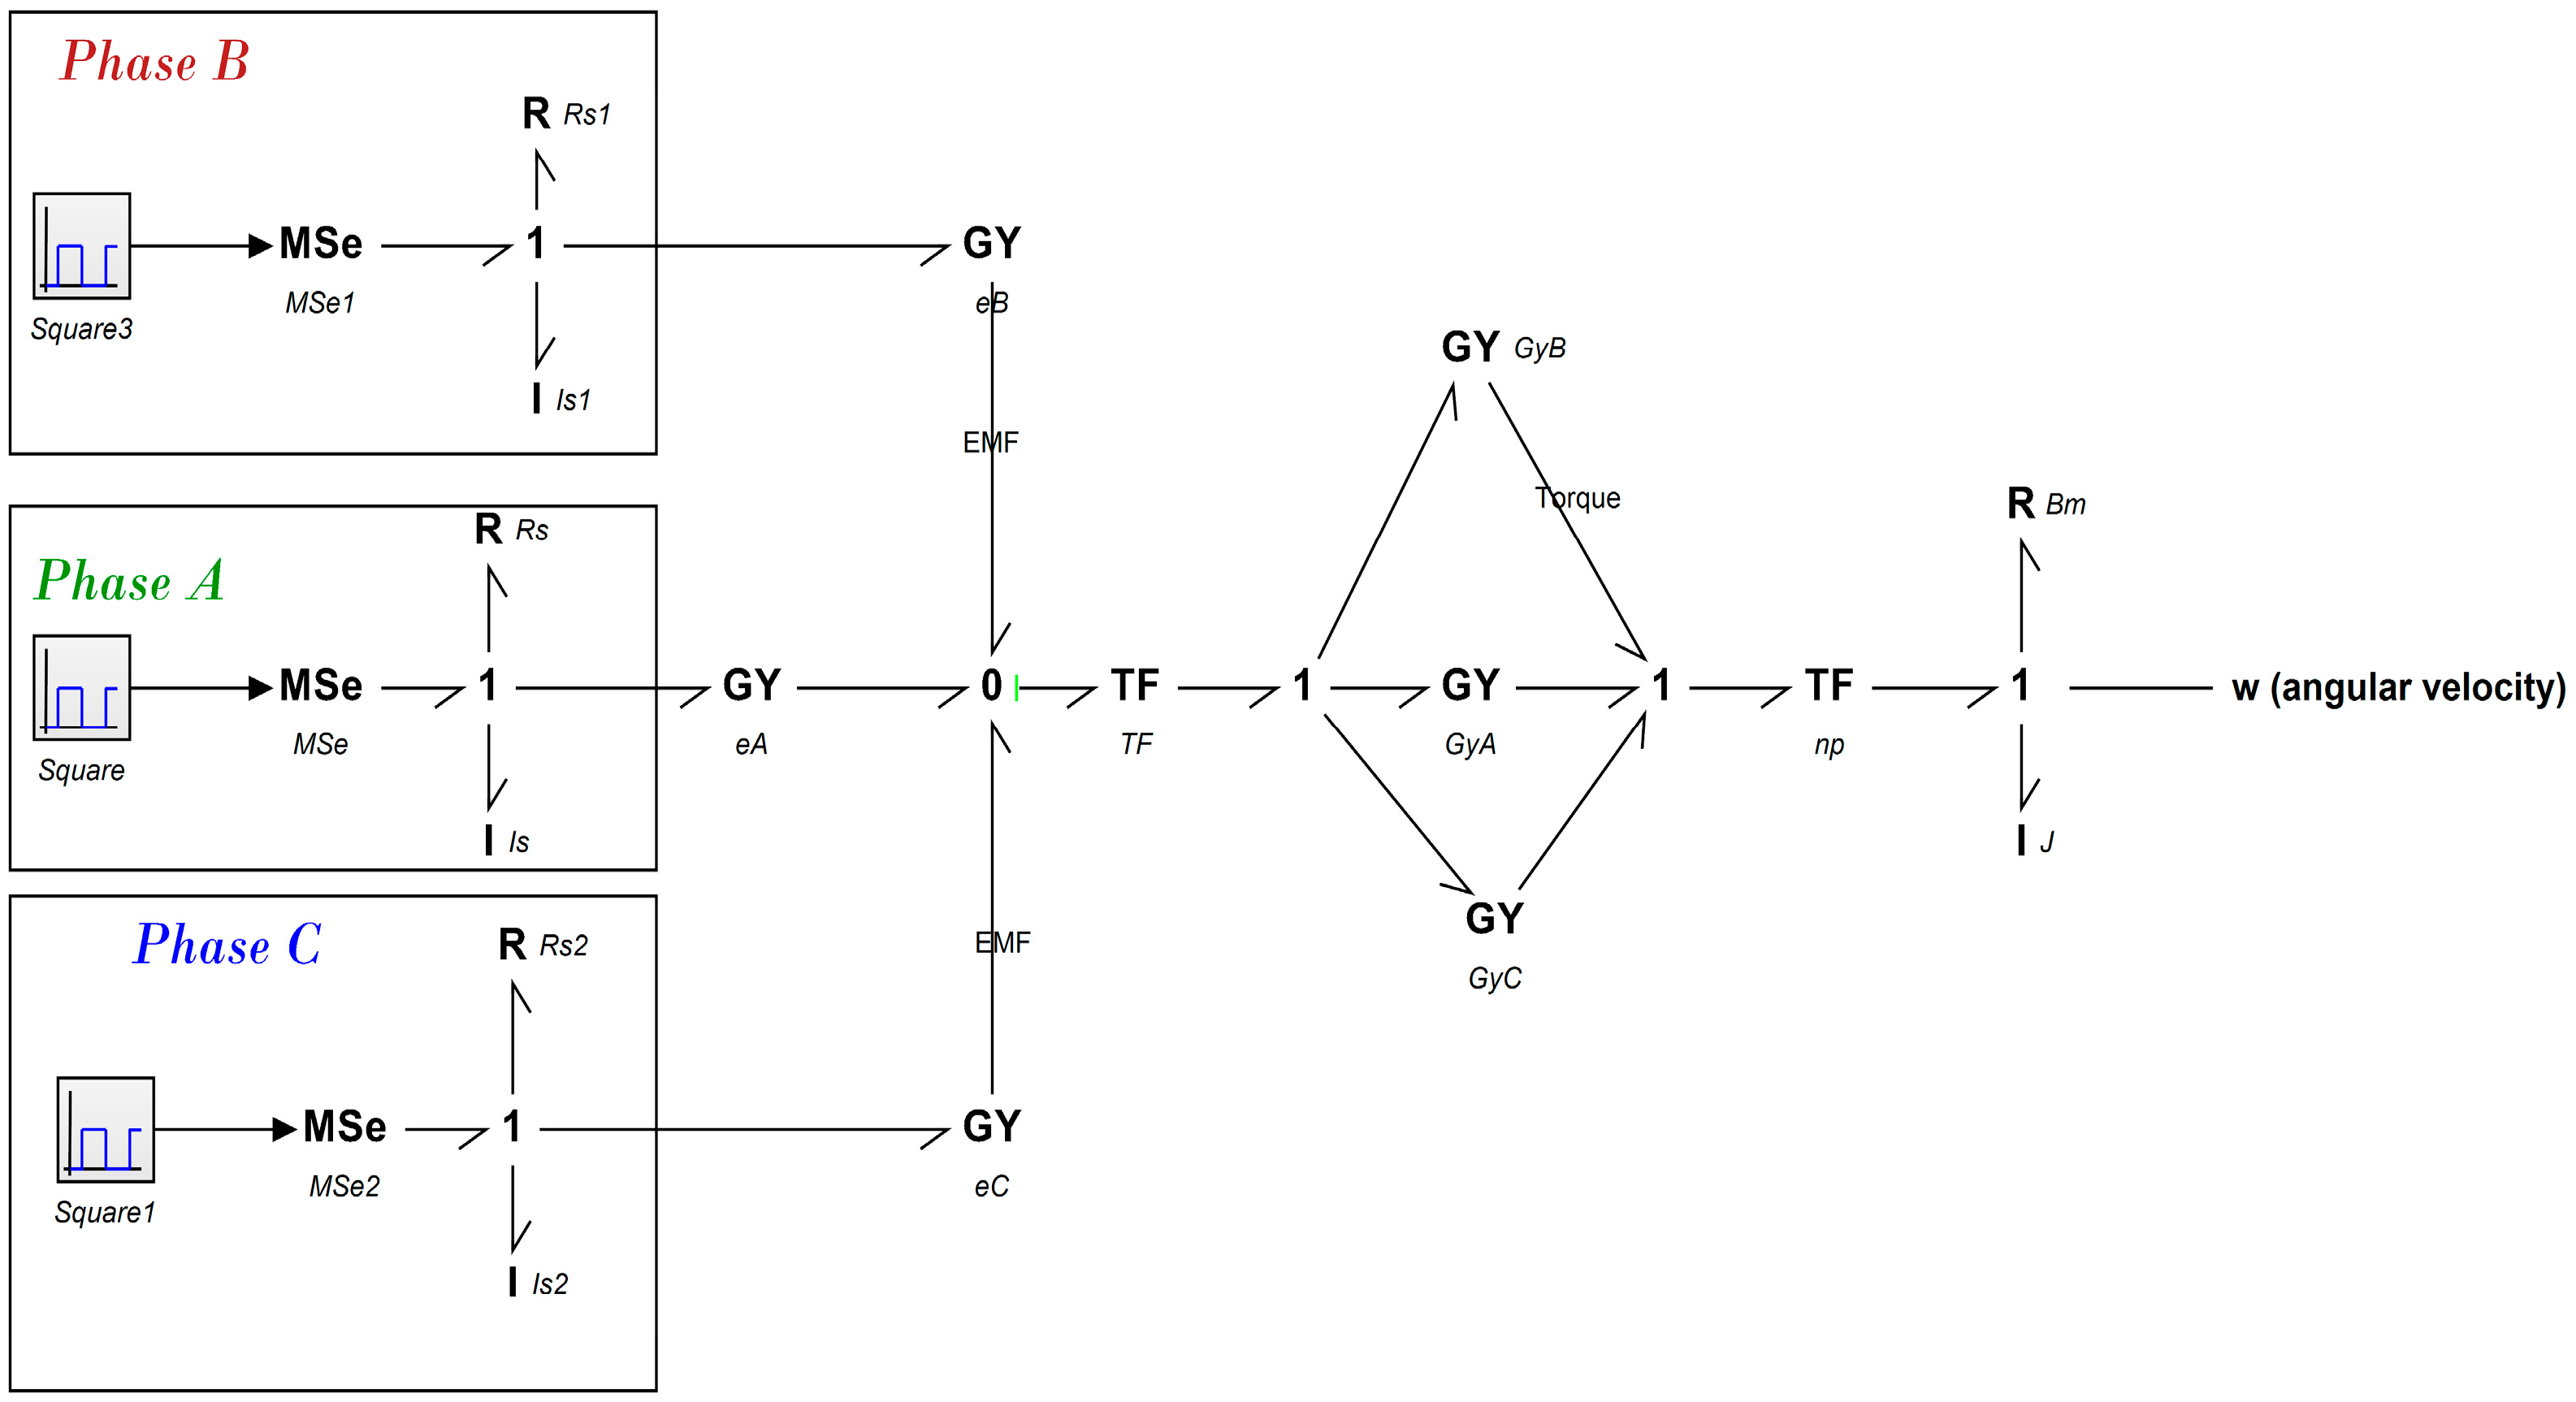
The dynamic behavior of the three-phase BLDC motor was modeled using the bond graph approach, which provides an energy-based framework for analyzing electromechanical systems. As illustrated in Figure 5, each phase winding was represented by an R−L branch, describing the resistive and inductive properties of the stator coils. The three GY components connected to a 0-junction represent the current summation of the current in Figure 4b, in which the output is zero as indicated in Equation (8)
i A + i B + i C = 0
Each stator phase is represented by a pair of gyrators, resulting in six GY elements in total. One gyrator models the electromagnetic torque generation τ = k t i , while the second represents the back-EMF feedback e = k e ω . This dual-gyrator formulation ensures clear causality assignment and facilitates modular interfacing with control or commutation subsystems in the simulation model. The transformer (TF) element accounts for the relationship between electrical and mechanical angular velocities, scaled by the motor’s pole-pair ratio.
Figure 5 represents the bond graph of the three-phase BLDC motor electromechanical coupling. Each GY element represents a bidirectional power exchange between one stator phase and the mechanical shaft, ensuring energy conservation between the electrical and mechanical domains. The 0-junction denotes the common voltage node connecting the three-phase branches, while the 1-junction collects the total torque contributions from the three GY elements. The transformer (TF) couples the mechanical shaft dynamics to the electrical domain according to the number of pole pairs. This schematic captures the fundamental energy conversion principles of the BLDC motor, forming the theoretical basis for the simulation model.
Figure 5. Bond graph representation of the three-phase BLDC motor electromechanical coupling.
Actuators 14 00523 g005
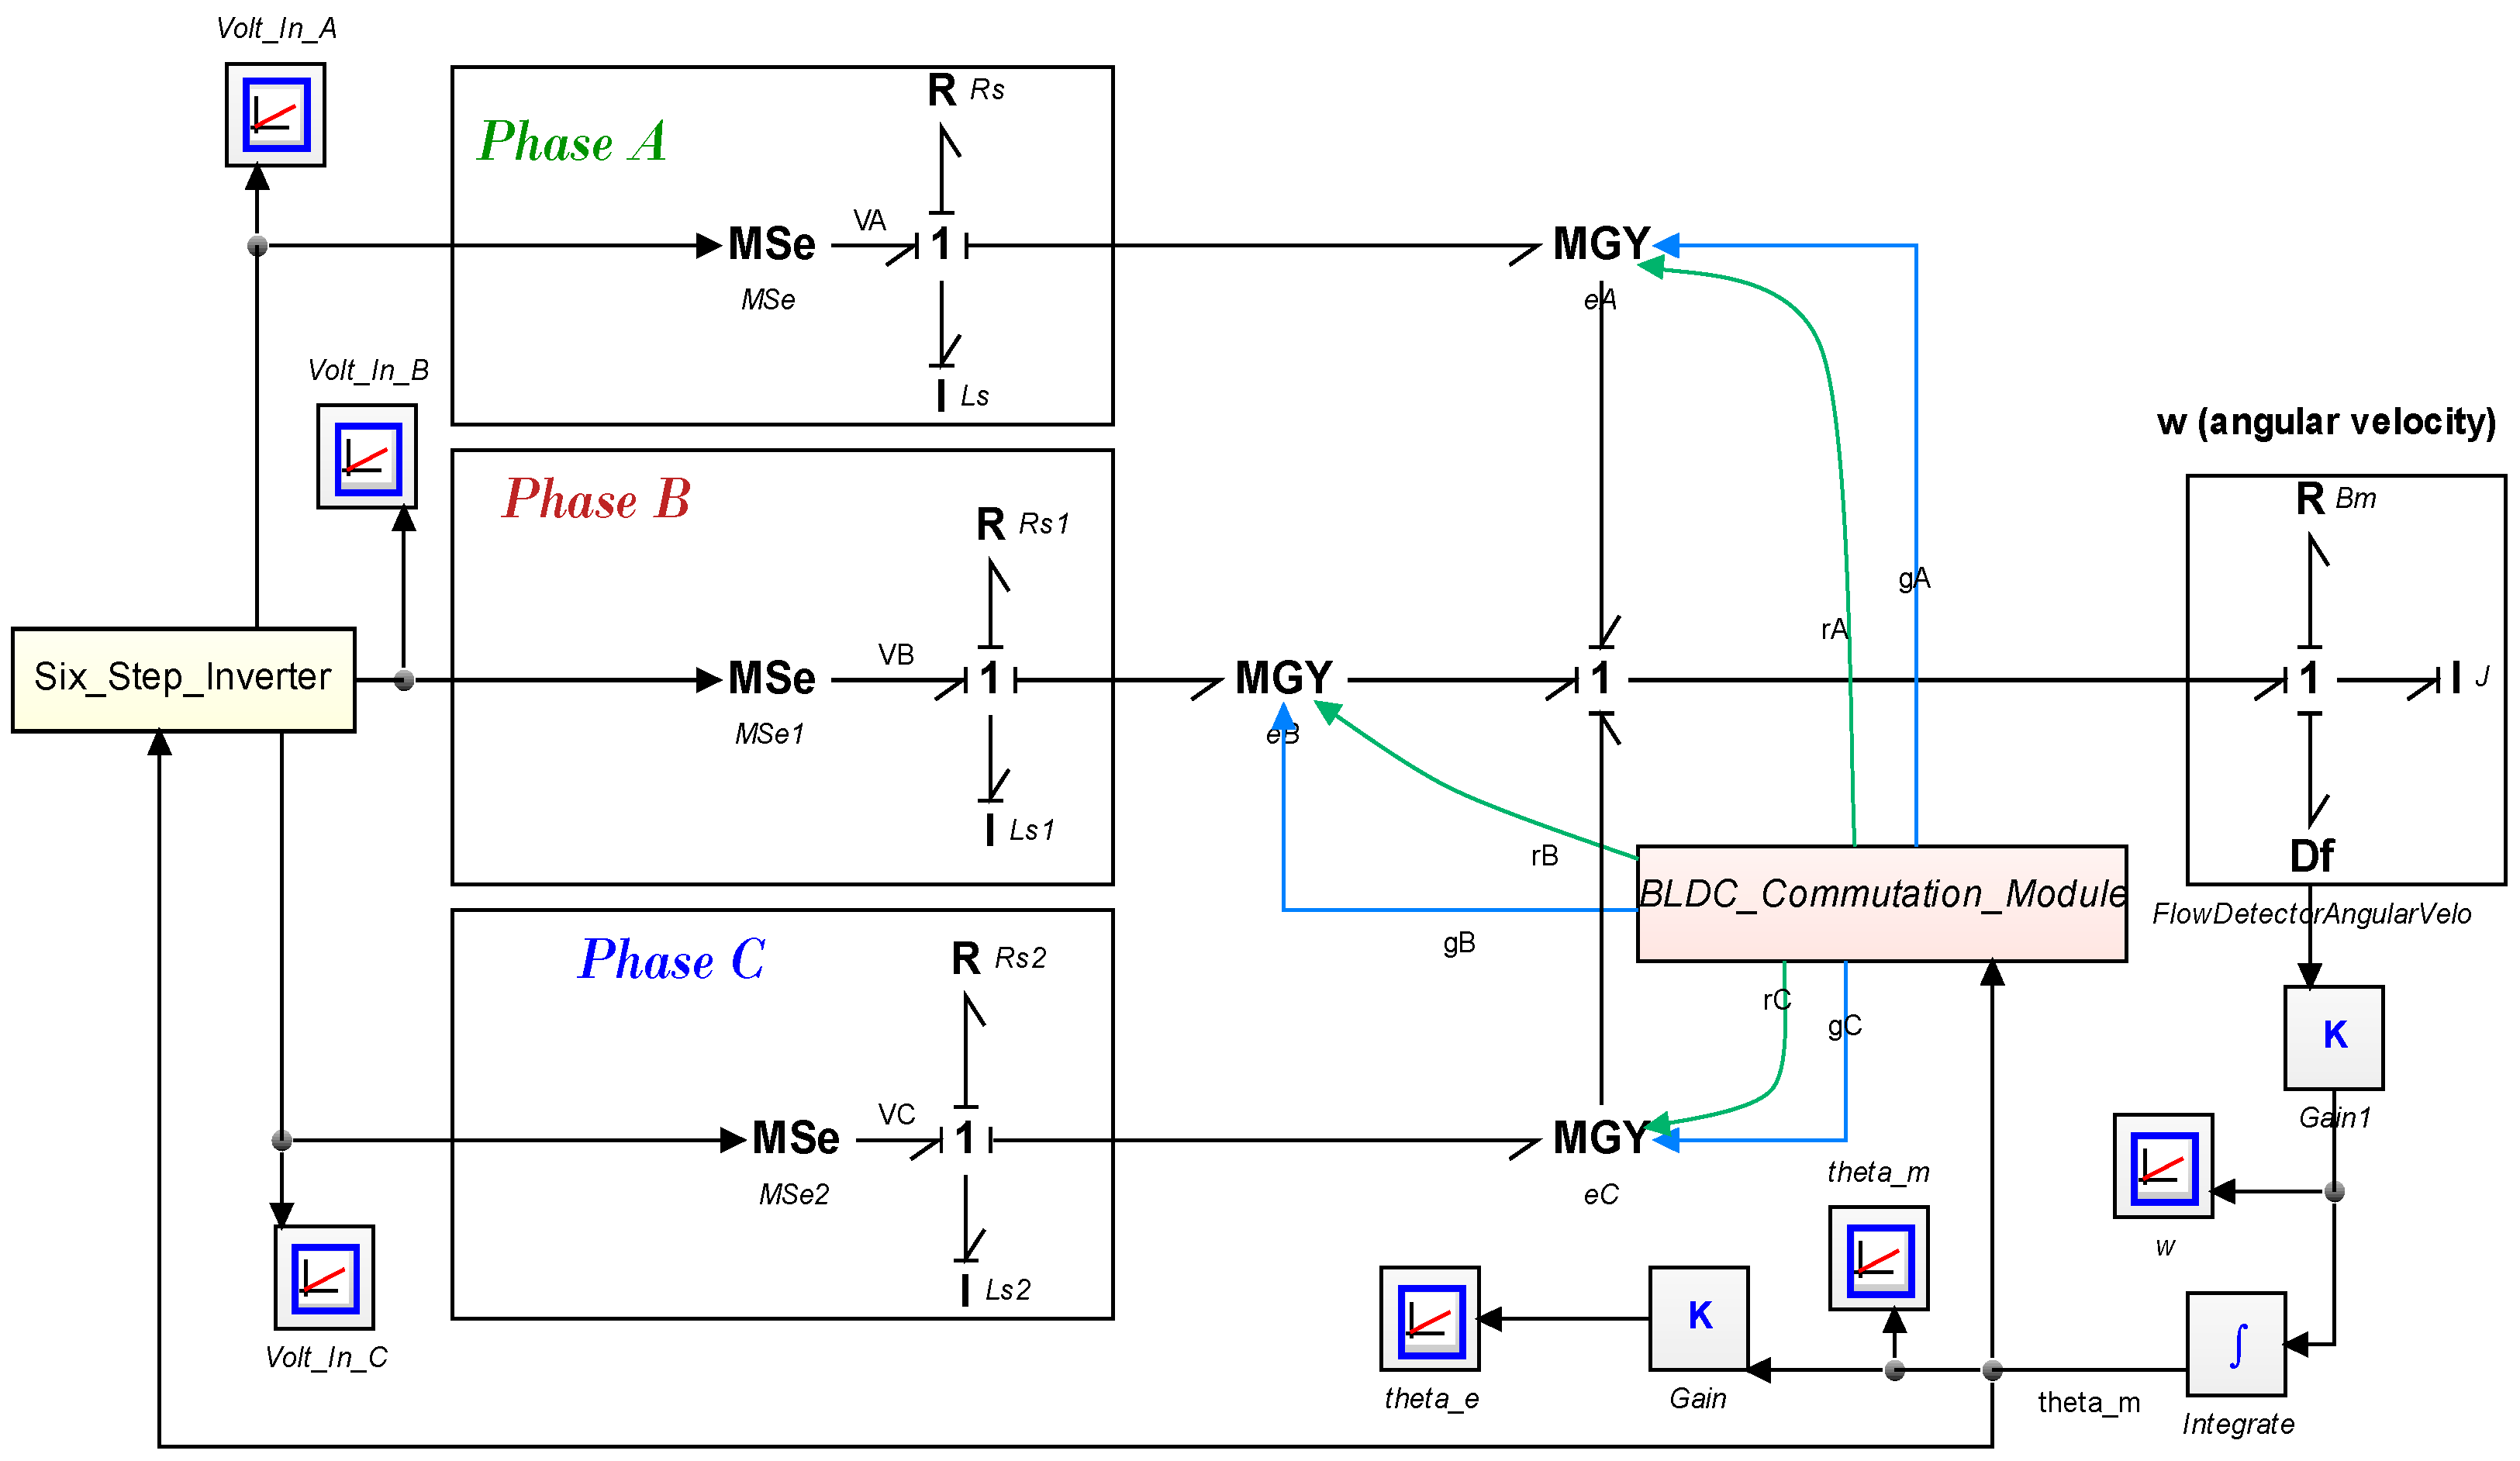
Figure 6 presents the 20-sim implementation of the bond graph model for BLDC motor dynamics and commutation. The implemented model follows the same energy structure as the conceptual bond graph but introduces computational modules suitable for time-domain simulation. The Six-Step Inverter block generates trapezoidal excitation voltages, while the BLDC_Commutation_Module computes the modulation functions ( f A ,   f B   a n d   f C ) and the corresponding EMF and torque coefficients ( r A ,   g A ). These signals define the instantaneous electromechanical coupling in each phase, while the mechanical subsystem—including inertia and damping—integrates the electromagnetic torque to compute the rotor angular velocity and position.
In the Six-Step Inverter Voltage Generation submodel shown in Figure 6, the inverter produces trapezoidal phase voltages corresponding to six commutation sectors of 60° each. The instantaneous electrical angle is:
ϕ = p θ m + θ 0 ,             θ e = ϕ ϕ / ( 2 π ) 2 π
where p is the number of pole pairs and θ 0 is a small offset to avoid numerical discontinuity. The DC bus voltage is ramped to its nominal value:
V d c , e f f = { V d c , n o m t t r a m p , 0 < t < t r a m p , V d c , n o m , t t r a m p .
The corresponding phase voltages are defined piecewise as:
( v A , v B , v C ) = 1 2 , 1 2 , 0 V d c , e f f , 0 θ e < π 3 , 1 2 , 0 , 1 2 V d c , e f f , π 3 θ e < 2 π 3 , 0 , 1 2 , 1 2 V d c , e f f , 2 π 3 θ e < π , 1 2 , 1 2 , 0 V d c , e f f , π θ e < 4 π 3 , 1 2 , 0 , 1 2 V d c , e f f , 4 π 3 θ e < 5 π 3 , 0 , 1 2 , 1 2 V d c , e f f , 5 π 3 θ e < 2 π .
A small deadband ε is applied at sector boundaries to prevent chattering during commutation.
The second submodel equation, called BLDC_Commutation_Module, as indicated in Figure 6, maps the mechanical rotor angle to the three-phase-shifted trapezoidal waveforms that modulate the electromechanical coupling (back-EMF and torque) of a trapezoidal-BLDC motor. The commutation pattern is obtained by calculating the phase-shifted trapezoidal waveforms ( f A , f B , f C ) within the electrical period.
As indicated in Equation (9), the electrical angle is derived from the mechanical rotor angle θ m .
This ensures that θ e remains within the range [ 0 ,   2 π ) . Each stator phase is displaced by 120° electrical from the others. Thus, the instantaneous per-phase electrical angles are expressed as:
t A = θ e
t B = θ e 2 π 3 θ e 2 π 3 2 π 2 π
t C = ( θ e + 2 π 3 ) θ e + 2 π 3 2 π 2 π .
This wrapping ensures that all phase angles remain within one electrical revolution. Each phase generates a trapezoidal function f k ( t k ) ( k = A , B , C ) over one electrical period.
The waveform varies between (−1) and (+1) as follows:
f k ( t k ) = 6 π t k , 0 t k < π 6 , 1 , π 6 t k < 5 π 6 , 6 π ( t k π ) , 5 π 6 t k < 7 π 6 , 1 , 7 π 6 t k < 11 π 6 , 6 π ( t k 2 π ) , 11 π 6 t k < 2 π .
These trapezoidal profiles represent the idealized phase back-EMF shapes for a BLDC motor. The trapezoidal functions are then used to compute the modulation coefficients for the electromechanical coupling (MGY blocks). Each phase has a coefficient for the EMF path r k and the torque path g k :
r A = K e ,   phase f A
r B = K e ,   phase f B
r C = K e ,   phase f C
g A = K t f A
g B = K t f B
g C = K t f C
The EMF in each phase is proportional to the product of the phase coefficient, and the angular velocity is indicated in Equation (22), while the electromagnetic torque produced by each phase is shown in Equation (23). Finally, the total electromagnetic torque acting on the rotor is determined in Equation (24):
e k = r k ω m ,   k { A , B , C } .
τ k = g k i k ,   k { A , B , C } .
τ em = τ A + τ B + τ C = K t ( f A i A + f B i B + f C i C )
The electromechanical interaction between each phase winding and the rotor is represented by a Modulated Gyrator (MGY) element. This element converts electrical power (voltage–current domain) into mechanical power (torque–angular velocity domain) through the modulation coefficients r and g obtained from the BLDC_Commutation_Module.
The integration of the analytical bond graph with its simulation-based implementation provides a unified and energy-consistent framework for studying BLDC electromechanical behavior. Unlike conventional models, this method emphasizes physical energy conservation, transparency in the coupling mechanisms, and modular expandability toward full robotic dynamics, control, and fault diagnosis. These aspects collectively represent the novelty and main contribution of this work.

3.2.2. Modeling of the Mobile Robot

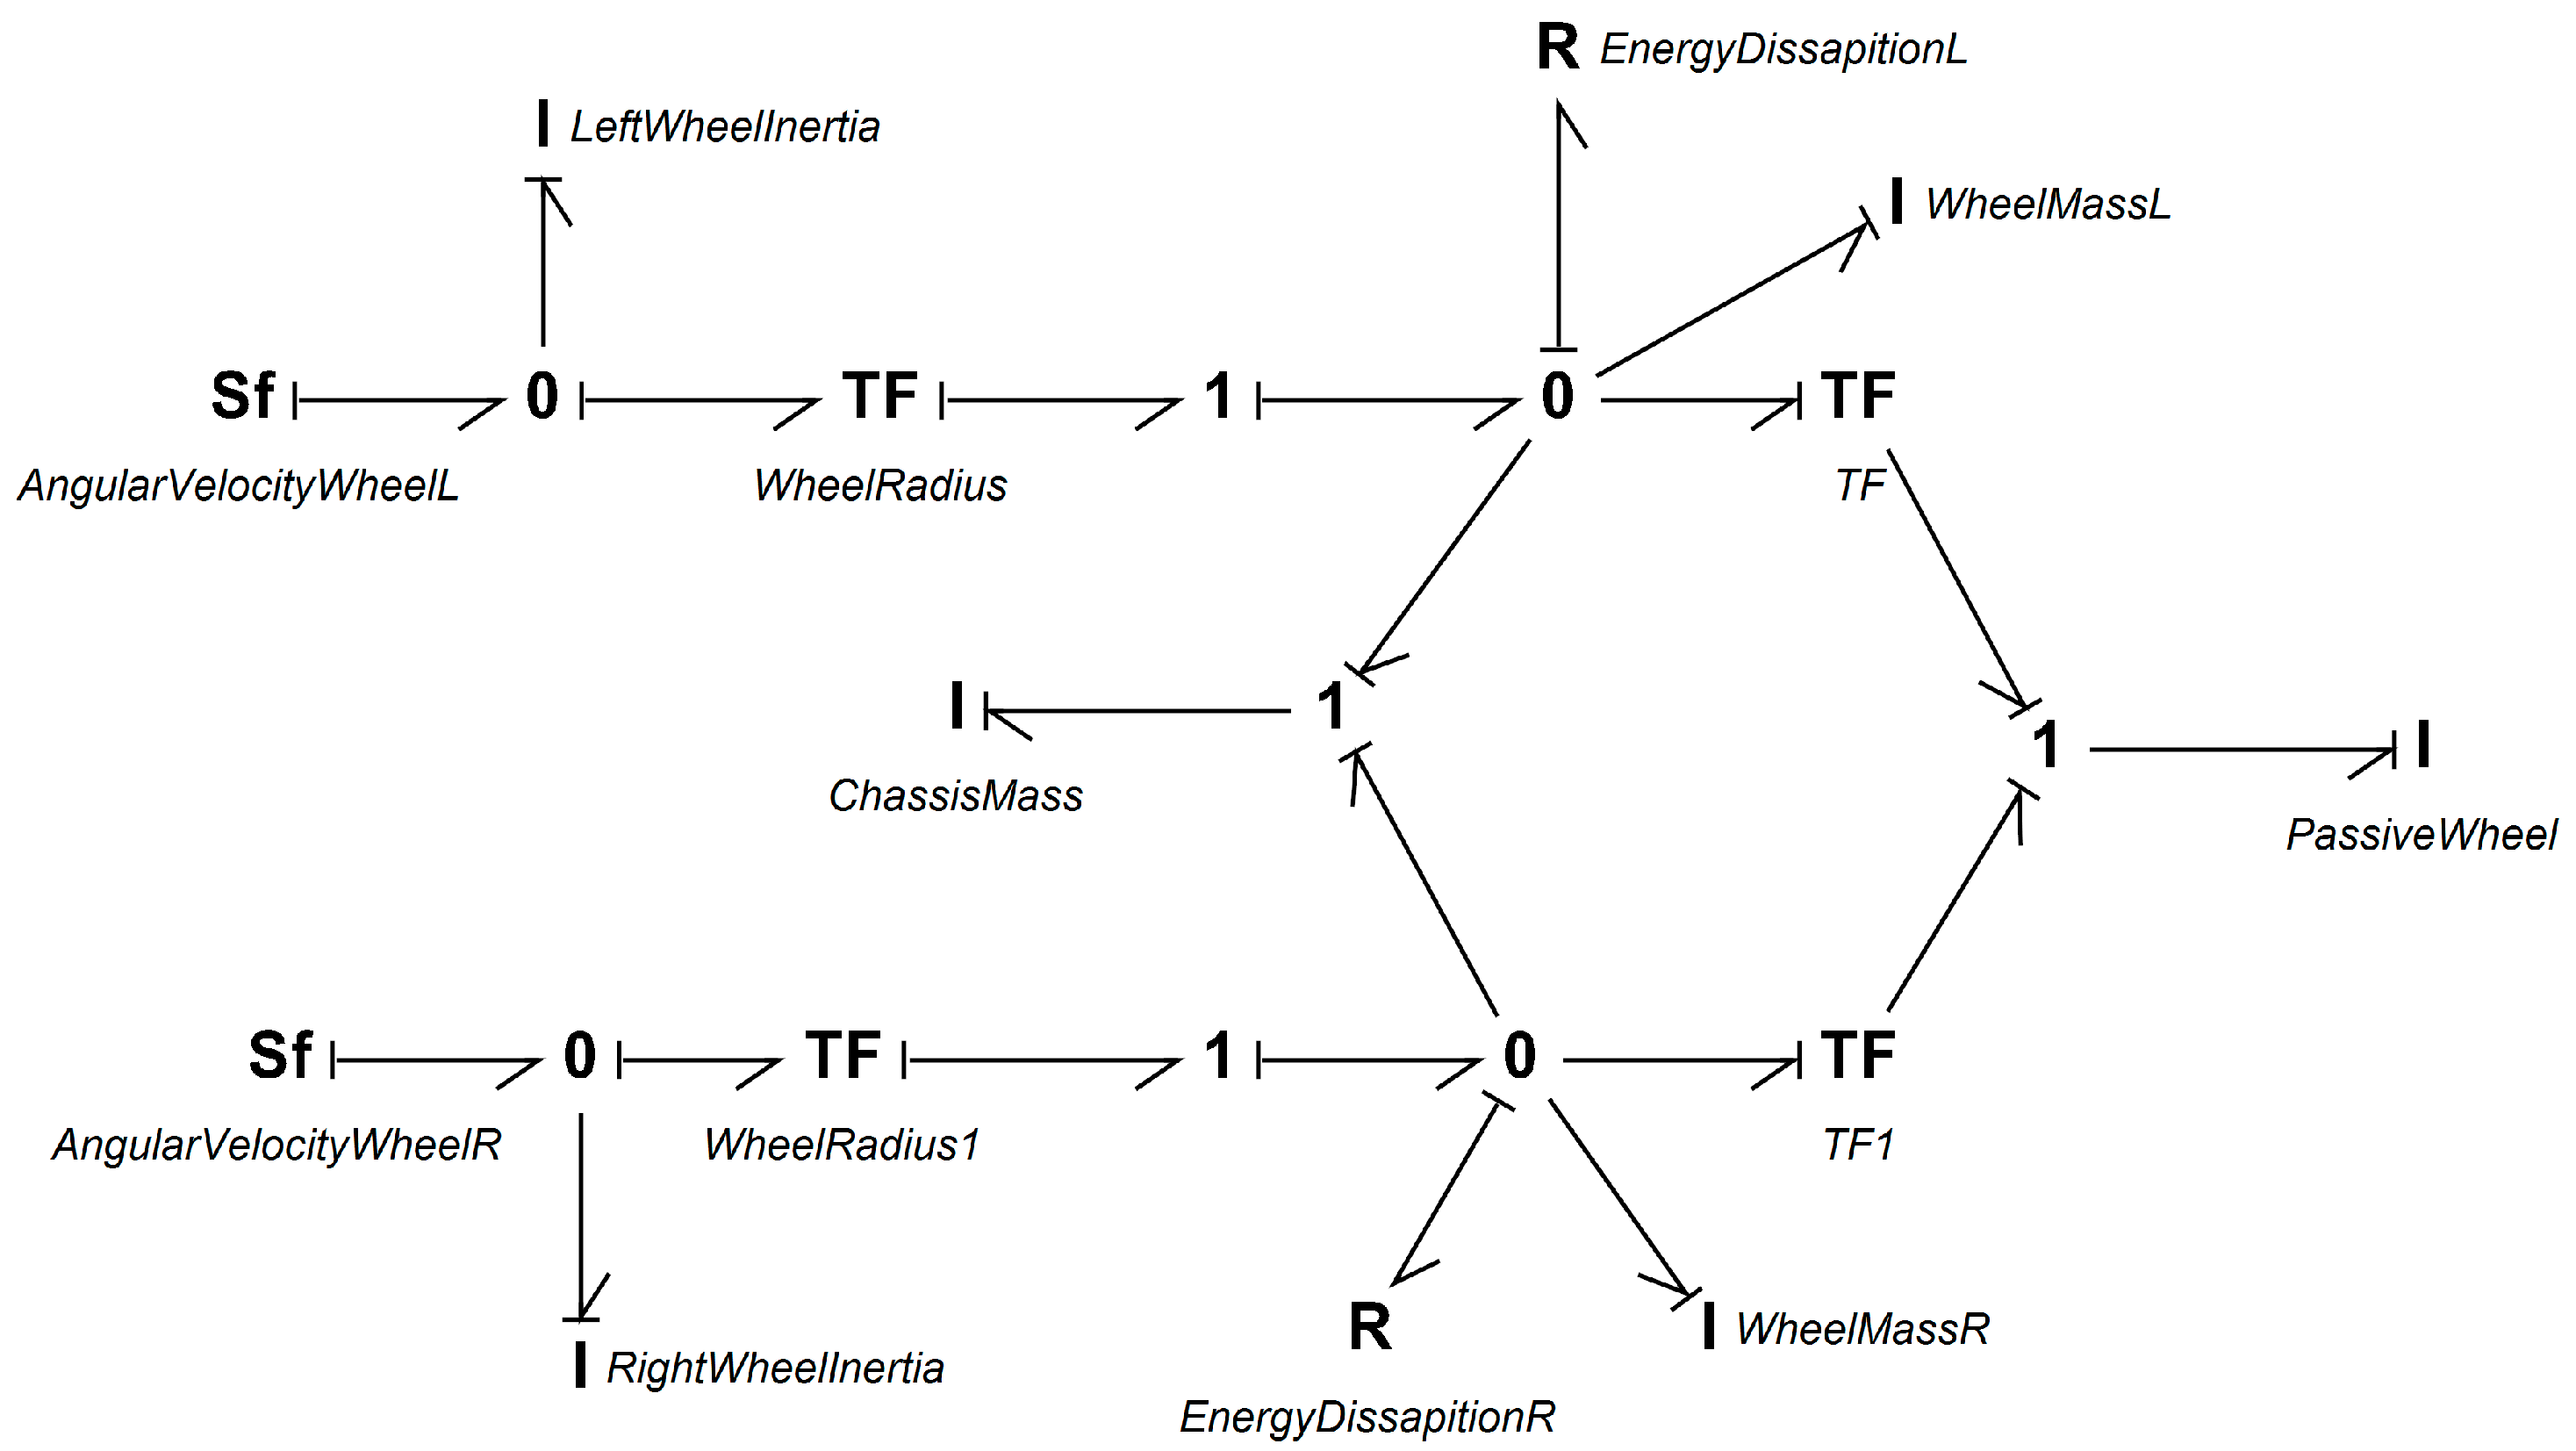
As shown in Figure 7, the BG of the mobile robot chassis represents the dynamic model of a two-wheeled differential-drive robot, capturing the energy interactions between its rotational and translational components. The model includes angular velocity sources (Sf) for the left and right wheels, connected through 0-junctions to represent torque equilibrium and linked to inertial elements modeling wheel rotational inertia. Transformers (TF) convert angular motion into linear motion based on wheel radius, transferring energy to 1-junctions that represent shared linear velocity. These are connected to inertias representing the chassis and wheel masses, along with resistive elements modeling energy dissipation (e.g., friction). The chassis connects both wheels via a central 0-junction, with an additional TF and inertia for a passive wheel, completing the robot’s structure. The model effectively describes how motor inputs translate into chassis motion while accounting for inertia and energy loss, making it suitable for simulation and control design.

4. Simulation and Validation

To validate the developed bond graph model of the 3-phase BLDC motor, a comprehensive simulation was carried out using 20-sim software with the Backward Differentiation Formula (BDF) solver because it is well-suited for stiff dynamic systems that include coupled electrical and mechanical subsystems. Tight error tolerances (absolute: 1 × 10⁻⁸, relative: 1 × 10⁻⁶) and a maximum integration step size of 1 × 10⁻⁵ s were selected to accurately capture the fast-switching transients and coupled electromechanical dynamics. The presence of fast-switching inverter signals, high electrical stiffness, and slower mechanical responses makes the BDF algorithm particularly suitable, ensuring both numerical stability and energy consistency throughout the simulation. The utilized motor is D6374 150KV (ODrive Robotics, El Sobrante, CA, USA) with the specification in Table 2. The responses of the motor in terms of input voltage efforts, phase currents, back electromotive forces (EMFs), angular velocity, and generated torque were analyzed and are presented in this section.
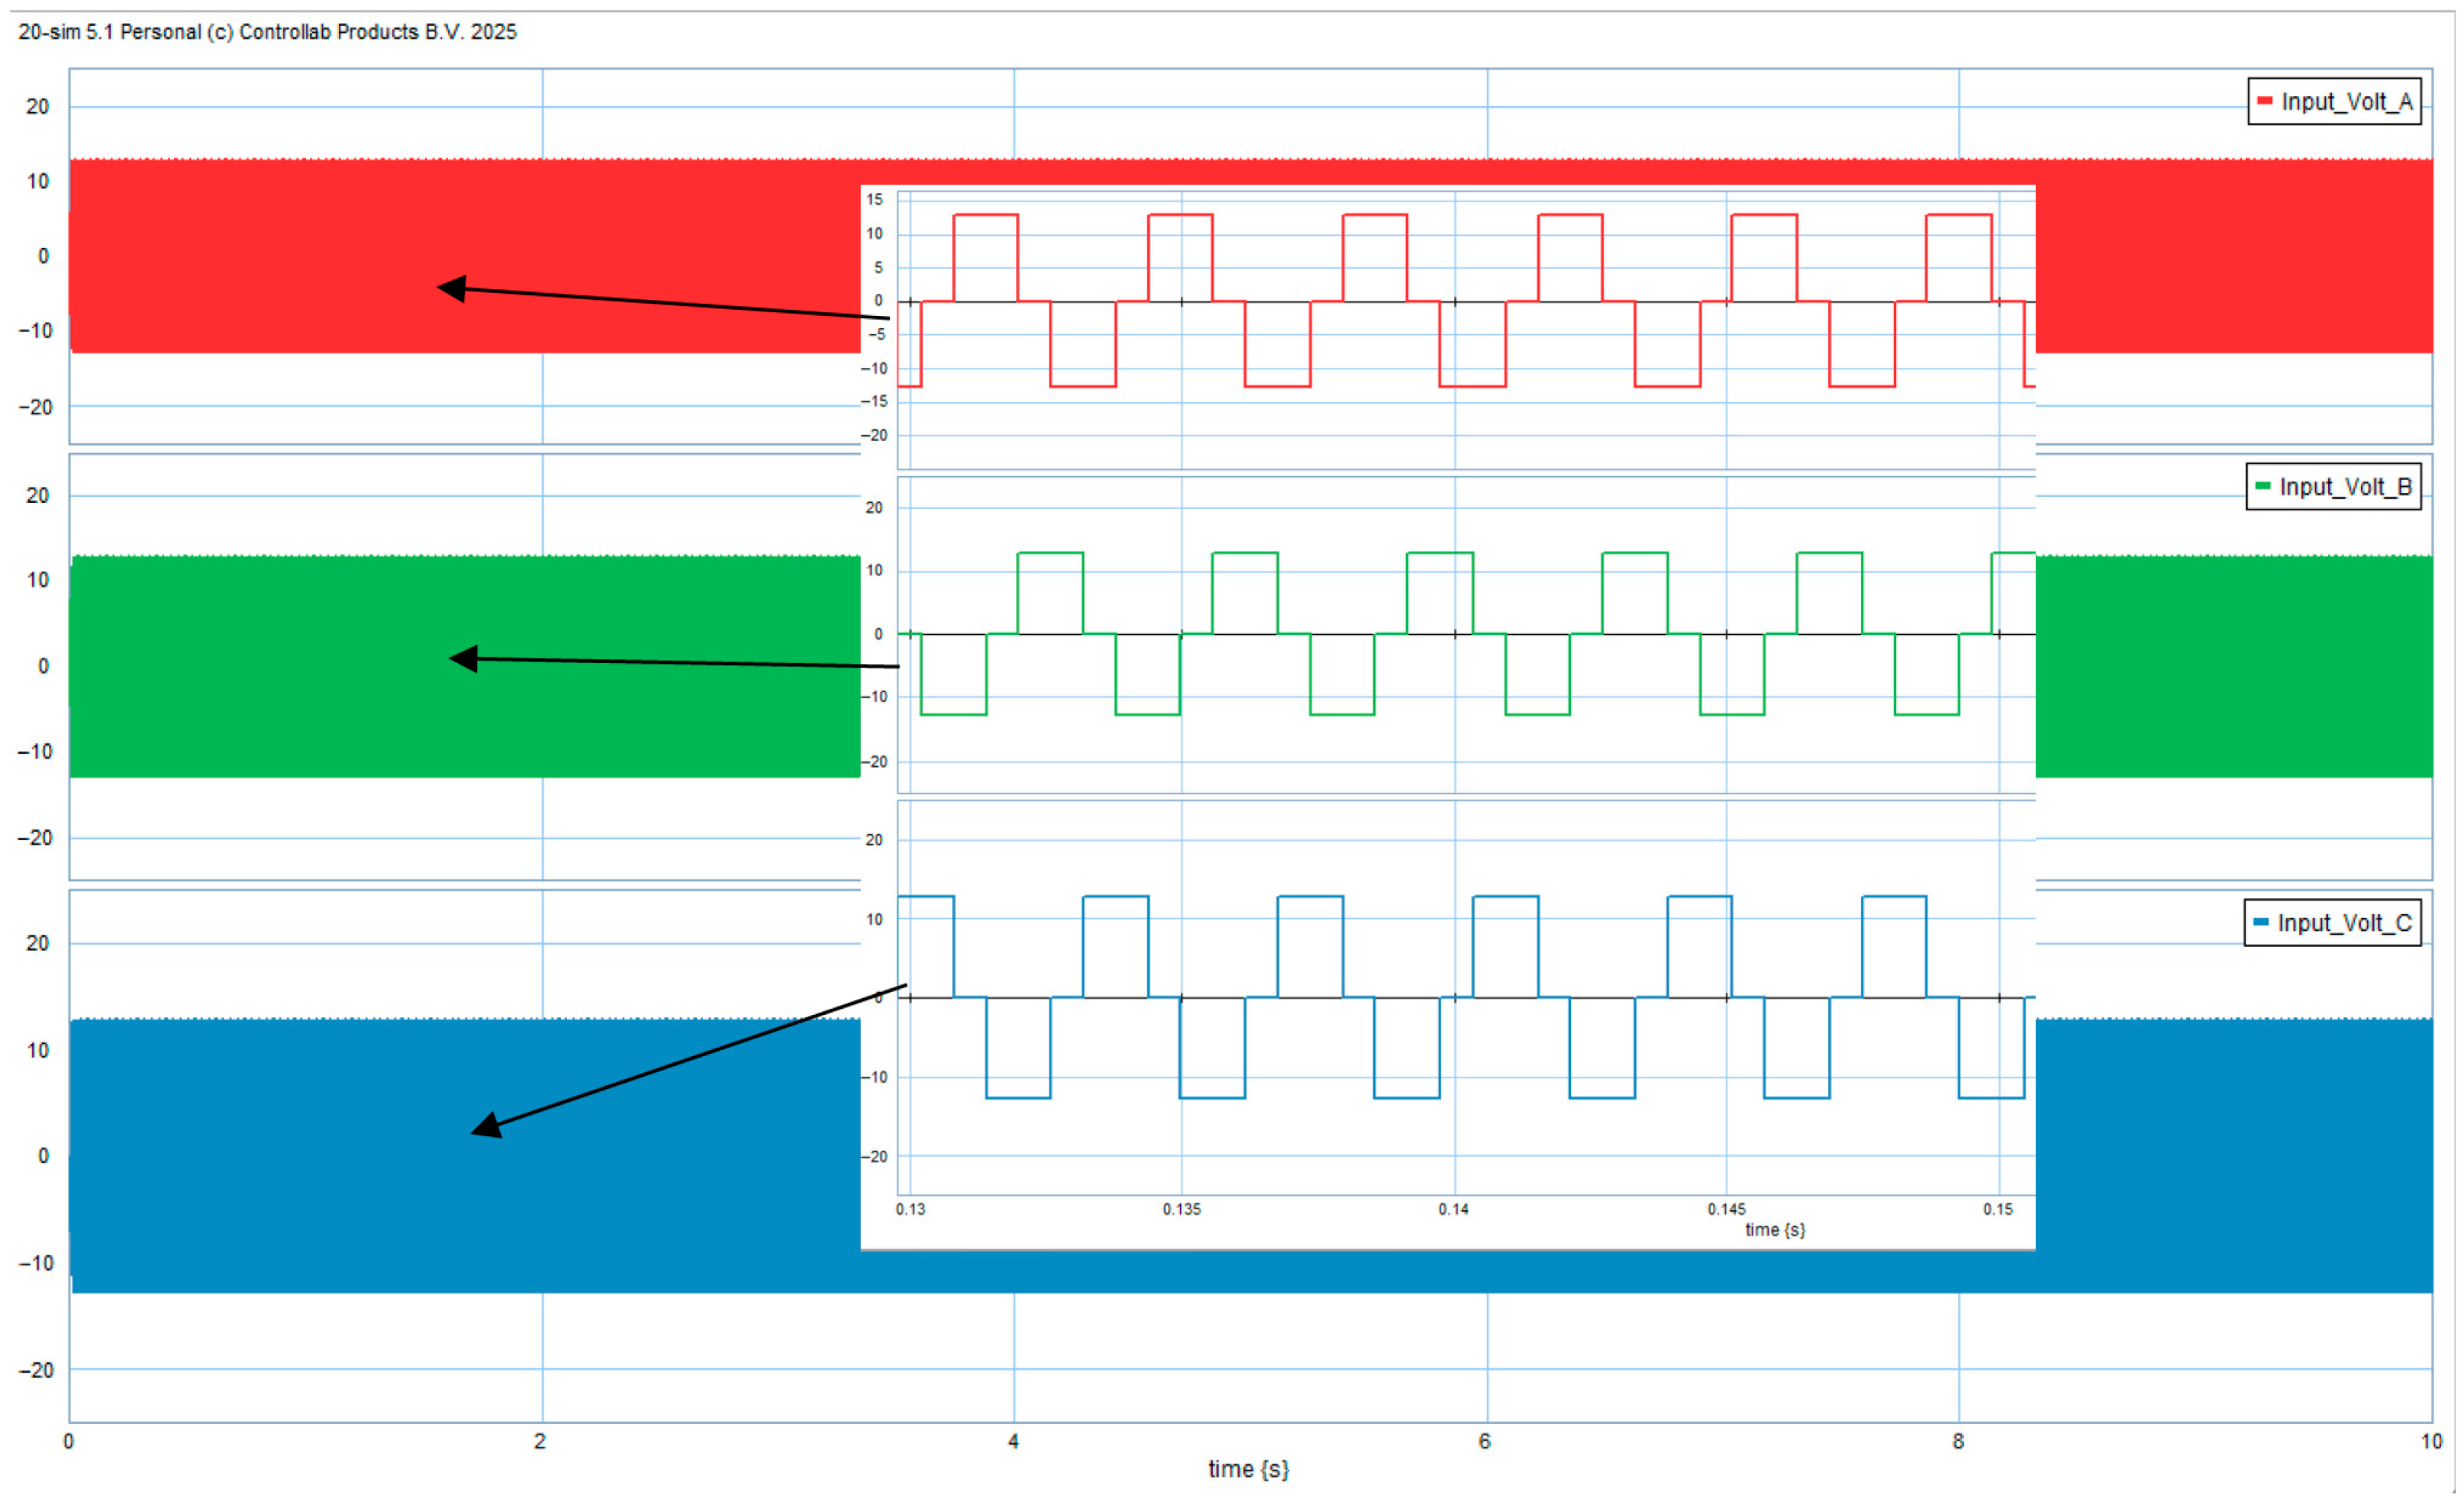
Figure 8 illustrates the six-step commutation pattern applied to the BLDC motor stator windings. Each phase voltage alternates between + V d c / 2 and V d c / 2 with a 120° phase shift between phases A, B, and C. The inset zooms into the switching sequence, clearly showing the step transitions and the typical six-step trapezoidal waveform shape used for BLDC excitation.
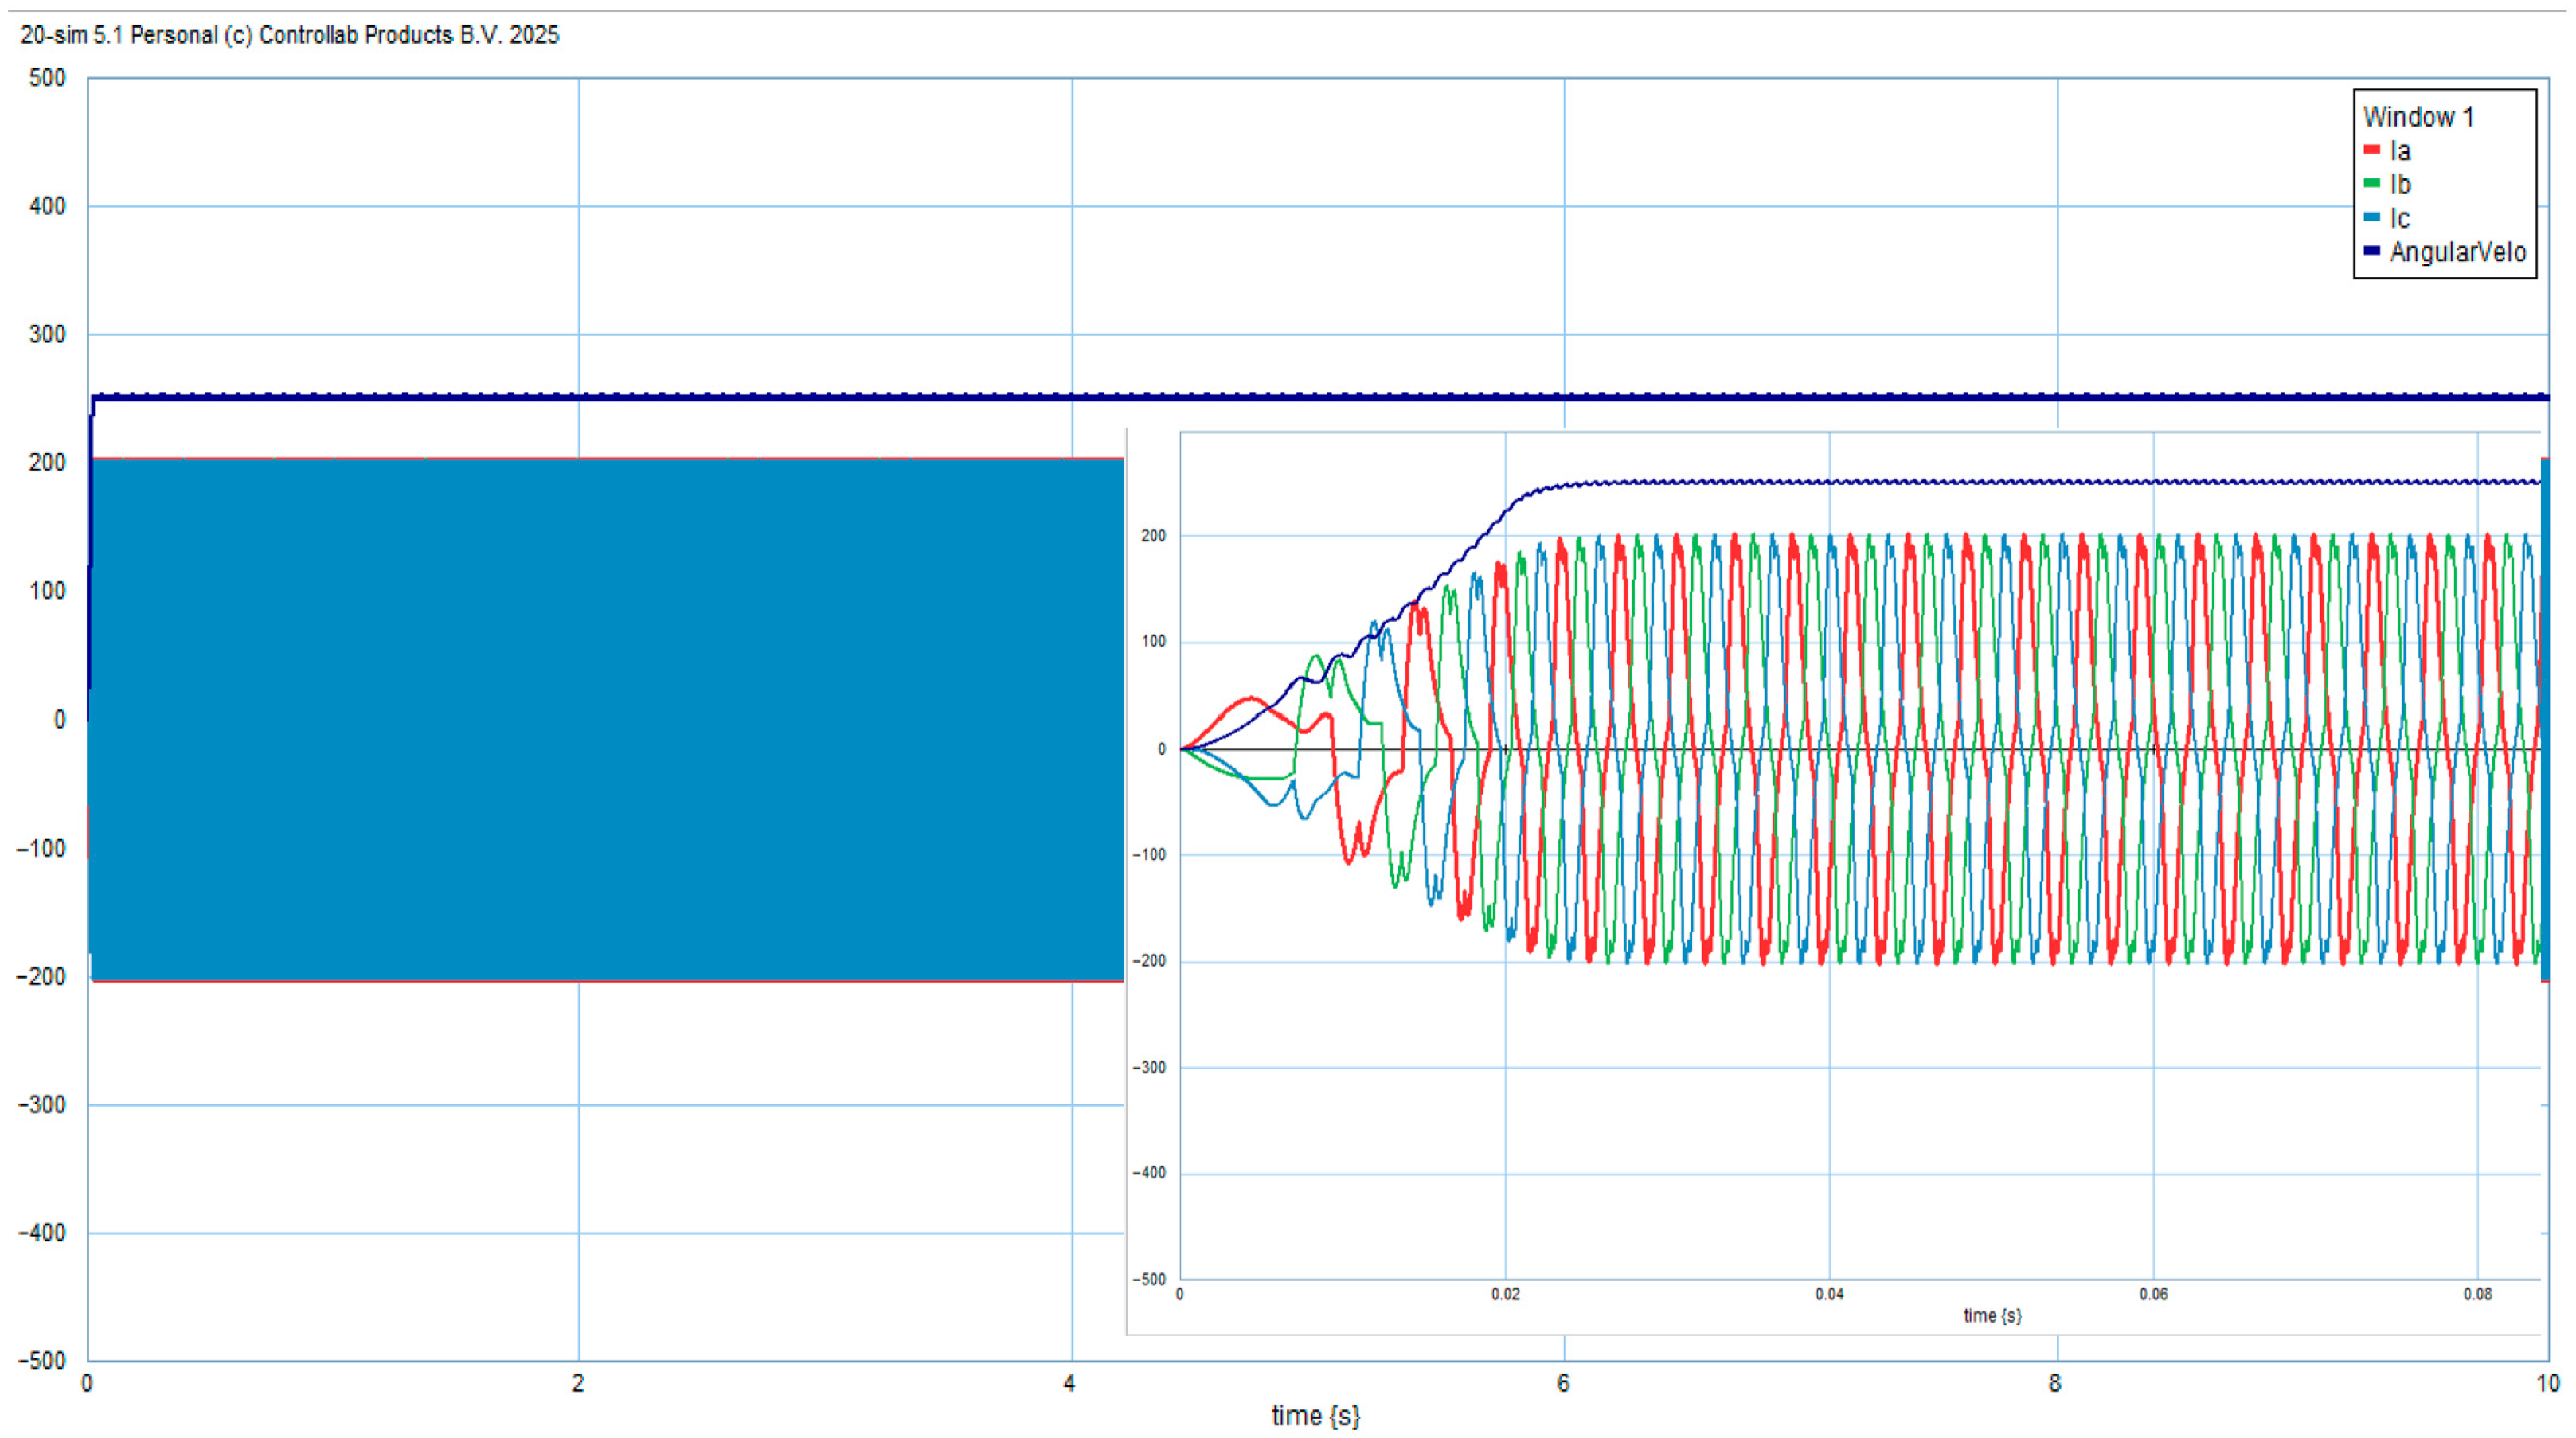
Figure 9 shows the transient and steady-state responses of the BLDC motor under six-step inverter excitation. At startup, the stator currents exhibit oscillatory behavior as the electromagnetic torque builds up, leading to a rapid acceleration of the rotor. The speed gradually increases and stabilizes as the system reaches steady-state operation. Once stabilized, the three-phase currents become balanced and exhibit a 120° phase shift, confirming proper commutation and electromechanical coupling between the electrical and mechanical domains.
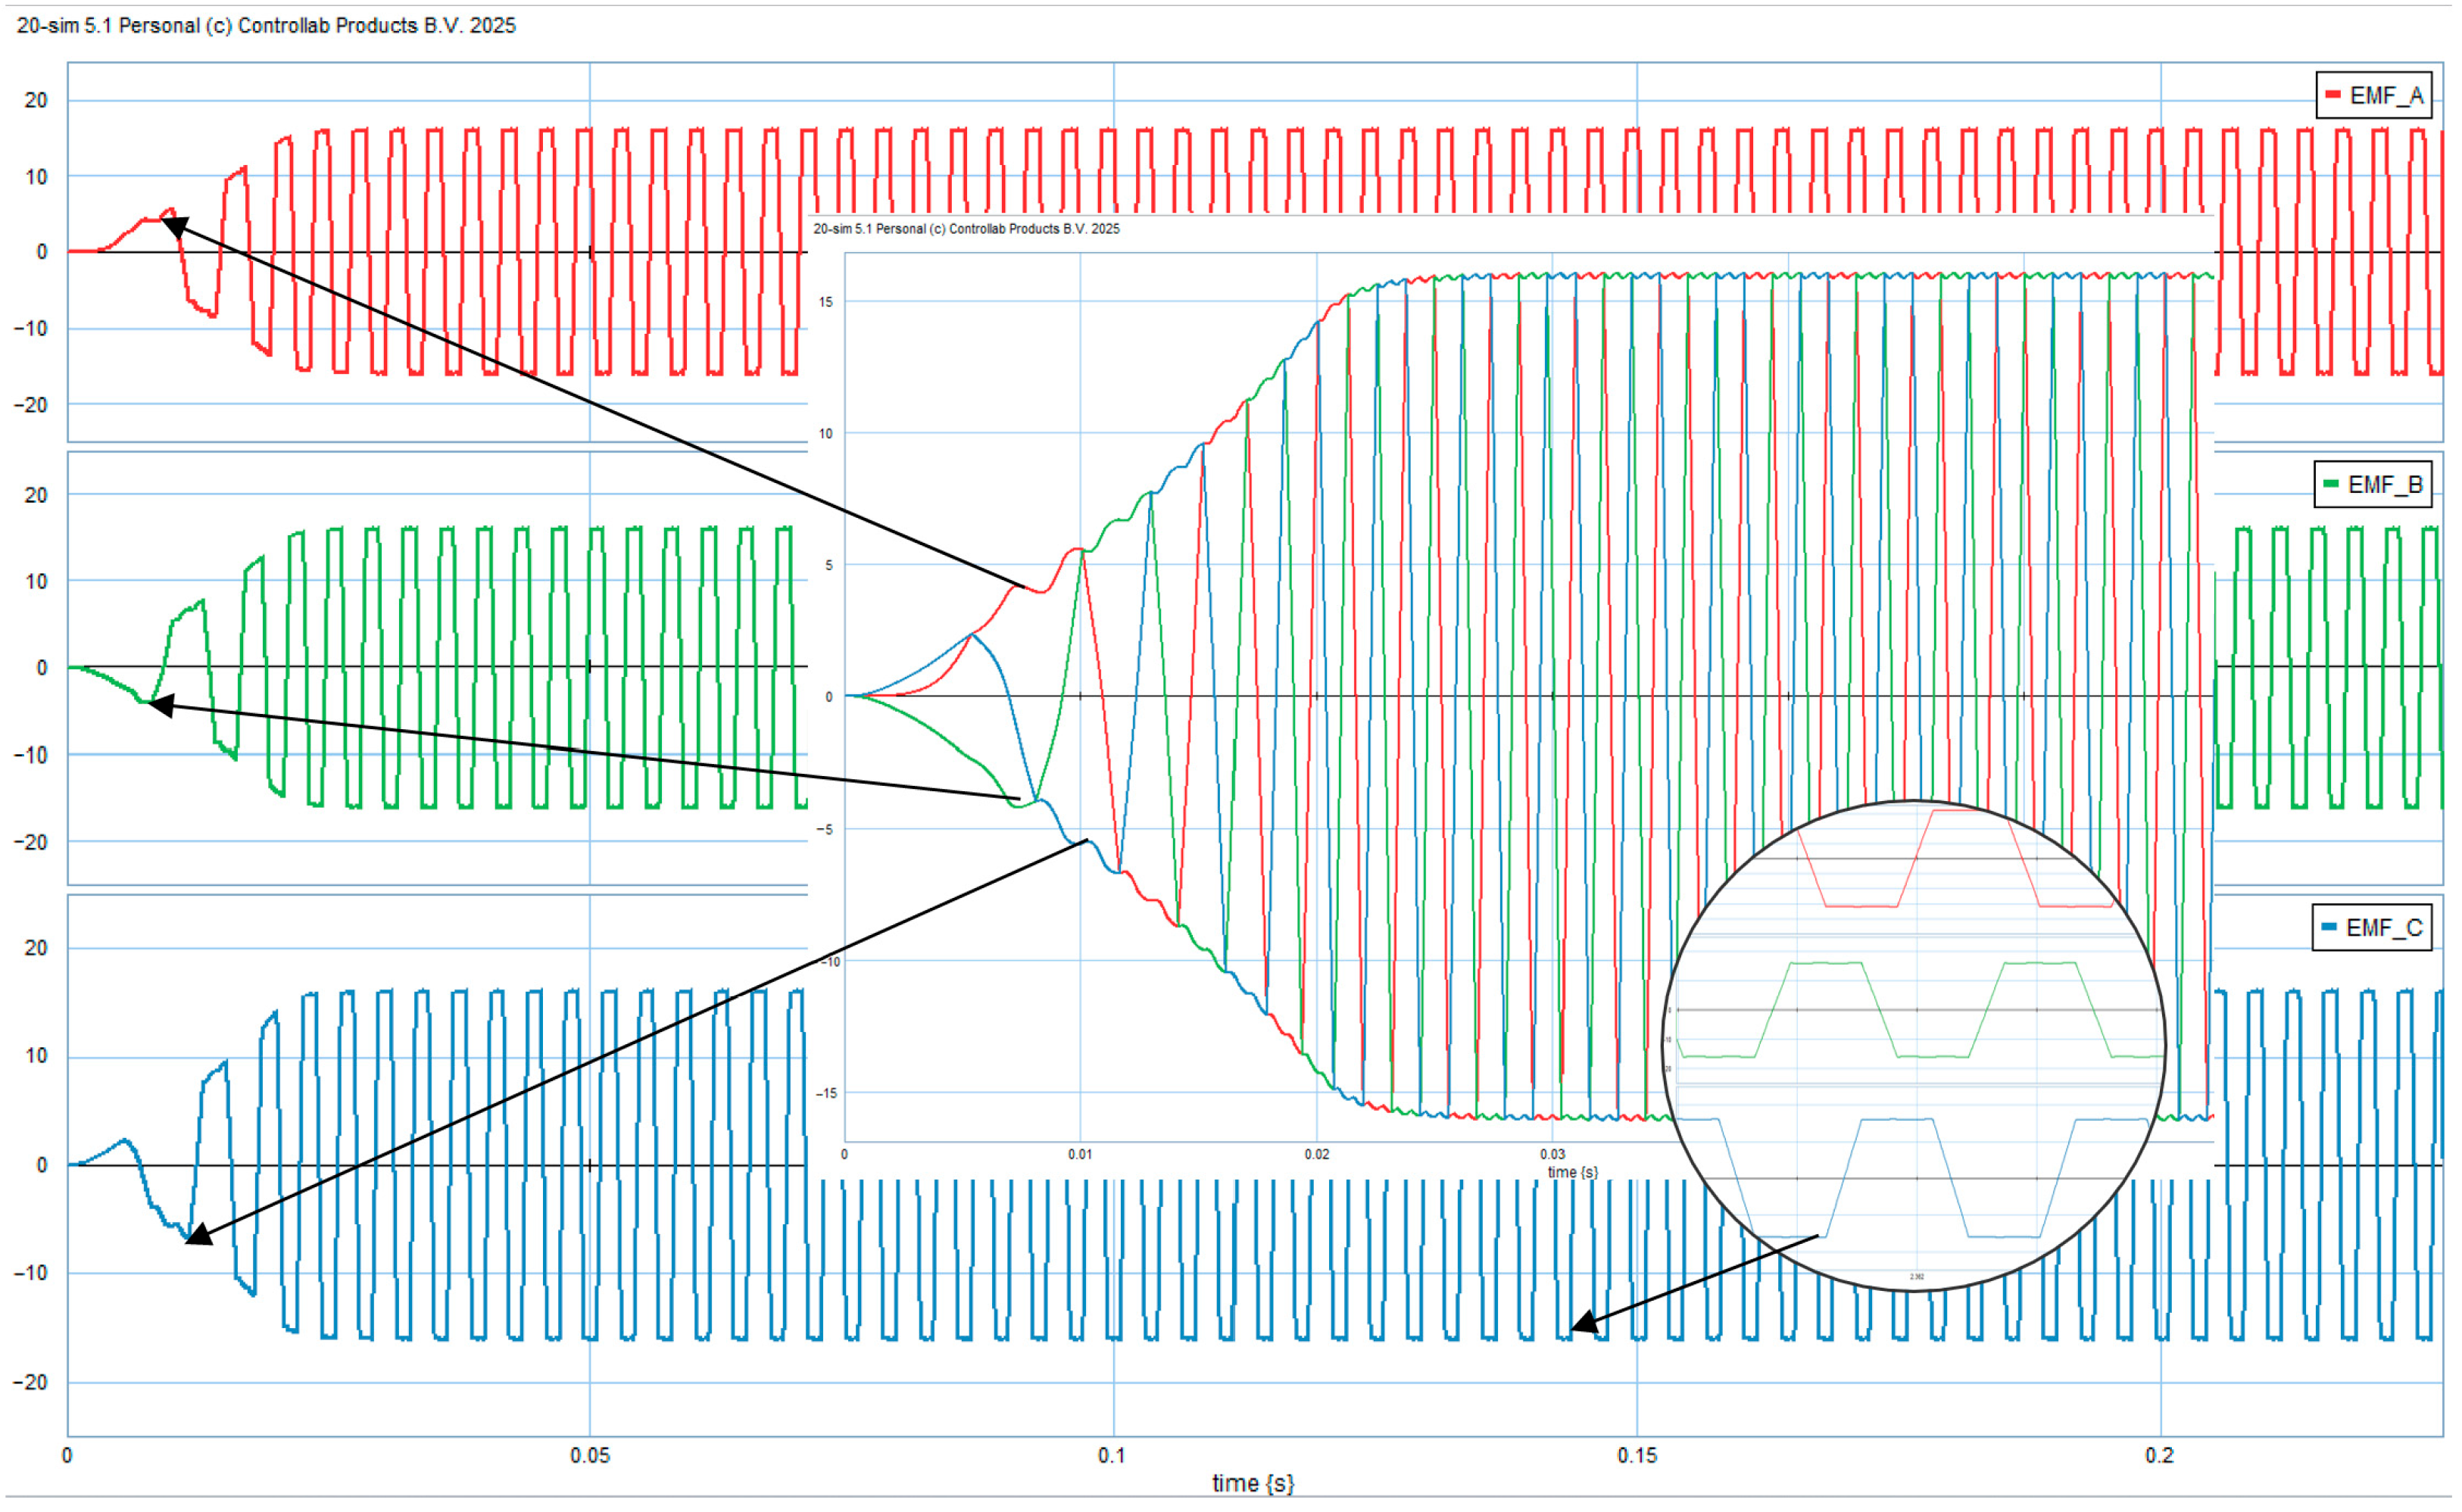
Figure 10 shows the simulated phase back-EMF waveforms ( e A , e B , e C ) of the three-phase BLDC motor derived from the bond graph model. During the startup interval, the back-EMFs gradually increase in amplitude as the rotor accelerates, indicating the growing counter-electromotive force opposing the supply voltage. At steady state, the back-EMFs attain a nearly trapezoidal shape with a 120° phase displacement, consistent with the expected BLDC commutation pattern.
The magnified view highlights the commutation intervals, where the overlap between the conducting phases produces smooth torque transfer. This verifies the correct generation of trapezoidal back-EMF waveforms modulated by the MGY elements according to the rotor electrical angle.
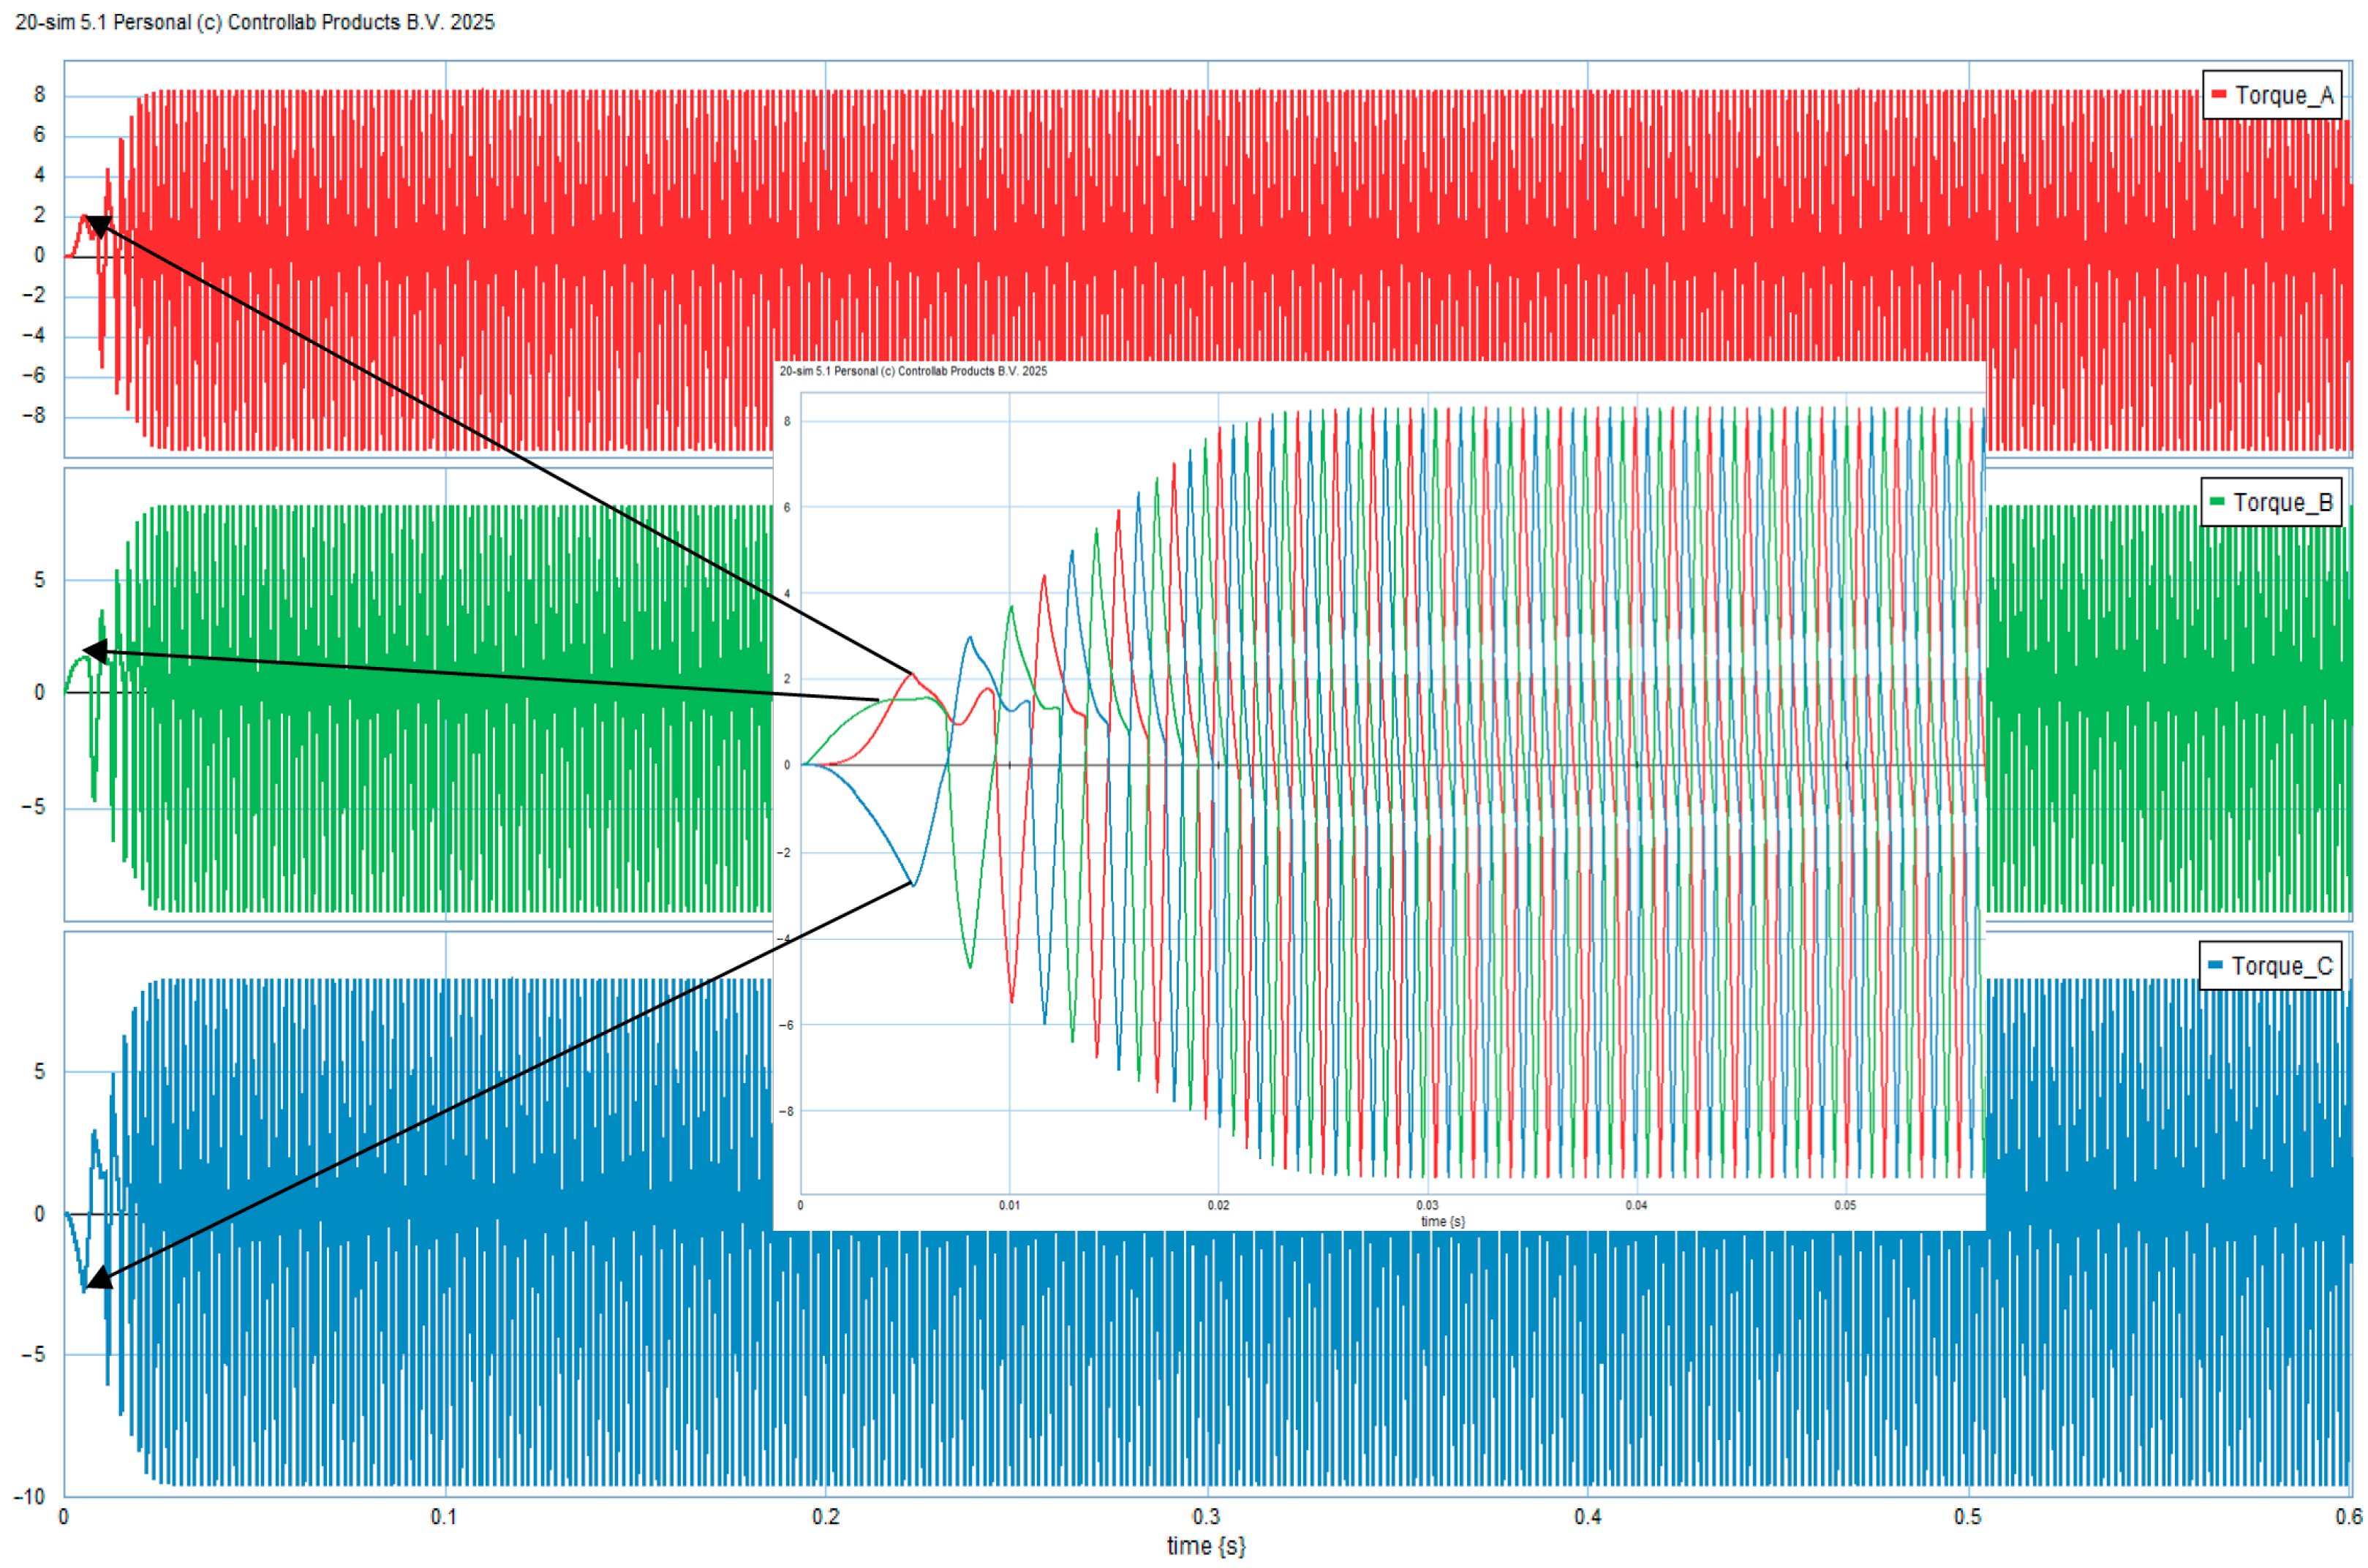
Figure 11 presents the electromagnetic torque generated by each phase ( T A , T B , T C ) of the BLDC motor under no-load conditions. During startup, transient oscillations appear due to switching and current buildup. As the rotor speed stabilizes, the phase torques exhibit periodic trapezoidal patterns shifted by 120°, similar to the back-EMFs.
The inset highlights the torque overlap among phases, illustrating the continuous torque production achieved through proper commutation. The results confirm the dynamic consistency between electrical back-EMF and mechanical torque responses, demonstrating accurate electromechanical coupling within the bond graph framework.
The rapid acceleration observed corresponds to a no-load condition, where the applied voltage is fully converted to electromagnetic torque with negligible opposing load or damping. Under realistic operating conditions that include robot mass and frictional resistance, the acceleration time would increase accordingly, as verified in the extended robot model.

Model Validation Using Datasheet Benchmark

To validate the model accuracy, the simulated no-load speed was compared with the theoretical speed derived from the motor datasheet. For the D6374 150 KV BLDC motor and V d c = 25.6 V, the expected no-load speed is:
ω t h e o r e t i c a l = K v × V d c = 150 × 25.6 = 3840 rpm ( 402 rad / s )
Under six-step commutation, the effective phase voltage is approximately V d c / 2 , giving:
ω e x p e c t e d = V d c / 2 K e = 12.8 0.0636 201 rad / s
The simulation converges to about 200 rad/s, which closely matches this theoretical prediction. Therefore, the bond-graph model correctly reproduces the expected no-load performance of the BLDC motor.
Collectively, these simulation results validate the fidelity of the bond graph model in replicating the physical behavior of a three-phase BLDC motor operating under six-step commutation. The consistent synchronization among phase currents, back-EMFs, electromagnetic torque, and rotor speed confirms the model’s accurate representation of electromechanical coupling. This establishes the developed model as a reliable platform for further analysis, controller design, and performance optimization of BLDC-based robotic systems.

5. Discussion

Several studies have employed the BG approach for the modeling and control of mobile robots, offering insights into various aspects of mechatronic system behavior. The present study, which focuses on the dynamic modeling and simulation of a differential-drive serving robot powered by a three-phase BLDC motor, distinguishes itself through its detailed treatment of motor dynamics, electromechanical coupling, and six-step commutation control. The bond graph method provides a unified representation of electrical and mechanical subsystems, allowing for the evaluation of torque, EMF, phase currents, and rotor speed under various operating conditions.
In comparison, Sahoo and Chiddarwar [23] emphasize high-level trajectory planning and tracking using differential flatness, rather than low-level motor behavior. While both works use bond graphs, their focus differs significantly: the former is control-oriented with emphasis on system-level trajectories, whereas the current study is motor-centric with a focus on electrical excitation and torque response.
Similarly, Joshi et al. [24] target path-tracking performance through feedback control laws and dynamic modeling. Although it also considers a two-wheeled mobile base, it lacks the detailed simulation of electromechanical interactions presented in this study, such as back-EMF waveform analysis or torque ripple under square-wave excitation.
Kumar et al. [25] shift the focus toward energy efficiency by estimating power consumption across different drive configurations. Unlike our work, which simulates a single configuration under fixed voltage input, this paper explores system behavior under changing driving strategies and operating conditions.
In contrast, Refs. [26,27] deal with robots that have inherently different kinematics and dynamic complexity. These works analyze multi-directional motion and load distribution across more complex wheel systems, while our model maintains the simpler but common differential-drive layout, which is better suited for indoor service applications.
Qian and Rahmani introduce another level of complexity by integrating robotic arms onto a mobile platform in [28]. While it shares the same modeling foundation, its primary concern is the coordination and dynamics of multiple rigid bodies, whereas our work keeps the focus tightly on the motor-vehicle dynamics.
Lastly, Daigle et al. in [29] diverge from the modeling focus and address fault detection and diagnostic communication across cooperative robot networks. Though relevant to mobile robotics, it does not involve physical modeling or simulation of electromechanical interactions, making it complementary but distinct from the goals of our study.
Overall, the reviewed literature illustrates the versatility of bond graphs across various robot types and applications. The contribution of this work lies in bridging the gap between detailed motor-level simulation and system-level modeling for a service-oriented robot, providing a foundation for future energy analysis, control optimization, and hardware implementation.

6. Conclusions and Prospects

This study successfully developed and validated a bond graph-based dynamic model of a differential-drive serving robot driven by a three-phase BLDC motor. By integrating electrical and mechanical subsystems into a unified representation, the model captures essential system behaviors including torque generation, EMF response, current dynamics, and rotor velocity. Simulation results under square-wave voltage excitation confirmed the model’s ability to reproduce transient and steady-state characteristics typical of six-step commutation control. The observed torque ripples, back-EMF patterns, and stabilization of angular velocity demonstrate the fidelity of the model in capturing electromechanical interactions. This modeling approach provides a reliable platform for further control algorithm development, energy optimization, and advanced simulation studies, reinforcing the value of bond graph methodology in service robotics. Although the model was not experimentally tested, the simulation results were benchmarked against datasheet-based analytical predictions, confirming the model’s accuracy and physical consistency.
This study serves as a foundational step for future research that will extend the bond graph framework toward fault diagnosis and health monitoring of the robot’s key components, particularly the motors and battery system. While the current work focuses on modeling and simulation, direct experimental validation of the developed model has not yet been conducted. This will be an important part of future efforts to confirm the model’s accuracy under real operating conditions. Building on the validated dynamic model, upcoming work will focus on developing diagnostic bond graphs to detect, isolate, and analyze faults in electromechanical subsystems. In parallel, we plan to design a control system that leverages this model to enhance robustness, ensure safe operation, and optimize energy efficiency in service-oriented robots. Together, these future developments aim to advance the reliability and autonomy of service-oriented robotic platforms.

Author Contributions

Conceptualization, methodology, software, writing—original draft preparation, data curation, and visualization, M.A.T.; validation, investigation, writing—review and editing, and resources, M.A.T. and G.H.; supervision, project administration, and funding acquisition, G.H. All authors have read and agreed to the published version of the manuscript.

Funding

This research received no external funding.

Data Availability Statement

The original contributions presented in this study are included in the article. Further inquiries can be directed to the corresponding authors.

Conflicts of Interest

The authors declare no conflicts of interest.

References

  1. IFR International Federation of Robotics. Available online: https://ifr.org/wr-service-robots (accessed on 2 June 2025).
  2. Li, L.; Li, Y.; Song, B.; Shi, Z.; Wang, C. How Human-like Behavior of Service Robot Affects Social Distance: A Mediation Model and Cross-Cultural Comparison. Behav. Sci. 2022, 12, 205. [Google Scholar] [CrossRef] [PubMed]
  3. Lee, I. Service Robots: A Systematic Literature Review. Electronics 2021, 10, 2658. [Google Scholar] [CrossRef]
  4. Garcia-Haro, J.M.; Oña, E.D.; Hernandez-Vicen, J.; Martinez, S.; Balaguer, C. Service Robots in Catering Applications: A Review and Future Challenges. Electronics 2021, 10, 47. [Google Scholar] [CrossRef]
  5. Samantaray, A.K.; Dasgupta, S.S.; Bhattacharyya, R. Bond Graph Modeling of an Internally Damped Nonideal Flexible Spinning Shaft. J. Dyn. Syst. Meas. Control 2010, 132, 061502. [Google Scholar] [CrossRef]
  6. Karnopp, D.C.; Margolis, D.L.; Rosenberg, R.C. System Dynamics: Modeling, Simulation, and Control of Mechatronic Systems; John Wiley & Sons: Hoboken, NJ, USA, 2012; ISBN 978-0-470-88908-4. [Google Scholar]
  7. Li, Y.; Ma, Y.; Huo, X.; Wu, X. Remote Object Navigation for Service Robots Using Hierarchical Knowledge Graph in Human-Centered Environments. Intel. Serv. Robot. 2022, 15, 459–473. [Google Scholar] [CrossRef]
  8. Kim, H.; So, K.K.F.; Wirtz, J. Service Robots: Applying Social Exchange Theory to Better Understand Human–Robot Interactions. Tour. Manag. 2022, 92, 104537. [Google Scholar] [CrossRef]
  9. Gao, J.; Wang, H.; Li, W.; Li, G.; He, S. Research on the Effect of the Empathy Ability of AI Service Robots on Consumer Well-Being: The Chain Mediating Model. Int. J. Hum. Comput. Interact. 2025, 41, 6716–6728. [Google Scholar] [CrossRef]
  10. Satya Durga Manohar Sahu, V.; Samal, P.; Kumar Panigrahi, C. Modelling, and Control Techniques of Robotic Manipulators: A Review. Mater. Today Proc. 2022, 56, 2758–2766. [Google Scholar] [CrossRef]
  11. Mughal, A.M. Introduction to Bond Graph Modeling. In Real Time Modeling, Simulation and Control of Dynamical Systems; Mughal, A.M., Ed.; Springer International Publishing: Cham, Switzerland, 2016; pp. 35–45. ISBN 978-3-319-33906-1. [Google Scholar]
  12. Broenink, J. Introduction to Physical Systems Modelling with Bond Graphs. SiE Whitebook Simul. Methodol. 1999, 31, 1–31. [Google Scholar]
  13. Wang, X.; Wu, H.; Yang, J.; Deng, X.; Piao, Z.; Yao, X. Modeling and Prediction Method for Inherent Energy Consumption of CNC Machine Tool Spindle Systems. J. Mech. Sci. Technol. 2025, 39, 4129–4145. [Google Scholar] [CrossRef]
  14. Massarotti, G.P.; Filippini, G.; Alviach, G.R.; Gamez-Montero, P.J.; Macia, E.C. A New Dual Steering System in a Compact Tractor. Actuators 2025, 14, 35. [Google Scholar] [CrossRef]
  15. Borutzky, W. Bond Graph Modelling for Control, Fault Diagnosis and Failure Prognosis; Springer International Publishing: Cham, Switzerland, 2021; ISBN 978-3-030-60966-5. [Google Scholar]
  16. Guo, Z.; Korondi, P.; Szemes, P.T. Bond-Graph-Based Approach to Teach PID and Sliding Mode Control in Mechatronics. Machines 2023, 11, 959. [Google Scholar] [CrossRef]
  17. Zaidi, A.; Barambones, O.; Zanzouri, N. Implementation of a Cascade Fault Tolerant Control and Fault Diagnosis Design for a Modular Power Supply. Actuators 2023, 12, 135. [Google Scholar] [CrossRef]
  18. Dash, B.M.; Bouamama, B.O.; Boukerdja, M.; Pekpe, K.M. Bond Graph-CNN Based Hybrid Fault Diagnosis with Minimum Labeled Data. Eng. Appl. Artif. Intell. 2024, 131, 107734. [Google Scholar] [CrossRef]
  19. Kypuros, J. System Dynamics and Control with Bond Graph Modeling; CRC Press: Boca Raton, FL, USA, 2013; ISBN 978-0-429-10006-2. [Google Scholar]
  20. Ibănescu, R. Bond Graphs in System Modelling. In Graph-Based Modelling in Engineering; Zawiślak, S., Rysiński, J., Eds.; Springer International Publishing: Cham, Switzerland, 2017; pp. 3–23. ISBN 978-3-319-39020-8. [Google Scholar]
  21. Felszolgáló Robotok. Available online: https://enjoyrobotics.com/ (accessed on 2 June 2025).
  22. Chu, Y.; AEsoy, V.; Zhang, H.; Bunes, O. Modelling and Simulation of an Offshore Hydraulic Crane. In Proceedings of the 28th European Conference on Modelling and Simulation, Brescia, Italy, 27–30 May 2014; Squazzoni, F., Baronio, F., Archetti, C., Castellani, M., Eds.; pp. 87–93. [Google Scholar]
  23. Sahoo, S.R.; Chiddarwar, S.S. Mobile Robot Control Using Bond Graph and Flatness Based Approach. Procedia Comput. Sci. 2018, 133, 213–221. [Google Scholar] [CrossRef]
  24. Joshi, J.; Kumar, P.; Manral, A.R.; Makkar, M. Bond Graph Model-Based Control of a Wheeled Mobile Robot. In Proceedings of the 2023 5th International Conference on Power, Control & Embedded Systems (ICPCES), Allahabad, India, 6–8 January 2023; pp. 1–6. [Google Scholar]
  25. Kumar, P.; Bensekrane, I.; Singh, M.; Merzouki, R. Bond Graph Based Power Consumption Estimation of a Non-Holonomic Wheeled Mobile Robot with Multiple Driving Modes. In Proceedings of the 2018 7th International Conference on Systems and Control (ICSC), Valencia, Spain, 24–26 October 2018; pp. 441–446. [Google Scholar]
  26. Kumar, P.; Othman, L.; Merzouki, R. Bond Graph Modeling of a Holonomic Mobile Platform with Four Mecanum Wheels. In Proceedings of the 13th International Conference on Bond Graph Modeling (ICBGM 2018); Society for Modeling & Simulation International (SCS), Bordeaux, France, 16 July 2018; Volume 50. [Google Scholar]
  27. Sahoo, S.R.; Chiddarwar, S.S.; Alakshendra, V. Dynamic Modelling and Simulation of a Three-Wheeled Omnidirectional Mobile Robot: Bond Graph Approach. In Proceedings of the 2017 3rd International Conference on Advances in Robotics, New York, NY, USA, 28 June 2017; Association for Computing Machinery: New York, NY, USA; pp. 1–6. [Google Scholar]
  28. Qian, Y.; Rahmani, A. Bond Graph Modeling and Simulation of a Dual-Arm Mobile Manipulator. In Proceedings of the 1st International and 16th National Conference on Machines and Mechanisms, Roorkee, India, 18–20 December 2013; pp. 62–69. [Google Scholar]
  29. Daigle, M.; Koutsoukos, X.; Biswas, G. Distributed Diagnosis of Coupled Mobile Robots. In Proceedings of the 2006 IEEE International Conference on Robotics and Automation, Orlando, FL, USA, 15–19 May 2006; pp. 3787–3794. [Google Scholar]
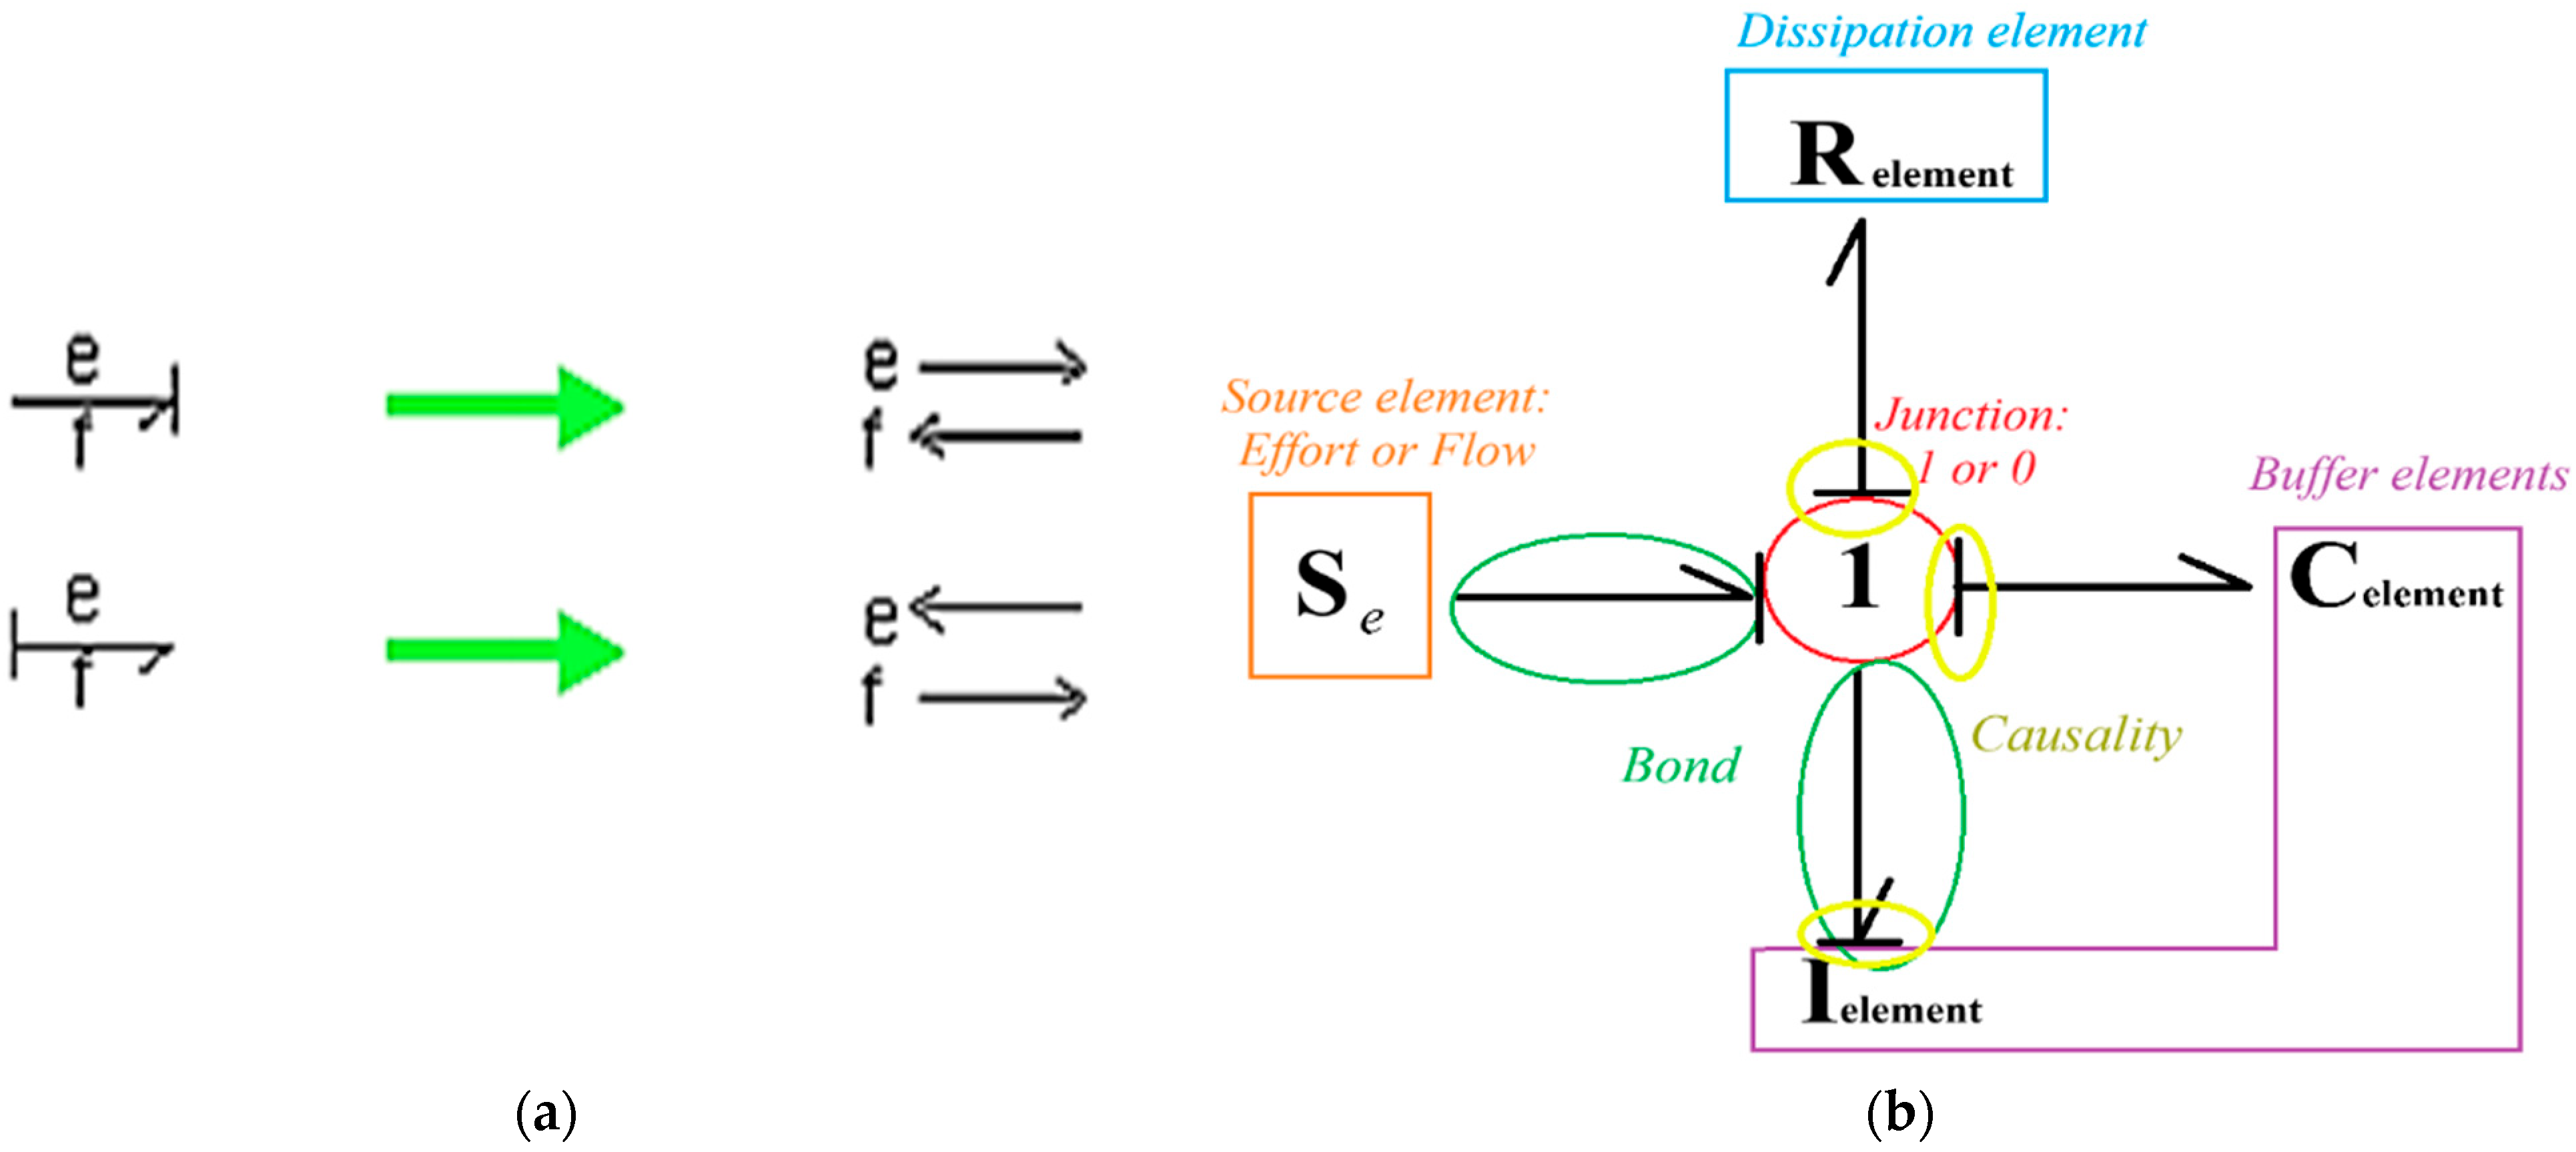
Figure 1. (a) The relation between causality and the flow/effort (20-sim bond graph tutorial) [14]. (b) Example of BG components with bond connections and causalities in 1-junction.
Actuators 14 00523 g001
Figure 2. Diana robot structure.
Actuators 14 00523 g002
Figure 3. Schematic of the mobile base of Diana robot.
Actuators 14 00523 g003
Figure 4. Three-phase brushless DC motor: (a) rotor and stator sketch; (b) electrical schematic.
Actuators 14 00523 g004
Figure 6. Sim implementation of the bond graph model for BLDC motor dynamics and commutation.
Actuators 14 00523 g006
Figure 7. Robot chassis bond graph.
Actuators 14 00523 g007
Figure 8. Phase voltage waveforms ( V A ,   V B ,   V C ) generated by the six-step inverter driving the BLDC motor.
Actuators 14 00523 g008
Figure 9. Simulated three-phase stator currents ( I a ,   I b ,   I c ) and rotor angular velocity ( ω ) of the BLDC motor during startup and steady-state operation.
Actuators 14 00523 g009
Figure 10. Phase back-EMF waveforms of the BLDC motor during startup and steady-state operation.
Actuators 14 00523 g010
Figure 11. Electromagnetic torque waveforms of the three BLDC motor phases.
Actuators 14 00523 g011
Table 1. Elements of Bond graph.
Element TypeBond-Graph ClassFunction
1-JunctionsPower-conserving junctionCommon flow
0-JunctionsCommon effort
R-element1-Port ElementsDissipate energy
C-elementStore potential energy
I-elementStore kinetic energy
Source of Effort ( S e )Impose a prescribed effort regardless of flow.
Source of Flow ( S f )Impose a prescribed flow regardless of effort.
Transformer (TF)2-Port ElementsScales effort and flow by a fixed ratio
Gyrator (GY) Converts effort ↔ flow between ports
Table 2. D6374 150KV 3-phase BLDC motor specification.
SpecificationValueUnit
Speed Constant150RPM/V [1]
Torque Constant0.055Nm/A [2]
Speed/Torque Gradient159.54RPM/Nm
Pole Pairs7
Phase Resistance39 → Phase-neutral
Phase Inductance24 → Phase-neutraluH
Continuous Current50 → Free Air
70 → Forced Air
A
A
Peak Current90 → 3-secondA
ThermistorNTC 10k 3435
Disclaimer/Publisher’s Note: The statements, opinions and data contained in all publications are solely those of the individual author(s) and contributor(s) and not of MDPI and/or the editor(s). MDPI and/or the editor(s) disclaim responsibility for any injury to people or property resulting from any ideas, methods, instructions or products referred to in the content.