Abstract
The geometry of soft actuators significantly impacts their performance, including force generation, range of motion, and adaptability. Optimizing actuator geometry and material properties under specific constraints is crucial for achieving desired performance. This paper presents an optimization workflow employing metaheuristic algorithms in synergy with SolidWorks and Sorotoki, a newly developed MATLAB toolkit for soft robotics. The workflow optimizes actuator geometry to maximize bending while minimizing actuating pressure. A metaheuristic algorithm iteratively modifies the actuator’s design in SolidWorks, according to finite element analysis conducted using Sorotoki. To ensure accurate simulations, a uniaxial tensile test is performed on Thermoplastic Polyurethane (TPU), with curve fitting based on metaheuristic algorithms for precise hyperelastic modeling. The Ogden and Yeoh models are compared, with results indicating the Ogden model best represents TPU behavior. Four metaheuristic algorithms—Particle Swarm Optimization (PSO), Genetic Algorithm, Simulated Annealing, and Moth Flame Optimization (MFO)—are evaluated. PSO outperforms others in material modeling, while MFO yields the most effective actuator geometry. This workflow enables the design of more efficient and adaptable soft actuators for applications in robotics, prosthetics, and biomedical devices.
1. Introduction
Soft actuators are a diverse range of devices typically made from flexible and compliant materials, designed to convert various sources of energy into motion or mechanical work [1].
The primary advantage of soft actuators compared to rigid ones is their flexibility and compliance due to their soft materials and flexible structures. This inherent characteristic provides soft actuators the versatility to achieve multiple degrees of freedom [2,3], offering valuable capabilities for a wide range of applications that involve direct interactions with humans, such as wearable and assistive devices that are used for health care [4,5,6].
The motion of soft actuators could be stimulated through various types of actuation sources, e.g., fluid, magnetic, electrical, thermal, chemical, etc. [7]. Each actuation method is characterized by specific advantages. For example, fluid actuation offers benefits such as energy efficiency, flexibility, and cost-effectiveness [8,9,10]. Thermal actuation eliminates the requirement for large pumps and valve systems, enabling wireless operation [11,12,13]. Electric actuation is notable for its rapid response, non-invasive stimulation, and ease of integration [14,15]. Magnetic actuation enables remote control, making it suitable for wireless soft actuators [16]. Chemical actuation operates through internal chemical reactions instead of relying on external environmental triggers [17].
Fluidic actuators are considered to be the most common type of soft actuators due to their capability to generate high forces and their useful resulting bending motion, making it suitable for wearable devices in order to compliantly assist body limbs through actuating their joints, or in industrial tasks that involve grasping fragile parts [11].
The bending capabilities of fluidic actuators are heavily influenced by the design parameters of their structure. Consequently, an efficient method for optimizing the bending angle of pneumatic actuators is highly preferred. Regarding this issue, Hu et al. [18] have investigated the effect of various design parameters on the bending capability of a pneumatic network actuator. Using a finite element method, several structural parameters of the actuator were evaluated in order to deduce an optimal performance of the actuator, under a specific actuation pressure. Keong and Hua [19] proposed a fold-based 3D printable soft bending actuator, apart from an experimental approach where they tested different possible designs towards several bending profiles. Wang and Hirai [20] have presented a workflow to optimize the chamber’s design of a bellows-type soft actuator using Abaqus and Isight software.
Pagoli et al. [21] provided a comprehensive classification of soft actuators and highlighted recent advances in soft fluidic actuators. Their review focused on seven influential designs, including pneumatic artificial muscles, PneuNets, and continuum arms, and discussed modeling approaches categorized as analytical, numerical, or model-free. From this review, several studies directly relevant to actuator optimization were presented. Pagoli et al. [22] introduced a soft finger with a pneumatic bending joint and optimized its geometry using FEM and NSGA-II to maximize bending and minimize size, validated experimentally with a silicone prototype. Decroly et al. [23] designed a soft fluidic bending actuator for steerable catheters, demonstrating how parametric modeling and FEM can guide miniaturized designs while maintaining bending performance.
Xavier et al. [24] surveyed the design, modeling, fabrication, sensing, and control of soft pneumatic actuators, highlighting the widespread adoption of pneumatic actuation due to its cost-effectiveness, responsiveness, and ease of implementation. The review also emphasized recent advances in analytical and numerical modeling, topology and data-driven optimization, and control methods. From this review, Peng et al. [25] optimized the length-to-diameter ratio of a two-section soft continuum manipulator via FEA to maximize workspace and minimize instability, and experimental validation confirmed the simulation results. Runge et al. [26] proposed a general design optimization framework for soft robot modules that effectively combines finite element modeling with genetic algorithm optimization. The method was applied to a soft pneumatic actuator, demonstrating robustness and efficiency in performance improvement while reducing the empirical nature of traditional soft robot design processes.
Jin et al. [27] examined the integration of FEA, machine learning, and digital twin technologies in soft robotics, emphasizing their role in modeling, sensing, control, and remote operation. From this review, Raeisinezhad et al. [28] developed two frameworks for optimizing multi-chamber pneumatic actuators, employing the firefly algorithm and deep reinforcement learning alongside FEA to maximize horizontal motion while minimizing vertical displacement, validated experimentally. Yao et al. [29] proposed a kinetostatic model for a biomimetic soft finger, combining geometric contact constraints and minimum strain energy principles with a multiobjective genetic algorithm to optimize adaptability and grasping force, demonstrating high predictive accuracy.
These studies collectively demonstrate the growing role of simulation-based design and meta-heuristic optimization in improving soft actuator performance. However, despite the abundance of research, few works have systematically compared multiple optimization algorithms within a unified framework for both material parameter identification and actuator shape optimization. Most previous studies focus on a single method or a specific actuator geometry, leaving open the question of which strategy provides the most efficient and accurate convergence for multi-level soft robotics design problems.
To address this gap, the present work evaluates four meta-heuristic algorithms for two optimization levels: (i) hyperelastic parameter identification based on experimental data, and (ii) actuator geometry optimization for maximizing bending at minimal pressure.
This study proposes an optimization approach for a soft bending actuator, in which meta-heuristic algorithms are tightly coupled with finite element simulations. Starting from a parametric 2D CAD model designed in SolidWorks, an STL file is generated and analyzed in MATLAB using the newly developed Sorotoki soft robotics toolkit [30]. Within the optimization loop, each algorithm particle—or candidate solution—represents a specific set of actuator design parameters defining its geometry. For each candidate, the algorithm triggers a complete simulation Finite Element Analysis (FEA) provided by Sorotoki toolkit, in order to evaluate the corresponding bending performance under a given actuation pressure. The computed bending angle serves as the objective function value, guiding the algorithm’s iterative search toward the optimal geometry.
To ensure realistic simulation and accurate material behavior, uniaxial tensile tests are conducted to identify hyperelastic parameters using both the Ogden and Yeoh models, whose parameters are also optimized via meta-heuristic algorithms. The tested algorithms in this study are the Genetic Algorithm (GA), Particle Swarm Optimization (PSO), Moth-Flame Optimization (MFO), and Simulated Annealing (SA). While the Sorotoki library provides built-in tools primarily suited for topology optimization, this work extends its capabilities by externally coupling it with these meta-heuristic algorithms for parameter-based shape optimization, allowing dynamic updates of actuator geometry during FEA-based iterations.
It is worth noting that although the Sorotoki library includes built-in optimization tools, these are primarily tailored for topology optimization tasks, aiming to determine the optimal material distribution within a fixed design domain. In contrast, the present work focuses on design parameters and shape optimization, where actuator dimensions and geometric parameters are iteratively modified to enhance performance. Since the current Sorotoki framework does not yet provide direct functionality to dynamically update geometric parameters during FEA-based iterations, external meta-heuristic algorithms were coupled with the toolkit to enable this functionality.
The remainder of this paper is organized as follows. Section 2 outlines the problem statement, framing material modeling and design geometry as optimization problems. Section 3 describes the workflow of the proposed optimization strategy and the meta-heuristic algorithms employed in this study. Section 4 exhibits the outcomes of the optimization algorithms applied to material modeling and design geometry. This paper concludes with a summary in Section 5.
2. Problem Statement
The soft actuator under consideration is a bellows-type pneumatic actuator, capable of converting the input air pressure into total deformation, which results in a usable bending motion. The resulting bending is due to the hyperelasticity of the actuator’s material and its unique structure, which comprises juxtaposed chambers such as bellows, folds, or networks. When the actuator is compressed, the air pressure inside the chambers causes them to unfold, resulting in the actuator’s bending motion, as illustrated in Figure 1.
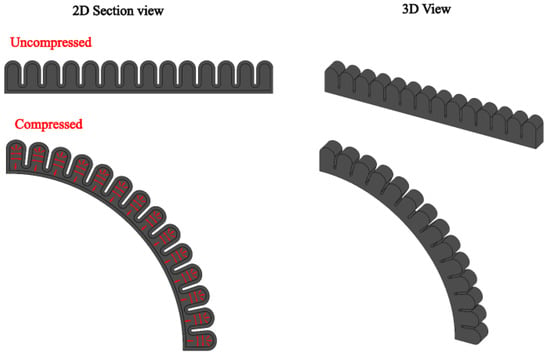
Figure 1.
Soft bellow-based actuator mechanism, the red arrows indicate the applied pneumatic pressure.
To accurately model and optimize the performance of the soft actuator, two key aspects must be addressed: the material’s hyperelastic behavior and the actuator’s geometric design. The material’s behavior, governed by its hyperelastic properties, is characterized using mathematical models such as the Ogden and Yeoh models [31,32]. Determining the parameters of these models through curve fitting based on experimental tensile tests is essential to simulate the material’s response accurately. Additionally, the actuator’s geometric parameters, such as chamber dimensions, play a crucial role in achieving maximum bending efficiency. These two optimization problems are explored in the following subsections.
2.1. Hyperelastic Models for Soft Actuators
Hyperelastic materials are characterized by their capability to undergo large elastic deformations. Modeling and simulating the behavior of such materials requires finite element analyses that incorporate non-linear material models such as the Yeoh and Ogden models, which describe the strain energy potential of a material. Equations (1) and (2) represent the strain energy potential according to the Ogden and Yeoh models, respectively [33,34,35].
where N is an order defining the number of terms in the model, and are the material’s intrinsic parameters.
where, are the material’s intrinsic parameters, and is the first deviatoric strain invariant based on the principal stretches , as expressed in Equation (3).
Assuming that the employed Thermoplastic Polyurethane (TPU) material is incompressible—a common assumption for elastomeric polymers supported by experimental observations showing Poisson’s ratio values close to 0.48 under large strains [36]—the relation between its principal stretches , and can be expressed as in Equation (4).
Considering the applied tensile stress along the x direction, , according to the incompressibility condition, the other stretches along the y and z directions are derived as in Equation (5).
It is important to note that the following formulation and subsequent Equations (5)–(9) are used exclusively to describe the uniaxial tensile test of the TPU material for the purpose of parameter identification of the hyperelastic models. These equations do not describe the general pressurization or deformation behavior of the soft actuator itself, but rather the material’s constitutive response under uniaxial loading.
Substituting the principal stretches in Equation (3), the first deviatoric strain invariant , could be formulated as in Equation (6).
The uniaxial tensile test conducted in this study yields a nominal stress–strain curve. Therefore, the first Piola–Kirchhoff stress is considered when fitting the analytical model curve (Ogden or Yeoh) to the experimental data, as calculated using Equation (7), where denotes the stress predicted by the respective model.
Which yields to Equations (8) and (9) as nominal stress measurement for the Ogden and Yeoh models, respectively.
In this study, an order model is used. Therefore, modeling the material involves determining the adequate values for , and in case of the Yeoh model and , and in case of the Ogden model.
For this purpose, an optimization problem is formulated following the approach of Ogden et al. [37] to determine the intrinsic parameters of both models by minimizing the Root Mean Squared Error (RMSE), which quantifies the average difference between the experimental data and the model predictions.
Let , be the vector that corresponds to stretch values applied during a uniaxial tensile test, where m represents the size of the experimental data. , is a vector for the corresponding nominal stress values.
Let the parameters vector for a specific model.
The objective function of such optimization is formulated as a MSE between the and the corresponding nominal stress values , as denoted by in Equation (10).
Therefore, the optimization problem could be formulated as follows:
where and for the Ogden and Yeoh models, respectively.
The accurate identification of hyperelastic model coefficients allows the FEA performed during the optimization process (presented in the next subsection) to capture realistic material deformations under pressurization, thereby strengthening the reliability of the obtained optimal design.
2.2. Parametric Design of the Actuator
The design optimization determines the optimal geometry of a soft bending actuator with a fixed total length L. The independent design parameters are the actuator height h, the number of chambers n, the chamber width coefficient c (which controls the chamber width relative to the total fold width W), the depth between folds d, and the shell thickness . The total fold width W is a derived dimension determined by the number of folds n and the fixed length L. Figure 2 provides a visual representation of these parameters.
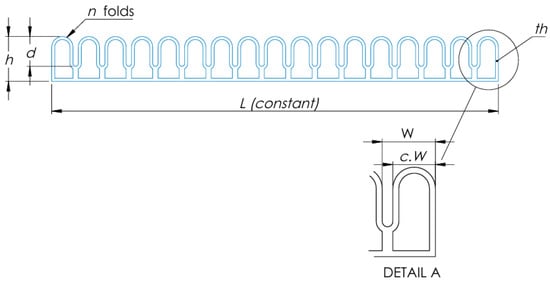
Figure 2.
Soft bending actuator design parameters.
The mathematical formulation of an optimization problem consists of an objective function to be minimized or maximized, decision variables that should be adjusted to optimize the objective function, and constraints which model the restrictions or conditions on the decision variables, often expressed as equalities or inequalities.
In our case, the objective function concerns the maximization of the bending of the soft actuator, which is evaluated using Equation (12):
where is a bending metric.
is the bending angle measured between the fixed origin of the actuator and its tip point, where D is the distance between both points. They are calculated using Equation (13) and Equation (14), respectively.
where and are coordinates of the fixed origin point and the tip point of the actuator, respectively, as depicted in Figure 3.
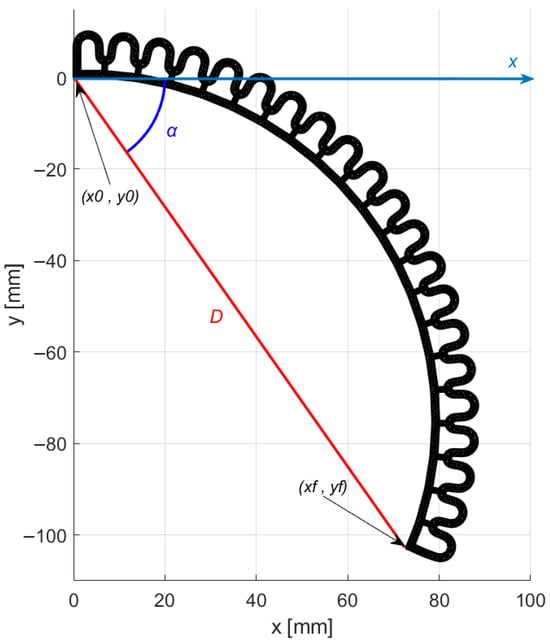
Figure 3.
Objective function metrics.
This metric was chosen because it simultaneously promotes a higher bending angle and a shorter tip distance from the base, which together indicate an improved overall curvature of the actuator.
The decision variables, , and are the design parameters that should be adjusted in order to maximize the bending under a specific applied pressure.
The constraints are a set of inequalities expressed in order to assure a feasible sketch for the actuator in SolidWorks.
Given that (as per Equation (12)) and the configuration shown in Figure 2, maximizing the bending corresponds to minimizing . Consequently, the optimization problem for the design geometry could be formulated as in Equation (15).
where , , , , and . indicated the FEA process conducted by the Sorotoki toolkit within the Matlab environment, which will be detailed in Section 3.1.
Inequalities (15a)–(15c) represent geometric constraints that prevent intersections or overlaps in the sketch, ensuring a feasible design in SolidWorks. Constraint (15a) ensures that the depth is sufficient to accommodate the chamber width , avoiding geometric interference between adjacent folds. Constraint (15b) imposes a minimum 1 mm gap between internal walls to ensure structural integrity and avoid sealing issues during fabrication. Constraint (15c) ensures that the inner fold width remains positive.
3. Methodology
This section outlines the methodology employed in this study for optimizing the design of a bellows-type soft actuator. The first subsection introduces the proposed geometry optimization workflow, which integrates parametric modeling and simulation to achieve maximum bending performance under minimal actuation pressure. The second subsection focuses on the metaheuristic algorithms used in this study, detailing their methodology and their features in the optimization process.
3.1. Finite Element Analyses for Optimization
Using SolidWorks (2023) Equations, Global Variables, and Dimensions tool, a 2D model of the actuator was designed based on dimension variables stored in a .txt file, enabling direct parametric control of the geometry. Each candidate geometry was exported as an .stl file and imported into MATLAB (MathWorks, 2023b), where the actuator’s behavior was simulated using the Sorotoki (v3.0.0) toolkit [30].
In Sorotoki, geometry discretization is performed through the Mesh.m class, which tessellates the actuator into finite elements (e.g., Tri3, Quad4 for 2D domains; Tet4, Hex8 for 3D). In this study, a 2D shell representation of the actuator was employed, discretized with Tri3 linear triangular elements to balance accuracy and computational cost. This mesh enabled computation of nodal displacements and internal stresses during optimization.
Nonlinear finite element analysis was carried out using the Fem.m class, which supports large deformations and hyperelastic material laws. A quasi-static analysis was conducted with the following boundary conditions: the actuator base was fixed, and a uniform internal pressure was applied to the cavity walls to replicate pneumatic actuation as presented in Figure 4, where red arrows model the actuation pressure. To reduce computational cost during optimization, a constant actuation pressure of 1 kPa was used. While this value is lower than typical TPU actuator operating pressures, the optimization objective is independent of absolute pressure. Since the goal is to maximize bending per unit pressure, the optimal geometry identified under 1 kPa remains scalable to higher pressures, ensuring the validity of the results without unnecessary computational expense.

Figure 4.
Boundary condition for optimization, red arrows indicate the applied pneumatic pressure.
3.2. Metaheuristic Optimization Algorithms
Metaheuristic algorithms are stochastic optimization techniques inspired by natural or physical processes. They aim to iteratively improve a set of candidate solutions through mechanisms that balance exploration (searching new regions of the solution space) and exploitation (refining promising regions) [38,39,40]. In this study, four paradigms of metaheuristic algorithms are employed to address two main optimization problems: (i) the material modeling problem formulated in Equation (11) and (ii) the geometry optimization problem formulated in Equation (15), where the objective is to maximize the actuator’s bending angle under a given actuating pressure.
The generic process of a metaheuristic optimization algorithm is illustrated in Figure 5. The procedure begins by generating an initial population (or single candidate solution), followed by evaluating their performance using the defined objective function. Based on the fitness values, new solutions are generated according to algorithm-specific operators that guide the search process toward optimal or near-optimal solutions. This iterative process continues until a termination criterion is met, typically a maximum number of iterations or a convergence threshold indicating a satisfying solution.
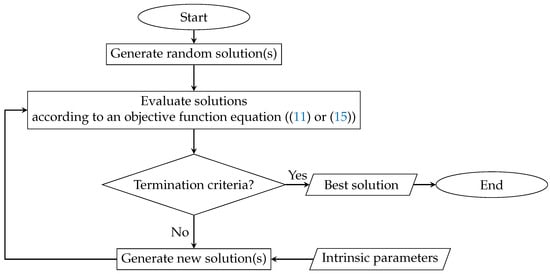
Figure 5.
Generic flowchart of the metaheuristic optimization process.
In this work, four algorithms were employed—PSO, SA, GA, and MFO. Each algorithm represents a distinct balance between exploration and exploitation, offering different search behaviors. Table 1 summarizes their intrinsic parameters and their solution generation technique.

Table 1.
Summary of metaheuristic algorithms, parameters, and solution generation techniques.
For the SA algorithm, the number of objective function evaluations corresponds to the number of iterations, since SA operates on a single candidate solution and performs one evaluation per iteration. In contrast, the population-based algorithms (PSO, GA, and MFO) evaluate the objective function for all individuals in the population at each iteration, resulting in a total number of evaluations equal to the product of the population size and the number of iterations.
This difference in computational effort among the algorithms is acknowledged. Preliminary tests indicated that increasing the number of SA iterations did not lead to a significant improvement in performance, as the algorithm tended to converge prematurely to local minima. The SA algorithm was therefore selected primarily for its low computational cost, which is a crucial consideration in the geometry optimization problem, where each objective function evaluation involves a time-consuming FEA simulation.
4. Results and Discussion
This section presents and discusses the key findings of this study, focusing on two main aspects: material modeling and design optimization. The first subsection highlights the results of the curve-fitting process, which aimed to model the hyperelastic behavior of the material using experimental tensile test data. The second subsection explores the outcomes of the geometry optimization workflow, detailing the performance of the proposed actuator designs.
4.1. Material Modeling
For the purpose of simulating the behavior of the actuator in the optimization processes, the actuator’s material must be mathematically modeled according to its mechanical intrinsic properties, as explained in Section 2.1. To determine the material properties, uniaxial tensile tests were performed on TPU specimens fabricated as dumbbells according to ASTM D638 Standard Test Method for Tensile Properties of Plastics (Type IV, thickness ≤ 4 mm) [52,53]. The overall dimensions of the dumbbells are indicated in Figure 6, with their corresponding values in Table 2.
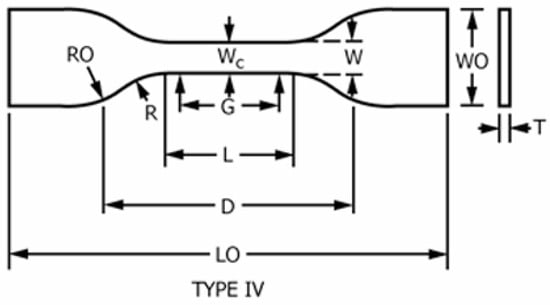
Figure 6.
Dumbbell-type IV dimensions.

Table 2.
Dumbbell dimension variables.
Three dumbbell specimens are fabricated using fused deposition modeling (FDM) 3D printing of semi-flexible Creality TPU filaments with a shore hardness of 95A Figure 7. The fabrication is carried out using a Raise3D N2 printer (Raise3D Technologies Inc., Irvine, CA, USA), and the printing parameters implemented through ideaMaker slicer software [54] are summarized in Table 3.
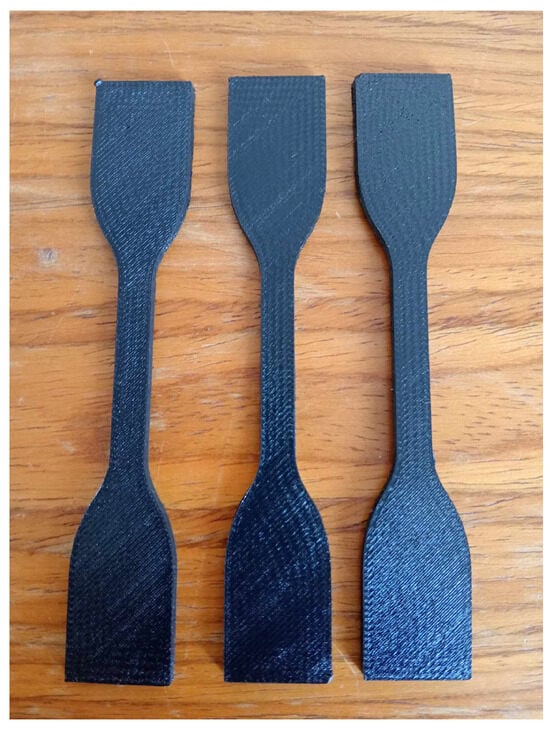
Figure 7.
TPU tensile test dumbbells.

Table 3.
The 3D printing parameters for tensile test dumbbells using ideaMaker slicer software.
The tensile test was conducted using an MTS Insight tensile testing machine, as shown in Figure 8, at a crosshead speed of 500 mm/min on three TPU samples.
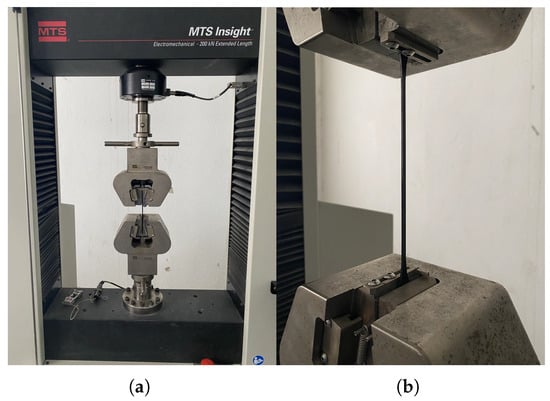
Figure 8.
Tensile test using MTS Insight machine: (a) initial position, (b) stretching.
A stress–strain curve of the applied stress relative to the resulting strain obtained through three tensile tests on three dumbbells is presented in Figure 9.
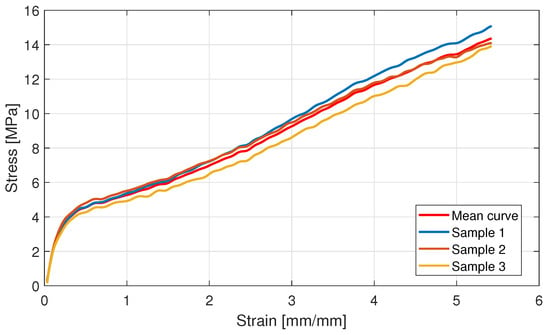
Figure 9.
Stress–strain curve obtained using tensile test.
Approaching the problem as an optimization problem, the way is outlined in Section 2.1. The four algorithms, SA, GA, MFO, and PSO, have been tested for the curve fitting between the model and experimental stress–strain curves. The intrinsic parameter values of each algorithm are listed in Table 4.

Table 4.
Algorithms’ intrinsic parameters for curve fitting.
The algorithmic parameters presented in Table 4 were selected and tuned through preliminary testing and plausible considerations to achieve a balance between computational efficiency and convergence quality. For the GA, a balanced selection rate was adopted, allowing half of the population to contribute to the generation of new solutions, which maintains a trade-off between exploration and exploitation. A relatively high mutation probability () was chosen to promote diversity, as preliminary tests indicated a tendency toward premature convergence when diversity was insufficient. The number of bits was set to 10, which is a standard precision for encoding continuous parameters and was found to be sufficient, as higher values did not significantly improve performance. For the PSO, the parameters were chosen according to the investigation conducted by Rokbani et al. [42] on the influence of PSO parameters in solving inverse problems, where recommended parameter intervals were provided. The parameters adopted in this study fall within those validated ranges. In the SA, a cooling rate c between 0.9 and 0.99 was selected, as this range was observed to enhance the algorithm’s exploration capability while maintaining convergence stability. Regarding the MFO, it has a single main parameter that defines the shape of the logarithmic spiral (b), which was set according to the original work of Mirjalili [49].
To provide a fair comparison with conventional optimization techniques, the parameter identification process was also carried out using the built-in curve fitting tool in ANSYS Workbench (2025 R2), commonly employed in the soft robotics community [18,55,56]. The results obtained from ANSYS were included in Table 5 alongside those of the proposed metaheuristic algorithms. As shown, the swarm-based methods, particularly PSO, achieved significantly lower fitness values compared to the Ansys result, demonstrating higher fitting accuracy and robustness in capturing the nonlinear material response. This comparison highlights the capability of metaheuristic techniques to avoid local minima and better handle highly nonlinear hyperelastic material models such as Ogden and Yeoh.

Table 5.
Algorithms’ best solutions among 30 runs for Ogden and Yeoh models.
Table 5 presents the best solutions obtained among 30 runs for the MFO, PSO, SA, and GA algorithms, along with the results from the ANSYS curve fitting tool, for both the Ogden and Yeoh models. Figure 10 illustrates the corresponding fitted curves for all methods.
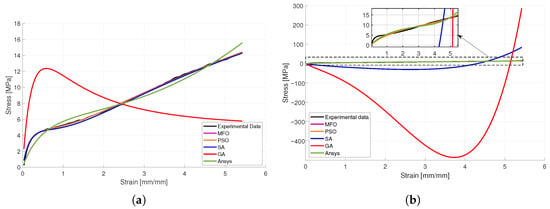
Figure 10.
Best curve fitting achieved for (a) Ogden model and (b) Yeoh model using SA, GA, MFO, and PSO among 30 epochs along with Ansys solution (highlighted with dotted rectangle).
Figure 11 presents the fitness values across 30 epochs for (a) the Ogden model and (b) the Yeoh model using SA, GA, PSO, and MFO. For the Ogden model, the MFO and PSO algorithms demonstrate consistently low fitness values across all epochs, indicating their superior stability and performance, though with slight variations. In contrast, GA and SA exhibit higher fitness values, with SA showing significant fluctuations and outliers, indicating inconsistency in performance. Similarly, for the Yeoh model, PSO continues to outperform the other algorithms with minimal fitness values across epochs, followed closely by MFO. GA demonstrates higher fitness values with moderate variations, while SA shows substantial fluctuations, underscoring its instability. These results reinforce the robustness and efficiency of MFO and PSO in achieving optimal solutions for both models compared to the other algorithms.

Figure 11.
Fitness value in each epoch for (a) Ogden and (b) Yeoh curves fitting using SA, GA, MFO, and PSO algorithms.
Figure 12 illustrates the convergence behavior of SA, GA, PSO, and MFO for the Ogden (a) and Yeoh (b) models, highlighting significant differences in optimization performance. For both models, PSO demonstrates the most efficient convergence, achieving the lowest fitness values early in the iterations, which reflects its superior ability to minimize errors. MFO also performs competitively, showing steady convergence and relatively low fitness values, though it is slightly less effective than PSO. In contrast, GA achieves moderate performance, with slower convergence and higher stabilized fitness values, indicating limited precision. SA consistently shows the poorest performance, with slow convergence and fitness values orders of magnitude higher than the other algorithms, rendering it unsuitable for these tasks. Notably, the Ogden model exhibits faster convergence and generally lower fitness values across all algorithms compared to the Yeoh model, suggesting it is more straightforward to model the material. These results confirm PSO as the most effective algorithm for curve fitting, particularly for the Ogden model.

Figure 12.
Average fitness value per iteration for: (a) Ogden and (b) Yeoh models curve fitting using SA, GA, MFO, and PSO.
In order to plausibly deduce the appropriate material model as well as the best algorithm for curve fitting, statistical analyses, along with the Wilcoxon nonparametric statistical comparative test [57,58], have been conducted. Table 6 presents a statistical analysis for the results of MFO, PSO, GA, and SA algorithms in curve fitting for Ogden and Yeoh models. PSO demonstrates superior fitting performance, achieving the lowest best value for the Ogden model (7.4753) and exceptional consistency for the Yeoh model, with nearly identical best, worst, median, and mean values (434.7078) and negligible standard deviation. MFO performs competitively for the Ogden model, achieving a best value of 8.1431, but exhibits high variability between trials (Std = 374.3590). In contrast, GA and SA show significant challenges with convergence and stability, as evidenced by their high standard deviations and extreme worst-case values, particularly for the Ogden model, where SA’s worst value reaches . Comparing the two models, the Ogden model is more suitable for accurately modeling the material, as it consistently achieves lower best values across all algorithms, reflecting a better fit to the material’s behavior. These findings suggest that PSO is the most reliable algorithm for optimizing material modeling, particularly with the Ogden model. These findings are supported by the Wilcoxon signed-rank test, which evaluates the statistical significance of differences between algorithms.

Table 6.
Statistical analyses of MFO, PSO, GA, and SA performances for Ogden and Yeoh models curve fitting.
The Wilcoxon signed-rank test is a non-parametric statistical method used to compare paired samples and determine if their median differences are significantly different from zero. It is particularly suitable for evaluating differences in performance between two algorithms when the data does not follow a normal distribution. It reports metrics such as the -value and , where
- : The statistical significance of the observed differences. A small p-value (e.g., <0.05) indicates that the differences are unlikely to be due to random chance, supporting the conclusion that one algorithm outperforms the other;
- : The sum of positive ranks. calculated based on the differences between paired observations in two datasets;
- : The sum of negative ranks. calculated based on the differences between paired observations in two datasets.
Let A and B be two compared algorithms, with their corresponding data and . Let represent the difference between the performance values of the algorithms for each instance. corresponds to the sum of ranks where (positive differences), while corresponds to the sum of ranks where (negative differences). In the context of a minimization problem, indicates cases where Algorithm B performs better than Algorithm A (due to its smaller values), whereas indicates cases where Algorithm A outperforms Algorithm B. In other words, assuming that the -value of the Wilcoxon signed-rank comparison test between algorithms A and B is . If , then Algorithm B is likely better for the minimization problem. Conversely, if , then Algorithm A is likely better.
The Wilcoxon signed-rank comparative results presented in Table 7 and Table 8 offer valuable insights into the relative performance of the algorithms (MFO, PSO, GA, and SA) for the Ogden and Yeoh material models, respectively. These tables evaluate the statistical significance of differences between algorithms using the Wilcoxon signed-rank test, reporting metrics such as the -value , and the best-performing algorithm for each pairwise comparison. For the Ogden model, MFO and PSO emerge as competitive candidates, with PSO outperforming in most pairwise comparisons. Meanwhile, in the Yeoh model, PSO and MFO consistently outperform the other algorithms, showing lower values and dominance in rankings, with PSO slightly edging out MFO.

Table 7.
Wilcoxon comparatives for Ogden model.

Table 8.
Wilcoxon comparatives for Yeoh model.
The findings from the boxplot of Figure 13 align with these statistical results and provide crucial context when compared to the ANSYS benchmark. PSO and MFO not only exhibit tighter interquartile ranges and lower median fitness values, reflecting their consistent performance across multiple iterations for both models, but also demonstrate competitive performance against the standard ANSYS curve-fitting tool, with PSO particularly matching or exceeding the ANSYS baseline for the Ogden model. In contrast, SA demonstrates a high degree of variability with many outliers, indicating instability in its optimization process and generally failing to reach the ANSYS benchmark. GA performs moderately, but its median and variability suggest it is less effective than both PSO and MFO, though it remains in the competitive range for certain cases.
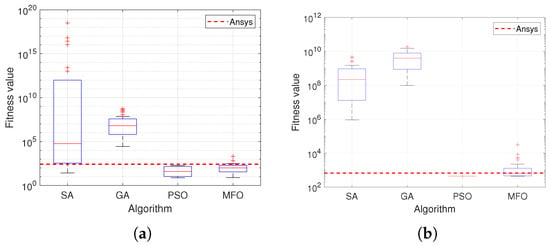
Figure 13.
Box plot presentation for the fitness values for (a) Ogden and (b) Yeoh models curve fitting for 30 epoches data of SA, GA, MFO, and PSO.
4.2. Design Optimization
Employing the methodology presented in Section 3, the four algorithms, viz., PSO, GA, SA, and MFO, have been implemented and tested within the proposed strategy to obtain an optimal geometry of the actuator. The termination criteria for each algorithm are a maximum number of iterations ; meanwhile, the algorithm’s intrinsic parameters used for this optimization problem are presented in Table 9. The population size was intentionally kept small (six candidate solutions) to maintain a reasonable computational cost, as each simulation of one candidate geometry required approximately 1–2 min (depending on its complexity). Moreover, since the design search space was limited by relatively narrow upper and lower bounds, a small population size was found sufficient to ensure adequate exploration without unnecessary computational expense.

Table 9.
Algorithms’ intrinsic parameters for design optimization.
Along the algorithms’ process, each candidate solution (geometry) of the actuator is analyzed by simulating the actuator’s performance using the Sorotoki Matlab robotics toolkit, using the model presented in Figure 2, with a mesh size of 1.5 mm. While the current version of the toolkit does not support the Ogden model, it accommodates the Yeoh model. Therefore, the fittest Yeoh parameters presented in Table 5, , , and are used to model the material properties and assigned to the model. The boundary condition applied in this simulation consists of a fixed support on the left side of the actuator and a pressure load of 1 kPa applied on the inner walls of the actuator. At each simulation, the bending response of the actuator is measured using Equation (12), evaluating each candidate solution.
Although the Ogden model provides a more precise representation of the TPU’s nonlinear behavior, the Yeoh model was sufficiently accurate to guide the optimization process in Sorotoki, while the final validation was conducted in ANSYS using the Ogden model for higher fidelity.
The performance of each algorithm in finding an optimal geometry is presented in Figure 14, which shows the evolution of the fitness curve along 30 iterations. The corresponding solutions provided by the implemented algorithms are shown in Figure 15.
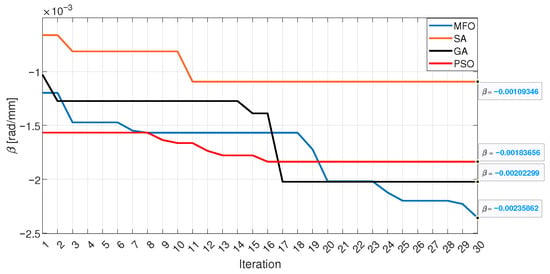
Figure 14.
Algorithms’ fitness curves.
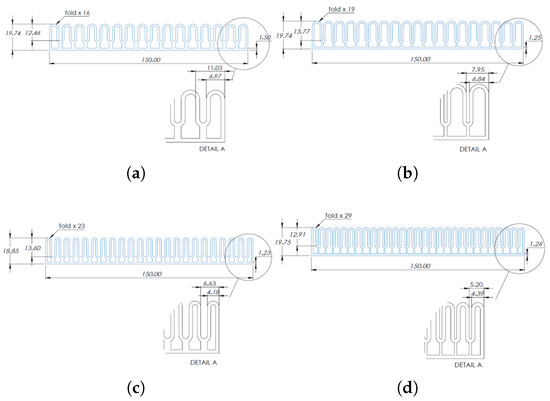
Figure 15.
Geometries of the solutions provided by (a) SA, (b) PSO, (c) GA, and (d) MFO.
The performance of each solution was simulated using ANSYS Workbench (ANSYS Inc.) in order to visualize the effect of the geometry on the response of the actuator under a specific pressure load.
To provide a meaningful comparison and assess the performance of the optimized actuators, additional finite element simulations were conducted on a classical PneuNet actuator, as presented in [59], and a bellows-type actuator from the Hiremath et al. [60] study. Both geometries were modeled using the same identified TPU material and evaluated under identical boundary and loading conditions as the optimal designs to ensure fairness.
The finite element simulation using the ANSYS Workbench structural study was performed using the following steps:
- Material propriety: inserting the fittest Ogden parameters presented in Table 5, , , , , , and into engineering data;
- Model import: a .step file of the 3D cad model of the actuator, according to the algorithm’s resulting geometry, is imported to ANSYS “Design Modeler”;
- Assign material: assign the Ogden parameters presented to the imported model;
- Named selections: prepare selections for the inner walls of the actuator to be selected for applied load, and outer walls (surfaces between each bellow) for contact interactions definition;
- A nonlinear mechanical mesh with quadratic tetrahedral elements and an element size of 0.3 mm was used. This size provided approximately four elements across the actuator wall thickness (1.2 mm), ensuring sufficient accuracy in capturing the strain distribution while maintaining computational efficiency. The mesh density was also limited by the maximum number of cells (512,000) supported by the available computational resources.
- Contact interaction: a friction-less contact interaction between two juxtaposed outer surfaces of each bellow of the actuator;
- Analysis settings: A single analysis step was used, with a step end time of 1 s, an initial time step of 0.1 s, a minimum time step of 0.0001 s, and a maximum time step of 1 s. The large deflection option was activated.
- Input boundary conditions and loads: Select a fixed support for the actuator and apply a pressure load of 900 kPa on the inner walls of the actuator;
- Solve and evaluate results: Job execution and results visualization.
Figure 16 illustrates the simulated deformation of the non-optimized and optimized actuator geometries obtained using four different optimization algorithms—SA, PSO, GA, and MFO—aimed at maximizing the actuator’s bending performance. Compared to the PneuNets geometry (Figure 16a) and the non-optimized reference actuator (Figure 16b), the optimized designs exhibit a significantly greater bending angle under the same pressure, confirming the improved deformation efficiency and validating the effectiveness of the proposed optimization framework. The displacement values observed indicate that MFO (Figure 16f) provides the most effective geometry for maximizing bending. GA (Figure 16e) demonstrates a competitive performance. PSO (Figure 16d) achieves a slightly lower bending, while SA (Figure 16c) exhibits the least bending performance, indicating it is less effective for this optimization problem. These results highlight MFO’s superior capability in identifying geometries that enhance actuator bending, while also showing that GA and PSO deliver reasonable alternatives. SA, despite its weaker performance, could offer other benefits such as better computational efficiency or stability in other scenarios.
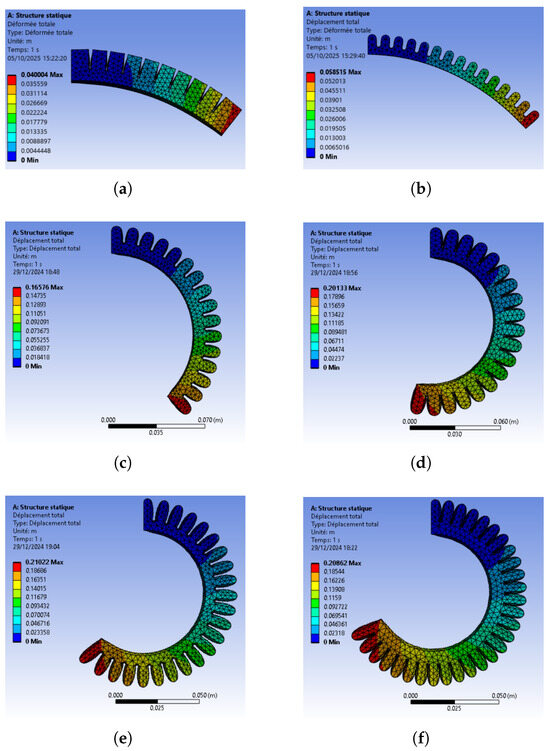
Figure 16.
Simulation results of (a) PneuNets, (b) non-optimized reference actuator, (c) SA, (d) PSO, (e) GA, and (f) MFO solutions.
4.3. Experimental Validation
The prototype actuator corresponding to the MFO-optimized design was fabricated and experimentally tested using the printing parameters presented in Table 10.

Table 10.
The 3D printing parameters for the MFO-optimized design.
Figure 17 shows the printed actuator according to MFO-optimized geometry.
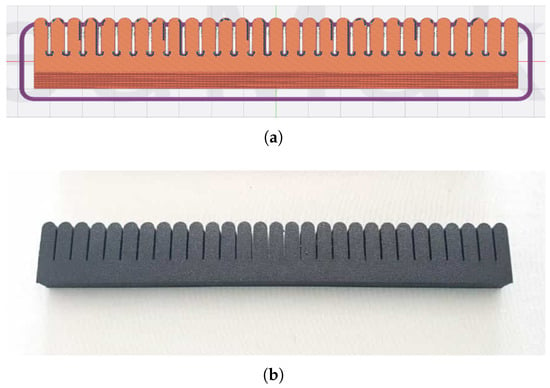
Figure 17.
MFO solution geometry: (a) slicing view, (b) printed.
The actuator reached a bending angle of approximately 36° under an input pressure of 220 kPa. Minor air leakage observed during pressurization likely constrained the reaching of higher applied pressure. Nonetheless, the actuator exhibited a bending profile and deformation trend consistent with the finite element predictions as presented in Figure 18, thereby supporting the validity of the proposed optimization framework.
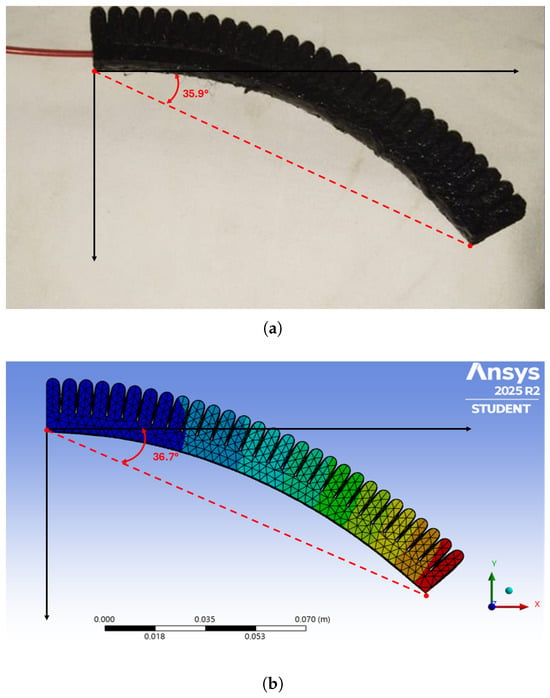
Figure 18.
Comparison between experimental and simulated deformation of the MFO-optimized actuator at 220 kPa applied pressure: (a) fabricated actuator, showing a measured bending angle of 35.9°, and (b) FEA simulation result (ANSYS), showing a predicted bending angle of 36.7°.
The actuator exhibited a smooth bending motion and reached a maximum bending angle of approximately 35.9°, as shown in Figure 18. The simulation predicted a comparable bending angle of 36.7° (Figure 18b), demonstrating close agreement between the experimental and finite element results. Minor leakage was observed during pressurization, which likely reduced the achievable deformation. Nevertheless, the deformation pattern and overall bending behavior followed the simulated predictions, confirming the accuracy of the optimization process and the adequacy of the hyperelastic material model used for design evaluation.
5. Conclusions
This study investigated the impact of the design geometry of a bellows-type soft actuator on its bending performance. An optimization workflow was proposed to determine the actuator geometry that maximizes bending for a given minimum actuation pressure. The workflow employs the SolidWorks equations tool to create a controllable parametric geometry and evaluates each design using the Sorotoki MATLAB toolkit, with performance feedback driving a metaheuristic algorithm to generate improved geometries. The metaheuristic algorithms tested include Particle Swarm Optimization (PSO), Genetic Algorithm (GA), Simulated Annealing (SA), and Moth Flame Optimization (MFO). Simulation results were validated using ANSYS Workbench FEA, with the material modeled based on experimental tensile tests of 3D-printable TPU using the Ogden and Yeoh hyperelastic models. In addition to geometry optimization, the metaheuristic algorithms were also applied to fit the Ogden and Yeoh model parameters to experimental stress–strain curves, demonstrating the potential of metaheuristic algorithms as a flexible alternative to conventional curve-fitting tools. Results show that PSO outperforms other algorithms in curve fitting, while MFO provides the most effective actuator geometry for maximum bending. The proposed workflow is not problem-specific. It could be adapted to other soft actuator geometries, different performance objectives, or extended to optimize material modeling. Future studies could explore these possibilities, including optimizing multiple objectives simultaneously, such as maximizing both bending and tip contact force, or comparing different actuator types to identify optimal geometries and designs.
Author Contributions
Conceptualization, M.S. and N.R.; methodology, M.S., N.R., M.A.T. and M.M.B.K.; software, M.S.; validation, E.W., M.M.B.K. and M.A.T.; formal analysis, M.S.; investigation, M.S.; resources, all authors; data curation, M.S.; writing—original draft preparation, M.S.; writing—review and editing, M.S., N.R., E.W. and M.M.B.K.; visualization, M.S. and M.M.B.K.; supervision, N.R., M.A.T., E.W. and M.M.B.K.; project administration, all authors; funding acquisition, all authors. All authors have read and agreed to the published version of the manuscript.
Funding
This research was funded by the Centre d’Aide à la Recherche et au Transfert Technologique (CARTT) of Toulon university under the “Appel à Projets CARTT” program.
Institutional Review Board Statement
Not applicable.
Informed Consent Statement
Not applicable.
Data Availability Statement
The data of the results presented in this study are available on request from the corresponding author.
Conflicts of Interest
The authors declare no conflicts of interest.
References
- Debije, M.G.; Schenning, A.P.H.J. Stimuli-Responsive Liquid Crystalline Materials. In Reference Module in Materials Science and Materials Engineering; Elsevier: Amsterdam, The Netherlands, 2016. [Google Scholar] [CrossRef]
- Hughes, J.; Culha, U.; Giardina, F.; Guenther, F.; Rosendo, A.; Iida, F. Soft Manipulators and Grippers: A Review. Front. Robot. AI 2016, 3, 69. [Google Scholar] [CrossRef]
- Marchese, A.D.; Katzschmann, R.K.; Rus, D. A Recipe for Soft Fluidic Elastomer Robots. Soft Robot. 2015, 2, 7–25. [Google Scholar] [CrossRef]
- Low, F.Z.; Tan, H.H.; Lim, J.H.; Yeow, C.H. Development of a Soft Pneumatic Sock for Robot-Assisted Ankle Exercise. J. Med. Devices 2016, 10, 014503. [Google Scholar] [CrossRef]
- Haghshenas-Jaryani, M.; Carrigan, W.; Wijesundara, M.B.J.; Patterson, R.M.; Bugnariu, N.; Niacaris, T. Kinematic Study of a Soft-and-Rigid Robotic Digit for Rehabilitation and Assistive Applications. In Proceedings of the ASME 2016 International Design Engineering Technical Conferences and Computers and Information in Engineering Conference, Charlotte, NC, USA, 21–24 August 2016; American Society of Mechanical Engineers Digital Collection: New York, NY, USA, 2016. [Google Scholar] [CrossRef]
- Al-Ibadi, A.; Nefti-Meziani, S.; Davis, S. Design, Kinematics and Controlling a Novel Soft Robot Arm with Parallel Motion. Robotics 2018, 7, 19. [Google Scholar] [CrossRef]
- Tang, X.; Li, H.; Ma, T.; Yang, Y.; Luo, J.; Wang, H.; Jiang, P. A Review of Soft Actuator Motion: Actuation, Design, Manufacturing and Applications. Actuators 2022, 11, 331. [Google Scholar] [CrossRef]
- Zhang, C.; Zhu, P.; Lin, Y.; Tang, W.; Jiao, Z.; Yang, H.; Zou, J. Fluid-driven artificial muscles: Bio-design, manufacturing, sensing, control, and applications. Bio-Des. Manuf. 2021, 4, 123–145. [Google Scholar] [CrossRef]
- Cui, Y.; Liu, X.J.; Dong, X.; Zhou, J.; Zhao, H. Enhancing the Universality of a Pneumatic Gripper via Continuously Adjustable Initial Grasp Postures. IEEE Trans. Robot. 2021, 37, 1604–1618. [Google Scholar] [CrossRef]
- Li, Y.; Chen, Y.; Ren, T.; Li, Y.; Choi, S.h. Precharged Pneumatic Soft Actuators and Their Applications to Untethered Soft Robots. Soft Robot. 2018, 5, 567–575. [Google Scholar] [CrossRef] [PubMed]
- Shan, W.; Diller, S.; Tutcuoglu, A.; Majidi, C. Rigidity-tuning conductive elastomer. Smart Mater. Struct. 2015, 24, 065001. [Google Scholar] [CrossRef]
- Rich, S.; Jang, S.H.; Park, Y.L.; Majidi, C. Liquid Metal-Conductive Thermoplastic Elastomer Integration for Low-Voltage Stiffness Tuning. Adv. Mater. Technol. 2017, 2, 1700179. [Google Scholar] [CrossRef]
- Wang, Q.; Tian, X.; Li, D. Multimodal soft jumping robot with self-decision ability. Smart Mater. Struct. 2021, 30, 085038. [Google Scholar] [CrossRef]
- Yuan, X.; Zhou, X.; Liang, Y.; Wang, L.; Chen, R.; Zhang, M.; Pu, H.; Xuan, S.; Wu, J.; Wen, W. A stable high-performance isotropic electrorheological elastomer towards controllable and reversible circular motion. Compos. Part B Eng. 2020, 193, 107988. [Google Scholar] [CrossRef]
- Yin, L.J.; Zhao, Y.; Zhu, J.; Yang, M.; Zhao, H.; Pei, J.Y.; Zhong, S.L.; Dang, Z.M. Soft, tough, and fast polyacrylate dielectric elastomer for non-magnetic motor. Nat. Commun. 2021, 12, 4517. [Google Scholar] [CrossRef]
- Ebrahimi, N.; Bi, C.; Cappelleri, D.J.; Ciuti, G.; Conn, A.T.; Faivre, D.; Habibi, N.; Hošovský, A.; Iacovacci, V.; Khalil, I.S.M.; et al. Magnetic Actuation Methods in Bio/Soft Robotics. Adv. Funct. Mater. 2021, 31, 2005137. [Google Scholar] [CrossRef]
- Maeda, S.; Hara, Y.; Yoshida, R.; Hashimoto, S. Self-Oscillating Gel Actuator for Chemical Robotics. Adv. Robot. 2008, 22, 1329–1342. [Google Scholar] [CrossRef]
- Hu, W.; Mutlu, R.; Li, W.; Alici, G. A Structural Optimisation Method for a Soft Pneumatic Actuator. Robotics 2018, 7, 24. [Google Scholar] [CrossRef]
- Keong, B.A.W.; Hua, R.Y.C. A Novel Fold-Based Design Approach toward Printable Soft Robotics Using Flexible 3D Printing Materials. Adv. Mater. Technol. 2018, 3, 1700172. [Google Scholar] [CrossRef]
- Wang, Z.; Hirai, S. Chamber dimension optimization of a bellow-type soft actuator for food material handling. In Proceedings of the 2018 IEEE International Conference on Soft Robotics (RoboSoft), Livorno, Italy, 24–28 April 2018; pp. 382–387. [Google Scholar] [CrossRef]
- Pagoli, A.; Chapelle, F.; Corrales-Ramon, J.A.; Mezouar, Y.; Lapusta, Y. Review of soft fluidic actuators: Classification and materials modeling analysis. Smart Mater. Struct. 2021, 31, 013001. [Google Scholar] [CrossRef]
- Pagoli, A.; Chapelle, F.; Ramon, J.A.C.; Mezouar, Y.; Lapusta, Y. Design and Optimization of a Dextrous Robotic Finger: Incorporating a Sliding, Rotating, and Soft-Bending Mechanism While Maximizing Dexterity and Minimizing Dimensions. IEEE Robot. Autom. Mag. 2020, 27, 56. [Google Scholar] [CrossRef]
- Decroly, G.; Mertens, B.; Lambert, P.; Delchambre, A. Design, characterization and optimization of a soft fluidic actuator for minimally invasive surgery. Int. J. Comput. Assist. Radiol. Surg. 2020, 15, 333–340. [Google Scholar] [CrossRef] [PubMed]
- Xavier, M.S.; Tawk, C.D.; Fleming, A.; Zolfagharian, A.; Pinskier, J.; Howard, D.; Young, T.; Lai, J.; Harrison, S.M.; Yong, Y.K.; et al. Soft Pneumatic Actuators: A Review of Design, Fabrication, Modeling, Sensing, Control and Applications; Open Research Newcastle: Callaghan, Australia, 2022. [Google Scholar]
- Peng, X.; Zhang, N.; Ge, L.; Gu, G. Dimension Optimization of Pneumatically Actuated Soft Continuum Manipulators. In Proceedings of the 2019 2nd IEEE International Conference on Soft Robotics (RoboSoft), Seoul, Republic of Korea, 14–18 April 2019; pp. 13–18. [Google Scholar] [CrossRef]
- Runge, G.; Peters, J.; Raatz, A. Design optimization of soft pneumatic actuators using genetic algorithms. In Proceedings of the 2017 IEEE International Conference on Robotics and Biomimetics (ROBIO), Macau, China, 5–8 December 2017; pp. 393–400. [Google Scholar] [CrossRef]
- Jin, L.; Zhai, X.; Xue, W.; Zhang, K.; Jiang, J.; Bodaghi, M.; Liao, W.H. Finite element analysis, machine learning, and digital twins for soft robots: State-of-arts and perspectives. Smart Mater. Struct. 2025, 34, 033002. [Google Scholar] [CrossRef]
- Raeisinezhad, M.; Pagliocca, N.; Koohbor, B.; Trkov, M. Design Optimization of a Pneumatic Soft Robotic Actuator Using Model-Based Optimization and Deep Reinforcement Learning. Front. Robot. AI 2021, 8, 639102. [Google Scholar] [CrossRef]
- Yao, J.; Fang, Y.; Yang, X.; Wang, P.; Li, L. Design optimization of soft robotic fingers biologically inspired by the fin ray effect with intrinsic force sensing. Mech. Mach. Theory 2024, 191, 105472. [Google Scholar] [CrossRef]
- Caasenbrood, B.J.; Pogromsky, A.Y.; Nijmeijer, H. Sorotoki: A Matlab Toolkit for Design, Modeling, and Control of Soft Robots. IEEE Access Pract. Innov. Open Solut. 2024, 12, 17604–17638. [Google Scholar] [CrossRef]
- Ogden, R.W. Large deformation isotropic elasticity—On the correlation of theory and experiment for incompressible rubberlike solids. Proc. R. Soc. Lond. A Math. Phys. Sci. 1997, 326, 565–584. [Google Scholar] [CrossRef]
- Yeoh, O.H. Some Forms of the Strain Energy Function for Rubber. Rubber Chem. Technol. 1993, 66, 754–771. [Google Scholar] [CrossRef]
- Haghshenas-Jaryani, M.; Manvar, M.; Wijesundara, M.B.J. Torque Characterization of a Novel Pneumatic Soft-and-Rigid Hybrid Actuator; American Society of Mechanical Engineers: New York, NY, USA, 2017. [Google Scholar] [CrossRef]
- Kanyanta, V.; Ivankovic, A. Mechanical characterisation of polyurethane elastomer for biomedical applications. J. Mech. Behav. Biomed. Mater. 2010, 3, 51–62. [Google Scholar] [CrossRef] [PubMed]
- Dilibal, S.; Sahin, H.; Celik, Y. Experimental and numerical analysis on the bending response of the geometrically gradient soft robotics actuator. Arch. Mech. 2018, 70, 391–404. [Google Scholar] [CrossRef]
- Xu, Y.X.; Juang, J.Y. Measurement of Nonlinear Poisson’s Ratio of Thermoplastic Polyurethanes under Cyclic Softening Using 2D Digital Image Correlation. Polymers 2021, 13, 1498. [Google Scholar] [CrossRef]
- Ogden, R.W.; Saccomandi, G.; Sgura, I. Fitting hyperelastic models to experimental data. Comput. Mech. 2004, 34, 484–502. [Google Scholar] [CrossRef]
- Vinod Chandra, S.S.; Anand, H.S. Nature inspired meta heuristic algorithms for optimization problems. Computing 2022, 104, 251–269. [Google Scholar] [CrossRef]
- Rahman, M.A.; Sokkalingam, R.; Othman, M.; Biswas, K.; Abdullah, L.; Abdul Kadir, E. Nature-Inspired Metaheuristic Techniques for Combinatorial Optimization Problems: Overview and Recent Advances. Mathematics 2021, 9, 2633. [Google Scholar] [CrossRef]
- Rajwar, K.; Deep, K.; Das, S. An exhaustive review of the metaheuristic algorithms for search and optimization: Taxonomy, applications, and open challenges. Artif. Intell. Rev. 2023, 56, 13187–13257. [Google Scholar] [CrossRef] [PubMed]
- Eberhart, R.; Kennedy, J. A new optimizer using particle swarm theory. In Proceedings of the MHS’95, Sixth International Symposium on Micro Machine and Human Science, Nagoya, Japan, 4–6 October 1995; pp. 39–43. [Google Scholar] [CrossRef]
- Rokbani, N.; Kumar, R.; Alimi, A.M.; Thong, P.H.; Priyadarshini, I.; Nhu, V.H.; Ngo, P.T.T. Impacts of heuristic parameters in PSO inverse kinematics solvers. Int. J. Nonlinear Sci. Numer. Simul. 2022, 23, 833–858. [Google Scholar] [CrossRef]
- Wang, F.; Zhang, H.; Zhou, A. A particle swarm optimization algorithm for mixed-variable optimization problems. Swarm Evol. Comput. 2021, 60, 100808. [Google Scholar] [CrossRef]
- Holland, J.H. Adaptation in Natural and Artificial Systems: An Introductory Analysis with Applications to Biology, Control, and Artificial Intelligence; The MIT Press: Cambridge, MA, USA, 1992. [Google Scholar] [CrossRef]
- The Binary Genetic Algorithm. In Practical Genetic Algorithms; John Wiley & Sons, Ltd.: Hoboken, NJ, USA, 2003; pp. 27–50. [CrossRef]
- Kirkpatrick, S.; Gelatt, C.D.; Vecchi, M.P. Optimization by Simulated Annealing. Science 1983, 220, 671–680. [Google Scholar] [CrossRef]
- Nikolaev, A.G.; Jacobson, S.H. Simulated Annealing. In Handbook of Metaheuristics; Gendreau, M., Potvin, J.Y., Eds.; Springer: Boston, MA, USA, 2010; pp. 1–39. [Google Scholar] [CrossRef]
- Guilmeau, T.; Chouzenoux, E.; Elvira, V. Simulated Annealing: A Review and a New Scheme. In Proceedings of the 2021 IEEE Statistical Signal Processing Workshop (SSP), Online, 11–14 July 2021; pp. 101–105. [Google Scholar] [CrossRef]
- Mirjalili, S. Moth-flame optimization algorithm: A novel nature-inspired heuristic paradigm. Knowl.-Based Syst. 2015, 89, 228–249. [Google Scholar] [CrossRef]
- Shehab, M.; Abualigah, L.; Al Hamad, H.; Alabool, H.; Alshinwan, M.; Khasawneh, A.M. Moth–flame optimization algorithm: Variants and applications. Neural Comput. Appl. 2020, 32, 9859–9884. [Google Scholar] [CrossRef]
- Zamani, H.; Nadimi-Shahraki, M.H.; Mirjalili, S.; Soleimanian Gharehchopogh, F.; Oliva, D. A Critical Review of Moth-Flame Optimization Algorithm and Its Variants: Structural Reviewing, Performance Evaluation, and Statistical Analysis. Arch. Comput. Methods Eng. 2024, 31, 2177–2225. [Google Scholar] [CrossRef]
- ASTM D638-14; Standard Test Method for Tensile Properties of Plastics. ASTM: Conshohocken, PA, USA, 2022. [CrossRef]
- Perry, S.; Rafael, R.; Huayamave, V.; Gonzalez, B.; Dae-Won, K.; Nadeau, Z. Tensile Testing of 3D Printed TPU Samples for Pediatric Biomaterial Applications. In Proceedings of the 1st International Conference of the Panamerican Society of Modeling, Methods in Engineering and Applied Sciences, PanaSoMM, Galapagos Islands, Ecuador, 22–25 May 2022. [Google Scholar]
- Raise3D Technologies Inc. Powerful 3D Slicer Software—ideaMaker®|Raise3D; Raise3D Technologies, Inc.: Irvine, CA, USA; Available online: https://www.raise3d.com/ideamaker/ (accessed on 20 October 2025).
- Tawk, C.; Alici, G. Finite Element Modeling in the Design Process of 3D Printed Pneumatic Soft Actuators and Sensors. Robotics 2020, 9, 52. [Google Scholar] [CrossRef]
- Xavier, M.S.; Fleming, A.J.; Yong, Y.K. Finite Element Modeling of Soft Fluidic Actuators: Overview and Recent Developments. Adv. Intell. Syst. 2021, 3, 2000187. [Google Scholar] [CrossRef]
- Wilcoxon, F. Probability Tables for Individual Comparisons by Ranking Methods. Biometrics. J. Int. Biom. Soc. 1947, 3, 119–122. [Google Scholar] [CrossRef]
- Wilcoxon, F. Individual Comparisons by Ranking Methods. In Breakthroughs in Statistics: Methodology and Distribution; Kotz, S., Johnson, N.L., Eds.; Springer: New York, NY, USA, 1992; pp. 196–202. [Google Scholar] [CrossRef]
- Manns, M.; Morales, J.; Frohn, P. Additive manufacturing of silicon based PneuNets as soft robotic actuators. Procedia CIRP 2018, 72, 328–333. [Google Scholar] [CrossRef]
- Hiremath, S.; Mathias, K.A.; Kim, T.W. 3D-Printed soft pneumatic actuators: Enhancing flexible gripper capabilities. Robomech. J. 2025, 12, 26. [Google Scholar] [CrossRef]
Disclaimer/Publisher’s Note: The statements, opinions and data contained in all publications are solely those of the individual author(s) and contributor(s) and not of MDPI and/or the editor(s). MDPI and/or the editor(s) disclaim responsibility for any injury to people or property resulting from any ideas, methods, instructions or products referred to in the content. |
© 2025 by the authors. Licensee MDPI, Basel, Switzerland. This article is an open access article distributed under the terms and conditions of the Creative Commons Attribution (CC BY) license (https://creativecommons.org/licenses/by/4.0/).