Abstract
Current evaluation methods for Dual-clutch Transmission (DCT) control systems typically focus on certain performance metrics while neglecting the assessment and quantitative diagnosis of system intelligence. To address this limitation, this paper employs a customized Analytic Hierarchy Process to determine the utility weights of scenario categories and scenario performance. A discrete choice model based on utility decision criteria is introduced, with the overall utility quantifying the intelligence of DCT control systems. This approach culminates in a diagnostic model for the intelligence of DCT control systems based on utility weights and the Analytic Hierarchy Process. Experimental validation involved comparative testing of two distinct DCT control systems installed on identical vehicles under multi-dimensional scenarios. Results demonstrate that the proposed model can accurately identify, analyze, compare, and evaluate the intelligence of DCT control systems. It shows broad applicability in vehicle intelligence, DCT control systems research and related fields.
1. Introduction
With technological advancements, short-distance commuting options have become increasingly diversified, with private vehicles, bike-sharing systems, and shuttle emerging as predominant modes [1,2]. In recent years, the market share of Dual-clutch Transmission (DCT) has been steadily increasing due to its advantages, such as high transmission efficiency, fast shift response, and good production compatibility with manual transmissions. DCT has now become mainstream in automatic transmission vehicles [3]. Simultaneously, modern DCT control systems are increasingly incorporating intelligent control strategies. These systems adaptively optimize DCT performance based on driver behavior characteristics and complex environmental requirements, thereby enhancing overall vehicle performance.
To promote overall vehicle performance optimization, researchers worldwide continue to prioritize the development of vehicle driving performance evaluation systems. Lu [4] proposed a subjective evaluation system for passenger vehicles, covering three aspects: drivability, shift quality, and dynamic performance, along with 24 corresponding sub-item evaluation indicators. The study also provided experimental methods for each evaluation indicator. Lei et al. [5] investigated an objective evaluation model of automatic transmission shift quality based on multi-hierarchical gray relational analysis and proposed an objective evaluation system for shift quality using MATLAB-CANoe. Huang et al. [6] proposed a driving performance evaluation model based on fuzzy dynamic weights. They evaluated driving performance under throttle conditions and identified evaluation indicators affecting driving performance during throttle application through multidimensional analysis. Based on the principles of “function-driven and difference-driven,” dynamic weights were established using an improved Analytic Hierarchy Process (AHP) and an improved entropy method. Wei et al. [7] developed an Intelligent Driving Performance Objective Evaluation Tool (I-DOET) for DCT passenger vehicles and validated it through real vehicle testing. Zhou et al. [8] proposed a novel objective evaluation method for passenger vehicle driving performance and designed an improved fuzzy comprehensive evaluation method. Wang et al. [9] integrated the AHP with the Criteria Importance Through Intercriteria Correlation (CRITIC) method to propose a comprehensive evaluation approach for autonomous vehicles, combining both subjective and objective factors. Wang [10] identified five first-level indicators, including overall vehicle intelligence, and 24 second-level indicators, such as average vehicle speed. He then constructed a comprehensive evaluation model for the performance of integrated parking and driving autonomous systems using the Analytic Network Process (ANP) and fuzzy comprehensive evaluation method. Liu [11] focused on the intelligence of Autonomous Underwater Vehicle (AUV) as the research subject. By introducing consistency testing, he addressed the issues of high uncertainty and over-reliance on dimensionless results prevalent in multi-expert weighting methods.
In summary, a growing body of research has incorporated driver intent, driving environment, and vehicle state into evaluation systems, achieving notable results. However, existing studies often limit their indicator selection and evaluation methods to assessing specific performance under particular operating conditions, neglecting the evaluation and quantitative diagnosis of DCT control system intelligence. This limitation hinders model transferability and generalizability across multi-dimensional scenarios. Therefore, it is imperative to investigate the intelligence of DCT control systems. This study begins with a theoretical analysis of DCT system dynamics and intelligence, followed by establishing a utility weight-based mathematical model. Finally, real-vehicle experiments are conducted to validate the effectiveness of the proposed diagnostic approach for assessing system intelligence across multi-dimensional scenarios.
2. DCT Control System Dynamics Model and Its Intelligence Analysis
2.1. Analysis of DCT Vehicle Transmission Model
First, the transmission system of the DCT vehicle is shown in Figure 1, which includes hardware mechanisms and the electronic control unit. The hardware mechanisms consist of the engine as the power source, the DCT composed of dual clutches and their respective gear pairs, the drive shaft, the reducer, and the wheels, among other mechanical components. The DCT gears are divided into two groups, including odd-numbered gears and even-numbered gears, which are connected to two separate clutches. The power shift process of the vehicle is achieved through pre-engagement of synchronizers. Meanwhile, the control system, composed of various electronic control units, is also an essential part of the transmission system. These electronic control units mainly include the Engine Control Unit (ECU), Transmission Control Unit (TCU), and Vehicle Control Unit (VCU), which are interconnected via CAN bus or electronic circuits [12,13,14].
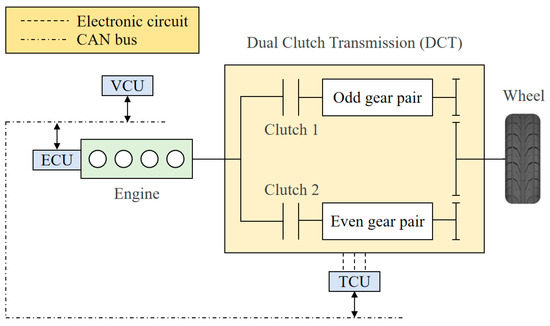
Figure 1.
The DCT vehicle transmission system.
2.2. Construction and Analysis of the Dynamics Model for the DCT Control Process
Considering that numerous components in the vehicle and their interactions will influence the DCT system. Therefore, building upon existing research [15,16,17], this paper adopts appropriate simplifications to the DCT vehicle transmission system to establish its dynamics model.
- 1.
- The system consists of elastic and inertial components with concentrated masses.
- 2.
- Torsional vibrations in the transmission system and the attenuation effects of clutch thermal dynamics are neglected.
- 3.
- The elasticity between bearings, gears, and their related components is ignored.
- 4.
- System backlash and the engagement process of synchronizers are neglected.
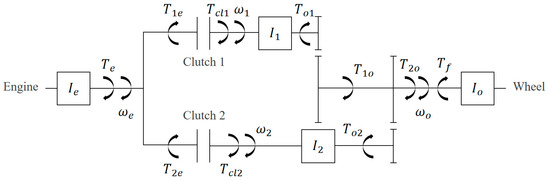
Figure 2.
Dynamic model of the DCT system [18].

Table 1.
Relevant parameters of DCT control system.
To establish a comprehensive dynamics model for the DCT system, existing research [17] is referenced, and the construction of the clutch torque transmission model and the vehicle load model during operation is approached from two perspectives: the clutch itself and the external working environment of the DCT vehicle. Additionally, referencing existing studies [13,19], the control strategies for starting and gear-shifting conditions are identified as key technologies in DCT control system research. Below, the preliminary construction and analysis of the dynamics model are conducted from these four aspects.
- 1.
- Dynamics Analysis of the Clutch Torque Transmission Model
The DCT transmits torque through the coordinated operation of two clutches. For the hardware subject of this diagnostic study, namely the wet 7-speed DCT, during gear shifts, the DCT control system adjusts the oil pressure, which in turn changes the piston pressure. This ultimately results in variations in the frictional torque between the driving and driven plates. Therefore, the clutches in the DCT can exist in two states: non-contact and contact. In the non-contact state, the clutches do not transmit torque. In the contact state, there are two sub-states: sliding friction and lock-up. In the sliding friction state, there is a difference in rotational speed between the driving and driven plates, and torque is transmitted through sliding friction. The dynamics equation for this state is shown in Equation (1). The main factors influencing the transmitted torque , include the dynamic friction coefficient , the surface area of the friction plates , the pressure on the friction plates , the number of friction surfaces , and the outer diameter and inner diameter of the friction plates.
In the lock-up state, the rotational speeds of the driving and driven plates remain synchronized, and torque is transmitted through static friction. The dynamics equation for this state is shown in Equation (2). In addition to the parameters of the friction plates mentioned above, the maximum static friction torque capacity of the clutch is also influenced by the static friction coefficient .
- 2.
- Dynamics Analysis of Vehicle Load During Operation
During operation, a DCT vehicle continuously needs to overcome various external resistances. The sources of these loads primarily include rolling resistance, gradient resistance, aerodynamic resistance, and acceleration resistance. Therefore, the total resistance equation during vehicle operation can be expressed as shown in Equation (3).
In the equation, represents the total resistance, is the aerodynamic resistance, is the rolling resistance, is the gradient resistance, and is the acceleration resistance. is the aerodynamic resistance coefficient, is the frontal area of the DCT vehicle, is the slope angle, is the velocity of the DCT vehicle, is the acceleration of the DCT vehicle, is the gravitational force of the DCT vehicle, is the rolling resistance coefficient of the road, is the rotational mass conversion factor, and and are the curb mass and loaded mass of the DCT vehicle, respectively.
- 3.
- Dynamics Analysis of the DCT Starting Process
Referencing existing research literature [15,20,21], the starting process of a DCT can generally be divided into three stages: the free travel stage, the slip friction stage, and the synchronization completion stage. The free travel stage occurs at the beginning of the starting process, where the driving plate of the clutch is pushed and rapidly moves toward the driven plate, but the two have not yet engaged. During the free travel stage, the clutch does not transmit torque. This stage occupies a relatively small portion of the starting process, but a prolonged free travel stage can affect the dynamic response of the DCT vehicle during starting.
The slip friction stage is the most critical phase of the DCT starting process. During this stage, the driving plate and driven plate of the DCT begin to contact and experience relative sliding friction, gradually progressing to synchronized rotational speeds. In the slip friction stage, performance adjustments of the DCT can be achieved by controlling the engagement process, rotational speed, and torque of the driving plate. According to the starting process model established by Wang Mengmeng [15], the dynamics equation for the slip friction stage is shown in Equation (4). In the equation, is the final drive ratio, and is the gear ratio of the odd-numbered clutch.
The synchronization completion stage is the phase where the rotational speeds of the driving plate and driven plate of the clutch become unified, marking the stable operation of the starting process. The dynamics equation for this stage is shown in Equation (5).
- 4.
- Dynamics Analysis of the DCT Gear-Shifting Process
Referencing existing research literature [16,17,20], the gear-shifting process of a DCT can be divided into two types: upshifting and downshifting. A single gear-shifting process typically consists of four stages: the pre-shift stage, the torque phase, the inertia phase, and the synchronization stage. Among these, the DCT operates stably during the pre-shift and synchronization stages, so the focus of analysis is on the torque phase and inertia phase. The sequence of the torque phase and inertia phase differs between upshifting and downshifting processes. Taking the upshifting process of a DCT vehicle as an example, the dynamics models of the torque phase and inertia phase are analyzed below.
During the torque phase of the DCT upshifting process, the clamping force on clutch C1 begins to decrease, but the gear ratio of the transmission remains unchanged. At this stage, the engine speed and the speed of clutch C1 remain equal. Both clutches C1 and C2 bear frictional torque, but the torque on C1 gradually decreases to zero, while the torque on C2 increases until it reaches the target torque of the next gear. The dynamics equation for this stage is shown in Equation (6).
In the inertia phase of the upshifting process, the clamping force on clutch C1 further decreases, while the clamping force on C2 continues to increase. The gear ratio of the transmission begins to change, gradually shifting to the gear ratio of the next gear. During this phase, the frictional torque on C1 has already dropped to zero, and the speed of C2 approaches synchronization with the engine speed. Therefore, torque is transmitted through C2 in this phase. The dynamics equation for this stage is shown in Equation (7).
Based on the dynamic analysis of the DCT control process, it is evident that the core of DCT control lies in the precise regulation of clutch torque transmission, as well as clutch control during vehicle launch and gear shifting. These aspects are directly related to vehicle dynamics and smoothness, respectively. Consequently, the specific association between DCT performance and the DCT control system can be clearly established.
2.3. Definition for the Intelligence of DCT Control Systems
Currently, a universally accepted definition of “intelligence” has not yet been established in academia, but it has already found preliminary and widespread applications in the fields such as vehicle engineering and urban planning [22]. In China, vehicle intelligence refers to machine intelligence applied to specific vehicle-related activities, such as autonomous navigation, powertrain control, and obstacle avoidance [23]. Some existing studies [24,25] categorize the key technologies of vehicle intelligence into three major fields: intelligence of perception and positioning systems, intelligence of decision-making and control systems, and intelligence of safety systems.
For DCT vehicles, their core feature compared to other types of vehicles lies in the DCT hardware structure and its control system. By accurately identifying and analyzing the surrounding scenario and the driver’s operational intent, the system makes decisions and precisely adjusts various parameters of the transmission system to achieve superior DCT performance, vehicle handling, and driving experience. This control process also reflects the “vehicle intelligence,” integrating the intelligence of perception systems and decision-making and control systems, which are two key technologies of vehicle intelligence [26].
As shown in Figure 3, based on an analysis of the studies on DCT system control strategies, existing DCT control systems have incorporated the identification of driver intent, vehicle operating conditions, and driving environment into their algorithms. They can optimize the clutch engagement control process using intelligent control algorithms, ultimately improving the performance of the DCT system and the full vehicle. This entire control process encompasses the three stages of “intelligence”: perception, decision-making, and execution. Therefore, it can be concluded that the control strategies adopted by DCT control systems and the operations performed by the control execution mechanism demonstrate the presence of intelligence in DCT control systems. Although the internal intelligent decision-making process of the control system can be regarded as a black box, the intelligence can still be researched by testing the outcomes of the actuator operations.
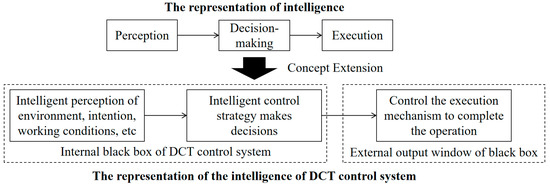
Figure 3.
The representation of the intelligence of DCT control system.
Figure existing studies on intelligent systems, it is understood that an “intelligent” system should possess both systematicity and independence. “Systematicity” refers to the fact that intelligence is not an isolated product or tool, but a complex system formed by the interaction and coordination of multiple aspects and capabilities. This requires that the object of evaluation possess the three fundamental systemic abilities of perception, decision-making, and execution. On the other hand, “independence” means that an intelligent system should be able to exist relatively independently within an application scenario and demonstrate its value and functionality [27].
Therefore, only an intelligent control algorithm for DCT or a segment of TCU program code cannot be regarded as an “intelligent” system. When the intelligent control algorithm is applied to a DCT vehicle, and the DCT vehicle achieves control behaviors during operation under the target conditions of the DCT control system, can it be regarded as “intelligence of the DCT control system.” Consequently, diagnosing the intelligence of the DCT control system cannot be performed in isolation. Instead, the DCT control system must be integrated into the full DCT vehicle and considered within the multi-dimensional scenarios of “driver-vehicle-road.” This is achieved by testing the perception and decision-making of the DCT control system in multi-dimensional scenarios and then optimizing the performance of the DCT through control adjustments to enhance the driving experience.
Based on the above analysis, influential parameters that reflect the control process, DCT performance, and multi-dimensional scenarios of the DCT vehicle control system can be obtained, as shown in Table 2. Using these parameters as inputs to the model helps to further improve the model’s accuracy and interpretability, ensuring that the evaluation results align more closely with subjective experiences and real conditions.
Table 2.
Influential parameters for DCT control system.
3. Analysis and Construction of Diagnosis Model for the Intelligence of DCT Control Systems
3.1. Analysis of Diagnostic Principle and Function Construction for the Intelligence
Based on the analysis of the intelligence of DCT systems, it is evident that the intelligence of DCT control systems is reflected in perception of multi-dimensional scenarios and ability to make decisions and execute optimal control strategies to achieve the best DCT performance. From the perspective of design and development, the purpose of DCT control system intelligence is to enhance the driver’s subjective experience and improve the overall performance of the vehicle. Therefore, the performance evaluation results of DCT vehicles in different scenarios can be used to research the intelligence of DCT control systems. In summary, the diagnostic principles for intelligence can be constructed as shown in Figure 4.
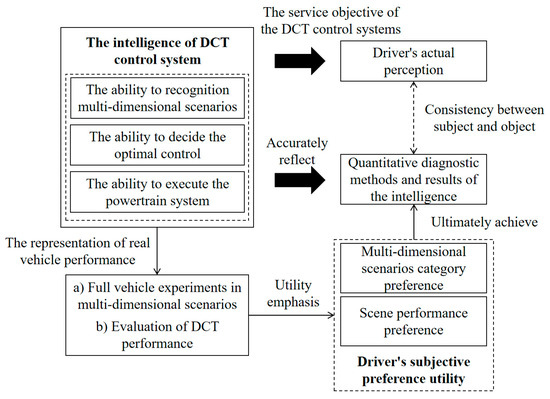
Figure 4.
Analysis of diagnostic principles for intelligence of DCT control systems.
By analyzing the three aspects of DCT control system intelligence, it is clear that the optimal control strategies vary across different scenarios to achieve the best performance. After analysis, DCT performance can be defined by driving dynamics and smoothness. Meanwhile, the importance of driving dynamics and smoothness differs across scenarios. For example, in flat environments or when the driver starts with a light throttle, smoothness dominates as the key factor. Conversely, in slope environments or when starting with an urgent intent, the importance of driving dynamics outweighs smoothness.
Additionally, the importance of multi-dimensional scenarios also varies. For instance, in terms of driving environments, users in the eastern plains have less demand for slope-related performance, while users in the hilly and mountainous regions of central and western China have higher demands for slope performance. Generally speaking, younger drivers, due to their aggressive driving habits, pay more attention to the vehicle’s response characteristics under urgent intents, whereas older drivers prefer the vehicle’s performance under gentle intents. These preferences can be categorized as driver subjective preference utilities, including scenario category preferences and scenario performance preferences.
Clearly, a DCT control system with sufficient intelligence must first be able to identify the aforementioned different scenarios. Second, it needs to implement differentiated and targeted control strategies for these scenarios. Finally, it must accurately execute commands by controlling the transmission system to prioritize and adjust DCT performance in terms of driving dynamics and smoothness. Since it is difficult to directly monitor or manipulate the perception and decision-making processes of the control system program during vehicle testing and diagnosis, the key to diagnosing the intelligence of the DCT control system lies in the execution process and its outcomes, i.e., the DCT performance evaluation results under multi-dimensional scenarios.
In summary, the intelligence of the DCT control system can be quantitatively defined in testing and diagnosis as the ability of the DCT control system to exhibit demand-oriented DCT performance in multi-dimensional scenarios. Specifically, “demand-oriented” refers to the ability to prioritize either driving dynamics or smoothness, as well as to adapt to the varying emphases of multi-dimensional scenarios. Therefore, the intelligence function can be expressed as shown in Equation (8), where the intelligence diagnosis result is derived from the DCT performance evaluation results and the multi-dimensional scenario factors Scene.
To further quantify this, the intelligence diagnosis result is obtained by applying the function to the driving dynamics evaluation result and the smoothness evaluation result for a specific vehicle model and DCT control strategy under the -th driving intent, -th vehicle condition, and -th road environment. Since this involves experiments under multi-dimensional scenarios, the overall evaluation results for driving dynamics and smoothness in a specific scenario are calculated as shown in Equations (9) and (10). In these equations, represents the -th driving intent, represents the -th vehicle condition, and represents the -th road environment.
3.2. Establishment of Weight Matrices Based on the AHP
In the model computation process, the actual values of the two types of weight matrices, scenario performance weights and scenario category weights, exhibit strong subjectivity, personalization, and customization characteristics. Different types of user groups often have varying preferences for control system performance and scenarios. Therefore, the AHP is adopted to determine the relevant weights. The flowchart of the AHP is shown in Figure 5.
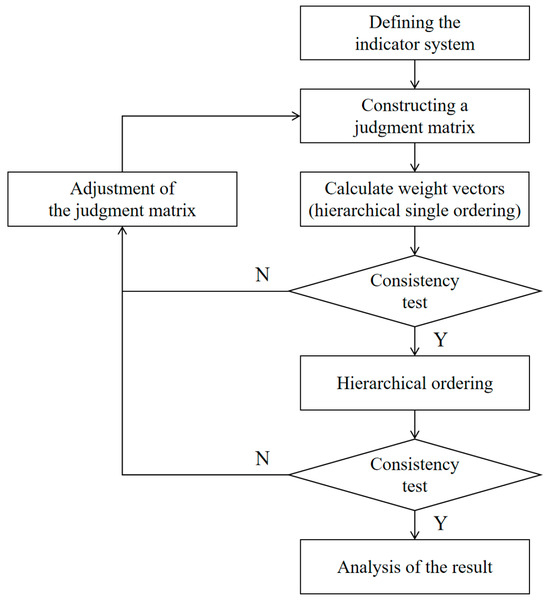
Figure 5.
AHP flowchart.
Based on the analysis in Section 2.2, DCT performance in multi-dimensional scenarios reflects vehicle performance under the influence of the DCT control system, primarily encompassing dynamics and smoothness. According to the analysis in Section 2.3 and Section 3.1, multi-dimensional scenario categories should be established based on the “driver-vehicle-road” interaction relationship. This involves defining three criteria: “driving intention,” “operating conditions,” and “driving environment.” Furthermore, by referencing existing literature [28,29,30], the sub-criteria layer of the indicator system can be constructed. Therefore, the indicator system for determining scenario performance weights and scenario category weights is shown in Figure 6.
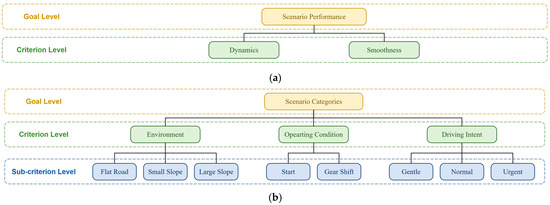
Figure 6.
AHP index system: (a) scenario performance; (b) scenario categories.
During the statistical analysis of the importance of different scenario categories, direct comparisons between refined scenario categories proved challenging. For example, it is difficult to directly compare “gentle start on a small slope” with “general gear shift on a large slope”. Therefore, the computation of scenario category weights was divided into three steps: first, computing the category weights of driving intents under specific environments and conditions; second, computing the weights of conditions and the weights of environments; final, synthesizing the weights of scenario categories.
Taking the “gear shift on a large slope” condition as an exemplary scenario to determine the weights of driver intent category, a judgment matrix is constructed based on multi-round expert questionnaire surveys.
This matrix indicates that, under this operating condition, a gentle intent is equally important as a normal intent, a gentle intent has a slight preference over an urgent intent, and a normal intent is equally important as an urgent intent.
Matrix is then column-normalized, followed by row summation. The resulting row sum vector is subsequently normalized to obtain the relative weight vector . This process is known as hierarchical single ordering, with its calculations detailed in Equations (12)–(14).
Next, a consistency test is performed on . The maximum eigenvalue , the consistency index , and the consistency ratio are calculated sequentially. The average random consistency index is 0.52.
Following the consistency check, the constructed judgment matrix is verified to be free of logical contradictions, confirming the rationality and credibility of the calculated weights. Driver intent category weights under other environments, further operating condition category weights, environmental category weights, and the final scenario category weights and scenario performance weights are all integrated and derived using AHP. It should be noted that for scenario performance weights, since only two indicators, dynamics and smoothness, are considered, the constructed judgment matrix is of second order. Consequently, the consistency ratio is consistently 0, which means the advantage of using the AHP is not significant. However, this paper adopts AHP to maintain procedural uniformity with the more complex scenario category weight calculations, thereby ensuring the consistency of the entire model methodology.
To facilitate discussion and computation, preliminary background settings were applied to the multi-dimensional scenario categories. For instance, only uphill conditions were considered for slope environments. After multiple rounds of AHP questionnaire surveys and data analysis, the statistical results for weights of scenario performance and weights of scenario categories were compiled, as, respectively, shown in Figure 7 and Figure 8.
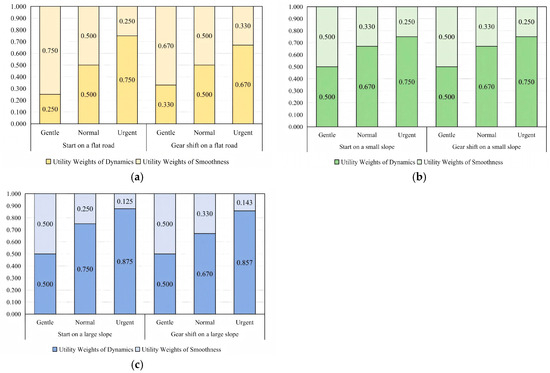
Figure 7.
Weights of scenario performance: (a) flat road; (b) small slope; (c) large slope.
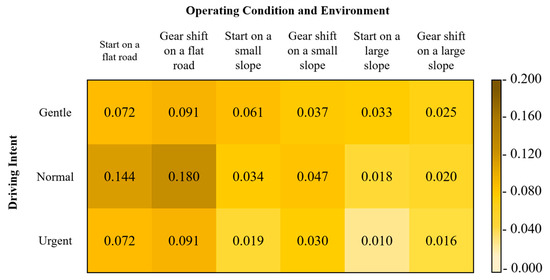
Figure 8.
Weights of scenario categories.
3.3. Construction of the Intelligence Diagnosis Model Based on Utility Weights
Based on the aforementioned analysis of the diagnostic principles for DCT control system intelligence and the constructed intelligence function expression, mathematical principles can be further applied to interpret the intelligence function, thereby establishing the mathematical computation function for intelligence. Considering the characteristics of DCT vehicles and the influence of driver subjective preferences on intelligence during driving, the Discrete Choice Model is adopted, and the utility decision criterion is used to achieve specific computations for intelligence.
The Discrete Choice Model (DCM), also known as the choice-based conjoint analysis model, is widely used in new product development, product quality evaluation, and market analysis. It is a research method rooted in psychology and sociology. Its core lies in simulating the competitive market environment of the product or service under study through experimental design, thereby measuring user preferences and inclinations. This allows researchers to understand how users make choices under different attribute levels and price conditions of products or services. The components of the DCM include decision-makers, choice sets, attributes of alternatives, and decision criteria [31,32,33,34].
By integrating the DCM with the diagnosis of DCT control system intelligence, the decision-makers are the vehicle users, the choice sets are different DCT control systems and control strategies, and the attributes of alternatives are the DCT performance evaluation results under multi-dimensional scenarios. The overall model can be described as users evaluating, selecting, and deciding to purchase DCT control systems in the market based on their preferences and the performance of DCT systems under multi-dimensional scenarios. In this discrete choice process, DCT control systems with higher levels of intelligence can better align with users’ practical preferences, selectively demonstrating their performance in multi-dimensional scenarios, and ultimately achieving a higher status in users’ minds. This is reflected in the data as obtaining more prioritized discrete choice results.
Among the decision criteria of the DCM, different criteria such as dominance criterion, threshold criterion, lexicographic criterion, and utility decision criterion are often adopted based on the attributes of the alternatives [35,36]. The dominance criterion and threshold criterion refer to users having specific upper or lower limits for a certain attribute and making decisions based on these requirements. The lexicographic criterion involves ranking the attribute values in a specific order and determining the ranking of alternatives accordingly. However, since users’ subjective experience of DCT vehicles in multi-dimensional scenarios is a highly complex decision-making process, it cannot be quantified into simple decision steps. Therefore, such decision criteria are difficult to apply.
On the other hand, the utility decision criterion makes decisions based on the overall utility of each alternative across all attribute dimensions [37,38,39]. Utility refers to a measure of how users’ needs and desires are satisfied through the use, enjoyment, or experience of the alternatives. It can also be described as the degree of satisfaction users derive from a specific dimension. In the DCM under the utility decision criterion, represents the utility of individual choosing alternative , as shown in Equation (19). In the equation, represents the utility of alternative on the -th attribute from the perspective of individual , and represents the weight of the -th attribute relative to the overall attributes of the alternatives.
In the studies on DCT control system evaluation, the subjective evaluation results of DCT performance in a specific scenario, as well as the objective evaluation results under the condition of achieving subjective-objective consistency, can be used as the calculation method for utility in that scenario. This utility represents the measure of user satisfaction in that scenario. Therefore, the DCT performance evaluation results under multi-dimensional scenarios can be combined with users’ preferences for these scenarios to perform utility calculations across multi-dimensional scenarios. This ultimately yields the overall discrete choice results of users for that type of DCT control system.
Based on the mathematical principles of the DCM and the utility weight criterion discussed above, the construction of the diagnostic model for the intelligence of DCT control systems can be carried out.
First, the performance utility in a specific scenario is calculated. Using the objective evaluation results of DCT performance in that scenario as the attributes of the alternatives, can derive Equation (20). In the equation, represents the utility weight matrix for driving dynamics and smoothness in that subdivided scenario, i.e., the utility weight matrix of scenario performance.
After obtaining the utility weight for each scenario, the overall utility is used as a measure of the intelligence of the DCT control system. By treating the performance utility values in each scenario as the attributes of the alternatives and combining Equations (19) and (20), can derive the overall utility calculation equation shown in Equation (21). In the equation, represents the utility weight matrix of scenario performance under multi-dimensional scenarios, and represents the utility weight matrix of scenario categories.
From Equations (8)–(10) and Equations (19)–(21), the diagnostic model for the intelligence of DCT control system and its mathematical formulation are ultimately established.
4. Experiments and Analysis
4.1. Construction of the Integrated Testing System for DCT Vehicle Driving Data
The experimental subject of this study is a sport utility vehicle (SUV) model equipped with a DCT, designed, developed, and mass-produced by an automotive manufacturer. The DCT has 7 gears, and its relevant hardware configuration values are listed in Table 3.
Table 3.
Hardware configuration values of the experimental DCT vehicle.
Based on the different sources and accuracy requirements of influential parameters in Table 2, they are divided into two categories: vehicle speed and longitudinal acceleration signals (obtained from an external sensor, Speedbox-Mini) and vehicle CAN signals (acquired from the onboard ECU/TCU). On this basis, the technical solution for constructing an integrated data testing system is developed [40], as shown in Figure 9.
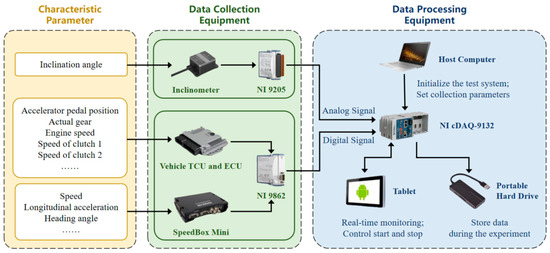
Figure 9.
Technical solution of the integrated data test system.
4.2. Experiment Design for DCT Vehicles Based on Multi-Dimensional Scenarios
For the experiments conducted under actual road conditions for DCT vehicles, the multi-dimensional scenarios and some special complex driving intents were comprehensively considered. The experiments were designed into 2 major categories and 8 subcategories, as shown in Table 4. The actual road areas covered various environments that users frequently encounter during daily use of DCT vehicles, such as urban areas and suburban expressways. Additionally, under real traffic conditions, the experimental data naturally included various operating conditions of the DCT vehicle and different types of driver intents. To address the differences in road slopes, three subcategories of actual road slope conditions were specifically proposed, and further experimental tests were conducted on different slopes.
Table 4.
The actual road experimental plan for the DCT vehicle.
After completing the actual road experiments, a vast amount of DCT vehicle driving data was obtained. To address the randomness of these driving data and the chaotic distribution of subdivided scenarios, standardized field experiments were conducted to simulate some representative scenarios under actual road conditions. Subjective evaluations were also carried out simultaneously.
For the field experiments on DCT vehicles, this study proposes 3 major categories, totaling 10 subcategories of experiments, as shown in Table 5. Among them, the experiments conducted on straight roads include starting and gear-shifting. The starting experiments cover scenarios with constant intents and intent changes, while the gear-shifting experiments comprehensively reflect various types of gear-shifting situations. During the maintained operating condition, the DCT system does not intervene, so this condition is only used for comparing and recording the performance baseline of the DCT vehicle and is not actually applied in the evaluation system. Based on existing standards and the classification of actual road slopes [20,41], two types of slopes, small slope (2%, approximately 1.15°) and medium slope (8%, approximately 4.57°), were selected for the field experiments. Starting and gear-shifting experiments were conducted on these slopes. Considering the specific challenges of driving on slopes, which makes complex experimental operations inconvenient, the experimental categories for slope conditions were simplified.
Table 5.
Standardized field experiment plan for the DCT vehicle.
In the aforementioned field experiments, the subjective scoring criteria and standards are based on two aspects. On one hand, they are based on industry norms and standard documents for current vehicle performance and vehicle testing subjective evaluation. On the other hand, they are based on expert knowledge and prior experience, i.e., the understanding and insights of subjective evaluation engineers from the project partner’s vehicle manufacturer regarding DCT performance and the control processes of DCT control systems.
4.3. Results Analysis
Following the experimental procedures described above, performance testing and evaluation experiments were conducted on the same DCT vehicle equipped with two different DCT control systems and corresponding strategies under multi-dimensional scenarios.
One control system is the DCT control system and corresponding strategy developed by an automotive manufacturer through laboratory research, calibrated through real-vehicle field experiments, and ultimately deployed in mass-produced vehicles. This system is referred to as strategy A1 in this paper. The other control system is the DCT control system and corresponding strategy optimized by a domestic university laboratory using intelligent identification and control algorithms, based on simulations and improvements over traditional control strategies. This system is referred to as strategy A2 in this paper.
After experiments, the DCT performance of the vehicle equipped with A1 and A2 was evaluated using the DCT performance evaluation model based on LSTM neural network with attention mechanism [18]. The evaluation results are shown in Figure 10. The scoring results indicate that the A1 and A2 each have their own strengths and weaknesses in terms of driving dynamics and smoothness. Taking the starting condition under gentle intent as an example, on a flat road, the A1 outperforms the A2 in dynamics but is inferior in smoothness; however, the opposite is true on a small slope. This is because the tested DCT vehicle and its powertrain hardware conditions remained consistent; there is no scenario where one strategy significantly outperforms the other.
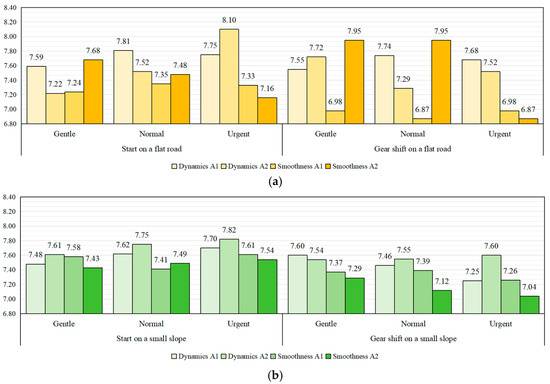
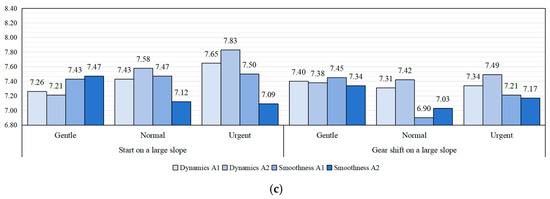
Figure 10.
Evaluation results for the vehicle equipped with A1 and A2 in multi-dimensional scenarios: (a) flat road; (b) small slope; (c) large slope.
After obtaining the evaluation results, the utility weights of scenario performance and utility weights of scenario categories were used for analysis. The derived results are presented in Figure 11. Taking the flat-road starting condition as an exemplary scenario, the average evaluation results for A1 and A2 are calculated, and the scenario performance utilities are computed using Equation (20) in conjunction with Figure 7 and Figure 10.
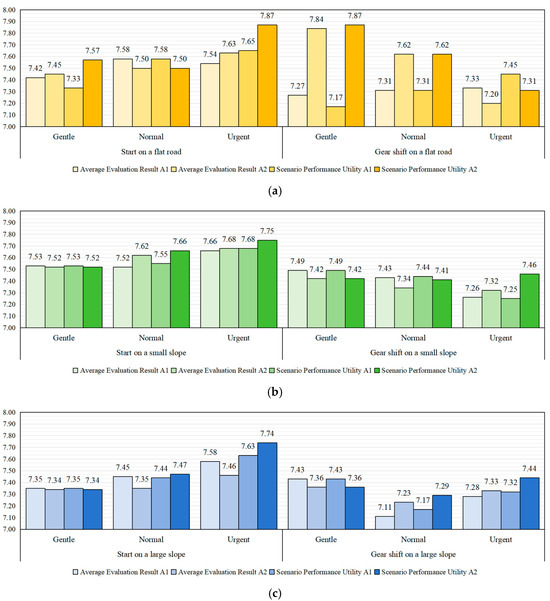
Figure 11.
Results of scenario performance utility under multi-dimensional scenarios: (a) flat road; (b) small slope; (c) large slope.
It can be observed that, without applying the weights, the average evaluation results for driving dynamics and smoothness of A1 and A2 are quite similar, with differences within a range of 0.1 points. A detailed analysis reveals that A1 maintains relatively consistent driving dynamics and smoothness across different intents, while A2 achieves dynamic regulation and enhancement of driving dynamics as the intents become more aggressive. This regulation aligns with the direction of the scenario performance utility weights. As a result, in terms of scenario performance utility, A2 significantly outperforms A1, demonstrating that the scenario performance utility calculation accurately describes the intelligence of the DCT control system.
Based on the scenario performance utility values, further weighted calculations were performed using the scenario category utility weights to obtain the overall utility values for the two control systems, A1 and A2. These overall utility values represent the quantitative diagnostic results of their respective intelligence, as shown in Figure 12. Additionally, the average evaluation results of DCT performance under each scenario were used to calculate an overall average, serving as the overall average result of the control strategies. This overall average was then compared with the intelligence diagnostic results of the DCT control systems.
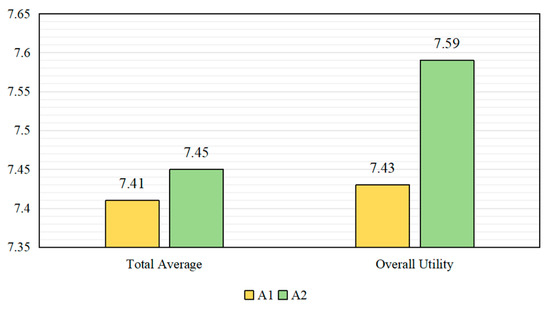
Figure 12.
Comparison between total average evaluation result and overall utility.
The final results show that the performance scores of the two control strategies, based on the overall average evaluation, are extremely close, with a difference of less than 0.05 points. Through certain optimization adjustments, A2 achieved a slight performance lead, but this does not fully reflect the intelligence advantage of A2 over A1. Furthermore, in subjective evaluation experiences, since the DCT performance under the control of both systems has its strengths and weaknesses in driving dynamics and smoothness across different scenarios, the subjective evaluation results also struggle to highlight the differences between the two.
However, in the intelligence diagnostic of the DCT control system, by analyzing the overall utility diagnostic results, it can be observed that A2 has a significant advantage in intelligence over A1, with a difference exceeding 0.15 points. Compared to traditional average performance evaluation methods, this model improves recognition accuracy by fourfold. The discrepancy between the results of the two evaluation methods primarily stems from the targeted optimization of the two control strategies for different scenarios. Specifically, A1 demonstrates relatively stable performance in driving dynamics and smoothness across various scenarios, exhibiting a more balanced performance. In contrast, A2 shows a more pronounced performance focus tailored to different scenarios. Compared to the A1, its specific enhancements include the integration of intelligent algorithms for driving intent and driving environment recognition in the TCU, the construction of a data-driven model for DCT vehicle starting and gear-shifting, and the development of adaptive optimization control algorithms based on fuzzy logic for scenarios such as starting and gear-shifting under different intents to achieve better control performance [15,17]. This reflects A2’s higher level of intelligence in perceiving and adapting to external conditions.
In summary, the objective evaluation results of DCT performance obtained from real-vehicle experiments demonstrate that A2 exhibits stronger driving dynamics when the scenario performance utility weights prioritize driving dynamics and stronger smoothness when the weights prioritize smoothness. This aligns with the previously defined concept of DCT control system intelligence. Consequently, the quantitative diagnostic results of intelligence (overall utility) accurately reflect the differences in intelligence. Therefore, the diagnostic model for the intelligence of DCT control systems based on utility weights and the AHP can achieve accurate identification, analysis, comparison, and evaluation of DCT control system intelligence. Additionally, the diagnostic process exhibits strong interpretability, making it widely applicable in vehicle intelligence, DCT control systems research and related fields.
5. Conclusions
This paper defines the intelligence of DCT control systems and further employs a customized AHP to measure the utility weights of scenario categories and scenario performance. By integrating a DCM based on the utility decision criterion, the intelligence of the DCT control system is quantified through the calculation of total utility, thereby establishing a diagnostic model for DCT control system intelligence based on utility weights. Through real vehicle experiments, the model clearly identifies the difference in intelligence between the intelligently optimized strategy A2 and the mass-produced strategy A1, demonstrating more significant results compared to traditional average performance methods. This validates that the model can effectively evaluate the intelligence of DCT control systems, with higher sensitivity in diagnosing their intelligence, and exhibits sound scientific and practical value.
Compared to existing vehicle performance evaluation methods, this model not only integrates the DCM utility decision criterion to enhance the objectivity of evaluation but also achieves an optimization from evaluating single performance under individual scenarios to multi-performance under multi-dimensional scenarios. Meanwhile, the introduction of user preferences and scenario weights more comprehensively reflects the intelligence of DCT control systems in practical use. Furthermore, unlike conventional studies, this paper focuses specifically on the DCT control system rather than overall vehicle performance. As a result, the proposed diagnostic model for intelligence exhibits better transferability and applicability. Particularly with the rapid development of new energy vehicles and intelligent driving technologies, the utility weight-based evaluation framework for intelligence proposed in this paper can be extended to assess the intelligence of other vehicle subsystems, such as intelligent suspension systems and intelligent steering systems, thereby advancing research on intelligent chassis control systems. Applying the intelligence evaluation model to these subsystems can further optimize vehicle control strategies, improve system performance, and enhance user experience.
Author Contributions
Conceptualization, M.C.; methodology, M.C.; software, M.C. and Z.X.; validation, M.C. and Z.X.; formal analysis, M.C.; investigation, M.C. and Z.X.; resources, H.L.; data curation, Z.X.; writing—original draft preparation, M.C.; writing—review and editing, H.L., M.C. and Z.X.; visualization, M.C.; supervision, M.C. and H.L.; project administration, M.C.; funding acquisition, H.L. All authors have read and agreed to the published version of the manuscript.
Funding
This research was funded by the National Natural Science Foundation of China, grant number U1764259.
Data Availability Statement
The data presented in this study are available on request from the corresponding author. The data are not publicly available due to privacy and confidentiality concerns related to the participants involved in the research.
Conflicts of Interest
The authors declare no conflicts of interest.
Abbreviations
The following abbreviations are used in this manuscript:
| DCT | Dual-clutch Transmission |
| AHP | Analytic Hierarchy Process |
| ECU | Engine Control Unit |
| TCU | Transmission Control Unit |
| VCU | Vehicle Control Unit |
| CAN | Controller Area Network |
| DCM | Discrete Choice Model |
References
- Lu, K.-F.; Liu, Y.; Peng, Z.-R. Unraveling urban bike-sharing dynamics: Spatiotemporal imbalances in bike rentals and returns in Washington D.C. Cities 2025, 162, 105967. [Google Scholar] [CrossRef]
- Liu, Y.; Lu, K.; Peng, Z.-R.; Zhai, W. Autonomous shuttle acceptance in an American suburban context: A revealed preference study in Lake Nona, Florida. Travel Behav. Soc. 2024, 37, 100865. [Google Scholar] [CrossRef]
- China Association of Automobile Manufacturers; China Automotive Technology and Research Center Co., Ltd.; Beijing Automotive Group Co., Ltd. Automotive Industry Blue Book: Annual Report on China’s Automotive Industry Development (2023); Social Sciences Academic Press: Beijing, China, 2023. [Google Scholar]
- Lu, C. Research on the Construction and Optimization of Dynamic Models Based on Subjective Evaluation of Passenger Vehicles. Master’s Thesis, Tongji University, Shanghai, China, 2018. [Google Scholar]
- Lei, Y.; Zhang, Y.; Fu, Y.; Wang, L.; Zhang, L. Objective Evaluation Model of Automatic Transmission Shift Quality Based on Multi-Hierarchical Grey Relational Analysis; SAE International: Warrendale, PA, USA, 2018. [Google Scholar]
- Huang, W.; Liu, H.J. Application of fuzzy dynamic weights drivability evaluation model in tip-in condition. J. Vib. Control 2019, 25, 9. [Google Scholar] [CrossRef]
- Zhou, W.; Guo, X.; Pei, X.; Zhang, C.; Xia, J. Objective Evaluation of Drivability in Passenger Cars with Dual-Clutch Transmission: A Case Study of Static Gearshift Condition. Math. Probl. Eng. 2020, 2020, 2061083. [Google Scholar] [CrossRef]
- Zhou, W.; Guo, X.; Zhang, C.; Yan, J.; Xia, J. A novel objective evaluation method of drivability for passenger cars considering subjective and objective consistency. Proc. Inst. Mech. Eng. Part D J. Automob. Eng. 2023, 237, 607–621. [Google Scholar] [CrossRef]
- Wang, W.; Wu, L.G.; Li, X.; Qu, F.F.; Li, W.B.; Ma, Y.Y.; Ma, D.H. An Evaluation Method for Automated Vehicles Combining Subjective and Objective Factors. Machines 2023, 11, 597. [Google Scholar] [CrossRef]
- Wang, Y. Comprehensive Performance Evaluation of Autonomous Driving Products with Integrated Driving and Parking for Company A. Master’s Thesis, Zhejiang University, Hangzhou, China, 2024. [Google Scholar]
- Liu, C. Research on AUV Intelligence Evaluation Index System and Evaluation Method. Master’s Thesis, Harbin Engineering University, Harbin, China, 2022. [Google Scholar]
- Matthes, B. Dual Clutch Transmissions—Lessons Learned and Future Potential. SAE Trans. 2005, 114, 941–952. [Google Scholar]
- Wu, G.; Yang, W.; Qin, D. Key technologies of control system for dual clutch transmission. J. Mech. Eng. 2007, 43, 13–21. [Google Scholar] [CrossRef]
- Jiang, L. Modern Automotive Technology, 3rd ed.; Peking University Press: Beijing, China, 2018. [Google Scholar]
- Wang, M. Intelligent Launch Control of Dual Clutch Transmission Based on Data-Driven Approach. Master’s Thesis, Chongqing University, Chongqing, China, 2020. [Google Scholar]
- Liu, Y. Research on Integrated Matching Control of Passenger Car Dual Clutch Automatic Transmission System. Ph.D. Thesis, Chongqing University, Chongqing, China, 2010. [Google Scholar]
- Wan, Y. Research on Intelligent Shift Control of DCT Based on Data-Driven Approach. Master’s Thesis, Chongqing University, Chongqing, China, 2020. [Google Scholar]
- Xu, Z.Y.; Liu, H.J. Research on the DCT vehicle starting process evaluation based on LSTM neural network with attention mechanism. J. Mech. Sci. Technol. 2024, 38, 4743–4756. [Google Scholar] [CrossRef]
- Liu, Z.; Qin, D.; Ye, M.; Hu, J. Research progress analysis of dual clutch automatic transmission technology for vehicles. Trans. Chin. Soc. Agric. Mach. 2005, 36, 167–170. [Google Scholar]
- Xing, Z. Analysis and Evaluation of DCT Control Quality Considering Driving Intention and Driving Environment. Master’s Thesis, Tongji University, Shanghai, China, 2022. [Google Scholar]
- Sun, Y. Research on Shift Model and Shift Quality Evaluation System of Six-Speed DCT. Master’s Thesis, Hefei University of Technology, Hefei, China, 2015. [Google Scholar]
- Peng, Z.-R.; Lu, K.-F.; Liu, Y.; Zhai, W. The Pathway of Urban Planning AI: From Planning Support to Plan-Making. J. Plan. Educ. Res. 2023, 44, 2263–2279. [Google Scholar] [CrossRef]
- Ma, Y.; Yang, X.; Li, R.; Tian, H. Intelligent and Connected Vehicle Testing and Evaluation Technology; China Communications Press: Beijing, China, 2022. [Google Scholar]
- Mao, C.; Mang, X. Intelligent Control-Based Vehicle Technology: Principles and Applications; Central South University Press: Changsha, China, 2021. [Google Scholar]
- Yu, X. Research and Development of China’s Strategic Emerging Industries: Intelligent Vehicles; China Machine Press: Beijing, China, 2020. [Google Scholar]
- Zhao, X.; Guo, W.; Li, L.; Guan, L. Intelligent Vehicle Measurement and Control Technology; China Communications Press: Beijing, China, 2022. [Google Scholar]
- Zhang, X. How Cars Become Intelligent; Publishing House of Electronics Industry: Beijing, China, 2023. [Google Scholar]
- Jing, H.; Ji, Z.; Peng, X.; Hu, L. Driving Style Adaptive Lane-changing Trajectory Planning and Control. China J. Highw. Transp. 2019, 32, 226–239+247. [Google Scholar] [CrossRef]
- Guo, Z.; Qin, D.; Li, A.; Feng, J.; Liu, Y. Influence of random road excitation on DCT vehicle dynamic characteristics during starting and shifting. J. Mech. Sci. Technol. 2023, 37, 4567–4582. [Google Scholar] [CrossRef]
- Xu, Z.; Liu, H.; Xing, Z. Estimation of Road Slope Based on IMU Error Compensation and GPS Based Multi-Sensor Fusion. In Volume 5: Dynamics, Vibration, and Control, Proceedings of the ASME International Mechanical Engineering Congress and Exposition, Columbus, OH, USA, 30 October–3 November 2022; American Society of Mechanical Engineers: New York, NY, USA, 2022. [Google Scholar]
- Nie, C.; Jia, S. Basic principles and development evolution of discrete choice models. J. Quant. Tech. Econ. 2005, 22, 151–159. [Google Scholar]
- Berry, S.T. Estimating Discrete-Choice Models of Product Differentiation. Rand J. Econ. 1994, 25, 242–262. [Google Scholar] [CrossRef]
- Greene, W.H.; Hensher, D.A. A latent class model for discrete choice analysis: Contrasts with mixed logit. Transp. Res. Part B Methodol. 2003, 37, 681–698. [Google Scholar] [CrossRef]
- Duan, P. Theory and Application Research of Discrete Choice Models; World Book Publishing Guangdong Company: Guangzhou, China, 2014. [Google Scholar]
- Wu, S.; Shi, Q.; Lu, H. Research on nonlinear utility discrete choice model for urban passenger travel. J. Wuhan Univ. Technol. 2008, 30, 108–111. [Google Scholar]
- Su, Z. Sales Forecasting and Discrete Choice Models in Automotive Market. Ph.D. Thesis, University of Science and Technology of China, Hefei, China, 2009. [Google Scholar]
- Ra, K.; Chang, S. An Improved Cost-Benefit Criterion Using Utility Theory. Trans. Am. Nucl. Soc. 1984, 46, 523–525. [Google Scholar]
- Wallenius, J.; Dyer, J.S.; Fishburn, P.C.; Steuer, R.E.; Zionts, S.; Deb, K. Multiple criteria decision making, multiattribute utility theory: Recent accomplishments and what lies ahead. Manag. Sci. 2008, 54, 1336–1349. [Google Scholar] [CrossRef]
- Dyer, J.S.; Fishburn, P.C.; Steuer, R.E.; Wallenius, J.; Zionts, S. Multiple Criteria Decision-Making, Multiattribute Utility-Theory—The Next 10 Years. Manag. Sci. 1992, 38, 645–654. [Google Scholar] [CrossRef]
- Wu, Y. Development of Multi-Source Vehicle Performance Parameter Detection System Under Precise Control of Throttle Opening. Master’s Thesis, Tongji University, Shanghai, China, 2022. [Google Scholar]
- JTG B01-2014; Technical Standard of Highway Engineering. Ministry of Transport of China: Beijing, China, 2014.
Disclaimer/Publisher’s Note: The statements, opinions and data contained in all publications are solely those of the individual author(s) and contributor(s) and not of MDPI and/or the editor(s). MDPI and/or the editor(s) disclaim responsibility for any injury to people or property resulting from any ideas, methods, instructions or products referred to in the content. |
© 2025 by the authors. Licensee MDPI, Basel, Switzerland. This article is an open access article distributed under the terms and conditions of the Creative Commons Attribution (CC BY) license (https://creativecommons.org/licenses/by/4.0/).