1. Introduction
With the increasing demand for large-scale space deployable mechanisms such as large-scale antennas and solar panels, the requirement for the accuracy of the shape maintenance of their in-orbit services is constantly increasing. However, due to machining technology, assembly errors, and other reasons, the joint of the developing mechanism inevitably has a clearance of moving pairs, thus resulting in the flutter phenomenon, which then affects the shape accuracy of the developing mechanism. Therefore, in order to achieve high precision prediction and control of flutter, it is urgent to carry out refined dynamic modeling research of the spatial development mechanism with a clearance joint.
Aiming at the problem of modeling the contact force of the ideal smooth joint clearance, the contact can be divided into uncoordinated contact and conformal contact according to the contact state. Between them, the noncoordinated contact solves the modeling problem of joint contact force with large clearance. Among them, the continuous contact force model of the interstitial moving pair is widely used [
1,
2,
3,
4]. This model was first proposed by the researcher Earles in the early 1970s [
5]. The Hertz contact force model [
6], L-N contact force model [
7], and Flores contact force model [
8] are the most authoritative continuous contact force models at present. Hertz et al. [
9] put forward a normal contact force model that can accurately calculate the nonlinear contact force at the clearance between two contacts. In order to make up for the lack of energy loss in the Hertz contact model, Lankanani [
10] proposed the L-N continuous contact force model, which introduced the viscous damping coefficient to describe the energy dissipation of the contact body during the contact process. This model provides a more accurate description of the motion of the contact. Based on the L-N continuous contact model, Flores [
11] proposed a general modeling method for rotating joints with clearance in multibody systems. This method provides a new way to solve complex motion problems in multibody systems theoretically. With the continuous improvement of machining accuracy, the joint clearance of the mechanism gradually becomes smaller, and the joint contact state changes from noncoordinated contact to conformal contact. In this case, the traditional hypothesis of the noncoordinated contact theory is no longer applicable [
12,
13,
14,
15,
16]. Therefore, researchers at home and abroad have carried out different research projects on the conformal contact of a joint space. Yan et al. [
16,
17] considered influence factors such as surface quality, axial bending deformation, and the viscous effect of moving pairs, which they combined with the Winkler elastic contact hypothesis and the traditional Hertz contact hypothesis; this model regarded the contact behavior under the condition of small clearance as a near-coordinated state, that is, there is a small clearance between contact surfaces. A near-coordinated contact force model for small clearances has been proposed. Based on the assumptions of the Winkler and Hertz contact models, Liu et al. [
10,
18,
19] used geometric methods to deduce the contact boundary of spherical joints with clearances, and they established a conformal contact model that accurately described the contact state of spherical joints in the process of motion. The proposed model provides a new theoretical framework for solving the spherical joint contact problem with clearances.
However, all the contact force models listed above focus on the case of smooth surfaces; however, in the actual contact process, the contact surface is often not completely smooth, and the joints cannot be fully fitted, thus resulting in discontinuity of the contact surface. The contact state may change due to the slightly convex surface or irregular shape. This will cause local load concentration or uneven distribution of the contact surface and then affect the dynamic characteristics of the mechanism.
In terms of the contact characteristics of irregular surface joints, scholars have divided them into two types of description methods, named statistical description and classification description. Based on the statistical description, the scholars did the following research. Greenwood et al. [
17,
20] first studied rough contact surfaces and proposed the G-W model. Han et al. [
21,
22] proposed a multibody dynamic modeling method for joints with irregular rough clearance surfaces considering the elastic deformation of microconvex contact surfaces, and they proposed wear prediction and dynamic error analysis methods for joint contact surfaces. In order to make up for the defect of a single radius of curvature in the hemispherical model, Shang et al. [
23,
24] proposed the method of an equivalent microconvex of a parabolic rotary body to correct the deficiency of the traditional hypothesis of a hemispherical microconvex, and they deduced the relationship between the normal stiffness of rough surfaces and elastic contact. Li Ling et al. [
25] further used the hypothesis that the rotating body of the quadratic function is equivalent to the traditional hemispherical microconvex body, and based on a rough surface topography measurement test, they established the analytical relationship between the contact radius and the contact deformation of a microconvex body. Wei Long et al. [
26] introduced the advantages and disadvantages of the Hertz contact model, statistical contact model, and fractal contact model, respectively. Based on the classification description method, domestic and foreign scholars have conducted the following research. In 1990, Majumdar and Bhushan [
27,
28] jointly proposed a rough surface contact model based on fractal geometry theory, and they obtained a more realistic relationship between the contact area of microconvex bodies and the contact load. In 2009, based on the fractal theory, Wen Shuhua et al. [
29] introduced a contact area distribution function with the cross-sectional area of the deformation position of a microconvex body as a variable, and they established a fractal model of contact stiffness of the joint surface considering the region expansion factor.
According to the different precision requirements of the research objects, the main research methods adopted at this stage are different. For large developable mechanisms, such as solar panels, cranes, and space antennas, due to the large number of joints and large scale, the computational efficiency is required to be higher. At this stage, most of the statistical joint contact modeling is adopted, such as using the G-W model [
30]. For high-precision transmission mechanisms with smaller scales and higher precision requirements, topography modeling such as the M-B modeling method [
31] is generally adopted at this stage.
However, both the existing statistical contact force model and the fractal contact model have their limitations. The statistical contact force model does not study the mapping relationship between the overall embedding depth of the contact surface and the actual embedding depth, which makes it difficult to consider the energy loss caused by nonlinear damping and thus makes the error of the contact force model larger. The fractal contact model needs to first extract the real topography data of the rough surface of the object through the instrument and then calculate the rough surface of the object based on the fractal theory. Although the contact force of the rough surface can be accurately described, it is difficult to model the multijoint spatial expansion mechanism efficiently due to the large amount of calculation and the need to sample different contact surfaces.
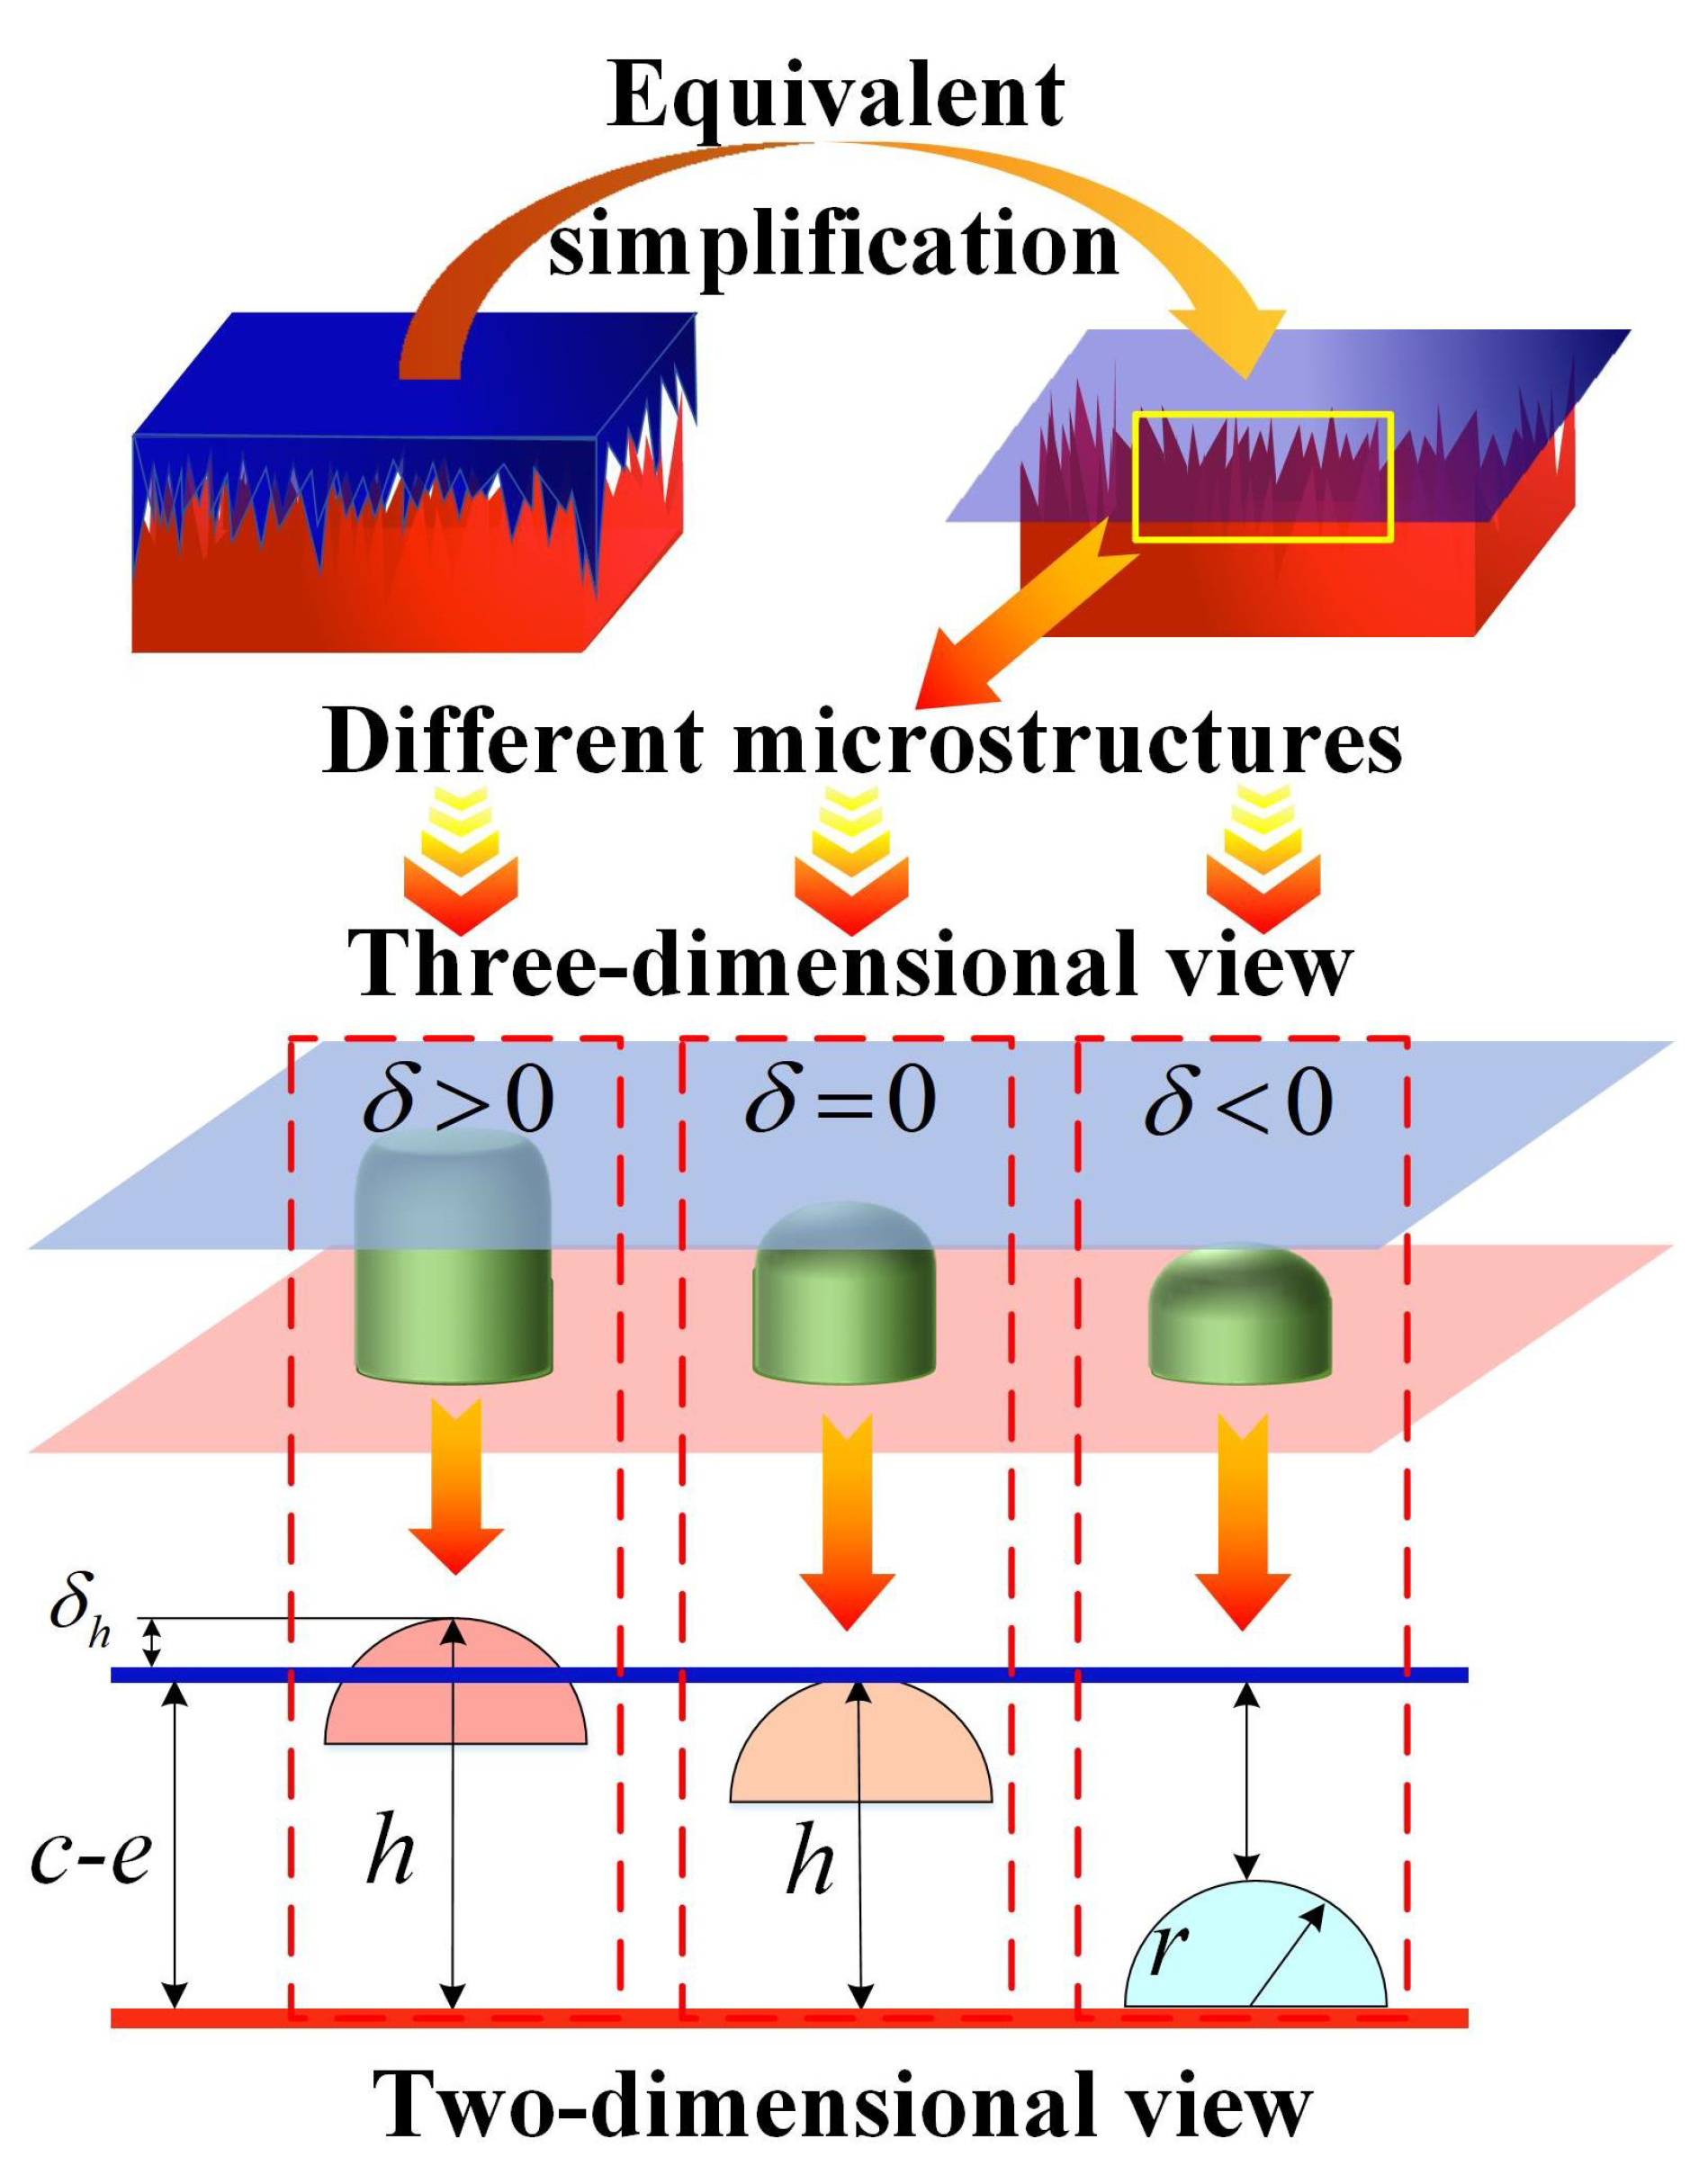
Therefore, aiming at the problem that it is difficult for traditional contact models to accurately and efficiently describe the contact state of irregular rough clearance surfaces, an improved clearance contact force modeling method based on an uncoordinated contact model [
1,
2,
3,
4] is proposed in this paper. Firstly, the contact state is simplified by referring to the G-W model [
17,
20] hypothesis, and the contact force modeling is simplified into modeling the contact force of a single microconvex body, which is followed by statistical modeling. Then, the contact force of a single microconvex body is modeled based on the traditional Hertz model [
6], and the stiffness of the traditional Hertzian model is modified based on the probability distribution density function of the rough peak. Based on the L-N model [
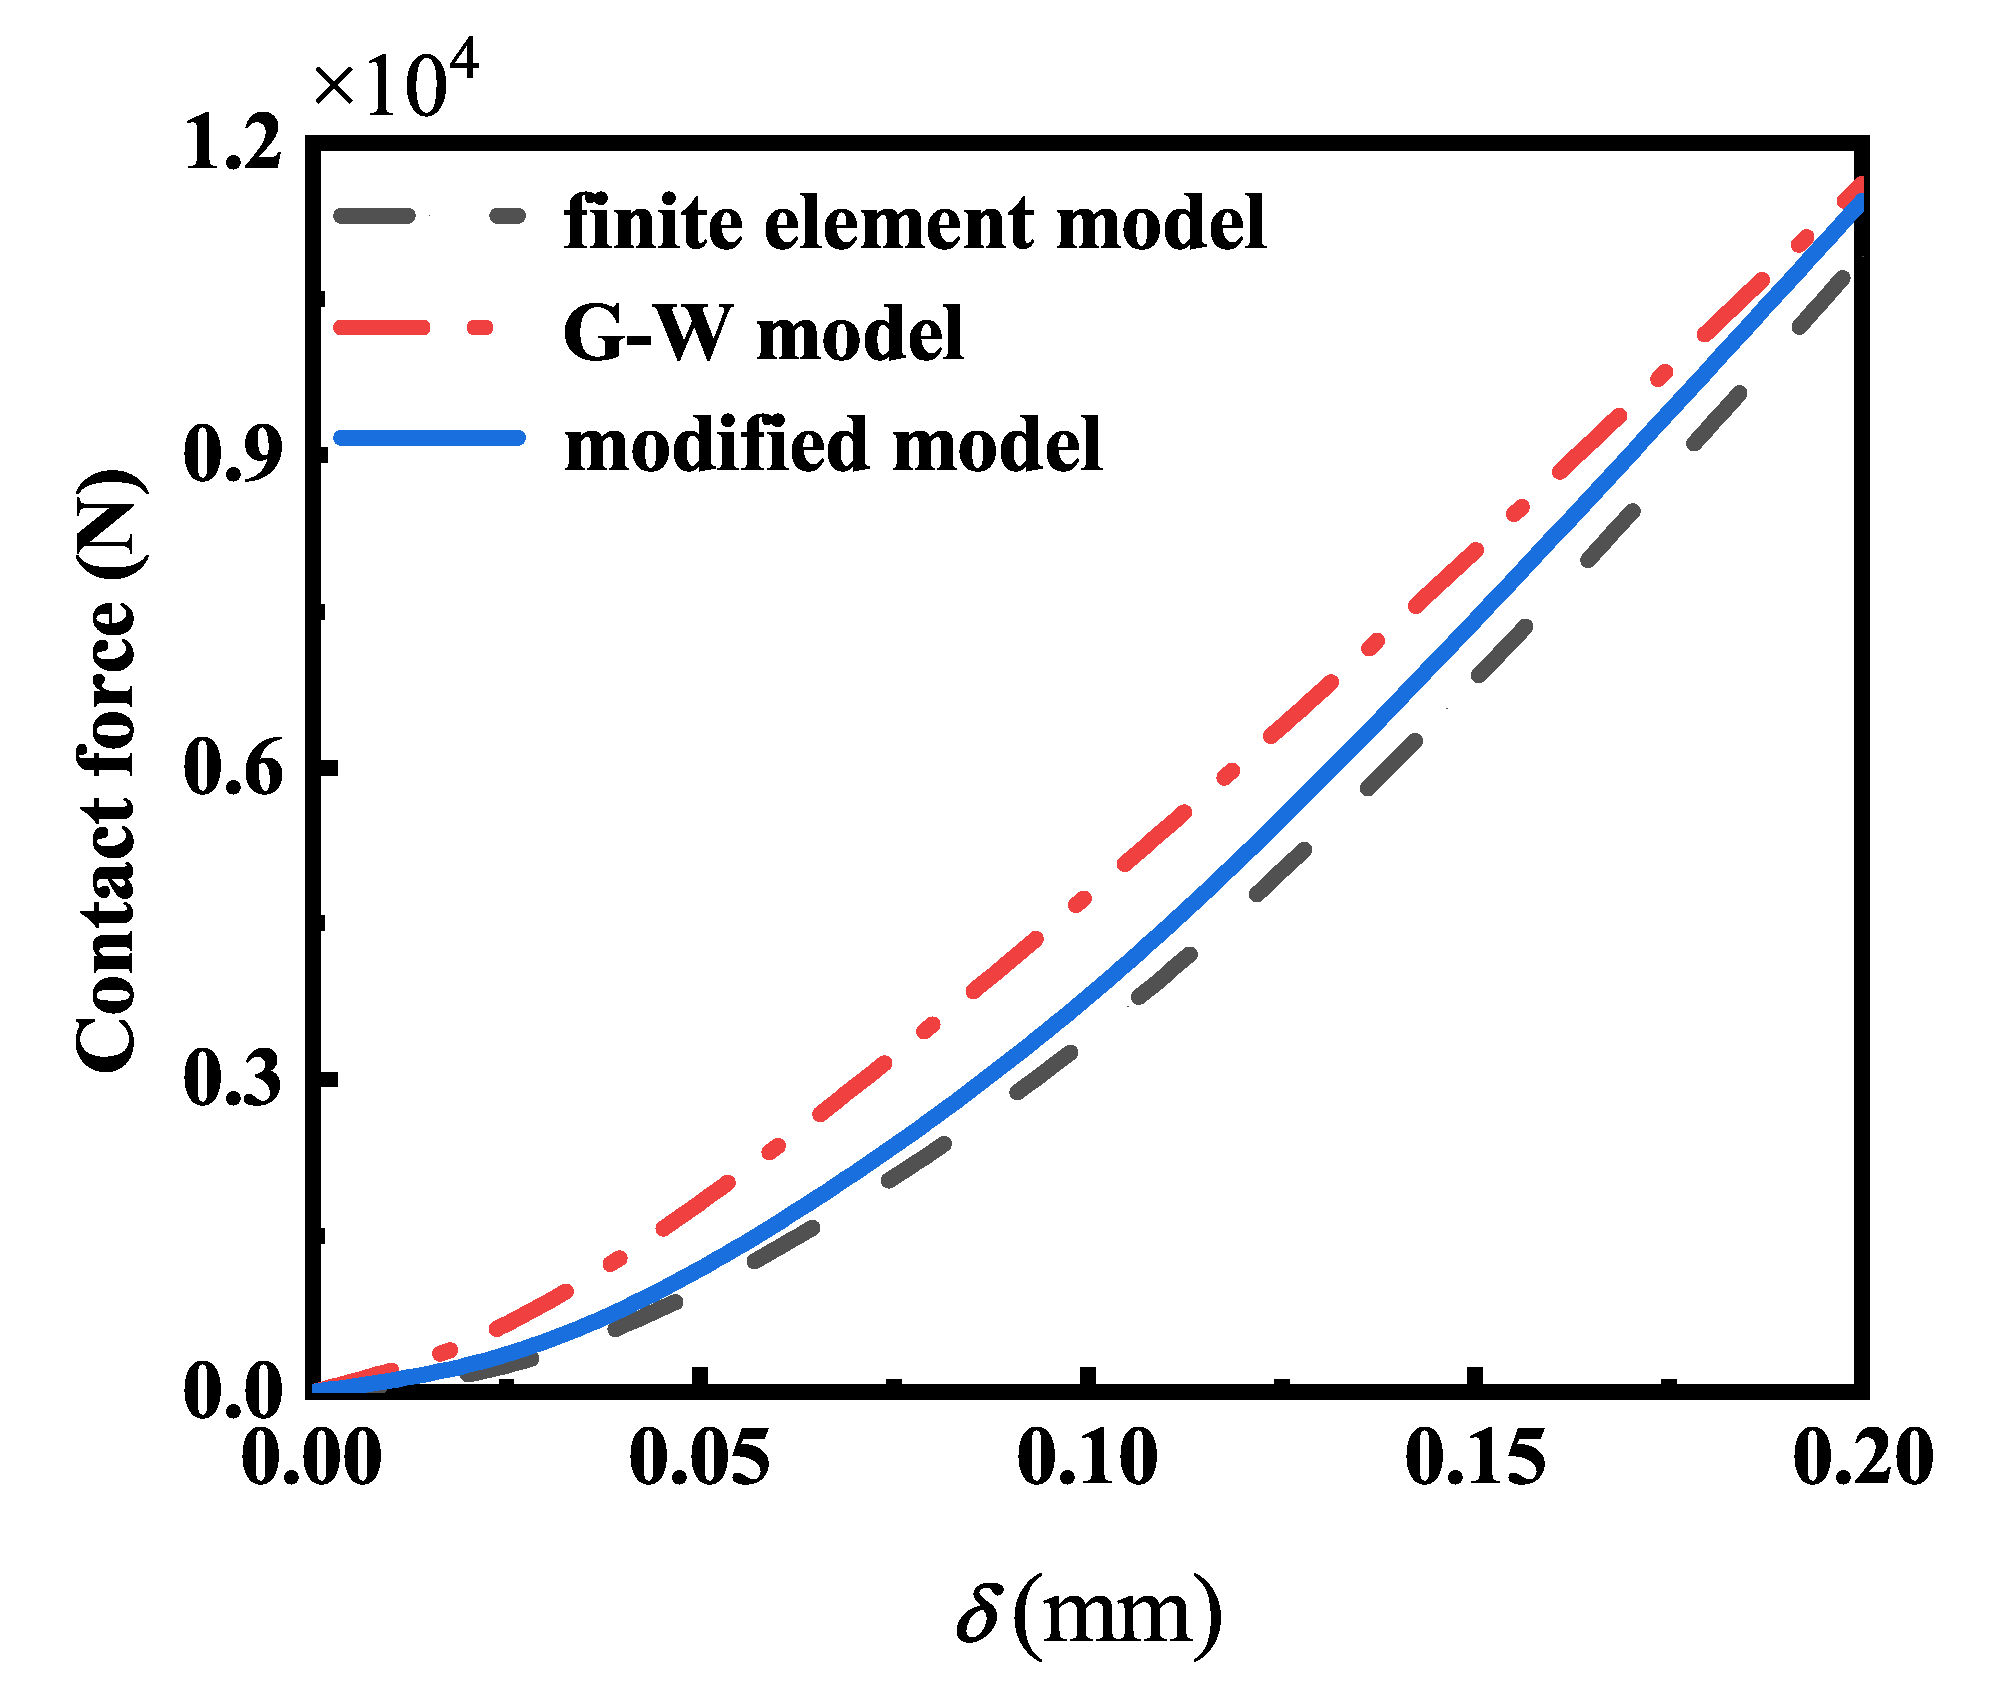
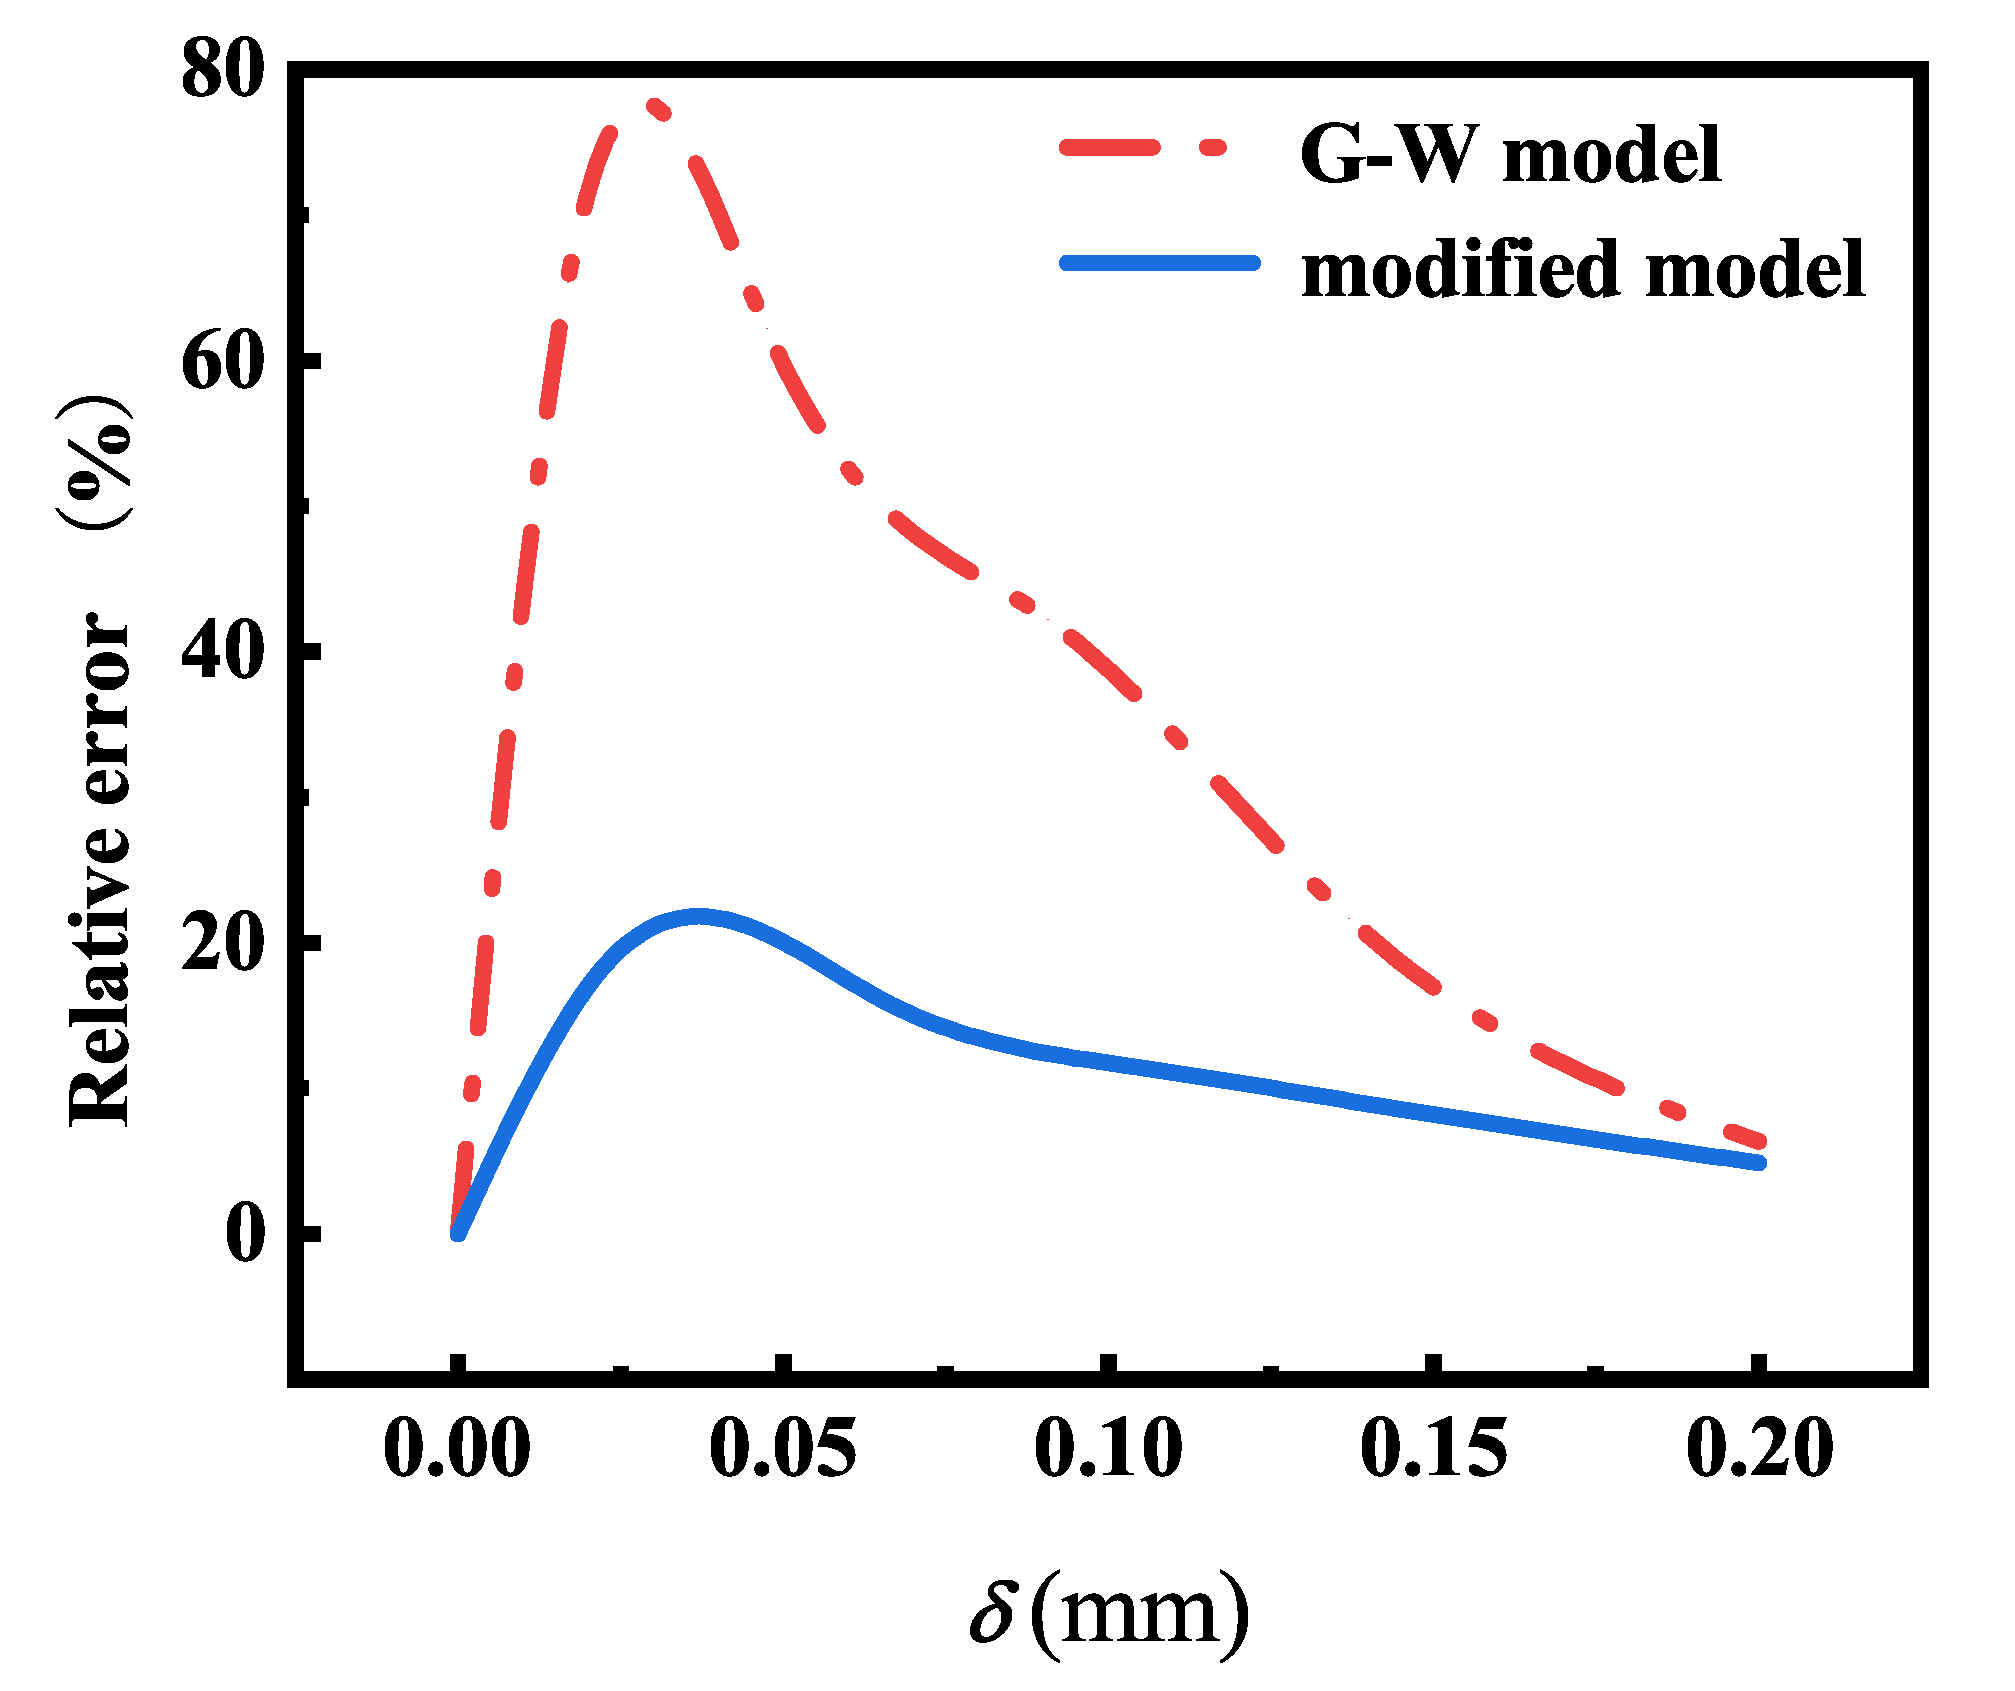
7], the nonlinear damping term is introduced into the contact force calculation model, and an improved contact model based on dynamic contact stiffness is established. A multibody dynamics model based on the improved contact model is established for the space development mechanism. The improved contact model is explored and verified using dynamic simulation. The accuracy and superiority of the improved contact model are verified by comparing the simulation results.
The remaining work is organized as follows.
Section 2 introduces the contact modeling, including the normal contact force model and the tangential friction force model .
Section 3 proposes a method for estimating the dynamic modeling of the space expansion mechanism of irregular rough surface joints. In
Section 4, the dynamic simulation analysis of the mechanism is carried out, and the dynamic response of different spacecraft components under different contact parameters is compared and analyzed. Furthermore, the optimal processing parameters of components with different requirements of the spatial developable mechanism are obtained. Finally, conclusions are drawn in the last section.
3. Considering the Dynamic Modeling of Space Expansion Mechanism of Irregular Rough Surface Joints
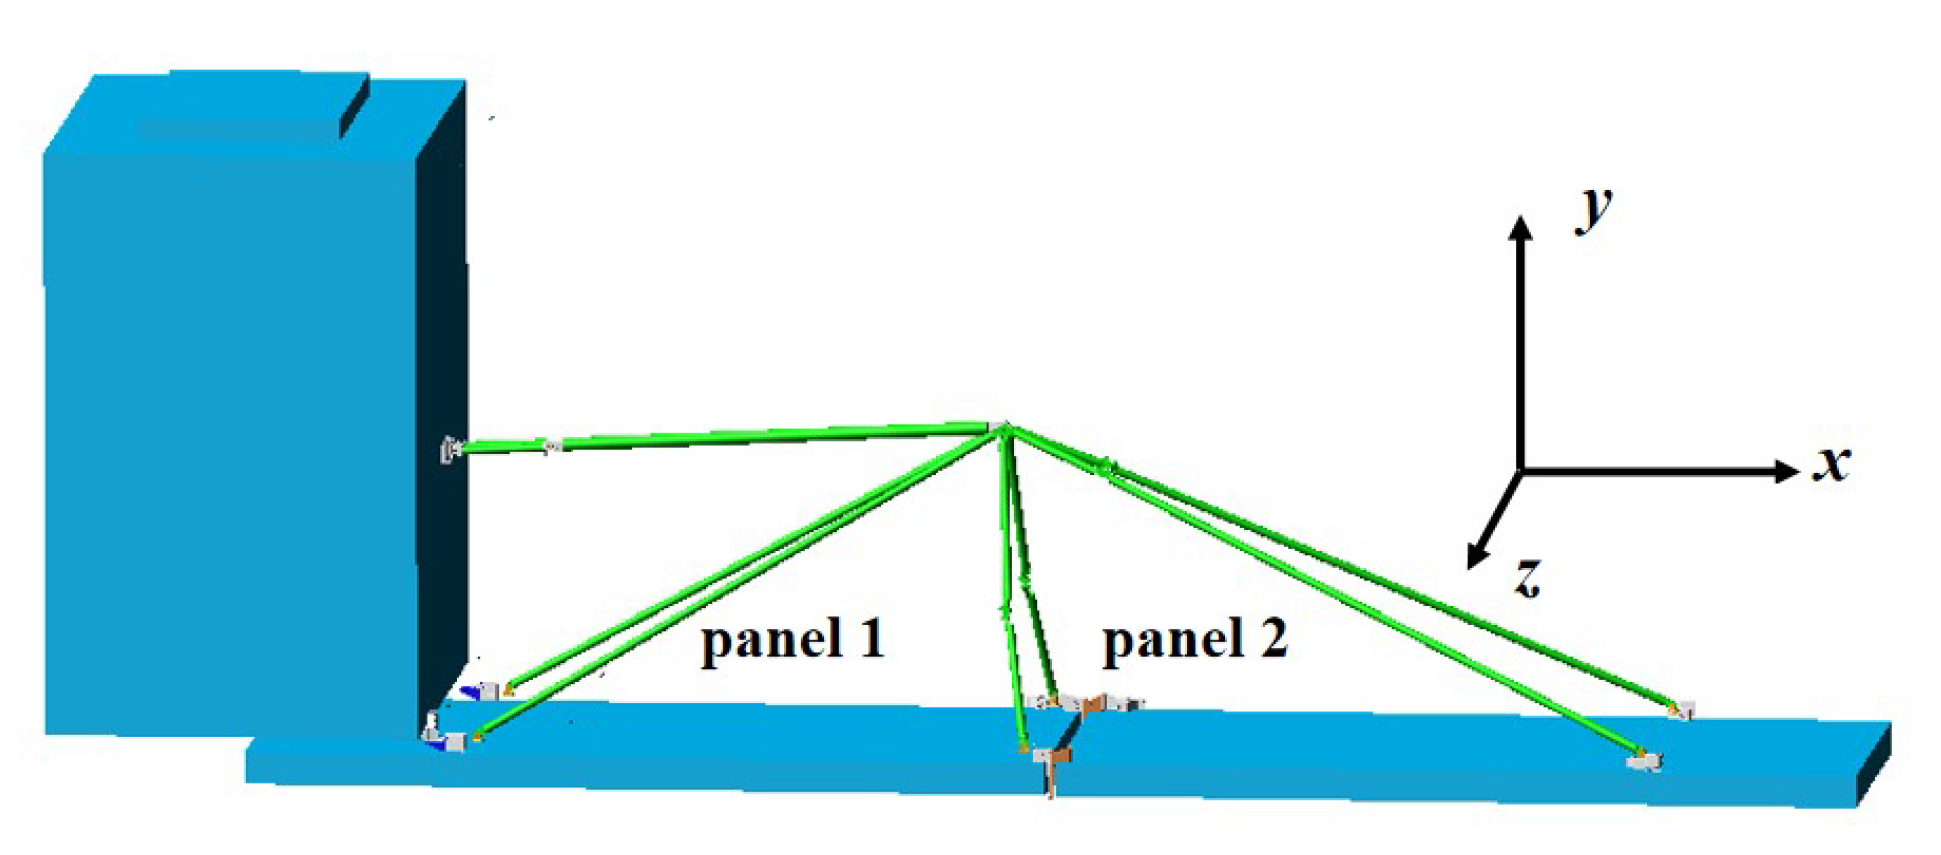
Since the space deployable mechanism has more demands on solar panels at this stage, the deployable mechanism model adopted in this chapter is shown in
Figure 6 and
Figure 7, thus including the spacecraft body, two solar panels, and several connecting support rods. In the process of unfolding, although the mechanism is a three-dimensional space mechanism, there is no movement in the Z direction, because all points on the component move in the corresponding X–Y plane. Therefore, in this chapter, the deployable mechanism model was simplified to the X–Y plane projection of the mechanism to study the effect of joint clearance on the dynamic characteristics of the deployable mechanism.
In accordance with the behavior of the mechanism during unfolding, the mechanism was projected onto the X–Y plane, and the schematic diagram of the mechanism development process as shown in
Figure 8 was obtained, thus indicating the motion process of the mechanism from the semiexpansion state to the expansion state, where
is panel 1,
is panel 2.
The mechanism is composed of three-ring mechanisms. According to the Lagrange multiplier modeling method, the closed-ring constraint equation of the mechanism is given as follows:
where the kinetic energy of each connecting rod can be expressed as follows:
where
and
respectively represent the velocity of the center of mass of
in the direction of x and y, and
is the mass of
. The total kinetic energy of the developing mechanism composed of
n poles is expressed as follows:
The initial locking state of the spring of the space expansion mechanism is regarded as the initial state of energy storage. In the process of expansion, the spring will release the stored energy to drive the expansion of the space expansion unit. The nonlinear function of the coil spring development angle can be expressed as follows:
where
is the stiffness coefficient of the coil spring, and
a is the angle of the coil spring development.
The spring elastic potential energy can be expressed as follows:
The closed-loop constraint equation was used to solve the position of each azimuth angle of the expansion mechanism, and the Lagrange equation was used to model the dynamics of the space expansion mechanism. The dynamics equation of the expansion mechanism can be expressed as follows:
where
L is the Lagrange function—defined as the difference between the kinetic energy and potential energy of the space expansion element—
is the generalized coordinate,
is the generalized force corresponding to the generalized coordinate, and [
] is the resultant force of the normal contact force and tangential friction force. The Lagrange dynamics equation of the expansion element can be written in matrix form as follows:
where
is the generalized mass matrix,
is the generalized damping matrix, and
is the generalized stiffness matrix;
,
,
represent the mass coefficient, damping coefficient, and stiffness coefficient of the superimposed expansion element, respectively.
In this paper, the generalized alpha method was used to solve the dynamic equation, and the specific simulation results are analyzed in the next section [
35].
4. The Dynamic Characteristic Analysis of the Expansion Mechanism
In this section, the dynamic simulation analysis of the mechanism is carried out. The specific parameters of the expansion mechanism are shown in
Table 2.
In the nonideal joint mechanism, the roughness of the clearance contact surface was set to an of 0.8, an of 1.6, and an of 3.2 from fine to coarse. In addition, the clearance size from small to large was set to 0.01 mm, 0.05 mm, and 0.1 mm in turn. The simulation time was set to 2 s, the simulation step was set to 0.01 s, and the angle between panel 1 and y axis was set as the unfolding angle. When the mechanism unfolding angle reaches 90 deg, the mechanism locks. Then, the effects of different clearance parameters on the dynamics of the deployable mechanism during the deployable and in-orbit phases can be analyzed in detail.
4.1. Influence of Clearance Contact Surface Roughness on System Motion
The spatial expansion mechanism starts to expand after it arrives at the working environment. The whole development stage is divided into a dynamic expansion process and a locking process after deployment. Therefore, for the nonideal joint mechanism, when the clearance size was 0.05 mm, the roughness of the clearance contact surface was set to an of 0.8, an of 1.6, and an of 3.2 from fine to coarse to carry out simulation analysis.
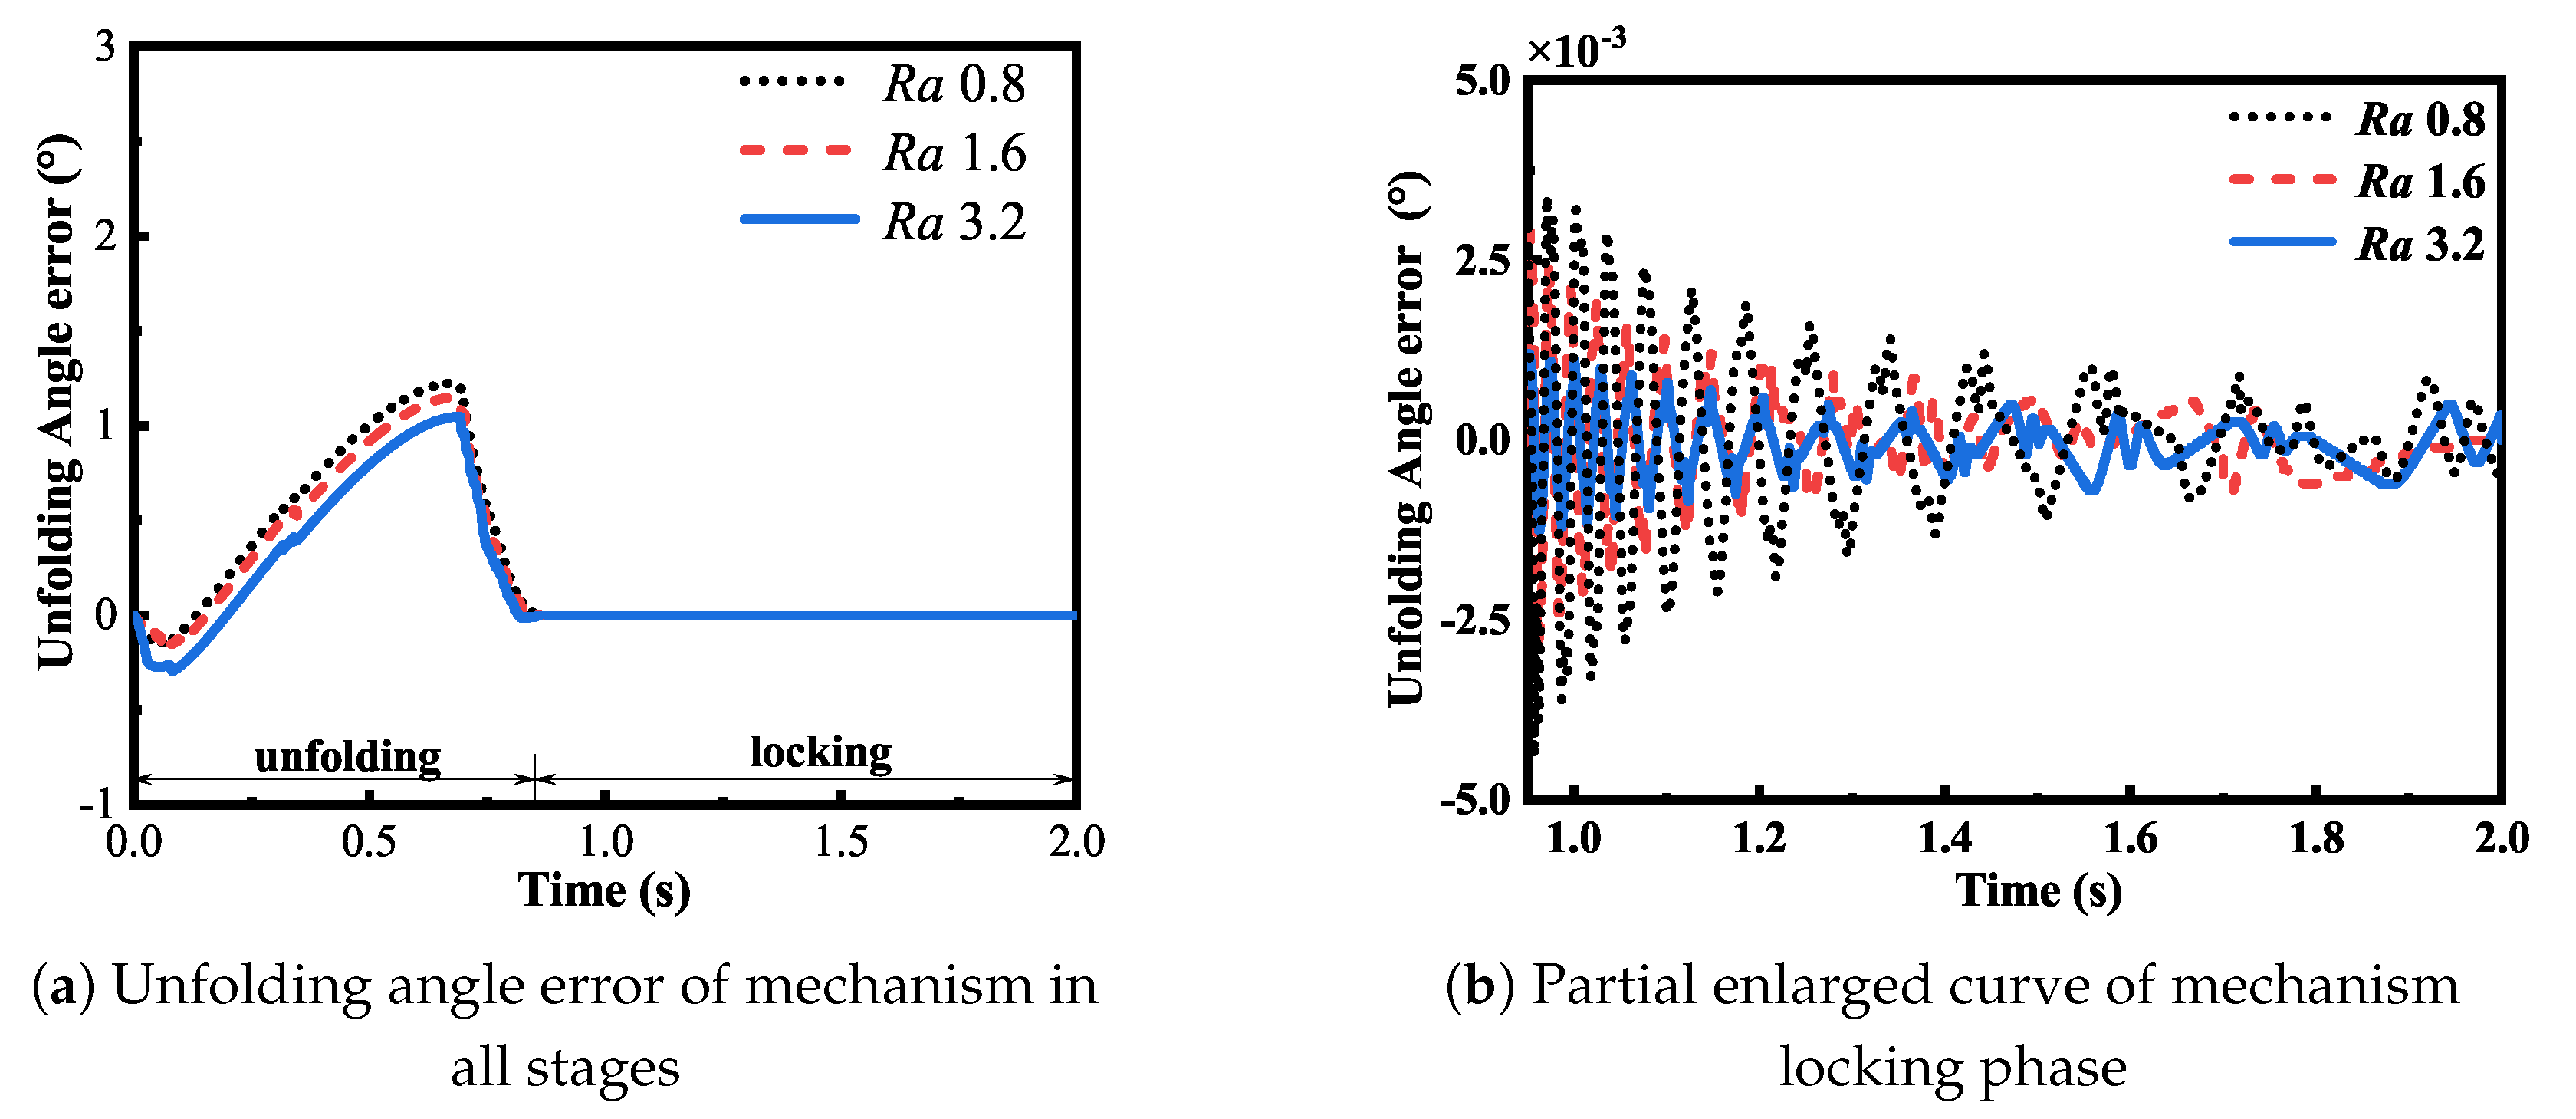
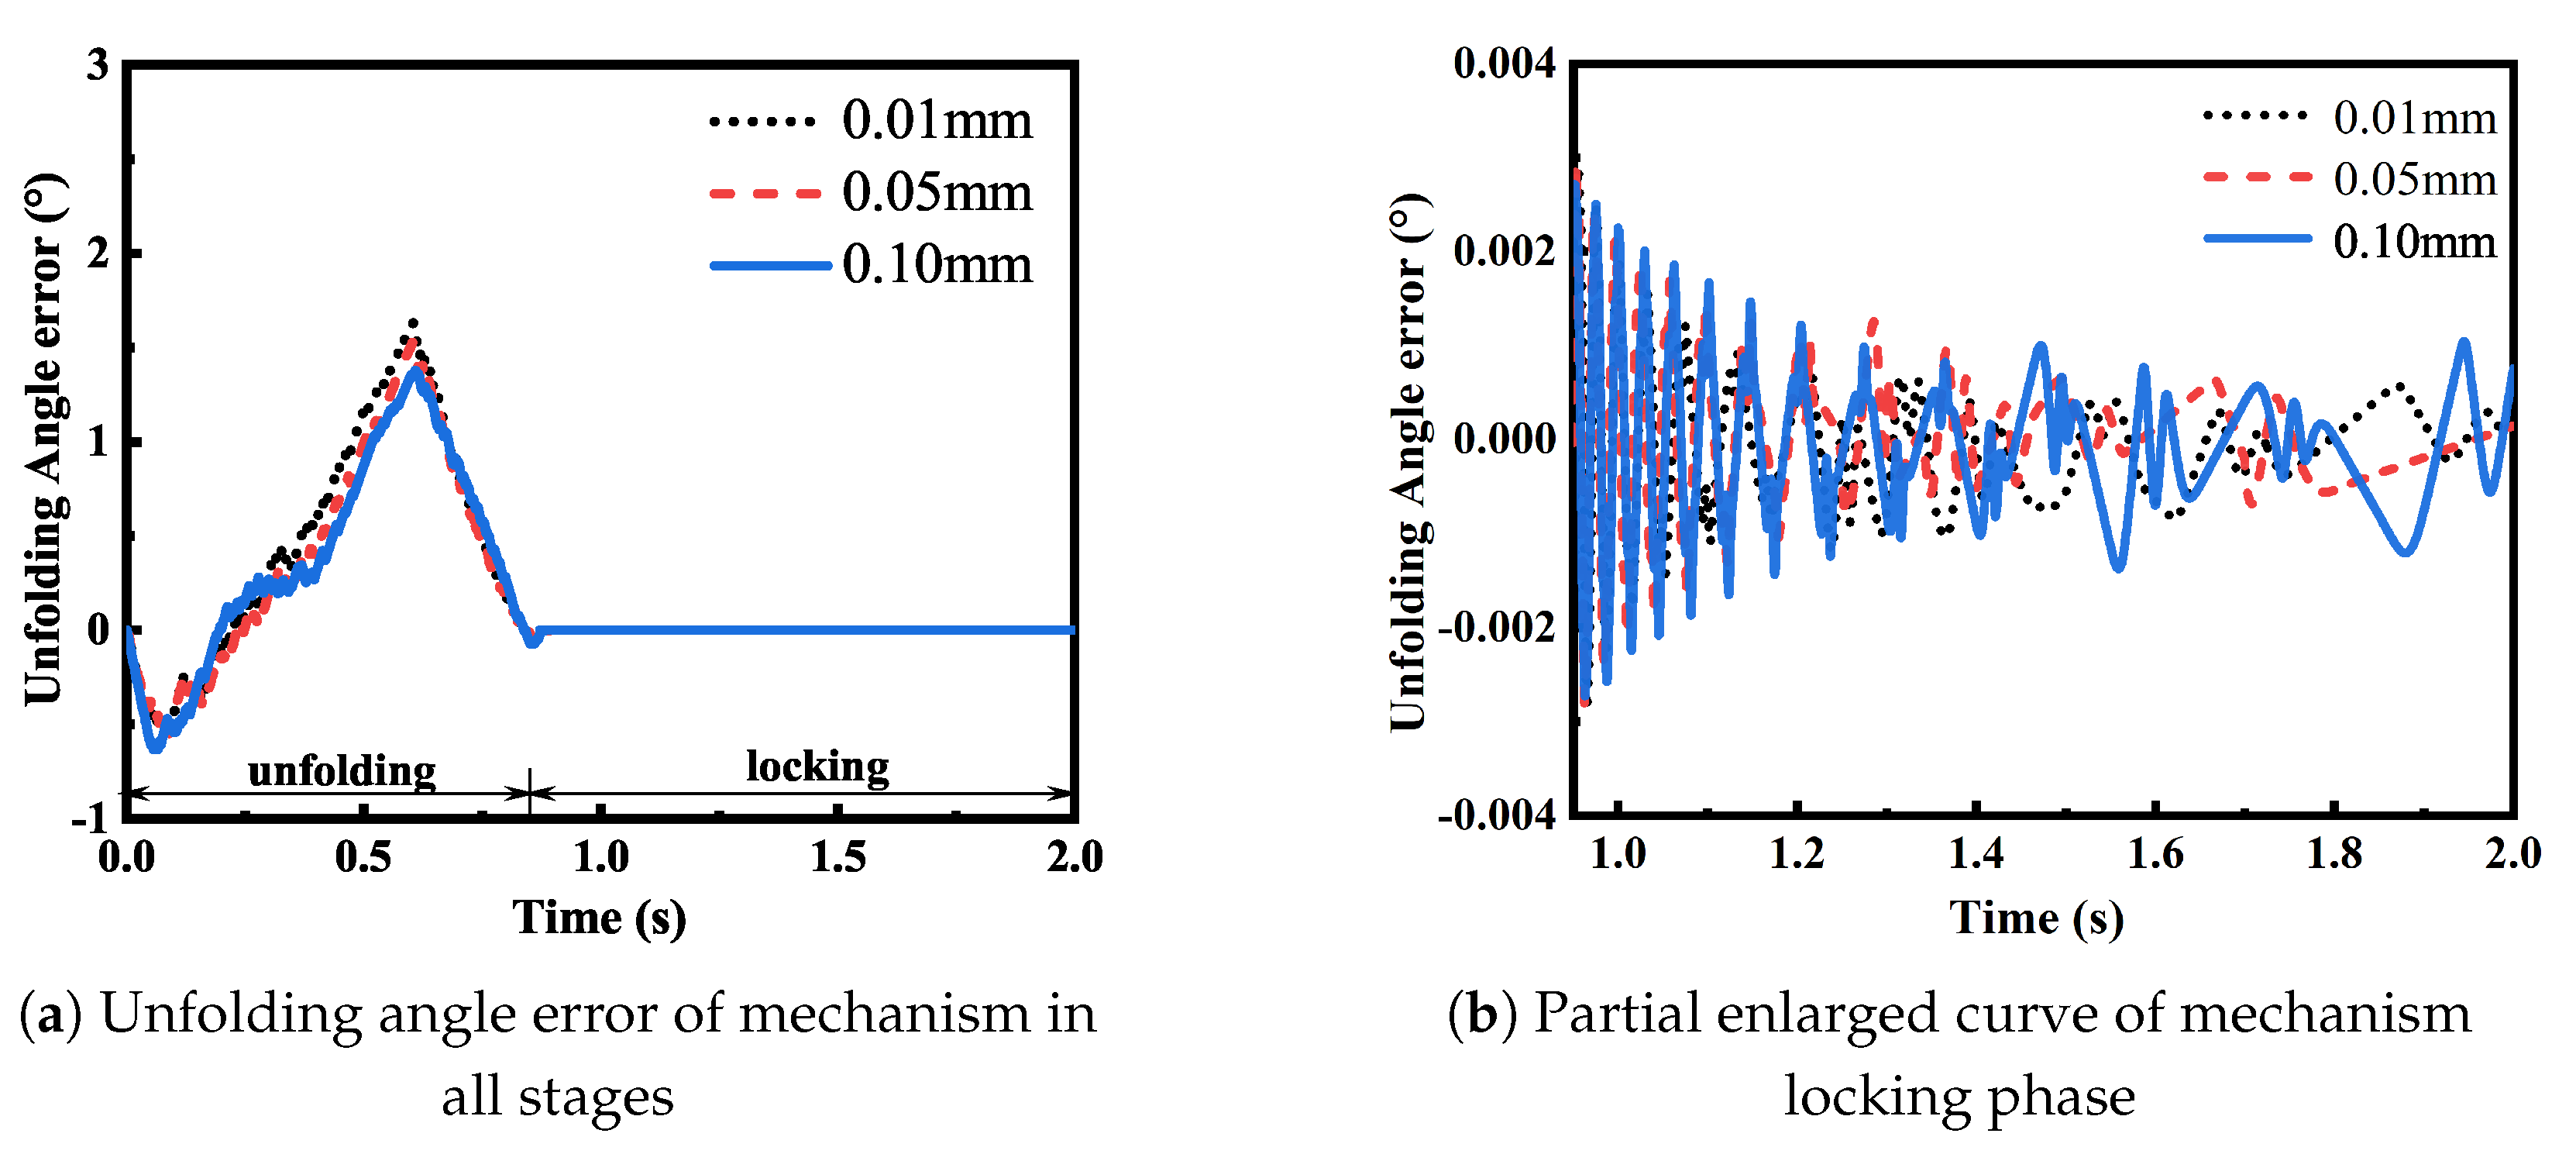
Firstly, the deviation of the unfolding angle in the unfolding and locking processes under different roughness was compared. As can be seen in
Figure 9, with the increase in the contact surface roughness, the angle deviation in the unfolding stage presented a trend of first increasing and then decreasing, while there was no significant difference between the upper and lower deviation ranges of the unfolding angle in the locking stage. The increase in the unfolding angle deviation in the initial development stage may be due to the increase in the initial friction force caused by the increase in roughness, which makes the mechanism need to overcome greater friction force to develop. With the development process, the reduction of contact force and the shortening of collision time caused by the increase of roughness effectively enhance the dynamic response speed of the system, thus making the deviation lower than that of the surface with low roughness.
In addition, it can be seen from
Figure 9b that, in the postlocking stage of the mechanism, the development angle deviation attenuated faster with the increase in roughness, which is because the increase in roughness is conducive to the surface microconvex body absorbing the collision energy between the elements of the motion amplitude so that the mechanism becomes stable faster.
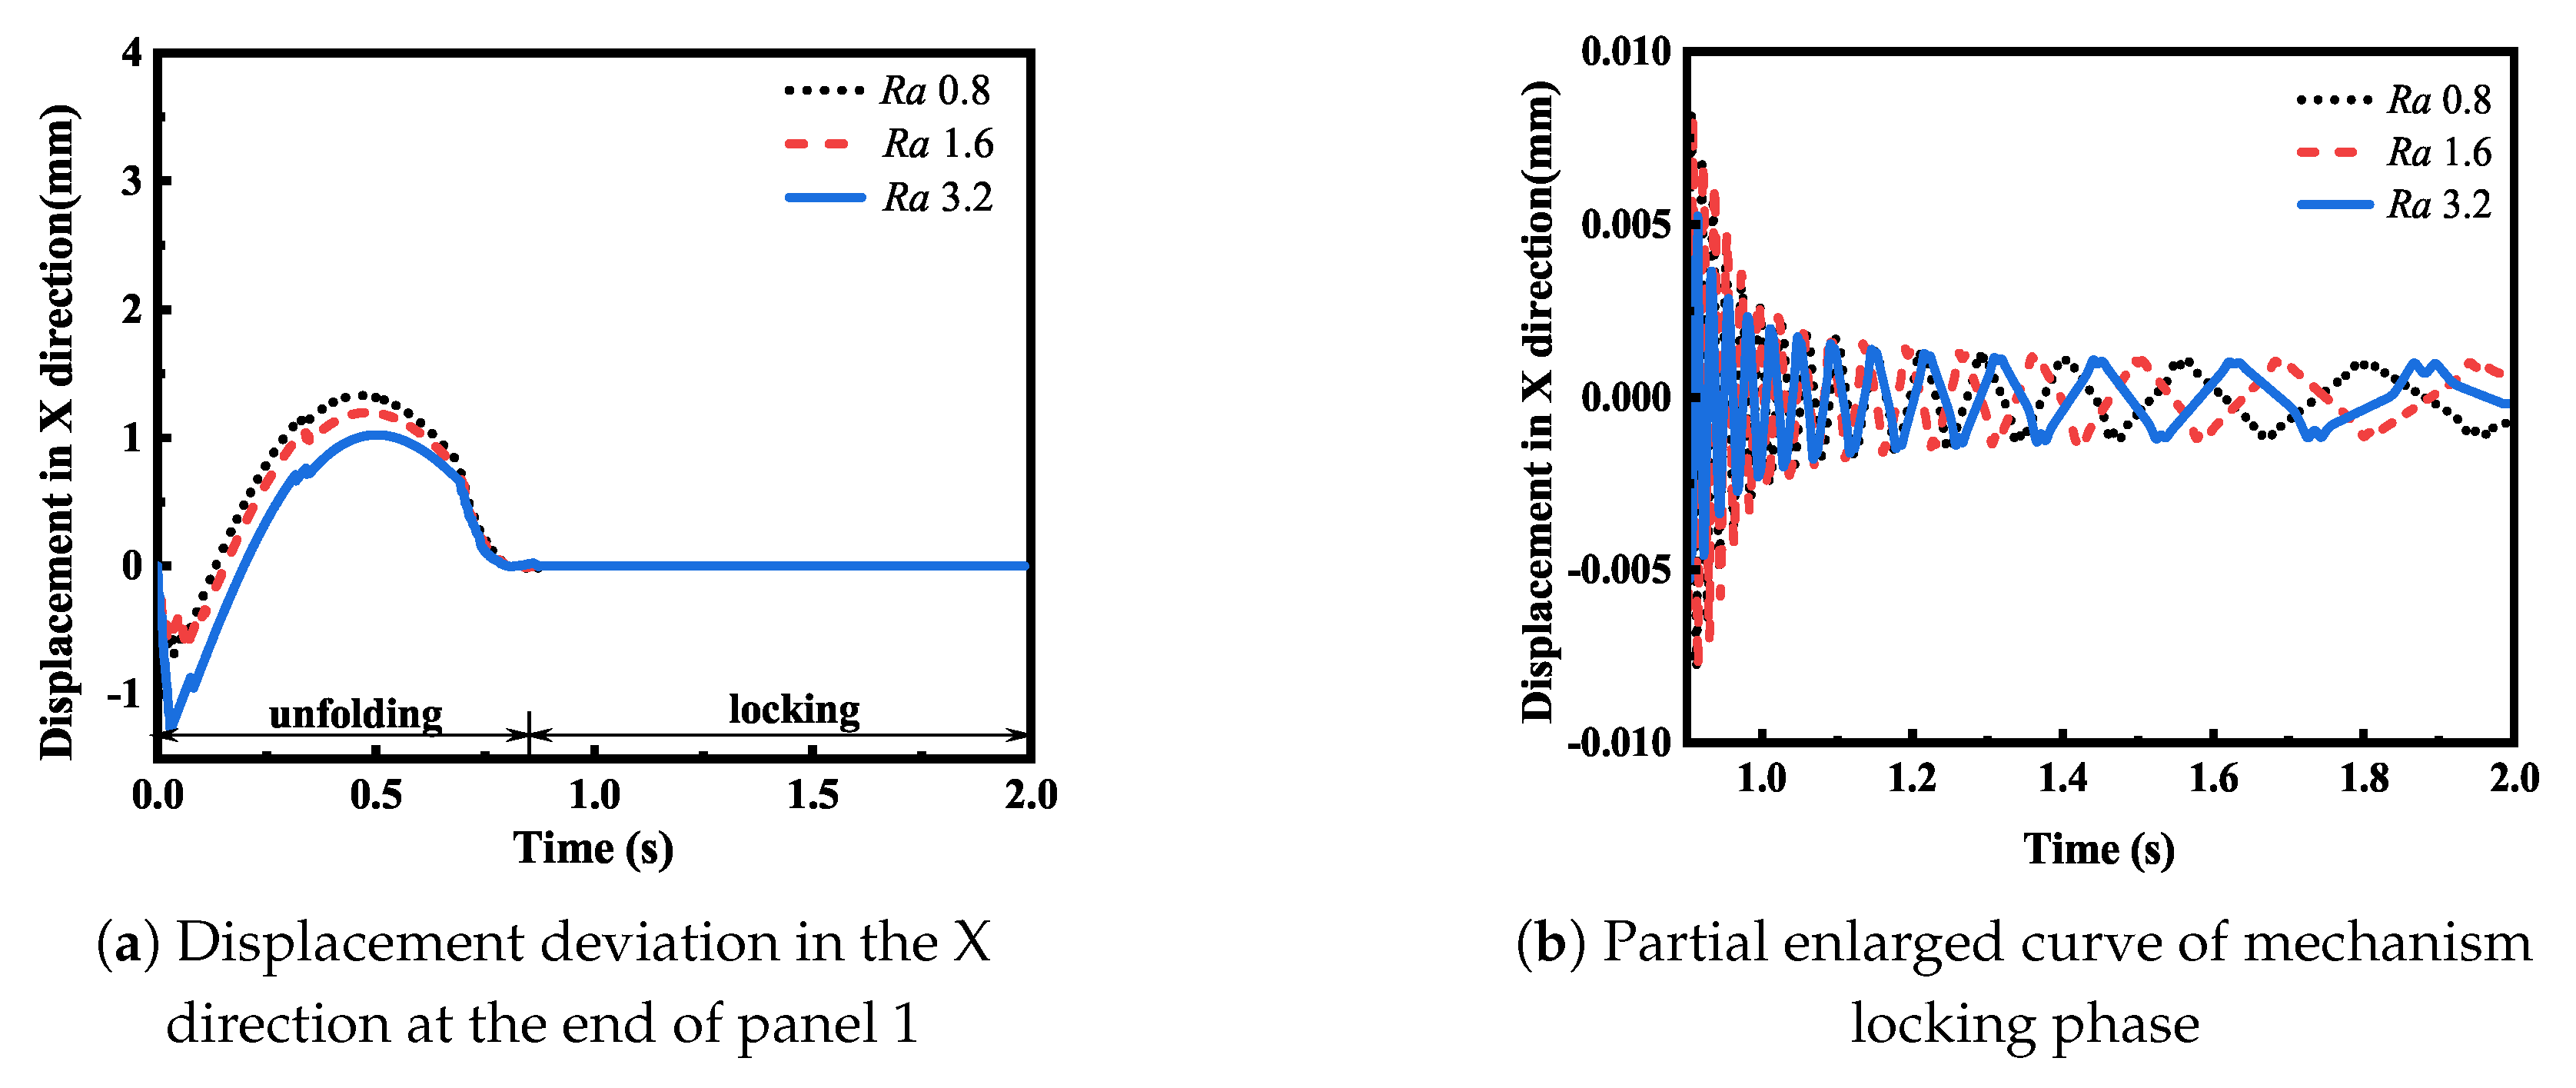
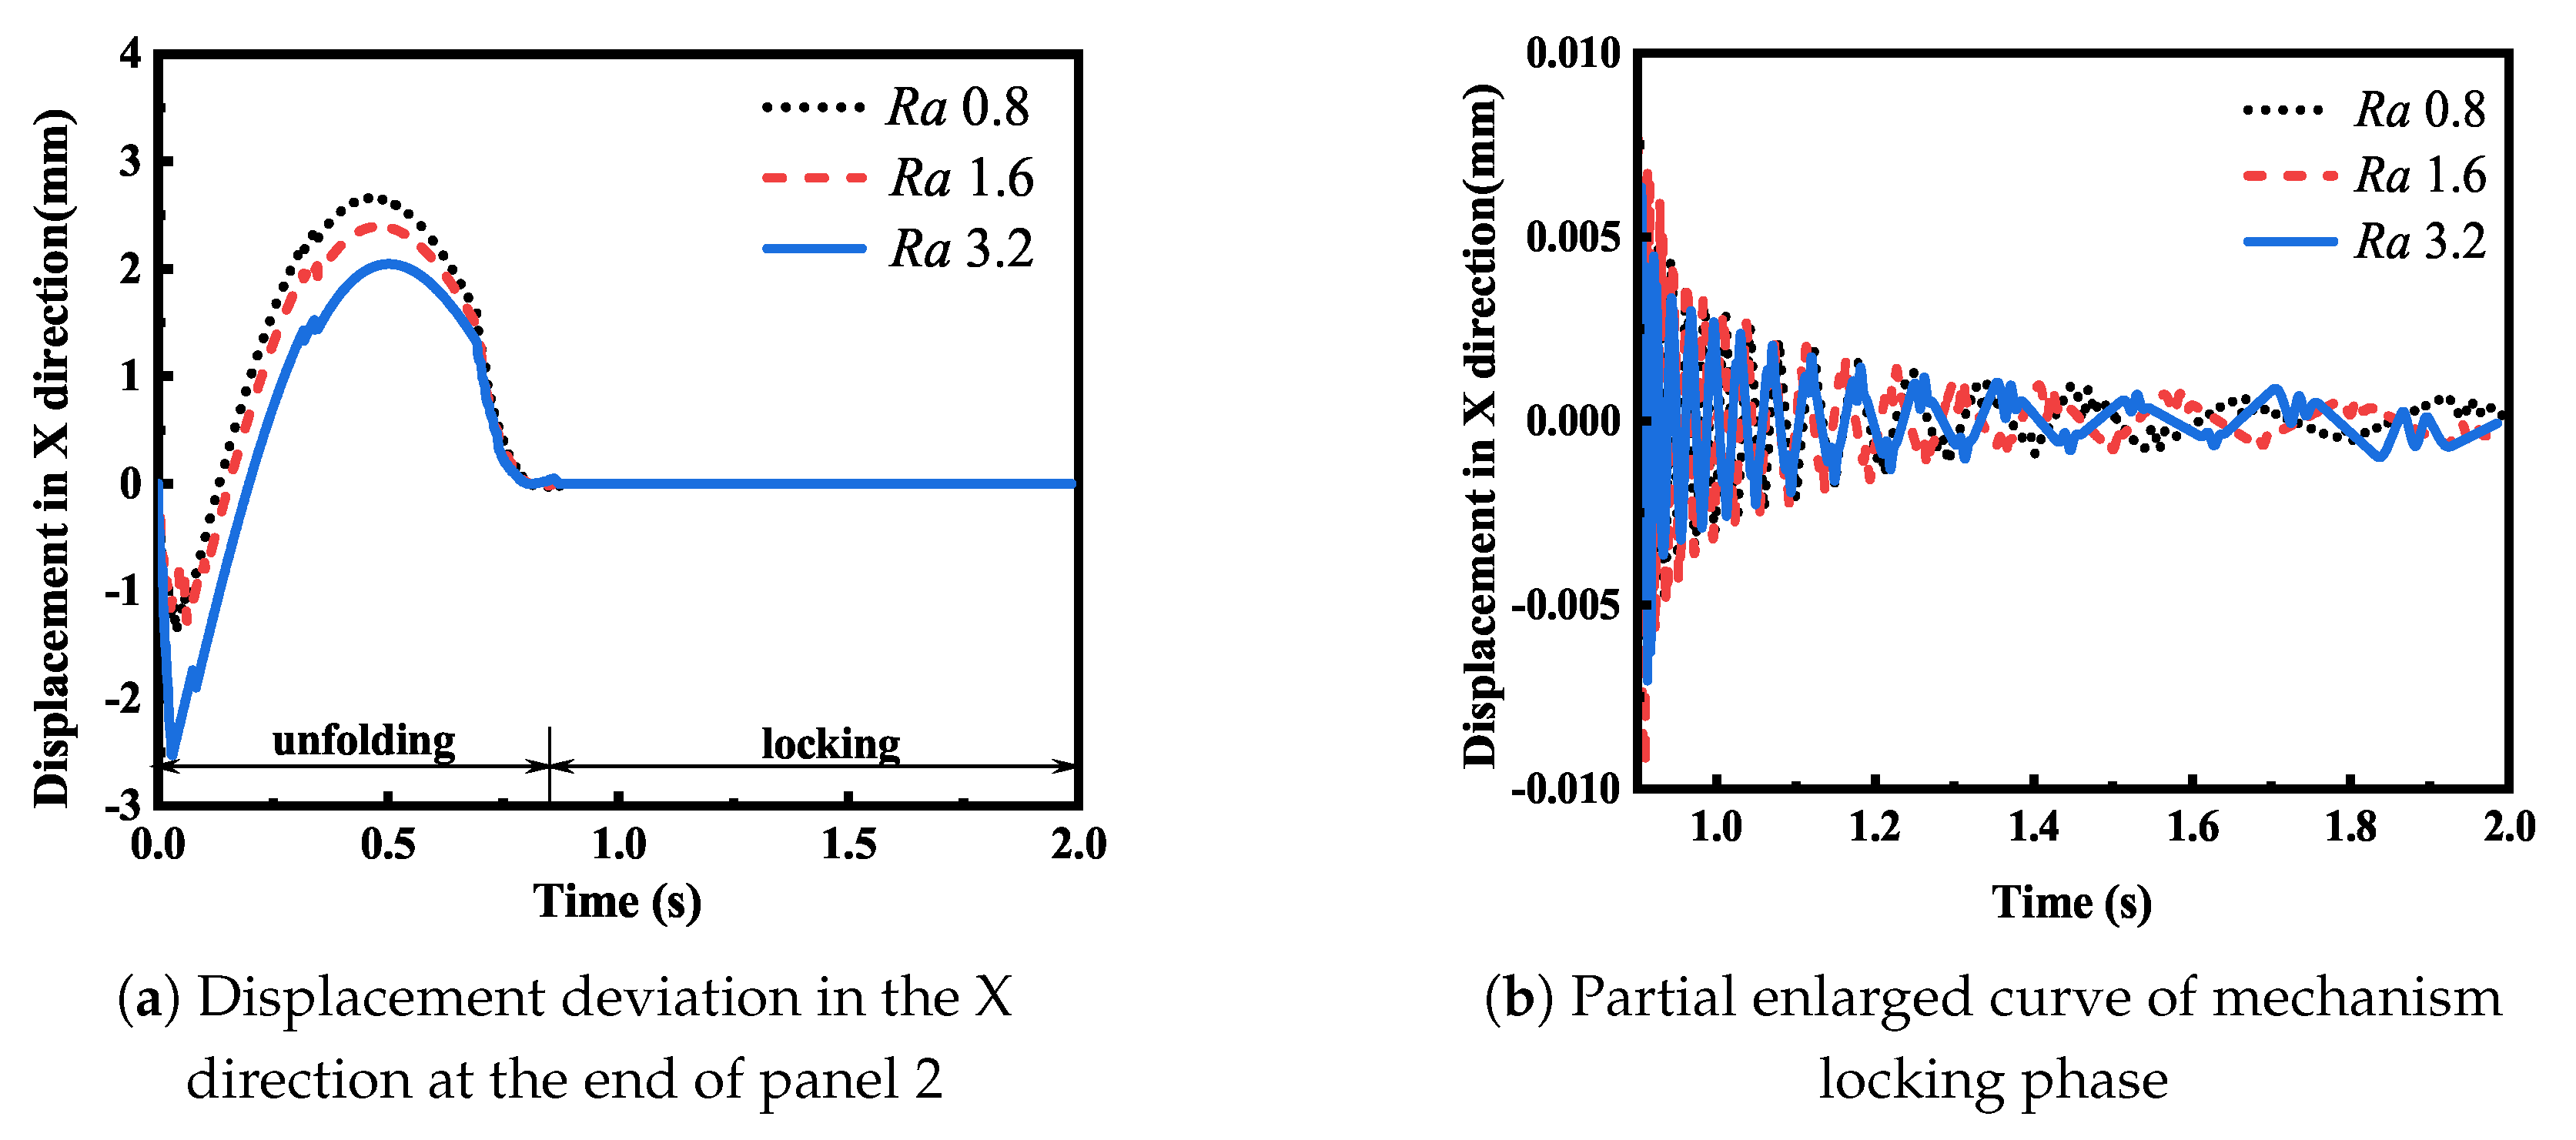
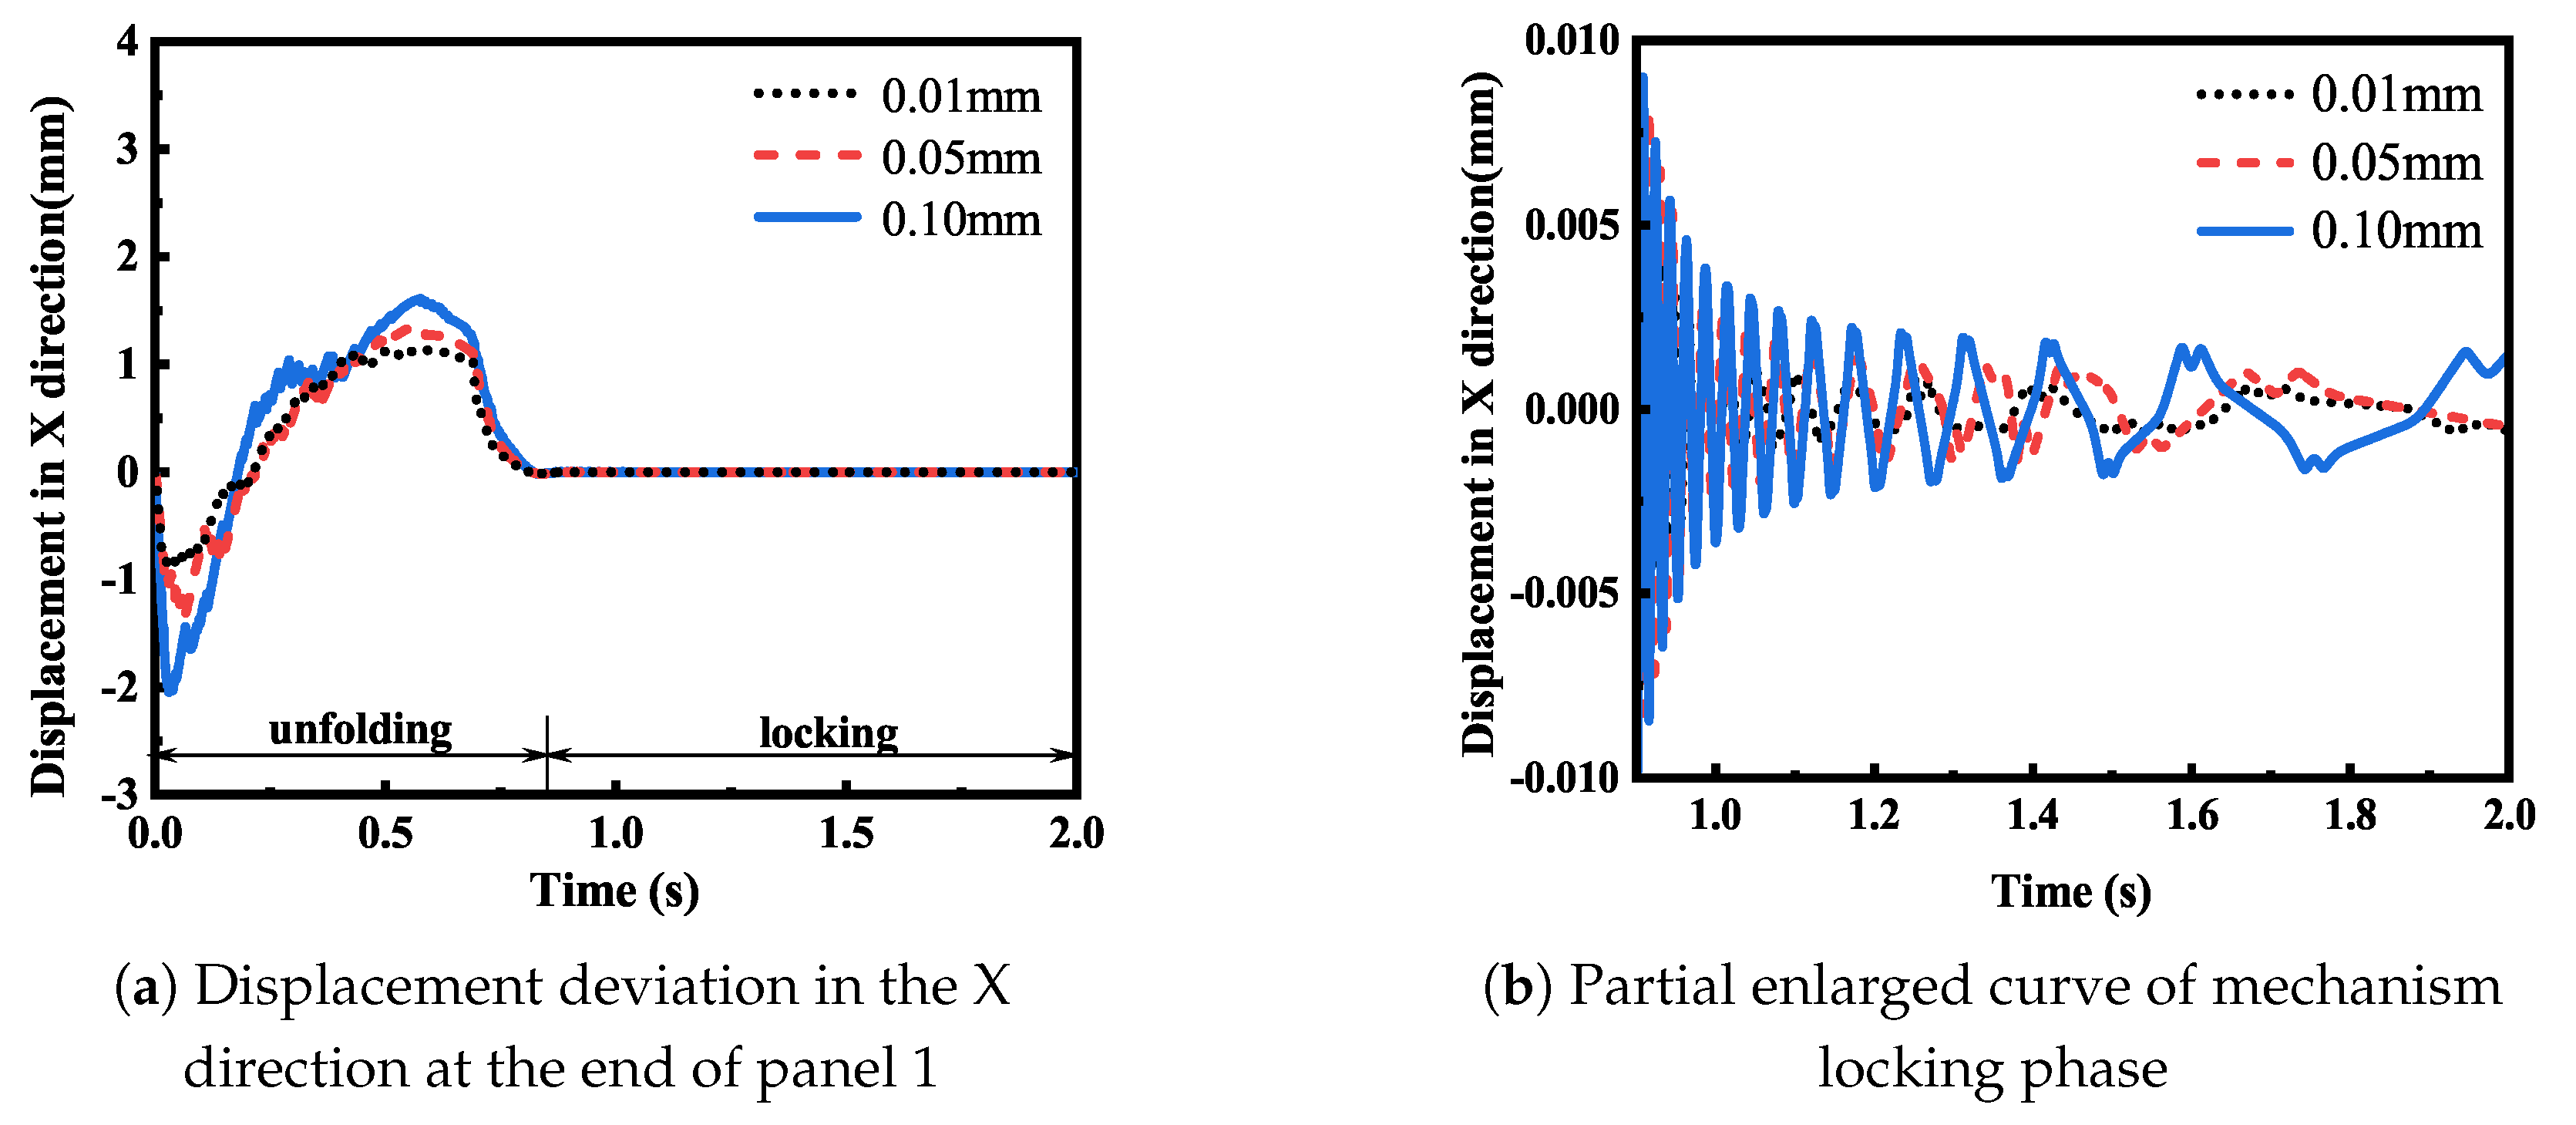
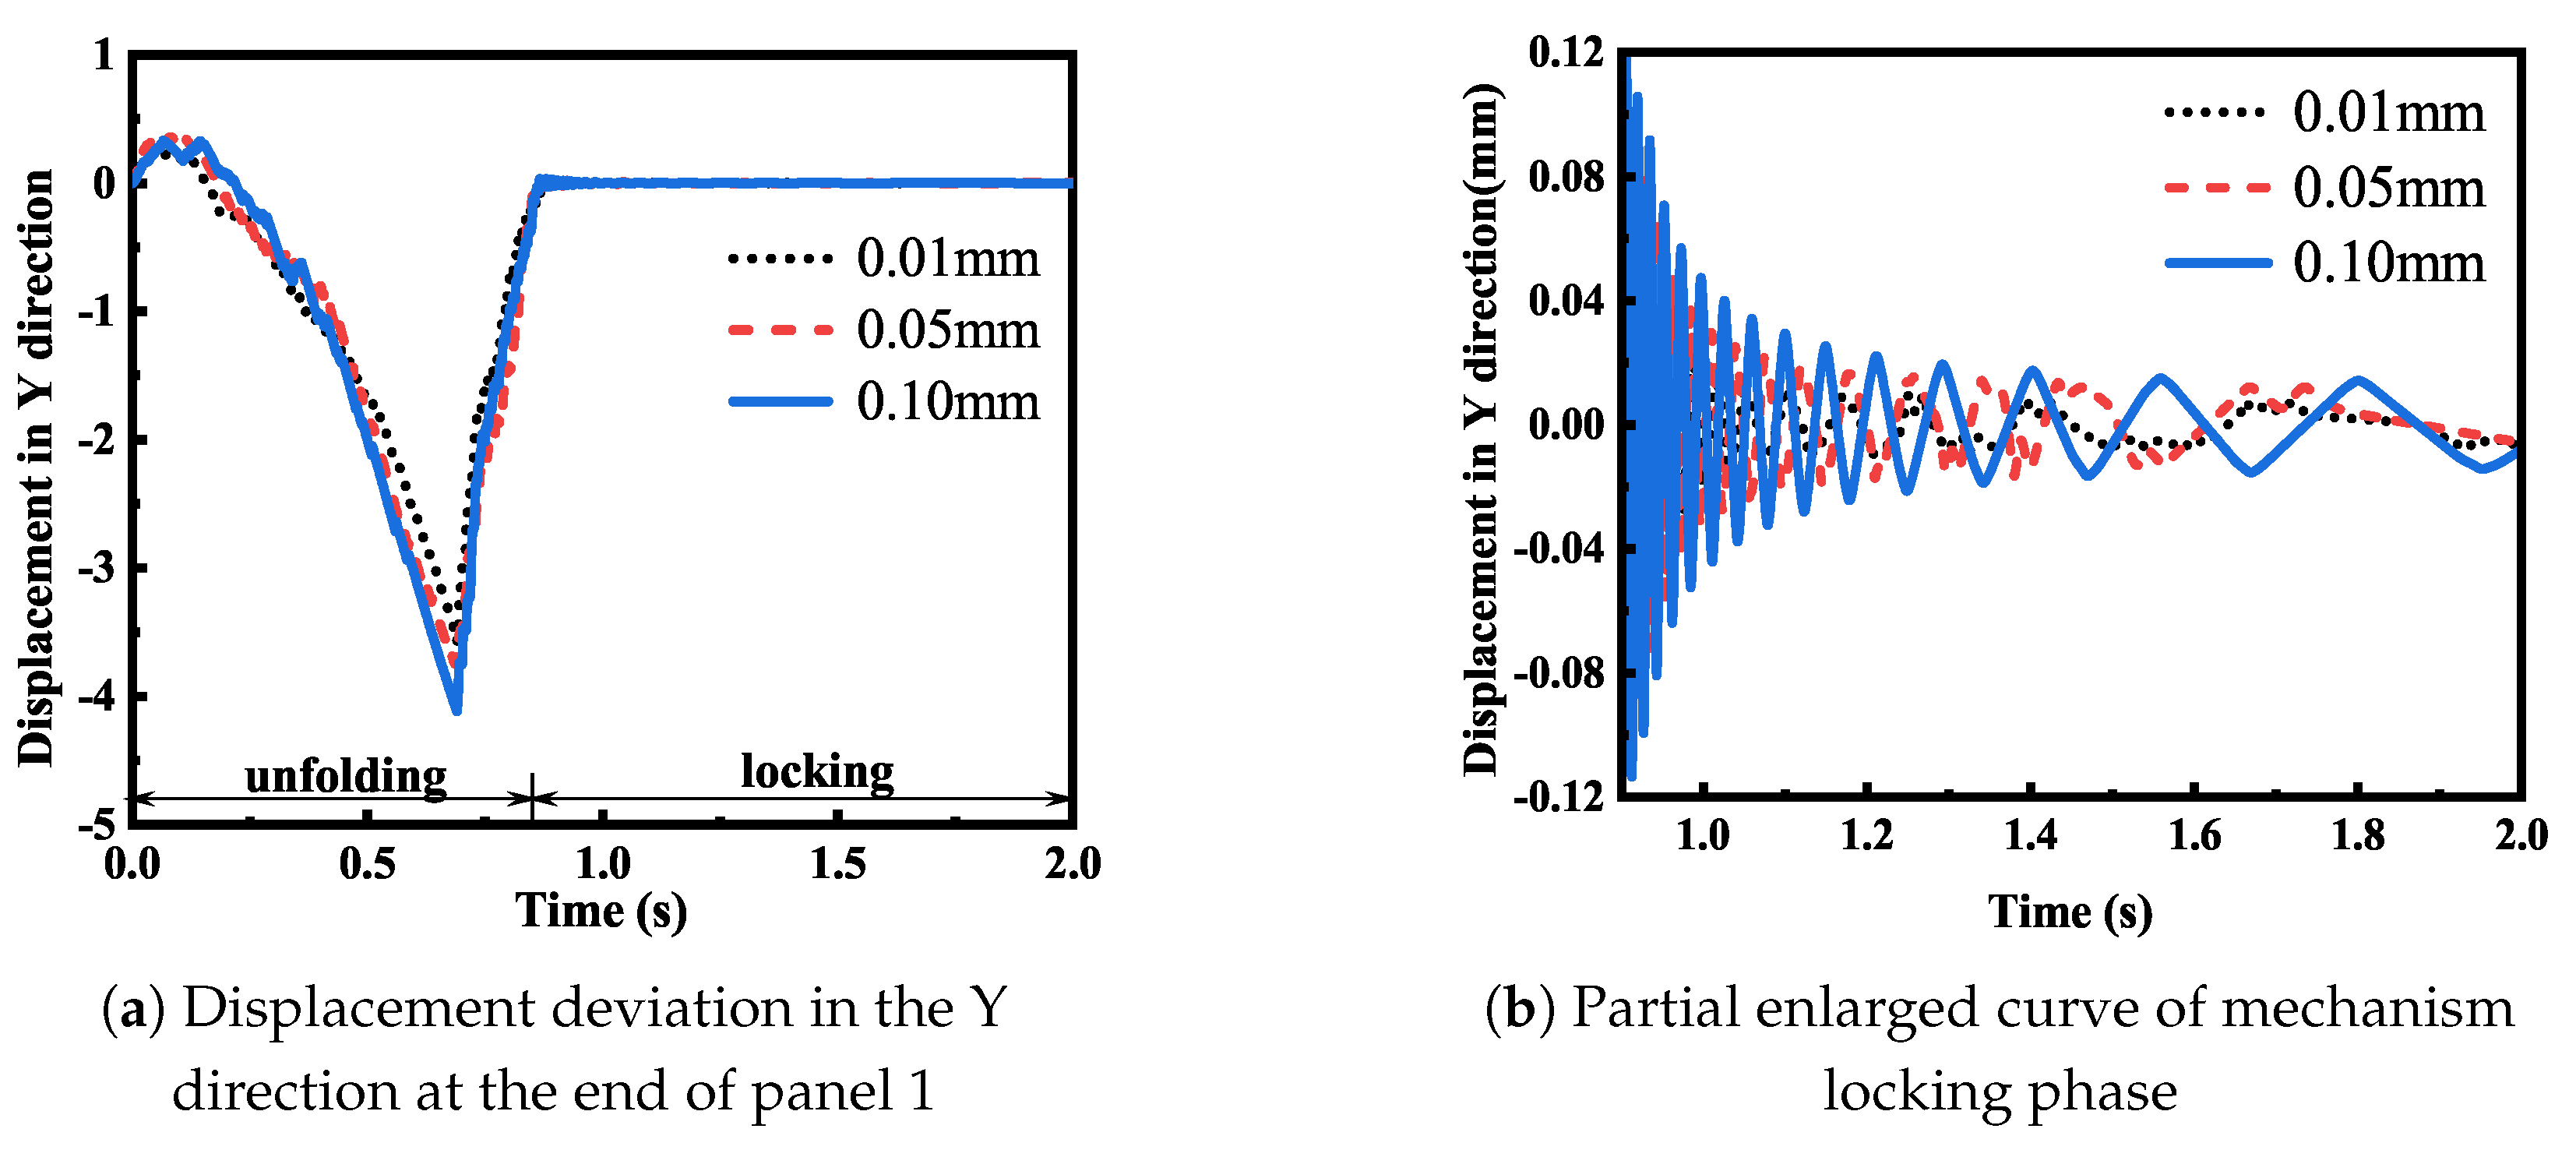
Then, the displacement deviation of panel 1 and panel 2 under different roughness values was analyzed.
Figure 10,
Figure 11,
Figure 12 and
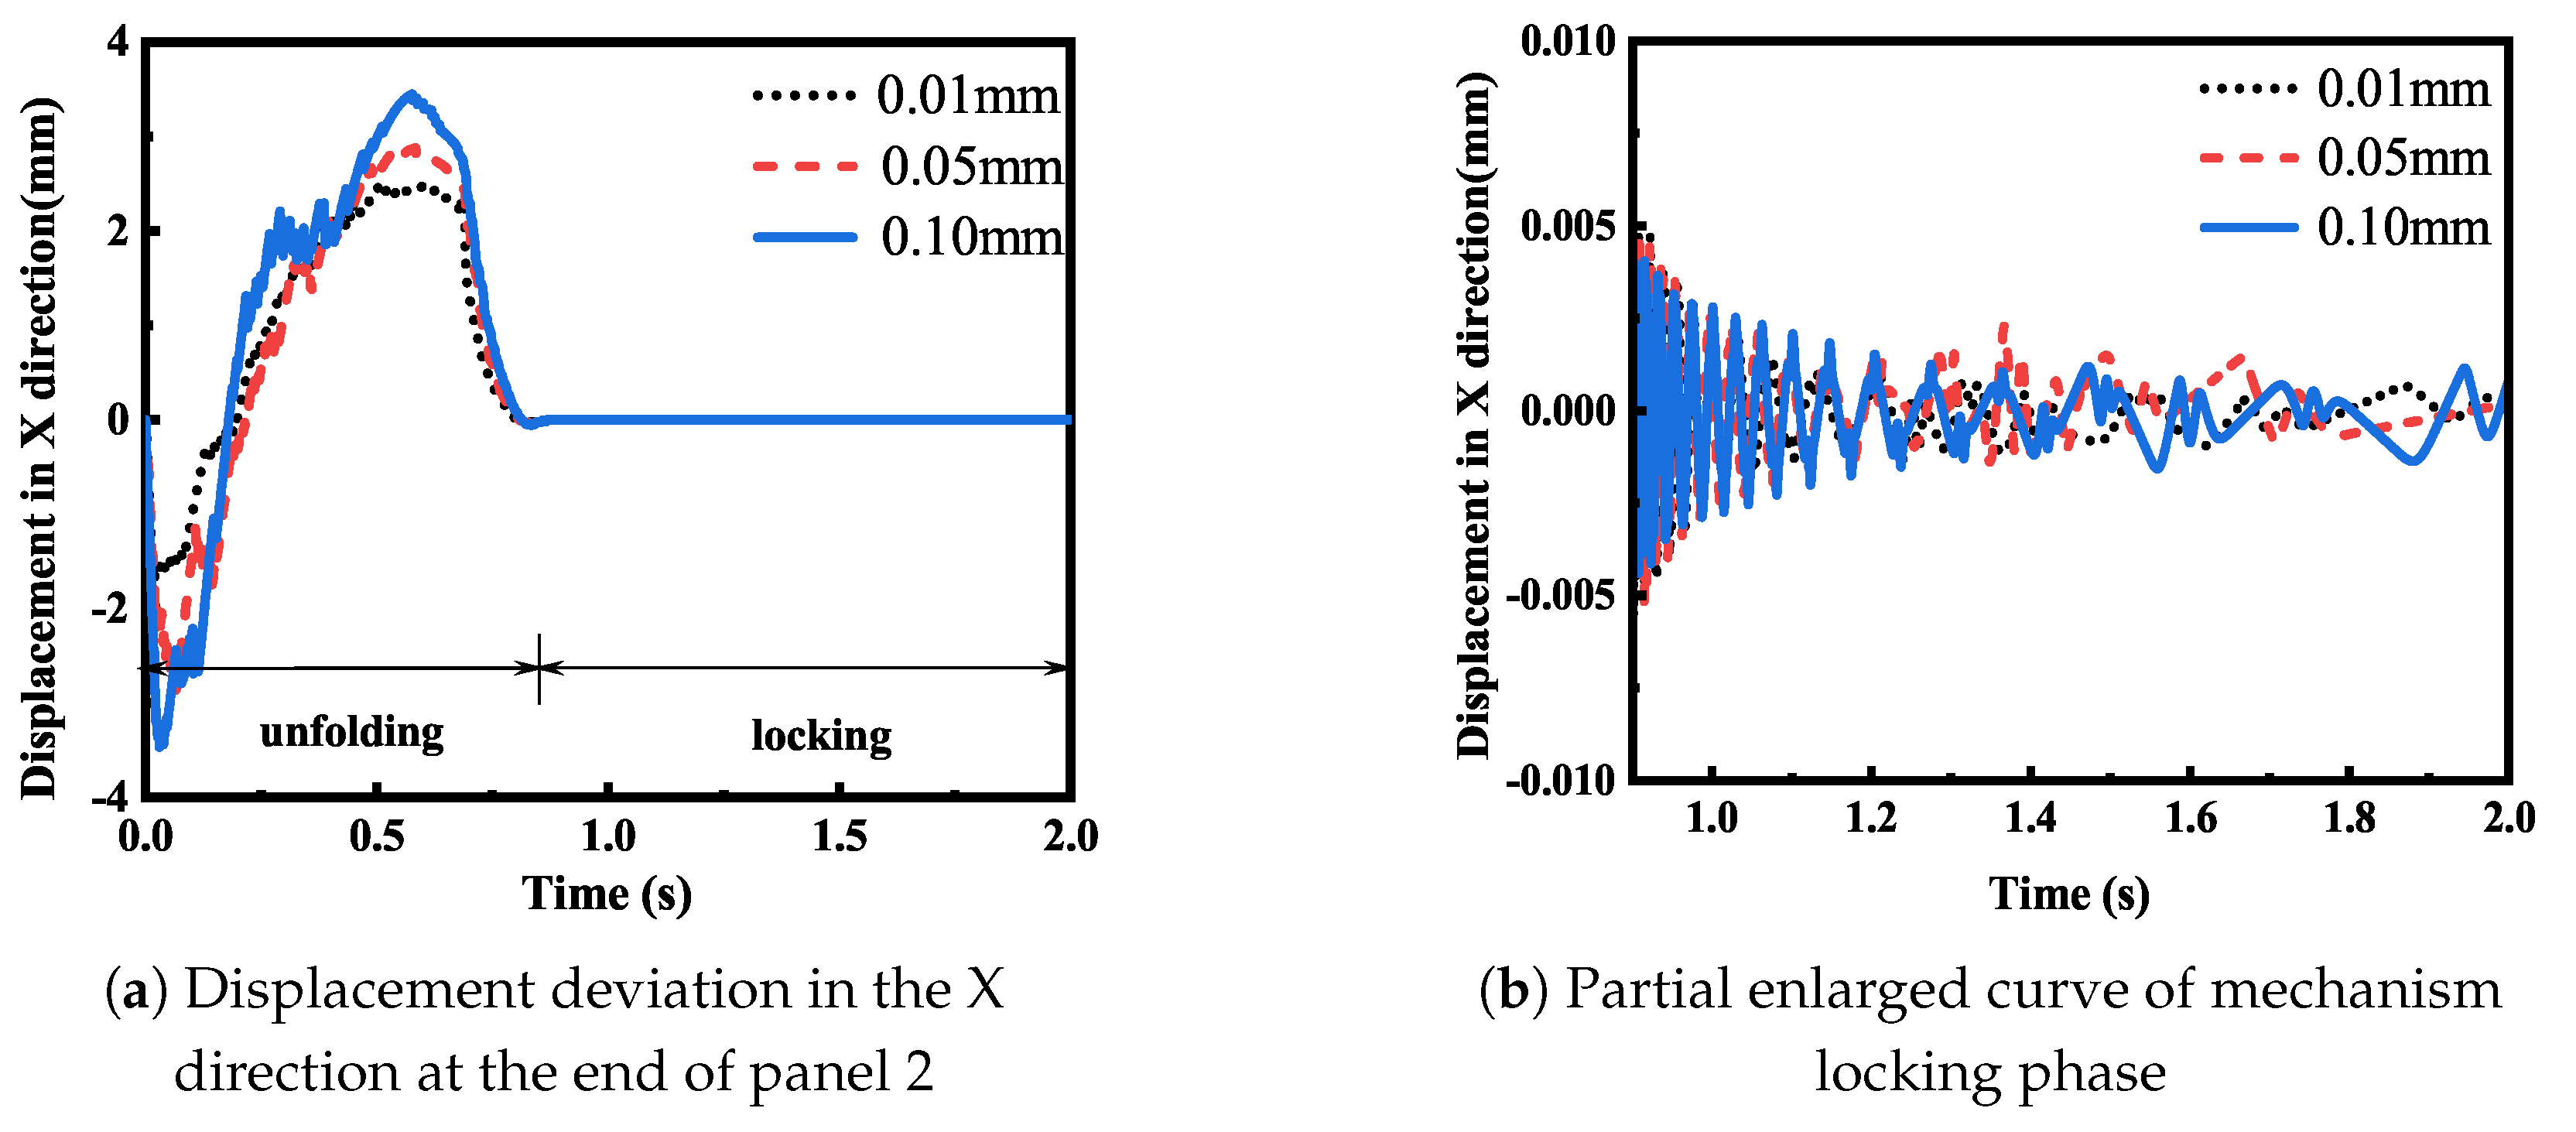
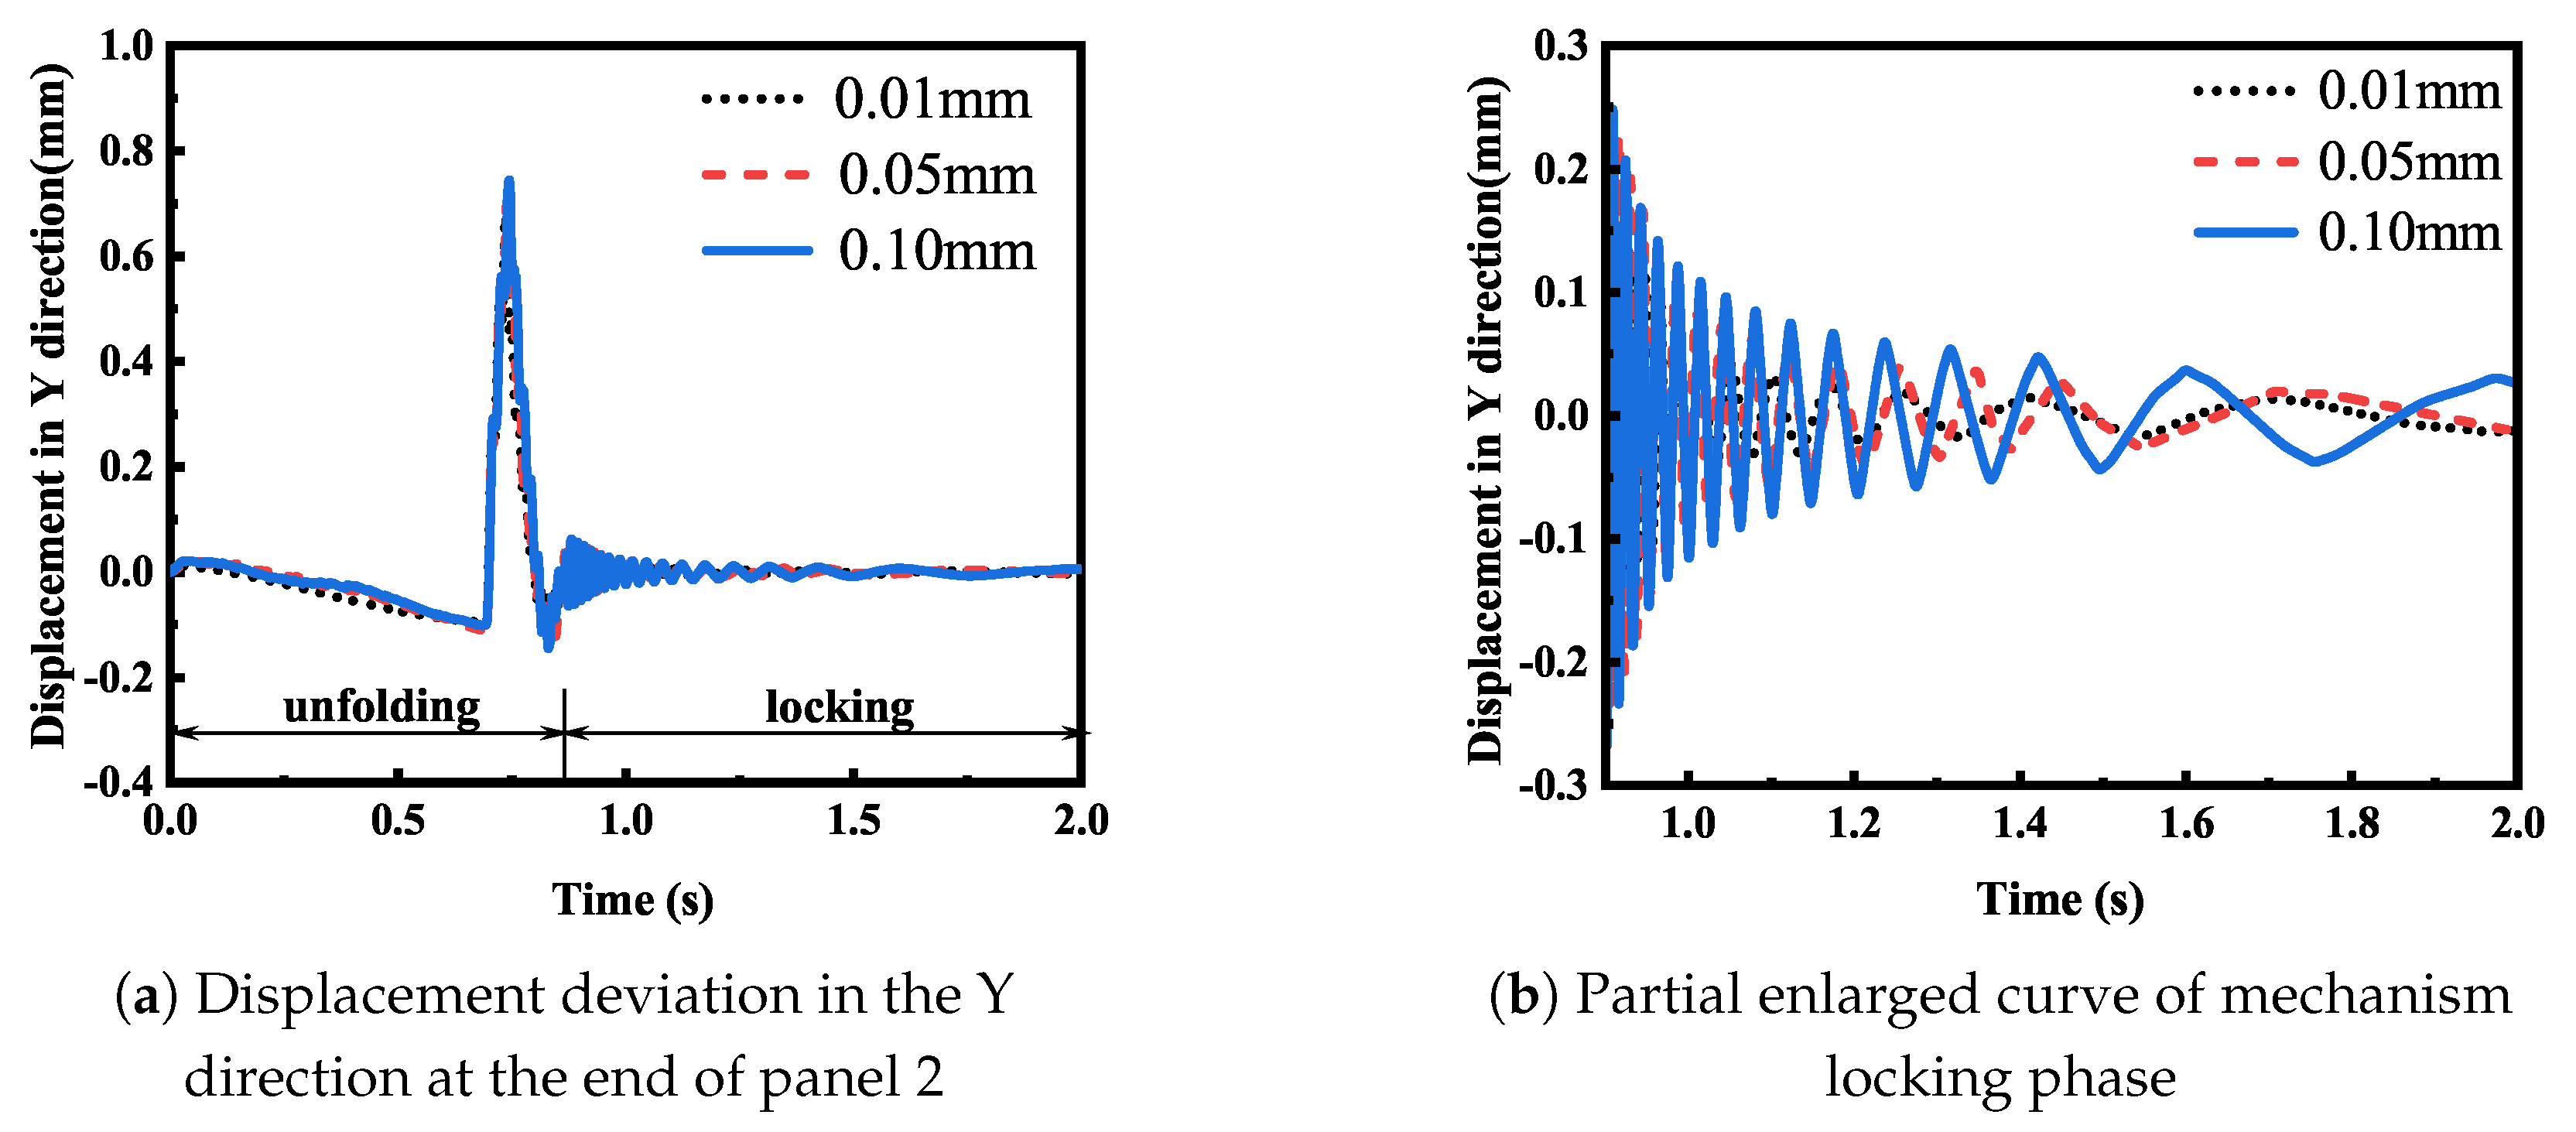
Figure 13 show that in the development stage, the smaller the joint roughness, the greater the displacement deviation generated by the panel. In the locking stage, the smaller the roughness, the larger the flutter amplitude of the mechanism locking moment, but when the mechanism gradually became stable, the flutter amplitude of the different roughness values was basically similar. According to the analysis, this is because in the development stage of the developing mechanism, the force at the joint is larger, and the contact deformation generated by the collision is larger. Therefore, the contact force at the joint will have a greater impact on the structure, and the greater the roughness, the greater the contact force at the joint, and the more obvious the damping effect on the movement of the mechanism. In the locking stage, the impact force caused by the locking instantaneous impact still has a great influence. However, as the internal motion of the stable joint of the mechanism decreases, the force decreases. At this time, the flutter effect of the solar panel is mainly affected by the overall flutter of the mechanism, and the impact of the contact force at the joint on the mechanism is basically ignored.
By comparing the simulation results in
Figure 10a and
Figure 12a, it can be seen that the displacement deviations of panel 1 and panel 2 in the X direction were similar in the development stage, and the displacement deviation of panel 2X was about twice the deviation of panel 1. By comparing the simulation results in
Figure 11a and
Figure 13a, it can be seen that the displacement deviations of panel 1 and panel 2 in the Y direction were not similar, and the deviation of the 2Y direction of the panel was smaller. The analysis suggests that this is because the panel has several support rods as constraints in the Y direction, and there is no additional support in the X direction, so the displacement deviation in the X direction will be superimposed with the superposition of the panel.
Compared to the simulation results in
Figure 10b and
Figure 12b, it can be seen that the displacement deviation in the X direction of the end of panel 2 decayed faster after locking, and the displacement deviation in the X direction was lower than that in the 1X direction of the panel after relative stability. By comparing the simulation results in
Figure 11b and
Figure 13b, it can be seen that the displacement deviation in the Y direction of panel 2 after stabilization was larger than that of panel 1. This is because there are relatively few support rods connected with panel 2, and they are subject to less locking torque after locking, so they can reach a stable state faster. However, due to the restriction, and panel 1 has a greater constraint in the Y direction than panel 2, panel 2 has worse stability in the Y direction than panel 1.
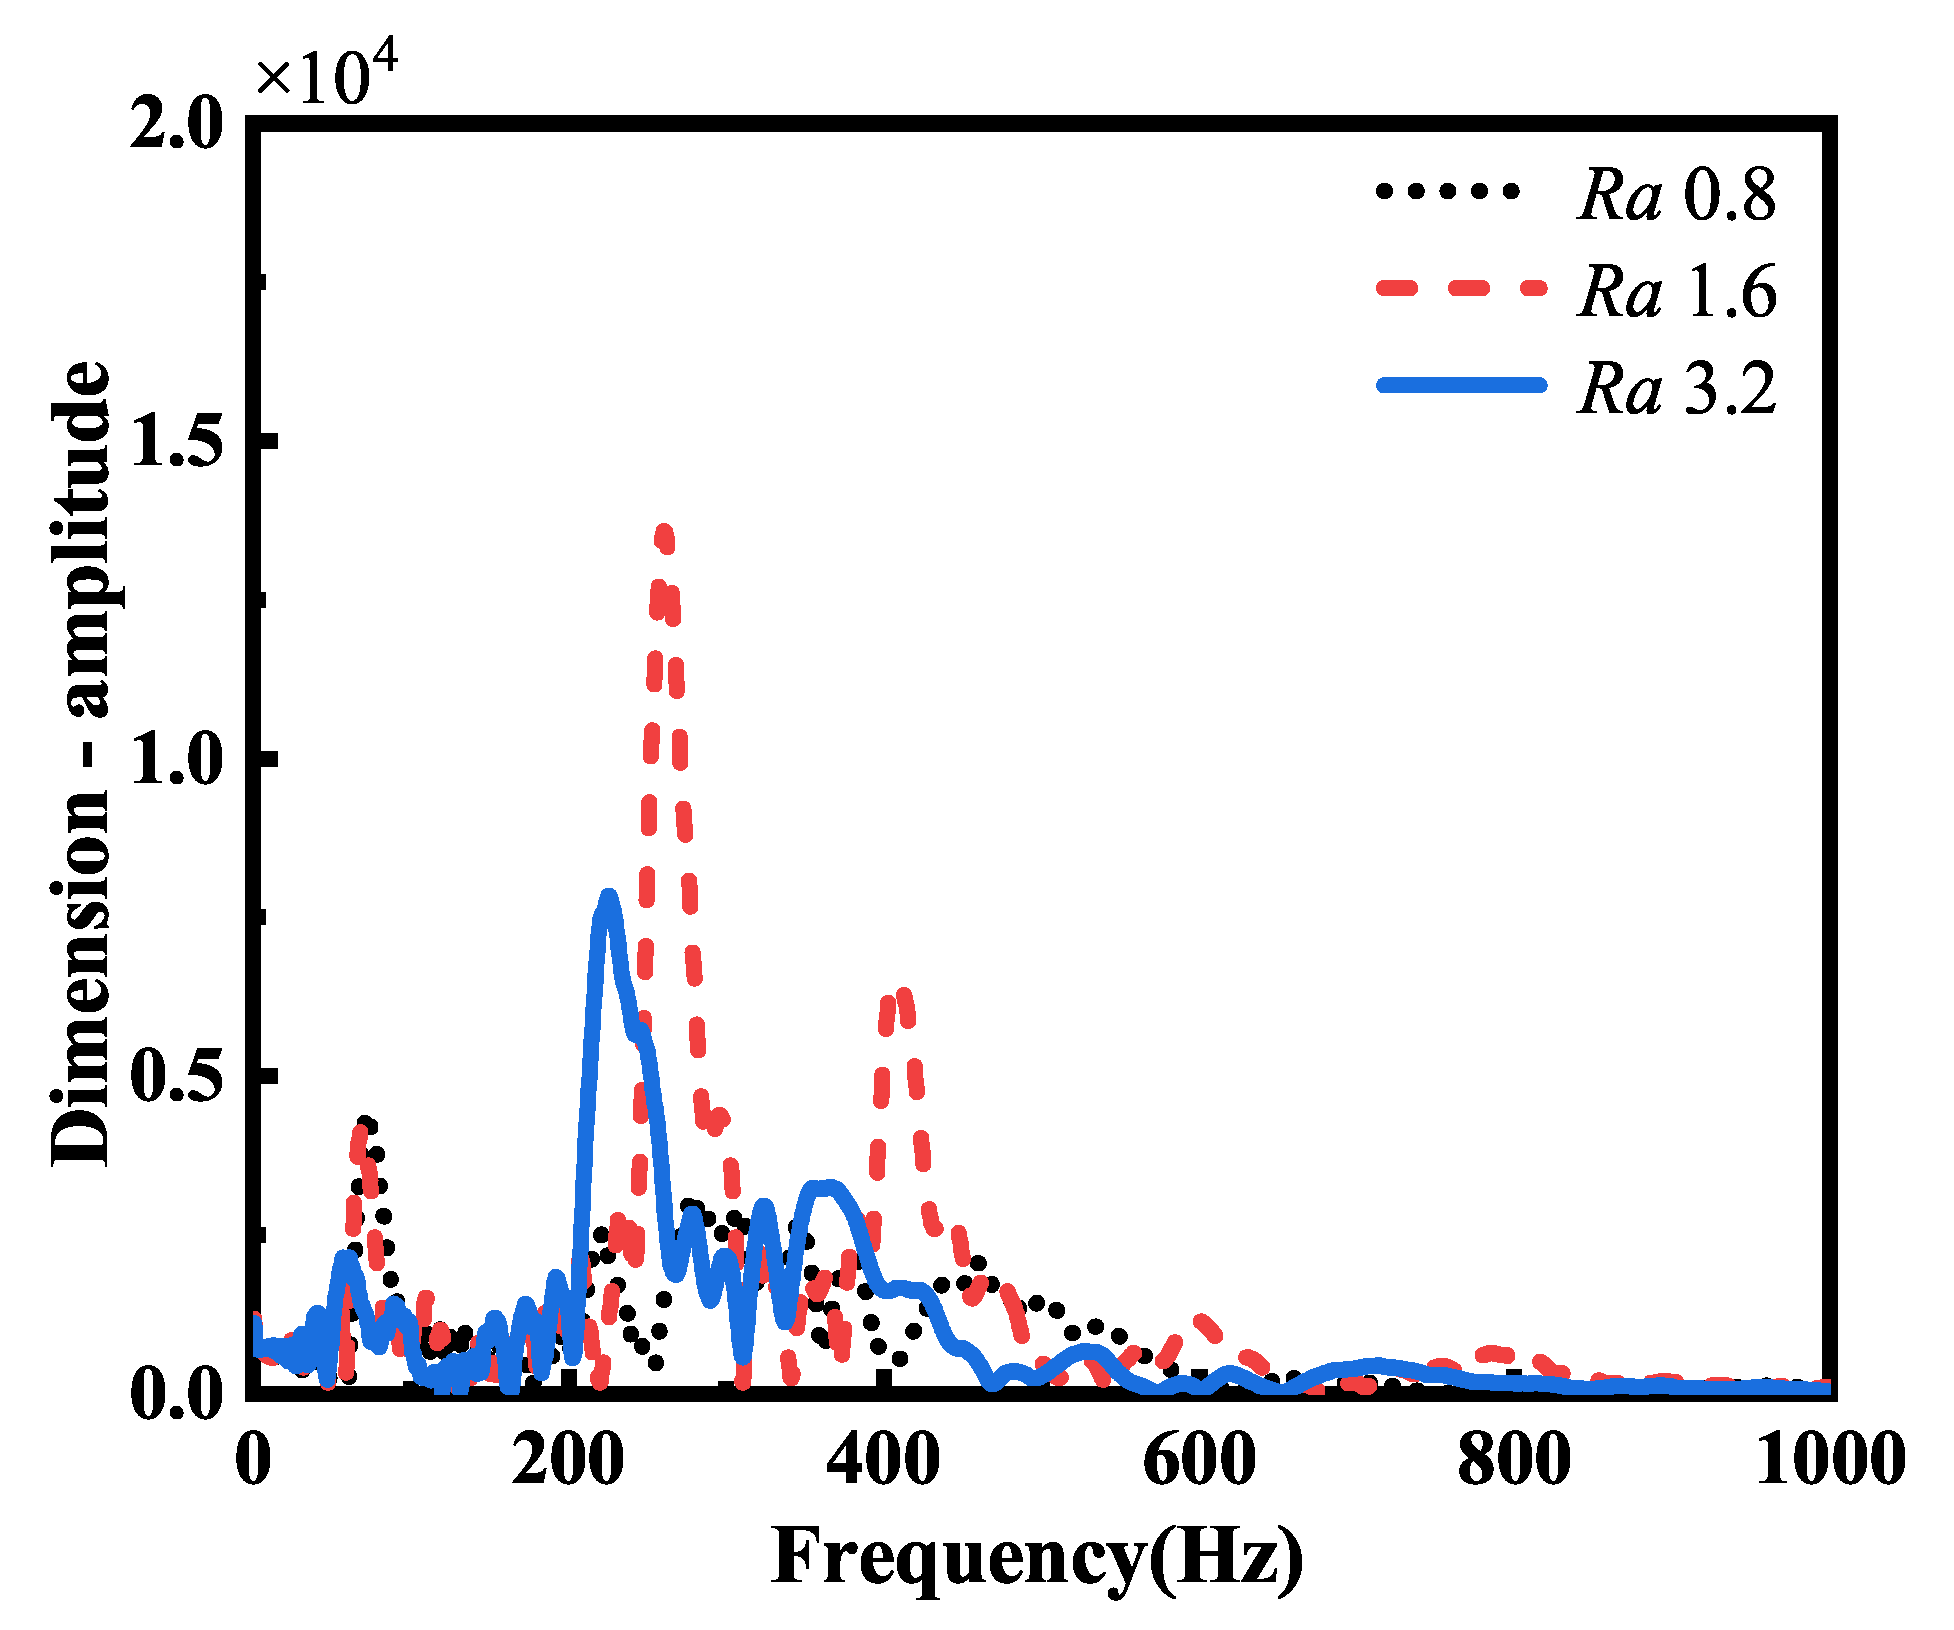
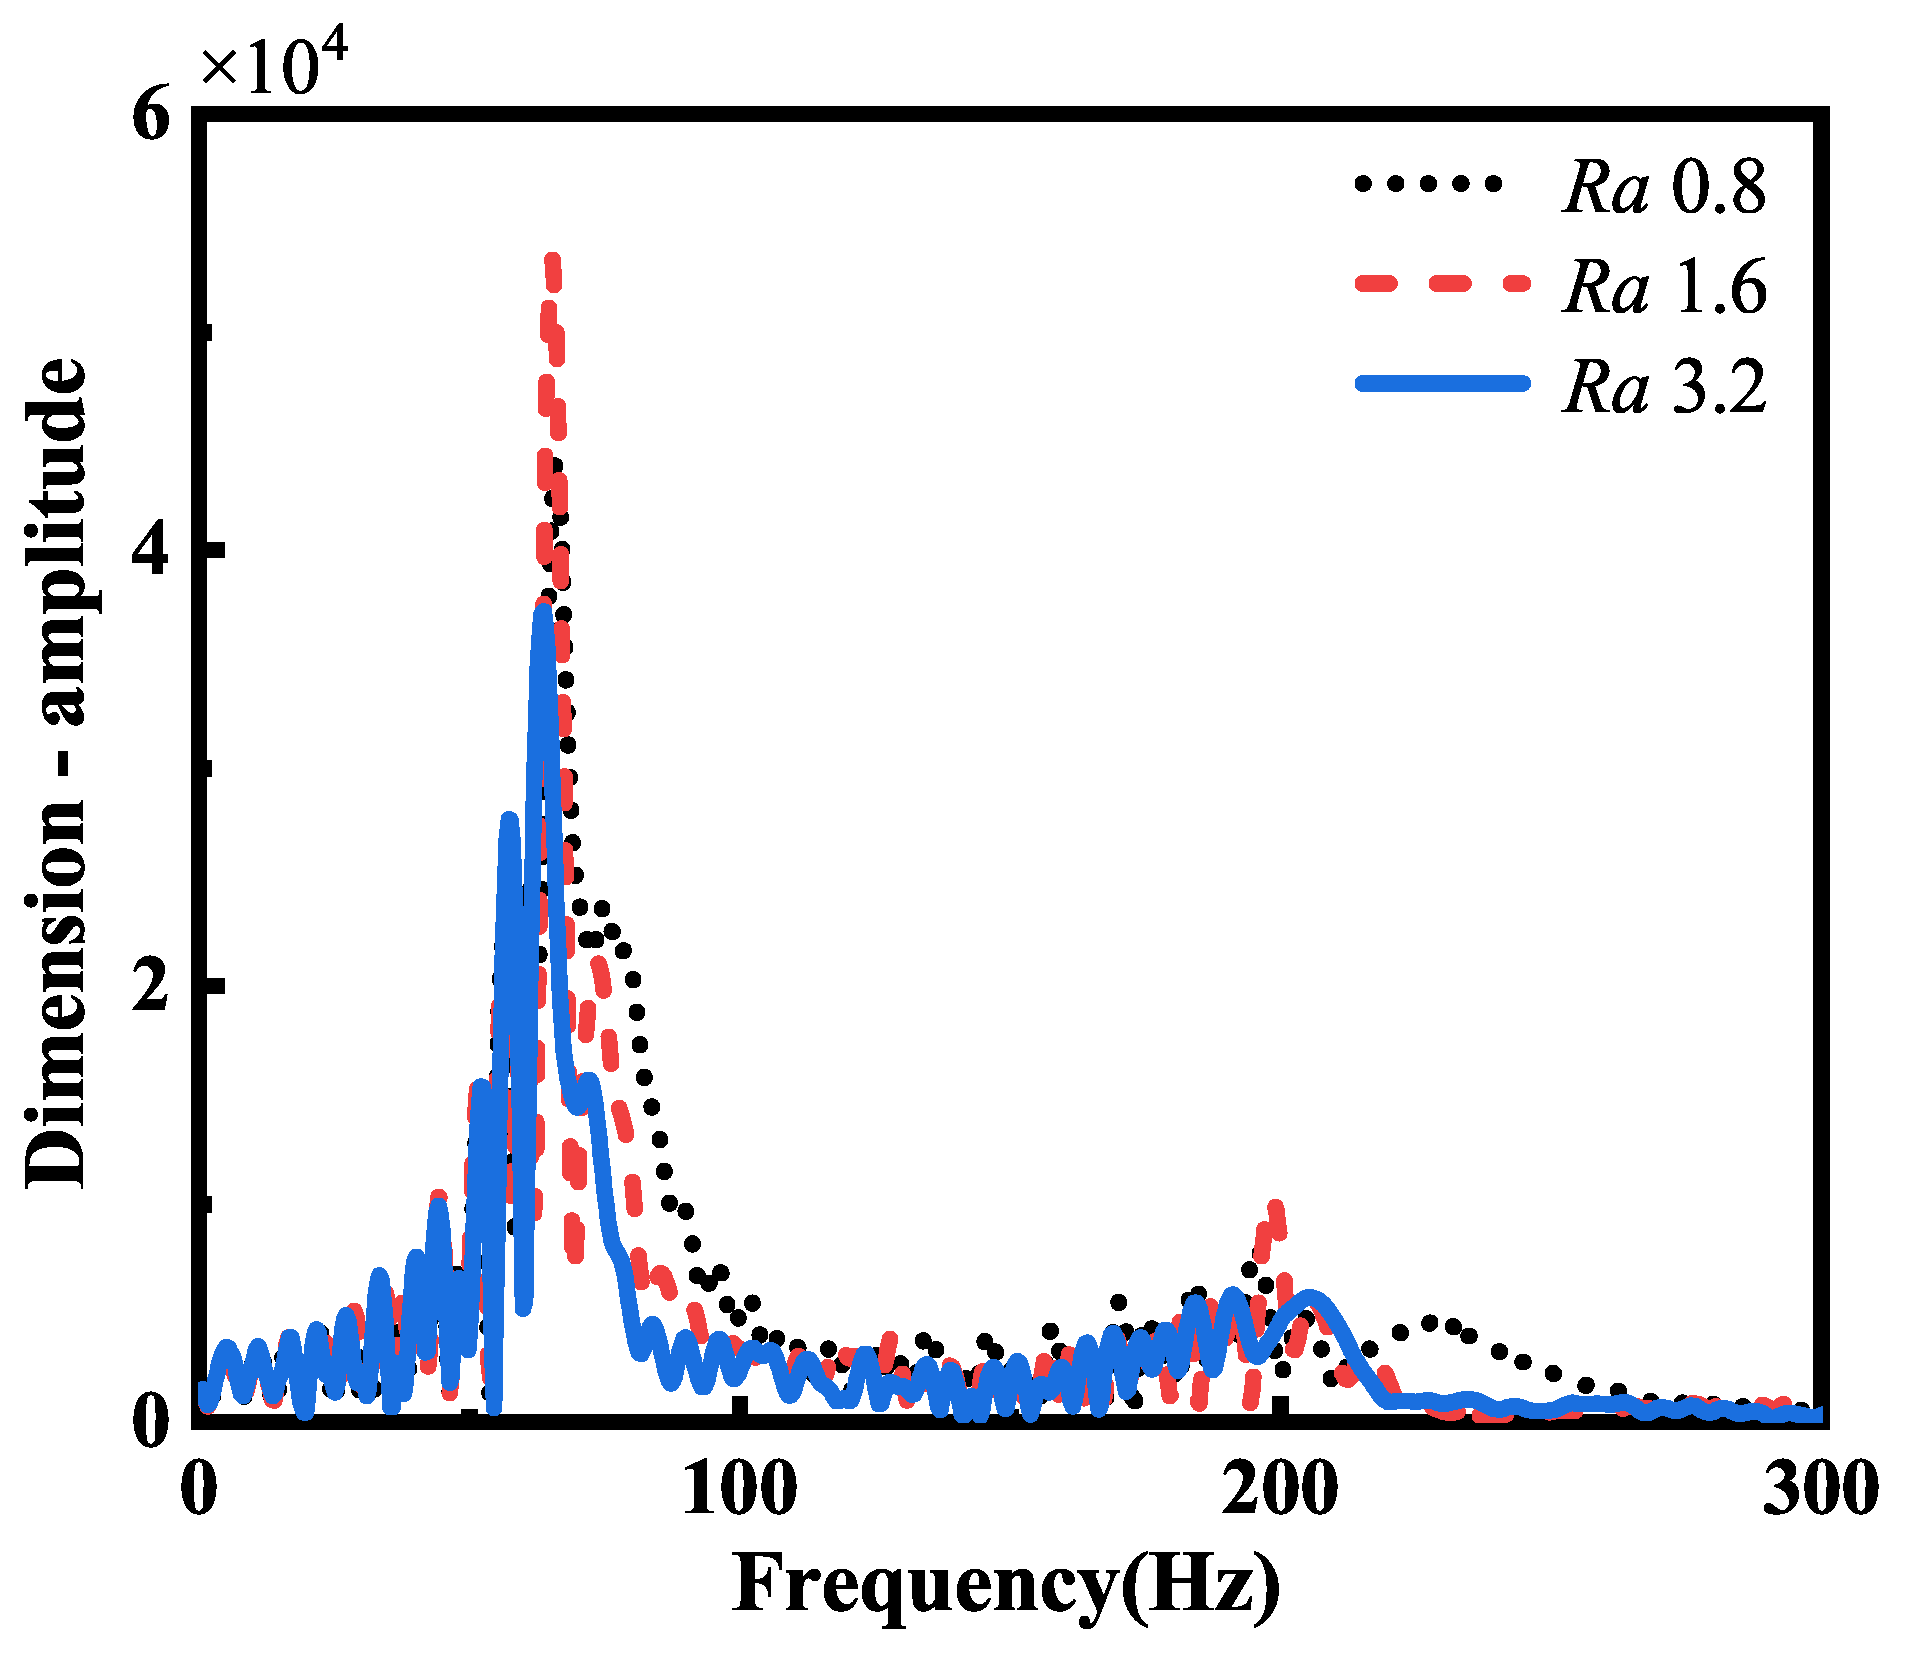
Transverse comparison of the joint spectrum under different roughness values shows the acceleration spectrum diagram of panel 1, as shown in
Figure 14. It can be seen from the diagram that as the roughness of the contact surface continued to increase, the vibration amplitude of panel 1 first increased and then decreased, while the vibration amplitude frequency kept decreasing. When the roughness was an
of 0.8, the vibration peak was the lowest, and the vibration amplitude frequency was the lowest. At this time, the system was relatively stable, and the vibration was not obvious, but the vibration at low frequency can easily cause structural damage, and the energy transmission speed will be slower. When the roughness was an
of 1.6, the vibration crest was the largest, and the change of the peak and trough was the most obvious, thus indicating that the roughness of an
of 1.6 has obvious vibration phenomenon, which can effectively help to identify and evaluate the dynamic characteristics of the system. Furthermore, the vibration amplitude frequency was the highest, and the system response speed was faster. As a moving part directly connected to the spacecraft, panel 1 needs a faster system response speed to meet the needs of rapid response in the process of spacecraft movement, so in the design process, the roughness of panel 1 needs to be selected as an
of 1.6.
Figure 15 shows the acceleration spectrum of panel 2. It can be seen from the figure that the vibration amplitude of panel 2 varied similarly under different roughness conditions, and the vibration frequency was mainly between 90 Hz and 100 Hz. However, as the roughness increased, the vibration peak of panel 2 tended to increase first and then decrease; therefore, the larger the roughness is, the faster the attenuation speed will be. When the roughness was an
Ra of 3.2, it had the fastest attenuation speed and lowest vibration peak. Therefore, the system has higher damping at this time, the vibration can dissipate faster, and the dynamic response of the system will be more stable. As the end transmission part of the expansion mechanism, panel 2 needs to reduce the vibration phenomenon of the system as much as possible to ensure the stability and reliability of the system operation. Therefore, in the design process, the roughness of panel 2 should be selected as an
Ra of 3.2.
4.2. Analysis of the Influence of Rough Clearance Surface Clearance Size on System Motion Parameters
The spatial expansion mechanism starts to expand after it arrives at the working environment. The whole development stage is divided into a dynamic expansion process and a locking process after deployment. Since the typical roughness of the joint of the spatial expansion mechanism is an Ra of 1.6, we set the clearance size of the nonideal joint mechanism as 0.01 mm in turn when the roughness was at Ra values of 1.6 mm, 0.05 mm, and 0.1 mm. We then conducted simulation analysis.
Figure 16a shows that the range of the unfolding angle deviation decreases with the increase in the clearance size in the unfolding stage, and we found that the attenuation speed of the angular deviation increased with the increase in the clearance in the locking stage. This is because in the process of development, too small a joint clearance will enhance the collision phenomenon of the joint shaft pin, thus resulting in the mechanism being more prone to unstable motion in the development stage and increasing the deviation range of the development angle. After locking, as shown in
Figure 16b, a large clearance reduced the damping effect of the mechanism, reduced the stability of the mechanism after locking, and increased the attenuation speed of the angle deviation.
Figure 17,
Figure 18,
Figure 19 and
Figure 20 show that in the expansion stage of the mechanism, as the clearance increased, the displacement deviation range of the X and Y directions between panel 1 and panel 2 increased. This is because a larger clearance will reduce the constraints of the panel in the development process, thus resulting in a larger shift of the panel. In the process of expansion, the clearance change has the least influence on the displacement deviation of the panel in the Y direction, so the panel has higher stability in the Y direction during the development process. In the locking stage of the mechanism, the stability of panel 2 becomes worse after the mechanism is stabilized due to the high tilt degree of its support rod 6 and support rod 7 after the mechanism is fully unlocked.
Figure 21 shows the acceleration spectrum diagram of panel 1 under different clearance sizes. With the increase in the clearance in the process of expansion, it can be observed that the peak height of the vibration spectrum diagram decreased, and the peak became more fuzzy, which means that with the increase in the clearance, the amplitude of the vibration decreases, and the spectral resolution of the vibration signal decreases. At the same time, with the decrease in the clearance, the vibration amplitude peak lagged, thus indicating that the vibration response time of the system becomes longer. For smaller clearances, the vibration amplitude curve shows obvious fluctuation around 600 Hz, which indicates that the main vibration characteristics of the system were concentrated before 600 Hz, and the vibration mode of the system became more complex at higher frequencies.
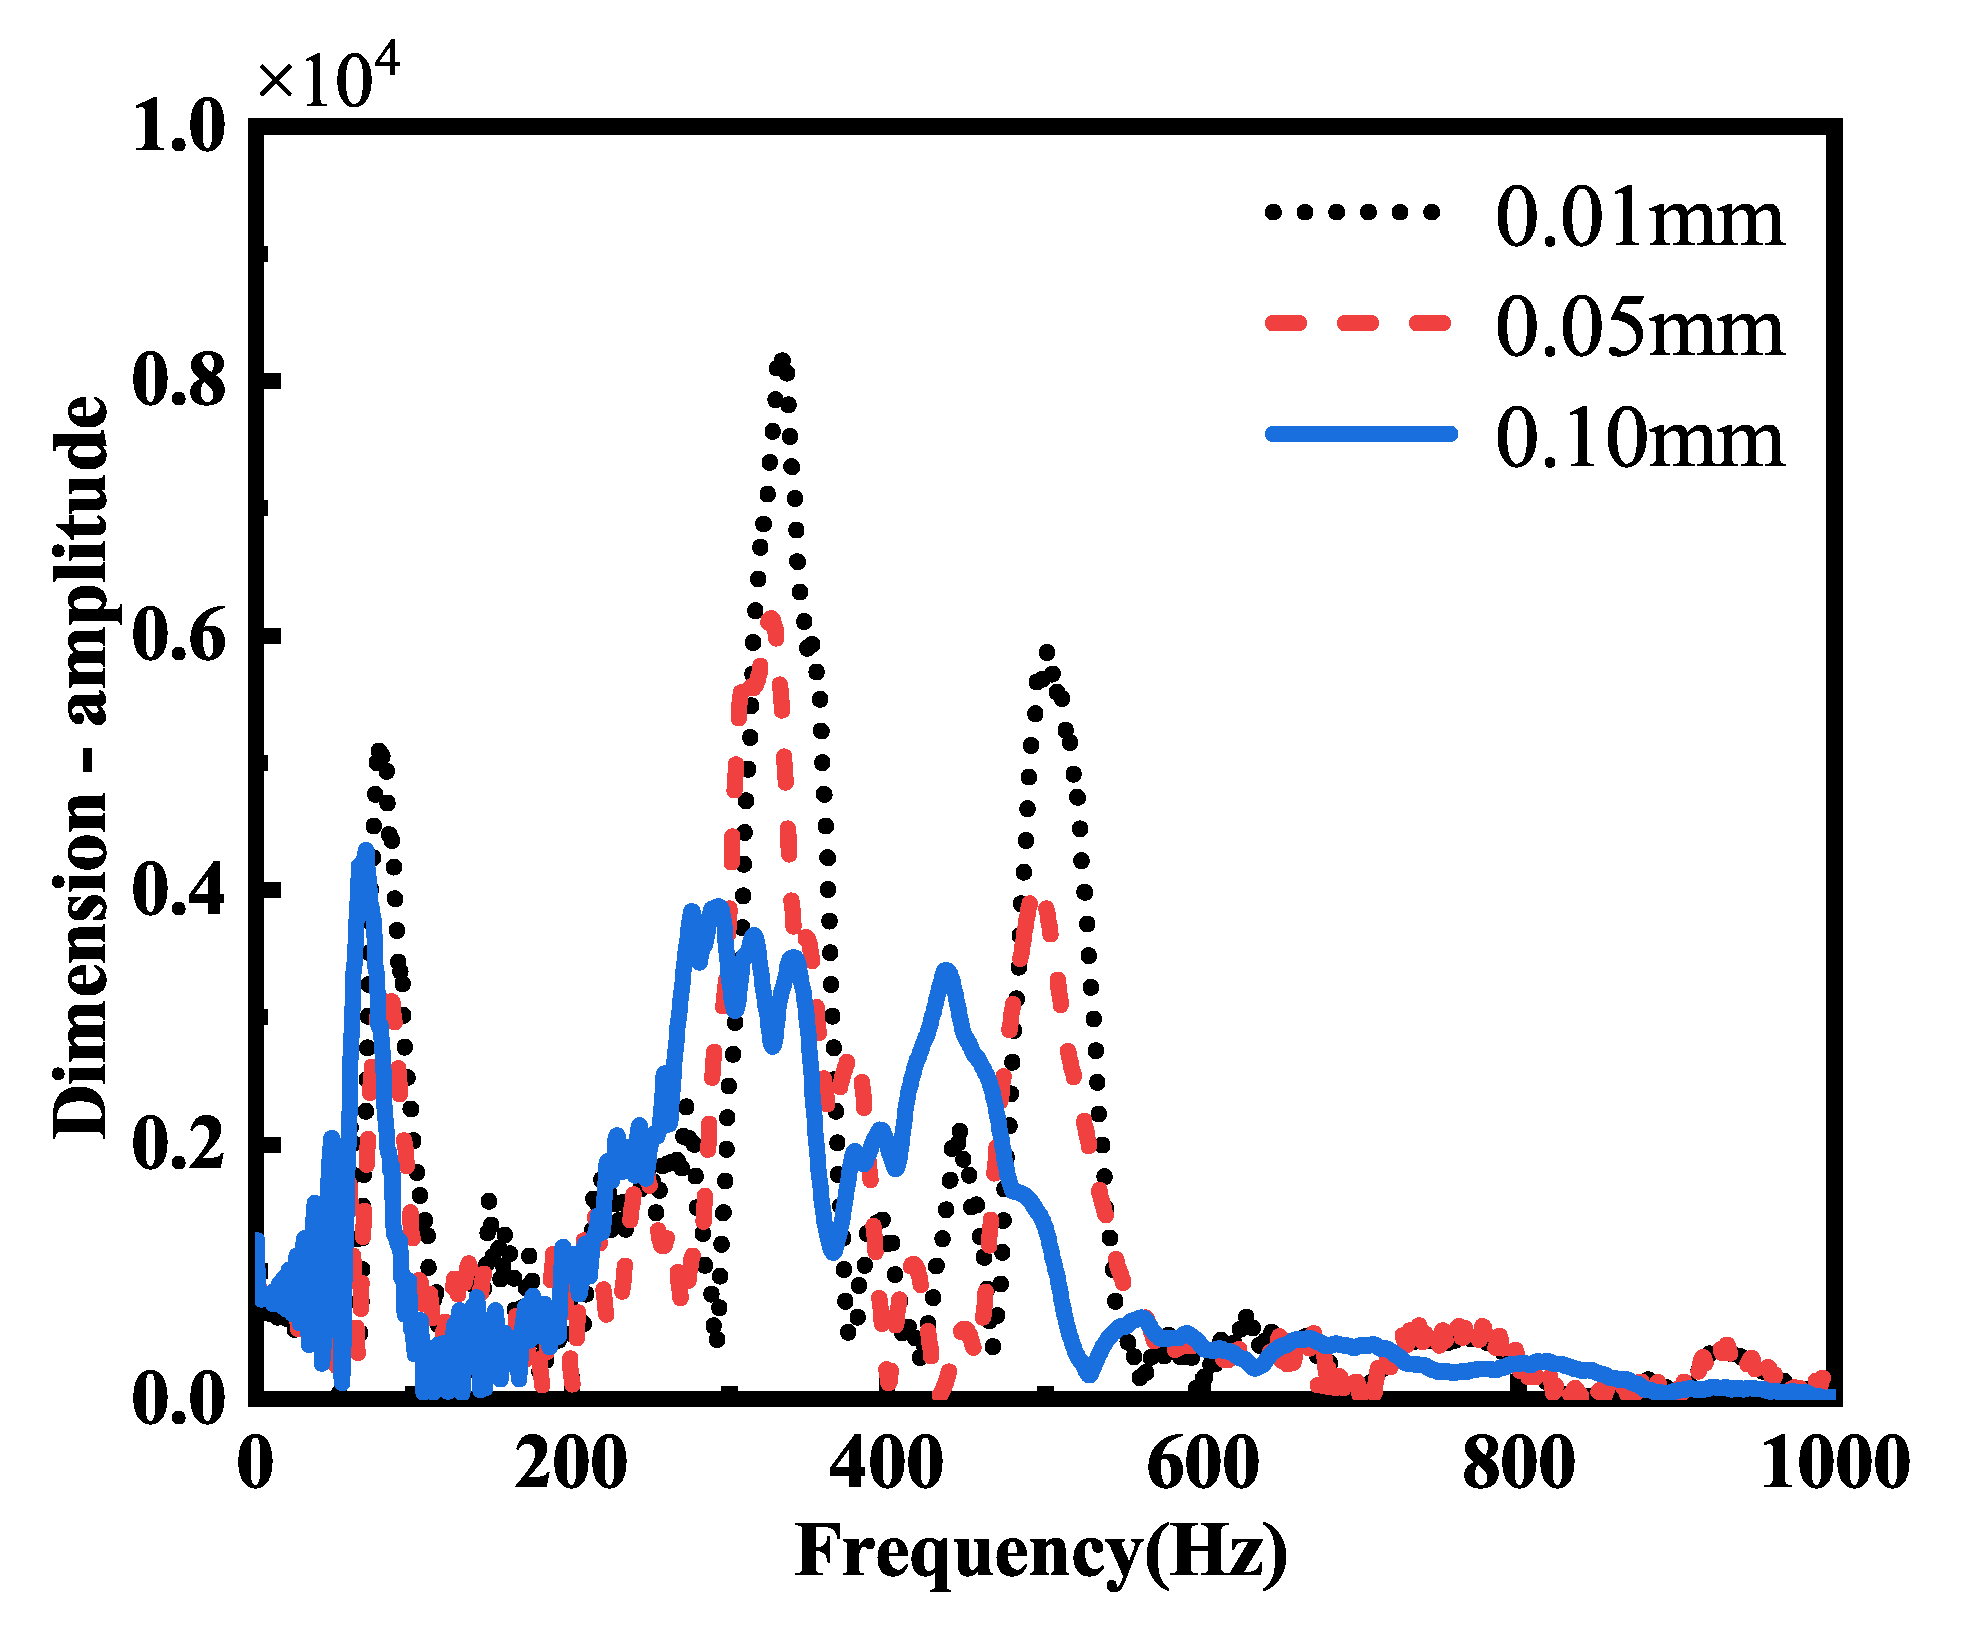
Figure 22 shows the acceleration spectrum diagram of panel 2 under different clearance sizes. With the increase in clearance, the peak of the vibration amplitude, frequency of vibration amplitude, and attenuation rate showed a trend of first increasing and then decreasing. This may be because the natural frequency of the system changes with the increase in the clearance, thus resulting in the increase in the vibration amplitude peak and vibration amplitude frequency. However, with the continuous increase in the clearance, different damping effects appeared, thus resulting in the decrease in the vibration amplitude peak, vibration amplitude frequency, and attenuation rate. By comparing
Figure 21 and
Figure 22, the amplitude of the vibration is demonstrated to have increased with the increase in the series of panels, but the corresponding frequency of the vibration peaks decreased, and the number of wave peaks decreased significantly and became more concentrated.


