Abstract
This study proposes a guidance strategy based on human–machine transition (HMT) for cooperative adaptive cruise control (CACC) truck platoon actuator failures. Existing research on the CACC platoon mainly focuses on upper-level planning and rarely considers platoon planning failures caused by actuator failures. This study proposes that the truck in the platoon creates sufficient space on the target lane through HMT when the actuator fails, thereby promoting lane changes for the entire team. The effectiveness of the proposed strategy is evaluated using the Simulation of Urban Mobility (SUMO) simulation. The results demonstrate that under conditions ensuring the normal operation of traffic flow, this guidance strategy enhances the platoon’s lane-changing capability. In addition, this strategy exhibits stronger robustness and efficiency in different traffic densities. This guidance strategy provides valuable insights into improving the driving efficiency of CACC truck platoons in complex road environments.
1. Introduction
With the significantly increased demand for road freight transport [1], trucks have become a dynamic bottleneck in urban traffic, further exacerbating the congestion situation on urban roads [2,3,4]. In recent years, autonomous driving technology has made significant progress, and the use of cooperative adaptive cruise control (CACC) systems for platooning autonomous trucks can effectively alleviate the aforementioned issues [5].
During actual operations, the complexity of operational environments and the autonomous nature of unmanned driving prone render the actuator failures of autonomous vehicles, thereby potentially diminishing the overall system’s control performance or even compromising its stability. Particularly within multi-agent systems, individual reliability tends to be lower, thus increasing the likelihood of failures. The failure of actuators within a platoon not only affects their own control performance but can also lead to disarray in the entire CACC system [6,7]. To ensure the safety and reliability of vehicle operations, the development of platoon driving strategies for actuator failure within CACC platoons is of paramount importance.
Currently, numerous scholars have undertaken research on the driving strategies of CACC platoons. In order to obtain the accurate motion status of the CACC truck platoons, the tire friction mass of the vehicle and an accurate estimation of the motion status of the preceding vehicle are also essential. A fault-tolerant estimation framework was proposed to estimate the tire ground friction coefficient [8]. Considering the missing measurement values, a fault-tolerant odorless Kalman filter was used to predict the longitudinal and transverse tire ground friction coefficients, respectively. For the estimation of the motion state of the preceding vehicle in the CACC truck platoons, an event-triggered estimation scheme that takes into account packet loss and unknown vehicle inertia parameters was proposed [9] for predicting the motion state of the preceding vehicle in the CACC truck platoons.
Recently, CACC truck platoon actuator failures have been the research hotspot. Liu et al. [10] investigated the privacy protection cruise control problem of heterogeneous queueing-vehicle systems under actuator failures and system uncertainties. Wang et al. [11] proposed a novel information physics-level security control framework. This framework models the switching communication topology using continuous-time Markov chains and designs an adaptive fault-tolerant controller based on the physical plane to track its observer state and compensate for the impact of unknown actuator faults. Wang et al. [12] proposed a novel hierarchical control framework that integrates the upper observation layer and lower tracking layer. Zhu et al. [13] studied a distributed data-driven event-triggered fault-tolerant control method, and experiments showed that this scheme can achieve the task of ensuring safe formation control of the scheduling system under partial sensor failures. Liu et al. [14] investigated the time-varying formation control problem under actuator failures and saturation and proposed a hyperbolic tangent function to mitigate the impact of actuator saturation on the system and combined it with an adaptive fault-tolerant strategy to handle deviation faults. Yan et al. [15] proposed a novel cooperative control scheme for lane keeping aimed for human–machine cooperative control of intelligent vehicles. This method adapted to variations in driver error, lane departure, and velocity. Liu et al. [16] investigated the problem of trajectory planning for autonomous vehicles under conditions of control accuracy degradation and instability and proposed a segment drift-control strategy to ensure that vehicles can complete the drift in operation with high precision. Wang et al. [17] proposed a continuous lane-change approach for platoon vehicles, and this method is susceptible to the driving behavior of surrounding vehicles, leading to vehicles breaking away from the platoon system, disrupting the stability of platoon driving, and still requiring favorable road traffic conditions to provide a sufficiently large lane-change gap on the target lane. In addition, M.A.S. Kamal [18] and Zambrano Martinez et al. [19] conducted a detailed study on centralized energy management to alleviate the impact of traffic congestion on CACC. By predicting future traffic conditions, traffic flow can be effectively improved.
In summary, previous research has predominantly focused on the uncontrolled state of individual vehicle actuators, with insufficient investigation into the driving strategies of multi-agent systems under actuator failure. Furthermore, existing platoon driving strategies exhibit inadequate adaptation to the authentic permissible conditions of urban roadways, the disruption of CACC system control and stability—caused by lane-changing maneuvers—and the difficulty of implementing lane-changing strategies in high-density traffic flows. Addressing these challenges necessitates the exploration of novel lane-changing strategies to enhance the overall efficiency and safety of platoons.
In order to adapt to the complex urban road environment, a collaborative platoon lane-changing strategy is proposed where the actuator of the autonomous truck platoon fails. Human–machine transition (HMT), where control authority alternates between human drivers and autonomous driving systems, is also referred to as “vehicle takeover control”. This strategy utilizes HMT for individual vehicles within the platoon to create space on the target lane in coordination with the platoon, thereby facilitating the platoon’s lane change. Additionally, simulation experiments are conducted on urban road segments with varying congestion levels, comparing the proposed guidance strategy model with traditional overall-platoon lane-change models and split-platoon lane-change models in terms of the platoon’s lane-change time and traffic flow delay percentage. The main contributions are as follows:
- (1)
- This study proposed a collaborative lane change guidance strategy for CACC platoons when the actuator fails and used SUMO simulation to verify that this strategy exhibits strong robustness and efficiency in different traffic flow environments.
- (2)
- This study considered the changing of the platoon’s topology, proposed HMT of individual vehicles within the platoon to break away from the platoon to create space for lane changes, and found that the platoon still maintains stability under this interference.
- (3)
- This study found that selecting the vehicle in the middle of the platoon for coordinated lane changes results in the shortest lane-change duration for the platoon while selecting the lead vehicle for coordinated lane changes results in the longest lane-change duration for the platoon.
2. Methodology
The Society of Automotive Engineers (SAE) divides the levels of vehicle automation into five levels as follows: assisted driving (L1), partial automation (L2), conditional automation (L3), highly automated driving (L4), and fully automated driving (L5). The current autonomous driving technology is in and will remain at L3 for a long time. This study focuses on the lane-changing behavior of CACC platoons composed of conditional autonomous driving trucks on urban roads.
2.1. Model Establishment
For the CACC platoon composed of conditionally autonomous driving trucks, a vehicle-following model and micro lane-changing model are constructed, and the distribution probability of road space gaps under different traffic flows is analyzed.
2.1.1. Vehicle-Following Model
The intelligent driver model (IDM), as a classic model for human-driven vehicles [20], has been widely utilized over the past 20 years [21,22,23]. This model, represented by Equation (1), effectively represents vehicle dynamics.
where represents the acceleration of vehicle at time ; represents the speed of vehicle at time ; denotes the maximum acceleration; denotes the maximum comfortable deceleration; represents the free-flow speed; represents the speed difference between vehicle and its leading vehicle; represents the minimum safe stopping distance; represents the length of the vehicle; represents the safety time headway for HV; and represents the headway of vehicle .
Currently, there is extensive research on autonomous driving systems, both domestically and internationally. Among them, the CACC model proposed by the PATH laboratory is one of the few models validated through real-world vehicle testing data [24]. It effectively captures the following behavior of CACC vehicles and has gained recognition from a wide range of scholars [25]. In this study, the CACC vehicle model proposed by the PATH laboratory is adopted as the vehicle model for autonomous driving, as shown in Equation (2).
where represents the speed of autonomous vehicle at time ; represents the control coefficient for the spacing error; represents the differential control coefficient for the spacing error; represents the actual headway; represents the error between the actual headway and the desired headway; represents the derivative of ; and represents the desired safe time headway for CACC vehicles.
2.1.2. Vehicle Microscopic Lane-Change Model
The conditions for vehicle lane changing can be summarized into two parts:
- Lane Change Motivation.
Lane-changing behavior can be categorized into voluntary lane changes and mandatory lane changes. Vehicles may change lanes voluntarily when they cannot maintain the desired speed in their current lane and the conditions in the adjacent lane are better. Mandatory lane changes may occur when there is a need to make a turn, exit, or when the forward lane is obstructed.
- Safety Conditions.
This refers to the consideration of the speed and relative positions of adjacent vehicles in the target lane, ensuring that the vehicle does not collide with other vehicles.
Equations (3)–(6) describe a generic truck-platooning lane-change model upon which the subsequent lane-change behavior in this paper is based. Equation (6) demonstrates the rule for vehicles to avoid rear-end collisions, which states that the distance between a vehicle and the adjacent following vehicle on the target lane must be greater than the safety distance.
where represents the distance between the lead vehicle of the platoon and the preceding vehicle at time t; represents the distance between the ith vehicle of the platoon and the preceding vehicle; represents the distance between the ith vehicle of the platoon and the adjacent preceding vehicle on the target lane; represents the distance between the ith vehicle of the platoon and the adjacent following vehicle on the target lane. and , respectively, represent the speed and desired speed of the platoon’s vehicles; and represents the maximum speed limit or desired speed on the road.
Dong [26] considers the speed of the target vehicle and the adjacent following vehicle to acquire a safety gap, as shown in Equation (7). Equation (7) indicates the safety requirement for vehicles to complete lane changes quickly without causing collisions.
where represents the speed of the ith vehicle in the truck platoon adjacent to the following vehicle on the target lane.
2.1.3. The Probability Distribution of Road Gap
We examine the interaction between truck platoons and surrounding vehicles to facilitate the lane-changing process by analyzing the probability distribution of vehicle gaps on urban road segments. On urban roads, the spacing between vehicles follows a particular probability distribution, with its distribution function mainly influenced by the traffic volume. According to traffic flow theory, in situations where the traffic density is not congested, the number of vehicles arriving within a specific time interval or distributed across a certain road section conforms to a Poisson distribution, as illustrated in Equation (8).
where represents the probability of vehicles arriving within the counting interval ; represents the average arrival rate of vehicles; stands for the duration of each counting interval; and represents the base of the natural logarithm, approximately equal to 2.718280.
According to Equation (8), the probability of no vehicles within a unit length is equal to the probability distribution of headways within a certain spatial range, as illustrated in Equation (9).
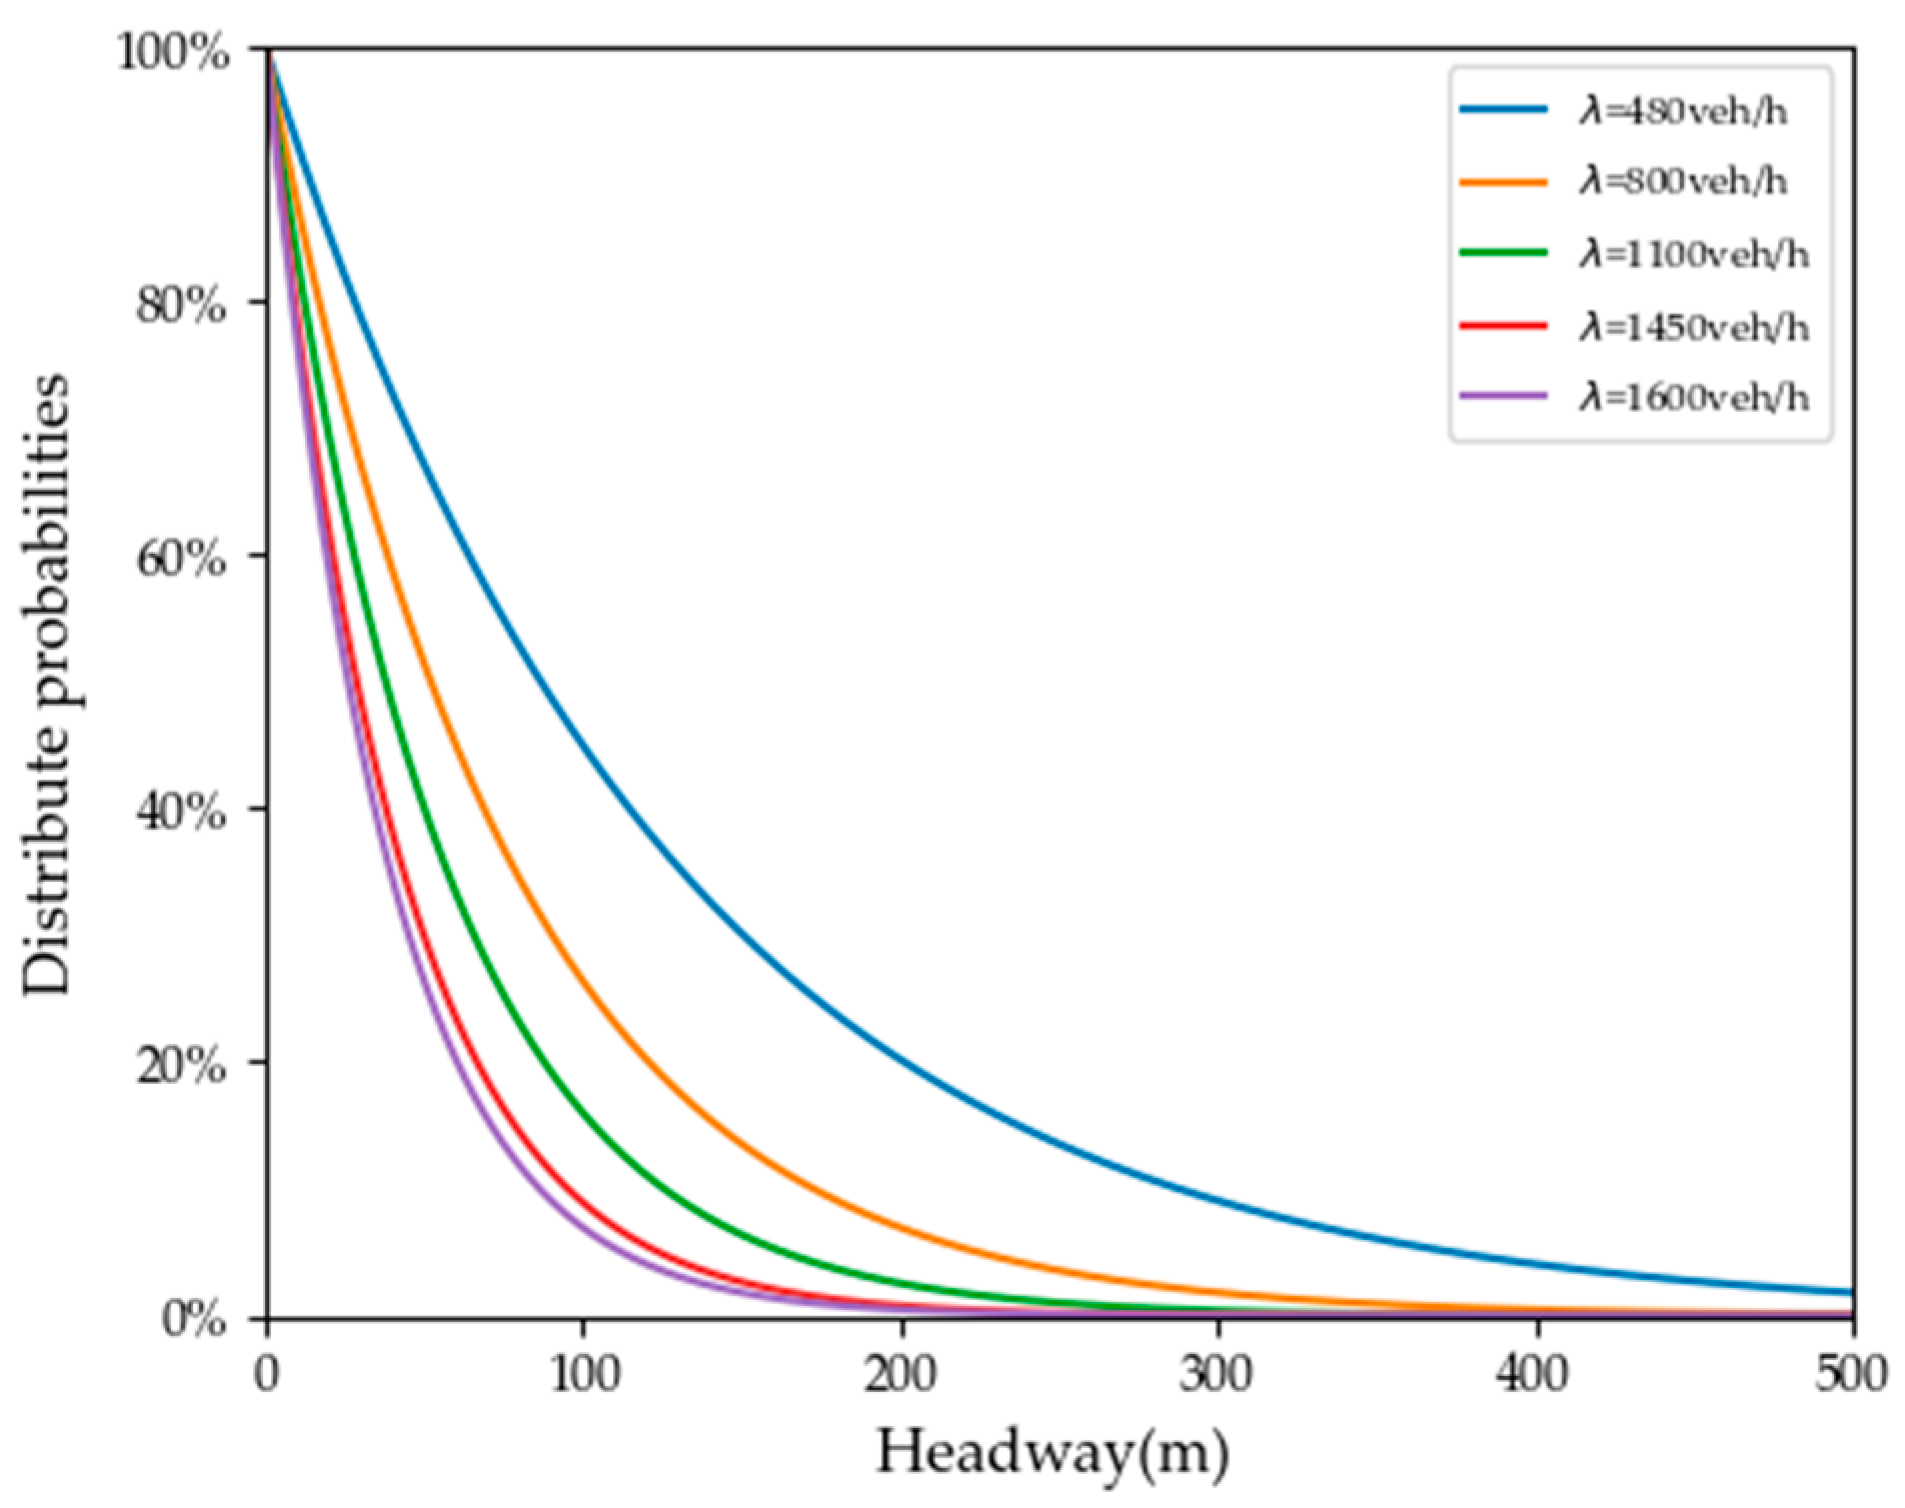
To facilitate the analysis of the road gap distribution under various traffic volume conditions, the probability of headway was calculated according to Equation (9), and the road speed was set to 60 km/h. The result is shown in Figure 1. It can be observed that for the same headway, the distribution probability decreases as the traffic volume increases. As the distribution probability of the headways decreases, the number of available merging spaces on the road segment sharply declines, which inevitably impacts the driving state.
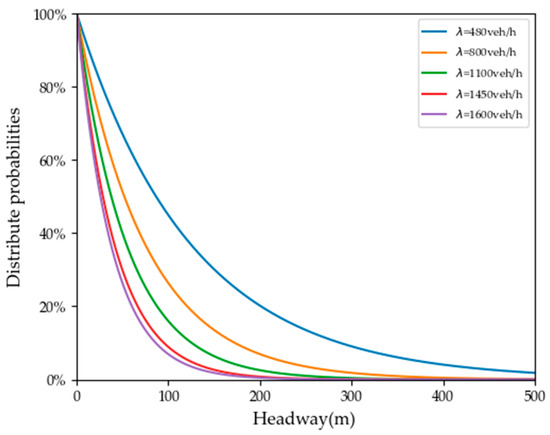
Figure 1.
The probability distribution of headways.
2.2. Guidance Strategy Design
Based on the road gap distribution described above, it is evident that the headway is low under poor road conditions. When the platoon’s actuator fails, to ensure safe navigation around obstacles ahead, in conjunction with the proposed vehicle model and considering HMT, a guidance strategy is designed for CACC platoon lane changes.
2.2.1. Process of Guidance Strategy
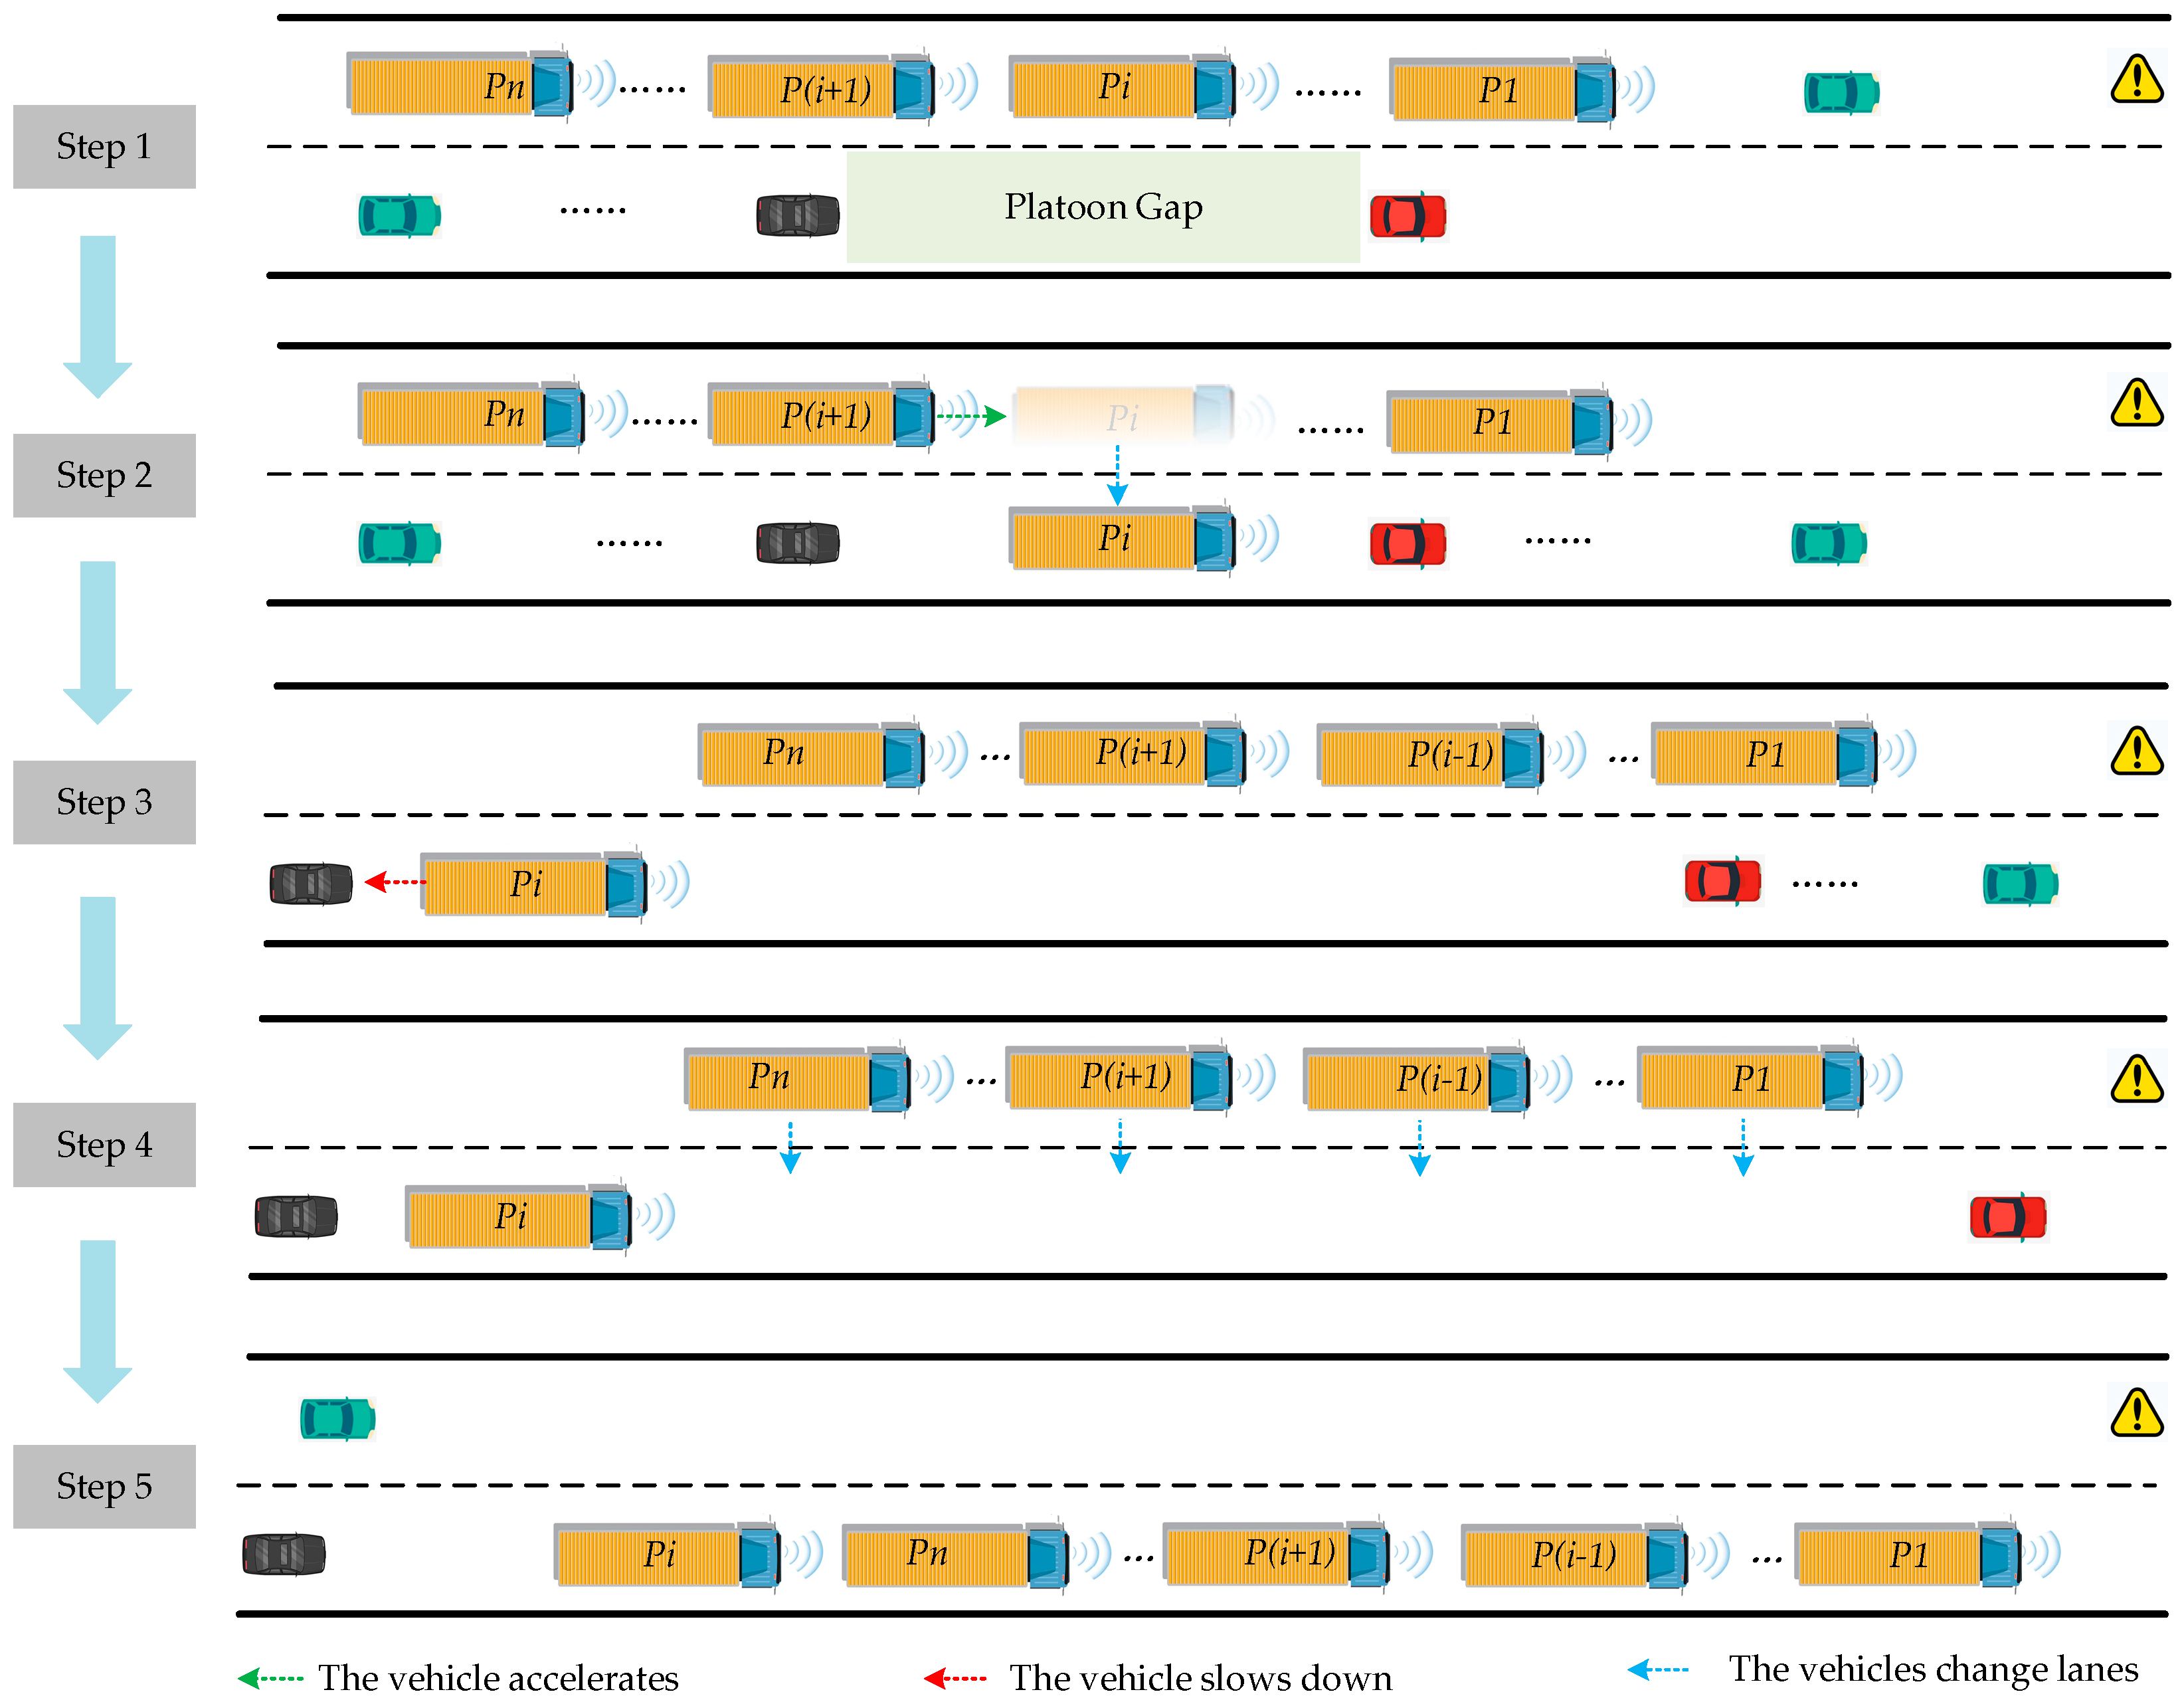
The strategy involves the HMT for selected vehicles within the platoon, facilitating stable and efficient platoon lane changes through a coordinated adjustment of the lane-changing space, as depicted in Figure 2. The specific steps are as follows:
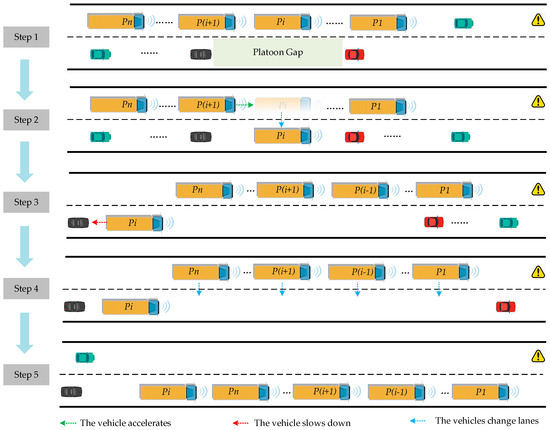
Figure 2.
Lane-change guidance strategy for platoon.
Step 1: Selection of the first lane-changing vehicle (Pi). When there is a lane change requirement in the CACC truck platoon, each vehicle in the platoon is sequentially evaluated to determine if it meets the safety conditions for lane changing. The first vehicle that meets the lane-change criteria is selected as Pi. In cases where multiple vehicles within the platoon simultaneously meet the lane-change criteria, priority is given to selecting the vehicle closer to the rearmost of the platoon to ensure platoon stability.
Step 2: Execution of lane change by Pi. Once Pi is determined, it initiates the lane-change process. Through HMT, Pi disengages from the platoon’s topology, and the vehicle safely takes control. Additionally, adjustments are made to the original platoon topology. After Pi leaves the platoon, the following vehicles in the platoon change their target and adjust their inter-vehicle spacing.
Step 3: Creating lane change space for the platoon: adjustment by Pi. To provide a sufficient space gap for other vehicles in the platoon to change lanes, Pi adjusts its relative speed and position with respect to the platoon. This is achieved by reducing the driving speed to facilitate the relative position change with the platoon vehicles.
Step 4: Creating lane change space for the platoon: adjustment by the platoon. If Pi cannot create enough space gap in the target lane for all remaining vehicles in the platoon to change lanes, the platoon decelerates to a speed not lower than the minimum lane speed limit, allowing for the completion of space adjustment for lane changing.
Step 5: Lane change by the platoon. The remaining vehicles in the platoon collectively change lanes, and Pi merges back into the platoon.
When there is a lane change demand in the CACC platoon, the vehicles within the platoon that meet the safety lane change requirements take the lead in executing the lane change behavior and detach from the platoon topology structure through HMT. Combining the relative position changes of vehicles within the platoon and the relative position changes between adjacent preceding vehicles in the target lane, the target lane is cleared to provide the CACC platoon with lane change space in order to meet the efficiency and reliability of a lane change in the platoon.
2.2.2. Adaptive Fault-Tolerant Control for Actuator Failure
The actuator failure of the CACC truck platoon will seriously affect the truck platoon’s driving state. The actuator failure proposed in this article refers to the problem of unpredictable actuator failure in the hub motor of the vehicle. For faultless vehicles, the failure factor of the actuator failure part is 0, and the additive fault function is 0. For a faulty vehicle, the additive periodic fault function it experiences throughout the entire experimental process is 0.05cos(5t). Firstly, we establish a longitudinal dynamic model of the platoon based on the dynamic characteristics:
where xi (t), vi (t), and ai (t) represent the longitudinal position, velocity, and acceleration of the ith truck, respectively; ηi represents the mechanical efficiency of the truck transmission system; Mi represents the quality of the truck; Ri represents the tire radius of the truck; τi represents the time-delay of the truck motor; g is the gravitational acceleration; ρa represents air density; Cai represents the aerodynamic drag coefficient; Ai is the cross-sectional area of the truck; Ξi is the road slope function; and , where di represents uncertainty interference functions, such as gusts and unknown acceleration interference. sat(ui(t)) represents the control torque of the truck motor in a saturated state, which can be expressed as:
where ui(t) is the control input of the truck, and ubi is the upper bound of the parameter.
Consider the actuator failure of the control torque of the i truck in a saturated state:
where λi represents the partial failure factors to describe the degree of actuator failure; Δi(t) represents the time-varying function of actuator failure; and ti,F represents the unknown moment of fault occurrence.
By introducing a smooth function h(ui(t)), the longitudinal dynamic model of the ith truck is rewritten as:
where and ; δ(ui(t)) represents the approximation error between sat(ui(t)) and h(ui(t)); Γi is used to describe approximation redundancy errors, actuator faults, etc.
In order to avoid significant transient errors and solve the problem of sudden acceleration changes caused by actuator failures, a secondary spacing strategy is introduced:
where Δxi(t) represents the actual distance between the i − 1 truck and the i truck; ei(t) is the spacing error between vehicles; Li−1 represents the length of the i truck; φd represents the ideal distance of the platoon at a steady state; ε represents the safety factor for vehicle operation; Φmax indicates the maximum deceleration of the truck; h represents the constant time distance at the front of the vehicle, and hvi(t) represents the safe distance between the trucks.
Based on Equation (14), a finite-time robust adaptive-coupled sliding mode fault-tolerant controller is proposed. The sliding surface of the i truck is:
To ensure the stability of the truck platoon, the coupled sliding surface is defined as:
where χ1 and χ2 are positive definite weight parameters. Combining Equation (16) and Equation (14), then taking the derivative of the coupled sliding surface si: and si+1:
Based on Equation (17), a finite-time robust adaptive fault-tolerant controller is designed as follows (for I = 1, 2, …, n − 1):
where k2i, Θi, and boi are positive definite constants. An adaptive compensation law is designed as follows:
Consider the road slope function in engineering practice Ξi and redundant error terms Γi. The measurement and parameter acquisitions are difficult, so adaptive estimation is required for it as follows:
where and are the estimated values of k1i; Ωi, Γi, Ξi, k1i, bki, bΩi, bΞi, and bΓi are positive constants; and ξki > 0, ξΩi > 0, ξΞi > 0, ξΓi > 0 are all extremely small constants.
2.2.3. Model of Guidance Strategy
Assume that the spatial relationships between vehicles within the study area are as depicted in Figure 3, where Pi represents the selected leading lane-changing vehicle, and there is a need for the truck platoon in Lane 1 to change lanes to Lane 2. The positional changes during the entire lane-changing process can be divided into two parts as follows:

Figure 3.
Initial relative positions.
- 1.
- The relative positional changes within the original platoon are depicted in Figure 4.
 Figure 4. Adjustment of relative positions of platoon vehicles.
When Pi initiates the lane change and executes it, the selected leading lane-changing vehicle starts adjusting the gap rearward, while its original following vehicle within the platoon adjusts forward to fill the gap left by the lane-changing vehicle as quickly as possible. Specifically, initial and final speeds match the platoon speed. The relevant models are as follows:
- The relative position change of satisfies the following relationship:
- The relative positional variation of vehicles following Pi within the original platoon satisfies the following relationship:
If i is 1, indicating that the original platoon leader initiates the lane change, the first following vehicle of the original platoon becomes the new platoon leader. To simplify the model, interactions between the new leader and the preceding vehicle are not considered, and the new lead vehicle maintains its original speed. If i is n, indicating that the original platoon’s rearmost vehicle initiates the lane change, there are no following vehicles behind Pi in the original platoon. Therefore, in both of these cases, there are no changes in the relative positions of the following vehicles for Pi.
In summary, the time required for the internal vehicles of the original platoon to complete the relative position change is given by max(, ).
- 2.
- Following the Pi lane change, Figure 5 illustrates the relative positional variation between the platoon leader and the preceding vehicle adjacent to Pi.
 Figure 5. Adjustment of the platoon’s relative position with surrounding vehicles.
The adjustment of the platoon leader with the preceding vehicle adjacent to Pi satisfies the following relationship:
where represents the moment when the platoon leader adjusts its relative position with the preceding vehicle; represents the speed of the platoon; represents the speed of the preceding vehicle; represents the initial relative longitudinal distance between the preceding vehicle of and the platoon leader; and represents the safety distance between the platoon leader and the preceding vehicle when the platoon changes lanes.
If , indicating that the original platoon leader is selected as Pi, and its position relative to the preceding vehicle in the adjacent lane is behind, thus is less than zero, then the position of the new platoon leader relative to the preceding vehicle does not affect the remaining platoon vehicles’ lane changes. Hence, there is no need to consider the relative position change between them.
Combining Equations (21)–(23), it can be concluded that the duration required for the platoon’s lane-change gap adjustment is given by max(,, ).
3. Simulation Verification and Result Analysis
This study focuses on urban roads with complex traffic conditions. To obtain reliable evaluation results, we used the Simulation of Urban Mobility (SUMO) for simulations. We analyzed scenarios where different vehicles within the platoon change lanes first and assessed the performance of various guidance strategies in diverse traffic flow environments.
3.1. Simulation Setting
SUMO 1.14.0 is an open-source, lightweight, microscopic, and sustainable traffic simulation software. This study further develops SUMO based on the proposed CACC truck platoon guidance strategy. A collaborative adaptive cruise control CACC truck platoon, consisting of six conditionally autonomous trucks, was constructed based on the plexe framework. According to previous research [27,28], a takeover time of 5 s was set, with the vehicles driving automatically before the takeover and manually after the takeover.
Taking urban roads with complex traffic conditions as the research scenario, according to the engineering technical specifications of Chinese urban roads, the road design parameters are shown in Table 1; the parameters are designed based on the vehicle model calibrated with the real-vehicle data of the PATH laboratory [24], as shown in Table 2.

Table 1.
Design parameters for roads.

Table 2.
Design parameters for vehicles.
Moreover, the road in this study is set as a two-lane road with a width of 3 m. According to the General Specification for Highway Engineering in China, the road saturation is shown in Table 3.

Table 3.
Design parameters for traffic flow.
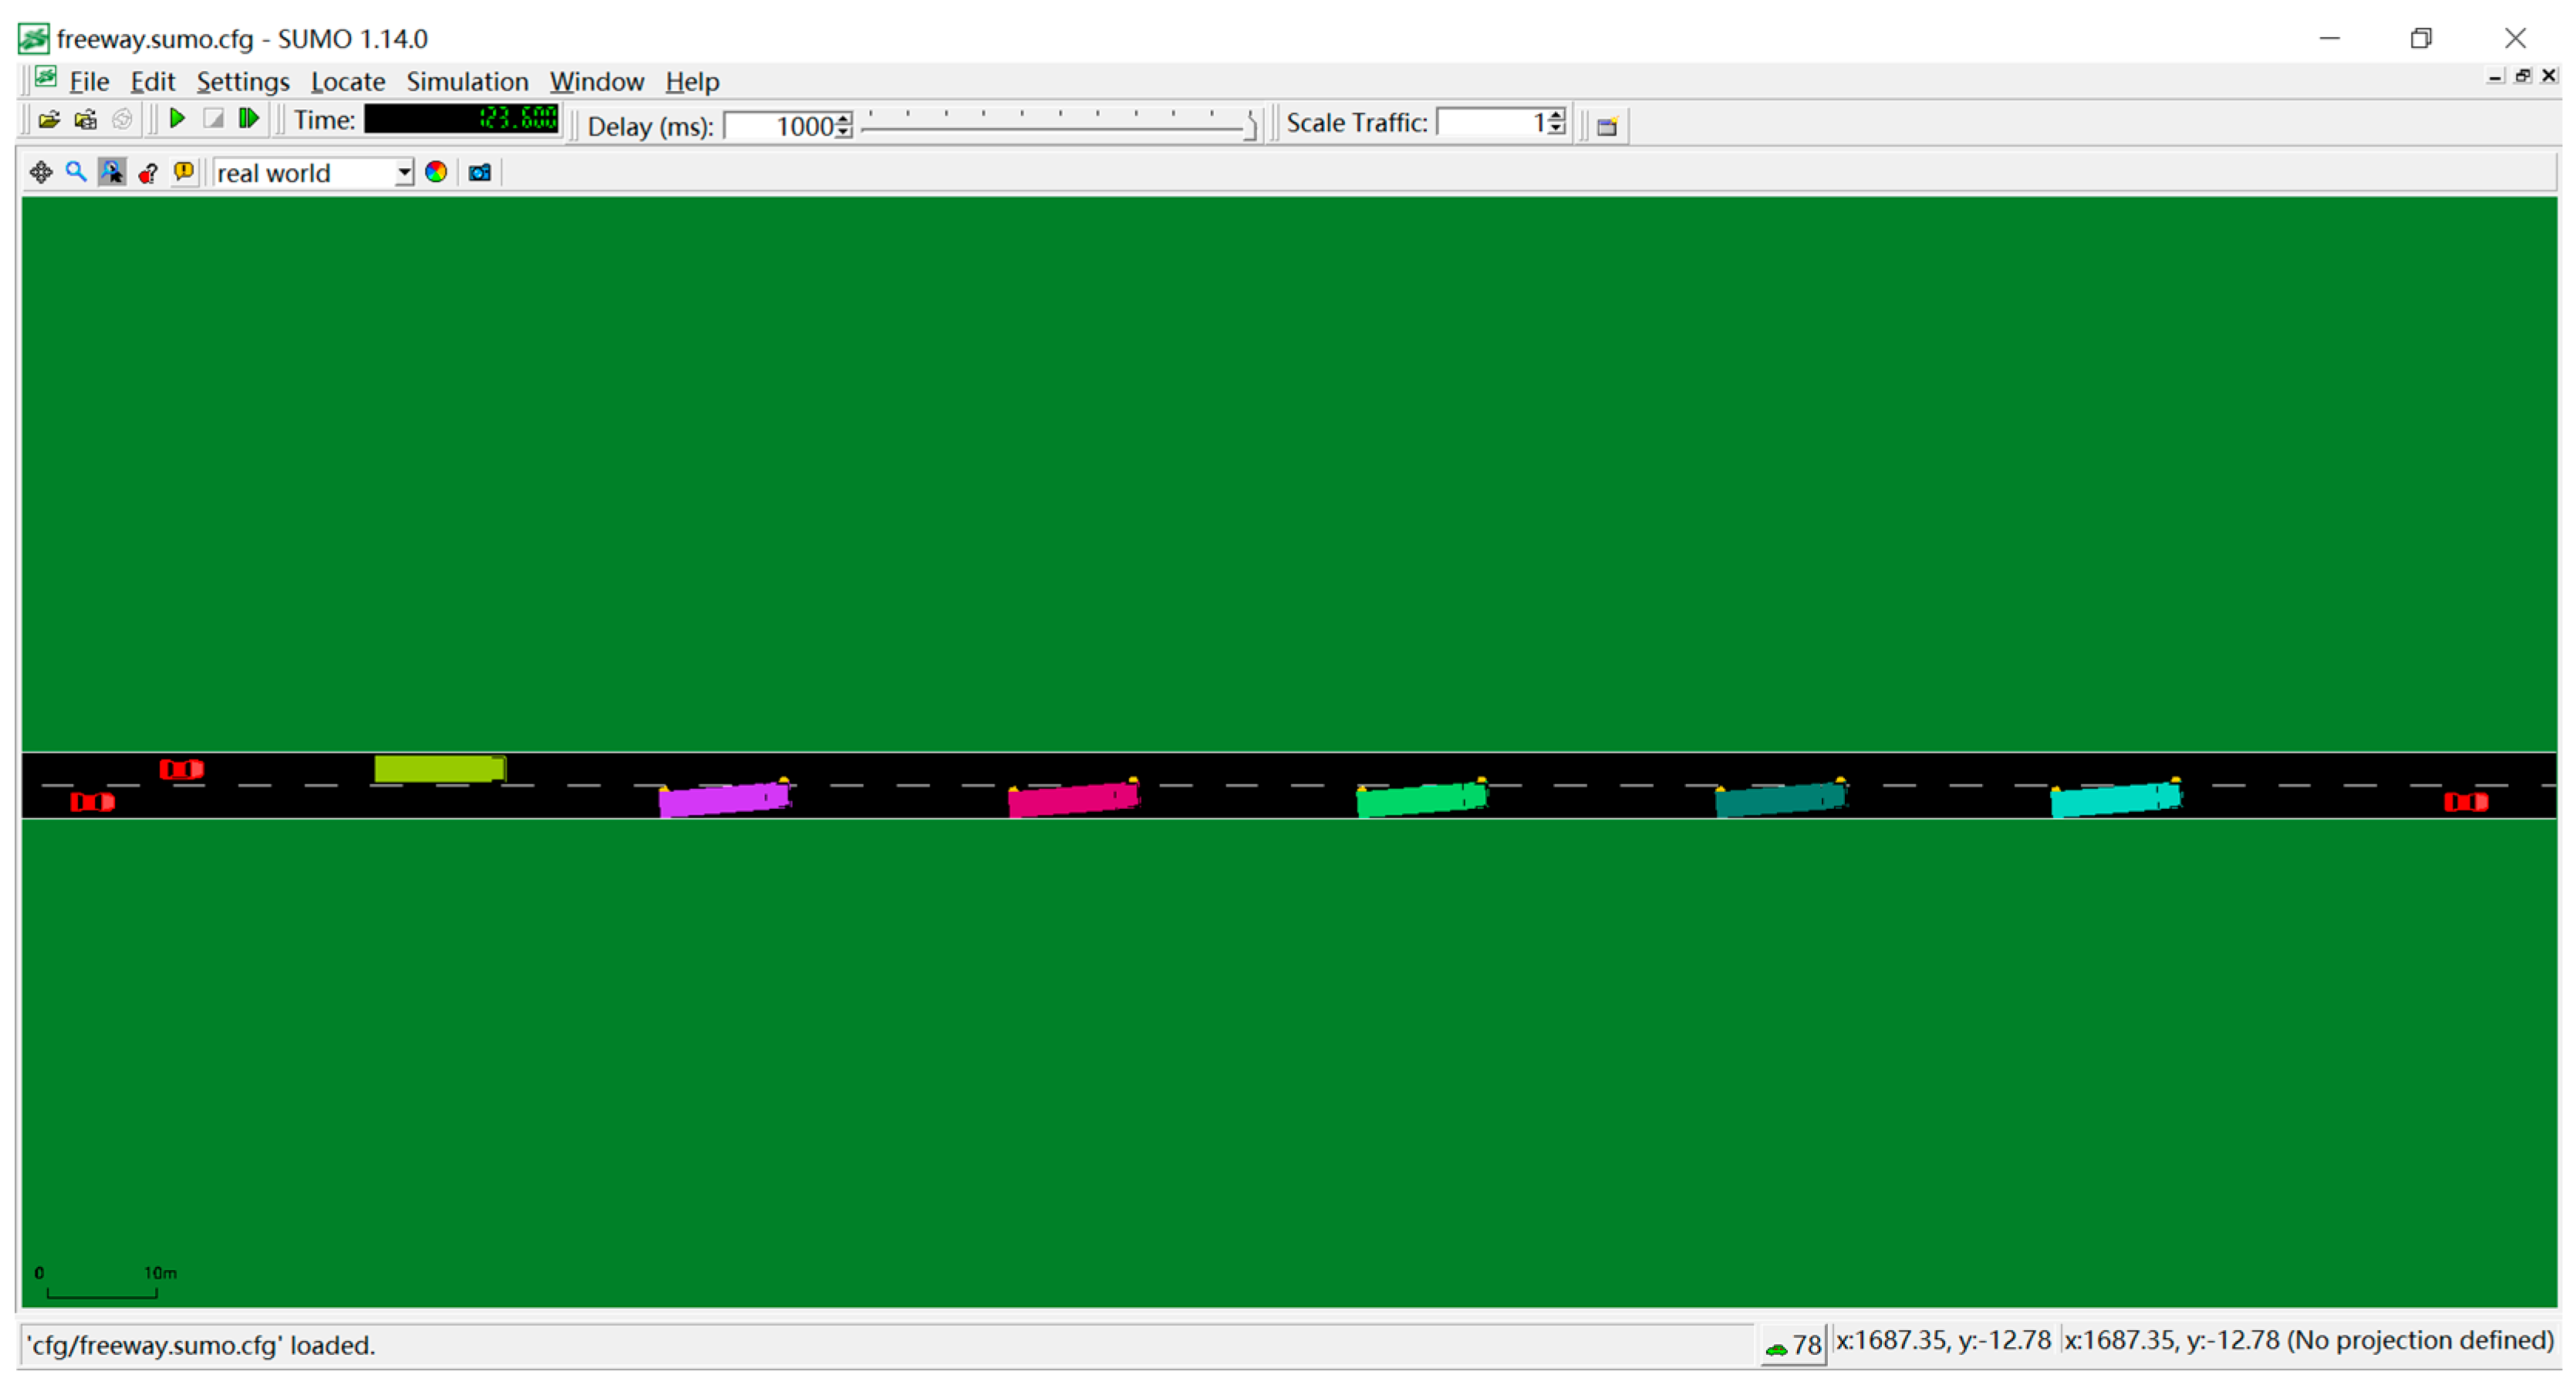
According to the parameter data, the simulation is operated and shown in Figure 6.
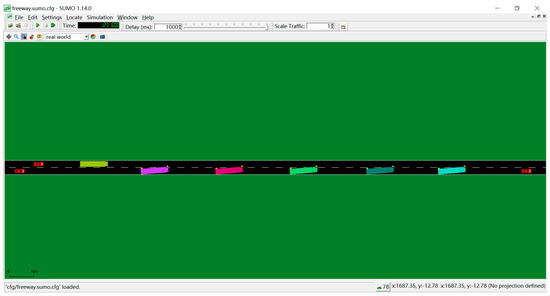
Figure 6.
Simulation interface.
3.2. Results Analysis
This study selected the following aspects to evaluate the guidance strategy: (1) functional evaluation of freeing up lane changing space; (2) assessment of the impact on traffic flow; (3) and an assessment of the stability of the platoon.
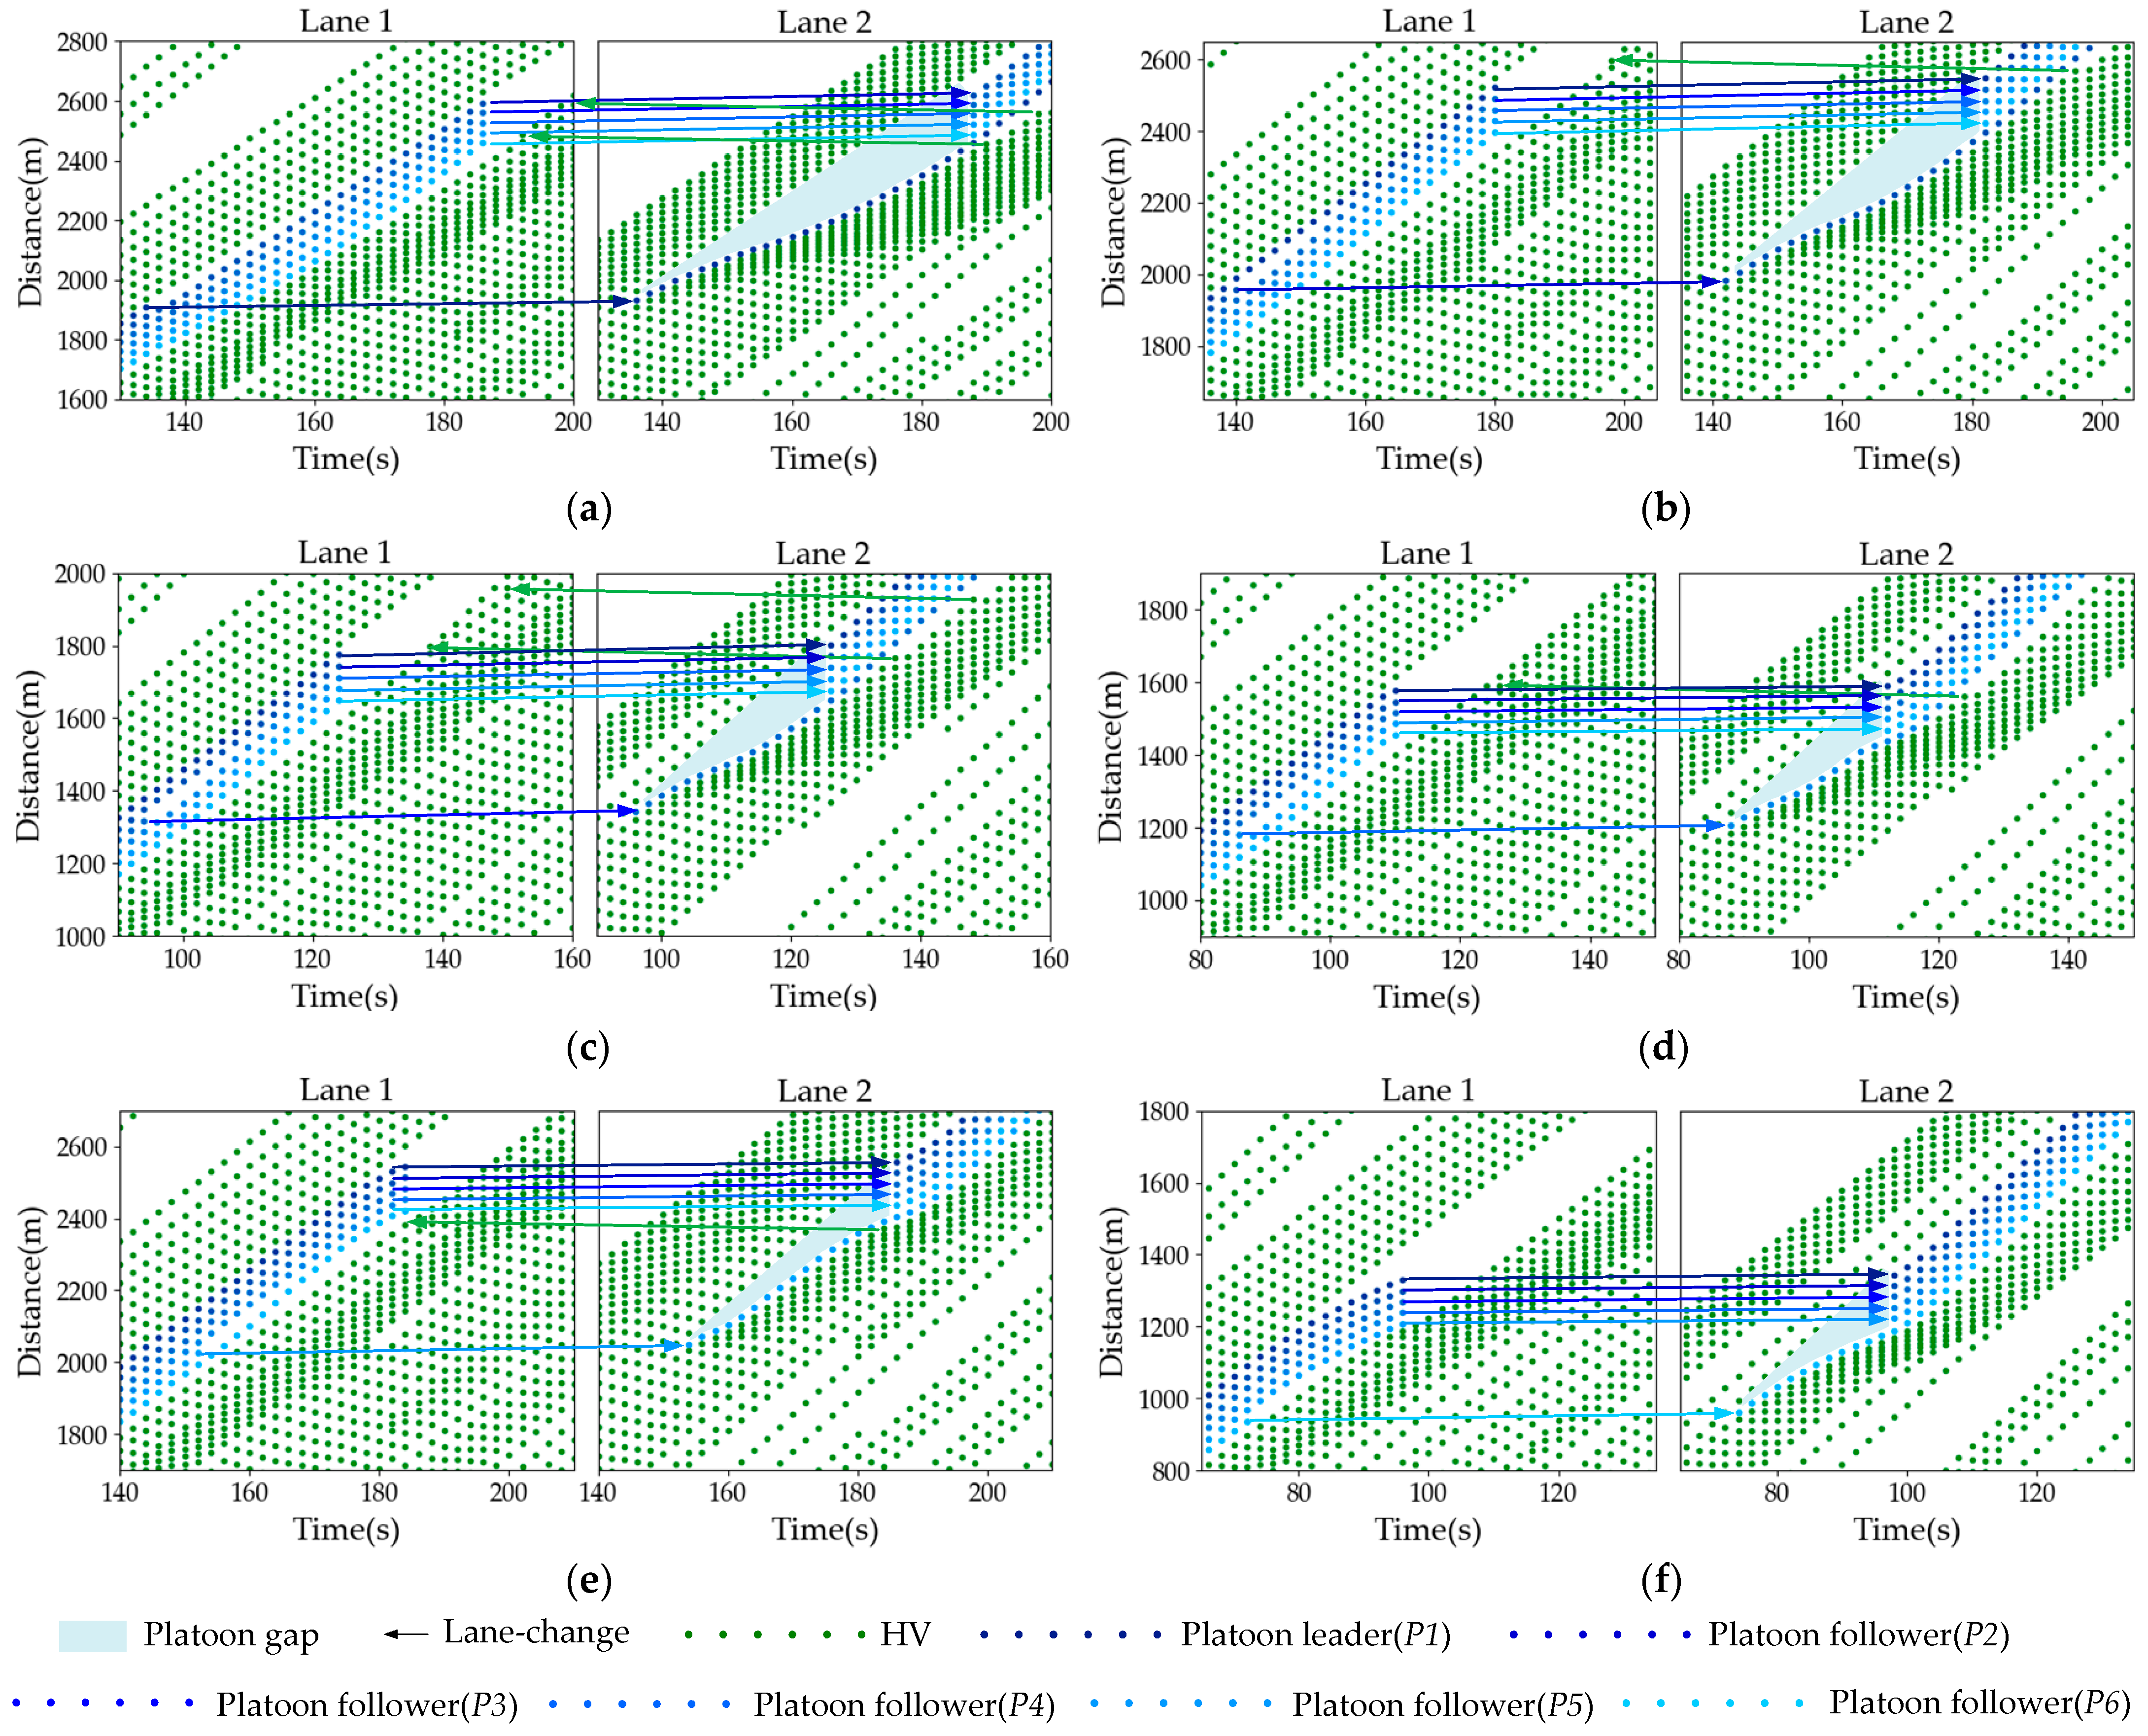
Figure 7 shows the trajectory of the truck platoon changing lanes under the guidance strategy. It indicates that the guidance strategy control method has the ability to free up lane-changing space for the platoon. As shown in Figure 7, the target lane (Lane 2) has dense traffic flow and cannot provide a space gap to accommodate all vehicles in the platoon to change lanes as a whole. Therefore, a single vehicle in the platoon change lanes first to the target lane through HMT. Then, the space gap in the target lane gradually expands. When the gap space is large enough, all remaining vehicles in the platoon change lanes. The successful widening of the selected gap on Lane 2 also confirms the lane-changing ability of the proposed strategy control method. At the same time, it can be observed that after the overall lane change of the platoon, the following two vehicles may change lanes to avoid being affected by the speed changes of the platoon.
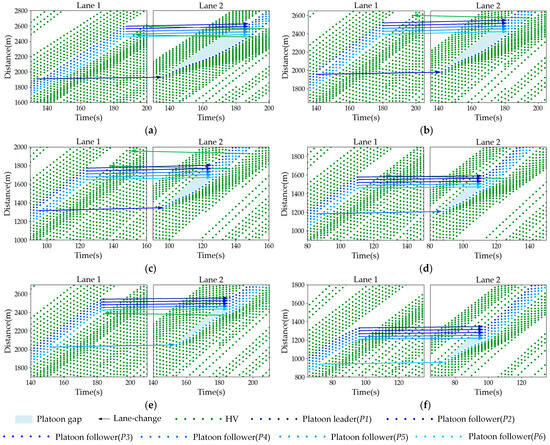
Figure 7.
Sample trajectory diagram: (a) the first lane-changing vehicle as P1; (b) the first lane-changing vehicle as P2; (c) the first lane-changing vehicle as P3; (d) the first lane-changing vehicle as P4; (e) the first lane-changing vehicle as P5; and (f) the first lane-changing vehicle as P6.
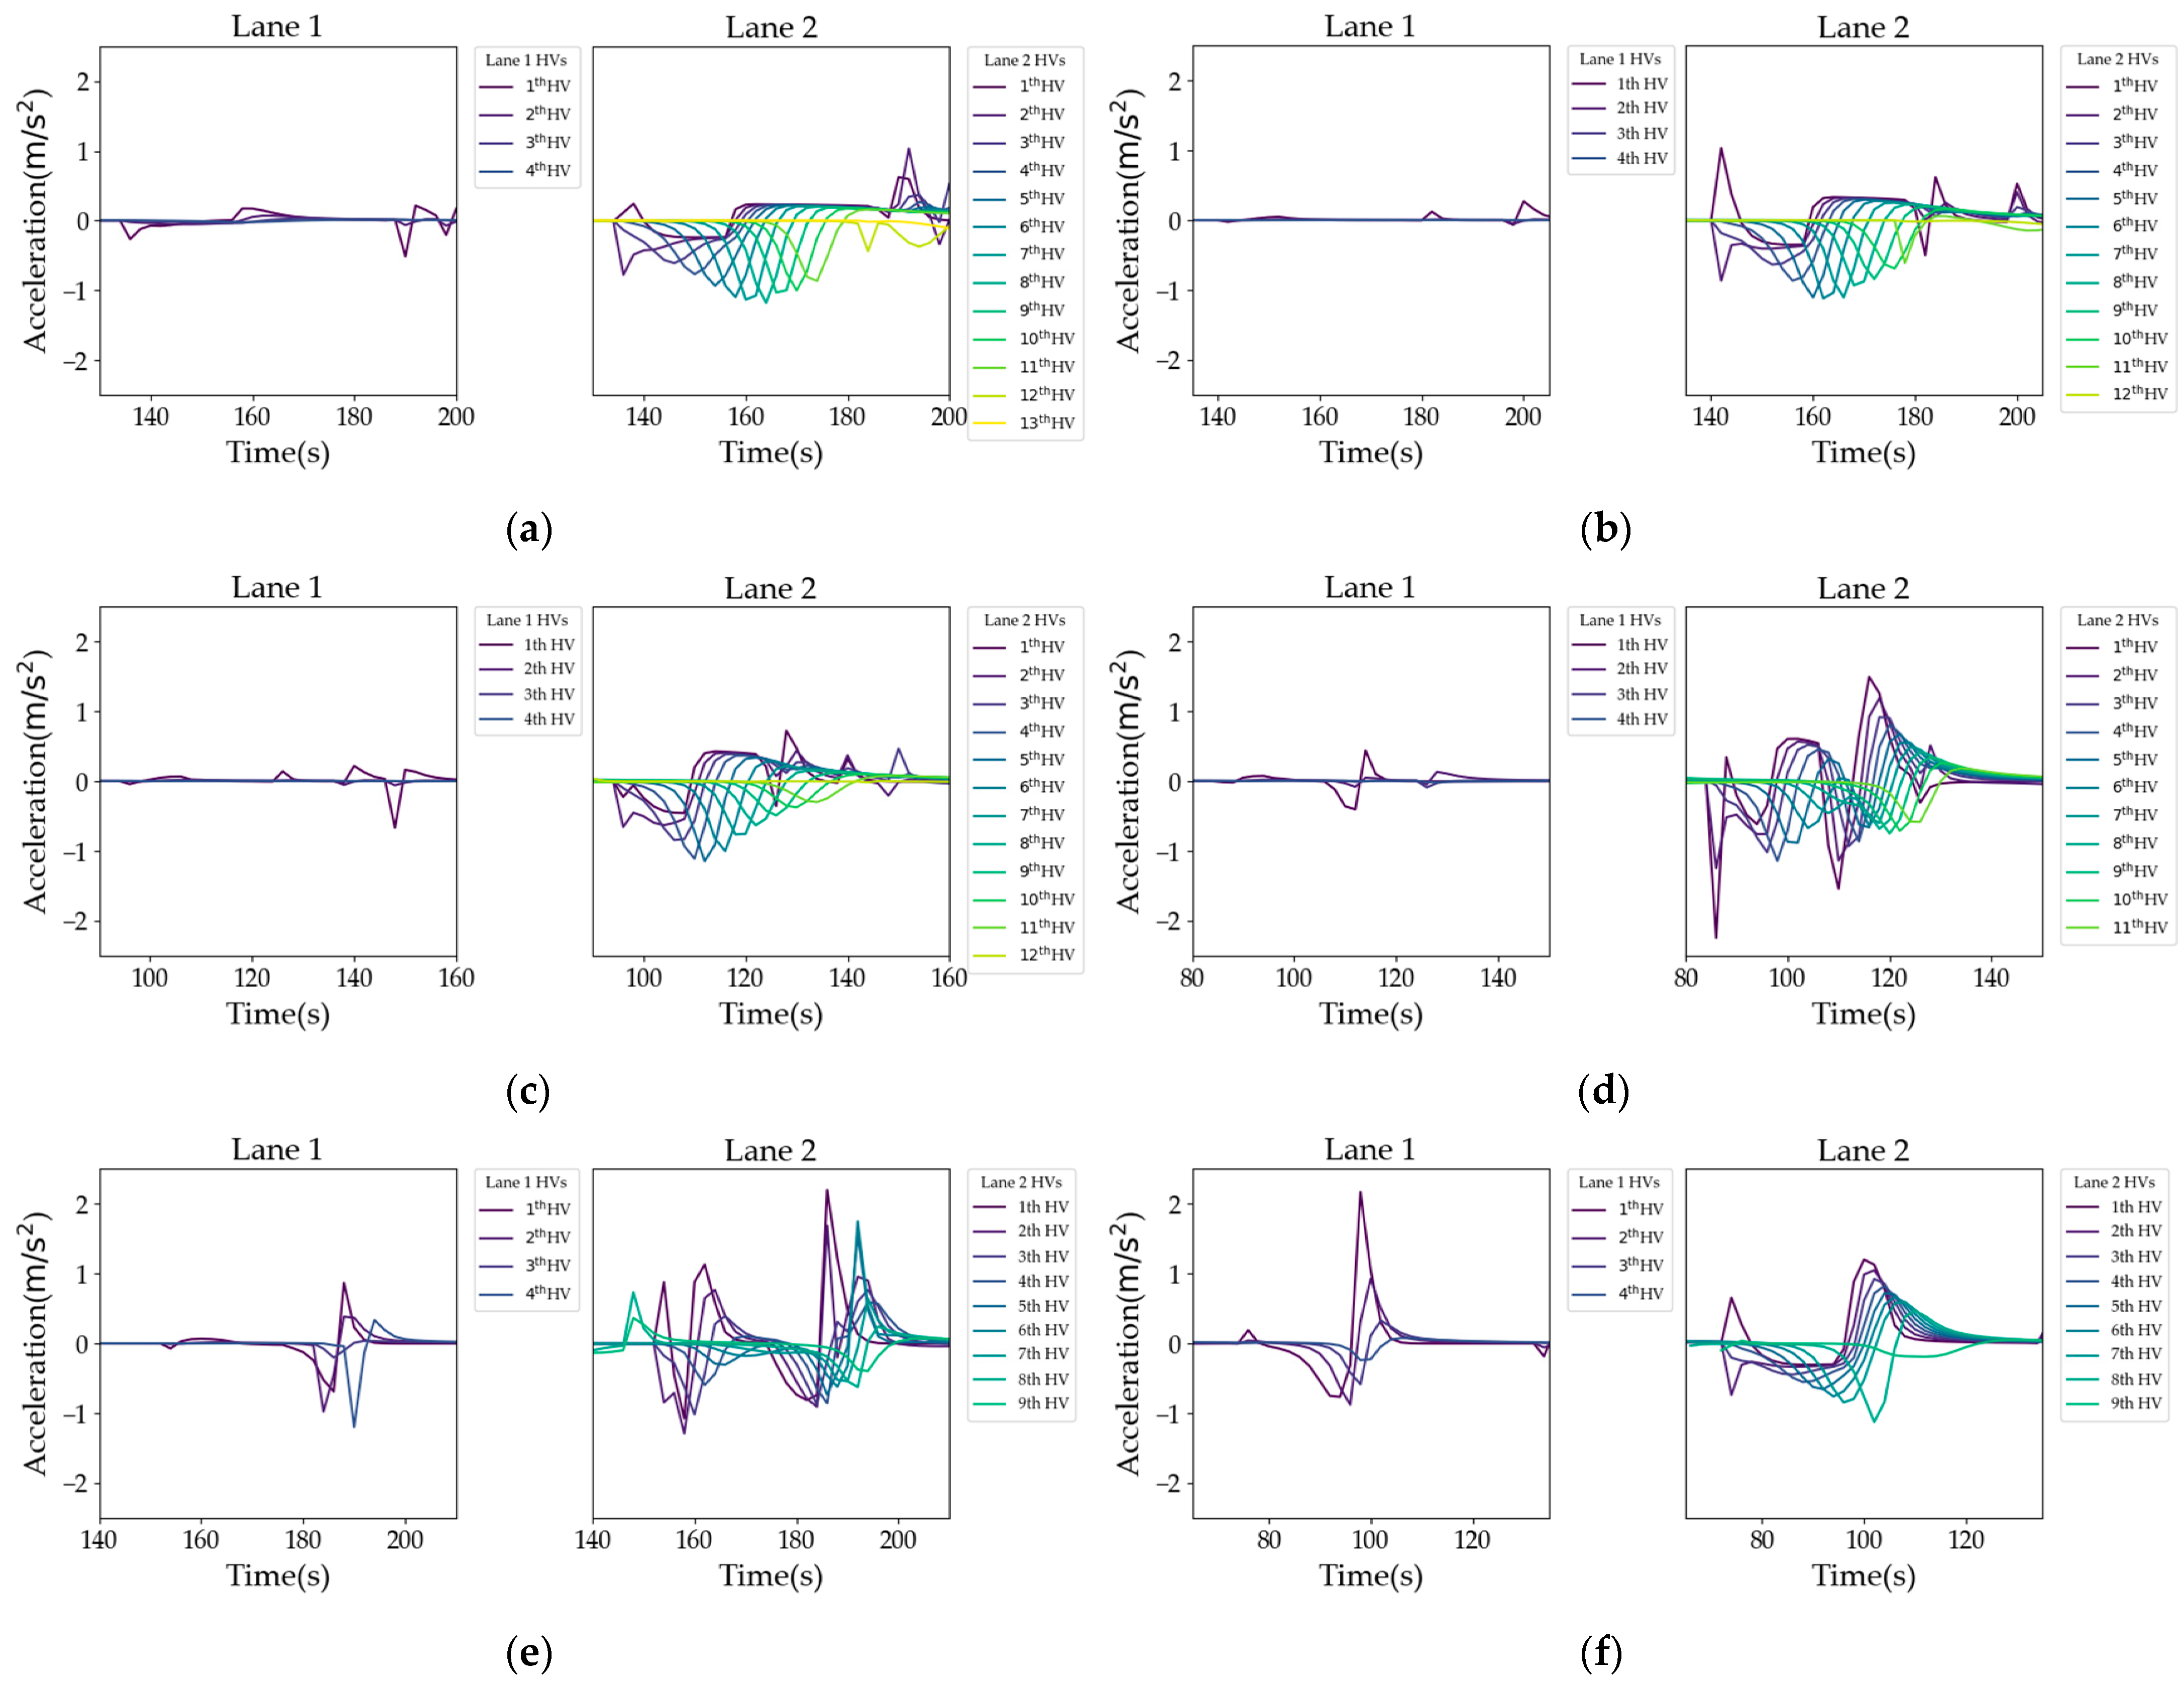
To analyze the impact of this guidance strategy on traffic flow, we researched the upstream vehicle acceleration changes, as shown in Figure 8. It can be seen that the closer the first lane-changing vehicle is to the platoon leader, the larger the impact area on the upstream vehicles of the target lane, the longer the stable acceleration time of the upstream vehicle, and the smaller the change in acceleration amplitude. Because the vehicle is closer to the platoon leader, there is a greater relative displacement between the vehicle and the platoon, and the positions of adjacent preceding vehicles more easily satisfy the conditions for platoon lane-changing. At the same time, there are two deceleration zones in Lane 2 in Figure 8d,e. This is because after the first lane-changing vehicle decelerates and changes its relative position with its original platoon, the adjacent preceding vehicle in the target lane is still in the gap space, so the vehicle decelerates simultaneously with the platoon, freeing up space for the platoon to change lanes. Therefore, after being affected by the deceleration behavior of the vehicle after changing lanes, vehicles upstream of the target lane are again affected by the driving status of the platoon vehicles, resulting in two decelerations. At the same time, the initial lane is also affected by the driving status of the platoon vehicles, causing speed fluctuations.
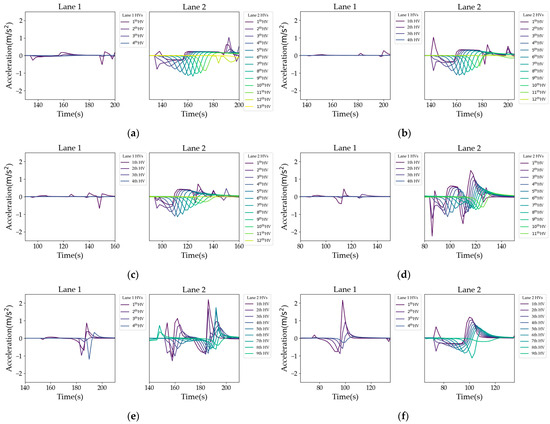
Figure 8.
The trajectory of acceleration for upstream vehicles: (a) the first lane-changing vehicle as P1; (b) the first lane-changing vehicle as P2; (c) the first lane-changing vehicle as P3; (d) the first lane-changing vehicle as P4; (e) the first lane-changing vehicle as P5; and (f) the first lane-changing vehicle as P6.
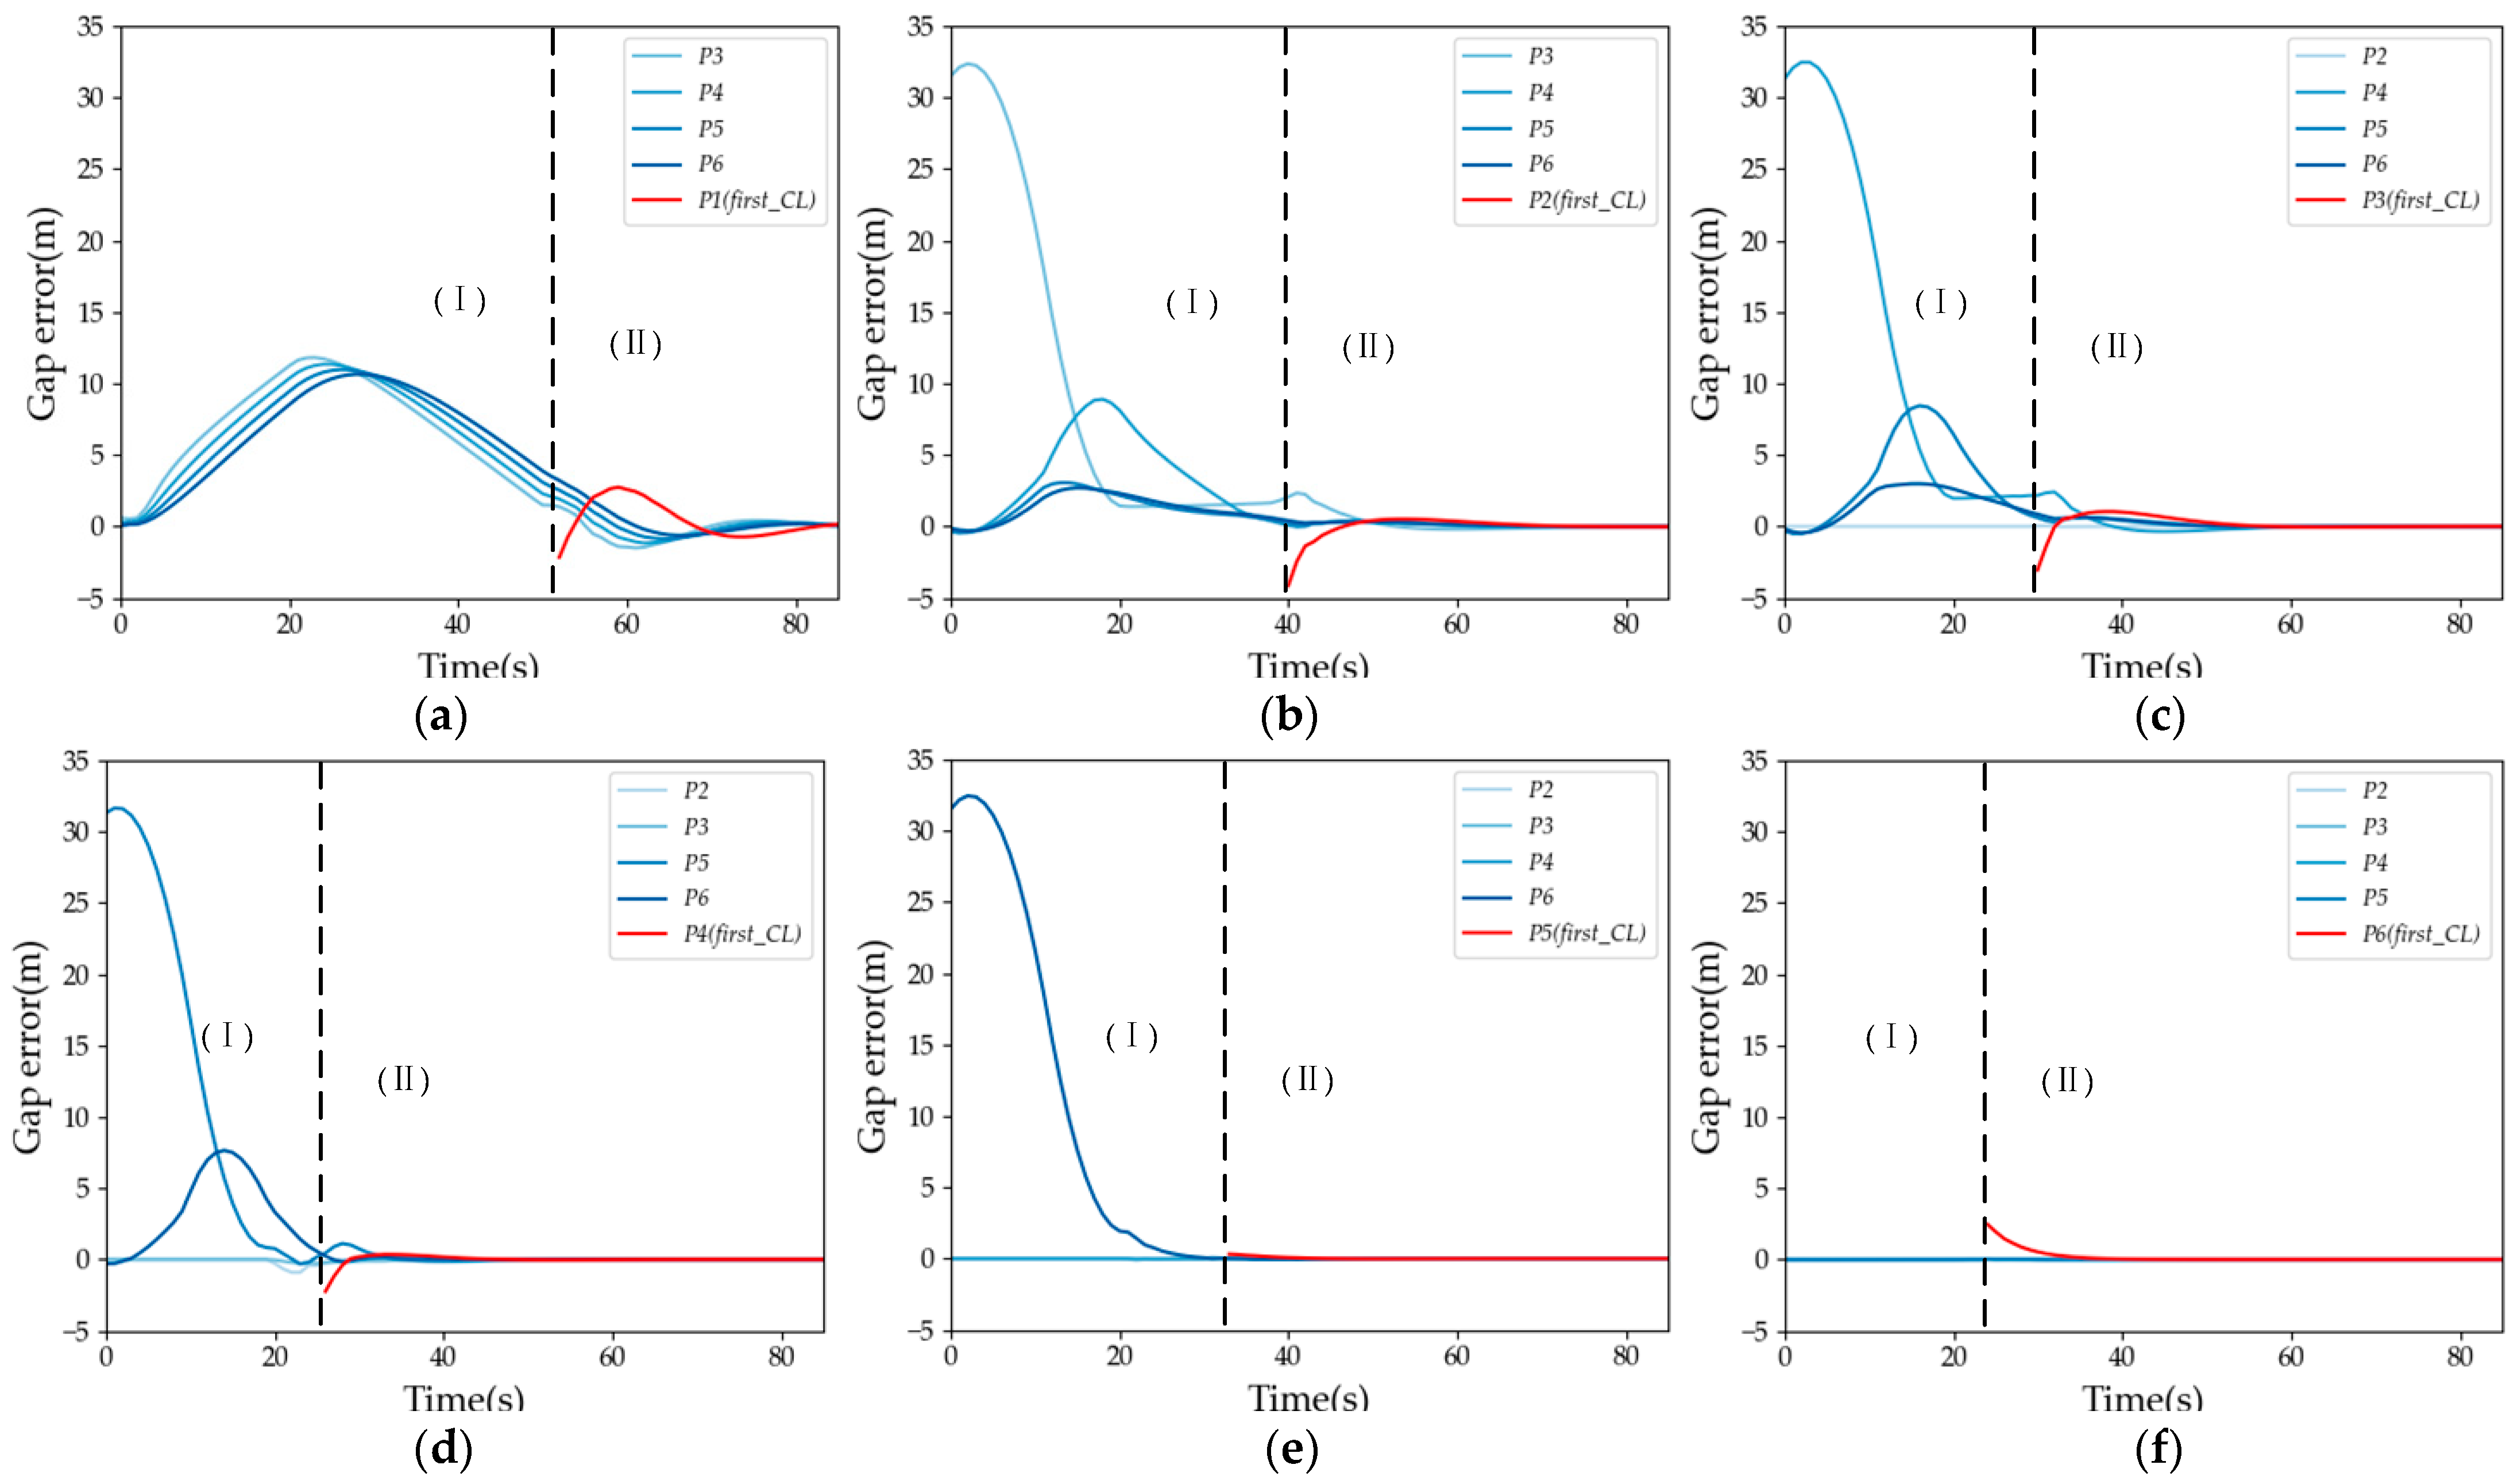
Figure 9 shows the trajectory of the lane-change gap error for different selected vehicles in the platoon. According to the changes in the topology structure of the platoon, the lane-changing process of the platoon is divided into two stages as follows: (I) selecting a vehicle to transition between human–machine and detach from the platoon topology structure and freeing up space for lane changing in the target lane; and (II) the selected vehicle rejoins the platoon topology, completing the overall lane change of the platoon. In Figure 9, it can be seen that the closer the selected vehicle is to the platoon leader, the more affected the variation of gap error between vehicles in the platoon. This is because after the selected vehicle changes lanes first, its team following vehicle changes the following object and needs to adjust the speed to reduce the gap following the preceding vehicle of the new platoon. However, the preceding vehicle of the selected vehicle in the original platoon is not affected by the selected vehicle’s detachment from the platoon’s topology structure and maintains a stable driving state. In addition, it can be seen that among the affected vehicles in the platoon, the gap error trajectory of the rearmost vehicle (dark blue line) has a lower peak compared to the front vehicle (light blue line), indicating that the disturbance gradually attenuates along the platoon propagation, indicating that the platoon still maintains stability under this lane change guidance strategy.
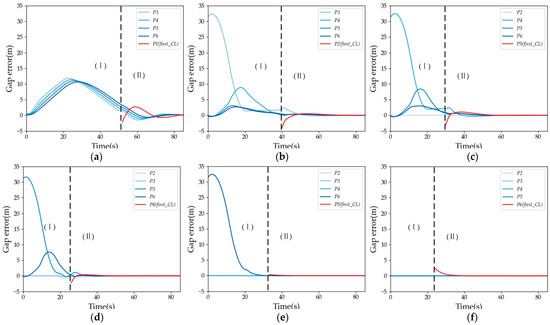
Figure 9.
The trajectory of gap error for the platoon: (a) the first lane-changing vehicle as P1; (b) the first lane-changing vehicle as P2; (c) the first lane-changing vehicle as P3; (d) the first lane-changing vehicle as P4; (e) the first lane-changing vehicle as P5; and (f) the first lane-changing vehicle as P6.
Meanwhile, as shown in Figure 9, the selected vehicle that changes lanes first will have an impact on the lane-changing time of the platoon. When the selected vehicle is the platoon leader, the lane-changing adjustment time of the platoon is the longest. When the selected vehicle is located in the middle of the platoon, the lane-changing adjustment time of the platoon is shorter. When the selected vehicle is the rearmost vehicle of the original platoon, as shown in Figure 9f, the lane-change time of the platoon is greatly affected by the relative position of the platoon leader and the adjacent front car of the selected vehicle.
3.3. Model Comparison
This study used the ALL-Platoon Change Lane Model (ALL_CL) [29] and Split-Platoon Change Lane Model (SP_CL) [30], as well as the proposed Collaborative Platoon Change Lane Model (CP-CL) for comparative evaluation. ALL_CL is based on the platoon, and the platoon changes lanes simultaneously as a whole; SP_CL is based on the vehicle; the vehicle performs lane-changing operations when it meets the lane-changing conditions; and CP-CL selects the vehicle that meets the lane-changing conditions to change lanes first, collaborates with the platoon, and vacates the lane-changing gap in the target lane to achieve lane changing for the platoon. For different levels of road service, each model uses different random factors for 15 simulations, with each simulation lasting no less than 10 min.
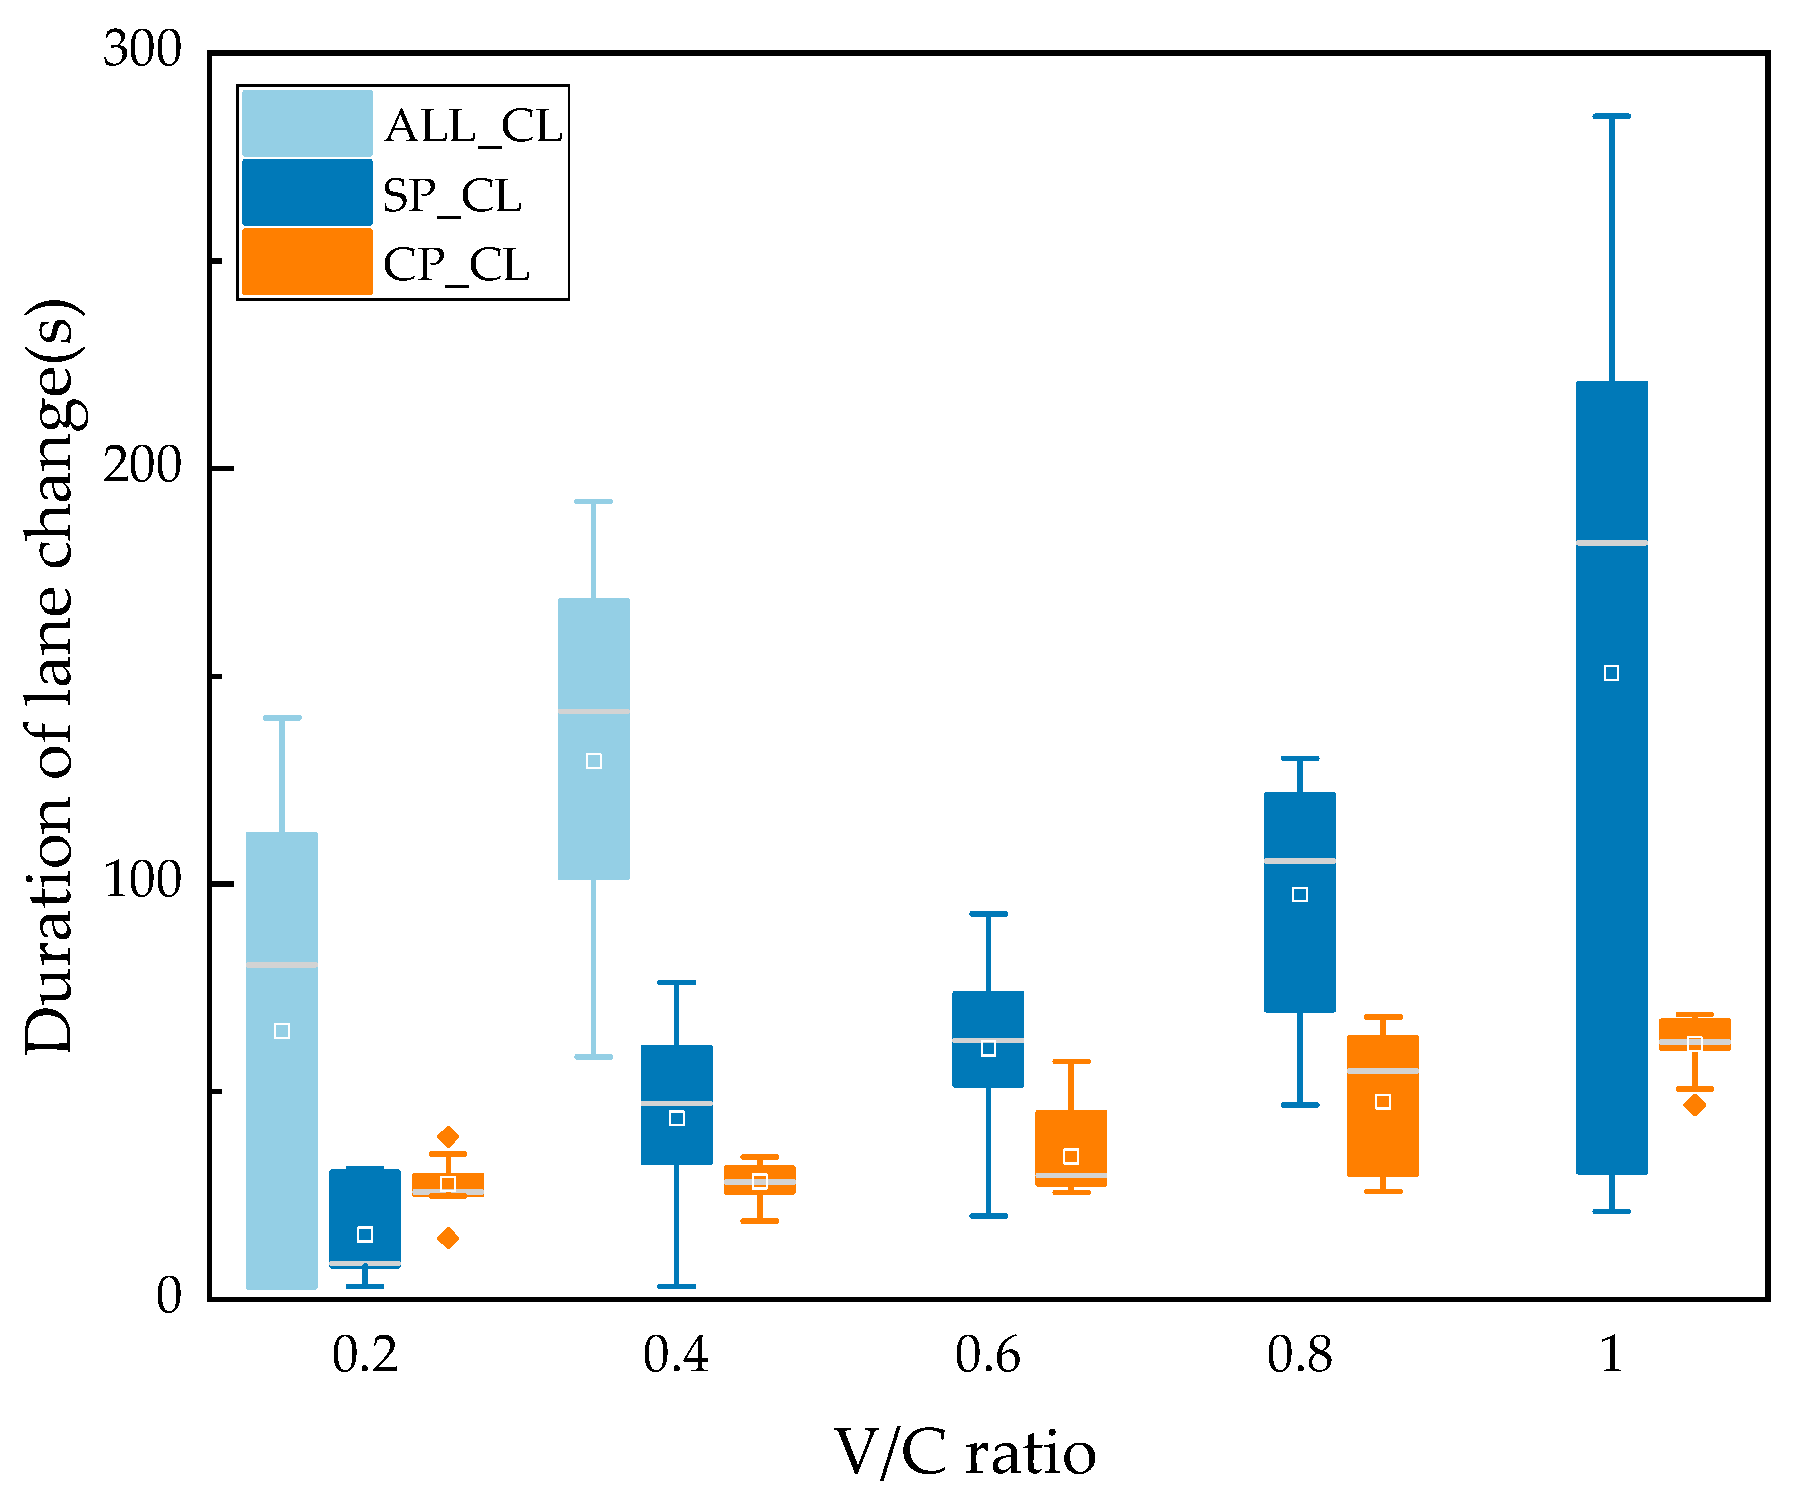
Figure 10 shows the duration of lane changing for ALL_CL, SP_CL, and CP_CL models at different V/C ratios. It can be seen that when the V/C ratio is greater than 0.4, the platoon, which is based on ALL_CL, is difficult to change lanes, indicating that the model relies on good road traffic flow conditions and is difficult to achieve in high-traffic density urban road sections. Compared to ALL_CL, SP_CL and CP_CL are less affected by the V/C ratio. However, SP_CL only considers its own environment when performing lane changes, making it difficult to ensure the continuity of the platoon. As the V/C ratio increases, the duration of SP_CL significantly increases, and the duration distribution of CP_CL is more concentrated and lower than that of SP_CL. This indicates that CP_CL model proposed in this study has stronger robustness and efficiency in the context of random traffic.
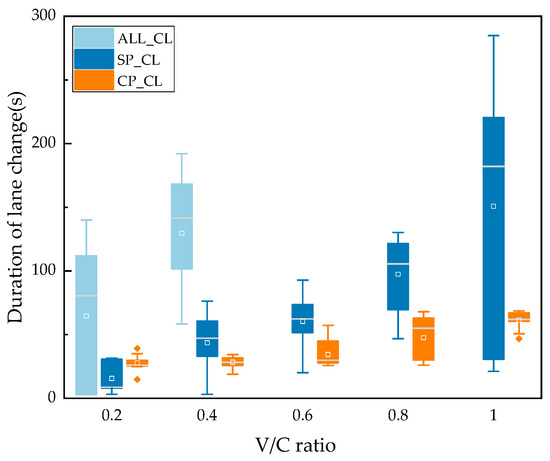
Figure 10.
Duration of lane changing for the platoon.
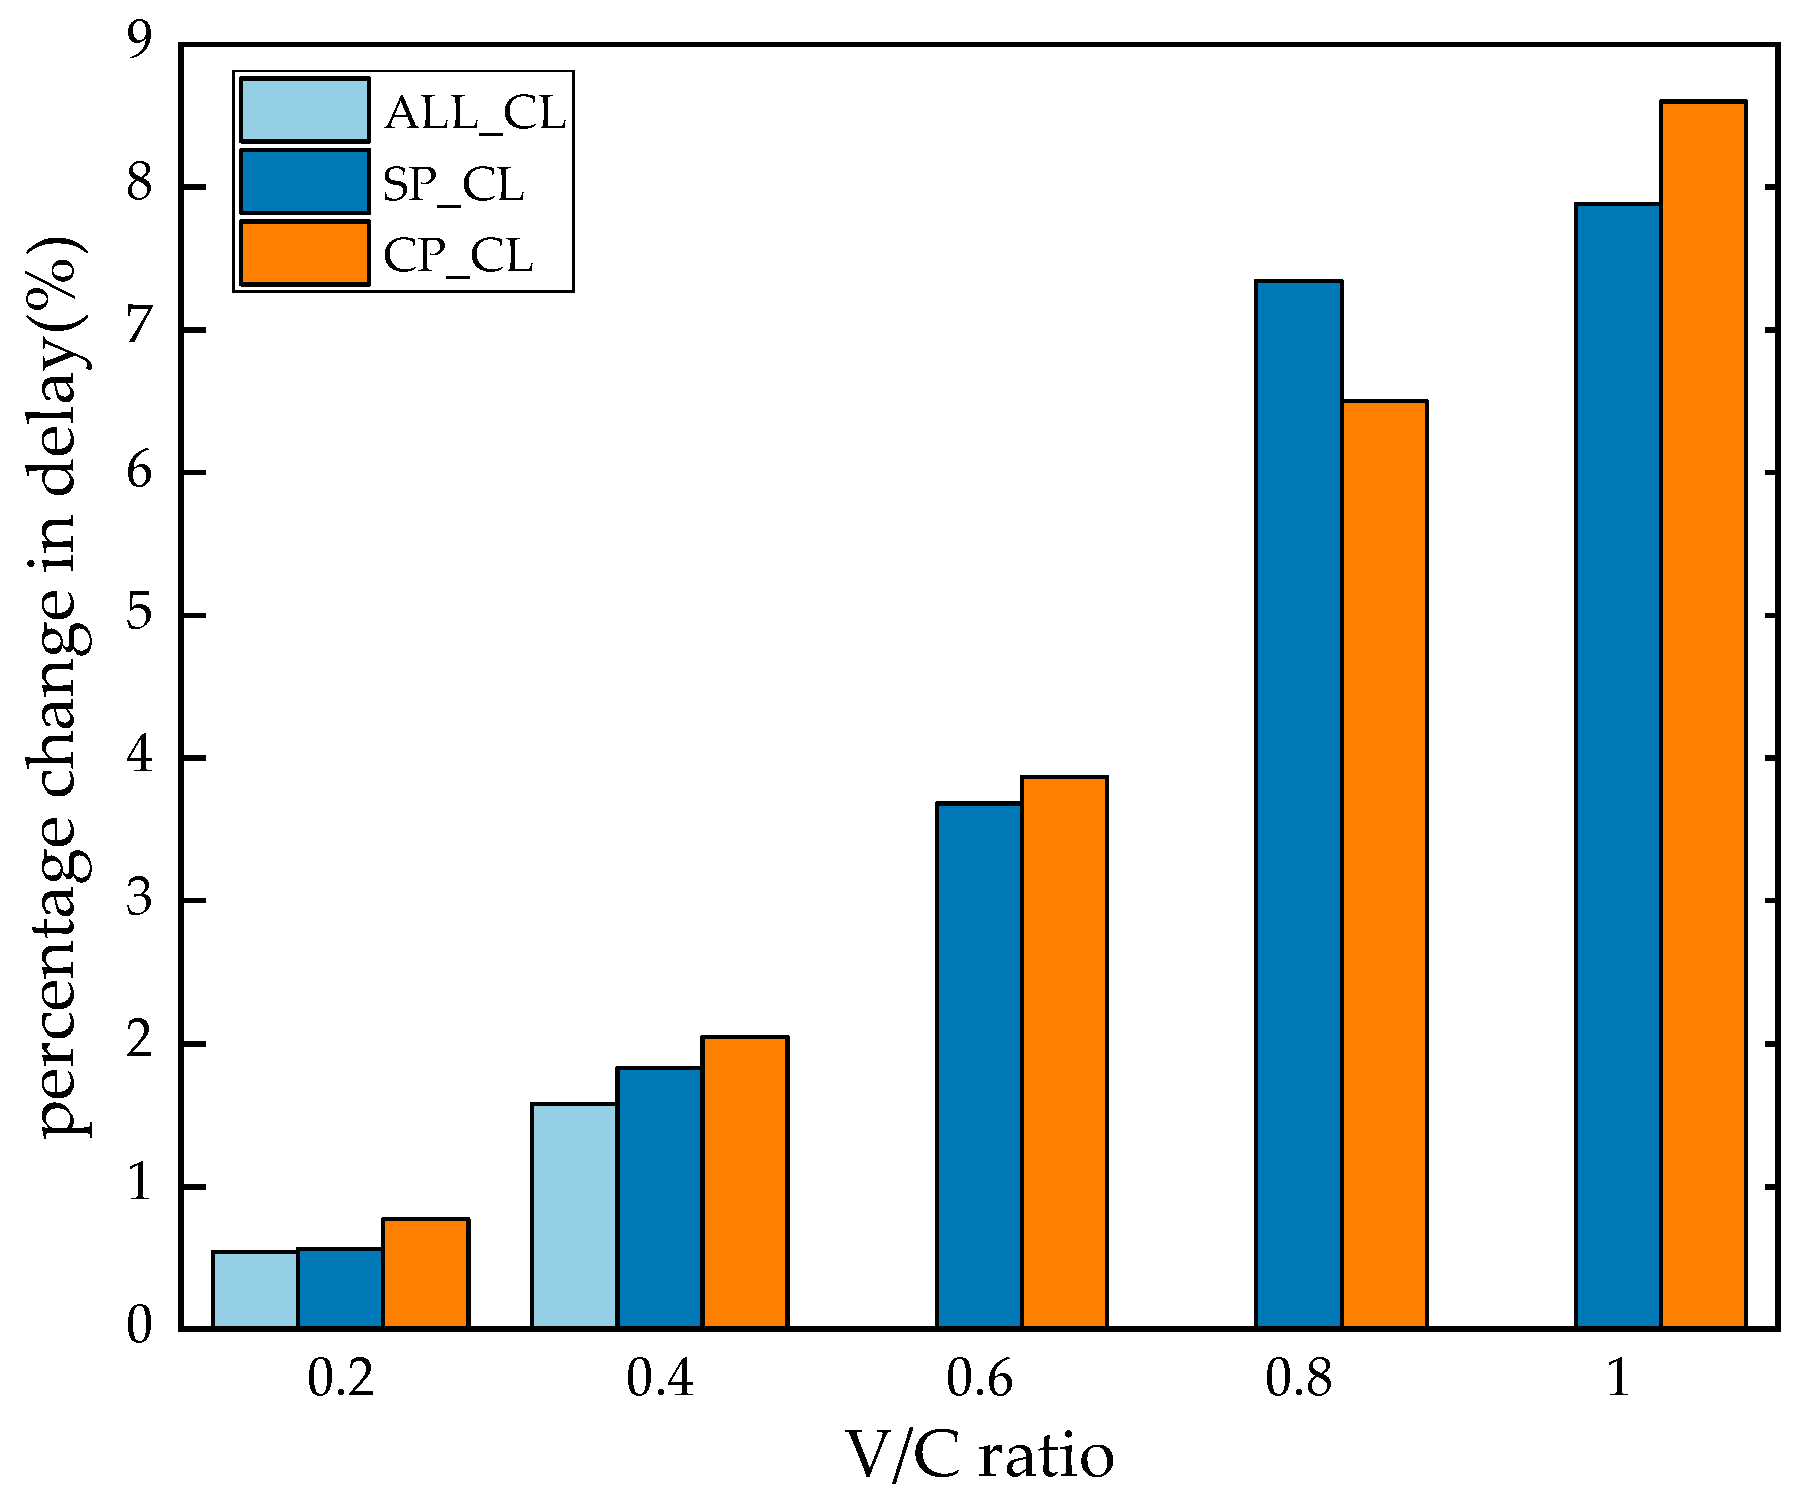
In addition, to further compare the impact of three lane-change guidance strategies on traffic flow, Figure 11 shows the percentage change in traffic flow delay under different platoon lane-change guidance strategies. It can be seen that the three lane-changing guidance strategies have similar adverse effects on traffic flow. In situations where the road traffic environment is good, ALL_CL has the least adverse impact on traffic flow when the platoon changes lanes. This is because ALL_CL relies on good road traffic conditions, and the platoon vehicles do not frequently change lanes. As the V/C ratio increases, the percentage of delay in traffic flow increases, indicating that when traffic conditions are poor, the lane-changing behavior of the platoon has a greater adverse impact on traffic flow. In addition, the delay growth rate of traffic flow under SP_CL is 226.78%, 101.09%, 99.45%, and 6.8% as the V/C ratio increases, indicating that when the V/C is greater than 0.8, the adverse impact of SP_CL on the traffic flow remains stable and is less affected by the V/C ratio. The growth rates of traffic flow delay for CP_CL are 159.74%, 88.78%, 67.95%, and 32.3% as the V/C ratio increases. The growth rates steadily decrease, indicating that as the V/C ratio increases, CP_CL gradually decreases the negative benefits on traffic flow.
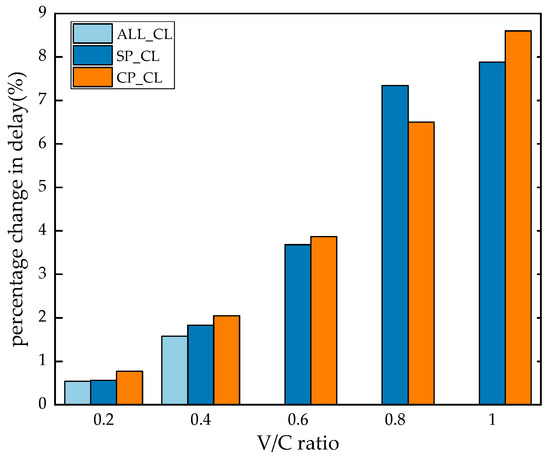
Figure 11.
Traffic flow delay percentage.
4. Conclusions
The platoon of trucks plays a significant role in saving energy consumption, improving road efficiency, and reducing transportation labor costs, and has therefore been highly valued by scholars both domestically and internationally. Due to the actuator failure under a complex urban road environment, this paper proposes a CACC truck platoon guidance strategy to achieve reliable and efficient lane changing based on HMT. The main conclusions are as follows:
- (1)
- This guidance strategy can safely and efficiently achieve lane changes for the CACC platoon when the actuator fails, with relatively little impact on the overall traffic flow on the road.
- (2)
- An analysis of the inter-distance error under this guidance strategy revealed that this guidance strategy maintains platoon stability during the lane-changing process. Moreover, it was found through a comparison with traditional platoon lane-changing strategies that this guidance strategy is reliable and more robust against congestion.
- (3)
- The closer the vehicle through HMT collaborative convoy lane changing is to the lead vehicle of the convoy, the longer the duration of the convoy’s lane change and the poorer the stability of the convoy will be.
5. Discussion
This article proposes a guidance strategy based on HMT to address the issue of actuator failures in CACC truck platoons. However, it should be noted that this study still has the following shortcomings:
- (1)
- Based on theoretical derivation and simulation, there is a gap between this study and the actual real vehicle.
- (2)
- The impact of other traffic participants, such as pedestrians and non-motorized vehicles, is not considered.
- (3)
- Large-scale road network scenarios and different road types have not been considered.
In the future, we will further explore the lane-changing behavior of CACC platoons in diverse and complex road network scenarios while simultaneously conducting real-vehicle experiments and constructing a CACC platoon real-vehicle testing platform. In addition, further in-depth research will be conducted on multi-lane continuous lane changing and target lane selection of the CACC truck platoon when the actuator fails.
Author Contributions
Conceptualization, Q.L. and L.G.; methodology, Q.L.; software, Q.L. and L.G.; validation, Q.L. and L.G.; formal analysis, Q.L.; investigation, Q.L. and L.G.; resources, Q.L.; data curation, Q.L. and L.G.; writing—original draft preparation, L.G.; writing—review and editing, Q.L.; visualization, Q.L.; supervision, Q.L.; project administration, Q.L.; funding acquisition, Q.L. All authors have read and agreed to the published version of the manuscript.
Funding
This research was funded by the National Natural Science Foundation of China (52372413, U20A20333, U20A20331, 52225212), the National Key R&D Program of China (2023YFB2504400), the Overseas Training Plan for Outstanding Young and Middle-Aged Teachers and Principals in Colleges and Universities in Jiangsu Province, and the Young Talent Cultivation Project of Jiangsu University.
Data Availability Statement
The original contributions presented in the study are included in the article, further inquiries can be directed to the corresponding author.
Conflicts of Interest
The authors declare no conflicts of interest.
References
- Mahajan, K.; Masud, S.S.B.; Kondyli, A. Navigating the landscape of automated truck platooning: A systematic review on stakeholder perspectives, employment implications, and regulatory challenges. Transp. Res. Interdiscip. Perspect. 2024, 23, 101009. [Google Scholar] [CrossRef]
- Akgün, E.Z.; Monios, J.; Rye, T.; Fonzone, A. Influences on urban freight transport policy choice by local authorities. Transp. Policy 2019, 75, 88–98. [Google Scholar] [CrossRef]
- Pulugurtha, S.S.; Jain, R.N. Passenger car equivalent travel time of a truck. Multimodal Transp. 2022, 1, 100031. [Google Scholar] [CrossRef]
- Marzano, V.; Tinessa, F.; Fiori, C.; Tocchi, D.; Papola, A.; Aponte, D.; Cascetta, E.; Simonelli, F. Impacts of truck platooning on the multimodal freight transport market: An exploratory assessment on a case study in Italy. Transp. Res. Part A Policy Pract. 2022, 163, 100–125. [Google Scholar] [CrossRef]
- Barua, L.; Zou, B.; Choobchian, P. Maximizing truck platooning participation with preferences. Transp. Res. Part E Logist. Transp. Rev. 2023, 179, 103297. [Google Scholar] [CrossRef]
- Hu, J.; Wang, H.; Li, X.; Li, X. Modelling merging behaviour joining a cooperative adaptive cruise control platoon. IET Intell. Transp. Syst. 2020, 14, 693–701. [Google Scholar] [CrossRef]
- Zhao, F.; Liu, Y.; Wang, J.; Wang, L. Distributed model predictive longitudinal control for a connected autonomous vehicle platoon with dynamic information flow topology. Actuators 2021, 10, 204. [Google Scholar] [CrossRef]
- Wang, Y.; Zhang, Z.; Wei, H.; Yin, G.; Huang, H.; Li, B.; Huang, C. A Novel Fault-Tolerant Scheme for Multi-Model Ensemble Estimation of Tire Road Friction Coefficient Witwithssing Measurements. IEEE Trans. Intell. Veh. 2024, 9, 1066–1078. [Google Scholar] [CrossRef]
- Wang, Y.; Chen, H.; Yin, G.; Mo, Y.; Boer, N.d.; Lv, C. Motion State Estimation of Preceding Vehicles With Packet Loss and Unknown Model Parameters. IEEE/ASME Trans. Mechatron. 2024, 99, 1–12. [Google Scholar] [CrossRef]
- Liu, J.; Dong, J. Privacy-Preserving Cruise Control for Heterogeneous Platoon Vehicle System Under Actuator Faults and Uncertainties. IEEE Trans. Intell. Transp. Syst. 2024, volume, 1–11. [Google Scholar] [CrossRef]
- Wang, L.; Qin, H.; Hang, P.; Chen, C.; Hu, M.; Bian, Y. Cyber-Physical-Level Safe Control of Intelligent and Connected Vehicles with Unreliable Communication and Actuator Faults. IEEE Trans. Intell. Veh. 2024, volume, 1–14. [Google Scholar] [CrossRef]
- Wang, L.; Bian, Y.; Cao, D.; Qin, H.; Hu, M. Hierarchical Safe Control of Heterogeneous Connected Vehicle Systems Using Adaptive Fault-Tolerant Control. IEEE Trans. Veh. Technol. 2024, volume, 1–14. [Google Scholar] [CrossRef]
- Zhu, P.; Jin, S.; Bu, X.; Hou, Z. Distributed Data-Driven Event-Triggered Fault-Tolerant Control for a Connected Heterogeneous Vehicle Platoon with Sensor Faults. IEEE Trans. Intell. Transp. Syst. 2023, 6, 5498–5509. [Google Scholar] [CrossRef]
- Liu, F.; Hua, Y.; Dong, X.; Li, Q.; Ren, Z. Adaptive fault-tolerant time-varying formation tracking for multi-agent systems under actuator failure and input saturation. ISA Trans. 2020, 104, 145–153. [Google Scholar] [CrossRef] [PubMed]
- Yan, M.; Chen, W.; Wang, Q.; Zhao, L.; Liang, X.; Cai, B. Human–Machine Cooperative Control of Intelligent Vehicles for Lane Keeping—Considering Safety of the Intended Functionality. Actuators 2021, 10, 210. [Google Scholar] [CrossRef]
- Liu, M.; Leng, B.; Xiong, L.; Yu, Y.; Yang, X. Segment drift control with a supervision mechanism for autonomous vehicles. Actuators 2021, 10, 219. [Google Scholar] [CrossRef]
- Wang, H.; Li, X.; Zhang, X.; Hu, J.; Yan, X.; Feng, Y. Cut through traffic like a snake: Cooperative adaptive cruise control with successive platoon lane-change capability. J. Intell. Transp. Syst. 2022, 28, 141–162. [Google Scholar] [CrossRef]
- Kamal, M.A.S.; Imura, J.i.; Hayakawa, T.; Ohata, A.; Aihara, K. Smart Driving of a Vehicle Using Model Predictive Control for Improving Traffic Flow. IEEE Trans. Intell. Transp. Syst. 2014, 15, 878–888. [Google Scholar] [CrossRef]
- Zambrano-Martinez, J.L.; Calafate, C.T.; Soler, D.; Cano, J.C. Towards a Centralized Route Management Solution for Autonomous Vehicles. In Proceedings of the 2019 IEEE Global Communications Conference (GLOBECOM), Waikoloa, HI, USA, 9–13 December 2019; pp. 1–6. [Google Scholar]
- Treiber, M.; Hennecke, A.; Helbing, D. Congested traffic states in empirical observations and microscopic simulations. Phys. Rev. E 2000, 62, 1805. [Google Scholar] [CrossRef]
- Shao, Y.; Shi, X.; Zhang, Y.; Zhang, Y.; Xu, Y.; Chen, W.; Ye, Z. Adaptive forward collision warning system for hazmat truck drivers: Considering differential driving behavior and risk levels. Accid. Anal. Prev. 2023, 191, 107221. [Google Scholar] [CrossRef]
- Liu, L.; Zhu, L.; Yang, D. Modeling and simulation of the car-truck heterogeneous traffic flow based on a nonlinear car-following model. Appl. Math. Comput. 2016, 273, 706–717. [Google Scholar] [CrossRef]
- Sharath, M.; Velaga, N.R. Enhanced intelligent driver model for two-dimensional motion planning in mixed traffic. Transp. Res. Part C Emerg. Technol. 2020, 120, 102780. [Google Scholar] [CrossRef]
- Ramezani, H.; Shladover, S.E.; Lu, X.-Y.; Altan, O.D. Micro-simulation of truck platooning with cooperative adaptive cruise control: Model development and a case study. Transp. Res. Rec. 2018, 2672, 55–65. [Google Scholar] [CrossRef]
- Yan-yan, Q.; Yi-wen, Z.; Li, Z.; Hong-hui, T. Capacity Analysis of Mixed Flow with Connected and Automated Truck Platooning. J. Transp. Syst. Eng. Inf. Technol. 2022, 22, 275–282. [Google Scholar]
- Chang-Yin, D.; Hao, W.; Wei, W.; Ye, L.; Xue-Dong, H. Hybrid traffic flow model for intelligent vehicles exiting to off-ramp. Acta Phys. Sin. 2018, 67, 179–193. [Google Scholar] [CrossRef]
- Liu, Q.; Liu, J.; Cai, Y.; Chen, L. Exploring the impact of the takeover time for conditionally automated driving vehicles on traffic flow in highway merging area. IEEE Trans. Intell. Transp. Syst. 2022, 23, 24753–24764. [Google Scholar] [CrossRef]
- Liu, Q.; Yu, R.; Cai, Y.; Chen, L. Studying the predictability of crash risk caused by manual takeover of autonomous vehicles in mixed traffic flow. Transp. Lett. 2023, volume, 1–19. [Google Scholar]
- Hsu, H.C.-H.; Liu, A. Kinematic design for platoon-lane-change maneuvers. IEEE Trans. Intell. Transp. Syst. 2008, 9, 185–190. [Google Scholar] [CrossRef]
- Lam, S.; Katupitiya, J. Cooperative autonomous platoon maneuvers on highways. In Proceedings of the 2013 IEEE/ASME International Conference on Advanced Intelligent Mechatronics, Wollongong, NSW, Australia, 9–12 July 2013; pp. 1152–1157. [Google Scholar]
Disclaimer/Publisher’s Note: The statements, opinions and data contained in all publications are solely those of the individual author(s) and contributor(s) and not of MDPI and/or the editor(s). MDPI and/or the editor(s) disclaim responsibility for any injury to people or property resulting from any ideas, methods, instructions or products referred to in the content. |
© 2024 by the authors. Licensee MDPI, Basel, Switzerland. This article is an open access article distributed under the terms and conditions of the Creative Commons Attribution (CC BY) license (https://creativecommons.org/licenses/by/4.0/).

