1. Introduction
In an electrified railway system, the power supplied by a pantograph–catenary system is vital for the normal operation of the vehicle [
1]. The catenary system is usually classified into the flexible catenary and the rigid catenary based on their structural differences. The rigid catenary, which is widely used in metro lines due to its strong durability, convenient installation, low maintenance cost, low tunnel clearance requirements, and good wind resistance, operates in a high-frequency and long-term environment [
2]. Long-term mechanical and electrical impact in harsh working environments leads to the formation of defects in the rigid catenary that can reduce the service life of the catenary as well as pose a threat to the safe operation of the vehicle. The online monitoring and defect diagnosis of the pantograph–catenary system can detect such defects and aid in the efficient elimination of their associated safety risks during normal operation [
3,
4]. Therefore, to reduce maintenance costs and ensure the safe operation of trains, the development of an effective monitoring and defect diagnosis system is significant and has attracted considerable attention in academics and industries.
Currently, mechanical sensor-based contact detection technology and vision-based detection technology have been widely utilized in pantograph–catenary systems for condition-based monitoring and defect diagnosis. Some scholars employ visual-based detection methods to extract the edges of catenary structures, thereby diagnosing faults in the catenary structures. In [
5], Liu W. et al. located the bracing wire components of a catenary using an image acquisition system and detected the installation defects of the messenger wire bases via image processing. Lyu et al. [
6] realized generic anomaly detection of catenary support components using an image-based approach, while Chen [
7] proposed a deep learning model for the diagnosis of catenary current-carrying ring faults. Kang et al. [
8,
9] proposed a contact wire support and insulator defect detection system capable of localizing the key components of a catenary and evaluating its defect status using deep Bayesian segmentation neural networks and prior geometric knowledge. Liu Y et al. [
10] introduced a robust image-based semantic segmentation model named ArcMSF for pantograph catenary arcing detection. While the visual-based detection method is effective in quickly identifying faulty components, it is limited to visible faults and lacks the ability to continuously monitor the status of the catenary in real time. Consequently, it cannot accurately detect the gradual degradation of the catenary status.
The mechanical sensor-based contact detection method utilizes sensors installed on the pantograph to indirectly monitor the real-time status of the catenary, thus diagnosing the catenary faults. Song Y et al. [
11] presented a method for evaluating the quality of pantograph–catenary current collection on high-speed railways using the contact line height variability. Tian SX et al. [
12] filtered the acceleration signal of the pantograph head with white noise using a global default threshold and utilized the characteristic signal to obtain a Hidden Markov Model for hard-point detection. Wang HR et al. [
13] proposed a data-driven approach using a Bayesian network to integrate inspection data from high-speed railway catenaries into a key performance indicator for improved condition monitoring. Gao SB et al. [
14] described the detailed architecture of the 6C system for automatic detection and monitoring of pantograph-catenary systems in China’s high-speed railways.
The objects of these studies are flexible catenaries, while there are limited studies on fault diagnosis of rigid catenaries.
At present, studies on monitoring and defect diagnosis of rigid catenary have mainly focused on condition monitoring by detecting the dynamic interaction parameters of the pantograph–catenary system. Bocciolone M et al. [
15] and Carnevale M et al. [
16] detected defects by observing the occurrence of high peaks in the measured contact force and vertical acceleration values. S. Gregori [
17] used a simulation model to generate acceleration data of pantograph heads under fault conditions and used it to train a neural network model, achieving state assessment of the contact network and diagnosis of contact wire wear and irregularities. The condition monitoring of a catenary can realize the abnormal state detection of a rigid catenary; however, the diagnosis of defects remains a challenge and has not been effectively resolved as defect identification and separation are quite difficult.
Due to the dynamic coupling relationship between the pantograph and the catenary, the pantograph’s vibration performance is intricately linked to the condition of the catenary. Diverse fault types lead to distinctive vibration patterns, giving rise to distinctive fluctuations in the dynamic interaction signal. Consequently, this paper introduces a defect diagnosis system based on pantograph vibrations for a rigid catenary. This system relies on strain signals as indicators, utilizing defect signature analysis to detect and identify various defects. This system offers the remarkable ability to pinpoint and synchronously locate catenary defects accurately, without the need for location equipment. It can be applied in real time and exhibits relatively high versatility. Furthermore, this system provides insights into the lifecycle of the catenary, particularly its early stages of degeneration, enabling defect prognosis and service life prediction.
2. Analysis of Common Defects in Rigid Catenary
Railways have often adopted rigid overhead conductor lines for current collection in underground lines and tunnels. The rigid catenary is composed of contact wires, the conductor rails, and the supports (
Figure 1). These supports are metal structures that are typically attached to the tunnel ceiling. The conductor rails are interconnected using bolted metal inserts, resulting in longer spans called anchoring sections. These mechanically independent anchoring sections form the entire catenary, which can minimize displacements due to thermal expansion or contraction. The overlap, expansion joint, and rigid–flexible transition are crucial structures that connect independent anchoring sections or different catenary components.
Metro operators have widely recognized that the majority of unfavorable behaviors between the pantograph and catenary—such as contact loss, impact, and arcing—tend to occur in specific sections like the overlap, expansion joint, and support spans. This is because the stiffness of the catenary varies in these unique spans, leading to an increase in vibrations caused by the interaction between the pantograph and the catenary. Over time, these intense vibrations can cause loosening, misalignment, and deformation of catenary components in the overlap, expansion joint, and support spans.
2.1. Misalignment of Overlap Section
The overlap section is crucial for maintaining electrical continuity in the line and transferring mechanical load from one catenary section to the next. In the transition span, the two sections overlap side-by-side, allowing the pantograph to interact with either one or both sections. When the pantograph travels through the overlap spans, the dynamic interaction parameters measured will exhibit different fluctuations compared to those in the normal span. Long-term exposure to pantograph shock and vibration can cause changes in the vertical displacement of the catenary, leading to vertical misalignment of the two catenary sections in the overlap. This misalignment of overlap can create hard spots and more intense impacts on the pantograph–catenary system.
2.2. Deformation of Expansion Joint
The expansion joint is made up of two parallel aluminum alloy plates of the same size, designed to compensate for any deformation caused by thermal expansion and contraction. One aluminum alloy plate is firmly attached, while the other is free to adjust and compensate for the deformation of the two adjacent conductor rails. However, due to differences in the length and thermal expansion/contraction forces of the conductor rails at both ends of the expansion joint, the amount of deformation caused by the expansion/contraction of the aluminum alloy plates varies. Additionally, the status of the expansion joints can change over time as a result of mechanical and electrical interactions within the pantograph–catenary system. Inconsistencies in the deformation can lead to a shift in the barycenter within the expansion joint after multiple expansions and contractions caused by temperature. This barycenter offset causes a downward bending deformation in the contact line at this point, which can impact the pantograph–catenary system and generate sparks and arcs.
2.3. Loosening of Support
Over the long-term operation of trains, as travel density increases, the energy generated accumulates, and any excess energy is transferred into the support system. This can have a noticeable impact on the support system’s performance. A significant amount of released energy can cause the support system’s threads to slip and other components to become loose during operation, ultimately leading to the loosening of the support system and disrupting the smooth operation of the train.
3. Analysis of Defect Characteristic Based on Simulation Test
In order to analyze defect characteristics of misalignment of the overlap section, deformation of the expansion joint, and the loosening of support, a simulation model using Finite Element Models (FEM) was established. The pantograph is modeled with a rigid–flexible hybrid body, with two strips of the pantograph head as a flexible body and other parts of the pantograph as a rigid body, as shown in
Figure 2a.
The rigid catenary support devices are simplified to a spring with mass, while the contact line and conductor rails are represented using the Euler–Bernoulli beam model. Furthermore, the stagger value is taken into account. The structure and parameters of the catenary used in this study are taken from a metro line in China. The catenary model includes two anchors, each 256 m long, connected by expansion joints. There are also overlapping sections at both ends of the catenary, as illustrated in
Figure 2b.
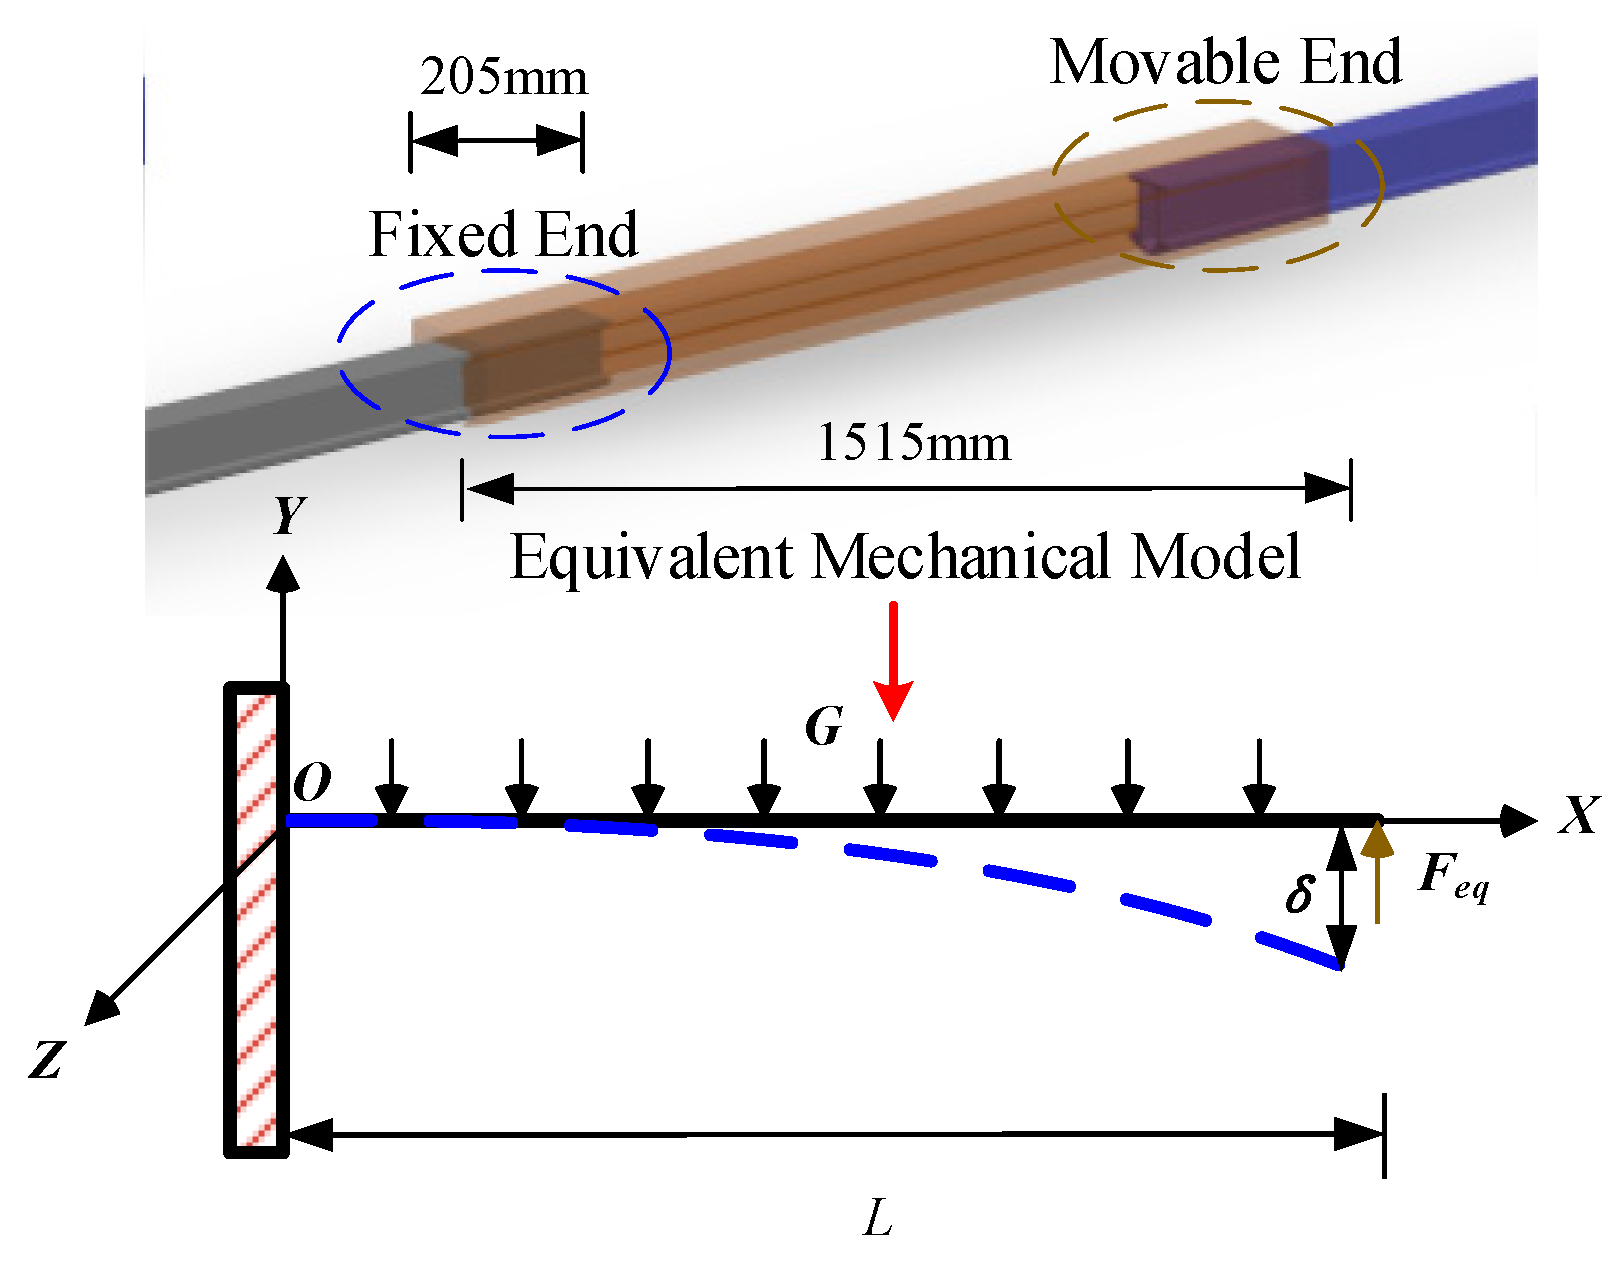
The expansion joint used in the experimental circuit in this paper is a dual auxiliary line expansion joint developed by the Furrer+Frey company from Guangzhou, China. Hence, we have chosen this specific type of expansion joint as our primary focus for the simulation. The expansion joint is composed of a fixed end and a movable end, which are both connected to different sections of the conductor rails. Given that the expansion joint experiences bending deformation during operation, it is represented as a beam model in our simulation. The fixed end is securely attached to the front anchor section, while the movable end is constrained using force elements to allow for a certain degree of freedom of movement along the conductor rail direction. This setup effectively simulates the thermal expansion and contraction of the conductor rails.
The expansion joint has a compensation range of 1000 mm, an overall length of 1515 mm, a mass of 60 kg, and a span of 4 m. The self-weight of the expansion joint, which is significantly heavier than the 6 kg/m mass of the conductor rail, enables sliding compensation for the conductor rail. However, due to the frequent reciprocating action of the pantograph and catenary, it is prone to loosening the connection between the expansion joint and the conductor rail. Coupled with its significant self-weight, this may result in the movable end of the expansion joint sinking, leading to an impact between the pantograph and catenary during passage. When the movable end of the expansion joint sinks due to gravity, the boundary conditions resemble those of a cantilever beam, allowing it to be equated to such a structure, as shown in
Figure 3. Notably, the interaction between the movable end of the conductor rail and the expansion joint can be likened to a concentrated force Feq applied to the cantilever beam.
The combined deformation of the free end of the expansion joint, caused by the interaction of the equivalent force Feq and gravity
G, results in the subsidence displacement, described in:
where
L is the length of the expansion joint, and
EI is the bending stiffness of the expansion joint.
At the overlap section, there is no constraint relationship between the front and rear anchor sections. By modifying the vertical relative displacement between these two sections, a fault model with various height differences can be established.
Under prolonged and repeated vibrations and impacts, the threaded connections within the support of the rigid catenary are prone to loosening. In severe cases, this can even lead to the detachment of the insulator from the conducting rail. In this paper, the support device has been simplified as a spring structure with a mass. To simulate the loosening and detachment failures of the support, we adjust the stiffness of the spring.
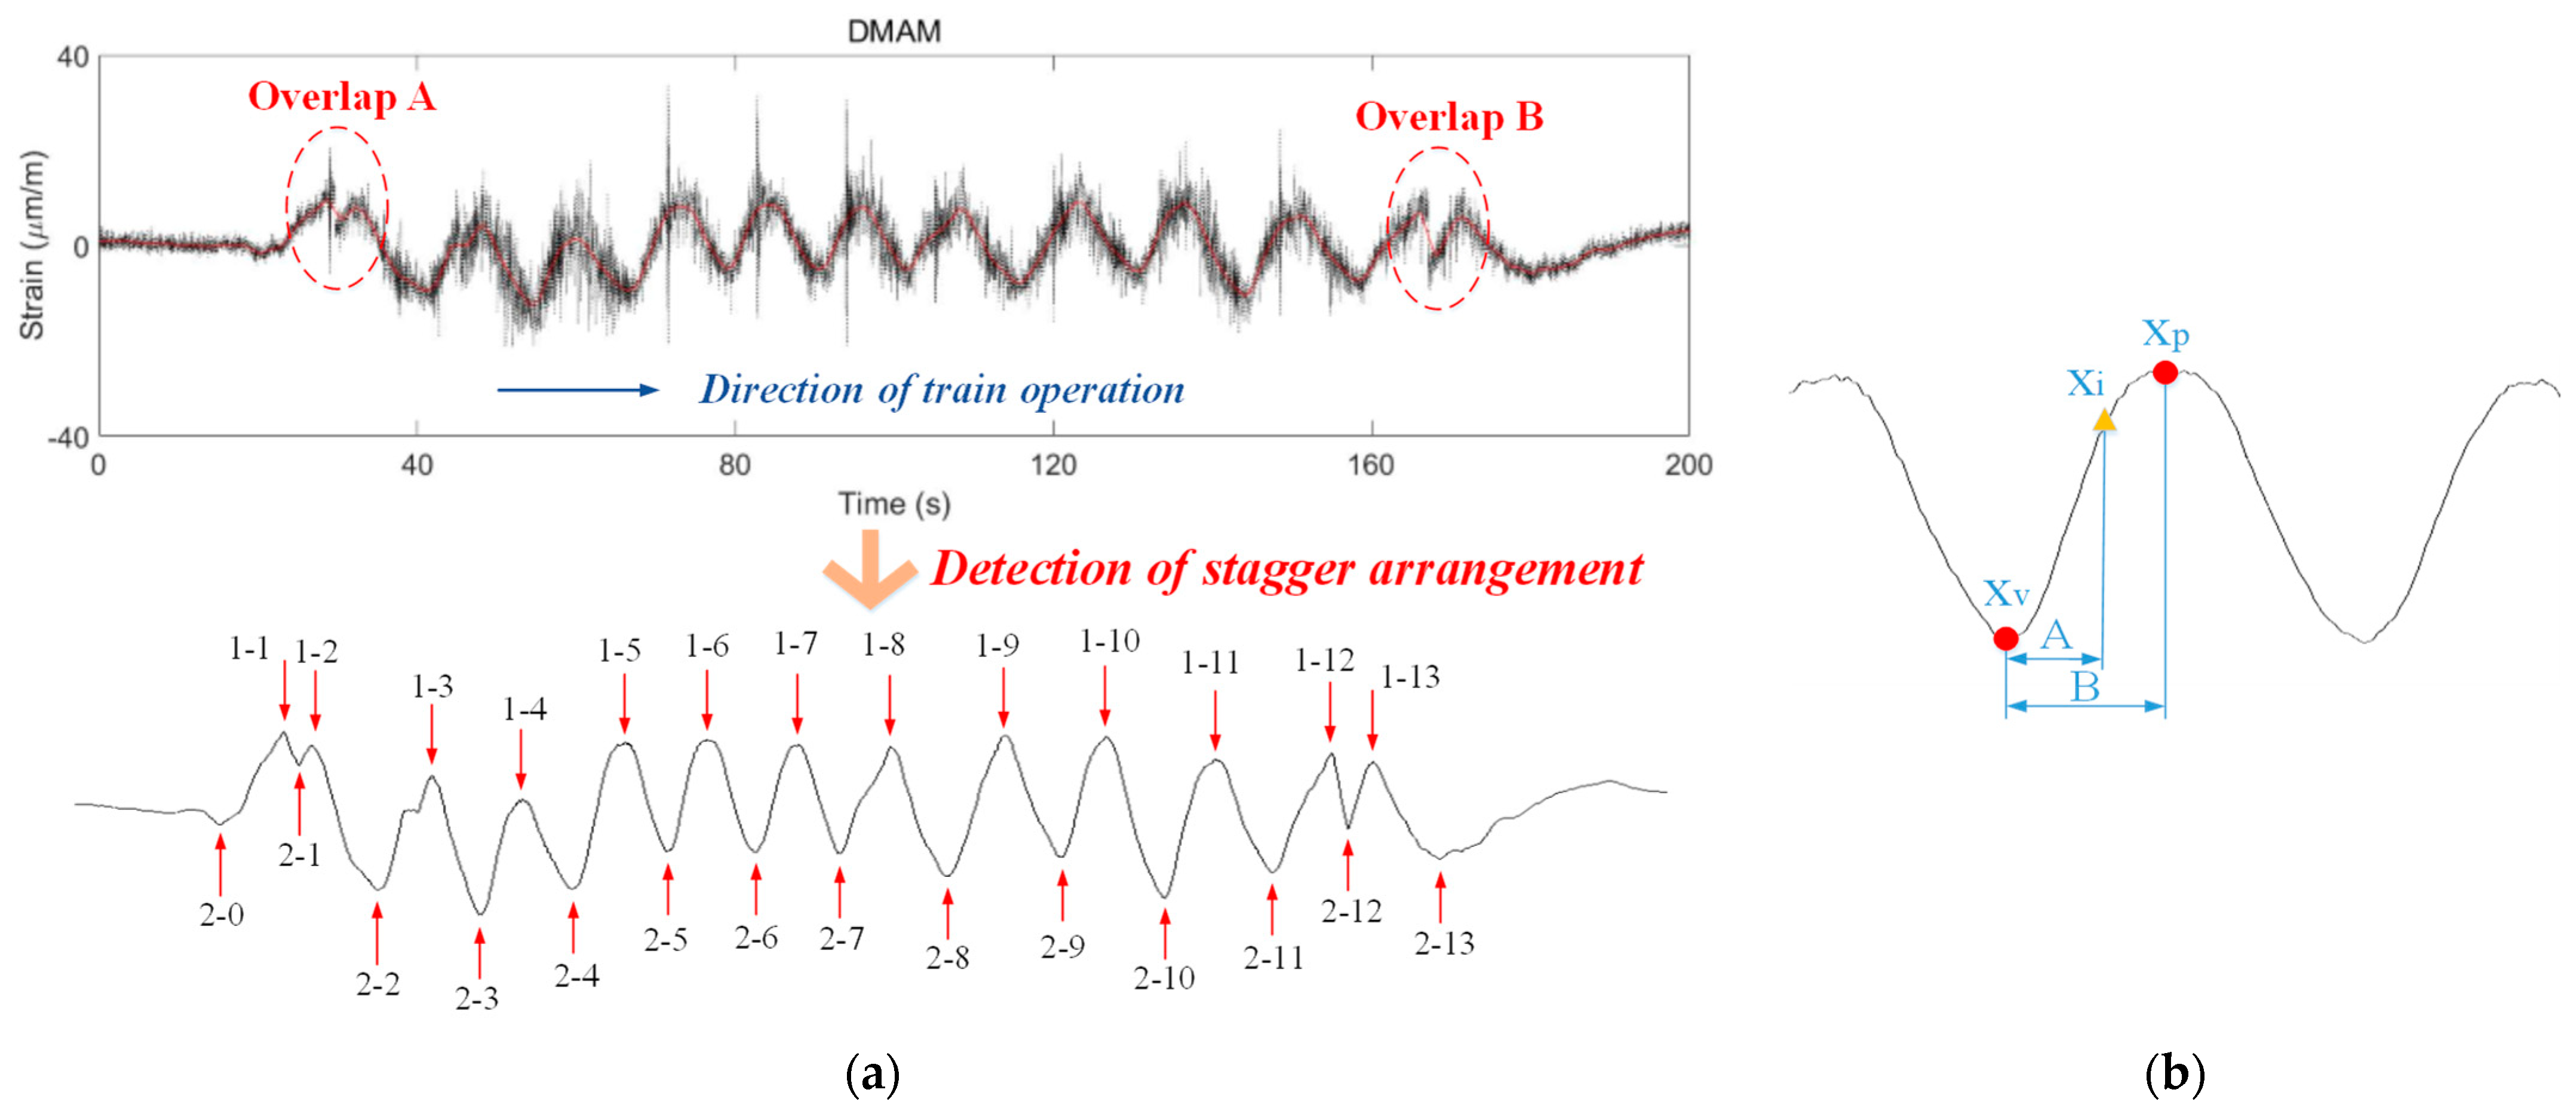
We simulated the strain as a train speeds along at 100 km/h. After analyzing the strain signal’s spectrum (see
Figure 4a), we discovered frequencies that align with the stagger (0.116 Hz) and dropper interval (3.47 Hz, 6.94 Hz, 10.41 Hz). This confirms the reliability of our simulation model.
To gain a better understanding of the fault characteristics of the catenary at various fault levels, we conducted simulation tests at 100 km/h with various fault levels.
Table 1 outlines the setup of these simulation experiments.
Figure 4b shows the strain signal, contact force signal, and dynamic pantograph head displacement signal results of the simulated defects caused by misalignment of overlap (misalignment displacement is 3 mm), loosening of support (stiffness is 37,788 N/m), and deformation of expansion joints (the amount of deformation is 3 mm).
As we can see in
Figure 4b, there are distinct differences in the waveforms of the faulty (blue curve) and fault-free (red curve) conditions at the overlap, support, and expansion joint sections. These variations are due to the distinct structures and failure modes of each section, which result in different vibration patterns and waveforms when there are defects. When the misalignment displacement of overlap reaches 3 mm, the simulated pantograph-head displacement is also approximately 3 mm, thereby verifying the reliability of the simulation results. By comparing the failure curve (blue curve) with the no-failure curve (red curve), it becomes evident that during the no-failure period, the pantograph–catenary vibration at the overlap, support, and expansion joint exhibited relatively regular patterns, with no notable impact. However, during the failure period, a significant impact was observed at the location of the failure.
A fault caused by misalignment of the overlap significantly impacts the strain and contact force signals. It also creates a noticeable difference in the pantograph–catenary displacement signal, as highlighted in the red box in
Figure 4b. Moreover, the fault characteristics caused by positive misalignment (left red box) and negative misalignment (right red box) are distinctly different. When the support loosens, the vibration amplitude at the adjacent support increases, while the amplitude at the faulty support decreases, as shown in the green box in
Figure 4b. Additionally, the deformation of the expansion joint leads to increased vibration at the faulty expansion joint, as indicated in the orange box.
Furthermore, the faulty features present in strain, contact force, and dynamic pantograph head displacement signals due to defects in the support, expansion joints, and overlap are highly similar. This suggests that both the contact force and strain demonstrate a similar level of sensitivity toward dynamic interaction loads. Moreover, the strain signal is more responsive to the position of the load, particularly the contact point. Vibrations caused by stagger provide insights into the location of defects, whereas those caused by coupled contact offer insights into their cause. Therefore, the unique characteristics of the measured strain signal allowed for the diagnosis of defects.
5. Experiments Results and Analysis
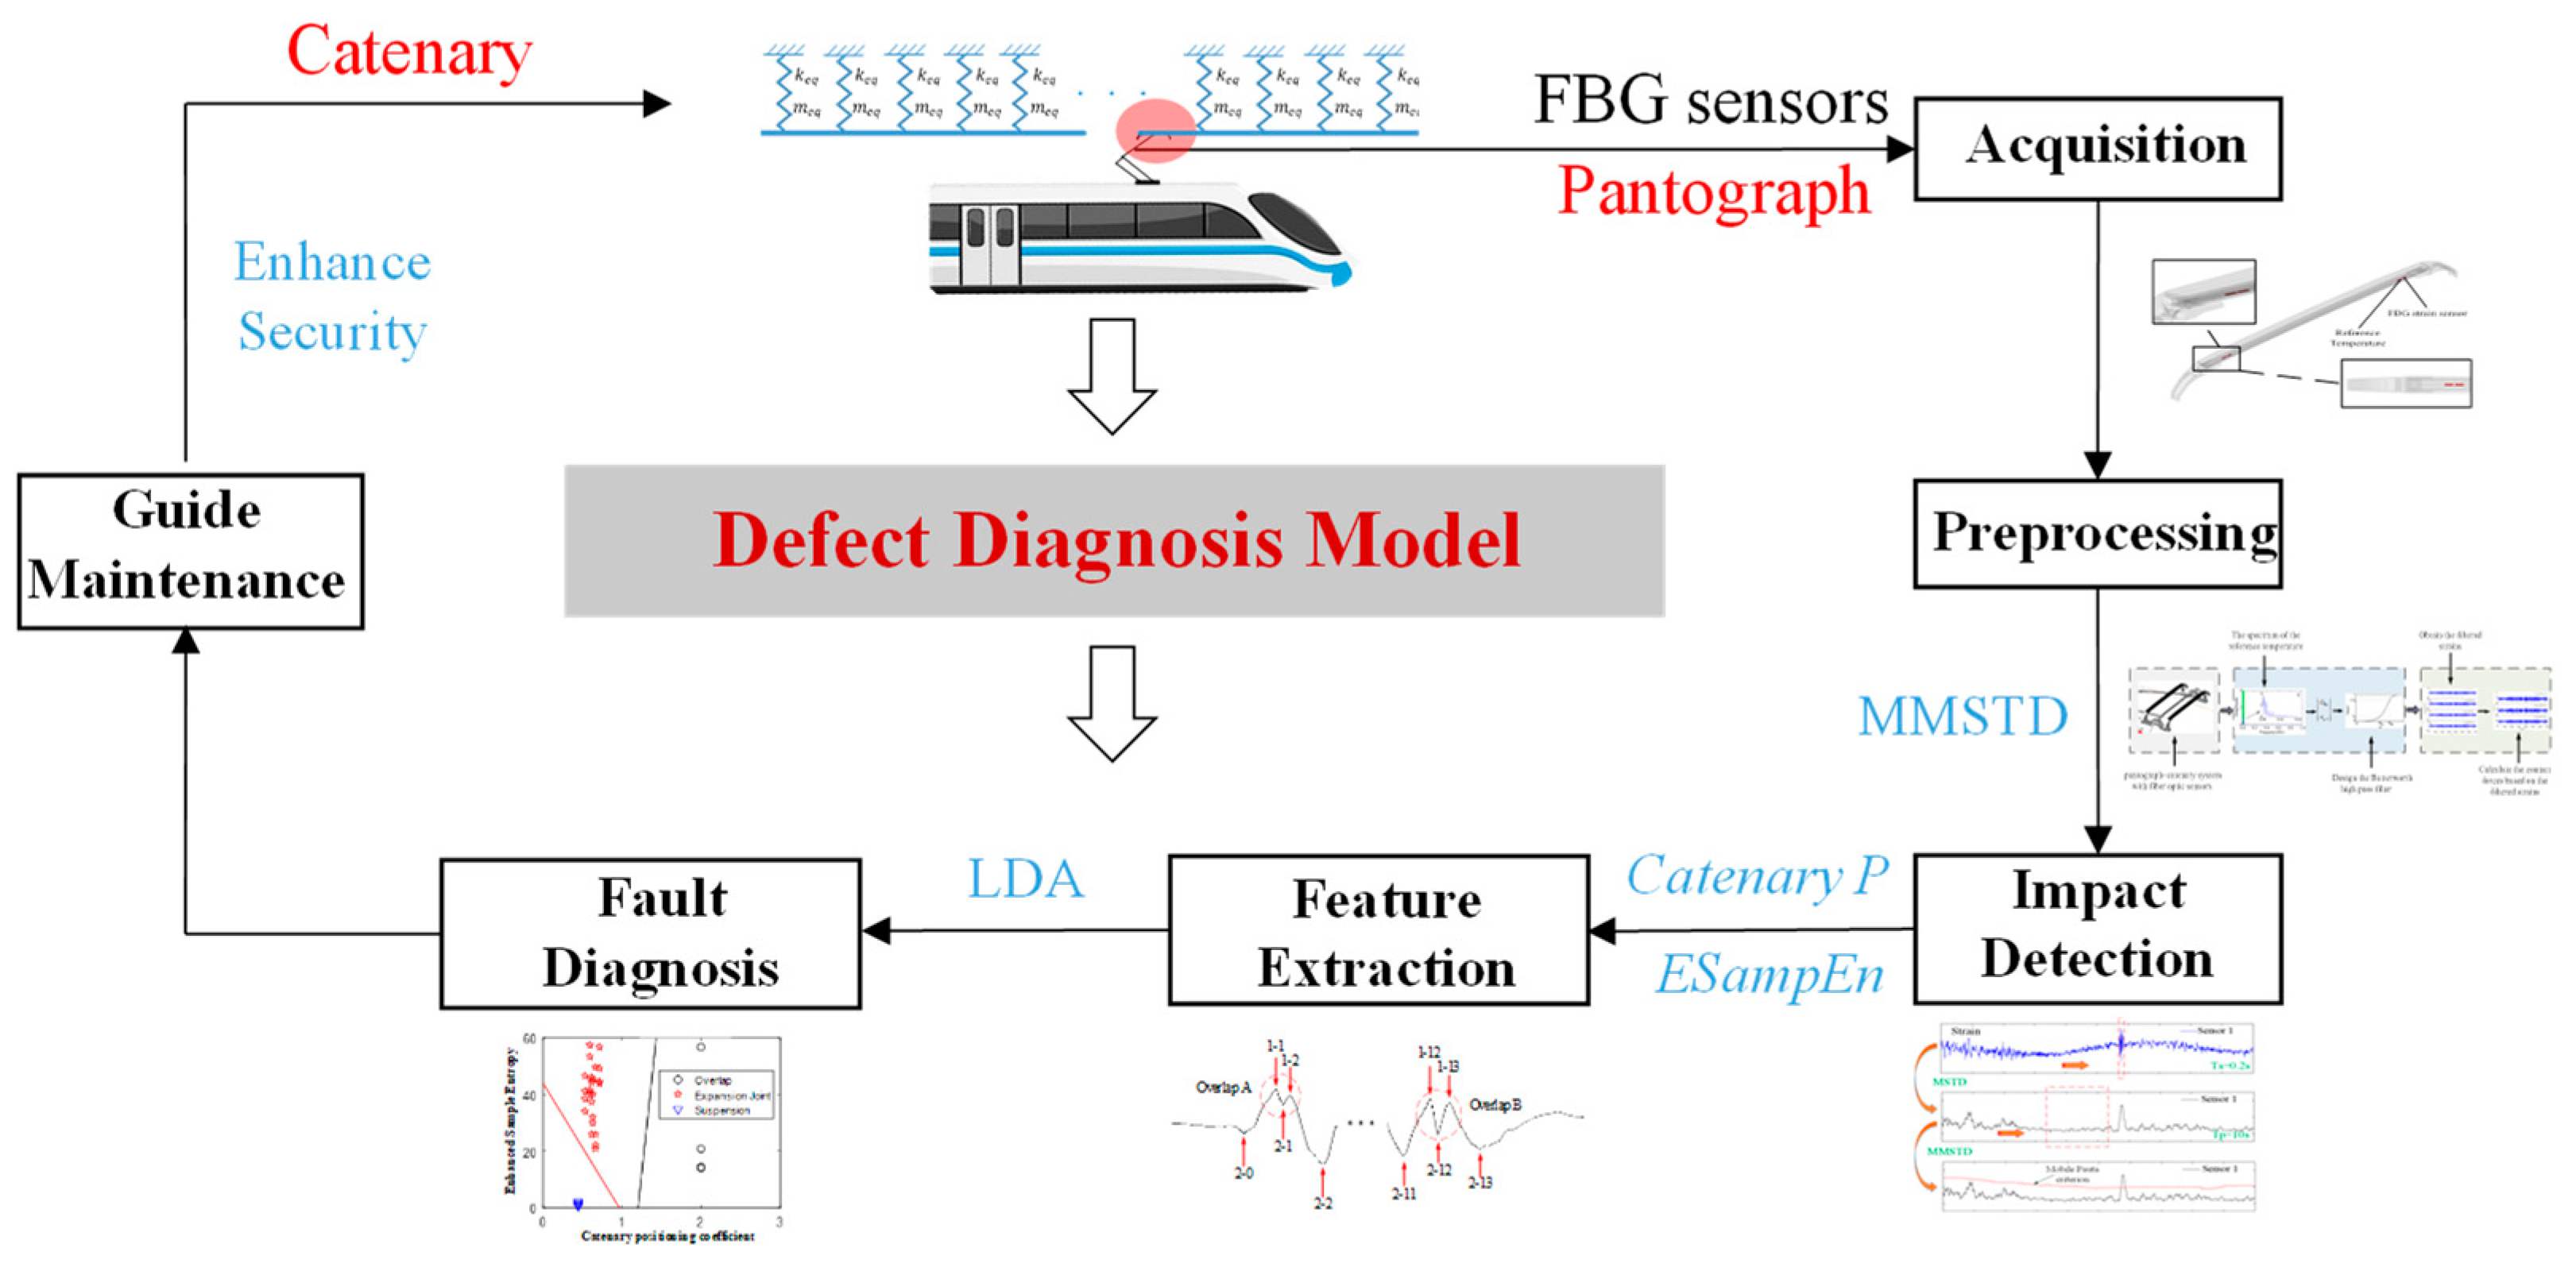
The catenary defect diagnosis system proposed in this study implements condition-based monitoring, impact detection, and defect diagnosis. As illustrated in
Figure 9a, lightweight and compact optic fiber strain sensors were embedded into the inner surface of a pantograph aluminum support. Given that significant fluctuations in contact strip temperature can compromise the measurement accuracy of optic fiber strain sensors, four reference temperature sensors were installed in close proximity to the strain sensors for temperature compensation. For further details, please refer to our previously published paper [
18].
Data from online tests utilizing the proposed monitoring system were collected from the metro line, with preprocessing employed to eliminate measurement noise and temperature-related drifts from the pantograph strain values obtained. To verify the reproducibility of experimental outcomes, two tests were conducted on the same line, separated by half a month. The Mann–Whitney U test and the Kruskal–Wallis test were utilized to analyze the correlation between these two tests. The correlation analysis results are summarized in
Table 2. Additionally, we analyzed two distinct rigid catenary segments, as represented in
Figure 9b (Case1 and Case2). Notably, strain signals collected on DATE1 (30June) and DATE2 (15 July) exhibited highly similar trends and amplitudes. However, the amplitude of the strain signal on DATE2 was slightly greater than that on DATE1. This observation suggests that half a month of operation slightly degraded the catenary’s condition.
The correlation coefficient analysis demonstrates a strong linear correlation between the strain signals obtained on the two dates. Furthermore, the Mann–Whitney U test and Kruskal–Wallis test confirm that the two datasets exhibit identical distributions (ID) and significant correlation. These findings validate the reliability and reproducibility of the experimental results.
The strain signals obtained from two distinct rigid catenary segments (Case1 and Case2) were analyzed using the proposed defect diagnosis method.
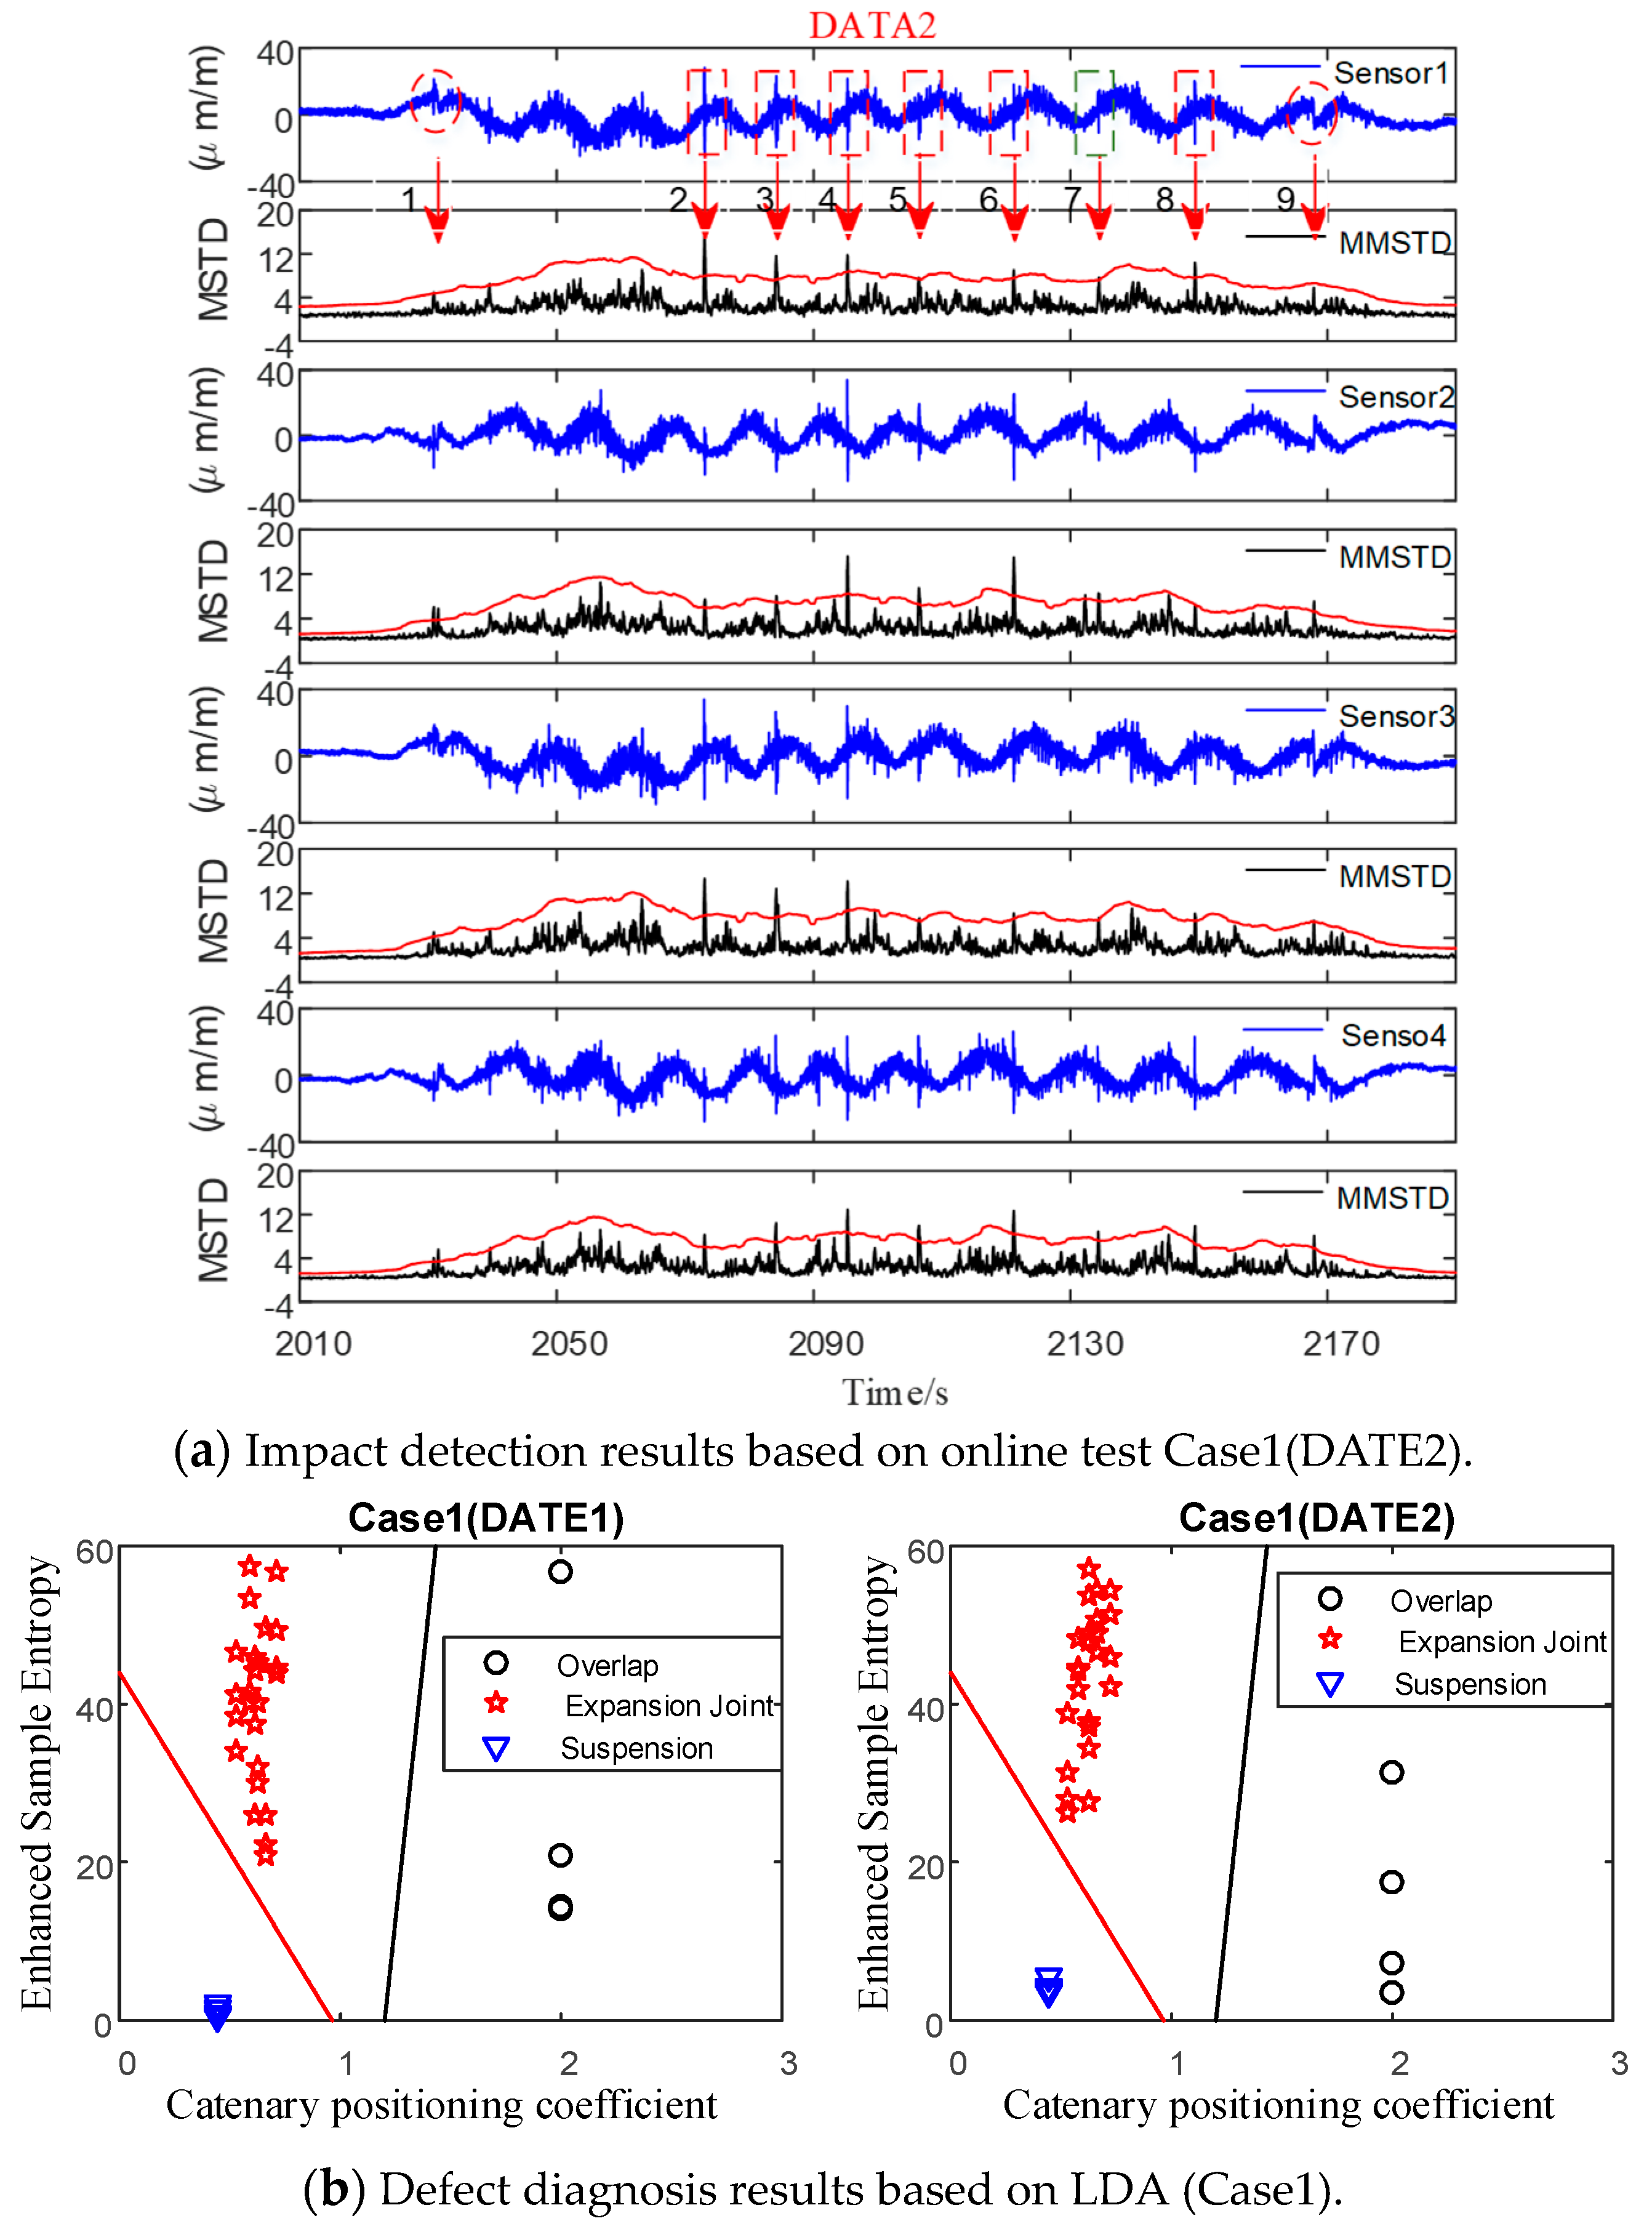
Figure 10 presents the strain signals captured by the four optic fiber strain sensors and the corresponding impact detection outcomes. The schematic of the corresponding rigid catenary segment (Case1) is provided at the top of
Figure 10. This configuration comprises two overlap sections (highlighted in a red box), ten expansion joints, and eleven midpoint anchors.
It is evident that the MMSTD (right curve) effectively identified the real impact defects (1, 2, 3, 4, 5, 6, 7, 8, 9). Subsequently, the feature extraction methods were utilized to extract the catenary position and enhance the sample entropy of the detected impact defects. Furthermore, a detailed view (
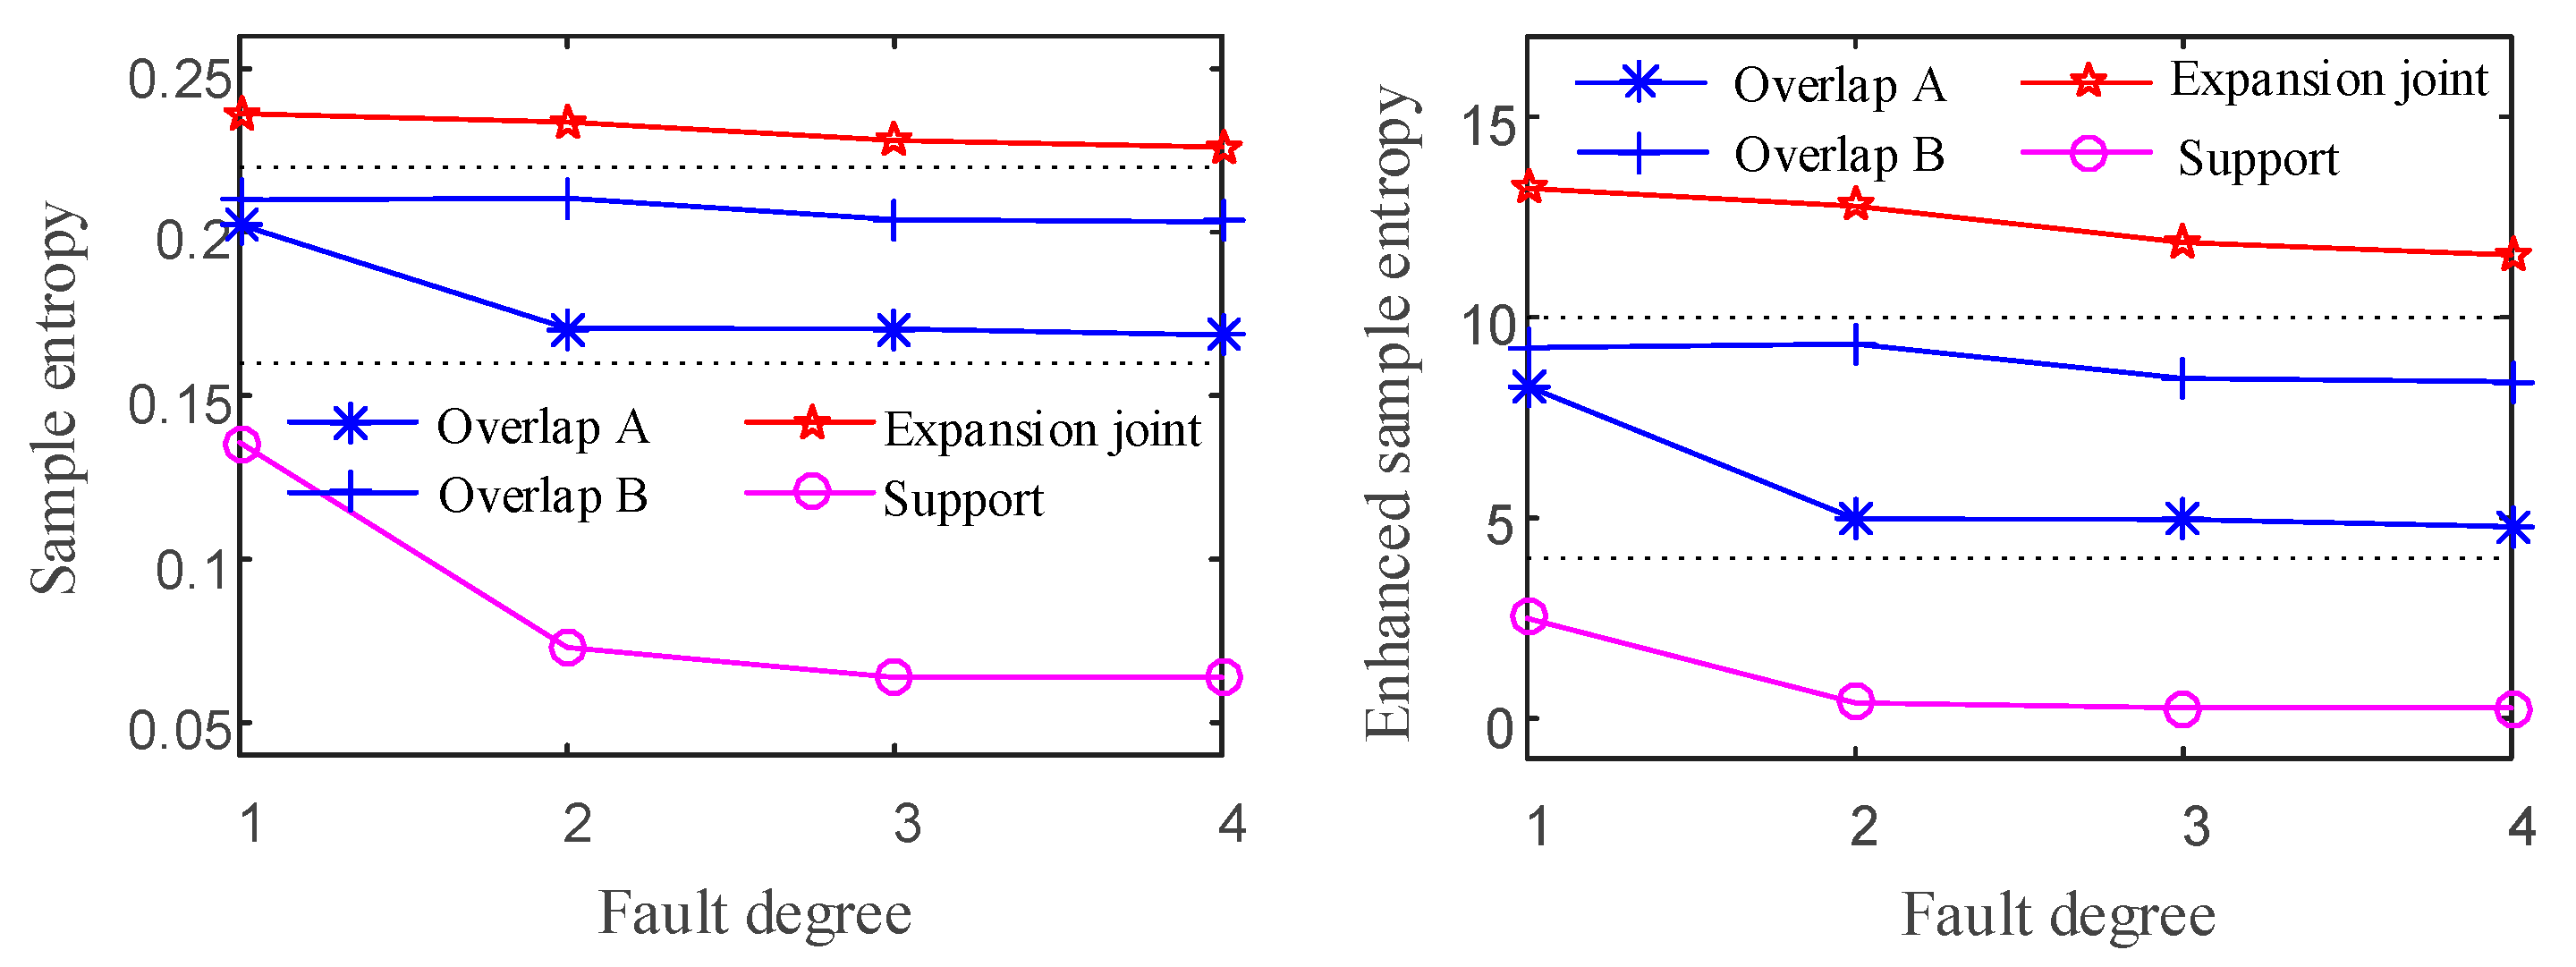
Figure 10c) reveals distinct defect characteristics among various defects, such as those caused by the deformation of expansion joints and loosening of control supports. These differences align with the simulation outcomes, highlighting the feasibility of the proposed diagnosis method to discriminate between different defects using enhanced sample entropy as a guiding feature.
Figure 11 presents the defect monitoring and feature extraction results of Case1 obtained from DATA 2. The collection time of DATA 2 is half a month later than that of DATA 1. As evident from the results, the detected defects are consistent, indicating the reproducibility of the test and the reliability of the experimental data. Following impact detection, the newly proposed diagnosis method was utilized to analyze the defects, with the diagnosis outcomes presented in
Figure 11b. As can be seen from
Figure 11b, the classification accuracy obtained by feature selection based on LDA is 100%, which can completely separate the three types of faults.
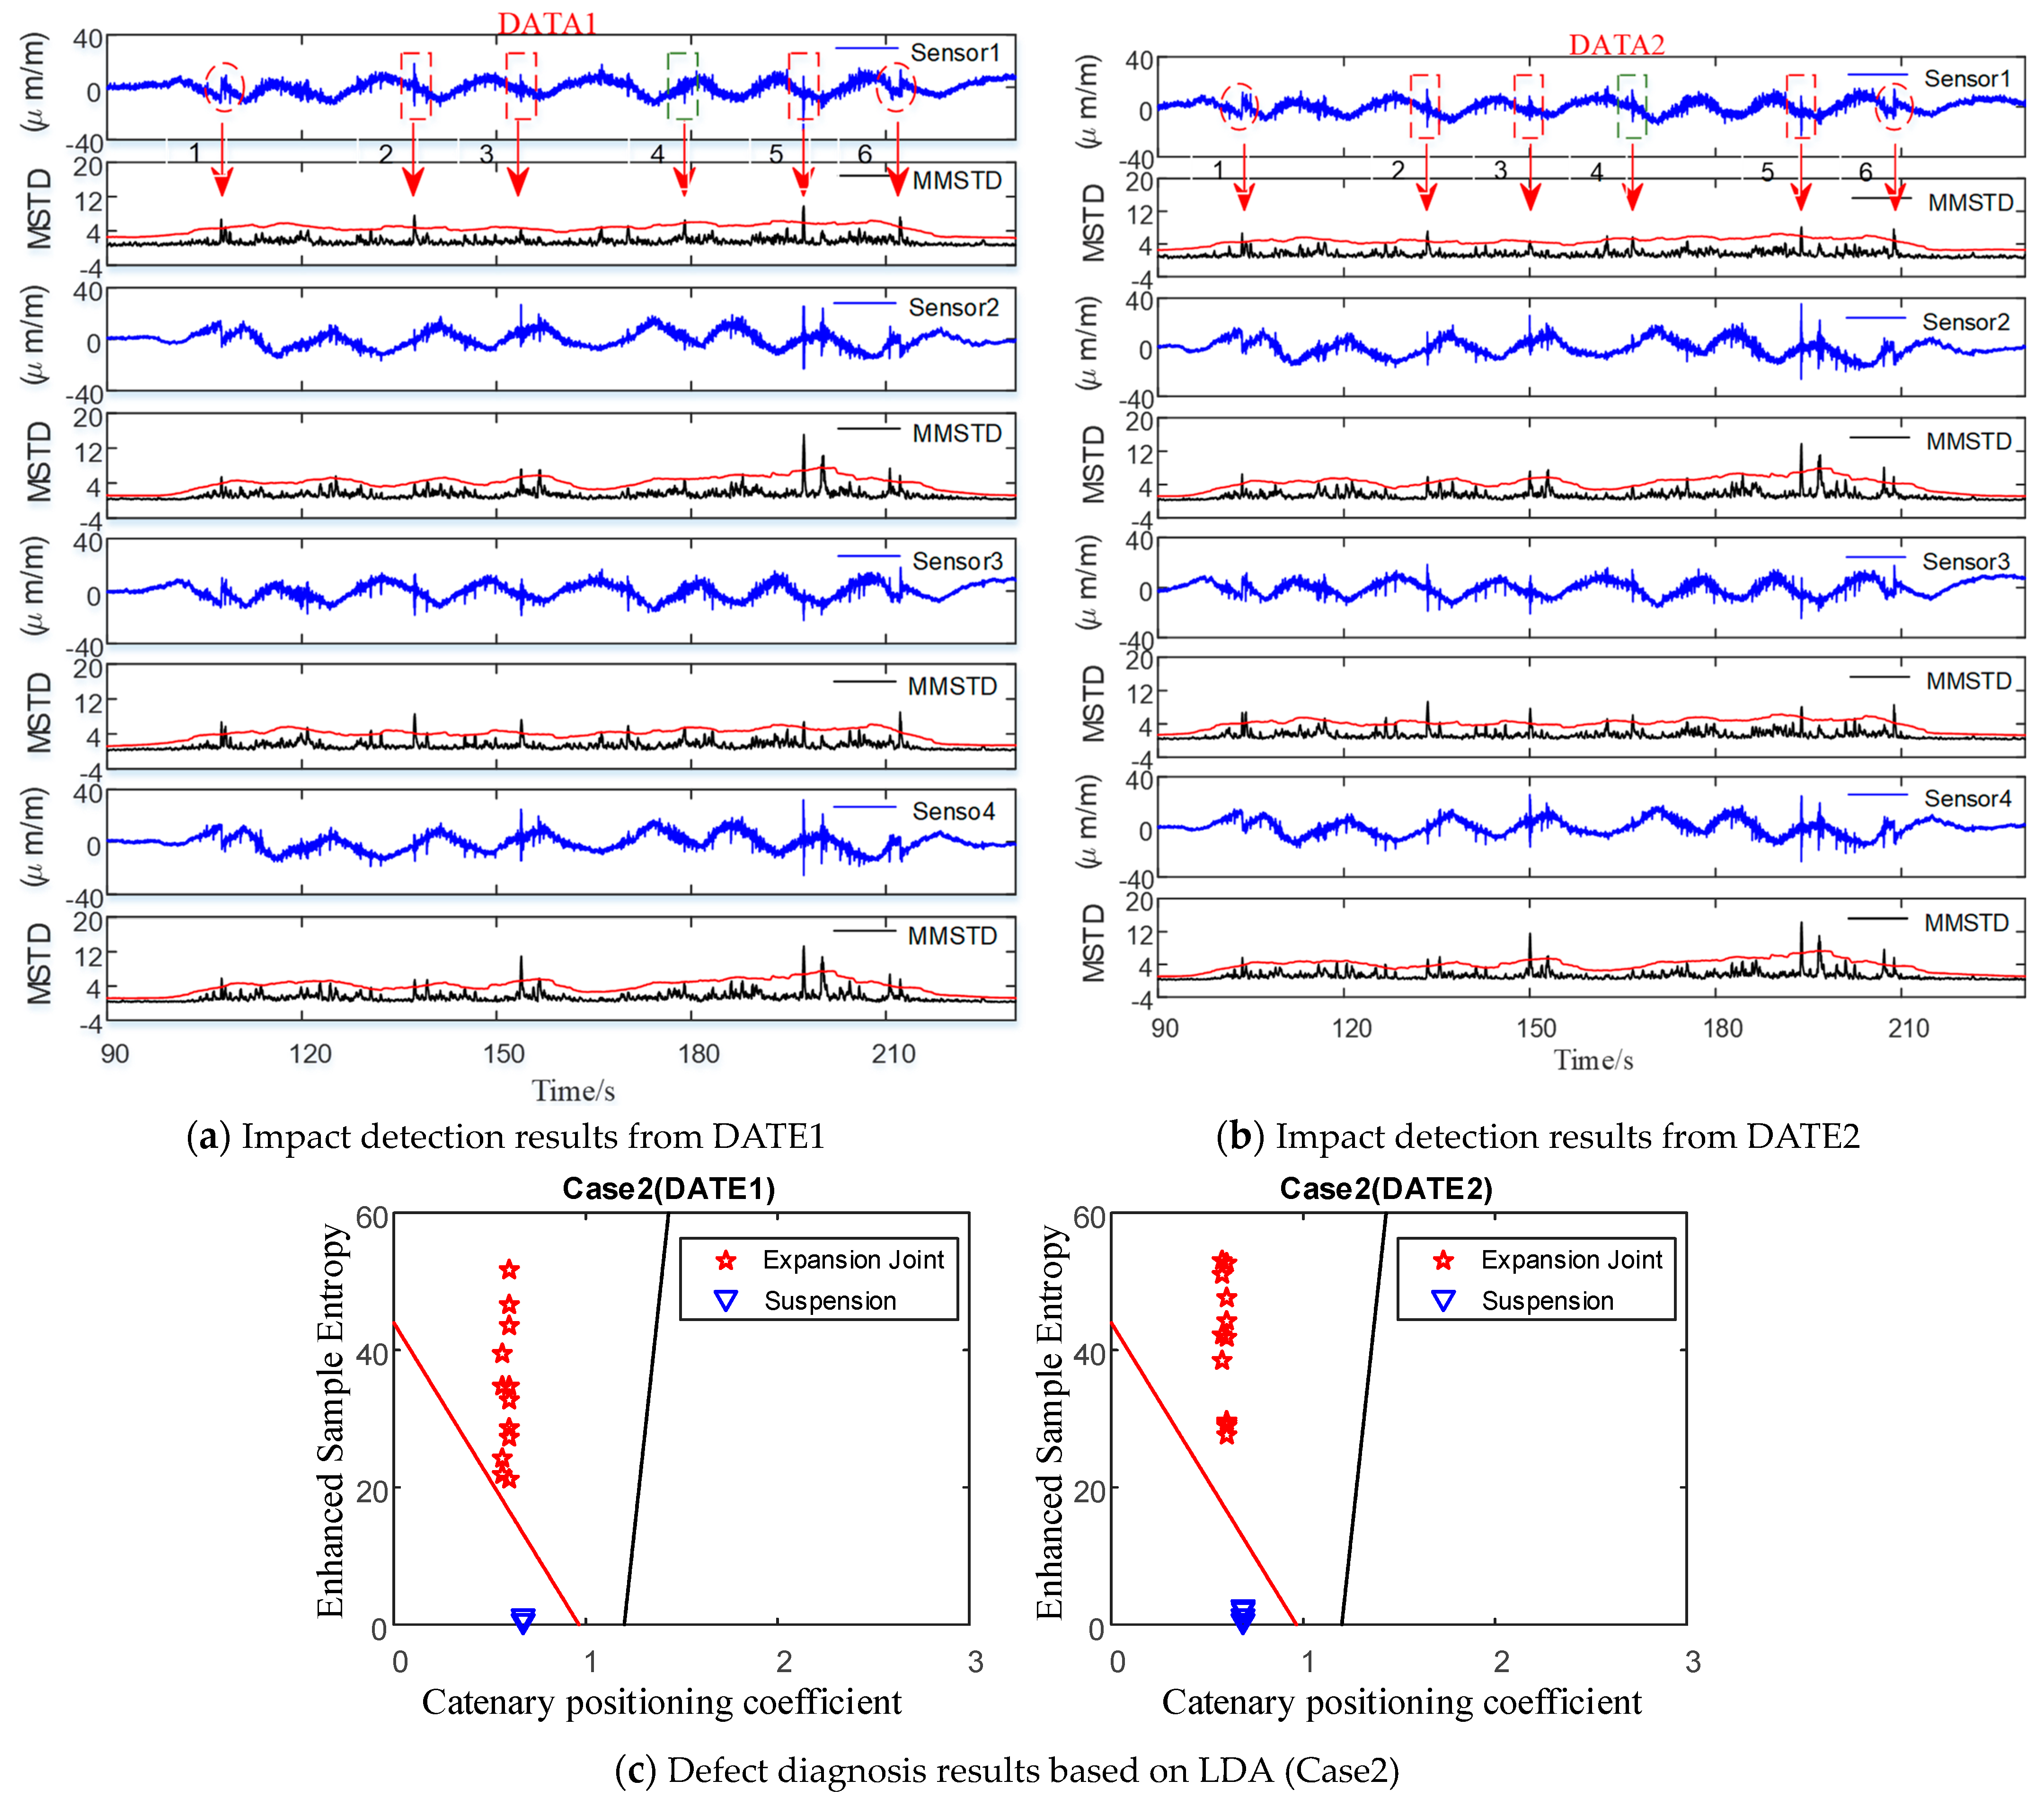
In the provided example, Case1 possesses a diverse range of fault categories and numerous fault points, making it suitable as a training sample. However, in practical applications, a more extensive statistical analysis of the measured faults in operational catenary systems should be conducted to enrich the training fault samples further. Subsequently, by inputting the fault features into the trained LDA classifier, the fault diagnosis results can be obtained, as illustrated in
Figure 12.
For the data collected from Case2, the MMSTD method was utilized to detect the defects, and a total of four defects were identified in Case2, as presented in
Figure 12. The statistical characteristics of these defects are summarized in
Table 3.
The analysis of Case1 and Case2 demonstrates that the fault feature extraction method proposed in this study renders the three prevalent catenary faults linearly separable. The findings indicate that the proposed approach enables discrimination between detected defects and provides information on their type and location. Furthermore, the diagnosis results were verified by the train operation company and were consistent with manual detection outcomes. The outcomes of the conducted analyses suggest that the proposed defect diagnosis method is highly effective.
6. Conclusions
In this study, we present a defect diagnosis system for a rigid catenary based on strain signals. The system architecture, key methods, and devices of the detection and monitoring system of the catenary are described in detail. We utilize pantograph head strain as a defect indicator, simplifying the detection system. The main conclusions are summarized as follows:
(1) The defects caused by the deformation of the expansion joint, the misalignment of overlap, and the loosening of control support result in different vibration patterns and waveforms in strain signals collected from the pantograph head.
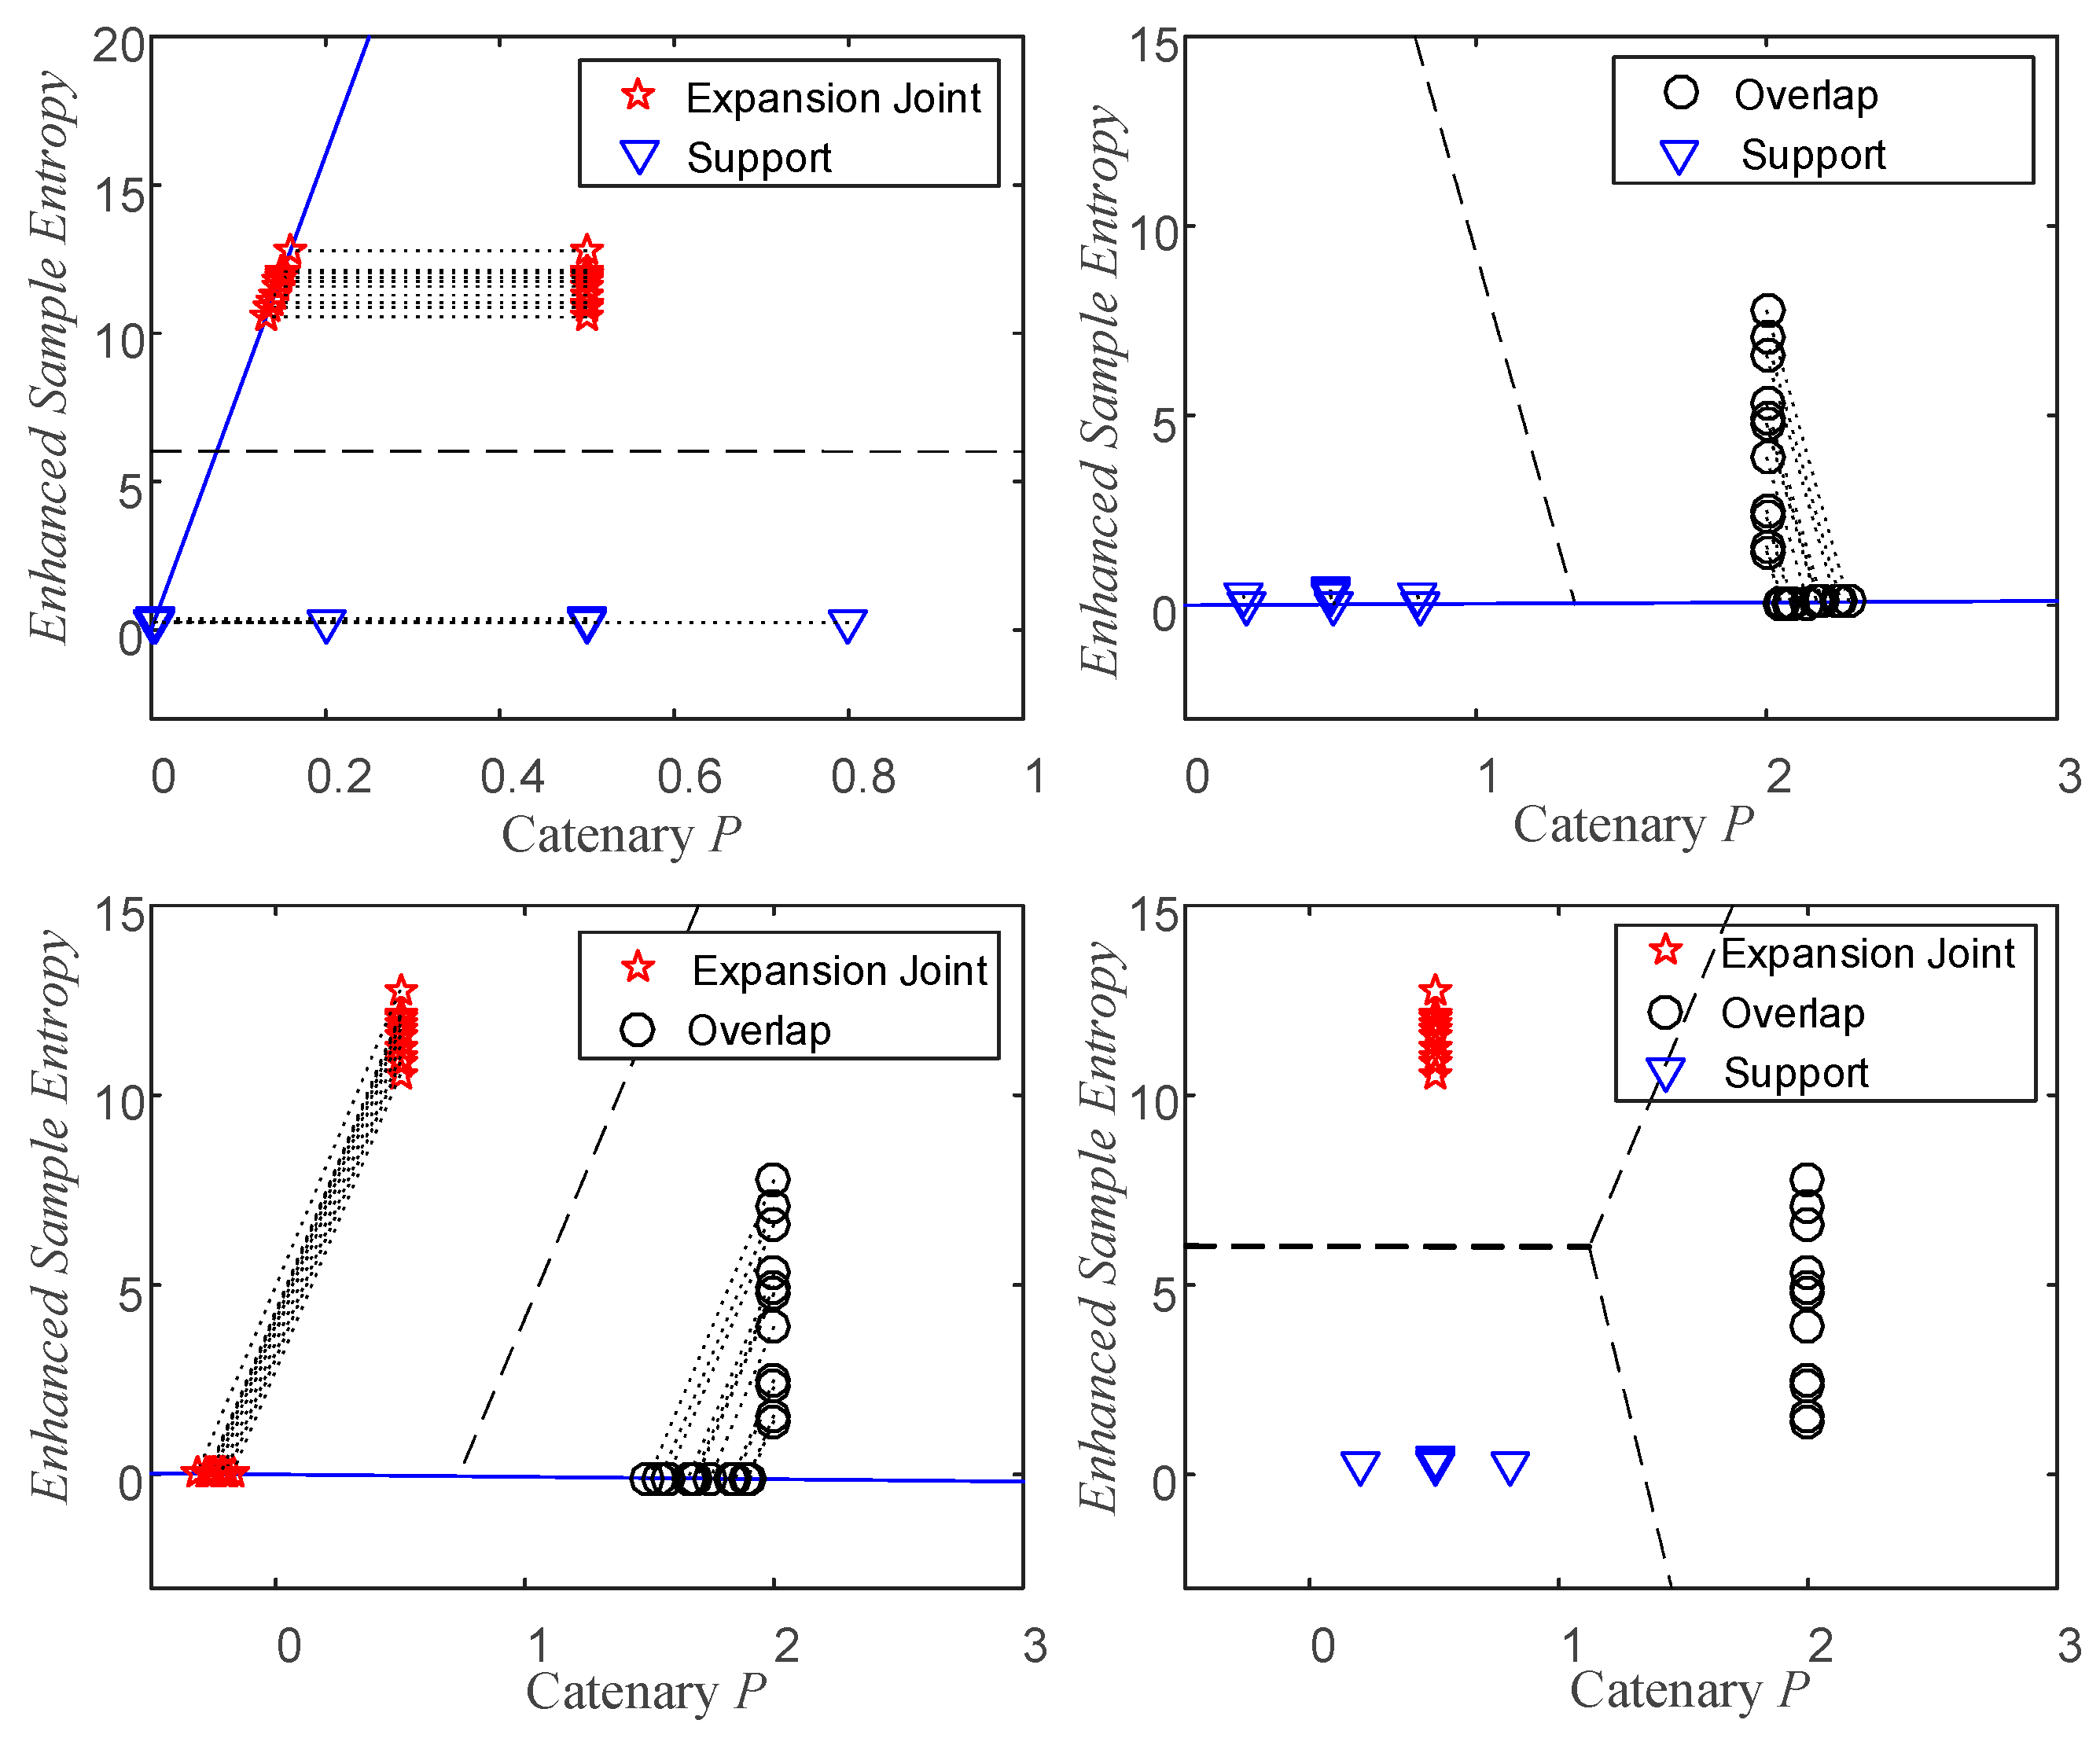
(2) The simulation results show that the feature extraction methods—catenary positioning coefficient and enhanced sample entropy—can extract effective fault features for subsequent fault separation and diagnosis.
(3) Two tests that were conducted on the same commercial metro line, separated by half a month, exhibited highly similar trends and amplitudes. The correlation coefficient analysis demonstrates a strong linear correlation between the strain signals obtained on the two dates. Furthermore, the Mann–Whitney U test and Kruskal–Wallis test confirm that the two datasets exhibit identical distributions (ID) and significant correlation. These findings validate the reliability and reproducibility of the experimental data.
(4) The fault detection results from two tests on different dates are the same, and the classification accuracy obtained by feature selection based on LDA is 100%. These demonstrate that the proposed monitoring system can effectively detect the main defects in a catenary system caused by expansion joint deformation, overlap misalignment, and support loosening.
(5) The results are also verified through manual inspection, indicating the high effectiveness of our proposed catenary defect detection and diagnosis method.


