Abstract
A thin-walled structure of high-strength aluminum alloy 2024 (AA2024) was fabricated using novel laser and cold metal transfer and pulse (CMT-P) arc hybrid additive manufacturing (LCAHAM) technology. The influence of the wire feeding speed, scanning speed, and laser power on the forming quality was systematically studied by the response surface methodology, probability statistical theory, and multi-objective optimization algorithm. The result showed that the forming accuracy was significantly more affected by the laser power than by the wire feeding speed and scanning speed. Specifically, there was an obvious correlation between the interaction of the laser power and wire feeding speed and the resulting formation accuracy of LCAHAM AA2024. Moreover, the laser power, wire feeding speed, and scanning speed all had noticeable effects on the spattering degree during the LCAHAM AA2024 process, with the influence of the laser power surpassing that of the other two factors. Importantly, these three factors demonstrated minimal mutual interaction on spattering. Furthermore, the scanning speed emerged as the most significant factor influencing porosity compared to the wire feeding speed and laser power. It was crucial to highlight that the combined effects of the wire feed speed and laser power played an obvious role in reducing porosity. Considering the forming accuracy, spattering degree, and porosity collectively, the recommended process parameters were as follows: a wire feeding speed ranging from 4.2 to 4.3 m/min, a scanning speed between 15 and 17 mm/s, and a laser power set at approximately 2000 W, where the forming accuracy was 84–85%, the spattering degree fell within 1.0–1.2%, and the porosity was 0.7–0.9%.
1. Introduction
High-strength aluminum alloys play an important role in the fabrication of structural components for aircraft, such as skins, wing beams, and wing ribs, owing to their advantages of low density, high strength, and good machinability [1,2]. The performance requirements of the aircraft materials are shown in Figure 1 [3]. The development of modern aviation industry towards large-scale, integrated, and lightweight aircraft structural parts demands a departure from traditional processing methods, such as casting and forging, due to their drawbacks of prolonged cycles and high costs [4,5,6,7,8]. Recognizing these limitations, additive manufacturing has emerged as a transformative approach overcoming traditional technology constraints [9,10,11]. Combining additive manufacturing with topology optimization enables the integration of materials, structures, processes and performance, with significant advantages for improving aerospace lightweighting, particularly in the lightweighting of redundant actuation systems for large aircraft [12].
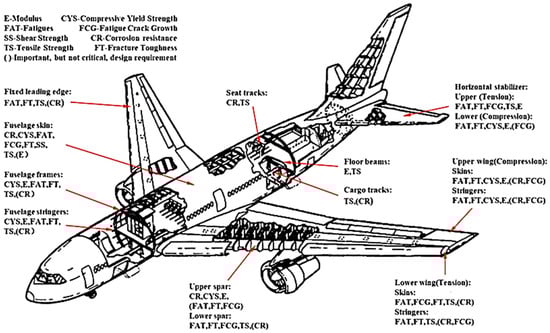
Figure 1.
Performance requirements of the aircraft materials.
The primary techniques for aluminum alloy additive manufacturing include laser additive manufacturing (LAM) and wire arc additive manufacturing (WAAM) [13,14,15]. LAM offers high forming accuracy but suffers from low production efficiency and excessive laser energy loss [16,17]. In contrast, WAAM exhibits high productivity but faces challenges such as poor forming accuracy and numerous defects [18,19,20]. Combining the advantages of both techniques, laser–arc hybrid additive manufacturing (LAHAM) integrates a laser and an electric arc. The plasma generated by the laser reduces the resistance of the arc channel, thereby increasing the utilization rate of the arc energy. Simultaneously, the plasma dilutes the arc acting on the surface of the molten pool, enhancing the absorption of the laser. Consequently, the LAHAM offers high forming efficiency and good forming quality [21,22,23,24]. CMT, a spatter-free process developed by Fronius based on metal inert gas (MIG) welding, was later integrated with pulsed MIG to create CMT-P, a hybrid transition alternating between short-circuit and pulsed transition [25]. The CMT-P process, applicable to various materials, including aluminum alloys, nickel-based alloys, and others, expands the adjustable range of heat input, allowing for precise control over the droplet transition behavior [26]. Therefore, LCAHAM has emerged as a favorable method for manufacturing aluminum alloy structural parts, holding significant potential for further exploration in the production of high-strength aluminum alloys.
Despite these advancements, the control of the forming quality remains a major challenge hindering the industrialization and large-scale production of metal additive manufacturing. In the actual production process of high-strength aluminum alloy additive manufacturing, issues like low dimensional accuracy and high defects, such as spatter and porosity, persist due to the immaturity of the additive process [27,28]. Improving the forming accuracy can effectively reduce machining allowance and improve efficiency. Reducing spatter is crucial to prevent defects that can significantly impact the additive part’s performance [29]. Additionally, porosity defects lead to stress concentration and induce corrosion, causing a decline in thin-walled parts’ performance [30]. Therefore, effectively controlling spatter, minimizing porosity defects, and enhancing formation precision are significant concerns for researchers in the additive manufacturing process.
In the LAHAM process of high-strength aluminum alloys, spatter behavior is more complex. Scholars have carried out extensive studies on the spatter characteristics formation mechanism, and the influence of process parameters. Wu et al. [31] and Zhang et al. [32] comprehensively investigated the spatter formation mechanism during the laser welding of aluminum alloys, identifying metal evaporation recoil pressure and shear stress from metallic vapor flow as primary factors. Ahmad et al. [33] studied spatter particle variation during selective laser melting by tracking the trajectories of these particles using Discrete Phase Mode. It was found that the inert gas flow affects the spatter particle trajectories. Zhang et al. [34] noted differences in the spatter quantity among CMT, pulsed MIG, and both of these hybrid welding processes. In addition, Zhang et al. [35] also indicated that the spatter during the laser–arc hybrid welding process was significantly less than that during the pure arc welding process. Han et al. [36] analyzed the spatter in a laser–pulsed MIG hybrid welding and laser–CMT hybrid welding process, finding less or no spattering during laser–CMT hybrid welding.
Porosity defects in the LAHAM process are generated due to the unstable keyhole tip and rapid solidification rate. Scholars have studied porosity in aluminum alloy additive manufacturing parts, demonstrating effective reduction through optimizing additive manufacturing process parameters. Derekar et al. [37] explored two varieties of WAAM, pulsed MIG and CMT, and found that the pulsed MIG samples showed more pores and a higher volume fraction of porosity than samples manufactured using the CMT. Cong et al. [38] studied the influence of various CMT modes on porosity in Al-6.3%Cu alloy, discovering that pulsed current in CMT-P increased porosity compared to conventional CMT. Wang et al. [39] found that pulse frequency and arc current had a significant impact on porosity. Liu et al. [40] used LAHAM for a thin-wall aluminum alloy, observing a decrease in porosity defects with increased laser power. Meanwhile, Zhang et al. [41] employed response surface methodology (RSM) to optimize CMT-P arc additive manufacturing aluminum alloy, revealing wire feeding speed’s significant impact on porosity and surface roughness.
To enhance the additive manufacturing quality and mitigate issues such as spatter and porosity defects, an LCAHAM technology was introduced. It is noteworthy that process parameters play a pivotal role in enhancing the formation quality of high-strength aluminum alloys in additive manufacturing. Although there are limited studies on optimizing the LAHAM process for aluminum alloys, research on LCAHAM remains scarce. Additionally, the interaction effects between LCAHAM process parameters and the forming quality of aluminum alloys are not yet clearly understood. Therefore, this study seeks to establish a correlation regulation between the LCAHAM process parameters (including wire feeding speed, scanning speed, and laser power) and the spattering degree, forming accuracy, and porosity using the RSM.
2. Experimental Procedures
Additive Manufacturing and Forming Quality Analysis Methods
An 8 mm thick plate of 2A12-T351 high-strength aluminum alloy was chosen as the substrate. The deposited wire was 2024 high-strength aluminum alloy (AA2024) with a diameter of 1.2 mm. The chemical composition of both the substrate and deposited wire was similar, as listed in Table 1. Before additive manufacturing, the substrate surface was carefully ground to eliminate the oxide film, followed by cleaning with alcohol and acetone to remove oil and impurities. A thin-wall structure of the AA2024 was manufactured by the LAHAM system. The LAHAM system consists of an IPG YLS-10000 laser, a Fronius Advanced 4000 CMT power source, a KR60 HA robot, and cooling systems, as depicted in Figure 2. The system adopted an arc-side axis compound configuration, where the angle between the laser beam and arc touch was set at 30°, and the arc touch angle with respect to the horizontal was 65°. The shielding gas was 99.99% Ar with a flow rate of 15 L/min. The CMT welder parameter regulation mode operates as a unified regulation mode, meaning that the arc current and arc voltage change in accordance with the wire feeding speed. And the dry elongation of the welding wire is 15 mm. The fiber has a core diameter of 100 µm. And the offset distance between the laser focal spot and hot wire tip is 2 mm.

Table 1.
Chemical composition of substrate and deposited wire (wt.%).
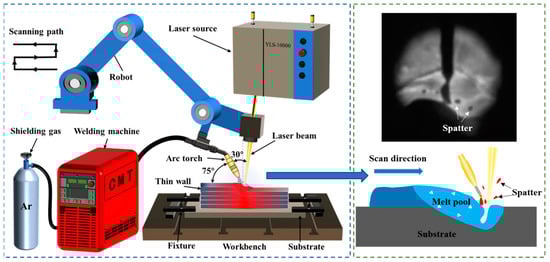
Figure 2.
Schematic of LCAHAM process.
The wire feeding speed, scanning speed, and laser power were the three most key process parameters to effect forming accuracy, spattering degree, and porosity of LCAHAM AA2024. A 3-factor and 5-level LCAHAM experimental scheme was designed by the center composite design (CCD) method of RSM. Every factor was set at five levels: −α, −1, 0, +1, +α, as illustrated in Figure 3. The red circle symbolizes the 0 level point, while the yellow circle represents the ±1 level point. The pentagram, on the other hand, signifies the ±α level point. Based on previous explorations of experimental parameters and with reference to the porosity rate, a central combination experiment was conducted with a wire feed speed of 4.6 m/min, a scanning speed of 16 mm/s, and a laser power of 2500 W as the central values, as listed in Table 2. A quadratic polynomial Equation (1) was used to construct the response surface model.
where Y was the response value; xi was the input factor; b0 was the constant term coefficient; bi was the primary term coefficient; bij was the cross term coefficient; and bii is the quadratic term coefficient. The optimal process parameters were determined using probability statistical methods such as ANOVA and multi-objective optimization algorithm.
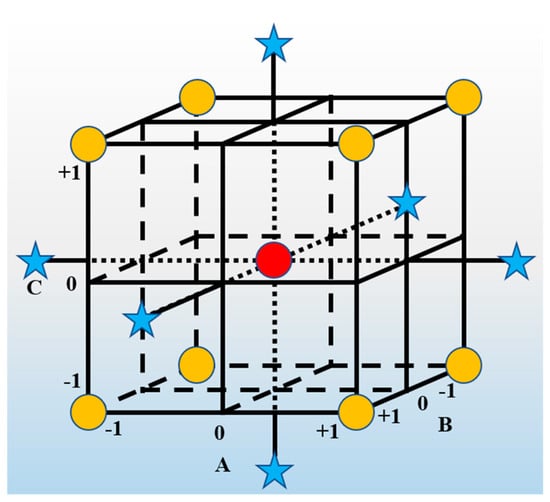
Figure 3.
Schematic of CCD.
Table 2.
A 3-factor and 5-level LCAHAM experimental scheme.
To evaluate the forming accuracy, five cross-sectional samples were prepared by cutting the LCAHAM AA2024 thin-wall structure at horizontally equidistant intervals using a wire-cutting machine (refer to Figure 4a). These samples underwent grinding with abrasive papers of various grits (200, 400, 600, 800, 1000, 1200, 1500, and 2000) and were mechanically polished to achieve a mirror finish. Afterward, the sample surfaces were cleaned with alcohol in an ultrasonic cleaning machine. And then, all samples were observed with an optical microscope (Olympus GX71, Olympus, Japan) at 50× magnification and stitched together for a comprehensive surface image. The definition of forming accuracy (F) is shown in Figure 4b and Equation (2).
where l0 is the distance between two parallel tangent lines; li (i = 1, 2, …, 10) is the distance between ten equally spaced horizontal lines along the thickness direction. The average forming accuracy of five samples served as the final result.
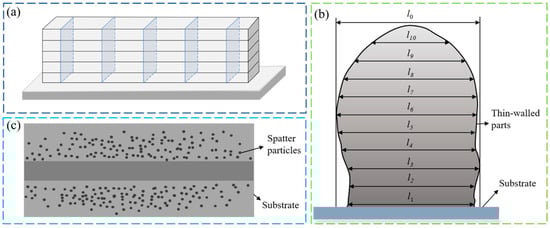
Figure 4.
Schematic diagram for analyzing forming quality of additive manufacturing AA2024. (a) Cross-sectional specimen sampling location; (b) statistical diagram of forming accuracy; (c) schematic of spatter particles on a substrate.
The spattering degree (D) in the AA2024 LCAHAM process was semi-quantitatively assessed by the ratio of spatter particle area (A1) on the substrate to the entire statistical area (A), as demonstrated in Figure 4c and Equation (3). The average of five samples served as the final result for spattering degree. It was crucial to emphasize that, according to previous validation experiments, the majority of spatter particles during the additive manufacturing process fell onto the substrate surface, with only a minimal amount falling outside the substrate.
The porosity (P) was defined as a ratio of the pore area (S1) on the cross-sectional sample surface to the entire statistical area (S), following the formula in Equation (4). The average of five samples was the final porosity. The porosity was identified by the Image-Pro-Plus 6.0, including grayness transformation, binarization, pore extraction, and subsequent calculation.
3. Results and Discussion
The forming quality results for LCAHAM AA2024 with various process parameters are presented in Table 3. Figure 5 and Figure 6 illustrate the distributions of the spatter particles and pores in LCAHAM AA2024, respectively. As can be seen from Figure 6, there are no crack defects in the thin-walled parts.
Table 3.
Forming quality results for LCAHAM AA2024 with various process parameters.
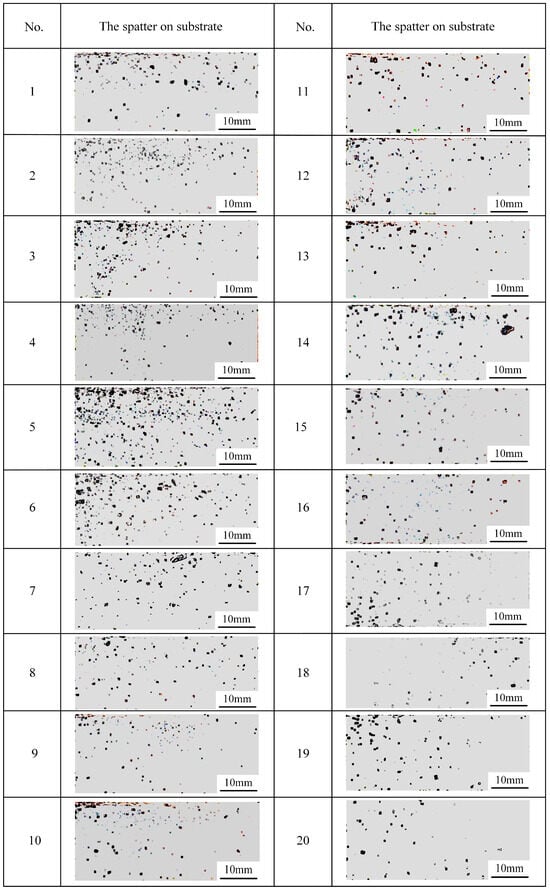
Figure 5.
Image of the spatter on substrate.
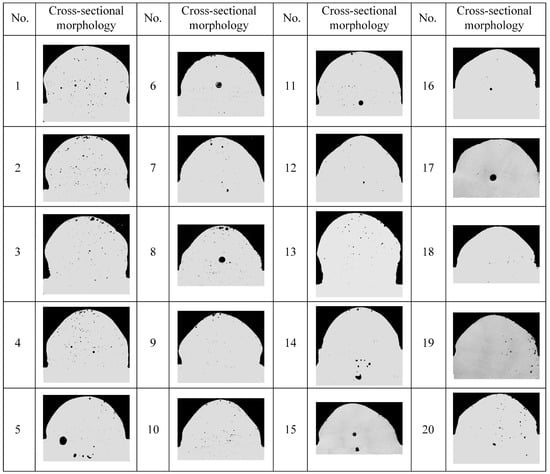
Figure 6.
The cross-sectional morphology of thin-walled parts.
3.1. Effect of Process Parameters on Forming Accuracy
3.1.1. Regression Model for Forming Accuracy and Process Parameters
In the process of additive manufacturing, it is necessary to ensure that thin-walled parts have a high forming accuracy. To examine the impact of the process parameters on the forming accuracy, a quadratic regression model was fitted to the experimental results of the forming accuracy from Table 3 using Design-Expert 12. The regression equation obtained is represented as Equation (5).
where F is the forming accuracy, A is the wire feeding speed, B is the scanning speed, and C is the laser power.
An ANOVA was performed on the quadratic regression model of the forming accuracy developed above, and the results of the analysis are shown in Table 4. In an ANOVA, the F-value indicates the significance of the entire fitted equation, with a larger F-value indicating a more significant equation and a better fit. The p-value indicates the probability that the observed outcome is randomly occurring at a given confidence level. Meanwhile, p-values less than 0.0500 indicate the model terms are significant. And p-values greater than 0.1000 indicate the model terms are not significant. The Model F-value of 21.01 implied the model was significant. The associated p-value being less than 0.0001 suggested that there was only a 0.01% chance that an F-value of this magnitude could occur due to random noise. This provided strong evidence that the model’s predictive ability was not merely a result of chance, further supporting its significance in explaining the relationship between the input variables and the forming accuracy. Therefore, these statistical indicators reinforced the reliability and validity of the quadratic regression model in predicting the forming accuracy under different process conditions. In addition, the Lack of Fit F-value of 0.4936 implied the Lack of Fit was not significant relative to the pure error. The p-value of the Lack of Fit was 0.7716, and there was a 77.16% chance that a Lack of Fit F-value this large could occur due to noise. The ANOVA results showed that the R2 was 0.9498, indicating a good fit of the model. In addition, the ANOVA results showed that the ratio was 14.275, indicating an adequate signal, so this model could be used to navigate the design space. Meanwhile, as shown in Figure 7, the experimental values of the forming accuracy closely matched the values of the forming accuracy predicted by the quadratic regression model. Based on the information provided, it could be concluded that the quadratic regression model developed by the RSM for assessing the forming accuracy was reliable and demonstrates a high level of accuracy. This model was effective in predicting the forming accuracy of the thin-walled parts under various process conditions. Additionally, the Mean Square and the F-value indicated that the laser power was the most important factor influencing the forming accuracy.
Table 4.
ANOVA for quadratic model of forming accuracy.
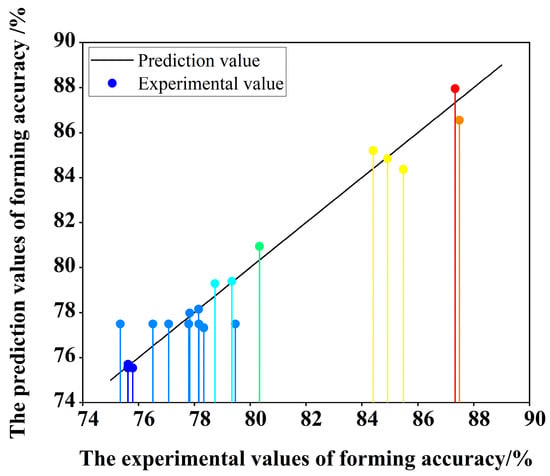
Figure 7.
Comparison of experimental values of forming accuracy with predicted values.
3.1.2. Effect of Wire Feeding Speed on Forming Accuracy
The wire feeding speed had a significant impact on the forming accuracy of the thin-walled parts. As shown in Figure 8a, the forming accuracy decreased as the wire feeding speed increased from 4.2 m/min to 5.0 m/min. The heat input increased as the wire feed speed increased. At the same time, the increase in the wire feed speed led to an increase in the amount of metal deposited per unit of time. This caused a greater amount of molten metal to flow to the sides, ultimately leading to a gradual decrease in the forming accuracy.
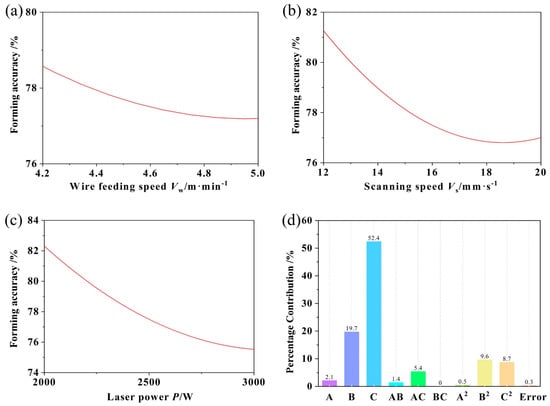
Figure 8.
Influence of process parameters on forming accuracy. (a) Wire feeding speed, (b) scanning speed, (c) laser power; (d) percentage contribution for forming accuracy.
3.1.3. Effect of Scanning Speed on Forming Accuracy
The scanning speed also exerted a notable influence on the forming accuracy of the thin-walled parts. As shown in Figure 8b, the forming accuracy exhibited a decline followed by an increase with the escalation of the wire feeding speed from 12 mm/s to 20 mm/s. As the scanning speed increased, the heat input decreased, resulting in a reduced remelting effect between the layers. This decrease in the remelting effect is one of the factors contributing to the reduced forming accuracy.
3.1.4. Effect of Laser Power on Forming Accuracy
Figure 8d emphasized the laser power as the most influential factor affecting the forming accuracy. As shown in Figure 8c, the forming accuracy decreased as the laser power increased from 2000 W to 3000 W. The laser’s stirring effect on the molten pool increased the fluidity, causing molten metal to flow to both sides and resulting in decreased dimensional accuracy.
3.1.5. Mutual Interaction between Process Parameters on Forming Accuracy
The influence of each factor on the forming accuracy was visually represented using two-dimensional lines, two-dimensional contours, and three-dimensional surface plots. As shown in Figure 9a–c, it was apparent that the impact of the scanning speed on the forming accuracy remained relatively consistent despite variations in the wire feeding speed. This suggested a relatively minor influence of the interaction between the wire feeding speed and scanning speed on the forming accuracy. As shown in Figure 10a–c, the impact of the laser power on the forming accuracy varied significantly with a change in the wire feeding speed. This observation indicated a notable interaction between the wire feeding speed and laser power in relation to the forming accuracy. The laser power would affect the heat input. The higher the laser power, the greater the heat input, resulting in a slower solidification of the weld pool. Therefore, adjusting the laser power would change the solidification rate and flow state of the molten pool, thereby affecting the shape and quality of the molten pool. When the laser power was low, the Marangoni effect inside the molten pool was weak, causing the laser-induced keyhole to be shallow. This led to a higher level of forming quality. Conversely, when the laser power was high, the Marangoni effect inside the molten pool was strong, resulting in an accelerated flow of the molten pool. As a result, the laser-induced keyhole became deeper, leading to a relatively lower level of forming quality. Therefore, regardless of the wire feeding speed, the forming accuracy decreased with increased laser power. Modifying the wire feeding speed influenced the supply and melting speed of the welding wire, affecting the shape and quality of the weld pool. The excessive metal melting and a wider weld pool resulted from a too-fast wire feeding speed, while the too-slow wire feeding speed led to a narrower weld pool. When the laser power was low, increasing the wire feeding speed decreased the forming accuracy in the thin-walled parts. However, when the laser power was high, increasing the wire feeding speed improved the forming accuracy in the thin-walled parts. Therefore, it could be observed that in terms of the wire feeding speed, the laser power had a greater impact on the forming accuracy of the thin-walled parts. Additionally, it was evident that there was a significant interaction between the wire feeding speed and laser power in relation to the forming accuracy of the thin-walled parts. As shown in Figure 11a–c, it was evident that the impact of the laser power on the forming accuracy remained consistent despite variations in the scanning speed. Additionally, the response surface displayed a smooth transition, indicating that there was no significant interaction between the influence of the scanning speed and laser power on the forming accuracy.
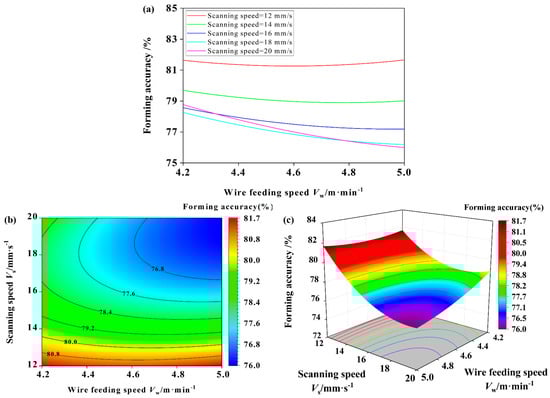
Figure 9.
Mutual interaction between process parameters and forming accuracy. (a) Two-dimensional lines of mutual interaction between wire feeding speed and scanning speed on forming accuracy; (b) Two-dimensional contours of mutual interaction between wire feeding speed and scanning speed on forming accuracy; (c) Three-dimensional surface plots of mutual interaction between wire feeding speed and scanning speed on forming accuracy.
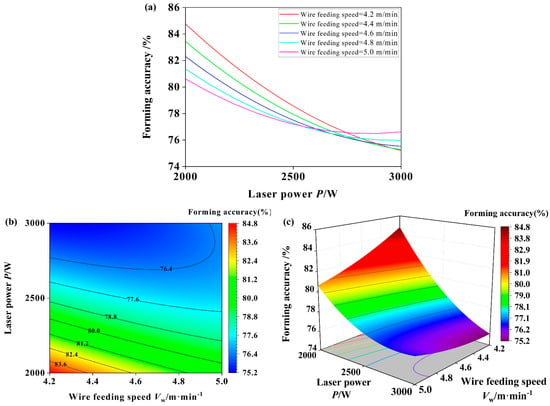
Figure 10.
Mutual interaction between process parameters and forming accuracy. (a) Two-dimensional lines of mutual interaction between wire feeding speed and laser power on forming accuracy; (b) Two-dimensional contours of mutual interaction between wire feeding speed and laser power on forming accuracy; (c) Three-dimensional surface plots of mutual interaction between wire feeding speed and laser power on forming accuracy.
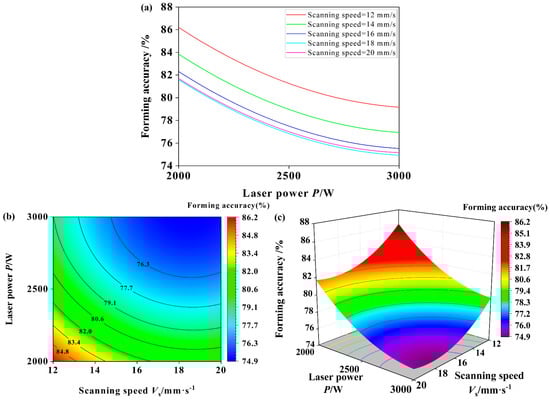
Figure 11.
Mutual interaction between process parameters and forming accuracy. (a) Two-dimensional lines of mutual interaction between scanning speed and laser power on forming accuracy; (b) Two-dimensional contours of mutual interaction between wire scanning speed laser power on forming accuracy; (c) Three-dimensional surface plots of mutual interaction between scanning speed and laser power on forming accuracy.
3.2. Effect of Process Parameters on Spattering Degree
3.2.1. Regression Model for Spattering Degree and Process Parameters
Various factors contribute to spattering in the LCAHAM process. First, in the process of LCAHAM, a complete CMT-P cycle consists of two phases: the pulse phase and the CMT phase. During the pulse phase, the droplet transition behavior exhibited a typical shot-drop transition mode and was in the form of a stable one droplet per pulse. This was caused by the higher arc current, resulting in a larger electromagnetic contraction force and a smaller surface tension of the droplet. Consequently, the droplets easily fell into the molten pool, leading to potential spattering issues. During the CMT stage, the droplet transition exhibited a characteristic short-circuit transition mode. In this mode, the droplet transition remained stable, resulting in less spatter [42]. Secondly, the laser’s effect caused the evaporation of the low-melting-point elements like Mg and Zn in the 2024 aluminum alloy, resulting in the formation of metal vapor. This vapor exerted an upward lifting force on the droplet, leading to the occurrence of spattering. Simultaneously, the combination of the laser and arc created a synergistic effect, resulting in recoil pressure and a powerful Marangoni effect within the molten pool. This, in turn, destabilized the molten pool, causing some of the liquid metal to escape and form spatter.
To investigate the impact of the process parameters on the spatter in the additive manufacturing processes, a quadratic regression model was employed to analyze the experimental results of the spattering degree during the additive manufacturing process, as presented in Table 3. The Design-Expert 12 was utilized for this analysis, resulting in the derivation of the regression equation, as shown in Equation (6).
where D is the spattering degree, A is the wire feeding speed, B is the scanning speed, and C is the laser power.
The ANOVA was performed on the quadratic regression model of the spattering degree, and the results of the analysis are shown in Table 5. The Model F-value of 4.87 suggested that the regression model was statistically significant. The associated p-value of 0.0105 indicated that there was only a 1.05% chance that an F-value of this magnitude could occur due to random noise. This provided evidence to support the significance of the model in explaining the relationship between the input variables and the spattering degree. Therefore, based on these statistical indicators, it could be concluded that the model had a significant impact on the spattering degree and was not merely a result of random chance. In addition, the Lack of Fit F-value of 0.0295 implied the Lack of Fit was not significant relative to the pure error. The p-value of the Lack of Fit was 0.9993, and there was a 99.93% chance that a Lack of Fit F-value this large could occur due to noise. And the ANOVA results showed that R2 was 0.8143, indicating a good fit of the model. In addition, the ANOVA results showed that the ratio was 8.2691, indicating an adequate signal. Meanwhile, as shown in Figure 12, the experimental values of the spattering degree closely matched the values of the spattering degree predicted by the quadratic regression model. Therefore, the quadratic regression model of the spattering degree obtained by the RSM was reliable with a high degree of fit and could predict the spattering degree under different process conditions. Meanwhile, the Mean Square and the F-value showed that the laser power was the most important factor affecting the spattering degree.
Table 5.
ANOVA for quadratic model of spattering degree.
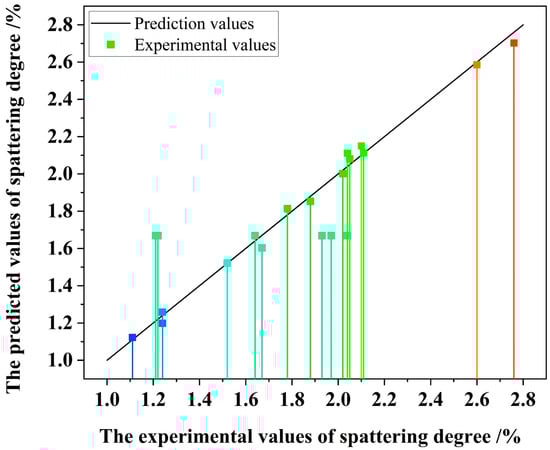
Figure 12.
Comparison of experimental values of spattering degree with predicted values.
3.2.2. Effect of Wire Feeding Speed on Spattering Degree
The wire feeding speed had a significant impact on the spattering degree. As shown in Figure 13a, the spattering degree escalated as the wire feeding speed increased from 4.2 m/min to 5.0 m/min. As the wire feeding speed increased, the heat at the tip of the wire reduced the surface tension of the droplets. Consequently, the droplets were formed within the liquid region at the tip of the wire and swiftly propelled towards the molten pool. There was a short-circuit explosion that occurred when the droplets came into contact with the molten pool. This resulted in a significant amount of spatter being generated due to the impact of the liquid bridge during the blast. In addition, the high heat input resulted in a heightened Marangoni effect within the molten pool. This, in turn, caused the vigorous convective movement of the molten metal inside the pool, ultimately leading to an increased amount of spatter. Moreover, adjusting the wire feeding speed directly impacted the stability of the arc. As the wire feeding speed increased, the arc would gradually shorten, resulting in the stronger induction effect of the laser on the arc. Therefore, the interference between the laser and the arc was intensified as the wire feeding speed increased, resulting in a heightened propensity for spatter formation.
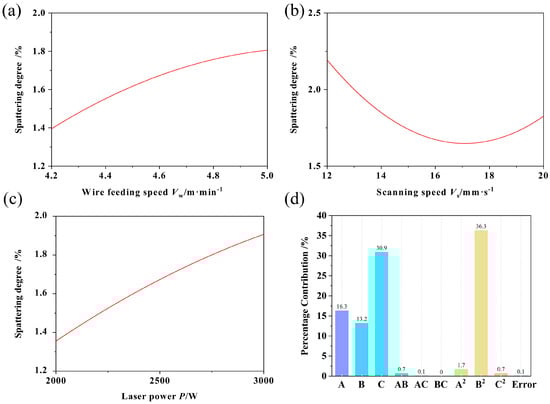
Figure 13.
Influence of process parameters on spattering degree. (a) Wire feeding speed, (b) scanning speed, (c) laser power, (d) percentage contribution for spattering degree.
3.2.3. Effect of Scanning Speed on Spattering Degree
The scanning speed significantly impacted the spattering degree. As shown in Figure 13b, the spattering degree decreased and then increased as the scanning speed increased from 12 mm/s to 20 mm/s. As the scanning speed increased, the time during which the heat source remained stagnant decreased, resulting in a reduction in the time required for energy input. This led to a more stable internal melt pool and a gradual decrease in spatter. As the scanning speed was increased, the stability of the vapor plume decreased, leading to more spatter. At a scanning speed of around 17 mm/s, the vapor plume was tilted but stable, resulting in the least spatter. However, any deviation from this speed compromised the plume’s stability, causing more intense spatter.
3.2.4. Effect of Laser Power on Spattering Degree
According to the ANOVA in Table 5, it was evident that the laser power was the most influential factor when it came to the spattering degree. In the LCAHAM process, the laser power directly affected the energy density of the laser. As the laser power increased, so did the energy density. The high energy density of the laser resulted in the formation of a significant amount of plasma and metal vapors above the keyhole. These substances interacted with the arc plasma and altered the force state of the droplets, leading to changes in the droplet behavior and the degree of spattering. Therefore, the spattering degree varied with different laser powers. As depicted in Figure 13c, as the laser power increased from 2000 W to 3000 W, the spattering degree gradually became more severe. Initially, increasing the laser power led to a higher temperature gradient within the molten pool, which intensified the Marangoni effect. This heightened effect caused more vigorous convective behavior, ultimately resulting in increased spattering. Additionally, the 2024 aluminum alloy contained elements like Mg and Zn, which had relatively low melting points. With an increase in the laser power, the evaporation of these elements accelerated, leading to the generation of a more potent metal vapor. This vapor exerted an upward lifting force on the droplets, resulting in a significant increase in droplet spattering. As the laser power increased, the interaction between the laser and the arc became more prominent. This led to a change in the mode of transition for the molten droplets and an escalation in the severity of spattering.
3.2.5. Mutual Interaction between Process Parameters on Spattering Degree
The influence of each factor on the spattering degree was visually represented using two-dimensional lines, two-dimensional contours, and three-dimensional surface plots. As shown in Figure 14a–c, it was evident that the changes in the wire feeding speed did not have a significant impact on the relationship between the scanning speed and spattering degree. As shown in Figure 15a–c, the effect of the wire feeding speed on the spattering degree remained consistent regardless of variations in the laser power. This suggested that there was no significant interaction between the wire feeding speed and laser power with respect to the spattering degree. As shown in Figure 16a–c, the changes in the scanning speed had a minimal impact on the relationship between the laser power and spattering degree. This implied that the interaction between the scanning speed and laser power on the spattering degree was relatively insignificant.
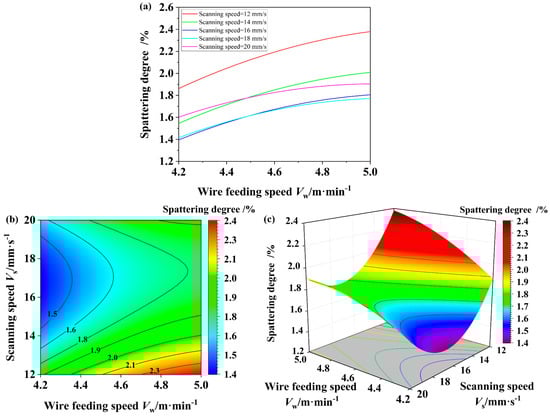
Figure 14.
Mutual interaction between process parameters on spattering degree. (a) Two-dimensional lines of mutual interaction between wire feeding speed and scanning speed on spattering degree; (b) Two-dimensional contours of mutual interaction between wire feeding speed and scanning speed on spattering degree; (c) Three-dimensional surface plots of mutual interaction between wire feeding speed and scanning speed on spattering degree.
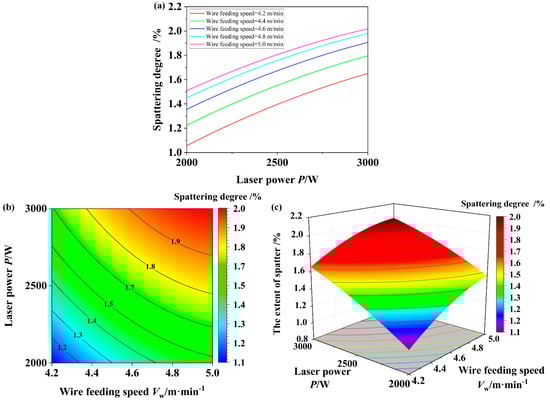
Figure 15.
Mutual interaction between process parameters on spattering degree. (a) Two-dimensional lines of mutual interaction between wire feeding speed and laser power on spattering degree; (b) Two-dimensional contours of mutual interaction between wire feeding speed and laser power on spattering degree; (c) Three-dimensional surface plots of mutual interaction between wire feeding speed and laser power on spattering degree.
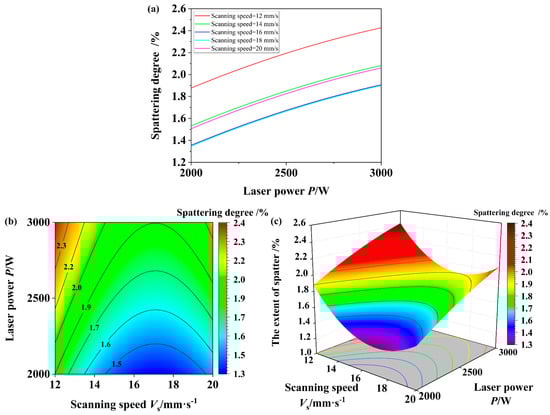
Figure 16.
Mutual interaction between process parameters on spattering degree. (a) Two-dimensional lines of mutual interaction between scanning speed and laser power on spattering degree; (b) Two-dimensional contours of mutual interaction between scanning speed and laser power on spattering degree; (c) Three-dimensional surface plots of mutual interaction between scanning speed and laser power on spattering degree.
3.3. Effect of Process Parameters on Porosity
3.3.1. Regression Model for Porosity and Process Parameters
The porosity defects were one of the most important factors affecting the forming quality of the high-strength aluminum alloy thin-walled parts. In order to investigate the influence of the process parameters on the porosity of the thin-walled parts, a quadratic regression model was fitted to the experimental results of the porosity from Table 3 using Design-Expert 12. The regression equation was obtained as shown in Equation (7).
where P is the porosity, A is the wire feeding speed, B is the scanning speed, and C is the laser power.
An ANOVA was performed on the quadratic regression model of porosity developed above, and the results of the analysis are shown in Table 6. The Model F-value of 21.37 implied the model was significant. The associated p-value being less than 0.0001 suggested that there was only a 0.01% chance that an F-value of this magnitude could occur due to random noise. This provided strong evidence that the model’s predictive ability was not merely a result of chance, further supporting its significance in explaining the relationship between the input variables and the porosity. Therefore, these statistical indicators reinforced the reliability and validity of the quadratic regression model in predicting porosity under different process conditions. In addition, the Lack of Fit F-value of 0.6605 implied the Lack of Fit was not significant relative to the pure error. The p-value of the Lack of Fit was 0.6699, and there was a 66.99% chance that a Lack of Fit F-value this large could occur due to noise. And the ANOVA results showed that the R2 was 0.9506, indicating a good fit of the model. In addition, the ANOVA results showed that the ratio was 14.5924, indicating an adequate signal, so this model could be used to navigate the design space. Meanwhile, as shown in Figure 17, the experimental values of the porosity closely matched the values of the porosity predicted by the quadratic regression model. Therefore, the quadratic regression model for the porosity derived from the RSM was highly reliable and accurately predicted the porosity of the thin-walled parts across various process conditions. The model exhibited a strong level of fit, ensuring its effectiveness in practical applications. Meanwhile, the Mean Square and the F-value showed that the scanning speed was the most important factor affecting the porosity.
Table 6.
ANOVA for quadratic model of porosity.
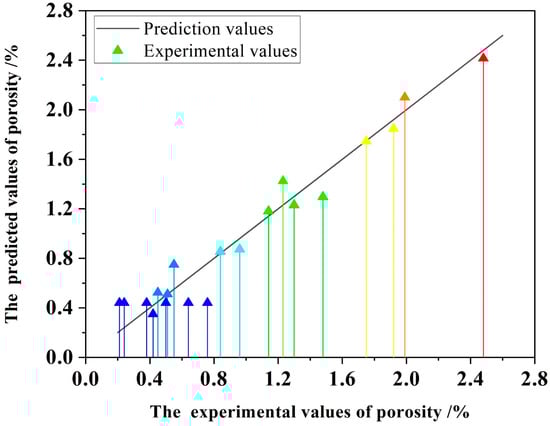
Figure 17.
Comparison of experimental values of porosity with predicted values.
3.3.2. Effect of Wire Feeding Speed on Porosity
The wire feeding speed had a significant impact on the porosity of the thin-walled parts. As shown in Figure 18a, the porosity decreased as the wire feeding speed increased from 4.2 m/min to 5.0 m/min. With an increase in wire feeding speed, the amount of molten metal per unit of time also increased, leading to a larger melt pool. Consequently, the contact area between the molten pool and the air expanded, providing more surface area for bubbles to escape upwards. At the same time, the higher wire feeding speed resulted in a gradual rise in the heat input, causing the melt pool to solidify more slowly. This extended solidification time allowed for the more effective release and escape of bubbles. Additionally, as the wire feeding speed increased, the arc current also rose, intensifying the pulsating current on the molten pool and enhancing the stirring effect. This further facilitated the acceleration of bubble uplift and escape. Therefore, as the wire feeding speed increased from 4.2 m/min to 5.0 m/min, the gradual disappearance of bubbles became more noticeable. Simultaneously, the number of pores per unit area gradually decreased, resulting in a reduction in the porosity.
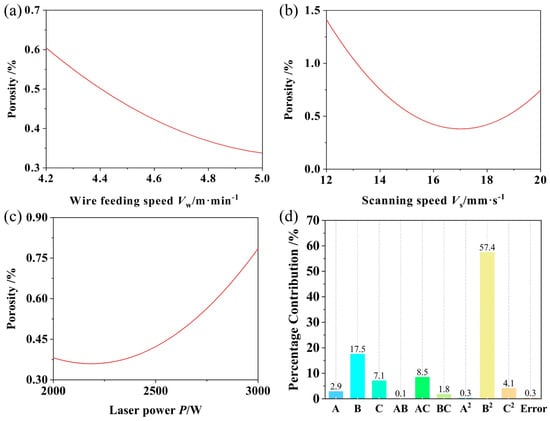
Figure 18.
Influence of process parameters on porosity. (a) Wire feeding speed, (b) scanning speed, (c) laser power; (d) percentage contribution for porosity.
3.3.3. Effect of Scanning Speed on Porosity
As shown in Figure 18d, the scanning speed was the most important factor affecting the porosity. As shown in Figure 18b, the porosity initially decreased and then increased as the scanning speed increased from 12 mm/s to 20 mm/s. When the scanning speed rose from 8 mm/s to 16 mm/s, there was a decrease in the heat input. Consequently, less material was deposited per unit area, resulting in a reduction in the size of the melt pool and a shorter path for bubbles to rise. During this period, the speed at which bubbles escaped surpassed the rate at which the melt pool solidified. As a result, the dominant factor was the escape of the bubbles, leading to a gradual decrease in the porosity within this range. However, when the scanning speed increased from 16 mm/s to 20 mm/s, the high scanning speed resulted in insufficient heat input, causing the solidification rate of the melt pool to accelerate. During this period, the velocity at which the bubbles escaped was lower than the solidification rate of the molten pool. Consequently, the majority of the bubbles were unable to timely escape the pool and remained within it, resulting in the formation of porosity defects. Consequently, the porosity gradually increased within this range.
3.3.4. Effect of Laser Power on Porosity
As shown in Figure 18d, the porosity of the thin-walled parts was significantly influenced by the laser power. The size of the melt pool and the rate at which it cooled were altered due to variations in the laser power, resulting in a competitive mechanism between nucleation, growth, upwelling, and bubble escape within the melt pool. As shown in Figure 18c, the porosity decreased and then increased with the laser power increased from 2000 W to 3000 W. When the laser power was approximately 2000 W, the heat input increased, resulting in a longer solidification time for the molten pool. Consequently, the uplift and escape of bubbles became dominant. Moreover, the high energy density of the laser caused a stirring effect on the molten pool, further facilitating the uplift and escape of the bubbles. As a result, the porosity decreased with an increase in the laser power around 2000 W. However, as the laser power continued to increase, the molten pool experienced what is known as the keyhole effect. This phenomenon occurred due to the laser’s high energy density selectively evaporating the low-melting-point elements, such as Mg and Zn, present in the 2024 aluminum alloy. The evaporation of these elements generated metal vapors, which exerted a downward recoil pressure on the melt pool. Consequently, large uneven keyhole defects formed at the bottom of the melt pool. The severity of the keyhole effect increased with a higher laser power, and these defects further contributed to the porosity of the thin-walled parts. Therefore, as the laser power increased, the porosity gradually increased.
3.3.5. Mutual Interaction between Process Parameters on Porosity
The influence of each factor on the porosity was visually represented using 2D lines, 2D contours, and 3D surface plots. As shown in Figure 19a–c, it was evident that the porosity remained relatively unaffected by changes in the wire feeding speed, regardless of the scanning speed. The response surface displayed a smooth transition, indicating that there was no significant interaction between the effects of the wire feeding speed and scanning speed on the porosity. As shown in Figure 20a–c, there was a noticeable alteration in the impact of the laser power on the porosity with varying wire feeding speeds. This suggests a notable interaction between the wire feeding speed and laser power in relation to the porosity. When the wire feeding speed was low, the porosity initially decreased and then increased as the laser power increased. This was mainly due to the low arc heat input at low wire feeding speeds, causing the molten pool to cool and solidify rapidly. Consequently, the trapped bubbles within the molten pool did not have enough time to rise and escape, leading to the formation of pores. As the laser power increased, the heat input also increased, slowing down the cooling of the molten pool. This extended cooling time allowed the bubbles to rise and escape, effectively reducing the porosity. However, when the laser power reached a specific threshold, a strong keyhole phenomenon occurred at the bottom of the weld pool, resulting in uneven keyholes and ultimately increasing the porosity. Therefore, when the wire feeding speed was low, the porosity initially decreased and then increased as the laser power increased. On the other hand, as the wire feeding speed increased, the porosity gradually decreased. This was primarily because a faster wire feeding speed led to a higher heat input, slowing down the solidification process of the weld pool. This extended solidification time allowed for more opportunity for gas bubbles to rise and escape. Additionally, the pulsing arc actively agitated the weld pool, further facilitating the upward movement of the gas bubbles. Consequently, as the wire feeding speed increased, the porosity gradually decreased. However, once the wire feeding speed reached a specific threshold, the porosity began to increase alongside the laser power. At this point, the increased laser power led to a more pronounced keyhole effect, causing uneven keyholes at the bottom of the weld pool. This deepened the weld pool and further lengthened the path for gas bubbles to rise and escape, resulting in an increase in the porosity. Therefore, when the feeding speed reached a certain range, the porosity no longer showed a trend of decreasing and then increasing with the increase in the laser power, but showed a trend of gradually increasing. As shown in Figure 21a–c, the influence of the laser power on the porosity exhibited less variation with the changing scanning speed. This suggested that the interaction between the scanning speed and laser power on the porosity was relatively insignificant.
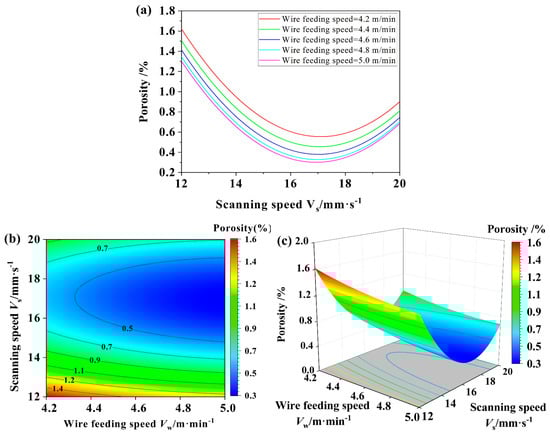
Figure 19.
Mutual interaction between process parameters on porosity. (a) Two-dimensional lines of mutual interaction between wire feeding speed and scanning speed on porosity; (b) Two-dimensional contours of mutual interaction between wire feeding speed and scanning speed on porosity; (c) Three-dimensional surface plots of mutual interaction between wire feeding speed and scanning speed on porosity.
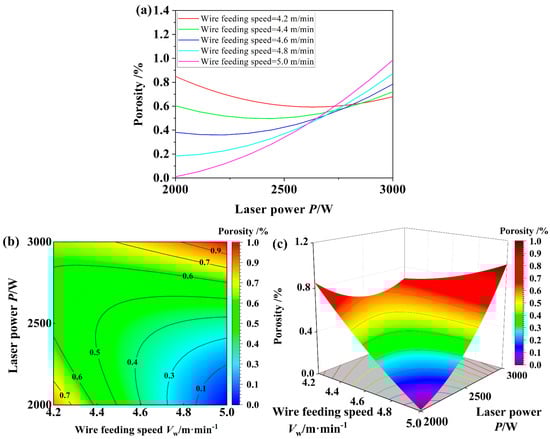
Figure 20.
Mutual interaction between process parameters on porosity. (a) Two-dimensional lines of mutual interaction between wire feeding speed and laser power on porosity; (b) Two-dimensional contours of mutual interaction between wire feeding speed and laser power on porosity; (c) Three-dimensional surface plots of mutual interaction between wire feeding speed and laser power on porosity.
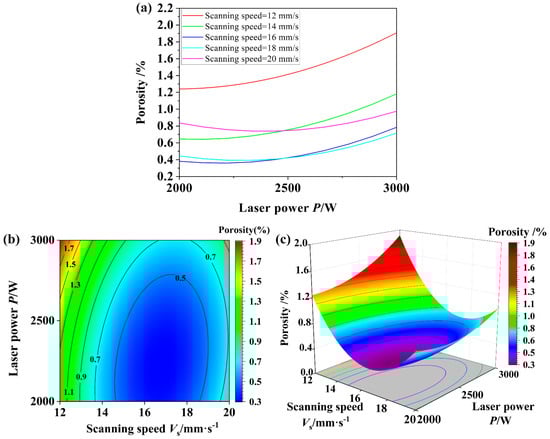
Figure 21.
Mutual interaction between process parameters on porosity. (a) Two-dimensional lines of mutual interaction between scanning speed and laser power on porosity; (b) Two-dimensional contours of mutual interaction between scanning speed and laser power on porosity; (c) Three-dimensional surface plots of mutual interaction between scanning speed and laser power on porosity.
On the other hand, as the wire feeding speed increased, the porosity gradually decreased. This was primarily because a faster wire feeding speed led to a higher heat input, slowing down the solidification process of the weld pool. This extended solidification time allowed for more opportunity for gas bubbles to rise and escape. Additionally, the pulsing arc actively agitated the weld pool, further facilitating the upward movement of the gas bubbles. Consequently, as the wire feeding speed increased, the porosity gradually decreased. However, once the wire feeding speed reached a specific threshold, the porosity began to increase alongside the laser power. At this point, the increased laser power led to a more pronounced keyhole effect, causing uneven keyholes at the bottom of the weld pool. This deepened the weld pool and further lengthened the path for gas bubbles to rise and escape, resulting in an increase in porosity. Therefore, when the feeding speed reached a certain range, the porosity no longer showed a trend of decreasing and then increasing with the increase in laser power, but showed a trend of gradually increasing.
3.4. Multi-Objective Optimization on Forming Quality
The influence of the LCAHAM process parameters on the forming accuracy, spattering degree, and porosity was systematically investigated using RSM. When prioritizing the porosity as the sole reference criterion, the optimal process parameters were identified as a wire feed speed of 4.82 m/min, a scanning speed of 16.51 mm/s, and a laser power of 2080 W, achieving a minimum porosity of 0.17%, as shown in Figure 22. Considering the forming accuracy, spattering degree, and porosity, the optimal range of the process parameters included a wire feeding speed of 4.2–4.3 m/min, a scanning speed of 15–17 m/min, and a laser power of about 2000 W. The predicted range within this range indicated a forming accuracy of 84–85%, spattering degree of 1.0–1.2%, and porosity of 0.7–0.9%, as shown in Figure 23. These optimal process parameters and corresponding response values are shown in Figure 24. Furthermore, the anticipated optimal values are as follows: forming precision at 84.58%, spattering degree at 1.11%, and porosity at 0.82%.
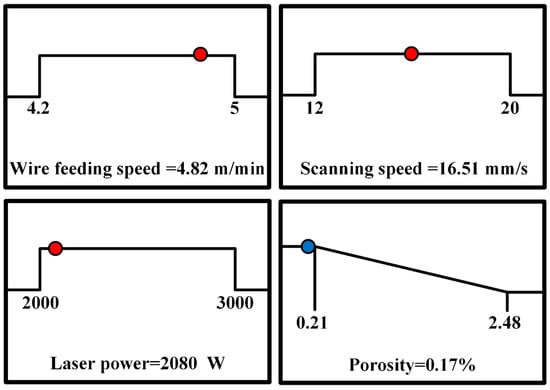
Figure 22.
Optimal results of porosity optimization.
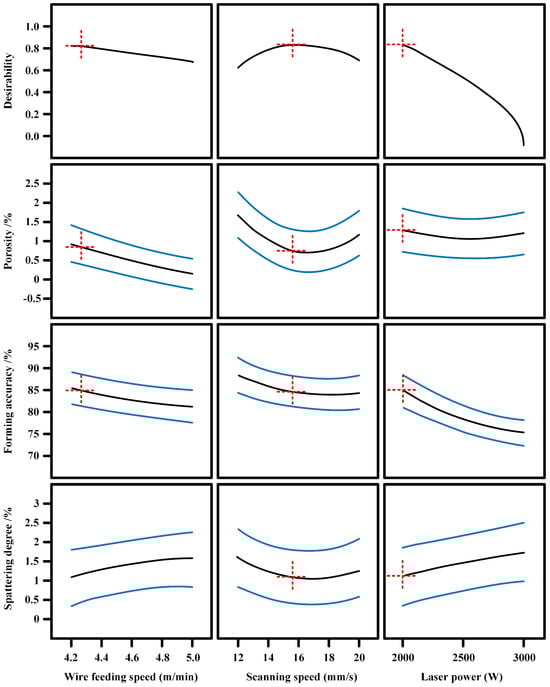
Figure 23.
Optimal range of process parameters for the prediction model.
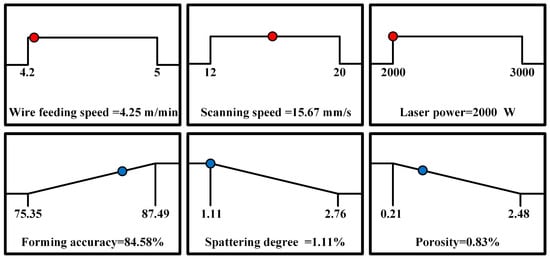
Figure 24.
Optimal results of multi-objective optimization.
4. Conclusions
(1) A thin-walled structure of high-strength AA2024, characterized by a crack-free, superior forming accuracy, minimal spattering, and a low porosity rate, was successfully fabricated using the innovative LCAHAM technology in combination with RSM, probability statistical theory, and a multi-objective optimization algorithm.
(2) The forming accuracy of LCAHAM AA2024 was significantly more affected by the laser power than by the wire feeding speed and scanning speed. Notably, there was an obvious correlation between the interaction of the laser power and wire feeding speed and the resulting formation accuracy of LCAHAM AA2024. Conversely, the interactions between the laser power and scanning speed, as well as between the wire feeding speed and scanning speed, did not significantly affect the forming accuracy.
(3) The laser power, wire feeding speed, and scanning speed all had noticeable effects on the spattering degree during the AA2024 LCAHAM process. However, the influence of the laser power significantly surpassed that of the other two factors. As the laser power and wire feeding speed increased, the spattering intensified; conversely, an increase in the scanning speed initially led to a decrease and subsequently an increase in the spattering extent. Notably, these three factors exhibited minimal mutual interaction on spattering.
(4) The most significant factor influencing the porosity of LCAHAM AA2024 was the scanning speed when compared with the wire feeding speed and laser power. The porosity exhibited an initial decrease followed by an increase as the scanning speed ranged from 12 mm/s to 20 mm/s. It was crucial to emphasize that the combined effects of the wire feed speed and laser power played an obvious role in reducing the porosity.
(5) Considering the forming accuracy, spattering degree, and porosity comprehensively, the recommended optimal process parameters were as follows: a wire feed speed ranging from 4.2 to 4.3 m/min, a scanning speed between 15 and 17 mm/s, and a laser power set at approximately 2000 W. Under these conditions, the forming accuracy was 84–85%, the spatter level fell within 1.0–1.2%, and the porosity was 0.7–0.9%.
Author Contributions
S.H.: writing—original draft, investigation, formal analysis. Z.Z.: funding acquisition, supervision, results analysis, validation, writing—review and editing. H.L.: methodology, visualization. T.Z.: validation. X.L.: supervision. J.K.: review, supervision. All authors have read and agreed to the published version of the manuscript.
Funding
This work was supported by the Aeronautical Science Foundation of China [Grant Number 2020Z049067002], Natural Science Foundation of Tianjin City [Grant Number 22JCYBJC01280] and National Natural Science Foundation of China [Grant Number 51905536].
Data Availability Statement
The original contributions presented in the study are included in the article, further inquiries can be directed to the corresponding author.
Conflicts of Interest
The authors declare no conflict of interest.
References
- Montanari, R.; Palombi, A.; Richetta, M.; Varone, A. Additive manufacturing of aluminum alloys for aeronautic applications: Advantages and problems. Metals 2023, 13, 716. [Google Scholar] [CrossRef]
- Elelwi, M.; Pinto, F.S.; Botez, R.M.; Dao, T.-M. Multidisciplinary optimization for weight saving in a variable tapered span-morphing wing using composite materials—Application to the UAS-S4. Actuators 2022, 11, 121. [Google Scholar] [CrossRef]
- Zhou, B.; Liu, B.; Zhang, S. The advancement of 7XXX series aluminum alloys for aircraft structures: A review. Metals 2021, 11, 718. [Google Scholar] [CrossRef]
- Chen, S.; Cao, D.; Wei, J.; He, G.; Fang, B.; Li, Y. Investigations on nonlinear dynamic modeling and vibration responses of T-shaped beam structures. Actuators 2022, 11, 293. [Google Scholar] [CrossRef]
- Soliman, H.A.; Elbestawi, M. Titanium aluminides processing by additive manufacturing—A review. Int. J. Adv. Manuf. Technol. 2022, 119, 5583–5614. [Google Scholar] [CrossRef]
- Jin, B.; Wang, Q.; Zhao, L.; Pan, A.; Ding, X.; Gao, W.; Song, Y.; Zhang, X. A review of additive manufacturing techniques and post-processing for high-temperature titanium alloys. Metals 2023, 13, 1327. [Google Scholar] [CrossRef]
- Hu, Y.; Chen, F.; Cao, S.; Fan, Y.; Xie, R. Preparation and characterization of CMT wire arc additive manufacturing Al-5%Mg alloy depositions through assisted longitudinal magnetic field. J. Manuf. Process. 2023, 101, 576–588. [Google Scholar] [CrossRef]
- Xi, X.; Lin, D.; Song, X.; Luo, X.; Ma, R.; Shi, Z.; Bian, H.; Fu, W.; Dong, Z.; Tan, C. Strength-plasticity transition mechanism after the solution treatment of GH3230 superalloy fabricated via laser powder bed fusion. Mater. Sci. Eng. A 2023, 15, 145124. [Google Scholar] [CrossRef]
- Tomar, B.; Shiva, S. Cold metal transfer-based wire arc additive manufacturing. J. Braz. Soc. Mech. Sci. Eng. 2023, 45, 157. [Google Scholar] [CrossRef]
- Eyers, D.R.; Potter, A.T. Industrial additive manufacturing: A manufacturing systems perspective. Comput. Ind. 2017, 92–93, 208–218. [Google Scholar] [CrossRef]
- Thapliyal, S. Challenges associated with the wire arc additive manufacturing (WAAM) of aluminum alloys. Mater. Res. Express 2019, 6, 112006. [Google Scholar] [CrossRef]
- Jensen, P.D.L.; Wang, F.; Dimino, I.; Sigmund, O. Topology optimization of large-scale 3D morphing wing structures. Actuators 2021, 10, 217. [Google Scholar] [CrossRef]
- Gong, G.; Ye, J.; Chi, Y.; Zhao, Z.; Wang, Z.; Xia, G.; Du, X.; Tian, H.; Yu, H.; Chen, C. Research status of laser additive manufacturing for metal: A review. J. Mater. Res. Technol. 2021, 15, 855–884. [Google Scholar] [CrossRef]
- Chang, T.; Fang, X.; Liu, G.; Zhang, H.; Huang, K. Wire and arc additive manufacturing of dissimilar 2319 and 5B06 aluminum alloys. J. Mater. Sci. Technol. 2022, 124, 65–75. [Google Scholar] [CrossRef]
- Wang, Z.; Zhang, Y. A review of aluminum alloy fabricated by different processes of wire arc additive manufacturing. Mater. Sci. 2021, 27, 18–26. [Google Scholar] [CrossRef]
- Huang, W.; Chen, S.; Xiao, J.; Jiang, X.; Jia, Y. Laser wire-feed metal additive manufacturing of the Al alloy. Opt. Laser Technol. 2021, 134, 106627. [Google Scholar] [CrossRef]
- Xi, X.; Yan, M.; Ma, R.; Shi, Z.; Tang, Z.; Li, Z.; Tan, C.; Dong, Z.; Song, X. Significantly improved weldability in laser welding of additively manufactured haynes 230 superalloys by tailoring microstructure. J. Mater. Res. Technol. 2023, 26, 7873–7892. [Google Scholar] [CrossRef]
- Wieczorowski, M.; Pereira, A.; Carou, D.; Gapinski, B.; Ramírez, I. Characterization of 5356 aluminum walls produced by wire arc additive manufacturing (WAAM). Materials 2023, 16, 2570. [Google Scholar] [CrossRef]
- Näsström, J.; Brueckner, F.; Kaplan, A.F.H. Laser enhancement of wire arc additive manufacturing. J. Laser 2019, 31, 022307. [Google Scholar] [CrossRef]
- Gong, M.; Meng, Y.; Zhang, S.; Zhang, Y.; Zeng, X.; Gao, M. Laser-arc hybrid additive manufacturing of stainless steel with beam oscillation. Addit. Manuf. 2020, 33, 101180. [Google Scholar] [CrossRef]
- Wang, C.; Suder, W.; Ding, J.; Williams, S. Wire based plasma arc and laser hybrid additive manufacture of Ti-6Al-4V. J. Mater. Process. Technol. 2021, 293, 117080. [Google Scholar] [CrossRef]
- Liu, D.; Wu, D.; Wang, R.; Shi, J.; Niu, F.; Ma, G. Formation mechanism of Al-Zn-Mg-Cu alloy fabricated by laser-arc hybrid additive manufacturing: Microstructure evaluation and mechanical properties. Addit. Manuf. 2022, 50, 102554. [Google Scholar] [CrossRef]
- Ma, G.; Wang, R.; Liu, D.; Wu, S.; Niu, F.; Wu, D. Laser-arc hybrid additive manufactured Al Cu alloy for T-shaped structure: Microstructure evaluation and molten pool behavior. J. Manuf. Process. 2022, 79, 442–459. [Google Scholar] [CrossRef]
- Ma, S.; Chen, X.; Jiang, M.; Li, B.; Wang, Z.; Lei, Z.; Chen, Y. Surface morphology, microstructure and mechanical properties of Al–Mg–Sc alloy thin wall produced by laser-arc hybrid additive manufacturing. Thin-Walled Struct. 2023, 186, 110674. [Google Scholar] [CrossRef]
- Selvi, S.; Vishvaksenan, A.; Rajasekar, E. Cold metal transfer (CMT) technology—An overview. Def. Technol. 2018, 14, 28–44. [Google Scholar] [CrossRef]
- Wang, Y.; Zhu, Z.; Gou, G.; Peng, L.; Liu, Y.; Yang, T.; Gao, W. Arc characteristics and metal transfer behavior of CMT+P process for Q235 steel of titanium-steel composite plate. Int. J. Mod. Phys. B 2019, 33, 1940040. [Google Scholar] [CrossRef]
- Maleki, E.; Bagherifard, S.; Bandini, M.; Guagliano, M. Surface post-treatments for metal additive manufacturing: Progress, challenges, and opportunities. Addit. Manuf. 2021, 37, 101619. [Google Scholar] [CrossRef]
- Langelandsvik, G.; Akselsen, O.M.; Furu, T.; Roven, H.J. Review of aluminum alloy development for wire arc additive manufacturing. Materials 2021, 14, 5370. [Google Scholar] [CrossRef]
- Li, Z.; Li, H.; Yin, J.; Li, Y.; Nie, Z.; Li, X.; You, D.; Guan, K.; Duan, W.; Cao, L.; et al. A review of spatter in laser powder bed fusion additive manufacturing:In situ detection, generation, effects, and countermeasures. Micromachines 2022, 13, 1366. [Google Scholar] [CrossRef]
- Basu, D.; Wu, Z.; Meyer, J.L.L.; Larson, E.; Kuo, R.; Rollett, A. Entrapped gas and process parameter-induced porosity formation in additively manufactured 17-4 PH stainless steel. J. Mater. Eng. Perform. 2021, 30, 5195–5202. [Google Scholar] [CrossRef]
- Wu, D.; Hua, X.; Ye, Y.; Huang, L.; Li, F.; Huang, Y. Experimental and numerical study of spatter formation and composition change in fiber laser welding of aluminum alloy. J. Phys. D Appl. Phys. 2018, 51, 185604. [Google Scholar] [CrossRef]
- Zhang, D.; Li, C.; Liu, X.; Cao, Y.; Wu, D. Numerical study of spatter formation during fiber laser welding of aluminum alloy. J. Manuf. Process. 2018, 31, 72–79. [Google Scholar] [CrossRef]
- Anwar, A.B.; Ibrahim, I.H.; Pham, Q. Spatter transport by inert gas flow in selective laser melting: A simulation study. Powder Technol. 2019, 352, 103–116. [Google Scholar] [CrossRef]
- Zhang, C.; Li, G.; Gao, M.; Yan, J.; Zeng, X.Y. Microstructure and process characterization of laser-cold metal transfer hybrid welding of AA6061 aluminum alloy. Int. J. Adv. Manuf. Technol. 2013, 68, 1253–1260. [Google Scholar] [CrossRef]
- Zhang, C.; Gao, M.; Zeng, X. Influences of synergy effect between laser and arc on laser-arc hybrid welding of aluminum alloys. Opt. Laser Technol. 2019, 120, 105766. [Google Scholar] [CrossRef]
- Han, X.; Yang, Z.; Ma, Y.; Shi, C.; Xin, Z. Comparative study of laser-arc hybrid welding for AA6082-T6 aluminum alloy with two different arc modes. Metals 2020, 10, 407. [Google Scholar] [CrossRef]
- Derekar, K.S.; Addison, A.; Joshi, S.S.; Zhang, X.; Lawrence, J.; Xu, L.; Melton, G.; Griffiths, D. Effect of pulsed metal inert gas (pulsed-MIG) and cold metal transfer (CMT) techniques on hydrogen dissolution in wire arc additive manufacturing (WAAM) of aluminium. Int. J. Adv. Manuf. Technol. 2020, 107, 311–331. [Google Scholar] [CrossRef]
- Cong, B.; Ding, J.; Williams, S. Effect of arc mode in cold metal transfer process on porosity of additively manufactured Al-6.3%Cu alloy. Int. J. Adv. Manuf. Technol. 2015, 76, 1593–1606. [Google Scholar] [CrossRef]
- Wang, D.; Lu, J.; Tang, S.; Yu, L.; Fan, H.; Ji, L.; Liu, C. Reducing porosity and refining grains for arc additive manufacturing aluminum alloy by adjusting arc pulse frequency and current. Materials 2018, 11, 1344. [Google Scholar] [CrossRef]
- Liu, M.; Ma, G.; Liu, D.; Yu, J.; Niu, F.; Wu, D. Microstructure and mechanical properties of aluminum alloy prepared by laser-arc hybrid additive manufacturing. J. Laser Appl. 2020, 32, 022052. [Google Scholar] [CrossRef]
- Zhang, Z.; Yan, J.; Lu, X.; Zhang, T.; Wang, H. Optimization of porosity and surface roughness of CMT-P wire arc additive manufacturing of AA2024 using response surface methodology and NSGA-II. J. Mater. Res. Technol. 2023, 24, 6923–6941. [Google Scholar] [CrossRef]
- Pang, J.; Hu, S.; Shen, J.; Wang, P.; Liang, Y. Arc characteristics and metal transfer behavior of CMT+P welding process. J. Mater. Process. Technol. 2016, 238, 212–217. [Google Scholar] [CrossRef]
Disclaimer/Publisher’s Note: The statements, opinions and data contained in all publications are solely those of the individual author(s) and contributor(s) and not of MDPI and/or the editor(s). MDPI and/or the editor(s) disclaim responsibility for any injury to people or property resulting from any ideas, methods, instructions or products referred to in the content. |
© 2024 by the authors. Licensee MDPI, Basel, Switzerland. This article is an open access article distributed under the terms and conditions of the Creative Commons Attribution (CC BY) license (https://creativecommons.org/licenses/by/4.0/).